Embed Size (px)
Citation preview
Capital Markets Day Hydro AgriCapital Markets Day Capital Markets Day Hydro Hydro AgriAgri
Executive Vice PresidentThorleif Enger
Oslo, December 9, 2002
Executive Vice PresidentExecutive Vice PresidentThorleifThorleif EngerEnger
Oslo, Oslo, December December 9, 20029, 2002
36207_5H - 12.2002 - * 2 - Hydro Media
2
Hydro Hydro Agri perspectivesAgri perspectives
● From Turnaround to industry leadership■ Debunking myths■ Our ability to deliver
● Hydro Agri’s unique business model and areas of global strength
● Opportunities ahead
36207_5H - 12.2002 - * 3 - Hydro Media
3
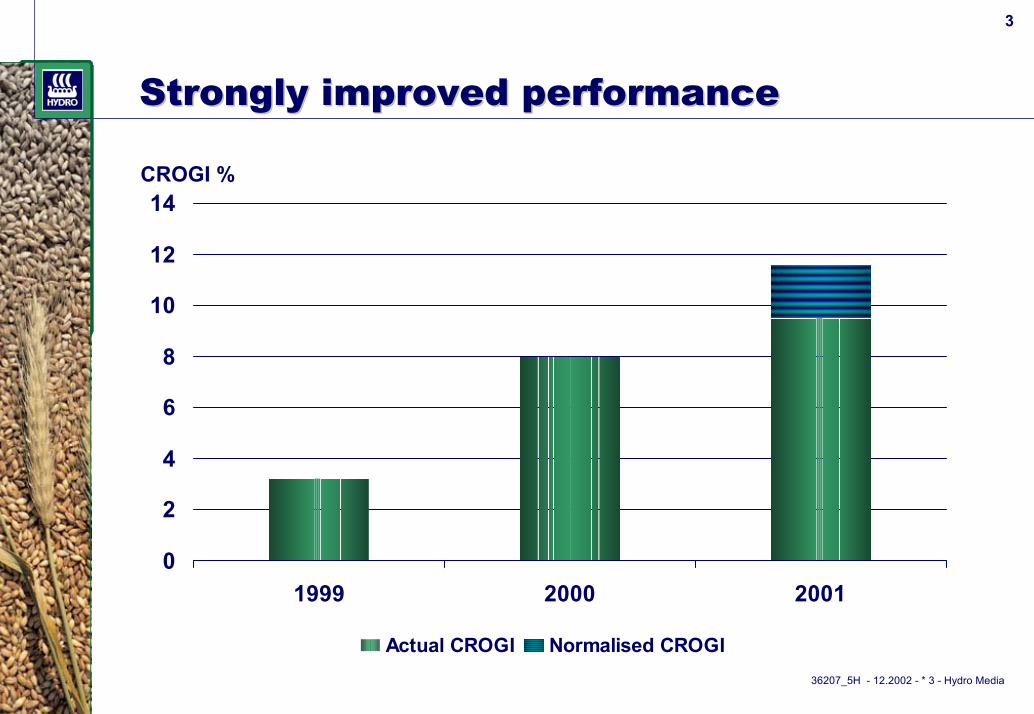
Strongly improved performanceStrongly improved performance
0
2
4
6
8
10
12
14
1999 2000 2001
Actual CROGI Normalised CROGI
CROGI %
36207_5H - 12.2002 - * 4 - Hydro Media
4
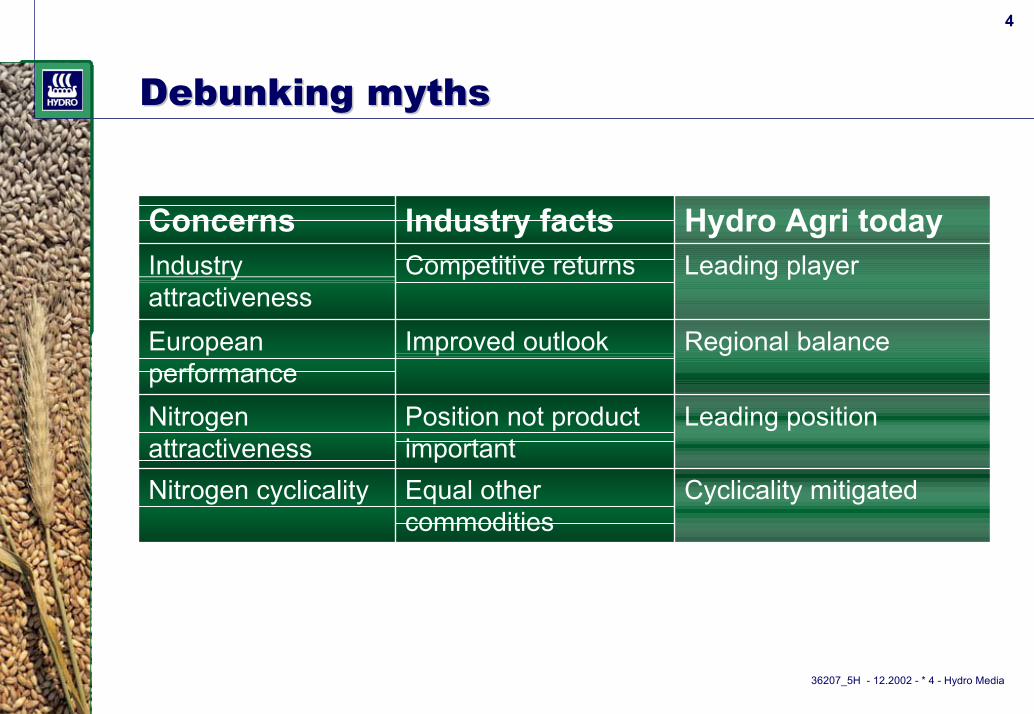
Debunking mythsDebunking myths
Cyclicality mitigatedEqual other commodities
Nitrogen cyclicality
Leading positionPosition not product important
Nitrogen attractiveness
Regional balanceImproved outlookEuropean performance
Leading playerCompetitive returnsIndustry attractiveness
Hydro Agri todayIndustry factsConcerns
36207_5H - 12.2002 - * 5 - Hydro Media
5
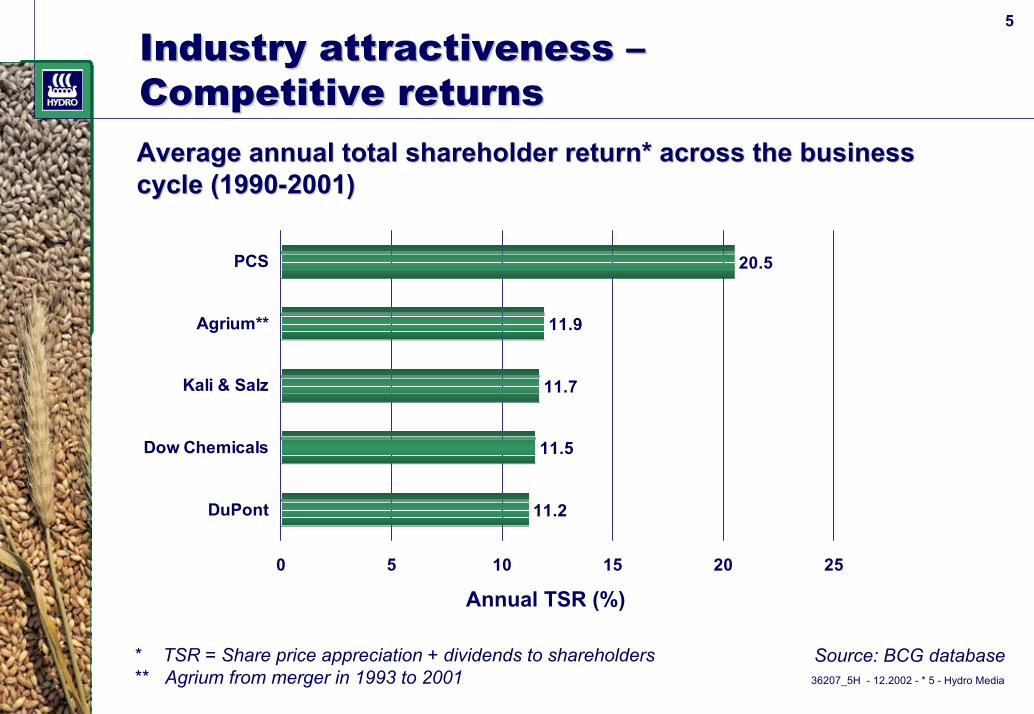
Industry attractiveness Industry attractiveness ––Competitive returnsCompetitive returnsAverage annual total shareholder return* across the businessAverage annual total shareholder return* across the businesscycle (1990cycle (1990--2001)2001)
11.2
11.5
11.7
11.9
20.5
0 5 10 15 20 25
DuPont
Dow Chemicals
Kali & Salz
Agrium**
PCS
Annual TSR (%)
* TSR = Share price appreciation + dividends to shareholders** Agrium from merger in 1993 to 2001
Source: BCG database
36207_5H - 12.2002 - * 6 - Hydro Media
6
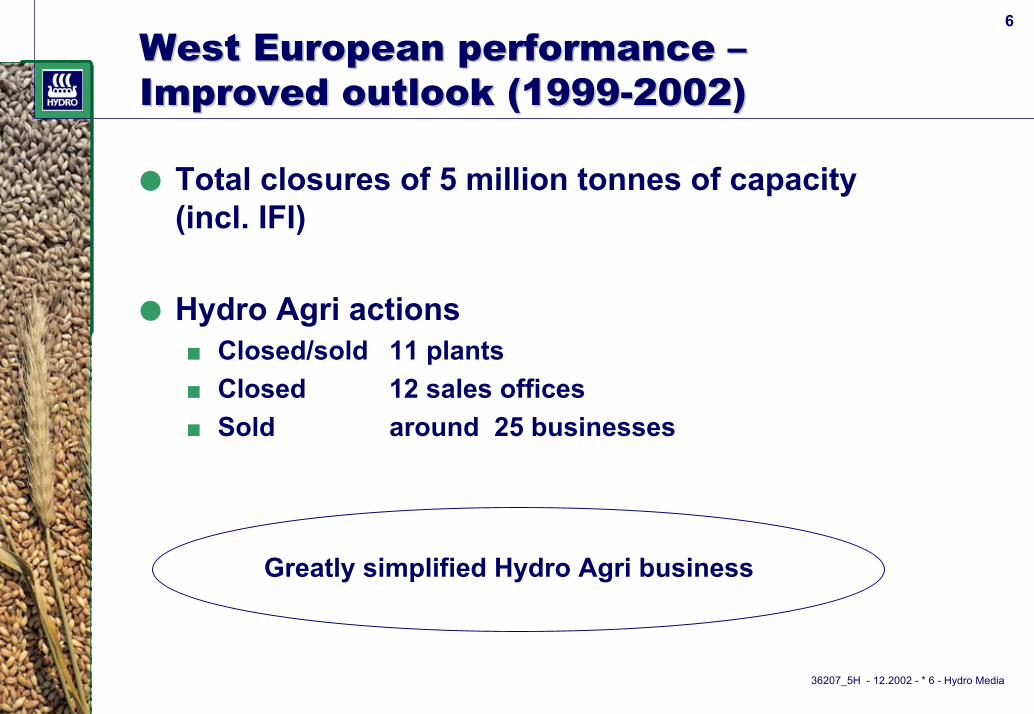
West European performanceWest European performance ––Improved outlook Improved outlook (1999(1999--2002)2002)
● Total closures of 5 million tonnes of capacity (incl. IFI)
● Hydro Agri actions■ Closed/sold 11 plants■ Closed 12 sales offices■ Sold around 25 businesses
Greatly simplified Hydro Agri business
36207_5H - 12.2002 - * 7 - Hydro Media
7
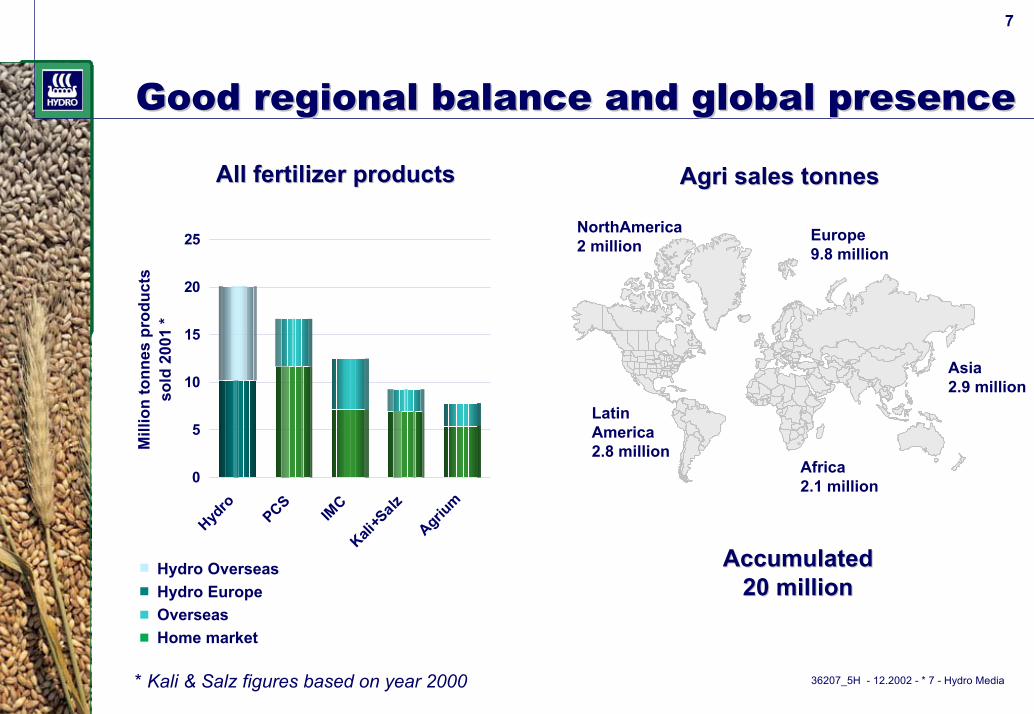
GoodGood regional regional balancebalance and global and global presencepresence
0
5
10
15
20
25
Hydro
PCS
IMC
Kali+S
alz
Agrium
All fertilizer productsAll fertilizer products M
illio
n to
nnes
pro
duct
s s
old
2001
*
Hydro Overseas Hydro Europe Overseas Home market
AccumulatedAccumulated20 million20 million
Latin America2.8 million
NorthAmerica2 million
Africa2.1 million
Asia2.9 million
Europe9.8 million
AgriAgri sales sales tonnestonnes
* Kali & Salz figures based on year 2000
36207_5H - 12.2002 - * 8 - Hydro Media
8
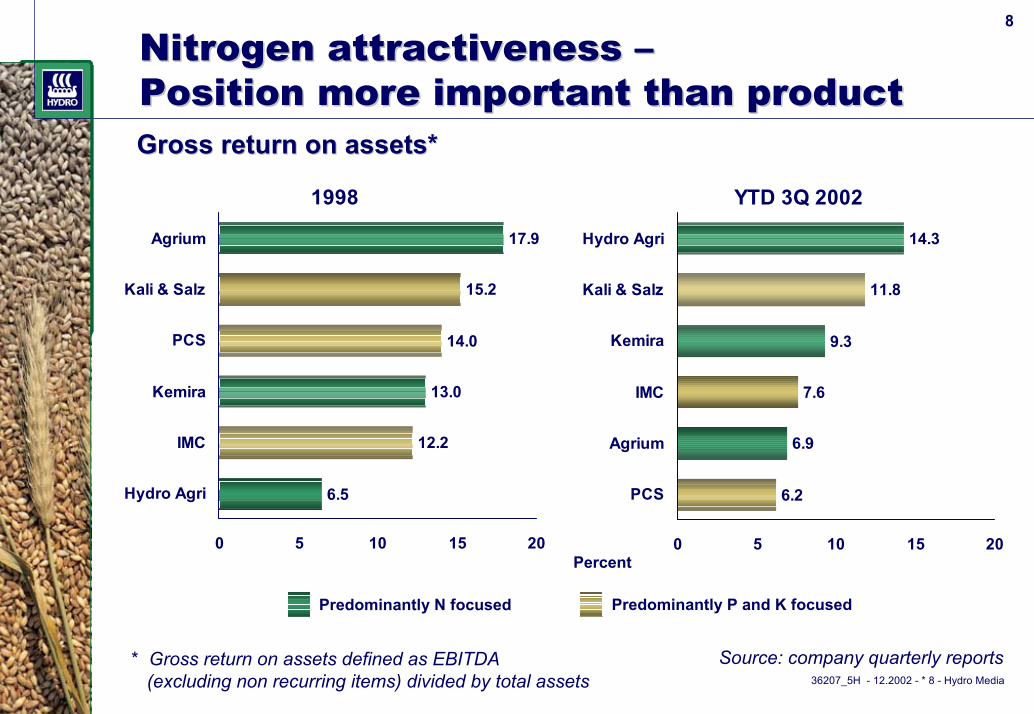
Gross return on assets*Gross return on assets*
Percent
1998
12.2
13.0
14.0
15.2
6.5
17.9
0 5 10 15 20
Hydro Agri
IMC
Kemira
PCS
Kali & Salz
Agrium
YTD 3Q 2002
6.2
6.9
7.6
9.3
11.8
14.3
0 5 10 15 20
PCS
Agrium
IMC
Kemira
Kali & Salz
Hydro Agri
Nitrogen Nitrogen attractivenessattractiveness ––PositionPosition more more important than productimportant than product
Predominantly P and K focused Predominantly N focused
Source: company quarterly reports* Gross return on assets defined as EBITDA (excluding non recurring items) divided by total assets
36207_5H - 12.2002 - * 9 - Hydro Media
9
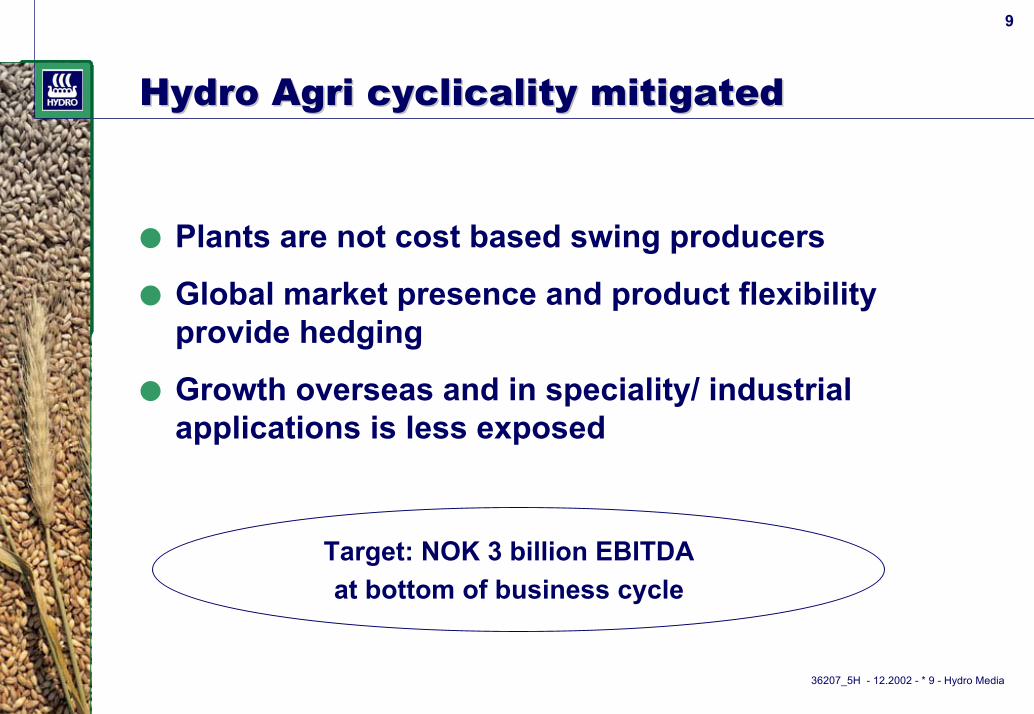
Hydro Hydro Agri cyclicality mitigatedAgri cyclicality mitigated
● Plants are not cost based swing producers
● Global market presence and product flexibility provide hedging
● Growth overseas and in speciality/ industrial applications is less exposed
Target: NOK 3 billion EBITDA at bottom of business cycle
36207_5H - 12.2002 - * 10 - Hydro Media
10
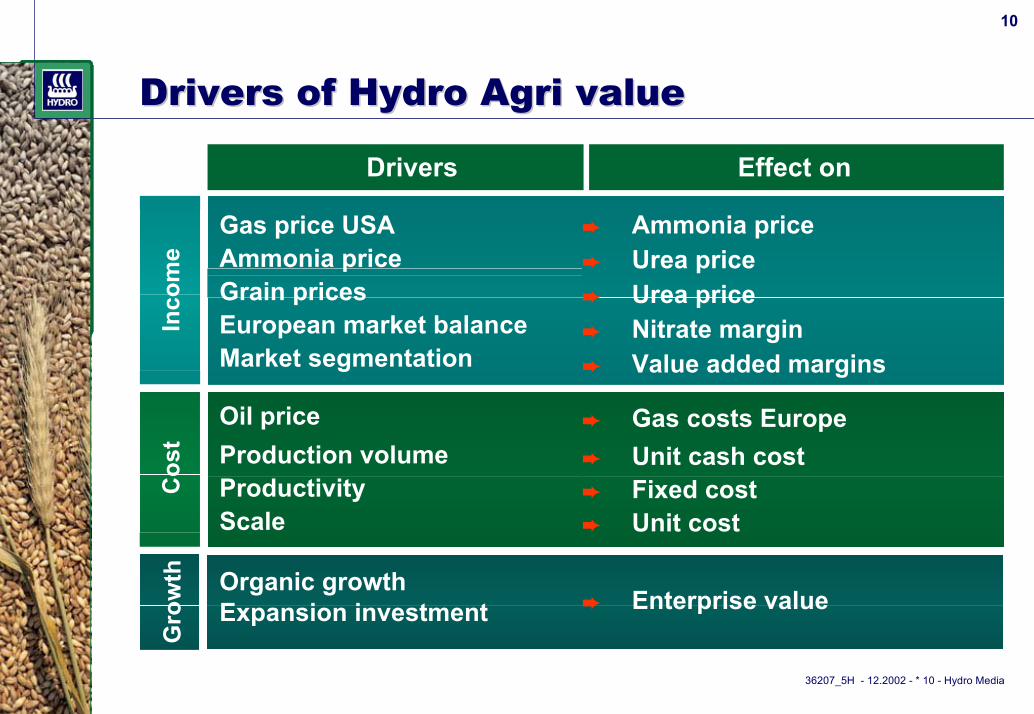
Drivers Drivers ofof Hydro Hydro Agri valueAgri value
Drivers Effect onIn
com
eC
ost
Gro
wth
Gas price USAAmmonia priceGrain pricesEuropean market balanceMarket segmentation
Oil priceProduction volumeProductivity Scale
Organic growthExpansion investment
➨ Ammonia price➨ Urea price➨ Urea price➨ Nitrate margin➨ Value added margins
➨ Gas costs Europe➨ Unit cash cost➨ Fixed cost➨ Unit cost
➨ Enterprise value
36207_5H - 12.2002 - * 11 - Hydro Media
11
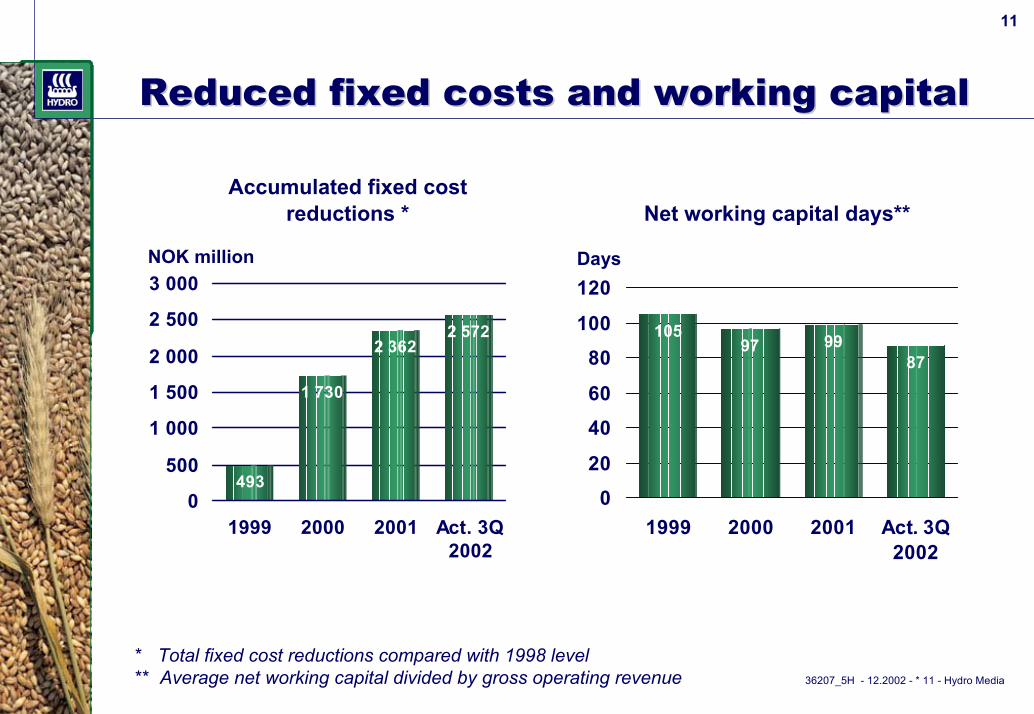
Reduced fixed costs and working capitalReduced fixed costs and working capital
Days
493
1 730
2 3622 572
0
500
1 000
1 500
2 000
2 500
3 000
1999 2000 2001 Act. 3Q2002
NOK million
Accumulated fixed cost reductions * Net working capital days**
10597 99
87
020
4060
80100
120
1999 2000 2001 Act. 3Q2002
* Total fixed cost reductions compared with 1998 level** Average net working capital divided by gross operating revenue
36207_5H - 12.2002 - * 12 - Hydro Media
12
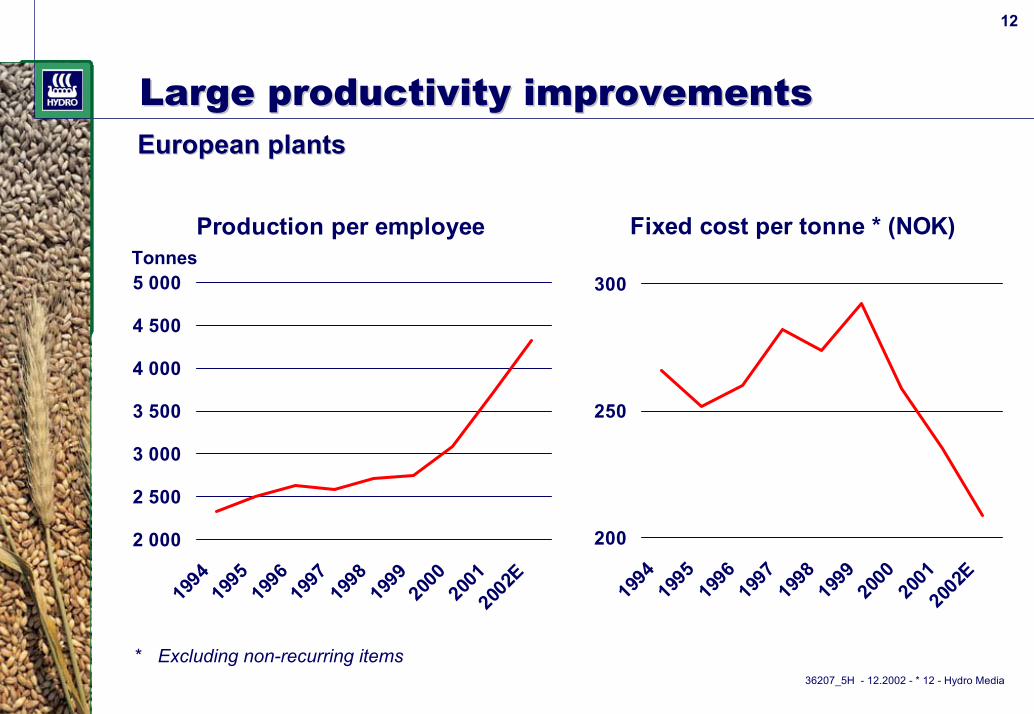
Large productivity improvementsLarge productivity improvements European plantsEuropean plants
Fixed cost per tonne * (NOK)
200
250
300
1994
1995
1996
1997
1998
1999
2000
2001
2002
E
Production per employee
2 000
2 500
3 000
3 500
4 000
4 500
5 000
1994
1995
1996
1997
1998
1999
2000
2001
2002
E
Tonnes
* Excluding non-recurring items
36207_5H - 12.2002 - * 13 - Hydro Media
13
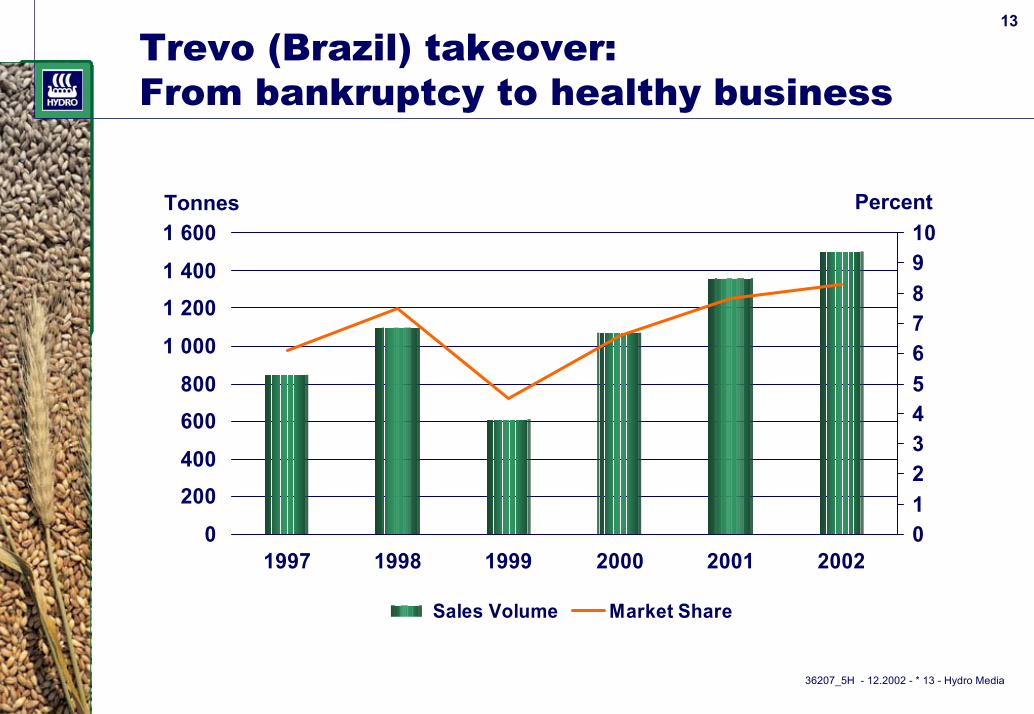
Trevo (Brazil) takeover:From bankruptcy to healthy business
0 200 400 600 800
1 0001 2001 4001 600
1997 1998 1999 2000 2001 2002012345678910
Sales Volume Market Share
Percent Tonnes
36207_5H - 12.2002 - * 14 - Hydro Media
14
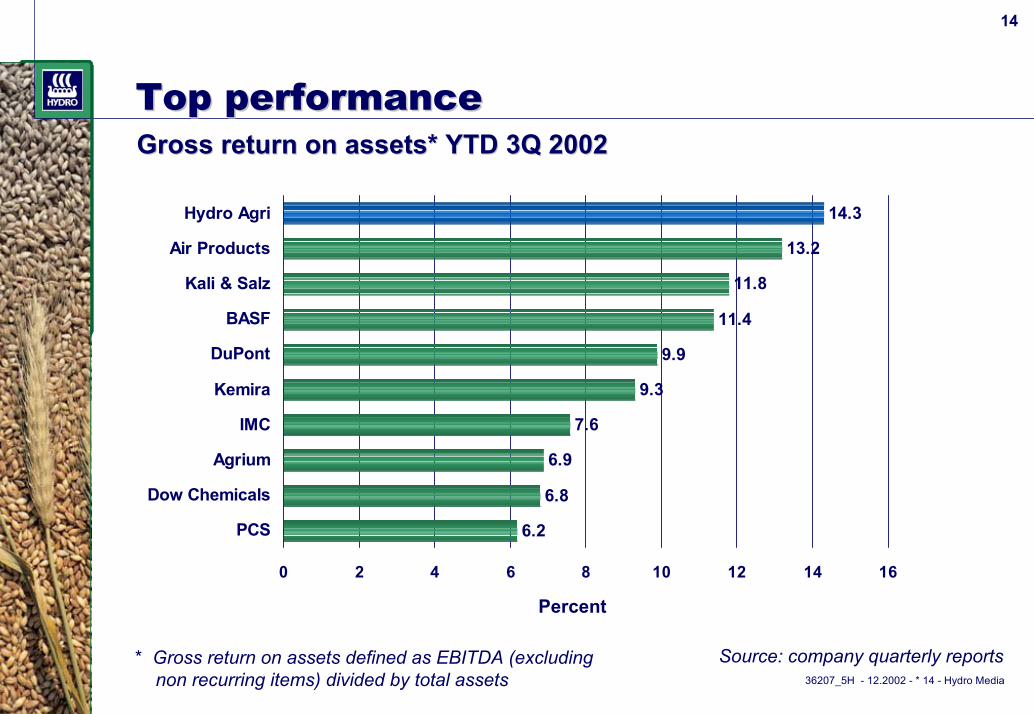
Top performanceTop performanceGross return on assets* YTD 3Q 2002Gross return on assets* YTD 3Q 2002
6.2
6.8
6.9
7.6
9.3
9.9
11.4
11.8
13.2
14.3
0 2 4 6 8 10 12 14 16
PCS
Dow Chemicals
Agrium
IMC
Kemira
DuPont
BASF
Kali & Salz
Air Products
Hydro Agri
Percent
Source: company quarterly reports* Gross return on assets defined as EBITDA (excludingnon recurring items) divided by total assets
36207_5H - 12.2002 - * 15 - Hydro Media
15
WeWe have a have a uniqueunique fertilizer positionfertilizer position
● The largest player
● The only truly global company
● Balanced product portfolio (N,P,K)
● Strong sourcing power
● Unique brands
36207_5H - 12.2002 - * 16 - Hydro Media
16
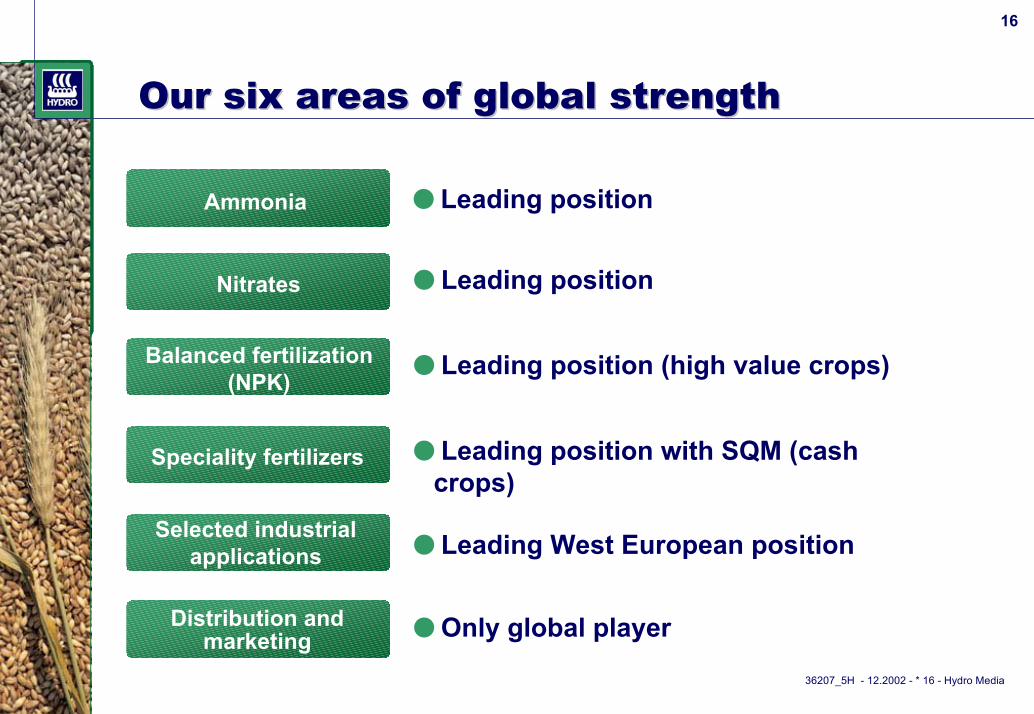
Our six areas of global strengthOur six areas of global strength
Ammonia ● Leading position
Nitrates ● Leading position
Balanced fertilization (NPK) ● Leading position (high value crops)
Speciality fertilizers ● Leading position with SQM (cash crops)
Selected industrialapplications ● Leading West European position
Distribution andmarketing ● Only global player
36207_5H - 12.2002 - * 17 - Hydro Media
17
Positive market outlookPositive market outlook
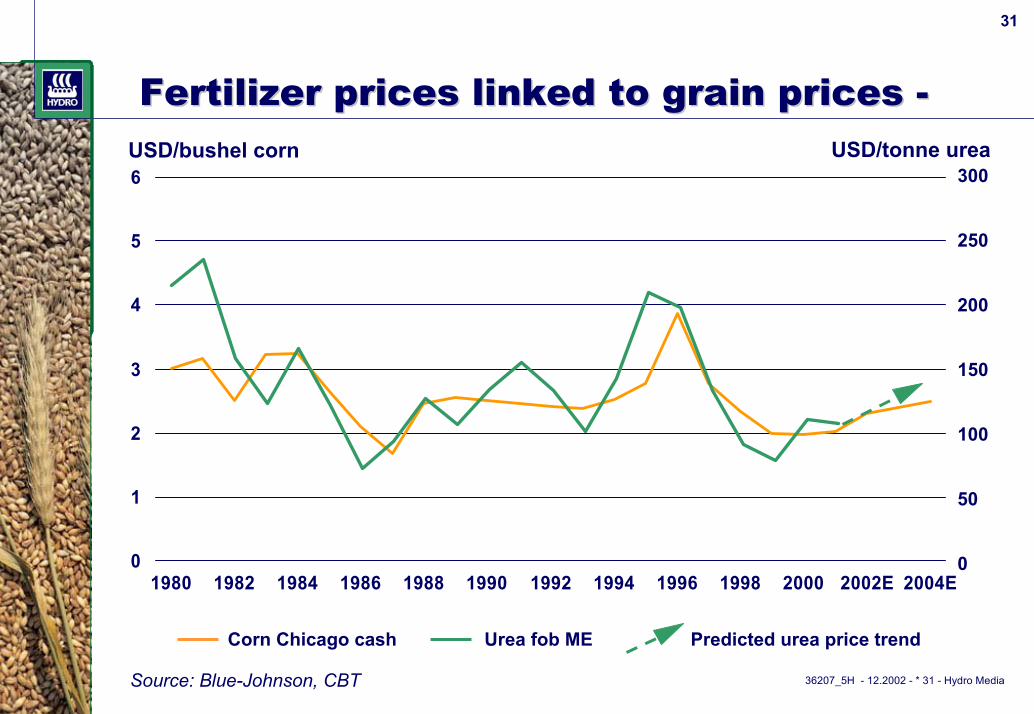
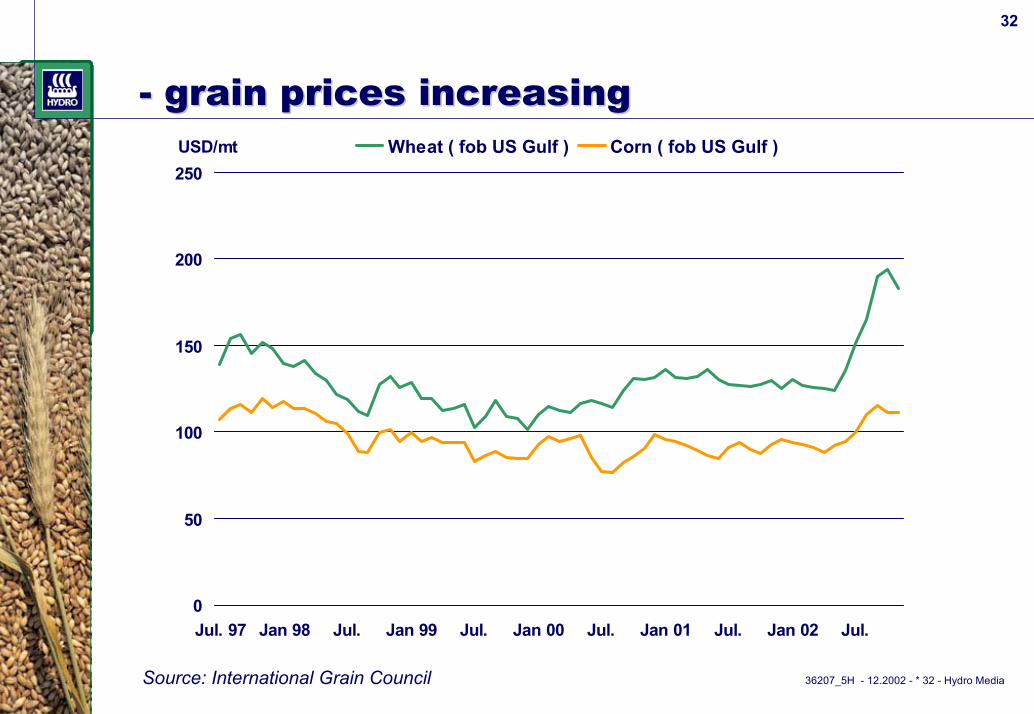
● Growth in fertilizer consumption■ Cereal stocks diminishing rapidly■ Increasing grain prices last months■ Historically, fertilizer prices correlate well with grain
prices
● Limited new capacity globally next 2-3 years
● Global supply/demand balance looks good
36207_5H - 12.2002 - * 18 - Hydro Media
18
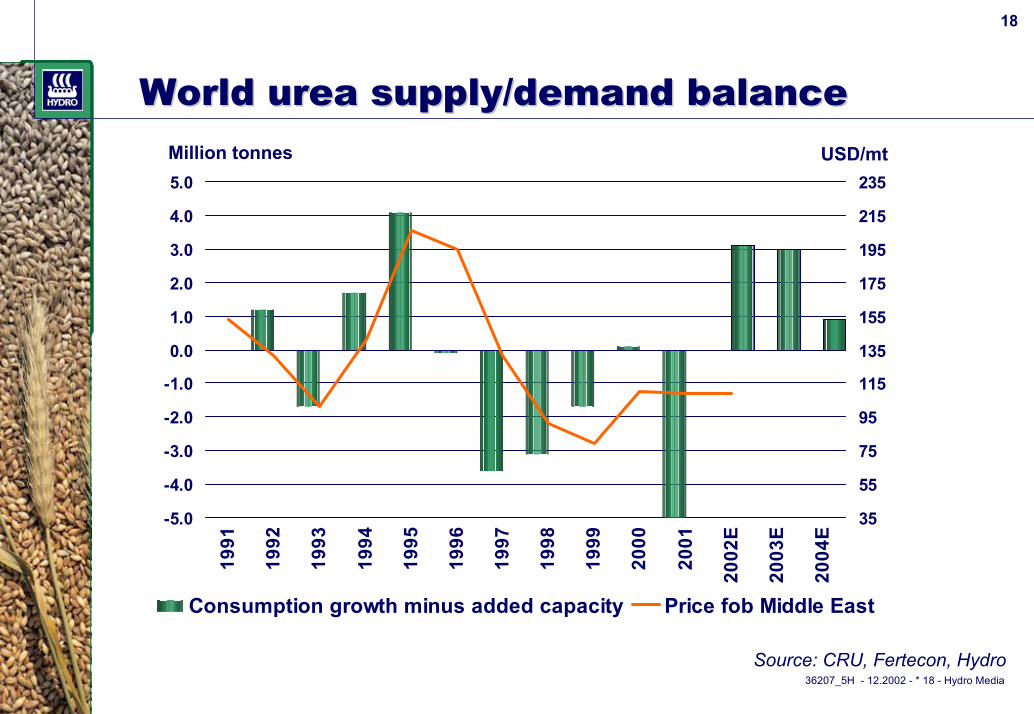
World urea supply/demand balanceWorld urea supply/demand balance
-5.0
-4.0
-3.0
-2.0
-1.0
0.0
1.0
2.0
3.0
4.0
5.0
1991
1992
1993
1994
1995
1996
1997
1998
1999
2000
2001
2002
E
2003
E
2004
E
35
55
75
95
115
135
155
175
195
215
235
Consumption growth minus added capacity Price fob Middle East
Million tonnes USD/mt
Source: CRU, Fertecon, Hydro
36207_5H - 12.2002 - * 19 - Hydro Media
19
Possible opportunities and threatsPossible opportunities and threats
Opportunities● Increased exports to China and India● Russian WTO membership expected to establish gas
prices reflecting real costs■ Reduce Government impact■ Intermediate EU antidumping measures linked to gas price
Threats● Improved US cost position● Imports into Europe
36207_5H - 12.2002 - * 20 - Hydro Media
20
Future growth opportunitiesFuture growth opportunities
● Organic growth■ Continued productivity improvements in our plants■ Scale and synergy effects in our global logistics and
marketing network
● Potential opportunities■ North America (nitrogen)■ Low cost ammonia capacity (Trinidad, Middle East...)■ Distribution channels (China, Brazil...)■ Global consolidation process
36207_5H - 12.2002 - * 21 - Hydro Media
21
Key messagesKey messages
● Market outlook positive
● Unique business position
● Global leadership in key strategic areas
● Industry leadership after Turnaround
● Strong platform for profitable growth
Additional InformationAdditional InformationAdditional Information
36207_5H - 12.2002 - * 23 - Hydro Media
23
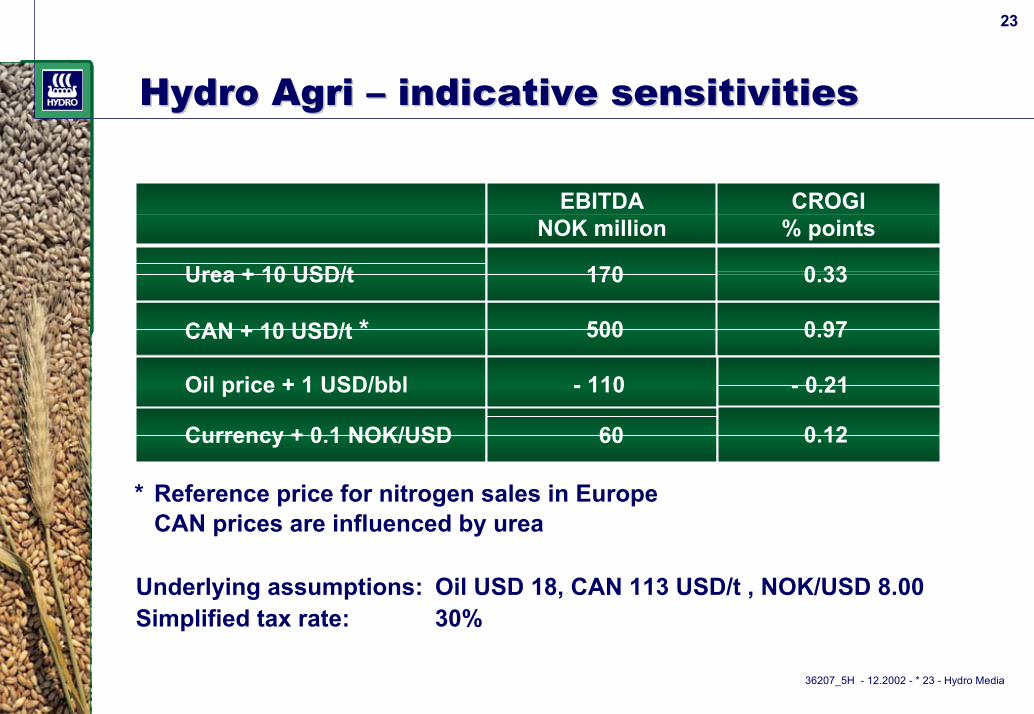
Hydro Hydro AgriAgri –– indicative sensitivitiesindicative sensitivities
EBITDANOK million
CROGI % points
Underlying assumptions: Oil USD 18, CAN 113 USD/t , NOK/USD 8.00Simplified tax rate: 30%
CAN + 10 USD/t * 500
Urea + 10 USD/t 170 0.33
0.97
Oil price + 1 USD/bbl - 110 - 0.21
0.12Currency + 0.1 NOK/USD 60
* Reference price for nitrogen sales in EuropeCAN prices are influenced by urea
36207_5H - 12.2002 - * 24 - Hydro Media
24
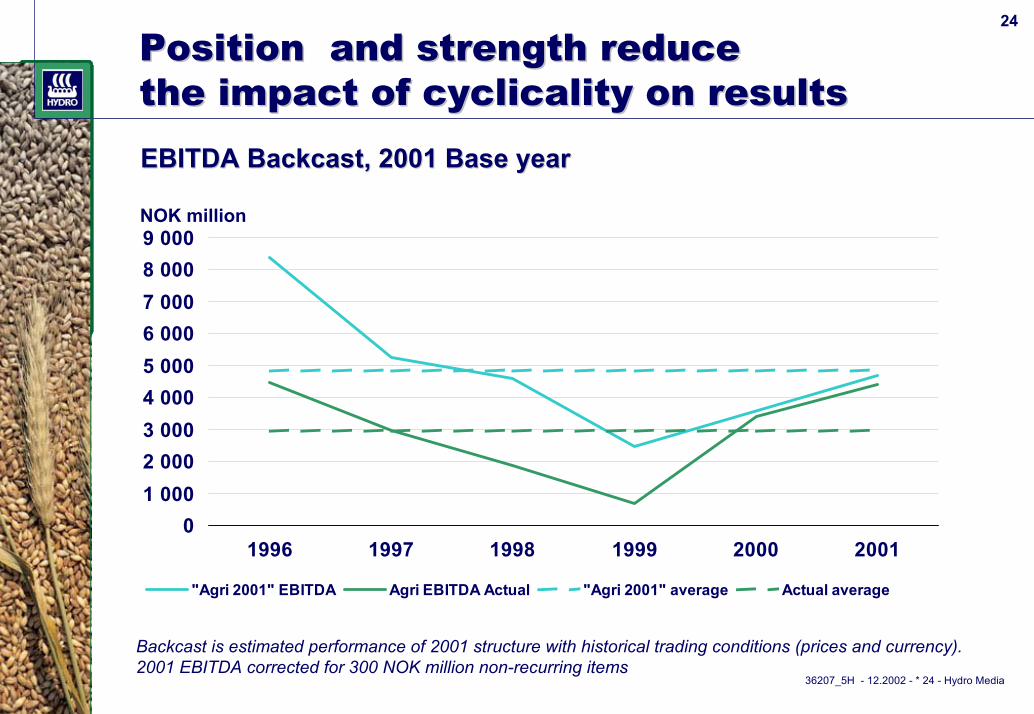
Position Position and and strength reduce strength reduce the impact of cyclicality on resultsthe impact of cyclicality on results EBITDA EBITDA BackcastBackcast, 2001 Base year, 2001 Base year
01 0002 0003 0004 0005 0006 0007 0008 0009 000
1996 1997 1998 1999 2000 2001
"Agri 2001" EBITDA Agri EBITDA Actual "Agri 2001" average Actual average
NOK million
Backcast is estimated performance of 2001 structure with historical trading conditions (prices and currency).2001 EBITDA corrected for 300 NOK million non-recurring items
36207_5H - 12.2002 - * 25 - Hydro Media
25
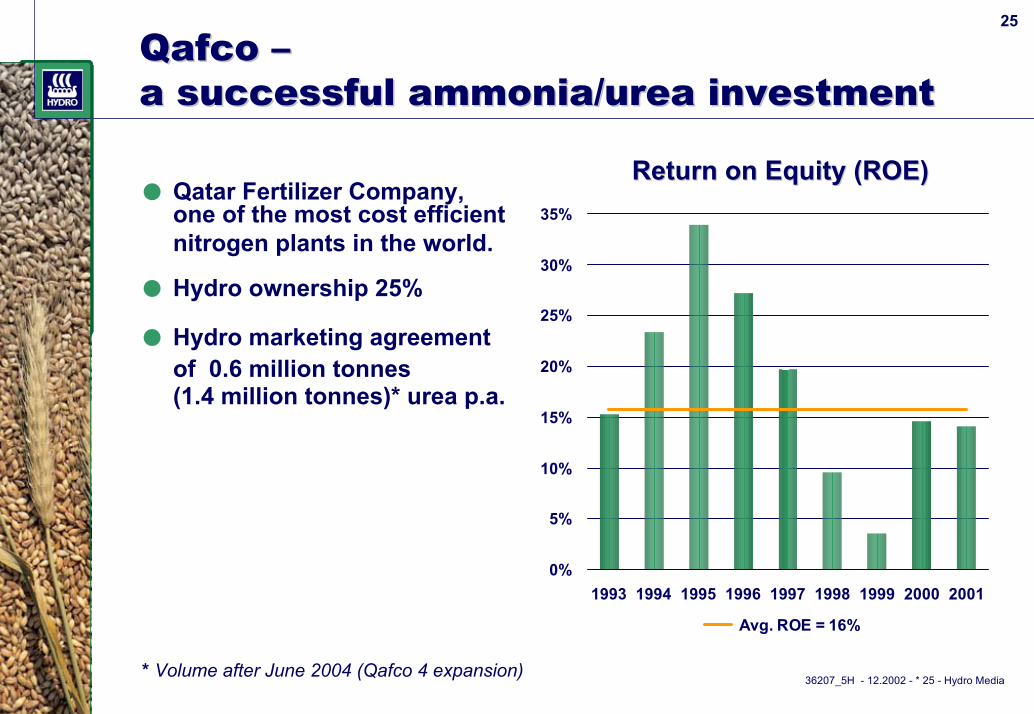
QafcoQafco ––a successful ammonia/urea investmenta successful ammonia/urea investment
0%
5%
10%
15%
20%
25%
30%
35%
1993 1994 1995 1996 1997 1998 1999 2000 2001
Avg. ROE = 16%
Return on Equity (ROE)Return on Equity (ROE)● Qatar Fertilizer Company,
one of the most cost efficientnitrogen plants in the world.
● Hydro ownership 25%
● Hydro marketing agreementof 0.6 million tonnes(1.4 million tonnes)* urea p.a.
* Volume after June 2004 (Qafco 4 expansion)
36207_5H - 12.2002 - * 26 - Hydro Media
26
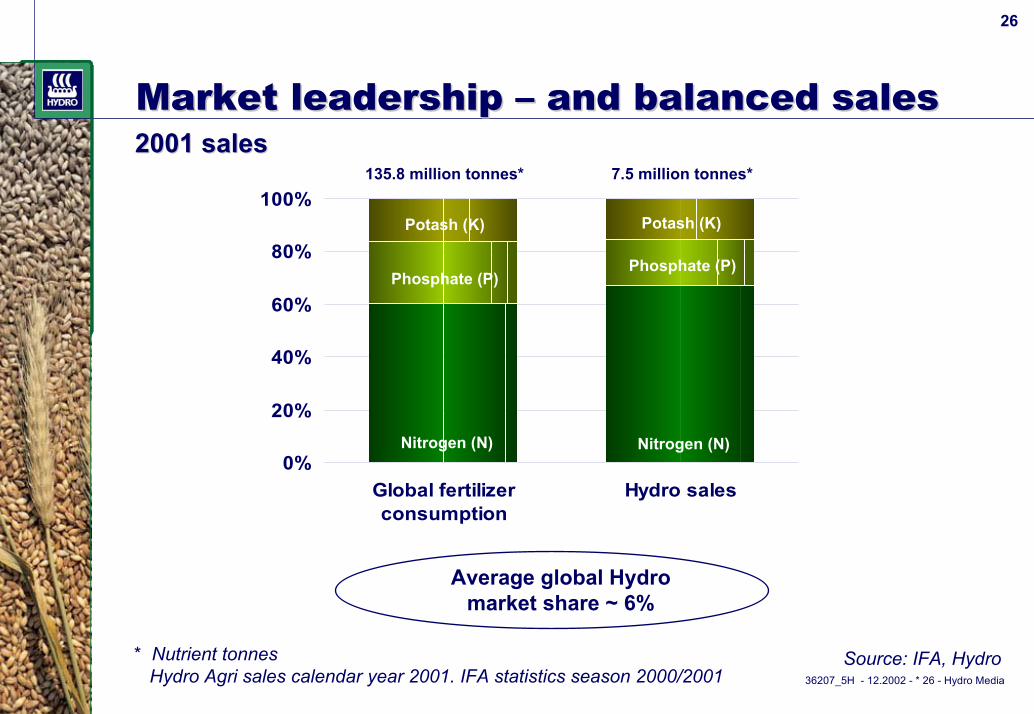
Market leadership Market leadership –– and balanced salesand balanced sales
0%
20%
40%
60%
80%
100%
Global fertilizerconsumption
Hydro sales
2001 sales2001 sales135.8 million tonnes*
Nitrogen (N)
Phosphate (P)
Potash (K)
7.5 million tonnes*
Nitrogen (N)
Phosphate (P)
Potash (K)
Average global Hydro market share ~ 6%
* Nutrient tonnesHydro Agri sales calendar year 2001. IFA statistics season 2000/2001
Source: IFA, Hydro
36207_5H - 12.2002 - * 27 - Hydro Media
27
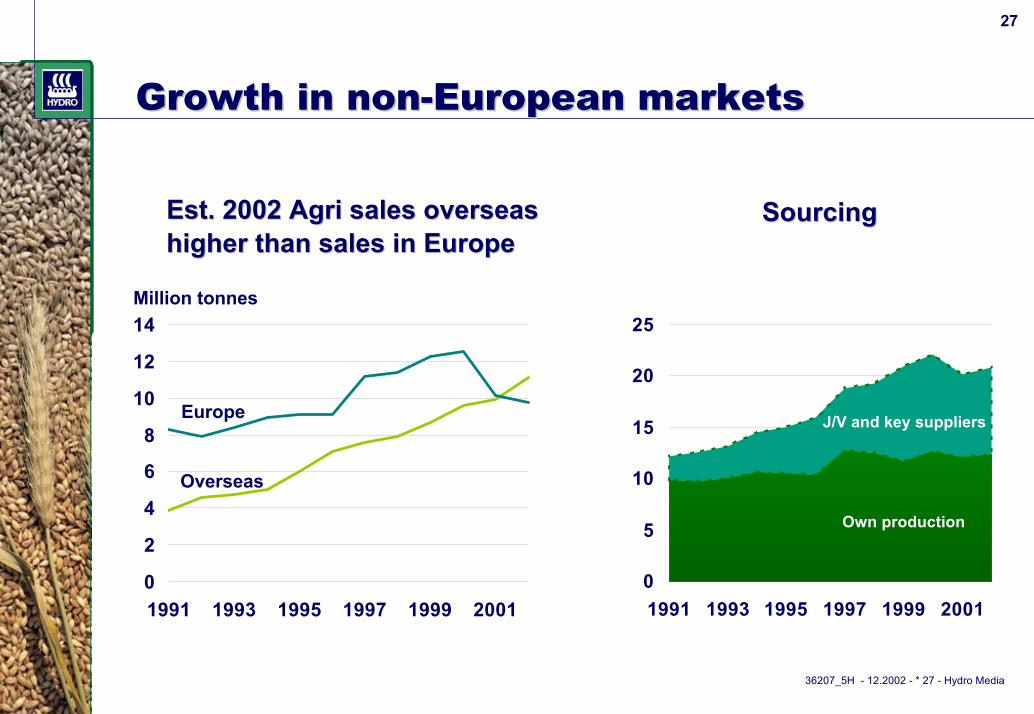
Growth in nonGrowth in non--European marketsEuropean markets
0
2
4
6
8
10
12
14
1991 1993 1995 1997 1999 2001
Million tonnes
Europe
Overseas
0
5
10
15
20
25
1991 1993 1995 1997 1999 2001
SourcingSourcingEst. 2002Est. 2002 AgriAgri sales overseassales overseashigher than sales in Europehigher than sales in Europe
Own production
J/V and key suppliers
36207_5H - 12.2002 - * 28 - Hydro Media
28
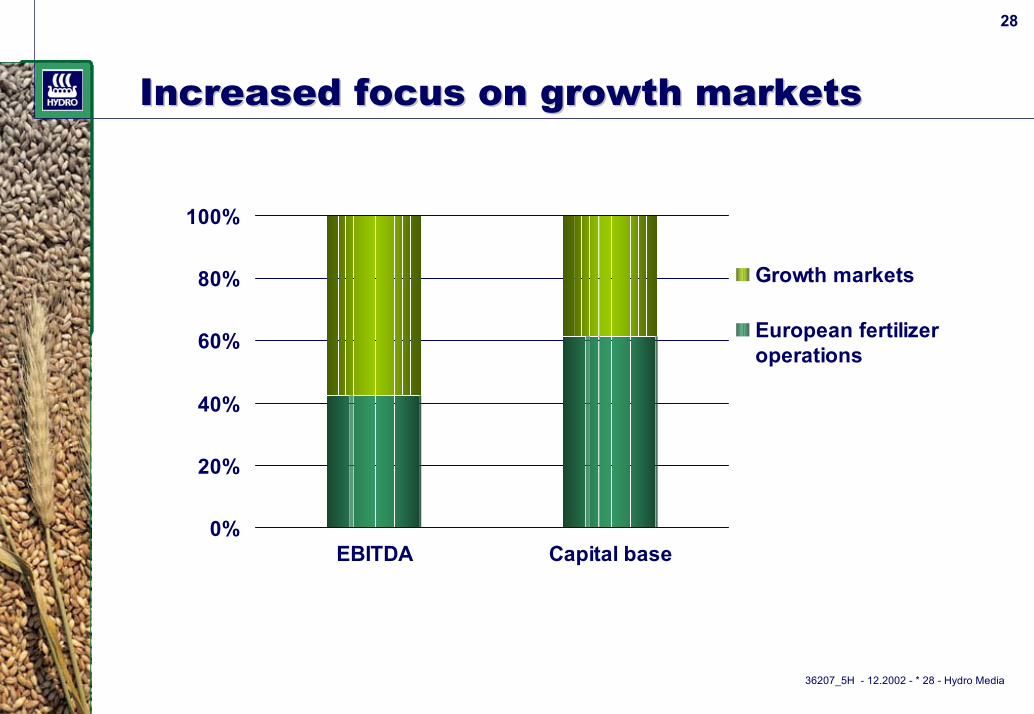
Increased focus on growth marketsIncreased focus on growth markets
0%
20%
40%
60%
80%
100%
EBITDA Capital base
Growth markets
European fertilizeroperations
36207_5H - 12.2002 - * 29 - Hydro Media
29
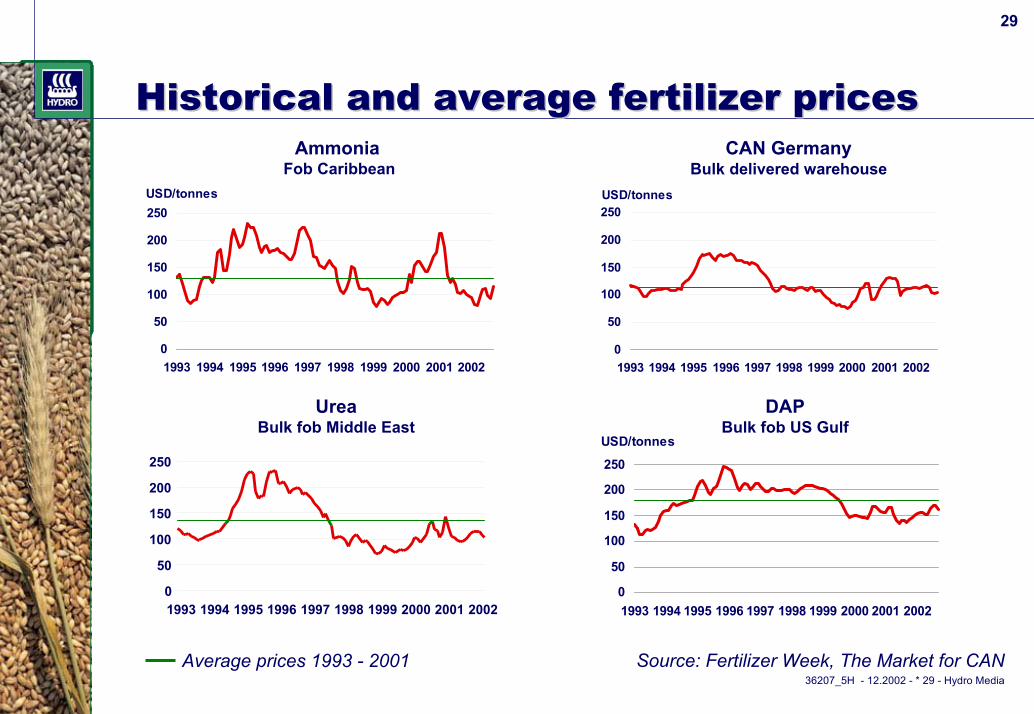
Historical and average fertilizer pricesHistorical and average fertilizer prices
0
50
100
150
200
250
1993 1994 1995 1996 1997 1998 1999 2000 2001 2002
USD/tonnes
Ammonia Fob Caribbean
UreaBulk fob Middle East
Source: Fertilizer Week, The Market for CAN
0
50
100
150
200
250
1993 1994 1995 1996 1997 1998 1999 2000 2001 2002
USD/tonnes
0
50
100
150
200
250
1993 1994 1995 1996 1997 1998 1999 2000 2001 2002
USD/tonnes
CAN GermanyBulk delivered warehouse
DAPBulk fob US Gulf
USD/tonnes 250
200
150
100
50
0 1993 1994 1995 1996 1997 1998 1999 2000 2001 2002
Average prices 1993 - 2001
36207_5H - 12.2002 - * 30 - Hydro Media
30
Jan
. -88
Jul
. -8
8 J
an. -
89 J
ul.
-89
Jan
. -90
Jul
. -9
0 J
an. -
91 J
ul.
-91
Jan
. -92
Jul
. -9
2 J
an. -
93 J
ul.
-93
Jan
. -94
Jul
. -9
4 J
an. -
95 J
ul.
-95
Jan
. -96
Jul
. -9
6 J
an. -
97 J
ul.
-97
Jan
. -98
Jul
. -9
8 J
an. -
99 J
ul.
-99
Jan
. -00
Jul
. -0
0 J
an. -
01 J
ul.
-01
Jan
. -02
Jul
. -0
2
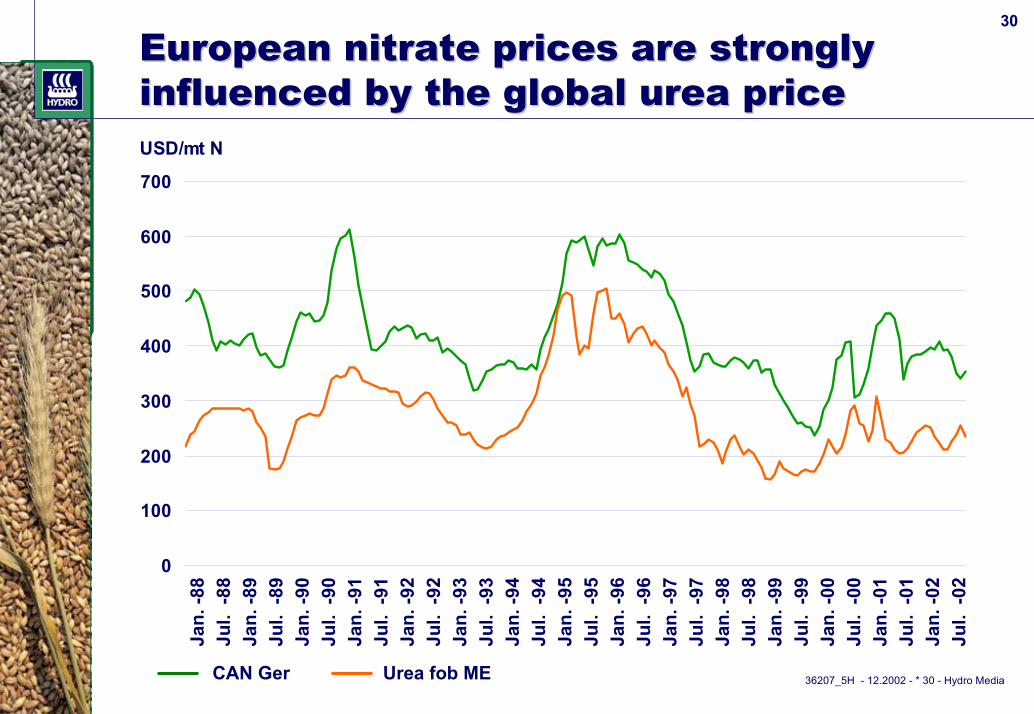
European nitrate prices are strongly European nitrate prices are strongly influenced by the global urea priceinfluenced by the global urea priceUSD/mt N
0
100
200
300
400
500
600
700
CAN Ger Urea fob ME
36207_5H - 12.2002 - * 31 - Hydro Media
31
Fertilizer prices linked to grain prices Fertilizer prices linked to grain prices --
0
1
2
3
4
5
6
1980 1982 1984 1986 1988 1990 1992 1994 1996 1998 2000 2002E 2004E
USD/bushel corn USD/tonne urea 300
250
200
150
100
50
0
Corn Chicago cash Urea fob ME Predicted urea price trend
Source: Blue-Johnson, CBT
36207_5H - 12.2002 - * 32 - Hydro Media
32
-- grain prices increasinggrain prices increasing
0
50
100
150
200
250
Jul. 97 Jan 98 Jul. Jan 99 Jul. Jan 00 Jul. Jan 01 Jul. Jan 02 Jul.
USD/mt Wheat ( fob US Gulf ) Corn ( fob US Gulf )
Source: International Grain Council
36207_5H - 12.2002 - * 33 - Hydro Media
33
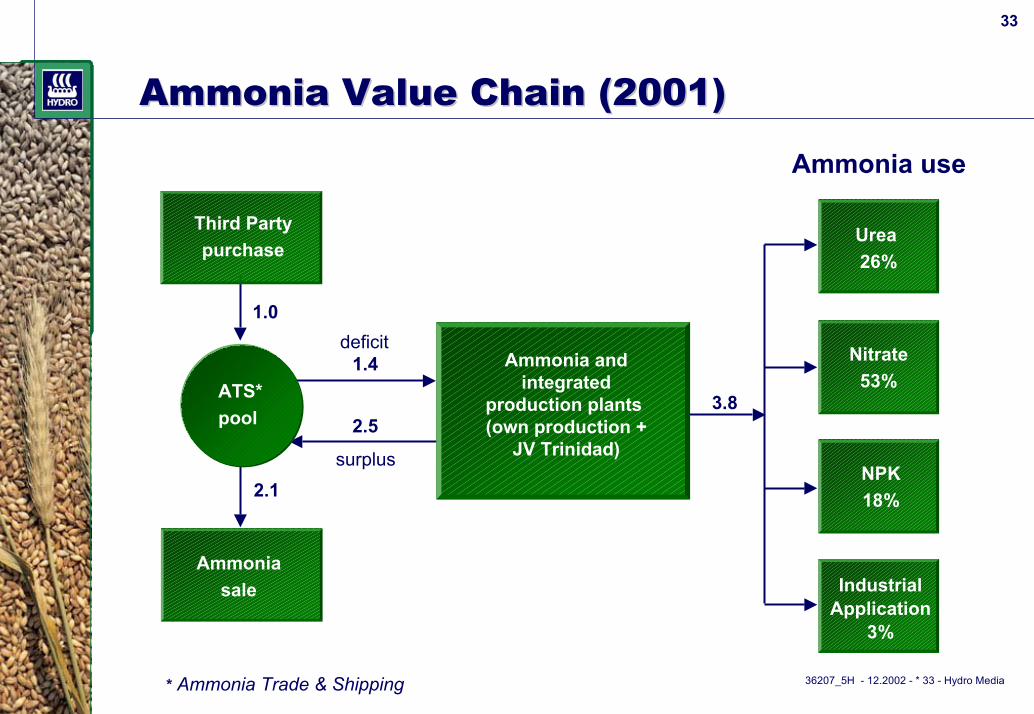
Ammonia Value Chain Ammonia Value Chain (2001)(2001)
ATS* pool
Third Party purchase
Ammonia sale
Urea 26%
Nitrate 53%
NPK 18%
Industrial Application
3%
deficit
surplus
1.4
2.5 3.8
2.1
Ammonia and integrated
production plants (own production +
JV Trinidad)
Ammonia use
1.0
* Ammonia Trade & Shipping
36207_5H - 12.2002 - * 34 - Hydro Media
34
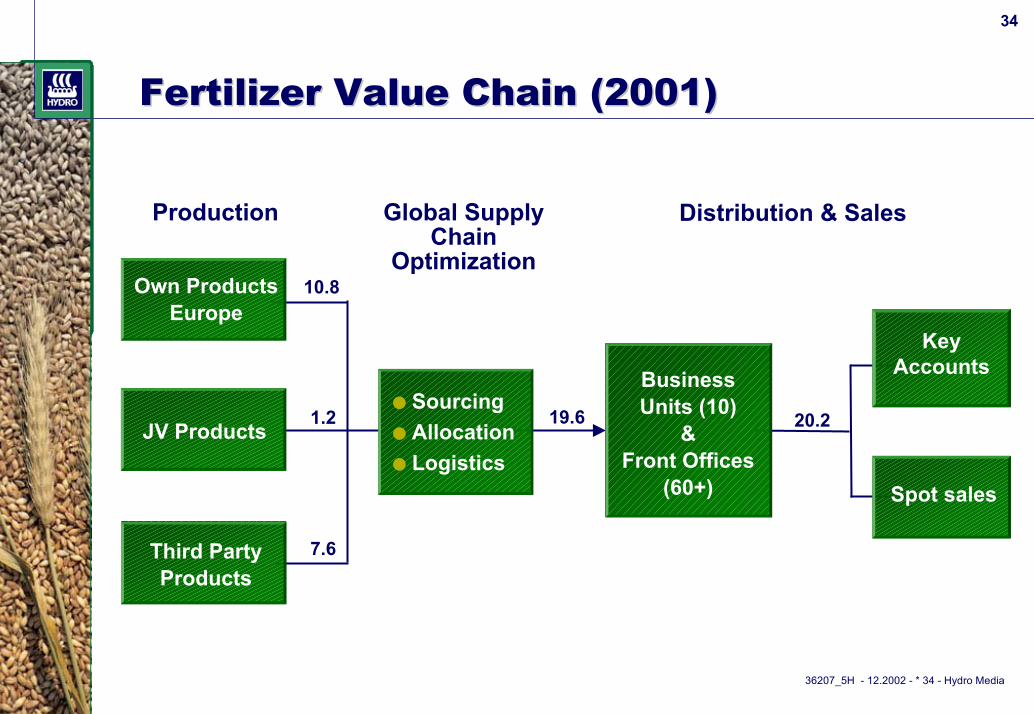
Fertilizer Value Chain Fertilizer Value Chain (2001)(2001)
Production Global Supply Chain
Optimization Own Products
Europe
JV Products
Third Party Products
● Sourcing● Allocation● Logistics
Business Units (10)
& Front Offices
(60+)
20.2
10.8
1.2
7.6
19.6
Key Accounts
Spot sales
Distribution & Sales
36207_5H - 12.2002 - * 35 - Hydro Media
35
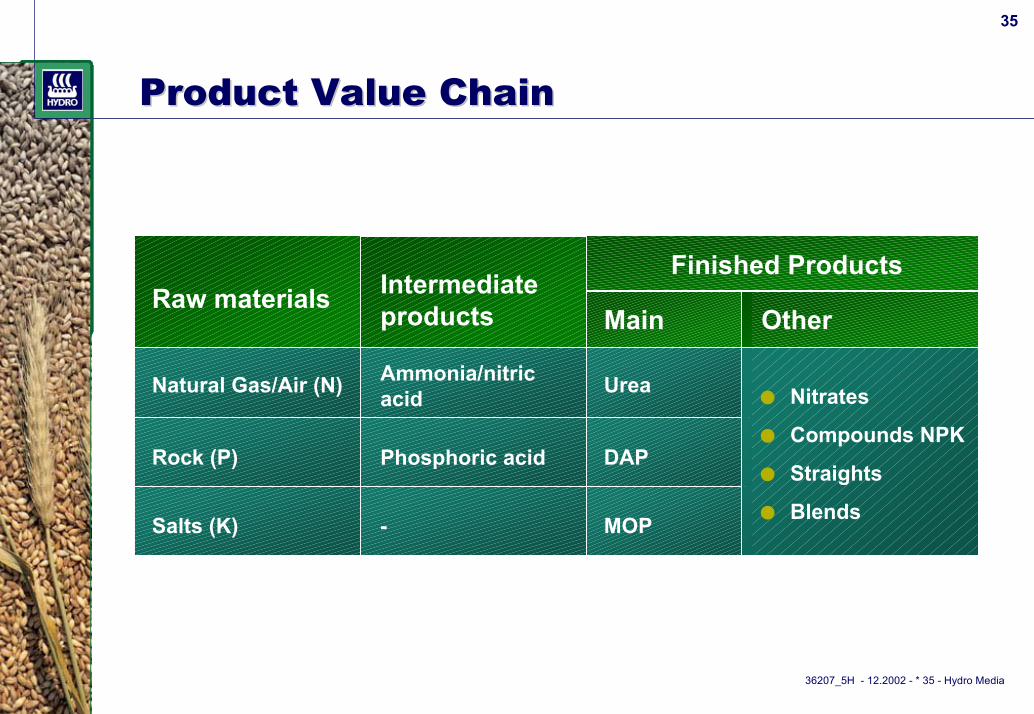
Product Value ChainProduct Value Chain
Raw materials
Natural Gas/Air (N)
Rock (P)
Salts (K)
Intermediate products
Ammonia/nitric acid
Phosphoric acid
-
Main
Urea
DAP
MOP
Other
● Nitrates
● Compounds NPK
● Straights
● Blends
Finished Products
36207_5H - 12.2002 - * 36 - Hydro Media
36
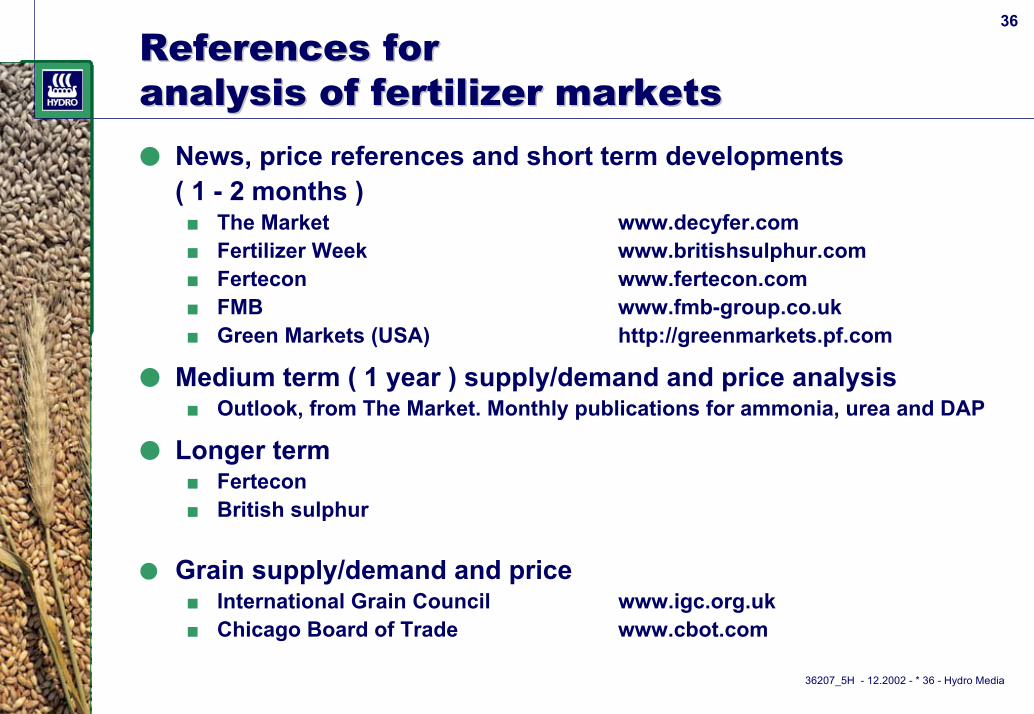
References forReferences foranalysis of fertilizer marketsanalysis of fertilizer markets● News, price references and short term developments
( 1 - 2 months )■ The Market www.decyfer.com■ Fertilizer Week www.britishsulphur.com■ Fertecon www.fertecon.com■ FMB www.fmb-group.co.uk■ Green Markets (USA) http://greenmarkets.pf.com
● Medium term ( 1 year ) supply/demand and price analysis■ Outlook, from The Market. Monthly publications for ammonia, urea and DAP
● Longer term■ Fertecon■ British sulphur
● Grain supply/demand and price■ International Grain Council www.igc.org.uk■ Chicago Board of Trade www.cbot.com
36207_5H - 12.2002 - * 37 - Hydro Media
37
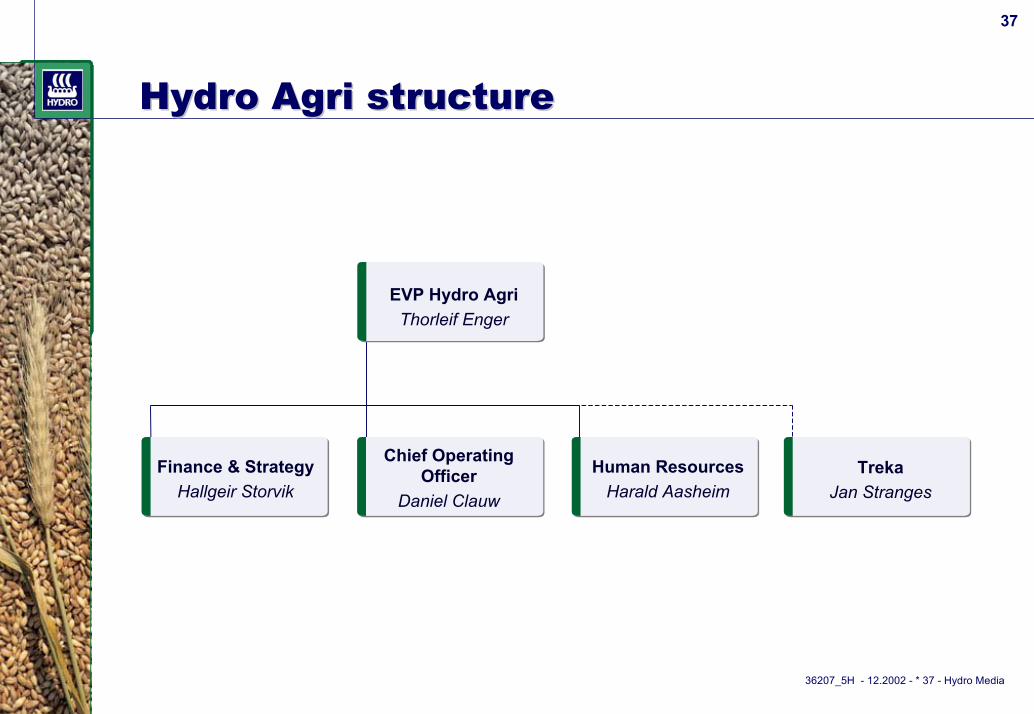
Hydro Agri structureHydro Agri structure
EVP Hydro AgriThorleif Enger
Finance & StrategyHallgeir Storvik
Chief Operating Officer
Daniel Clauw
Human ResourcesHarald Aasheim
TrekaJan Stranges