Embed Size (px)
Citation preview
Taking Stock Playing in the Indian Capital Markets
Foreword
Executive Summary
Overview of Indian Capital Markets
The Roots: Quick Recap
Deepening of Markets: Beginnings of Retail (investor) Participation
Current State: Types of Securities Markets and Their Regulation
Promoters’ Stake in Indian Economy
Fiduciaries of Companies
Promoters’ shareholding
Pledging of Shares by Promoters
Share Price Volatility
Study of Mega Issues
Overview
Price Manipulation
Price Discovery process in the Primary Market in India
How Successful is IPO Grading
Informed Trading
The Study and Methodology
The Contrarian View: Is Insider Trading Good or Bad?
Conclusion
SEBI: Market Regulation
Extent of Adoption of Corporate Governance Norms by Listed Companies
Effectiveness of Appeals Process
Analysis of Consent Orders and their Effectiveness
Annexures
Contents
01
02
03
04
05
06
1
2
4
10
20
32
36
46
T he year 1992 was in some ways a watershed year for Indian capital markets—
establishment of an independent regulatory authority, the Securities and Exchange
Board of India (SEBI), coincided with the abolishment of the restrictive Controller of
Capital Issues (CCI), signalling a marked shift in administrative approach to regulation of Indian
capital.
In the following decade, as SEBI grew stronger, the capital market also matured. There was
widespread adoption of technology such as demat accounts, setting up of online trading
platforms, developing futures and options and robust indices like SENSEX and NIFTY. Along with growth of capital
markets, there have also been frequent stock market scams such as the spectacular Harshad Mehta & Ketan Parekh
incidents and almost-regular cases of circular trading, round tripping, IPO mis-valuations, etc. And along with the
growth of scams, SEBI’s adjudication process has also matured to deal with them, even if not entirely satisfactorily.
SEBI has been instrumental in instituting a basic level of corporate governance among listed companies through the
listing agreement (Clause 49) to an extent that it has become a benchmark governance document even among non-listed
companies and other entities. The level of adherence to clause 49 (92% companies as of March 2012) while no
guarantee of the quality, at least ensures that formal governance mechanisms are in place.
Similarly, SEBI’s new 2012 requirement from listed companies to report on sustainability parameters through Business
Responsibility Reports is expected to ensure a basic level of corporate attention to this important subject which
currently is not in the ownership domain of any regulatory authority.
However, SEBI must demonstrate transparency in its working in the same measure that it expects from its constituents;
arbitrariness in adjudication process and consent orders being two major areas of concern.
In the final analysis, it is testimony to SEBI’s solid work of building the confidence of the retail investor in the Indian
capital market that even radio jockeys provide regular updates of movement in SENSEX and NIFTY in between airing
popular music.
Vijay Kumar Shunglu
(Former Comptroller & Auditor General of India)
Foreword
1
Executive Summary
t was in the 1870s, on the now-well-known ‘Dalal Street’ that the Indian Capital Market first took concrete shape. IThere has been no looking back since then; several milestones have been crossed along the way. In 1991 the liberal-
market reforms fundamentally changed the way of conducting business in India, leading to renewed interest in the
capital markets. The legislative framework of the country has been moving towards developing stronger, dependable and
more participative/wider capital markets in India; as a result, they witnessed significant growth in this period. There is also a
flip side to the story: the increasing number of scams and volatility in the market during this period. With the help of market
regulators like SEBI and supportive legislation, a concerted attempt is being made to deliver clean markets. This paper seeks
to take stock of the current situation; to see the kind of impact some of these activities have had on the market. Such an
attempt has to be, by its very nature, a matter of vast scope; this paper is an attempt to approach the subject from certain
perspectives, thereby contribute to the understanding of the current scenario. Following are the key findings:
Promoters' Stake in Indian Economy
Promoters’ holding is one of the key determinants of
firm value.
Literature suggests a non-linear relationship between
these two indicating that somewhere in the lifespan of
the firm, as the promoters' holding increases, s/he may
indulge in non-value maximizing activities.
Analysis of BSE 500 companies (over three years)
shows that on an average their stake has been around
60%.
Pledging of Shares by Promoters
Pledging of shares by a promoter lead him/her to
manipulate stock prices, to keep them at an artificial
level, to maintain margin money or avert a hostile
takeover (as exemplified in the case of Satyam
Computer Services Limited recently).
Analysis of BSE 500 companies shows that promoters
have pledged shares in about 35% of them. As far as the
extent of pledging goes, on an average it is about 30 %
of the promoters' shares.
Pledging has also increased in the years 2009-10 (44%)
and 2010-11 (27%).
Pledging is believed to be one of the precursors of
volatility in the market.
Our analysis shows that on an average 75% of the
companies with pledged shares have also exhibited
share price volatility greater than 10%.
About 87% of the companies with pledged promoters'
shares display more volatility than BSE Sensex or BSE
200 index.
On an average in 70% of the companies had share price
volatility greater than 10%, there was in fact movement
in pledged shares; and in about 68% of these, the
movement in pledged shares was greater than 10%.
The analysis has found beyond reasonable doubt a
coincidence between instances of pledged shares and
share price volatility.
Study of Mega Issues
Several studies have found distinct evidence of
manipulation in IPO pricing, in an attempt to stabilize
prices at a certain level.
Our analysis of mega issues (size of Rs 300 cr. or more),
shows that in almost 41% of the cases across years, the
opening price itself was at a discount to the offer price,
suggestive of off-market operations.
Most of the companies are not able to retain the day's
Taking Stock: Playing in the Indian Capital Markets
2
opening price during day’s trading: nearly 74% of the
issues closed at a price lower than the opening price.
Further analysis of price movements during the
subsequent eight months shows that while on an
average 29% of the issues trade at discount by the end
of the first month, as many as 48% trade at a discount
from the third month onwards and this percentage
becomes more than 50% by the end of the seventh
month.
IPO grading an attempt to simplify the task of
evaluating complex IPO process does not seem to be a
good indicator of future performance. In 2010-11 half
of the issues graded ‘five’ and almost 90% of those
graded ‘four’ had negative returns.
Informed Trading
We analysed instances of insider trading disclosed to
BSE. The preceding and succeeding period of ‘the
insider trade’ (15 days before and after) was compared
with ‘the normal period’ (30 days before the beginning
of the preceding period).
Greater share price volatility and turnover were
observed in both the periods preceding and succeeding
the day of the insider trade.
A fall in price accompanied by 5-10% intra-day swing
was observed in the share price.
SEBI: Market Regulation
Corporate Governance Norms: Analysis of company
submissions of compliance report to SEBI for the
quarter ended on 30th June 2011 shows that seventy per
cent companies comply with prescribed norms.
Analysis of the Appeals Process of SEBI (100 appeals
studied) shows that in 35% of the cases it took more
than 4 years for SEBI to appoint an AO, the first level
authority in the process. In 32% of the cases the show-
cause notice was issued after six months.
In 40% cases it took more than 2 years to complete
proceedings.
In 56% cases it took more than 5 years to pass an order.
There seems to be no prescribed standard time with
respect to the notice, suggesting arbitrariness in the
process.
Analysis of Consent Orders
Consent order allows compounding of offence,
whereby an accused pays compounding charges in
lieu of undergoing consequences of prosecution.
In the analysis of about 100 consent orders, we found
that 53 % of the cases were resolved within 180 days;
another 28% were wrapped up in 180-360 days.
Consent Orders do positively expedite the resolution
of old cases.
But about 24% of the cases settled through consent
orders were less than twelve months old where SEBI
could have taken the normal route. There are no clear
guidelines regarding the type of cases that may be
settled through the consent order route, leaving
considerable room for discretion.
In 58% of the cases penalty levied is less than Rs 3
lacs, possibly indicating revenue loss to SEBI, perhaps
not a stringent enough application of the provisions
leading to a weaker monetary deterrent for lapses.
Moreover no correlation could be found between
ageing of cases and the amount of penalty, suggesting
some subjectivity in its application.
On January 2001, Sensex hovered around 4000. In the
following decade it witnessed about a fourfold rise: in the
last few years, ranging between 15000 and 20000. This is
the decade in which the Indian growth story established
itself; the Indian businesses gained increasing access to
global capital; while the FIIs, attracted by the buoyancy in
India, increased their participation and exposure to the
Indian Capital Markets. It must have been a challenge for
SEBI to not only manage such a market, but keep it free
of all dubious operations and at the cutting edge of
global best practices. There is still some distance to go
before the Indian Capital Markets can be declared truly
mature, transparent and rule-based; however, one can
safely assume they are on their way.
Kshama V Kaushik
Director, Thought Arbitrage Research Institute
Vishesh Chandiok
National Managing Partner, Grant Thornton India
Executive Summary
3
Taking Stock: Playing in the Indian Capital Markets
4
OVERVIEW OF INDIANCAPITAL MARKETS
01
The Roots: Quick Recap
The first instance of an organised market in stocks, in
India, can be traced back to 1870s; by when, the securities
market had stabilised enough for brokers to gather together
in a sort of marketplace on a street called ‘Dalal Street’, in
Bombay (now Mumbai). In 1875, The Native Share and
Stock Brokers Association was formally established, also
known as the Bombay Stock Exchange. It is the oldest
stock exchange in Asia.
As the economy consolidated under the British Raj, several
stock exchanges opened across the country one after the
other. Post independence their fortunes fluctuated as many
merged, re-organised or shut down altogether. Around 21
stock exchanges are registered and recognised under the
Securities Contracts (Regulation) Act, 1956. However,
today only twonamely, Bombay Stock Exchange (BSE) and
National Stock Exchange (NSE) have active trading in
large volumes and may be considered representative of
Indian securities market.
The Bombay Stock Exchange developed the BSE Sensex in
1986, an indicator to measure overall performance of the
exchange. Historically an open-cry floor trading exchange,
the Bombay Stock Exchange switched to an electronic
trading system in 1995. In 2000 the BSE, based on this
index, opened its derivatives market in Sensex futures
contracts. The development of Sensex options along with
equity derivatives followed in 2001 and 2002, expanding the
BSE's trading platform.
Capital markets reforms in India and the launch of the
Securities and Exchange Board of India (SEBI) accelerated
the formation of the second Indian stock exchange called
the National Stock Exchange (NSE) in 1992. Within a few
years of its existence, NSE has become the largest stock
exchange in India. Three segments of the NSE trading
platform were established one after another. The
Wholesale Debt Market (WDM) commenced
operations in June 1994 and the Capital Markets (CM)
segment was opened at the end of 1994. Finally the
Futures and Options segment began operating in 2000.
Deepening of Markets: Beginnings of Retail
(investor) Participation
Retail investors began participating in the stock markets
in a small way with the dilution of the FERA in 1978.
Multinational companies with operations in India were
forced to reduce their foreign share- holding below a
certain percentage, which led to a compulsory sale of
shares or issuance of fresh stock. Indian investors who
applied for these shares realised windfall gains, because
those days share issue price could not be decided freely
and the formula for pricing was very conservative.
The next big boom and mass participation by retail
investors happened in 1980, with the entry of Dhirubhai
Ambani-promoted Reliance. Prime Minister V.P. Singh’s
fiscal budget in 1984 removed estate duty and reduced
taxes leading to new issues and several new companies in
1985. Manmohan Singh (as Finance Minister)
introduced liberal-market reforms in 1991, completely
transforming the way business was conducted. This led
to a resurgence of interest in the capital markets, only to
be deflated by the Harshad Mehta scam in 1992. The
end-1990s witnessed the Ketan Parekh debacle and also
the advent of information, communication and
entertainment companies. This period coincided with
the dotcom bubble in the US, followed by a melt-down
in software stocks in early 2000. Subsequent
governments continued the liberalization and reform
process: opening up the economy, lifting taxes on long-
term gains and introducing
5
Overview of Indian Capital Markets
Overview of Indian Capital Markets
Taking Stock: Playing in the Indian Capital Markets
6
early 2000. Subsequent governments continued the liberalization and reform process: opening up the economy, lifting
taxes on long-term gains and introducing short-term turnover tax to encourage small investors to redirect their
savings into stocks.
In the last few years, the introduction of the Fraudulent Trade Practices Act, the Prevention of Insider Trading Act
and the Takeover Code and Corporate Governance Norms has made the Indian Capital markets attractive to foreign
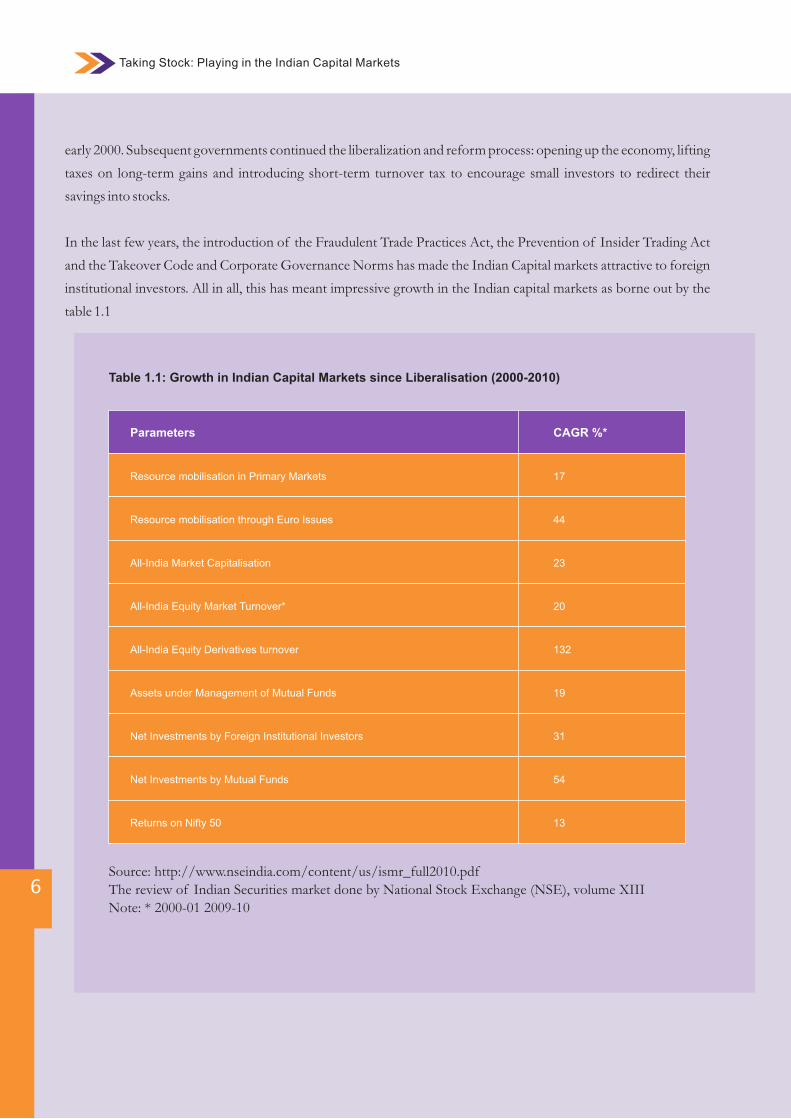
institutional investors. All in all, this has meant impressive growth in the Indian capital markets as borne out by the
table 1.1
Source: http://www.nseindia.com/content/us/ismr_full2010.pdfThe review of Indian Securities market done by National Stock Exchange (NSE), volume XIIINote: * 2000-01 2009-10
Table 1.1: Growth in Indian Capital Markets since Liberalisation (2000-2010)
Parameters CAGR %*
Resource mobilisation in Primary Markets 17
Resource mobilisation through Euro Issues
All-India Market Capitalisation
All-India Equity Market Turnover*
All-India Equity Derivatives turnover
Assets under Management of Mutual Funds
Net Investments by Foreign Institutional Investors
Net Investments by Mutual Funds
Returns on Nifty 50
44
23
20
132
19
31
54
13
7
Current State: Types of Securities Markets and their
Regulation
India is evolving into one of the most sophisticated trading
destinations internationally. It has a long history of both
the debt and the equity markets. Within equity, India has a
fairly developed primary, secondary and derivatives market.
Fresh issue of shares and other securities are conducted
through the primary market. Investors can also buy/ sell
securities in the secondary market. Trading is carried out
through intermediaries on the stock exchange under the
prescribed regulatory framework. Derivative trading in
India is allowed in index futures, stock futures, index
options and stock options.
In the recent years, India has seen several scams. The
regulators haven't lagged behind. Many new legislations,
along with the older ones, are in place to regulate the
market. Prominent among them are:
SEBI Act, 1992
Companies Act, 1956
Securities Contract (Regulation) Act, 1956
Depository Act, 1996
Prevention of Money Laundering Act, 2002
Securities markets are subject to varying degrees of
regulation all over the world, because they involve vast
sums of money critical to the economy; integrity is a key
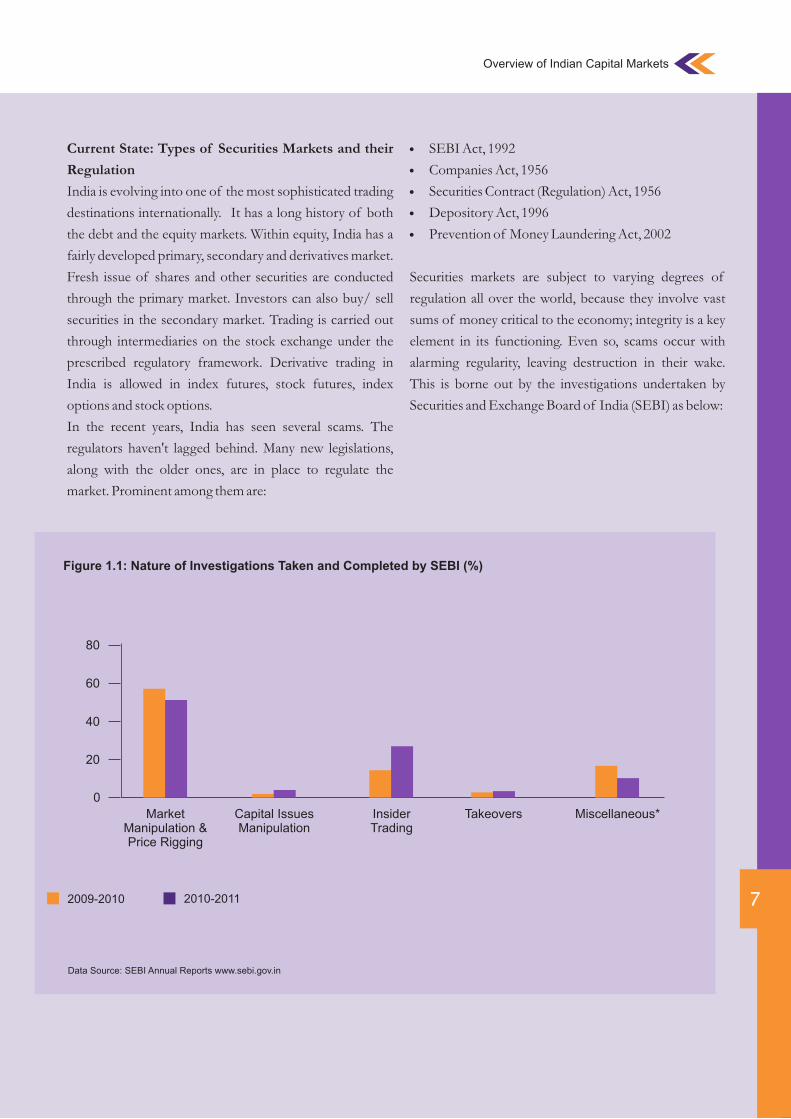
element in its functioning. Even so, scams occur with
alarming regularity, leaving destruction in their wake.
This is borne out by the investigations undertaken by
Securities and Exchange Board of India (SEBI) as below:
Figure 1.1: Nature of Investigations Taken and Completed by SEBI (%)
Data Source: SEBI Annual Reports www.sebi.gov.in
MarketManipulation &Price Rigging
Capital IssuesManipulation
InsiderTrading
Takeovers Miscellaneous*
2009-2010
0
20
40
60
80
2010-2011
Overview of Indian Capital Markets
Taking Stock: Playing in the Indian Capital Markets
8
Market surveillance plays a significant role in proper functioning of the markets. It has been and is expected to be one of the key inputs from SEBI into the process of development of the Indian Capital Markets.
SEBI, ever since its inception has effected considerable
change in the Indian capital markets. More specifically, it has
worked hard to develop and succeeded reasonably in
increasing:
Market Capitlization
Number of listed firms
Trading volumes and turnover in all sections of the
market
There is an ever growing network of intermediaries instrumental in market formation. India has a fairly
sophisticated new issuance market with a framework of
regulations and procedures that would match the best in the 1world. Yet it is also a market that has been constantly
marred by scams every now and then.
Manipulation and rigging of price, and insider trading have
been the proverbial “thorn in the flesh” for the regulator.
Market surveillance plays a significant role in proper
functioning of the markets. It has been and is expected to be
one of the key inputs from SEBI into the process of
development of the Indian Capital Markets.
9
1 Sabarinathan G.SEBI's regulation of the Indian securities market: a critical review of the major developments.
Vikalpa 2010;35(4):13-26.
Overview of Indian Capital Markets
Later, the paper delves deeper into the effectiveness of the
specific measures undertaken by SEBI. From this point on
the paper will attempt to evaluate if the capital markets
which have come to play an increasingly significant role in
resource mobilization in the country in the last decade are
running effectively and efficiently enough, to fulfil their
essential role.
The Organization of the Paper:
Part 1- deals with the promoters’ stake in Indian capital
markets, extent of pledging of such promoters' stake and
the price volatility as a result of such pledging. The study
uses volatility as a proxy for market manipulation by
promoters and investigates if pledging of promoters' stake
increases the chances of manipulation thereby the
resultant instability in markets
Part 2 - looks at the price discovery process in the
primary market, using mega issues as the base, to see if
there are possible price manipulations.
Part 3 - looks at share price manipulation in the
secondary market through informed trading. Insider
trading is difficult to catch except with the most
sophisticated surveillance mechanisms. The study
analyses informed trading to examine whether there is
sufficient reason to believe that there is price
manipulation in secondary markets.
Part 4 - looks at the role of SEBI as the market
regulator and examines the effectiveness of its
adjudication process, particularly the practice of
consent orders as a means of settling disputes.
Taking Stock: Playing in the Indian Capital Markets
02PROMOTERS' STAKE AND IMPACT ON THE INDIAN ECONOMY
10
Promoters' shareholding
'Promoter Group' includes the promoter or an
immediate relative of the promoter (i.e. spouse, parent,
brother, sister or child of the person or of the spouse).
In case the promoter is a company the following would
be clubbed as well:
a subsidiary or holding company of that company
any company in which the promoter holds 10% or
more of the equity capital or which holds 10% or
more of the equity capital of the Promoter
any company in which a group of individuals or
companies or combinations thereof holds 20% or
more of the equity capital.
Promoters’ holding is one of the key determinants of
firm value. In a study, Anirban Ghatak found a non-
linear relationship between the two. The firm’s value
initially increases with increase in promoters’ stake, and
then somewhere in the middle it decreases due to focus
on ‘entrenchment and other non-value maximizing
activities’. As the stake rises further, the promoters’
interest once again gets aligned with the firm and works
favourably for firm value. As per entrenchment
hypothesis, more equity ownership by manager/insider
may lead to lower financial performance. With larger
stake they might not be inclined to maximizing firm
profit but look to maximize their personal utility. The
study also affirms “Firms having high promoters’
holding have experienced several fraud cases like
accounting fraud, wrong information to the market etc.
impacting the firm's value. Where the ownership is
diversified their performance has been found to be 3
better”.
11
Promoters' Stake and Impact on the Indian Economy
Fiduciaries of Companies
A promoter is a person who puts together a business,
particularly a corporation and provides or arranges initial
financing and management depth. He/she is in over-all
control of the company and is instrumental in the
formulation of the initial investment plan or programme,
pursuant to which securities may be offered to the public.
Promoters have a strong influence not only on the
companies’ fortunes, but also on the interest of various
stakeholders.
He/she stands in a fiduciary relationship with other
investors and the corporation itself. It is an integral part of
their duties to conduct their activities in utmost good faith
and with strictest honesty and candour. He/ she is legally
charged with a duty to disclose any interest in any
transaction with the corporation. Their role being creative,
exacting and challenging, it is natural for them to desire a
certain amount of latitude in discharging their duties.
Recently, however, as the Indian economy has begun to
mature and become more competitive, the instances of
stretching this too far have also been on the rise. A recent
report on dealings of private equity (PE) firms has brought
to light how the promoters and the firms have run into
rough weather as the PE firms demand premium for alleged
instances of bribery, graft , corporate governance failure 2
etc.
The following sections examine the role of Indian
promoters in terms of shareholding and control, followed
by an in-depth analysis of the phenomenon of pledging of
shares by promoters and, its links with stock volatility and
return.
Promoters' Stake and Impact on the Indian Economy
Taking Stock: Playing in the Indian Capital Markets
12
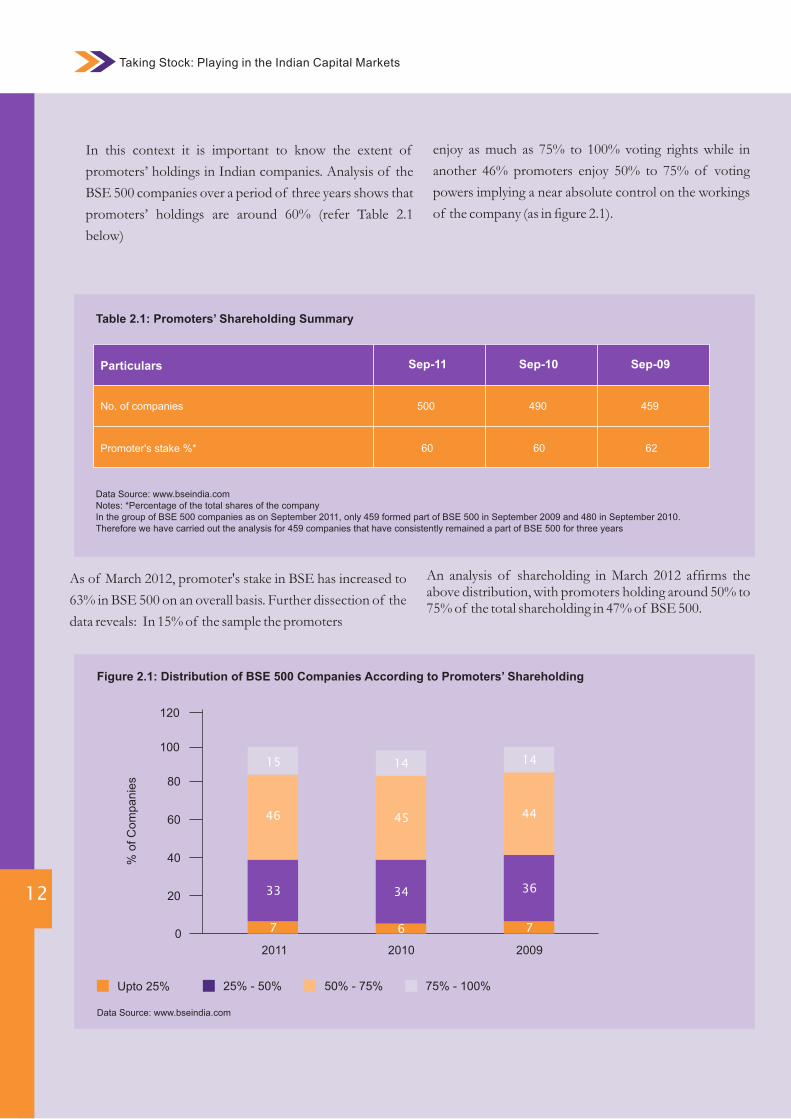
Table 2.1: Promoters’ Shareholding Summary
Data Source: www.bseindia.com Notes: *Percentage of the total shares of the companyIn the group of BSE 500 companies as on September 2011, only 459 formed part of BSE 500 in September 2009 and 480 in September 2010. Therefore we have carried out the analysis for 459 companies that have consistently remained a part of BSE 500 for three years
Particulars
No. of companies
Sep-11 Sep-10 Sep-09
Promoter's stake %*
500 490 459
60 60 62
Figure 2.1: Distribution of BSE 500 Companies According to Promoters’ Shareholding
Data Source: www.bseindia.com
2011 2010 2009
0
20
40
60
80
100
120
Upto 25% 25% - 50% 50% - 75% 75% - 100%
7
33
46
15
6 7
34 36
45 44
14 14
% o
f C
om
panie
s
In this context it is important to know the extent of
promoters’ holdings in Indian companies. Analysis of the
BSE 500 companies over a period of three years shows that
promoters’ holdings are around 60% (refer Table 2.1
below)
As of March 2012, promoter's stake in BSE has increased to
63% in BSE 500 on an overall basis. Further dissection of the
data reveals: In 15% of the sample the promoters
enjoy as much as 75% to 100% voting rights while in
another 46% promoters enjoy 50% to 75% of voting
powers implying a near absolute control on the workings
of the company (as in figure 2.1).
An analysis of shareholding in March 2012 affirms the above distribution, with promoters holding around 50% to 75% of the total shareholding in 47% of BSE 500.
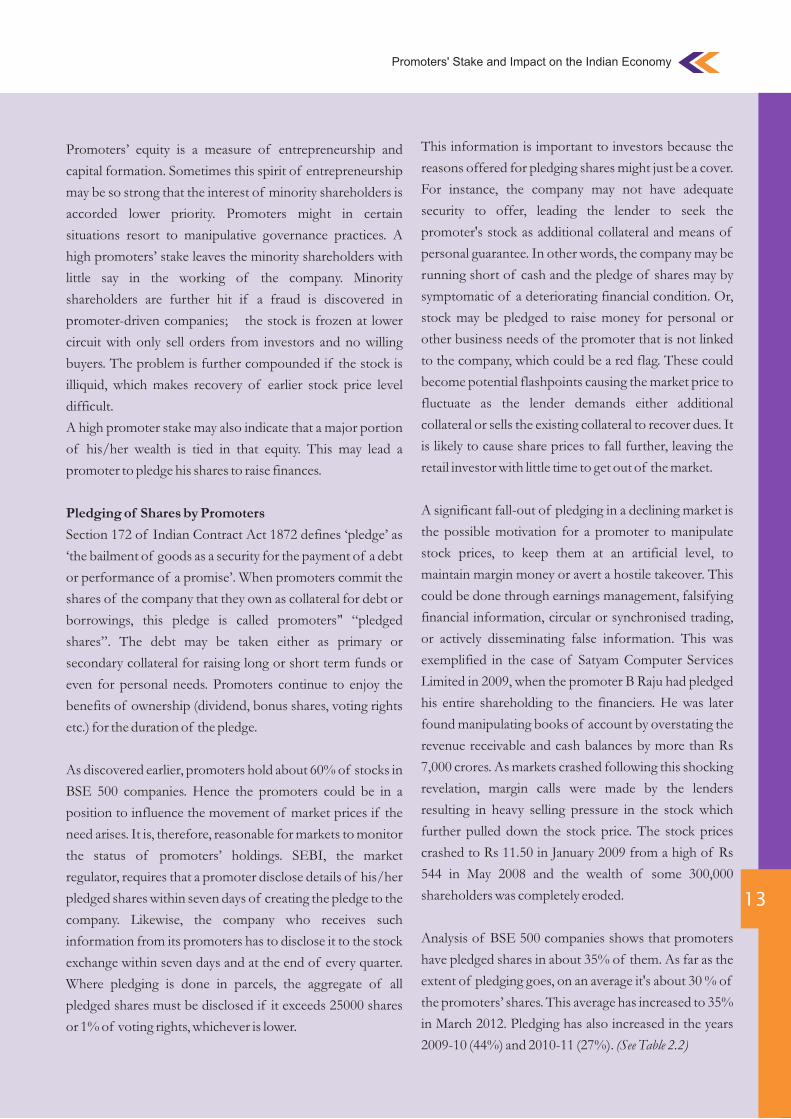
This information is important to investors because the
reasons offered for pledging shares might just be a cover.
For instance, the company may not have adequate
security to offer, leading the lender to seek the
promoter's stock as additional collateral and means of
personal guarantee. In other words, the company may be
running short of cash and the pledge of shares may by
symptomatic of a deteriorating financial condition. Or,
stock may be pledged to raise money for personal or
other business needs of the promoter that is not linked
to the company, which could be a red flag. These could
become potential flashpoints causing the market price to
fluctuate as the lender demands either additional
collateral or sells the existing collateral to recover dues. It
is likely to cause share prices to fall further, leaving the
retail investor with little time to get out of the market.
A significant fall-out of pledging in a declining market is
the possible motivation for a promoter to manipulate
stock prices, to keep them at an artificial level, to
maintain margin money or avert a hostile takeover. This
could be done through earnings management, falsifying
financial information, circular or synchronised trading,
or actively disseminating false information. This was
exemplified in the case of Satyam Computer Services
Limited in 2009, when the promoter B Raju had pledged
his entire shareholding to the financiers. He was later
found manipulating books of account by overstating the
revenue receivable and cash balances by more than Rs
7,000 crores. As markets crashed following this shocking
revelation, margin calls were made by the lenders
resulting in heavy selling pressure in the stock which
further pulled down the stock price. The stock prices
crashed to Rs 11.50 in January 2009 from a high of Rs
544 in May 2008 and the wealth of some 300,000
shareholders was completely eroded.
Analysis of BSE 500 companies shows that promoters
have pledged shares in about 35% of them. As far as the
extent of pledging goes, on an average it's about 30 % of
the promoters’ shares. This average has increased to 35%
in March 2012. Pledging has also increased in the years
2009-10 (44%) and 2010-11 (27%). (See Table 2.2)
13
Promoters’ equity is a measure of entrepreneurship and
capital formation. Sometimes this spirit of entrepreneurship
may be so strong that the interest of minority shareholders is
accorded lower priority. Promoters might in certain
situations resort to manipulative governance practices. A
high promoters’ stake leaves the minority shareholders with
little say in the working of the company. Minority
shareholders are further hit if a fraud is discovered in
promoter-driven companies; the stock is frozen at lower
circuit with only sell orders from investors and no willing
buyers. The problem is further compounded if the stock is
illiquid, which makes recovery of earlier stock price level
difficult.
A high promoter stake may also indicate that a major portion
of his/her wealth is tied in that equity. This may lead a
promoter to pledge his shares to raise finances.
Pledging of Shares by Promoters
Section 172 of Indian Contract Act 1872 defines ‘pledge’ as
‘the bailment of goods as a security for the payment of a debt
or performance of a promise’. When promoters commit the
shares of the company that they own as collateral for debt or
borrowings, this pledge is called promoters’' “pledged
shares”. The debt may be taken either as primary or
secondary collateral for raising long or short term funds or
even for personal needs. Promoters continue to enjoy the
benefits of ownership (dividend, bonus shares, voting rights
etc.) for the duration of the pledge.
As discovered earlier, promoters hold about 60% of stocks in
BSE 500 companies. Hence the promoters could be in a
position to influence the movement of market prices if the
need arises. It is, therefore, reasonable for markets to monitor
the status of promoters’ holdings. SEBI, the market
regulator, requires that a promoter disclose details of his/her
pledged shares within seven days of creating the pledge to the
company. Likewise, the company who receives such
information from its promoters has to disclose it to the stock
exchange within seven days and at the end of every quarter.
Where pledging is done in parcels, the aggregate of all
pledged shares must be disclosed if it exceeds 25000 shares
or 1% of voting rights, whichever is lower.
Promoters' Stake and Impact on the Indian Economy
Taking Stock: Playing in the Indian Capital Markets
14
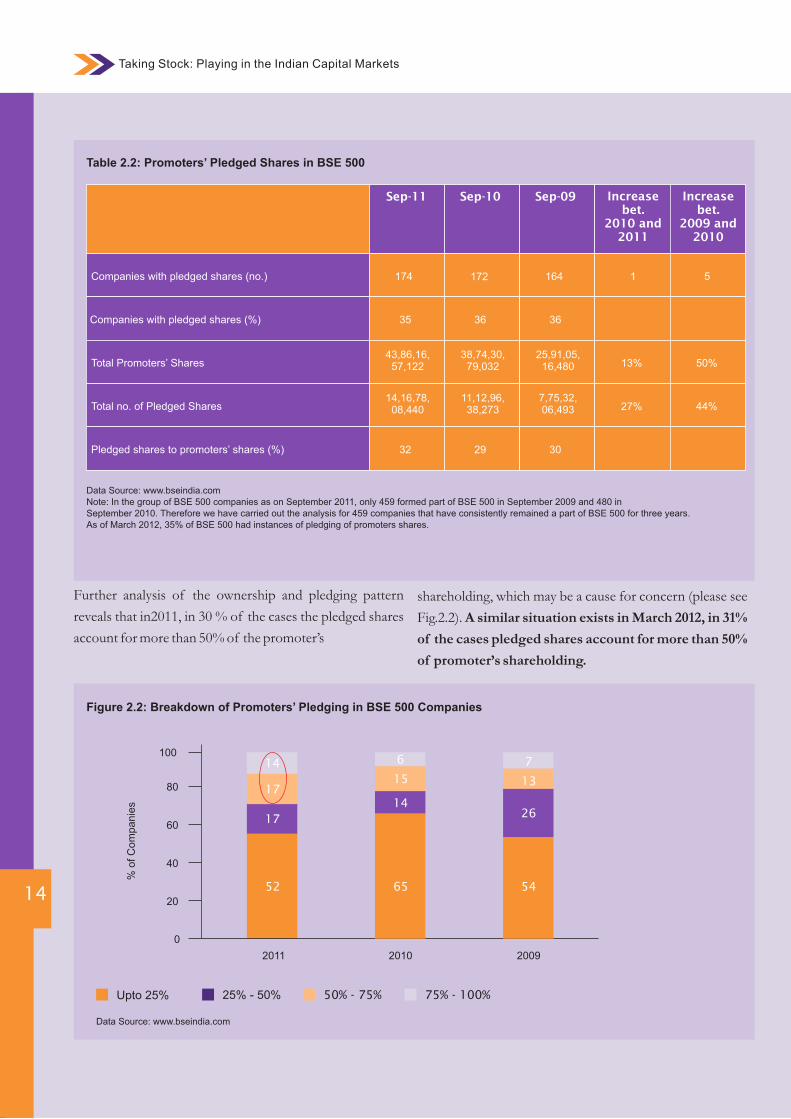
Further analysis of the ownership and pledging pattern
reveals that in2011, in 30 % of the cases the pledged shares
account for more than 50% of the promoter’s
shareholding, which may be a cause for concern (please see
Fig.2.2). A similar situation exists in March 2012, in 31%
of the cases pledged shares account for more than 50%
of promoter’s shareholding.
Data Source: www.bseindia.comNote: In the group of BSE 500 companies as on September 2011, only 459 formed part of BSE 500 in September 2009 and 480 in September 2010. Therefore we have carried out the analysis for 459 companies that have consistently remained a part of BSE 500 for three years.As of March 2012, 35% of BSE 500 had instances of pledging of promoters shares.
Table 2.2: Promoters’ Pledged Shares in BSE 500
Companies with pledged shares (no.) 17
Companies with pledged shares (%)
Total Promoters’ Shares
Total no. of Pledged Shares
Pledged shares to promoters’ shares (%)
44
23
20
132
Increase bet.
2010 and 2011
Increase bet.
2009 and 2010
Sep-11 Sep-10 Sep-09
174 172 164 1 5
35 36 36
43,86,16,57,122
38,74,30,79,032
25,91,05,16,480 13% 50%
14,16,78,08,440
11,12,96,38,273
7,75,32,06,493 27% 44%
32 29 30
Figure 2.2: Breakdown of Promoters’ Pledging in BSE 500 Companies
Data Source: www.bseindia.com
Upto 25% 25% - 50% 50% - 75% 75% - 100%
2011
0
20
40
60
80
100
52
% o
f C
om
panie
s
17
14
17
2010
65
6
15
14
2009
54
7
13
26
We have analysed the shareholding pattern of BSE 200
companies in order to examine the link, if any, between
promoters’ pledged shares and capital markets instability.
We have examined share price volatility with variations in
number of pledged shares (submitted quarterly to BSE, as
part of shareholding pattern filing) to ascertain if there is
any co-relation (between the two)
Methodology and limitations: The study covers fourteen
quarters beginning March 2009 till June 2012. For the
purpose of the selection of the sample, companies with
pledged shares in the preceding quarter or any time during
the calendar year have been considered. For share prices,
monthly closing price has been considered.
The analysis however does not:
Reflect any movements within the quarter, during which
the pledging and shareholding may have varied
Similarly, any share price movements within the month
are not reflected
Note: Disclosure of shareholding pattern information has
been made mandatory with effect from January 28, 2009.
Observations of shareholding analysis: Consistent with the
earlier findings, about 35% of the BSE 200 sample have
pledged shares.
15
In the BSE 500 sample both the promoters’ shareholding
and extent of pledging is quite high.This could expose the
stock market to high price volatility, manipulation etc.,
creating all manner of instability in the system. It becomes
all the more probable given the fact that in nearly one third
of the BSE 200 sample the pledging is more than 25% of
the promoters’ holding. According to a report by Crisil
Research, promoters of 31% of the 1,214 listed companies
and with a market capitalisation of Rs100 crore or more,
have pledged substantial portion of their shareholding. The
risk to market stability increases further in an already
challenging macro economic environment. The total pledge
works out to Rs1.1 lakh crore worth of market capitalisation 4as on 18 November 2011.
Share Price Volatility
Pledging of shares, as observed in the analysis above, seems
to have become a norm among promoters in India. It is
believed to be one of the precursors of volatility in the
market as lenders need to maintain a certain level of margin
money.
In the BSE 500 and BSE 200 both the promoters' shareholding and extent of pledging is quite high. This could expose the stock market to high price volatility, manipulation creating instability in the system.
Promoters' Stake and Impact on the Indian Economy
Taking Stock: Playing in the Indian Capital Markets
16
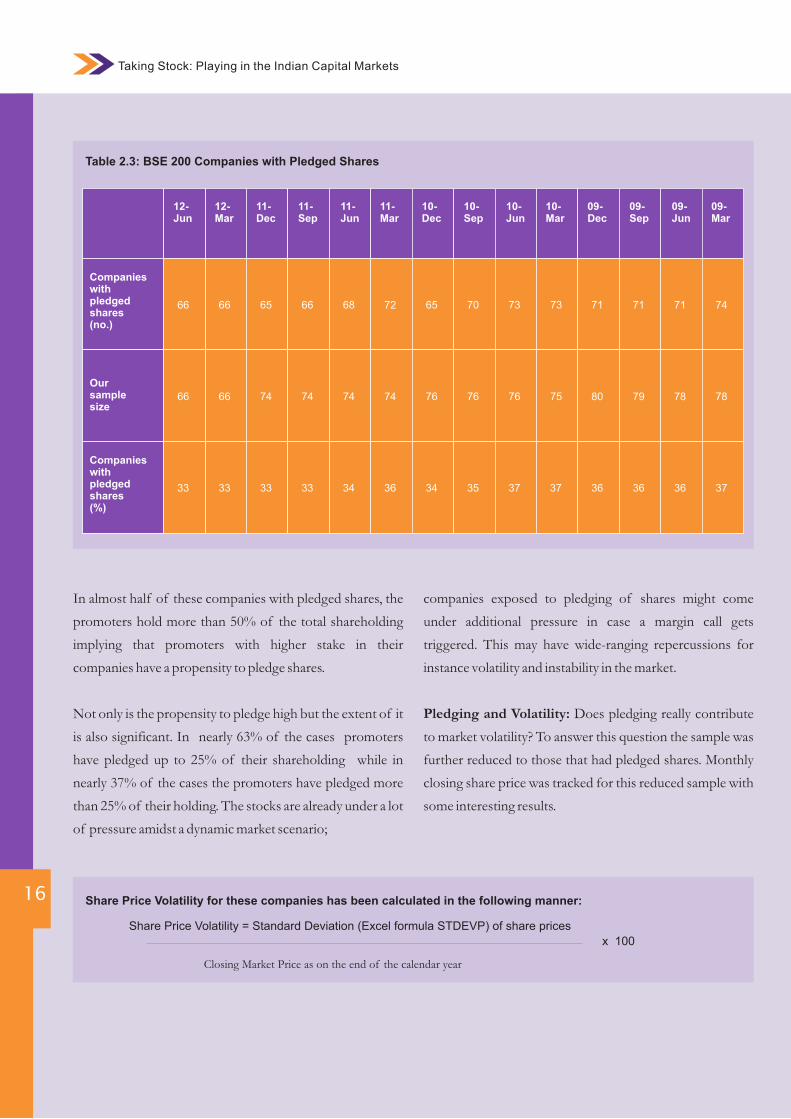
In almost half of these companies with pledged shares, the
promoters hold more than 50% of the total shareholding
implying that promoters with higher stake in their
companies have a propensity to pledge shares.
Not only is the propensity to pledge high but the extent of it
is also significant. In nearly 63% of the cases promoters
have pledged up to 25% of their shareholding while in
nearly 37% of the cases the promoters have pledged more
than 25% of their holding. The stocks are already under a lot
of pressure amidst a dynamic market scenario;
companies exposed to pledging of shares might come
under additional pressure in case a margin call gets
triggered. This may have wide-ranging repercussions for
instance volatility and instability in the market.
Pledging and Volatility: Does pledging really contribute
to market volatility? To answer this question the sample was
further reduced to those that had pledged shares. Monthly
closing share price was tracked for this reduced sample with
some interesting results.
Table 2.3: BSE 200 Companies with Pledged Shares
Companies with pledged shares (%)
11-Sep
11-Jun
11-Mar
10-Dec
10-Sep
10-Jun
10-Mar
09-Dec
09-Sep
09-Jun
09-Mar
66 68 72 65 70 73 73 71 71 71 74
33 34 36 34 35 37 37 36 36 36 37
Share Price Volatility for these companies has been calculated in the following manner:
Share Price Volatility = Standard Deviation (Excel formula STDEVP) of share prices
Closing Market Price as on the end of the calendar year
x 100
11-Dec
Companies with pledged shares (no.)
65
33
12-Mar
66
33
12-Jun
66
33
Our sample size
74 74 74 76 76 76 75 80 79 78 78746666
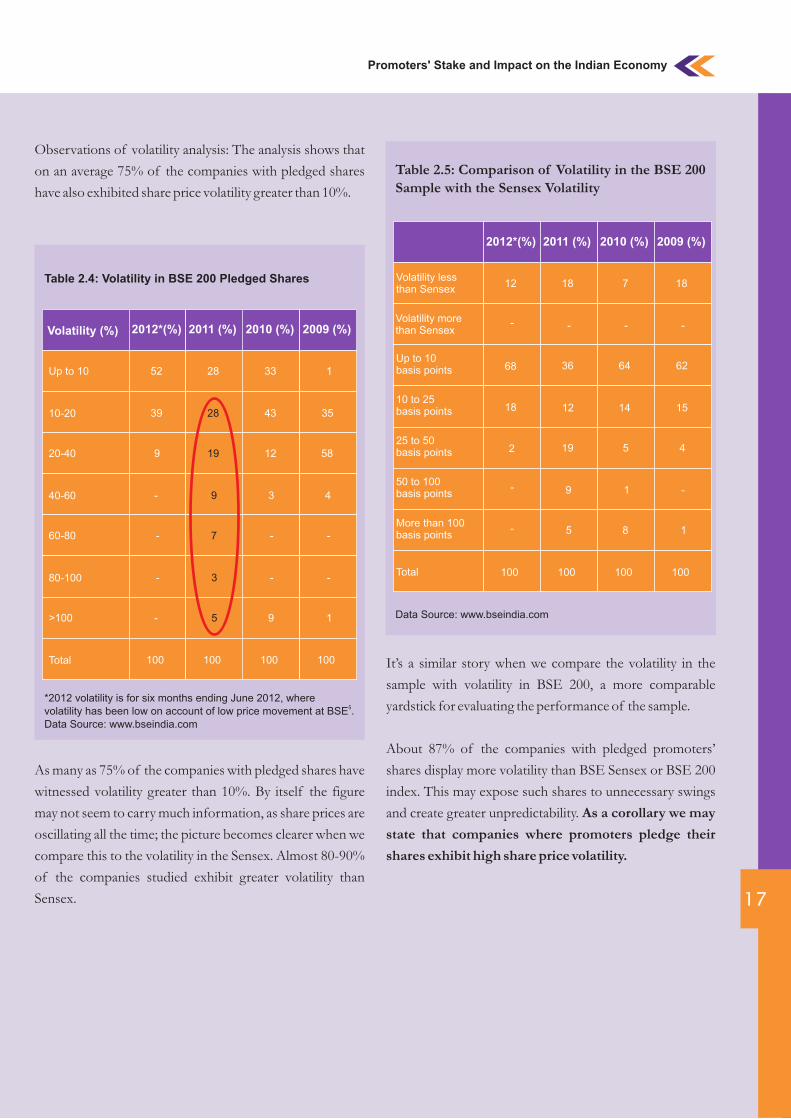
It’s a similar story when we compare the volatility in the
sample with volatility in BSE 200, a more comparable
yardstick for evaluating the performance of the sample.
About 87% of the companies with pledged promoters’
shares display more volatility than BSE Sensex or BSE 200
index. This may expose such shares to unnecessary swings
and create greater unpredictability. As a corollary we may
state that companies where promoters pledge their
shares exhibit high share price volatility.
17
Observations of volatility analysis: The analysis shows that
on an average 75% of the companies with pledged shares
have also exhibited share price volatility greater than 10%.
As many as 75% of the companies with pledged shares have
witnessed volatility greater than 10%. By itself the figure
may not seem to carry much information, as share prices are
oscillating all the time; the picture becomes clearer when we
compare this to the volatility in the Sensex. Almost 80-90%
of the companies studied exhibit greater volatility than
Sensex.
Table 2.5: Comparison of Volatility in the BSE 200 Sample with the Sensex Volatility
Data Source: www.bseindia.com
Promoters' Stake and Impact on the Indian Economy
2011 (%) 2010 (%) 2009 (%)2012*(%)
Table 2.4: Volatility in BSE 200 Pledged Shares
*2012 volatility is for six months ending June 2012, where 5volatility has been low on account of low price movement at BSE .
Data Source: www.bseindia.com
Up to 10
10-20
33 1
43 35
20-40
40-60
12 58
3 4
60-80
80-100
- -
- -
>100 9 1
Total 100 100
28
28
19
9
7
3
5
100
Volatility (%) 2011 (%) 2010 (%) 2009 (%)
52
39
9
-
-
-
-
100
2012*(%)
Volatility less than Sensex
Up to 10 basis points
10 to 25 basis points
25 to 50 basis points
50 to 100 basis points
More than 100 basis points
Total
Volatility more than Sensex
12
68
18
2
-
100
7
-
64
14
5
1
8
100
18
-
62
15
4
-
1
100
18
-
36
12
19
9
5
100
-
-
Taking Stock: Playing in the Indian Capital Markets
18
Volatility in the sample companies and movement in
pledged shares: Volatility in share prices though a
significant indicator may not, after all, be truly connected
with activity in the pledged stock. Companies are required
to file quarterly returns with details of shareholding,
including the closing balances of pledged shares,
separately. If some kind of concomitance is observed
between the pledged shares and overall share price, it
could be an indication of possible manipulation in stock
prices. In order to explore this hypothesis, the sample was
further refined to those which had experienced more than
10% share volatility to see if the movement in price had
any relation with the movement in pledged shares.
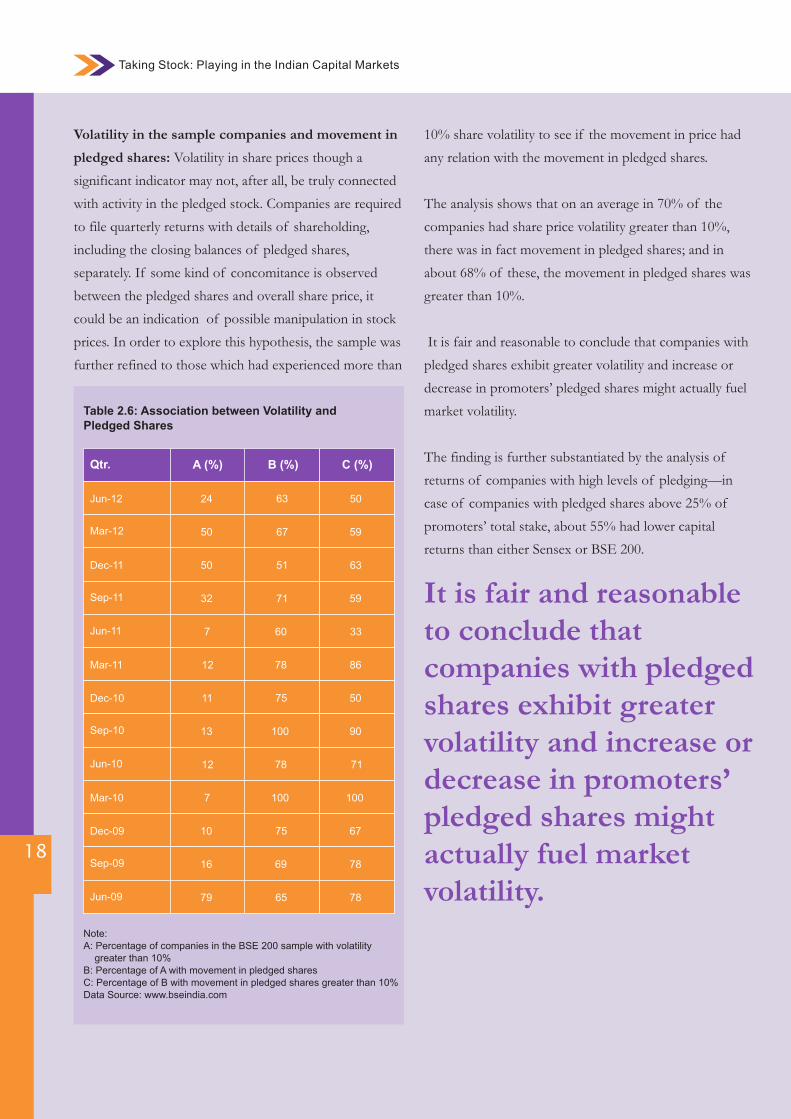
The analysis shows that on an average in 70% of the
companies had share price volatility greater than 10%,
there was in fact movement in pledged shares; and in
about 68% of these, the movement in pledged shares was
greater than 10%.
It is fair and reasonable to conclude that companies with
pledged shares exhibit greater volatility and increase or
decrease in promoters’ pledged shares might actually fuel
market volatility.
The finding is further substantiated by the analysis of
returns of companies with high levels of pledging—in
case of companies with pledged shares above 25% of
promoters’ total stake, about 55% had lower capital
returns than either Sensex or BSE 200.
Table 2.6: Association between Volatility and Pledged Shares
Note: A: Percentage of companies in the BSE 200 sample with volatility greater than 10%B: Percentage of A with movement in pledged sharesC: Percentage of B with movement in pledged shares greater than 10%Data Source: www.bseindia.com
Qtr. B (%) C (%)
Dec-11
Sep-11
Jun-11
Mar-11
51
71
60
78
75
100
78
63
59
33
86
50
90
71
100
75
69
100
67
78
Dec-10
Sep-10
Jun-10
Mar-10
Dec-09
Sep-09
Jun-09 65 78
A (%)
50
32
7
12
11
13
12
7
10
16
79
It is fair and reasonable to conclude that companies with pledged shares exhibit greater volatility and increase or decrease in promoters’ pledged shares might actually fuel market volatility.
Jun-12
Mar-12
63
67
50
59
24
50
19
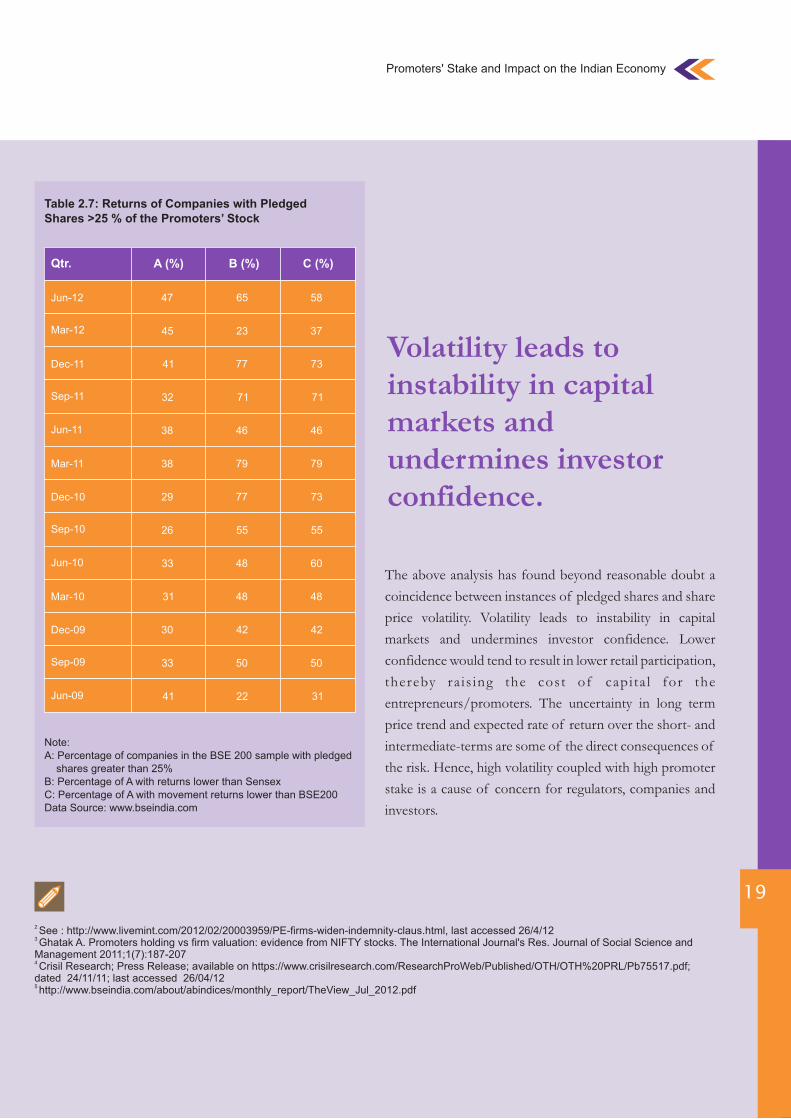
Table 2.7: Returns of Companies with Pledged Shares >25 % of the Promoters’ Stock
Note: A: Percentage of companies in the BSE 200 sample with pledged shares greater than 25%B: Percentage of A with returns lower than SensexC: Percentage of A with movement returns lower than BSE200Data Source: www.bseindia.com
Qtr. B (%) C (%)A (%)
Dec-11
Sep-11
Jun-11
Mar-11
77
71
46
79
77
55
48
73
71
46
79
73
55
60
48
42
50
48
42
50
Dec-10
Sep-10
Jun-10
Mar-10
Dec-09
Sep-09
Jun-09 22 31
41
32
38
38
29
26
33
31
30
33
41
Volatility leads to instability in capital markets and undermines investor confidence.
The above analysis has found beyond reasonable doubt a
coincidence between instances of pledged shares and share
price volatility. Volatility leads to instability in capital
markets and undermines investor confidence. Lower
confidence would tend to result in lower retail participation,
thereby ra is ing the cost of capita l for the
entrepreneurs/promoters. The uncertainty in long term
price trend and expected rate of return over the short- and
intermediate-terms are some of the direct consequences of
the risk. Hence, high volatility coupled with high promoter
stake is a cause of concern for regulators, companies and
investors.
Promoters' Stake and Impact on the Indian Economy
Jun-12
Mar-12
65
23
58
37
47
45
2 See : http://www.livemint.com/2012/02/20003959/PE-firms-widen-indemnity-claus.html, last accessed 26/4/123 Ghatak A. Promoters holding vs firm valuation: evidence from NIFTY stocks. The International Journal's Res. Journal of Social Science and Management 2011;1(7):187-2074 Crisil Research; Press Release; available on https://www.crisilresearch.com/ResearchProWeb/Published/OTH/OTH%20PRL/Pb75517.pdf;dated 24/11/11; last accessed 26/04/125 http://www.bseindia.com/about/abindices/monthly_report/TheView_Jul_2012.pdf
Taking Stock: Playing in the Indian Capital Markets
20
03STUDY OF MEGA ISSUES
Follow on Public Offer (FPO): issue of shares by a
public company that is already listed on an exchange.
An FPO is essentially a stock issue of supplementary
shares made by a company that is already publicly listed
and has gone through the IPO process before this issue.
Rights Issue: a company offers shares to existing
shareholders in proportion to their current
shareholding, on a particular date fixed by the issuer (i.e.
record date). The rights are offered in a particular ratio
to the number of securities held as on the record date.
Private Placement: When an issuer makes an issue of
securities to a select group of persons not exceeding 49,
which is neither a rights issue nor a public issue, it is
called a private placement. Private placement of shares
or convertible securities by listed issuer can be of two
types: Preferential Allotment and Qualified Institutions
Placement.
ADR/GDR/ECB : Apart from raising capital in
domestic market, companies can also issue securities in
international market through ADR/GDR/ECB route
Bonus Issue: When an issuer makes an issue of
securities to its existing shareholders as on a record
date, without any consideration received for such issue,
it is called a bonus issue. The shares are issued out of the
Company’s free reserve or share premium in a
particular ratio to the number of securities held as on
record date.
21
Study of Mega Issues
Overview
India has a fairly well developed security issuance market,
with an established network of intermediaries,
operating in a competitive and regulated environment.
The securities may be issued in the primary or the
secondary market. The issue may be public in nature or
private, in which case it is called a ‘private placement’,
available to a select group of investors.
Types of issues: The major types of issues are as
follows:
Initial Public Offer (IPO): It is the most common
primary mechanism for raising capital. When an
unlisted company makes either a fresh issue of
securities or offers its existing securities for sale or both
for the first time to the public, it is called an IPO.
India has a fairly well developed security issuance market, with an established network of intermediaries, operating in a competitive and regulated environment.
Study of Mega Issues
This paves way for listing and trading of the issuer's
securities in the Stock Exchanges. Thus IPO is the
first sale of stock by a company to the public.
Taking Stock: Playing in the Indian Capital Markets
22
Price Manipulation Pricing of Issues:
Companies have been free to price their equity shares since
1992. However, this price has to be justified in the offer
document or letter of offer. The issuer, in consultation with
the merchant banker, decides the price based on assessment
of the market demand. An issue is classified into Fixed Price
issue and Book Built issue on the basis of pricing. When the
issuer at the outset decides the issue price and mentions it in
the Offer Document, it is commonly known as ‘Fixed Price
issue’. When the price of an issue is discovered on the basis
of demand received from the prospective investors at various
price levels, it is called 'Book Built issue'.
(http://www.sebi.gov.in/faq/pubissuefaq.pdf)
Issue Price Manipulation: In a study of capital markets in the
US, it has been observed that an IPO is priced keeping the
‘Sentiment Investor’ and the possibility of ‘Short Sale’ in mind.
The stock, first issued to institutional investors, is under-priced,
giving them a window to maintain prices by restricting supply.
The offer price is higher than the fundamental price but not 6
aggressive.
A study by Katharina Lewellen, based on NASDAQ data, has
found that immediately following an IPO, underwriters often
repurchase shares of poorly performing offerings in an
apparent attempt to stabilize the price. Some of the key findings
are: (1) Stabilization is substantial, inducing price rigidity at and
below the offer price; (2) There is no evidence that stocks with
larger information asymmetries are stabilized more strongly; (3)
Larger underwriters stabilize more, perhaps to protect their
reputations with investors; (4) Investment banks with retail
brokerage operations stabilize much more than other banks,
inconsistent with the view that stabilization benefits primarily 7institutional investors.
Markus Buttgen examined initial public offerings (IPOs) that
were conducted between 1998 and 2000. He found that they
were manipulated by means of a practice called ‘laddering’
which artificially inflates share prices in the IPO aftermarket.
Laddered IPOs are either underwritten by prestigious
investment banks or venture capital (VC)
backed. Laddering is especially prevalent in the offerings of
young technology or internet companies and is
accompanied by high levels of under pricing and price 8
revision. The process of price discovery in an IPO is
complex and subject to several factors and chances of
manipulation of prices seems to be a global phenomenon.
Share prices may be manipulated at the time of fixing offer
price during an IPO even in connivance with underwriters
or merchant bankers. It can be also done before the shares
are listed by creating artificial buying/ selling pressures by
the brokers on their own discretion or direction by others. In
secondary market prices may be manipulated through
circular trading and synchronised deals. SEBI has advised
Merchant Bankers to disclose the track record of the
performance of the public issues managed by them in the
public offer document, so that investor can take an
informed decision. The track record is required to be
disclosed for a period of three financial years from the date
of listing of each public issue managed by the merchant
banker.
The Price Discovery Process in the Indian Primary
Market
We have examined the primary market issues for five
financial years beginning April 1, 2006 to March 31, 2011 to
analyse the price discovery process in the primary market in 9India .
Methodology: The sample has been restricted to mega
issues only as defined in the annual reports of Securities and
Exchange Board of India, which define mega issues as
issues of size more than Rs 300 crores. The behaviour of
other non-mega issues and their price discovery processes
may vary from the findings. Preliminary evidence indicates
that a period of six to eight months is required for a new
issue to settle into a market-adjusted price, that is, what the
market is actually willing to pay for the stock after the initial
excitement of the issue dies down. Therefore this analysis
looks at the price discovery process of the mega issues and
tracks the capital returns on these issues over a period of
eight months from the end of financial year in which it was
issued.
Further, intra-day movement of the IPOs as well as the
market swings/ downsides have been analysed to assess
whether the issue price can hold its position on and just after
the listing day. For the purpose of the study all mega issues
in the category of IPO/ FPO & Rights issue have been
considered. However, cumulative convertible preference
shares/ debt instruments are excluded from the study
because the pricing of these instruments is based on
different considerations.
Definitions:
1. Share offer price is the price at which shares have
been offered/ allotted to the subscriber.
2. Listing price is the closing price on the date of the
listing of the scrip. In case of rights issue or FPO,
the closing price on the date of opening of issue
has been taken.
3. For the purpose of analysis closing price at the
month end has been considered.
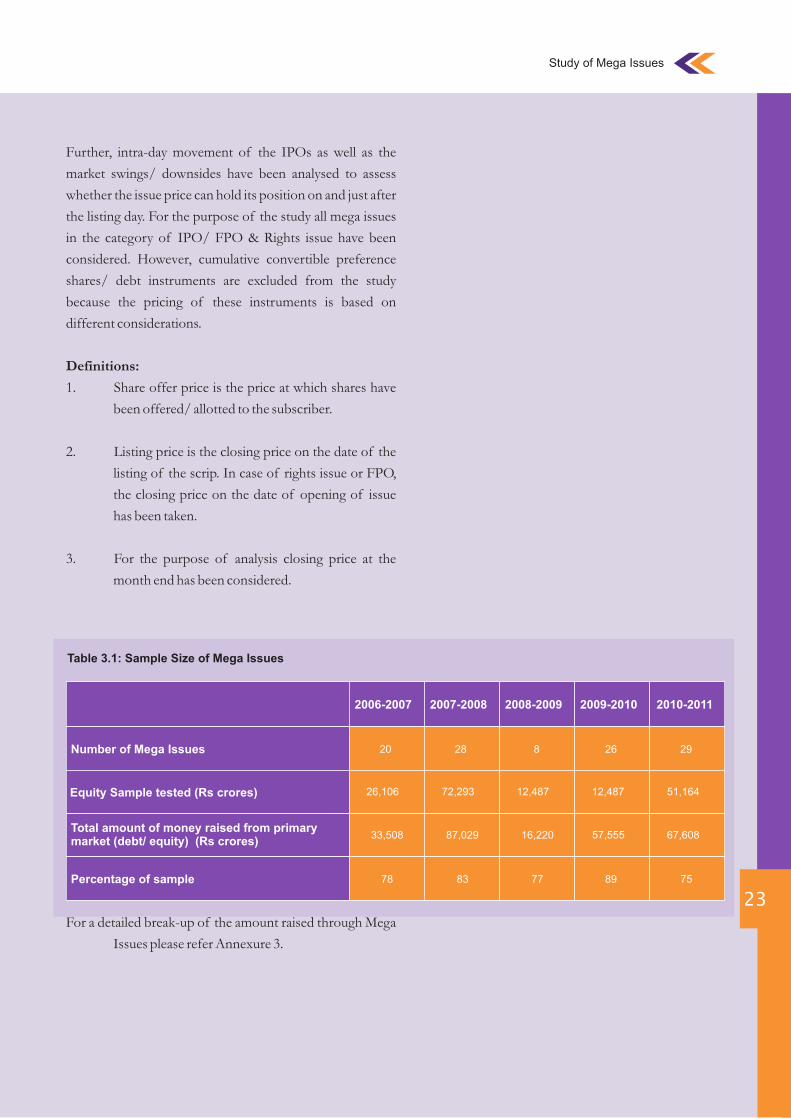
For a detailed break-up of the amount raised through Mega
Issues please refer Annexure 3.
23
Table 3.1: Sample Size of Mega Issues
Number of Mega Issues 17
Equity Sample tested (Rs crores)
Total amount of money raised from primary market (debt/ equity) (Rs crores)
Percentage of sample
44
23
20
2006-2007
20 28 8 26 29
26,106 72,293 12,487
33,508 87,029 16,220 57,555 67,608
78 83 77 89 75
2007-2008 2008-2009 2009-2010 2010-2011
12,487 51,164
Study of Mega Issues
Taking Stock: Playing in the Indian Capital Markets
24
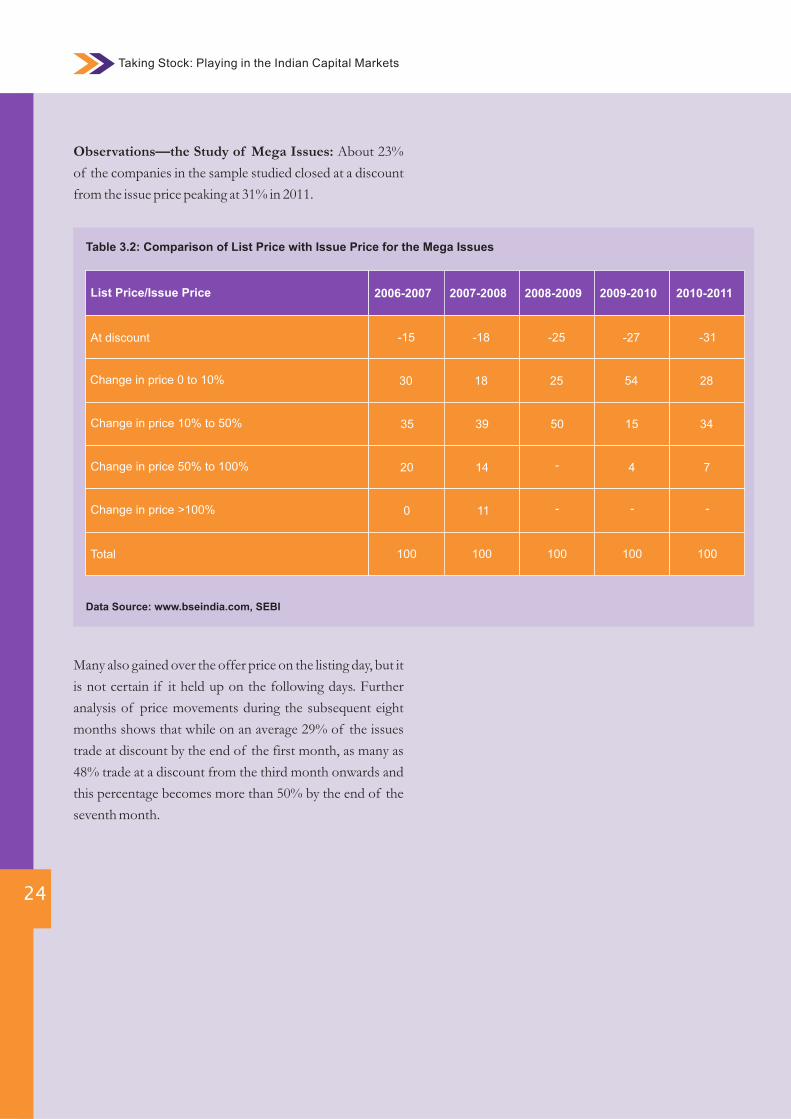
Observations—the Study of Mega Issues: About 23%
of the companies in the sample studied closed at a discount
from the issue price peaking at 31% in 2011.
Many also gained over the offer price on the listing day, but it
is not certain if it held up on the following days. Further
analysis of price movements during the subsequent eight
months shows that while on an average 29% of the issues
trade at discount by the end of the first month, as many as
48% trade at a discount from the third month onwards and
this percentage becomes more than 50% by the end of the
seventh month.
Table 3.2: Comparison of List Price with Issue Price for the Mega Issues
At discount 17
Change in price 0 to 10%
Change in price 10% to 50%
Change in price 50% to 100%
44
23
20
2006-2007
-15 -18 -25 -27 -31
30 18 25
35 39 50 15 34
20 14 - 4 7
2007-2008 2008-2009 2009-2010 2010-2011
54 28
List Price/Issue Price
Data Source: www.bseindia.com, SEBI
Change in price >100%
Total
0 11 - - -
100 100 100 100 100
25
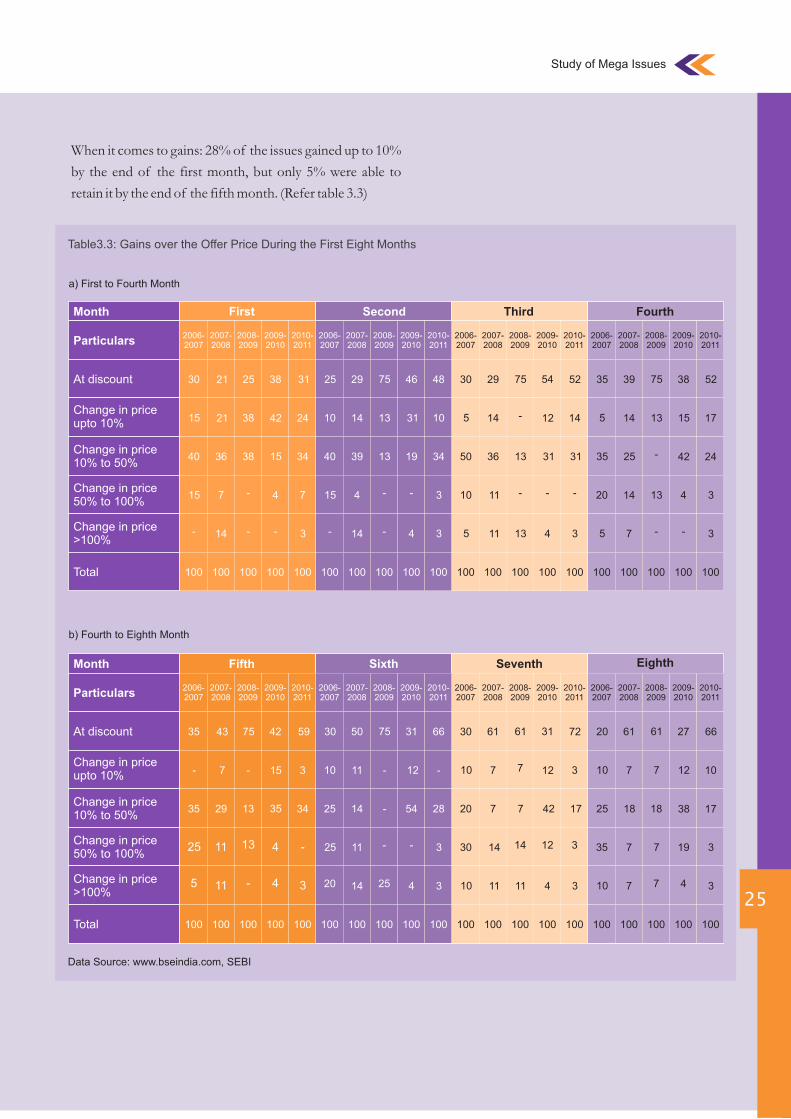
When it comes to gains: 28% of the issues gained up to 10%
by the end of the first month, but only 5% were able to
retain it by the end of the fifth month. (Refer table 3.3)
Table3.3: Gains over the Offer Price During the First Eight Months
a) First to Fourth Month
At discount
Change in price upto 10%
Change in price 10% to 50%
Month
Change in price >100%
Total
Change in price 50% to 100%
Particulars
First Second Third Fourth
100 100 100 100 100 100 100 100 100 100 100 100 100 100 100
2006-2007
2007-2008
2008-2009
2009-2010
2010-2011
2006-2007
2006-2007
2007-2008
2007-2008
2008-2009
2008-2009
2009-2010
2009-2010
2010-2011
2010-2011
30
15
40
15
-
21 25 38 31 25 29 75 46 48 35 39 75 38 52
21 38 42 24 10 14 13 31 10 5 14 13 15 17
36 38 15 34 40 39 13 19 34 35 25 - 42 24
7 - 4 7 15 4 - - 3 20 14 13 4 3
14 - - 3 - 14 - 4 3
100 100 100 100 100
2006-2007
2007-2008
2008-2009
2009-2010
2010-2011
30 29 75 54 52
5 14 - 12 14
50 36 13 31 31
10 11 - - -
5 11 13 4 3 5 7 - - 3
Data Source: www.bseindia.com, SEBI
b) Fourth to Eighth Month
At discount
Change in price upto 10%
Change in price 10% to 50%
Month
Change in price >100%
Total
Change in price 50% to 100%
Particulars
Fifth Sixth Seventh Eighth
100 100 100 100 100 100 100 100 100 100 100 100 100 100 100 100 100 100 100 100
2006-2007
2007-2008
2008-2009
2009-2010
2010-2011
2006-2007
2006-2007
2006-2007
2007-2008
2007-2008
2007-2008
2008-2009
2008-2009
2008-2009
2009-2010
2009-2010
2009-2010
2010-2011
2010-2011
2010-2011
35
-
35
25
5
43 75 42 59 30 50 75 31 66 30 61 61 31 72 20 61 61 27 66
7 - 15 3 10 11 - 12 - 10 7 7 12 3 10 7 7 12 10
29 13 35 34 25 14 - 54 28 20 7 7 42 17 25 18 18 38 17
11 13 4 - 25 11 - - 3 30 14 14 12 3 35 7 7 19 3
11 - 4 3 20 14 25 4 3 10 11 11 4 3 10 7 7 4 3
Study of Mega Issues
Taking Stock: Playing in the Indian Capital Markets
26
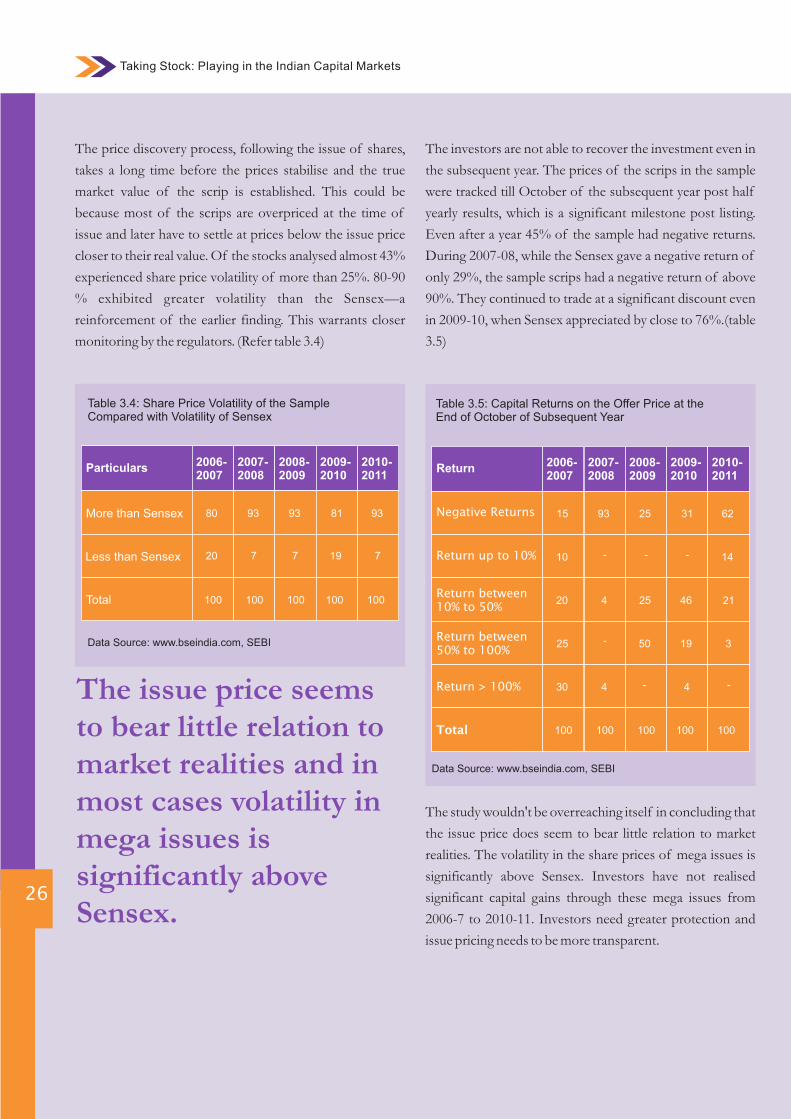
The price discovery process, following the issue of shares,
takes a long time before the prices stabilise and the true
market value of the scrip is established. This could be
because most of the scrips are overpriced at the time of
issue and later have to settle at prices below the issue price
closer to their real value. Of the stocks analysed almost 43%
experienced share price volatility of more than 25%. 80-90
% exhibited greater volatility than the Sensex—a
reinforcement of the earlier finding. This warrants closer
monitoring by the regulators. (Refer table 3.4)
Table 3.4: Share Price Volatility of the Sample Compared with Volatility of Sensex
More than Sensex 17
Less than Sensex
Total
44
23
2006-2007
80 93 93 81 93
20 7 7
100 100 100 100 100
2007-2008
2008-2009
2009-2010
2010-2011
19 7
Particulars
Data Source: www.bseindia.com, SEBI
The issue price seems to bear little relation to market realities and in most cases volatility in mega issues is significantly above Sensex.
The investors are not able to recover the investment even in
the subsequent year. The prices of the scrips in the sample
were tracked till October of the subsequent year post half
yearly results, which is a significant milestone post listing.
Even after a year 45% of the sample had negative returns.
During 2007-08, while the Sensex gave a negative return of
only 29%, the sample scrips had a negative return of above
90%. They continued to trade at a significant discount even
in 2009-10, when Sensex appreciated by close to 76%.(table
3.5)
The study wouldn't be overreaching itself in concluding that
the issue price does seem to bear little relation to market
realities. The volatility in the share prices of mega issues is
significantly above Sensex. Investors have not realised
significant capital gains through these mega issues from
2006-7 to 2010-11. Investors need greater protection and
issue pricing needs to be more transparent.
Table 3.5: Capital Returns on the Offer Price at the End of October of Subsequent Year
Negative Returns 17
Return up to 10% 44
2006-2007
15 93 25 31 62
10 - -
2007-2008
2008-2009
2009-2010
2010-2011
- 14
Return
Data Source: www.bseindia.com, SEBI
Return between 10% to 50%
17
Return between 50% to 100%
44
20 4 25 46 21
25 - 50 19 3
Return > 100% 4430 4 - 4 -
Total 100 100 100 100 100
27
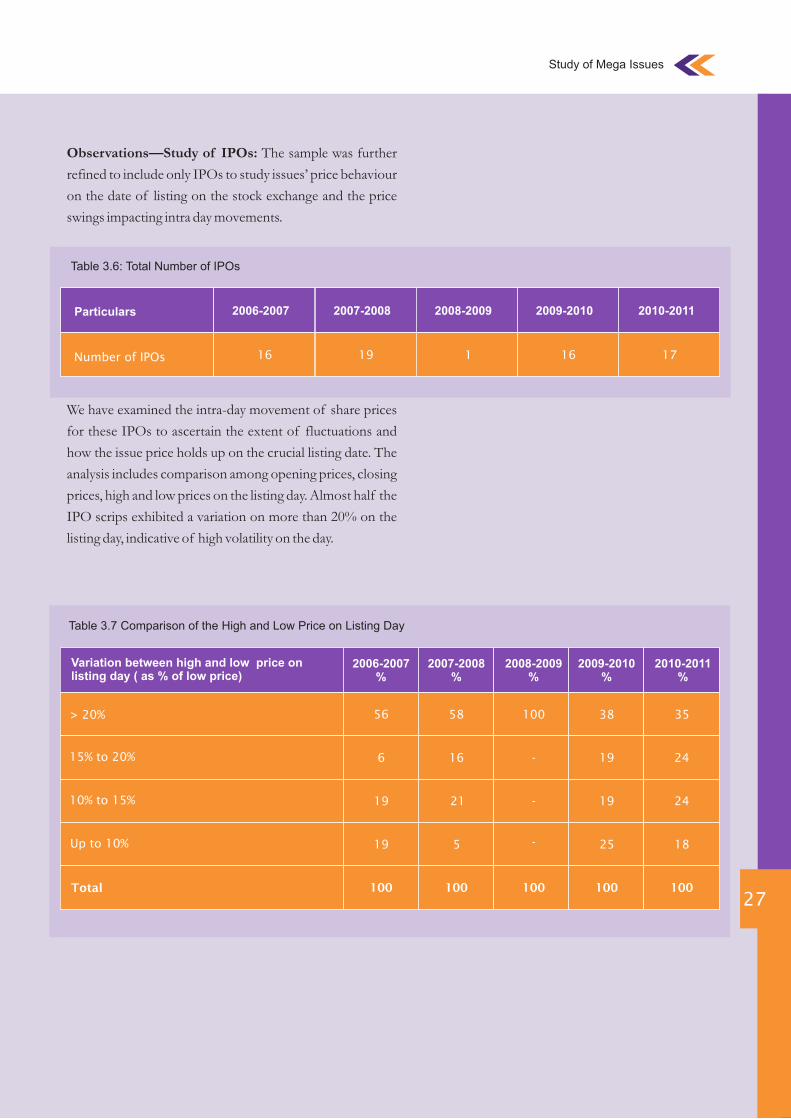
Observations—Study of IPOs: The sample was further
refined to include only IPOs to study issues’ price behaviour
on the date of listing on the stock exchange and the price
swings impacting intra day movements.
We have examined the intra-day movement of share prices
for these IPOs to ascertain the extent of fluctuations and
how the issue price holds up on the crucial listing date. The
analysis includes comparison among opening prices, closing
prices, high and low prices on the listing day. Almost half the
IPO scrips exhibited a variation on more than 20% on the
listing day, indicative of high volatility on the day.
Table 3.6: Total Number of IPOs
Table 3.7 Comparison of the High and Low Price on Listing Day
> 20% 17
15% to 20%
10% to 15%
Up to 10%
44
23
20
2006-2007%
56 58 100 38 35
6 16 -
19 21 - 19 24
19 5 - 25 18
2007-2008%
2008-2009%
2009-2010%
2010-2011%
19 24
Variation between high and low price on listing day ( as % of low price)
Total 100 100 100 100 100
Particulars
Number of IPOs 16 19 1 16 17
2006-2007 2007-2008 2008-2009 2009-2010 2010-2011
Study of Mega Issues
Taking Stock: Playing in the Indian Capital Markets
28
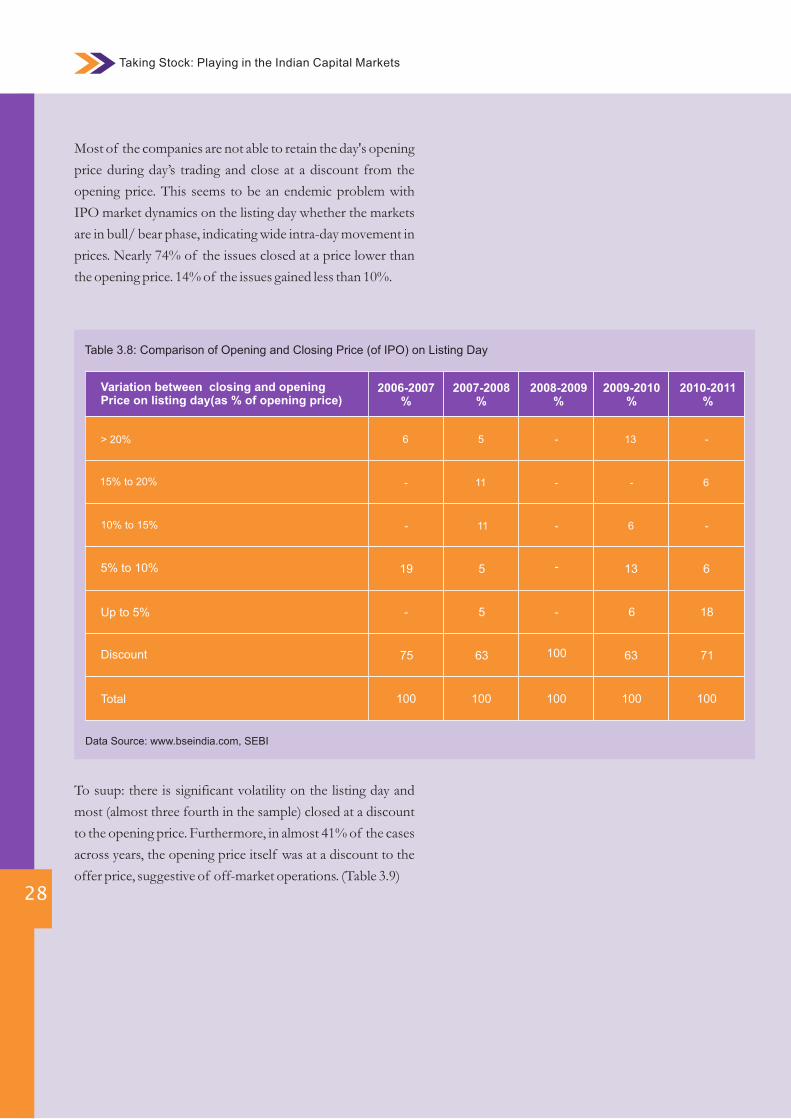
Most of the companies are not able to retain the day's opening
price during day’s trading and close at a discount from the
opening price. This seems to be an endemic problem with
IPO market dynamics on the listing day whether the markets
are in bull/ bear phase, indicating wide intra-day movement in
prices. Nearly 74% of the issues closed at a price lower than
the opening price. 14% of the issues gained less than 10%.
To suup: there is significant volatility on the listing day and
most (almost three fourth in the sample) closed at a discount
to the opening price. Furthermore, in almost 41% of the cases
across years, the opening price itself was at a discount to the
offer price, suggestive of off-market operations. (Table 3.9)
Table 3.8: Comparison of Opening and Closing Price (of IPO) on Listing Day
> 20% 17
15% to 20%
10% to 15%
5% to 10%
44
23
20
2006-2007%
6 5 - 13 -
- 11 -
- 11 - 6 -
19 5 - 13 6
2007-2008%
2008-2009%
2009-2010%
2010-2011%
- 6
Variation between closing and opening Price on listing day(as % of opening price)
Up to 5% - 5 - 6 18
Discount 2075 63 100 63 71
Total 100 100 100 100 100
Data Source: www.bseindia.com, SEBI
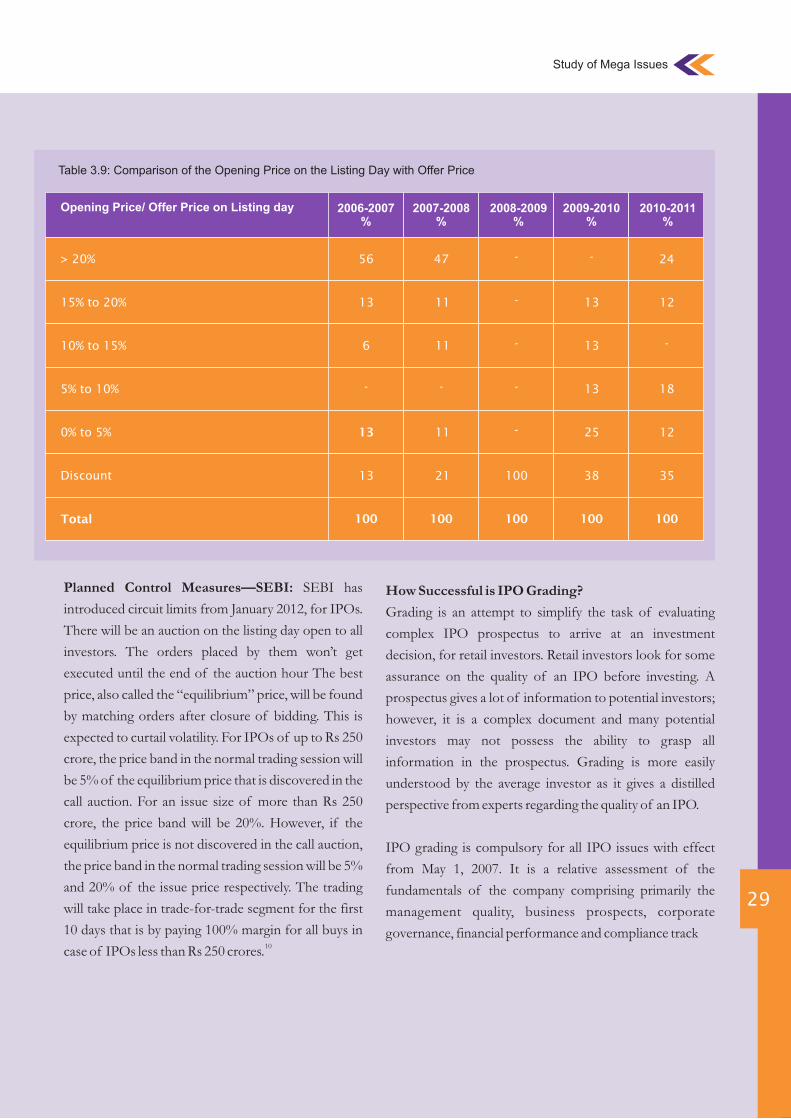
How Successful is IPO Grading?
Grading is an attempt to simplify the task of evaluating
complex IPO prospectus to arrive at an investment
decision, for retail investors. Retail investors look for some
assurance on the quality of an IPO before investing. A
prospectus gives a lot of information to potential investors;
however, it is a complex document and many potential
investors may not possess the ability to grasp all
information in the prospectus. Grading is more easily
understood by the average investor as it gives a distilled
perspective from experts regarding the quality of an IPO.
IPO grading is compulsory for all IPO issues with effect
from May 1, 2007. It is a relative assessment of the
fundamentals of the company comprising primarily the
management quality, business prospects, corporate
governance, financial performance and compliance track
29
Planned Control Measures—SEBI: SEBI has
introduced circuit limits from January 2012, for IPOs.
There will be an auction on the listing day open to all
investors. The orders placed by them won’t get
executed until the end of the auction hour The best
price, also called the “equilibrium” price, will be found
by matching orders after closure of bidding. This is
expected to curtail volatility. For IPOs of up to Rs 250
crore, the price band in the normal trading session will
be 5% of the equilibrium price that is discovered in the
call auction. For an issue size of more than Rs 250
crore, the price band will be 20%. However, if the
equilibrium price is not discovered in the call auction,
the price band in the normal trading session will be 5%
and 20% of the issue price respectively. The trading
will take place in trade-for-trade segment for the first
10 days that is by paying 100% margin for all buys in 10
case of IPOs less than Rs 250 crores.
Table 3.9: Comparison of the Opening Price on the Listing Day with Offer Price
> 20% 17
15% to 20%
10% to 15%
5% to 10%
44
23
20
2006-2007%
56 47 - - 24
13 11 -
6 11 - 13 -
- - - 13 18
2007-2008%
2008-2009%
2009-2010%
2010-2011%
13 12
Opening Price/ Offer Price on Listing day
0% to 5% 13 11 - 25 12
Discount 2013 21 100 38 35
Total 100 100 100 100 100
Study of Mega Issues
Taking Stock: Playing in the Indian Capital Market
30
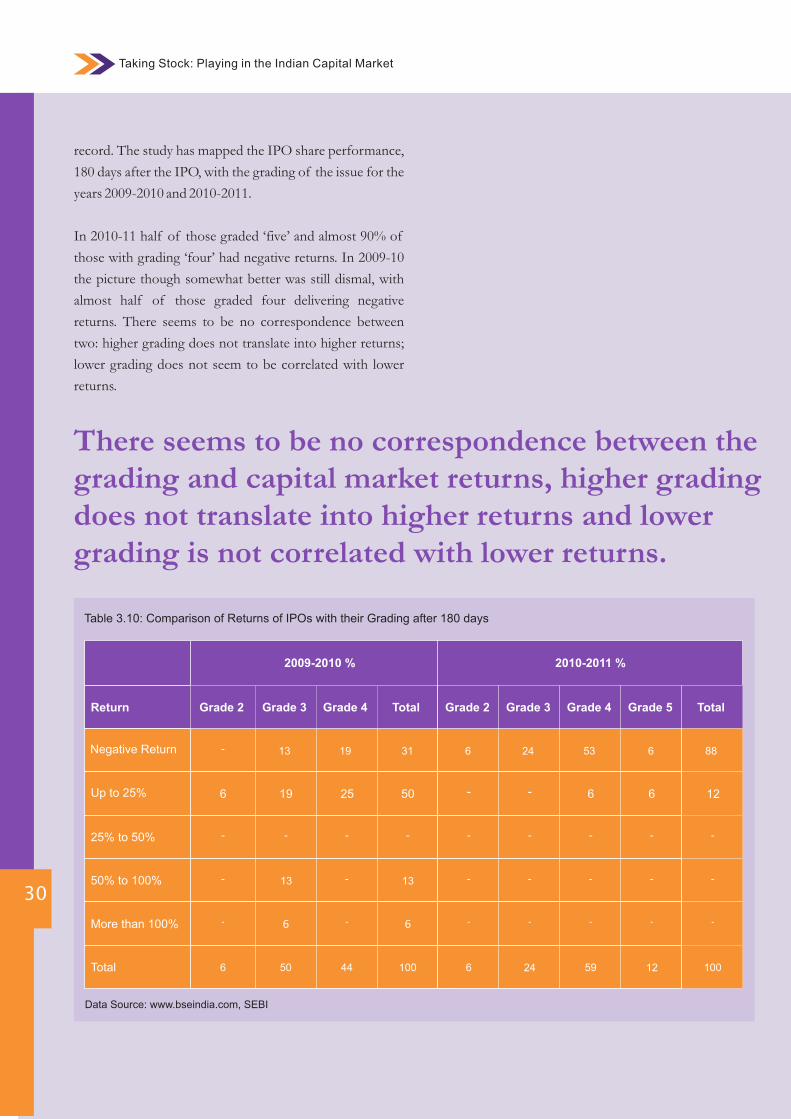
record. The study has mapped the IPO share performance,
180 days after the IPO, with the grading of the issue for the
years 2009-2010 and 2010-2011.
In 2010-11 half of those graded ‘five’ and almost 90% of
those with grading ‘four’ had negative returns. In 2009-10
the picture though somewhat better was still dismal, with
almost half of those graded four delivering negative
returns. There seems to be no correspondence between
two: higher grading does not translate into higher returns;
lower grading does not seem to be correlated with lower
returns.
Table 3.10: Comparison of Returns of IPOs with their Grading after 180 days
Negative Return
Up to 25%
25% to 50%
50% to 100%
More than 100%
Total
Data Source: www.bseindia.com, SEBI
Return
2009-2010 %
-
6
-
-
-
6
Grade 2 Grade 3 Grade 4 Total
2010-2011 %
Grade 2 Grade 3 Grade 4 Grade 5 Total
13
19
-
13
6
50
19
25
-
-
-
44
31
50
-
13
6
100
6
-
-
-
-
6
24
-
-
-
-
24
53
6
-
-
-
59
6
6
-
-
-
12
88
12
-
-
-
100
There seems to be no correspondence between the grading and capital market returns, higher grading does not translate into higher returns and lower grading is not correlated with lower returns.
Therefore grading may not be a good indicator of future
performance of scrip. Indian markets do not seem to have a
robust method of pricing shares or price discovery.
Volatility is high even on the listing day. The offer price does
not seem to bear any relationship with the opening or
closing price on the listing day, for that matter even after an
year of listing.
SEBI Regulation: Securities and Exchange Board of India
(Disclosure and Investor Protection) Guidelines 2000
require that the Merchant Bankers ensure all the
requirements of ‘Disclosure and Investor Protection
Guidelines’ are complied with at the time of submitting the
draft offer documents to SEBI. The promoters of the
company are required to contribute at least 20% of the
equity issue at the time of listing. Merchant Bankers are
required to disclose the price information of past issues
handled by them and the due diligence certificate to the
Board in the prescribed format; to disclose the track record
of the performance of the public issues managed by them
in the public offer document, so that investor can take an
informed decision. Credit Rating Agencies (CRA) have
been advised to follow the requirements, for transparency in
the process, pertaining to rating process, methodology and
its records. CRAs shall have an internal audit on a half yearly
basis conducted by Chartered Accountants, Company
Secretaries or Cost and Management Accountants who are
in practice and who do not have any conflict of interest with
the CRA. The internal audit shall cover all aspects of CRA
operations and procedures, investor grievance redressal
mechanism and compliance with the requirements 11
stipulated as per SEBI.
31
Indian markets do not seem to have a robust method of pricing shares or price discovery. The offer price does not seem to bear any relationship with the opening or closing price on the listing
6 See Ljungqvist, Nov. 2003 , available at http://papers.ssrn.com/sol3/papers.cfm?abstract_id=282293, last accessed 26/4/127 See Lewellen K, Dec. 2003, available at http://papers.ssrn.com/sol3/papers.cfm?abstract_id=479925, last accessed 26/4/128 See ButtgenM.,available at http://arno.unimaas.nl/show.cgi?fid=19356, last accessed 26/4/129SEBI Annual reports have served as a basis of selection of sample size of mega issues for the years 2006 to 2011. Annual report for March 31, 2012 is not available in public domain as on 22nd September 2012. Hence the sample size could not be extended to mega issues of financial year 2011-2012.10 For details please refer to Annexure 211 For detailed circulars please refer Annexure 2
Study of Mega Issues
Taking Stock: Playing in the Indian Capital Markets
32
04INFORMED TRADING
Issue of securities by way of public/right/bonus etc.
Major expansion plans or execution of new projects
Amalgamation, mergers, takeovers and buy back
Disposal of whole or substantial part of the
undertaking
Any changes in plans, policies or operation of the
company
Moreover, for any investments beyond a threshold limit, a
special pre clearance is required and the deal should be
completed within seven days of the clearance. The Third
Party entities in possession of such information due to
their dealings with the organization also need to follow a
“Chinese Wall” policy wherein only authorized officials
can access a demarcated area of sensitive information. For
the purpose of the study, a distinction has been made
between trading by insiders permitted within the
regulations of SEBI, which we call ‘informed trading’ and
trading by persons acting on behalf of insiders, based on
information obtained from them, which is the real ‘insider
trading’. While the former trade is subject to checks and
balances, the latter is more dangerous and difficult to
detect.
The Contrarion View: Insider Trading: Good or Bad?
Insider trading is not necessarily considered harmful to the
health of organization by everyone. A point of view in
support of it has also been developed. Ajay Shah in “Why
forbid insider trading” has argued that insider traders speed
up the flow of information and forecasts into prices via 12
trading in securities markets, making them more efficient.
It contends that insider trading helps bring prices closer to
their fair value. The state should simply focus on enhancing
efficiency by imposing a reporting requirement. Trades by
insiders are informative and promote market efficiency. In
an paper titled, “The Insider: Parasite or Legitimate Profit-
Maker?, Mark Miller” claims
33
Informed Trading
Definition and Background
Insider trading is the buying, selling or dealing in securities
of a listed company by a promoter, director, member of
management , employee of the company, or by any other
person such as internal auditor, advisor , consultant, analyst
etc, who is privy to certain inside information relating to the
company not available in the public domain to general
public. It is legal as long as adequate disclosures as required
by laws have been made and no undue profits have been
made by the insiders that could not have been made by a
person with similar knowledge. Insider trading has been one
of the prime concerns of SEBI in the recent years. It can
create lopsided advantage for those with access to privileged
information. Insider trading arrests the smooth running /
operation of the securities market and its healthy growth
and development. It leads to loss of investors' confidence.
Securities and Exchange Board of India (Prohibition of
Insider Trading) Regulations, 1992, does not directly define
the term “insider trading”. However it defines the terms
insider, connected person and price sensitive information.
Since any undue advantage to be derived from it is based on
inequity of information, SEBI regulation focuses on
removing this disparity. SEBI's moral code of conduct lays
down certain trading restrictions on all directors, officers
and designated employees. Designated employees are
officers comprising the top three tiers of the company’s
management or the employees designated by the company
to whom the restrictions shall be applicable. They are
eligible to deal in securities only during a trading period
known as “Trading windows” and this window shall be
closed at certain crucial times such as :-
Declaration of financial results
Declaration of dividends
Informed Trading
Taking Stock: Playing in the Indian Capital Markets
34
that the negative effects of insider trading has been
exaggerated.
He elaborates that the arguments in favour of insider
trading laws ignore the issue of use of information. Even if
everyone has equal access to information, there is no
guarantee that they will all use this information in the same
way. Information must be analysed and different people
have different opinions on what the best analysis of stock-
related information is. The possession of inside
information by itself is not as valuable as it appears to be at
first. Investors who are too busy to read the financial section
of the newspaper or to follow the latest information about
the companies they invest in voluntarily allow information
inequality to exist. Since so much inequality of information
exists even when the government attempts to narrow the
knowledge gap, equal access to information is a utopian
goal.
By contrast, if an insider acts before the general public, the
stock will still eventually reach the same price it would if
there were no insiders trading in the stock. In other words,
insider-trading laws are a way to ensure that gains from stock
news are distributed equitably. A country with no insider
trading laws, however, will only punish insider trading when
there is a specific aggrieved party who is the victim of fraud
or a breach of contract. The rest of the insider transactions
that take place improve market efficiency by bringing prices
closer to the price that would prevail under perfect
information. He suggests that if India were to abolish its
insider trading laws, it would improve the efficiency of its 13financial markets.
The Study and Methodology
The study analyses the insider trading instances disclosed to
BSE. Such declaration is updated periodically by BSE. The
study examines the data as on December12, 2011.
The analysis pertains to BSE 200 index covering volatility,
daily turnover, price discovery and the intra-day movement
of such shares, in the following periods:
Movements in preceding period (15 days before the date
of transaction)
Movements in post transaction period (15 days after the
date of transaction)
Movements in normal period (30 days before the
beginning of preceding period)
In case the first date or last date of the relevant period is a stock
exchange holiday, the closest preceding trading day has been
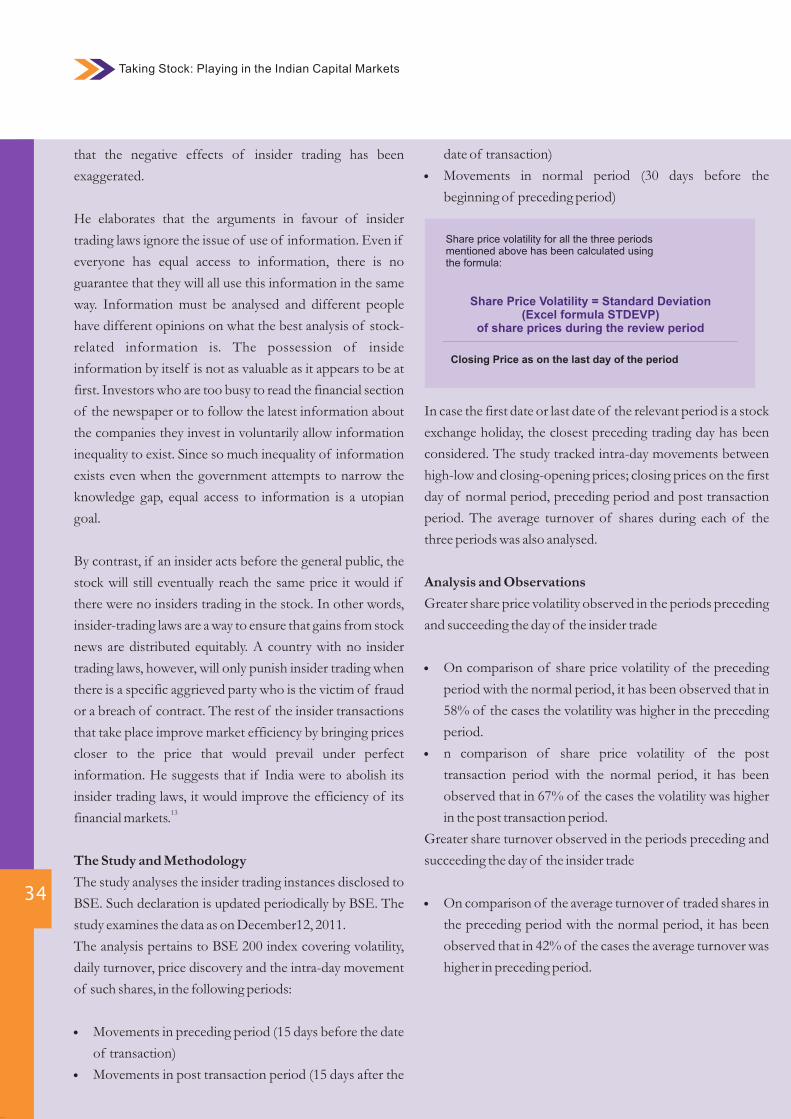
considered. The study tracked intra-day movements between
high-low and closing-opening prices; closing prices on the first
day of normal period, preceding period and post transaction
period. The average turnover of shares during each of the
three periods was also analysed.
Analysis and Observations
Greater share price volatility observed in the periods preceding
and succeeding the day of the insider trade
On comparison of share price volatility of the preceding
period with the normal period, it has been observed that in
58% of the cases the volatility was higher in the preceding
period.
n comparison of share price volatility of the post
transaction period with the normal period, it has been
observed that in 67% of the cases the volatility was higher
in the post transaction period.
Greater share turnover observed in the periods preceding and
succeeding the day of the insider trade
On comparison of the average turnover of traded shares in
the preceding period with the normal period, it has been
observed that in 42% of the cases the average turnover was
higher in preceding period.
Share price volatility for all the three periods mentioned above has been calculated using the formula:
Share Price Volatility = Standard Deviation (Excel formula STDEVP)
of share prices during the review period
Closing Price as on the last day of the period
Informed trading transactions do seem to fuel share price
volitality in a band of fifteen days both before and after the
transaction day; when compared to the period before it,
volatility is more prominent in post transaction period. This
may indicate that investors other than promoters follow the
cue of the promoters and mimic their actions.
The prices on the date of transaction are generally lower
than the preceding and normal period. The market prices
might have been manipulated to get the best deal for the
informed investor.
Informed trading is allowed by the regulator provided
adequate and timely disclosures are made to bring about
informational efficiency. However, it may impair an
unprejudiced price discovery process and stimulate
volatility. The disclosure norms must be linked with
underlying events leading to such informed transactions
and made public. The reasons for the informed trade, such
as increasing stake, combating takeover risks, offloading the
stake or any other cause also needs to be disclosed.
35
On comparison of the average turnover of the
number of traded shares in the post transaction
period with the normal period, it has been
observed that in 42% of the cases the average
turnover was higher in post transaction period.
5 -10 % intraday swing observed in the price of the
share on the day of the insider trade
On the day of transaction, intraday swing between
the high and low price as a percentage of low price
was less than 5% in 73% of the cases and between
5% to 10% in 27% of the cases.
On the day of transaction, intraday movement
between closing and opening price as percentage
of the opening price was to 5% in 55% of the cases
and for balance 45% cases the closing price was
lower than opening price.
Fall in price of the share observed on the day of the
insider trade
On comparing closing price on the transaction
date with the closing price of first day of the
preceding period: in 82% of the cases price on the
transaction date was lower.
On comparing closing price on the transaction
date with the closing price of last day of the post
transaction period: in 70% of the cases post
transaction period price was higher.
On comparing closing price on the transaction
date with the closing price of first day of the
normal period in 82% of the cases price on the
transaction date was lower.
Conclusion
12 http://www.mayin.org/ajayshah/MEDIA/1998/insider.html13 http://ccsindia.org/ccsindia/policy/money/studies/wp0029.pdf)
Informed trading though allowed by the regulator provided adequate and timely disclosures are made can impair an unprejudiced price discovery process and stimulate volatility
Informed Trading
Taking Stock: Playing in the Indian Capital Markets
05SEBI MARKET REGULATION
36
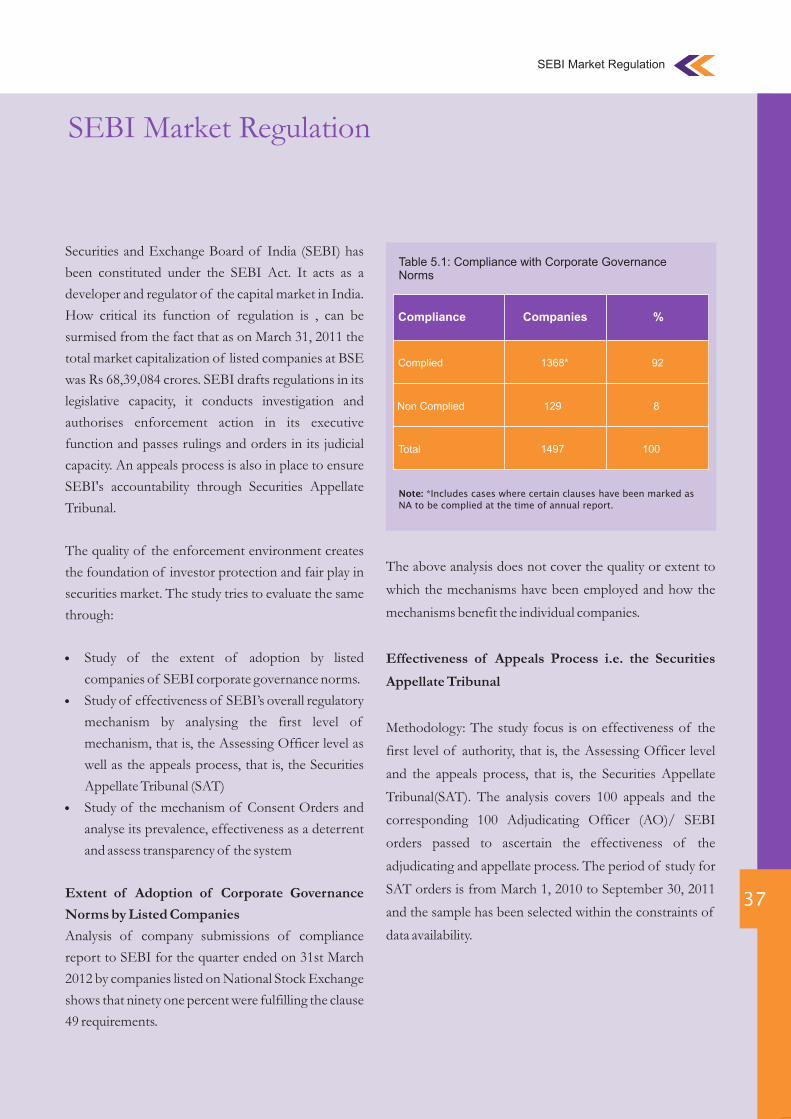
The above analysis does not cover the quality or extent to
which the mechanisms have been employed and how the
mechanisms benefit the individual companies.
Effectiveness of Appeals Process i.e. the Securities
Appellate Tribunal
Methodology: The study focus is on effectiveness of the
first level of authority, that is, the Assessing Officer level
and the appeals process, that is, the Securities Appellate
Tribunal(SAT). The analysis covers 100 appeals and the
corresponding 100 Adjudicating Officer (AO)/ SEBI
orders passed to ascertain the effectiveness of the
adjudicating and appellate process. The period of study for
SAT orders is from March 1, 2010 to September 30, 2011
and the sample has been selected within the constraints of
data availability.
37
SEBI Market Regulation
Securities and Exchange Board of India (SEBI) has
been constituted under the SEBI Act. It acts as a
developer and regulator of the capital market in India.
How critical its function of regulation is , can be
surmised from the fact that as on March 31, 2011 the
total market capitalization of listed companies at BSE
was Rs 68,39,084 crores. SEBI drafts regulations in its
legislative capacity, it conducts investigation and
authorises enforcement action in its executive
function and passes rulings and orders in its judicial
capacity. An appeals process is also in place to ensure
SEBI's accountability through Securities Appellate
Tribunal.
The quality of the enforcement environment creates
the foundation of investor protection and fair play in
securities market. The study tries to evaluate the same
through:
Study of the extent of adoption by listed
companies of SEBI corporate governance norms.
Study of effectiveness of SEBI’s overall regulatory
mechanism by analysing the first level of
mechanism, that is, the Assessing Officer level as
well as the appeals process, that is, the Securities
Appellate Tribunal (SAT)
Study of the mechanism of Consent Orders and
analyse its prevalence, effectiveness as a deterrent
and assess transparency of the system
Extent of Adoption of Corporate Governance
Norms by Listed Companies
Analysis of company submissions of compliance
report to SEBI for the quarter ended on 31st March
2012 by companies listed on National Stock Exchange
shows that ninety one percent were fulfilling the clause
49 requirements.
Table 5.1: Compliance with Corporate Governance Norms
Note: *Includes cases where certain clauses have been marked as
NA to be complied at the time of annual report.
Complied
Non Complied
Compliance
Total
1368*
129
Companies
1497
92
8
%
100
SEBI Market Regulation
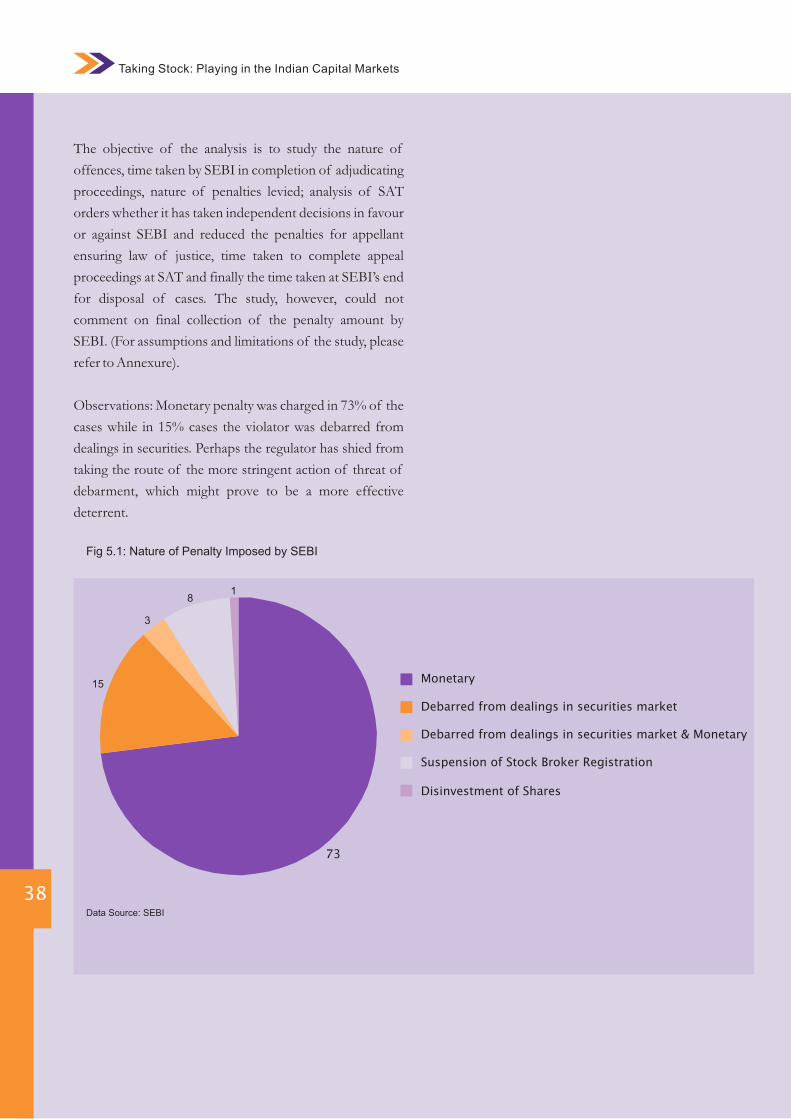
Taking Stock: Playing in the Indian Capital Markets
38
The objective of the analysis is to study the nature of
offences, time taken by SEBI in completion of adjudicating
proceedings, nature of penalties levied; analysis of SAT
orders whether it has taken independent decisions in favour
or against SEBI and reduced the penalties for appellant
ensuring law of justice, time taken to complete appeal
proceedings at SAT and finally the time taken at SEBI’s end
for disposal of cases. The study, however, could not
comment on final collection of the penalty amount by
SEBI. (For assumptions and limitations of the study, please
refer to Annexure).
Observations: Monetary penalty was charged in 73% of the
cases while in 15% cases the violator was debarred from
dealings in securities. Perhaps the regulator has shied from
taking the route of the more stringent action of threat of
debarment, which might prove to be a more effective
deterrent.
Fig 5.1: Nature of Penalty Imposed by SEBI
Data Source: SEBI
73
15
3
18
Monetary
Debarred from dealings in securities market
Debarred from dealings in securities market & Monetary
Suspension of Stock Broker Registration
Disinvestment of Shares
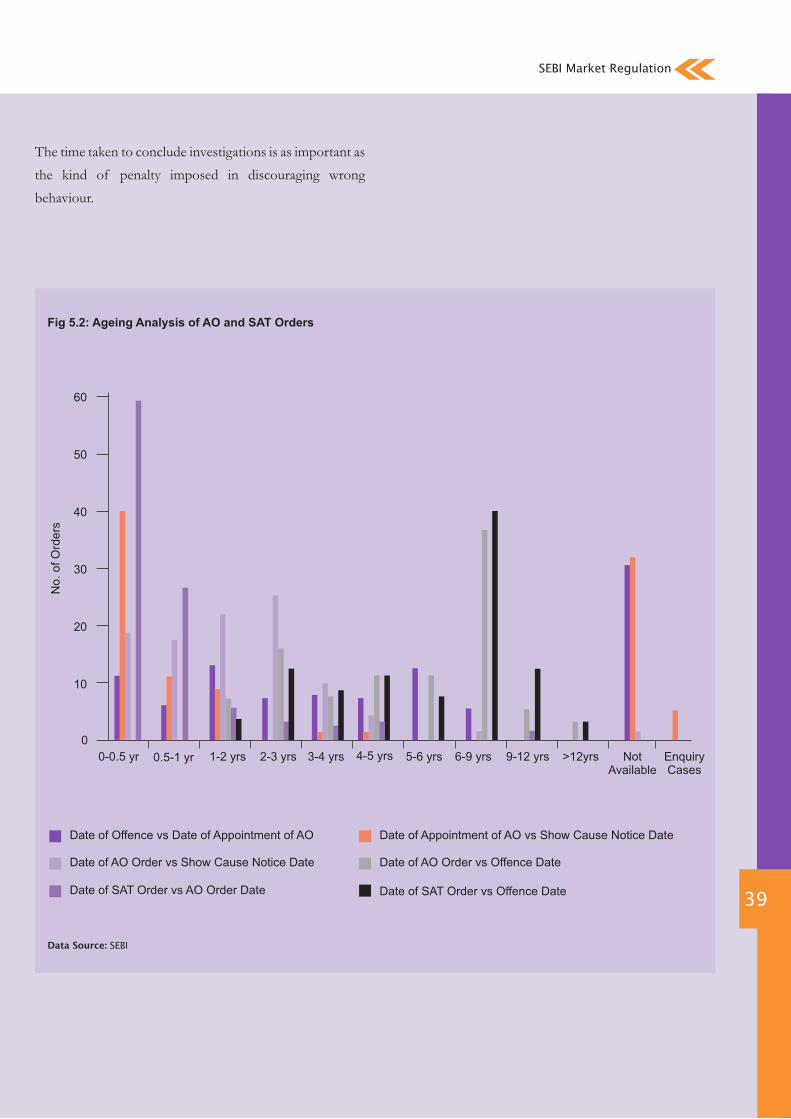
39
The time taken to conclude investigations is as important as
the kind of penalty imposed in discouraging wrong
behaviour.
Fig 5.2: Ageing Analysis of AO and SAT Orders
Data Source: SEBI
Date of Offence vs Date of Appointment of AO Date of Appointment of AO vs Show Cause Notice Date
Date of AO Order vs Show Cause Notice Date
Date of SAT Order vs AO Order Date Date of SAT Order vs Offence Date
No.
of
Ord
ers
Date of AO Order vs Offence Date
0-0.5 yr 0.5-1 yr
0
10
20
30
40
50
60
1-2 yrs 2-3 yrs 3-4 yrs 4-5 yrs 5-6 yrs 6-9 yrs 9-12 yrs NotAvailable
EnquiryCases
>12yrs
SEBI Market Regulation
Taking Stock: Playing in the Indian Capital Markets
40
Conclusion
I. Time taken to initiate action: In 25% cases the AO has
been appointed within a year. However in 35% of the
cases it took more than 4 years for SEBI to appoint an
AO. That is, there is a delay of as long as 4 years to initiate
punitive action from the time of violation. This may
result in loss of evidence and reduce chances of bringing
the violation to book.
ii. Time taken to initiate proceedings: In 65% cases the
show cause notice was issued within 6 months, whereas in
32% cases it took more than 6 months to issue the same.
In 4% cases the show cause notice was issued after 36
months. There is no prescribed standard time within
which the AO is required to issue a show cause notice,
which leaves room for discretion.
iii. Time taken to complete the enquiry process: In
37% of the cases the proceedings have been completed
in one year. However in 40% cases it took more than 2
years to complete proceedings. Such long periods carry
the risk of destruction of circumstantial evidence or
the defaulter becoming untraceable and increasing
investor losses.
iv. Time taken to punish the offence: In 25% cases the
AO/SEBI order is passed within 3 years whereas in 56%
cases it took more than 5 years to pass an order. The time
taken is too long to provide any kind of effective
deterrence to serve as an example.
v. Time taken by SAT to complete appellate
proceedings: In 59% of the cases SAT proceedings
have been completed within 6 months. This shows
efficiency in disposal of cases by SAT which, however, is
an appellant authority and not a primary court of enquiry.
vi. Time lag between date of offence and final SAT
order: A comparison of the date of SAT order with date
of offence to ascertain the time lag between the time of
non-compliance and the final indictment after first leg of
appeal process is complete reveals it takes more than 5
years in 64% of the cases from the time of offence to
the time of disposal of appeal at SAT with 16% in
more than 9 years bracket.
The appeals process seems to be slow and also often
arbitrary and opaque. The framework is as per the best
practices of justice and fair play; implementation seems to
be a problem. The entire process of enquiry, adjudication,
trial, decision and appeal needs streamlining, with clear
and reasonable timeline to be strictly enforced, if SEBI is
to perform its role as a gatekeeper.
Analysis of Consent Orders and their Effectiveness
Normal litigation in courts in India is known for its
involved proceedings and huge backlog. Often
alternatives have been established to expedite a particular
class of cases. The Consent Order is one such initiative.
According to the SEBI guidelines of April 2007, a
consent order means "an order settling administrative or
civil proceedings between the regulator and a
person/party who may prima facie be found to have
violated securities laws. It may settle all issues or reserve
an issue or claim, but it must precisely state what issues or
claims are being reserved. A consent order may or may
not include a determination that a violation has
occurred.”
Consent order allows compounding of offence whereby
an accused pays compounding charges in lieu of
undergoing consequences of prosecution. Consent
orders serve as an alternative to litigation, lengthy
proceedings and consequent delays. Consent Orders can
be passed in respect of all types of enforcement or
remedial actions including administrative proceedings
and civil actions. Any person who is notified that a
proceeding will be initiated/instituted against him/her, or
any party to a proceeding already initiated/instituted, may,
at any time, propose in writing for settlement. Consent
orders are aimed to reduce the regulatory cost, time and
effort spent on pursuing enforcement actions.
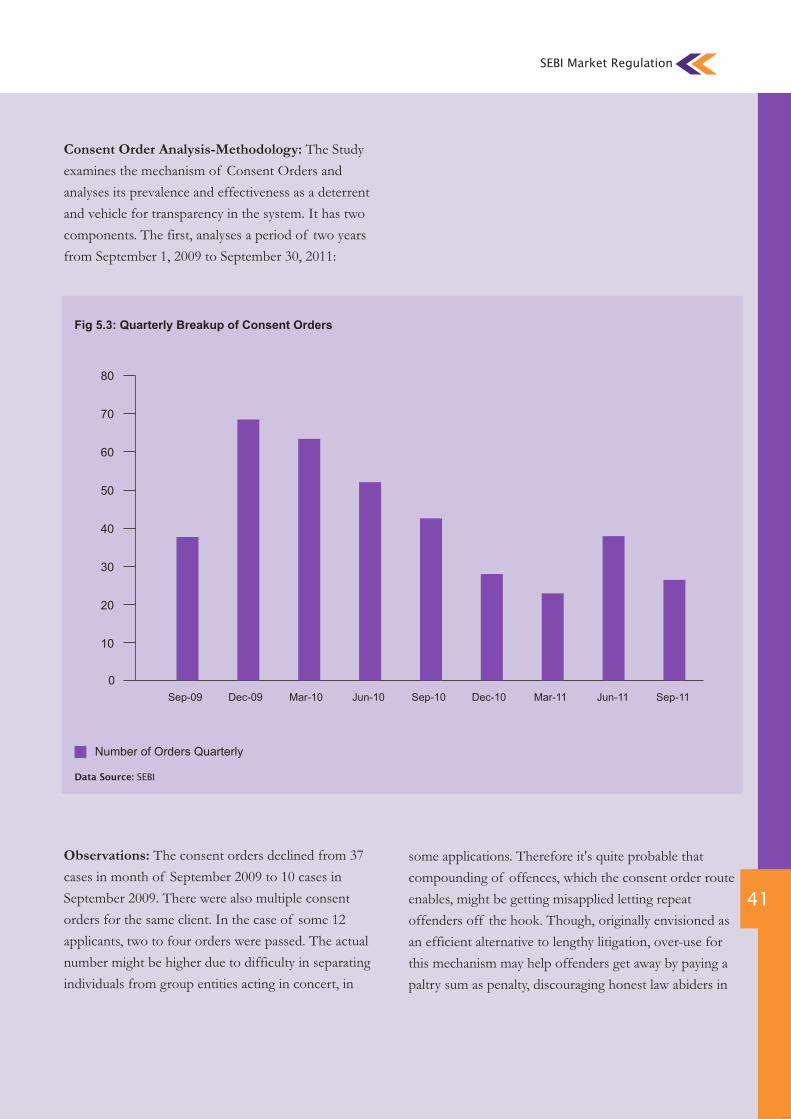
some applications. Therefore it's quite probable that
compounding of offences, which the consent order route
enables, might be getting misapplied letting repeat
offenders off the hook. Though, originally envisioned as
an efficient alternative to lengthy litigation, over-use for
this mechanism may help offenders get away by paying a
paltry sum as penalty, discouraging honest law abiders in
41
Consent Order Analysis-Methodology: The Study
examines the mechanism of Consent Orders and
analyses its prevalence and effectiveness as a deterrent
and vehicle for transparency in the system. It has two
components. The first, analyses a period of two years
from September 1, 2009 to September 30, 2011:
Observations: The consent orders declined from 37
cases in month of September 2009 to 10 cases in
September 2009. There were also multiple consent
orders for the same client. In the case of some 12
applicants, two to four orders were passed. The actual
number might be higher due to difficulty in separating
individuals from group entities acting in concert, in
Fig 5.3: Quarterly Breakup of Consent Orders
Data Source: SEBI
Number of Orders Quarterly
Sep-09 Dec-09 Mar-10 Jun-10 Sep-10 Dec-10 Mar-11 Jun-11 Sep-11
0
10
20
30
40
50
60
70
80
SEBI Market Regulation
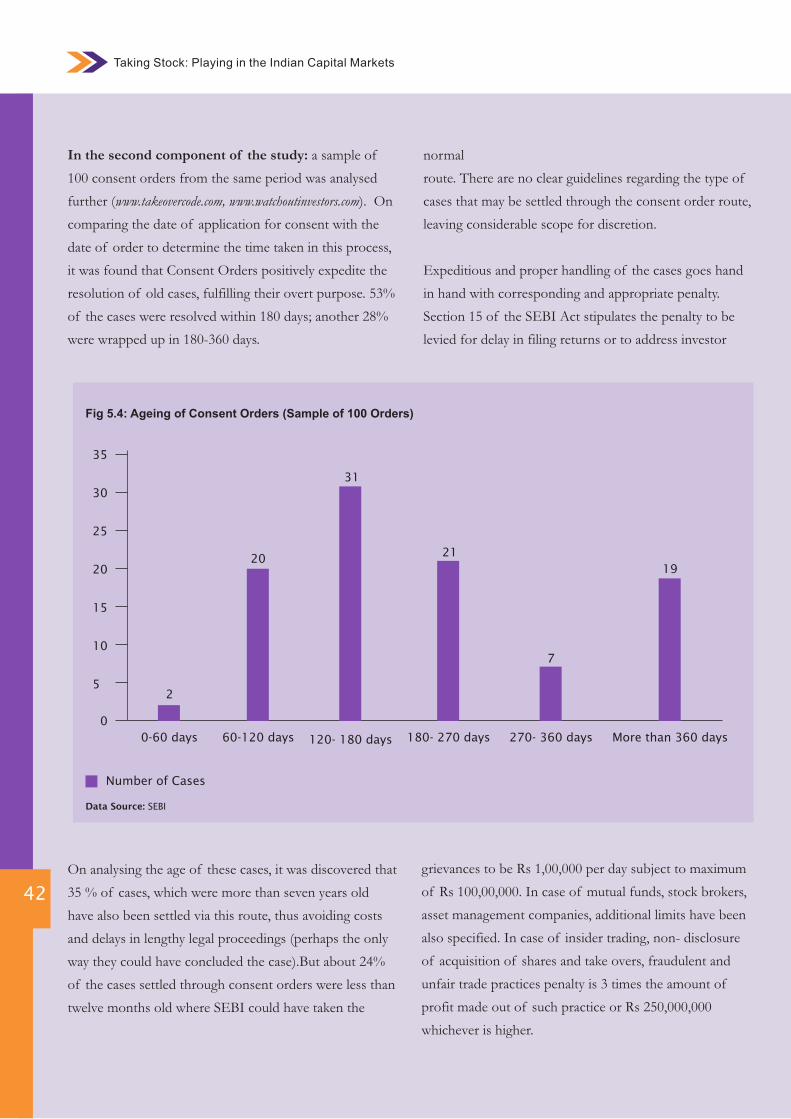
Taking Stock: Playing in the Indian Capital Markets
42
In the second component of the study: a sample of
100 consent orders from the same period was analysed
further (www.takeovercode.com, www.watchoutinvestors.com). On
comparing the date of application for consent with the
date of order to determine the time taken in this process,
it was found that Consent Orders positively expedite the
resolution of old cases, fulfilling their overt purpose. 53%
of the cases were resolved within 180 days; another 28%
were wrapped up in 180-360 days.
On analysing the age of these cases, it was discovered that
35 % of cases, which were more than seven years old
have also been settled via this route, thus avoiding costs
and delays in lengthy legal proceedings (perhaps the only
way they could have concluded the case).But about 24%
of the cases settled through consent orders were less than
twelve months old where SEBI could have taken the
normal
route. There are no clear guidelines regarding the type of
cases that may be settled through the consent order route,
leaving considerable scope for discretion.
Expeditious and proper handling of the cases goes hand
in hand with corresponding and appropriate penalty.
Section 15 of the SEBI Act stipulates the penalty to be
levied for delay in filing returns or to address investor
Fig 5.4: Ageing of Consent Orders (Sample of 100 Orders)
Data Source: SEBI
Number of Cases
0-60 days 60-120 days 120- 180 days 180- 270 days 270- 360 days More than 360 days
0
5
10
15
20
25
30
35
2
20
31
21
7
19
grievances to be Rs 1,00,000 per day subject to maximum
of Rs 100,00,000. In case of mutual funds, stock brokers,
asset management companies, additional limits have been
also specified. In case of insider trading, non- disclosure
of acquisition of shares and take overs, fraudulent and
unfair trade practices penalty is 3 times the amount of
profit made out of such practice or Rs 250,000,000
whichever is higher.
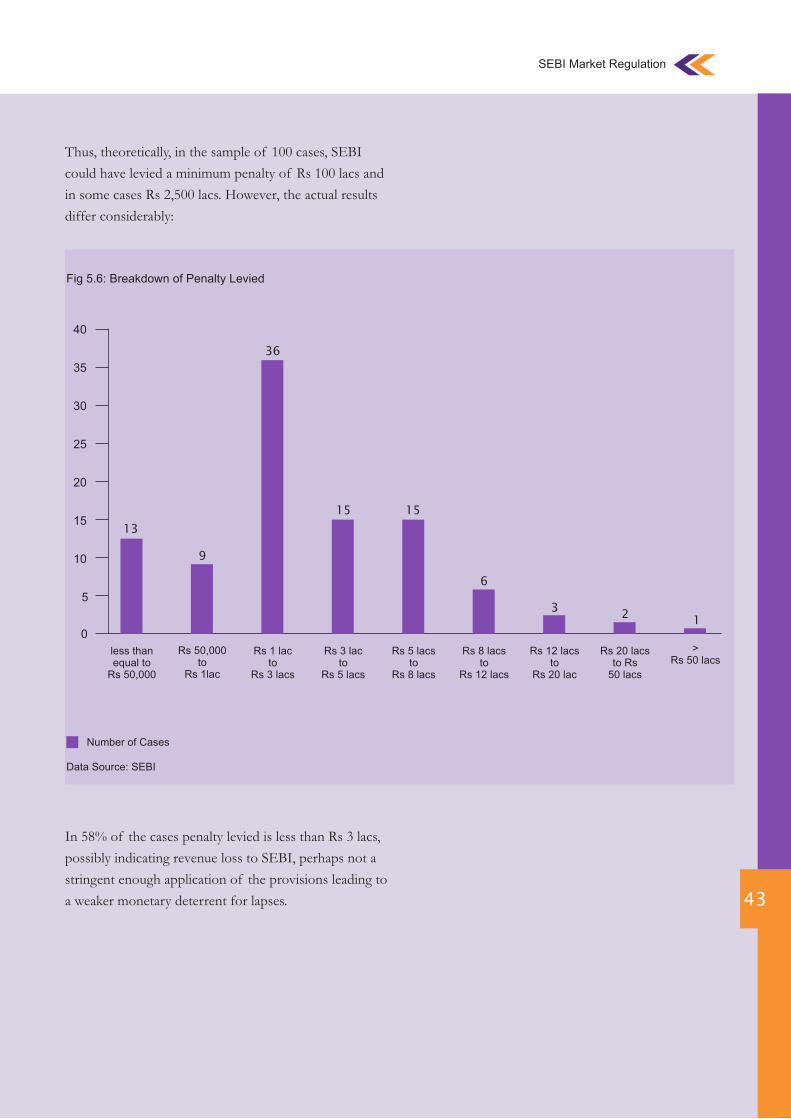
Thus, theoretically, in the sample of 100 cases, SEBI could
have levied a minimum penalty of Rs 100 lacs and in some
cases Rs 2,500 lacs. However, the actual results differ
considerably:
In 58% of the cases penalty levied is less than Rs 3 lacs,
possibly indicating revenue loss to SEBI, perhaps not a
stringent enough application of the provisions leading to a
weaker monetary deterrent for lapses.
43
Fig 5.6: Breakdown of Penalty Levied
less thanequal to
Rs 50,000
Thus, theoretically, in the sample of 100 cases, SEBI
could have levied a minimum penalty of Rs 100 lacs and
in some cases Rs 2,500 lacs. However, the actual results
differ considerably:
In 58% of the cases penalty levied is less than Rs 3 lacs,
possibly indicating revenue loss to SEBI, perhaps not a
stringent enough application of the provisions leading to
a weaker monetary deterrent for lapses.
Rs 50,000to
Rs 1lac
Rs 1 lac to
Rs 3 lacs
Rs 3 lac to
Rs 5 lacs
Rs 5 lacs to
Rs 8 lacs
Rs 8 lacs to
Rs 12 lacs
Rs 12 lacs to
Rs 20 lac
Rs 20 lacs to Rs
50 lacs
> Rs 50 lacs
0
5
10
15
20
25
30
35
40
Data Source: SEBI
Number of Cases
13
9
36
15 15
6
32
1
SEBI Market Regulation
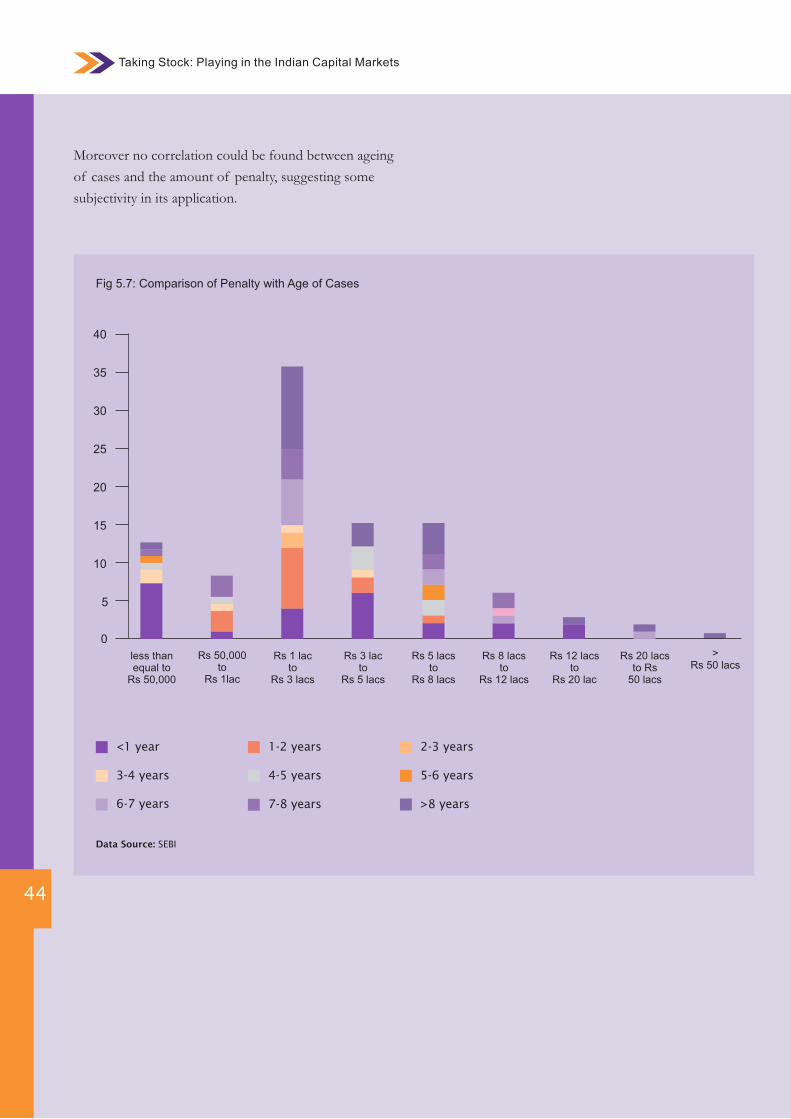
Taking Stock: Playing in the Indian Capital Markets
44
Moreover no correlation could be found between ageing
of cases and the amount of penalty, suggesting some
subjectivity in its application.
Fig 5.7: Comparison of Penalty with Age of Cases
less thanequal to
Rs 50,000
Rs 50,000to
Rs 1lac
Rs 1 lac to
Rs 3 lacs
Rs 3 lac to
Rs 5 lacs
Rs 5 lacs to
Rs 8 lacs
Rs 8 lacs to
Rs 12 lacs
Rs 12 lacs to
Rs 20 lac
Rs 20 lacs to Rs
50 lacs
> Rs 50 lacs
15
20
25
30
35
40
Data Source: SEBI
<1 year 1-2 years 2-3 years
3-4 years
6-7 years
4-5 years
7-8 years
5-6 years
>8 years
0
5
10
were disposed of by SEBI: out of these, 9% of the
cases pertain to 2004-2005 (more than 6 years old),
while 41% of the disposed cases are 3-5 years old. Only
18% of the cases pertain to 2010-2011.
The system of Consent Orders while efficient in terms
of settling long pending cases also seems opaque in
terms of: amount of penalty levied, timelines involved
in settling of cases, criterion for accepting applications
from repeat offenders etc. This calls for greater
transparency and clearer guidelines so that the system
builds confidence among all constituents.
45
Although SEBI is a young institution it has been fairly
successful in fulfilling its mandate as the capital market
regulator, ensuring deepening of markets and increasing
participation of investors. However the enforcement
process tends to be somewhat arbitrary and rather opaque 14
and leaves scope for discretion in the hands of officials.
The system of enforcement is also slow as these statistics
show: as per Annual Report of SEBI for 2010-2011 (pp
110-112) there are 3,493 pending cases as on March 31,
2011. On analysis of these cases we find that as many as
32% of the pending cases have an ageing of 6 or more
years, while 28% of the cases have been pending for 3 to
5 years. During the year 2010-11, a total of 1801 cases
SEBI Market Regulation
14 There have been amendments to the consent order process vide SEBI's circular dated May 25, 2012, for details please refer to Annexure II.
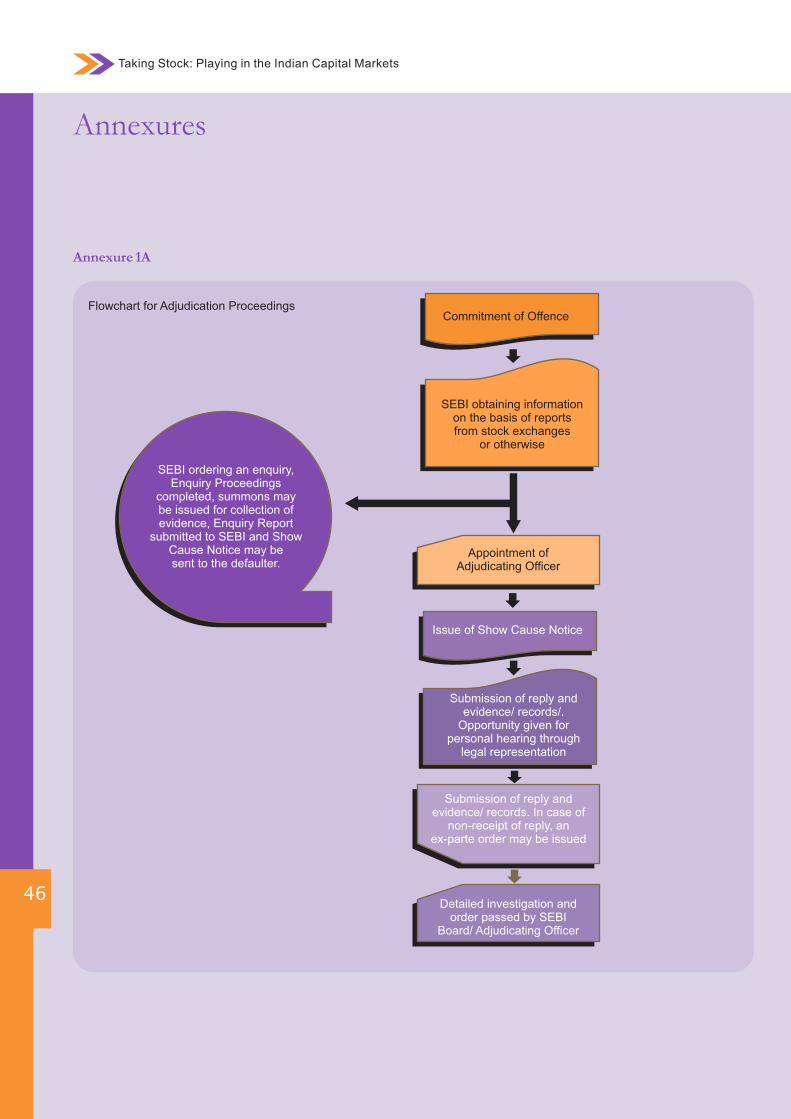
Annexures
Taking Stock: Playing in the Indian Capital Markets
46
Annexure 1A
Flowchart for Adjudication Proceedings
SEBI ordering an enquiry, Enquiry Proceedings
completed, summons may be issued for collection of evidence, Enquiry Report
submitted to SEBI and Show Cause Notice may be sent to the defaulter.
Submission of reply and evidence/ records. In case of
non-receipt of reply, an ex-parte order may be issued
Detailed investigation and order passed by SEBI
Board/ Adjudicating Officer
Submission of reply and evidence/ records/.
Opportunity given for personal hearing through
legal representation
Issue of Show Cause Notice
Appointment of Adjudicating Officer
Commitment of Offence
SEBI obtaining information on the basis of reports from stock exchanges
or otherwise
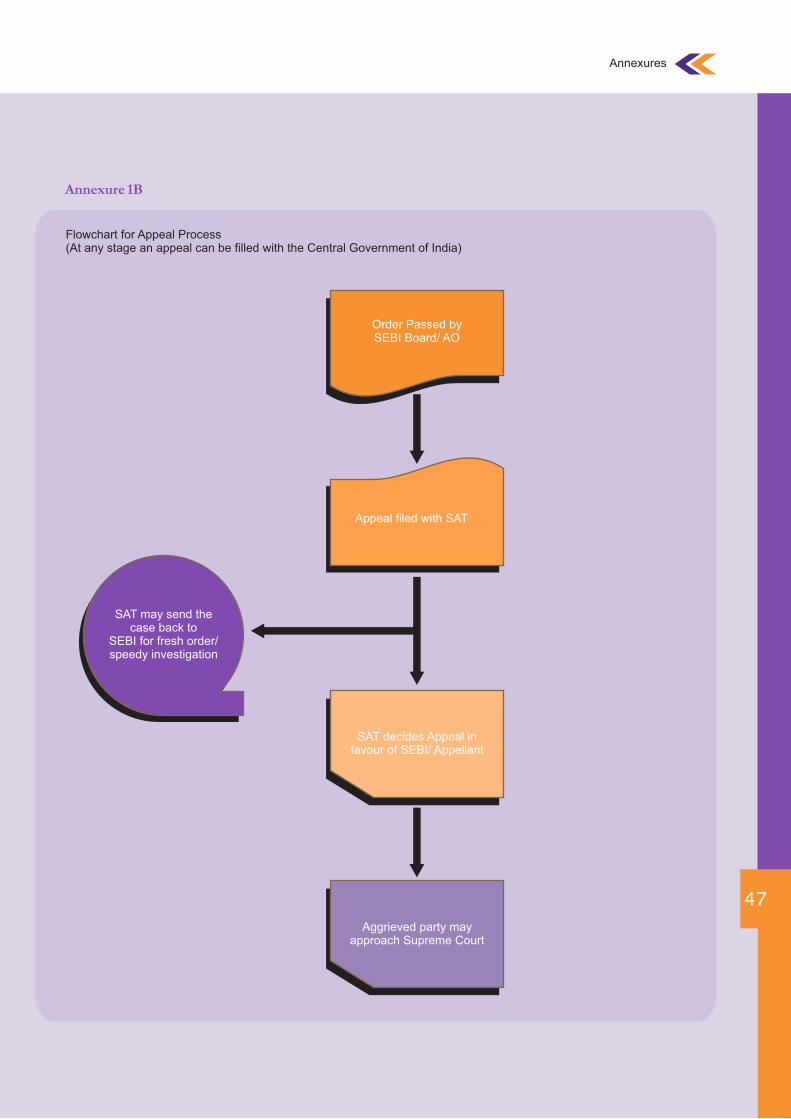
Annexures
Flowchart for Appeal Process(At any stage an appeal can be filled with the Central Government of India)
Order Passed by SEBI Board/ AO
Appeal filed with SAT
SAT decides Appeal in favour of SEBI/ Appellant
47
Aggrieved party may approach Supreme Court
SAT may send the case back to
SEBI for fresh order/ speedy investigation
Annexure 1B
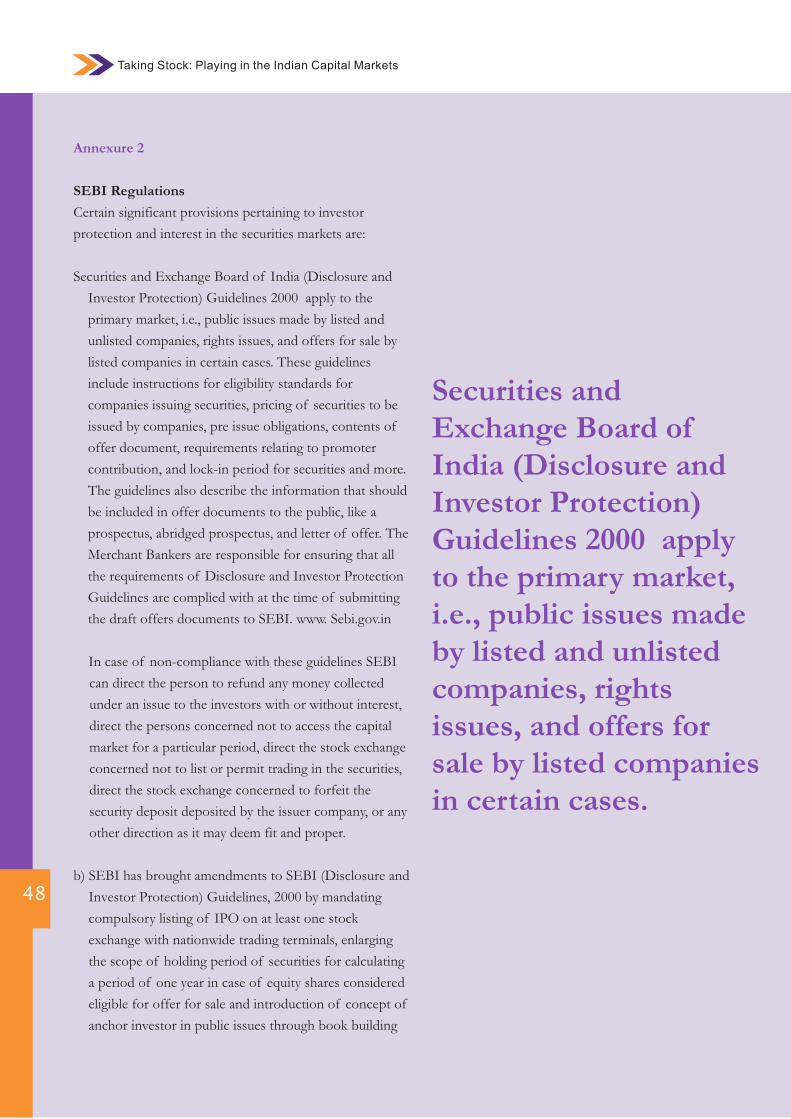
Taking Stock: Playing in the Indian Capital Markets
Securities and Exchange Board of India (Disclosure and Investor Protection) Guidelines 2000 apply to the primary market, i.e., public issues made by listed and unlisted companies, rights issues, and offers for sale by listed companies in certain cases.
48
Annexure 2
SEBI Regulations
Certain significant provisions pertaining to investor
protection and interest in the securities markets are:
Securities and Exchange Board of India (Disclosure and
Investor Protection) Guidelines 2000 apply to the
primary market, i.e., public issues made by listed and
unlisted companies, rights issues, and offers for sale by
listed companies in certain cases. These guidelines
include instructions for eligibility standards for
companies issuing securities, pricing of securities to be
issued by companies, pre issue obligations, contents of
offer document, requirements relating to promoter
contribution, and lock-in period for securities and more.
The guidelines also describe the information that should
be included in offer documents to the public, like a
prospectus, abridged prospectus, and letter of offer. The
Merchant Bankers are responsible for ensuring that all
the requirements of Disclosure and Investor Protection
Guidelines are complied with at the time of submitting
the draft offers documents to SEBI. www. Sebi.gov.in
In case of non-compliance with these guidelines SEBI
can direct the person to refund any money collected
under an issue to the investors with or without interest,
direct the persons concerned not to access the capital
market for a particular period, direct the stock exchange
concerned not to list or permit trading in the securities,
direct the stock exchange concerned to forfeit the
security deposit deposited by the issuer company, or any
other direction as it may deem fit and proper.
b) SEBI has brought amendments to SEBI (Disclosure and
Investor Protection) Guidelines, 2000 by mandating
compulsory listing of IPO on at least one stock
exchange with nationwide trading terminals, enlarging
the scope of holding period of securities for calculating
a period of one year in case of equity shares considered
eligible for offer for sale and introduction of concept of
anchor investor in public issues through book building
49
IPOs, Amount raised, Number of IPOs trading at
discount/ premium on listing day and on 30th calendar
d a y f r o m l i s t i n g d a t e . A v a i l a b l e a t
http://www.sebi.gov.in/cms/sebi_data/attachdocs/
1317128055980.pdf last accessed on Aril 2, 2012.
h) Credit Rating Agencies (CRA) have been advised to
follow the requirements pertaining to rating process and
methodology and its records, transparency and
disclosures, avoidance of conflict of interest, code of
conduct, etc, as prescribed in the SEBI Regulations and
circulars while carrying out rating of securities issued by
way of public and rights issue and other securities /
instruments and loans / facilities provided by banks
which are not regulated by SEBI. Available at
http://www.sebi.gov.in/cms/sebi_data/attachdocs/13
31706378217.pdf last accessed on April 2, 2012.
I) CRAs shall keep a record of the important factors
underlying the credit rating and sensitivity of such
credit rating to changes in these factors; summary of
discussions with the issuer, its management, auditors
and bankers; decisions of the rating committee; if a
quantitative model is a substantial component of the
credit rating process the rationale for any material
difference between the credit rating implied by the
model and the credit rating actually assigned for a
period of five years after maturity of instruments. CRA
shall publish information about the historical default
rates of CRA rating categories and whether the default
rates of these categories have changed over time, so
that the public can understand the historical
performance of each category. CRA shall formulate the
policies and internal codes for dealing with the conflict
of interests. CRA shall formulate and disclose its
policies, methodology and procedures in detail
regarding solicited and unsolicited credit ratings.
Available at http://www.sebi.gov.in/cms/sebi_data/
attachdocs/1288154943197.pdf last accessed on April
2, 2012.
j) CRAs shall have an internal audit on a half yearly basis
conducted by Chartered Accountants, Company
Secretaries or Cost and Management Accountants who
route. Available at http://www.sebi.Gov.in/cms/
sebi_data/ attachdocs/1289809510694.pdf last accessed
on April 2, 2012.
c) The promoters of the company are required to
contribute atleast 20% of the equity issue at the time of
listing. There shall be no partly paid up share/ other
securities at the time of filing of draft offer document
with SEBI. Available at http://www.sebi.gov.in/cms/
sebi_data/ attachdocs/1291175688427.pdf last
accessed on April 2, 2012.
d) Securities and Exchange Board of India (Issue of
Capital and Disclosure Requirements) Regulations,
2011.
e) Securities and Exchange Board of India (Investor
Protection and Education Fund) Regulations, 2009.
The fund shall be utilised for the purpose of protection
of investors and promotion of investor education. The
fund can also be utilised for aiding investors’
associations to undertake legal proceedings in the
interest of investors in securities that are listed or
proposed to be listed.
f) SEBI has advised Merchant Bankers to disclose the
track record of the performance of the public issues
managed by them in the public offer document so that
investor can take an informed decision. The track
record is required to be disclosed for a period of three
financial years from the date of listing of each public
issue managed by the merchant banker. Available at
http://www.sebi.Gov.in/cms/sebi_data/attachdocs/
1326184127412.pdf last accessed on April 2, 2012.
g) Merchant Bankers are required to disclose the price
information of past issues handled by them and the due
diligence certificate to the Board in the prescribed
format detailing Issue Name, Issue Size, Issue Price,
Listing Date, Opening & Closing price on the listing
date along with the percentage change, Closing Price on
10th, 20th and 30th calendar day from the listing date
along with the benchmark index on the respective dates.
The Merchant Bankers are also required summary
statement of disclosure for total number of
Annexures
Taking Stock: Playing in the Indian Capital Markets
50
made, its impact, etc. The consent terms may also
include other directives viz. disgorgement of ill-
gotten profits, etc. The HPAC/ Panel of WTMs
considering the facts and circumstances of the case
and the gravity of the charges, may enhance the
settlement amount in serious cases as per the scheme
of the SEBI Act, or reduce the settlement amount if
the settlement amount is disproportionately higher
considering the nature of violation, or refuse to
consider the case under the consent process. In case
of rejection of the consent application, no
subsequent application with respect to the same
default shall be considered by SEBI at any stage
thereafter. SEBI shall dispose of the consent
application expeditiously preferably within a period
of six months from the date of registration of the 16consent application.
are in practice and who do not have any conflict of interest
with the CRA. The internal audit shall cover all aspects of
CRA operations and procedures, investor grievance redressal
mechanism and compliance with the requirements stipulated
as per SEBI. Available at
http://www.sebi.gov.in/cms/sebi_data/attachdocs/1295346
684641.pdf last accessed on April 2, 2012.
k) SEBI has amended “Issue of Capital and Disclosure
Requirements Regulations” whereby in the case of an initial
public offer, the minimum subscription to be received shall
be subject to allotment of minimum number of specified
securities. The promoter or promoter group shall not make
institutional placement programme if the promoter or any
person who is part of the promoter group has purchased or
sold the eligible securities during the twelve weeks period
prior to the date of the programme and they shall not
purchase or sell the eligible securities during the twelve 15
weeks period after the date of the programme.
l) SEBI has modified the circular on consent order process, as a
consequence of which insider trading, front running, failure
to make an open offer, failure to redress investor grievances,
fraudulent and unfair trade practices and response to the
summons issued by SEBI have been excluded from the
consent process. The consent application will not be
considered, if any violation is committed within a period of
two years from the date of any consent order. In case an
applicant has already obtained more than two consent
orders, no consent application shall be considered for a
period of three years from the date of the last order. There
cannot be consent application before the completion of
investigation / inspection. In respect of proceedings
pending before SEBI, no consent application shall be
considered if filed after 60 days from the date of the service
of the show cause notice.
The consent terms shall be determined on the basis of the
guidelines. The significant ones being determination of
consent amount on the basis of underlying default/ violation
category & gravity, penalty imposed, track record of the
applicant, profits made, nature of disclosure not
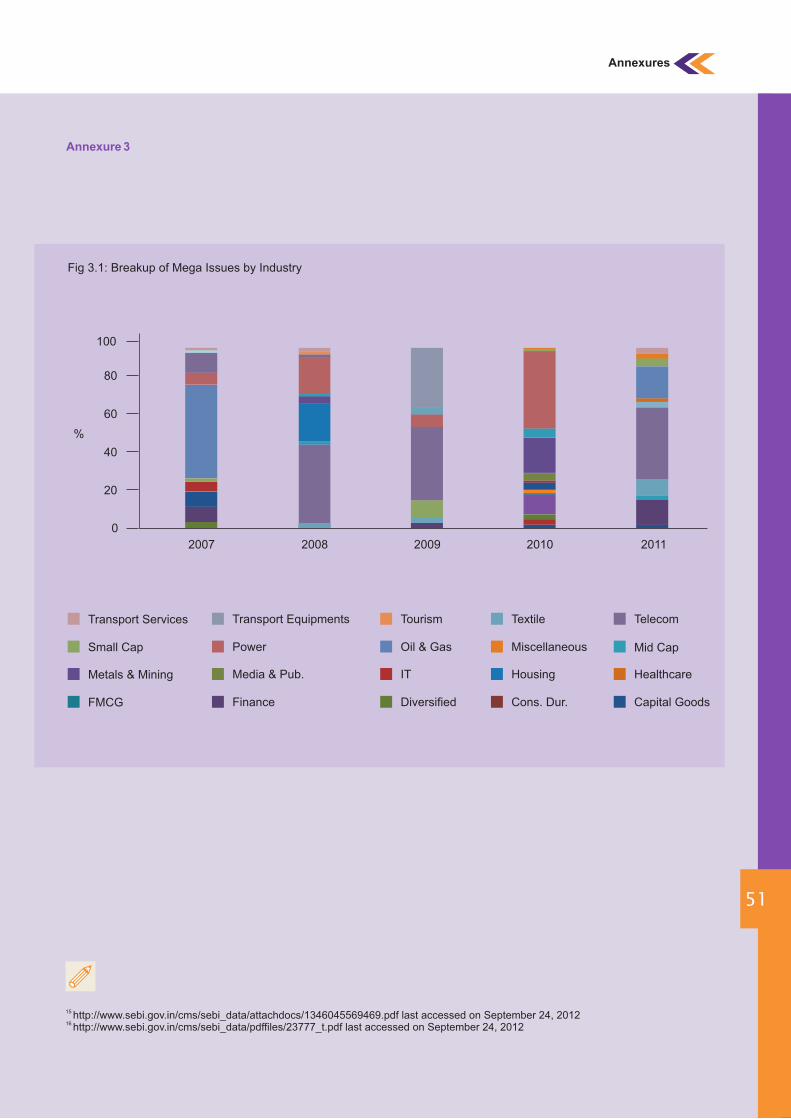
51
Annexure 3
Annexures
15 http://www.sebi.gov.in/cms/sebi_data/attachdocs/1346045569469.pdf last accessed on September 24, 201216 http://www.sebi.gov.in/cms/sebi_data/pdffiles/23777_t.pdf last accessed on September 24, 2012
Fig 3.1: Breakup of Mega Issues by Industry
2007
0
20
40
60
80
100
%
2008 2009 2010 2011
Transport Services Transport Equipments Tourism Textile Telecom
Small Cap Power Oil & Gas Miscellaneous
Metals & Mining Media & Pub. IT Housing Healthcare
FMCG Finance Diversified Cons. Dur.
Mid Cap
Capital Goods
Taking Stock: Playing in the Indian Capital Markets
52
for further investigation or a fresh order have been also
considered as relief to Appellant.
6. In order to determine the nature of violations, clubbing has
been done in the following manners:
a) Price Manipulation comprises of the cases where promoters
or directors or broker or company has involved itself in
synchronised/ circular/ cross deals to create artificial
volume and rig securities prices. It also consists of cases
whereby false or misleading corporate public
announcements have been made or insider trading has
been done.
b) Takeover violation comprises of the cases where the
regulations relating to takeover code i.e. Disclosures of
more than 2%/5% voting rights, shareholding pattern by
the company have not been followed.
c) Investors grievances’ relate to the companies delays in
dematerialisation of shares, non-redress of investors
grievances, huge selling in the shares with an objective to
defraud investors, delay in refund of investors' funds, non-
implementation of moral code of conduct to protect
investors interest.
d) Violation of code of conduct of brokers encompass the
cases where the brokers have not maintained proper books
of accounts, segregation of client moneys and own funds,
fund based activities, unauthorised terminals, KYC norms
non-compliance etc.
e) Non responsiveness of summons issued by SEBI includes
the cases of zero response or non-cooperation as to the
quantum & timeliness of information submitted.
f) Failure to pay stock broker registration charges on a timely
basis.
g) IPO manipulation includes the cases where fraudulent
financing of IPOs have been done to oversubscribe the
shares and make disproportionate profits on the date of
listing or create benami shareholding. It also includes
subscription to avoid under subscription of shares.
Annexure 4
Assumptions of the study / Limitations of the Data
1. Samples of 100 appellants with maximum of 2 appellants
in one SAT order have been considered.
2. Date of offence is the first date of violation. In cases of
offence relating to noncompliance with summons issued
by SEBI, date of offence has been taken as the date of 1st
summons issued.
3. Date of appointment of adjudicating officer could not be
found in case of ex-parte orders/ investigations ordered
by SEBI/ otherwise (32 such cases). We could not
ascertain the reasons why this date was not written in the
orders. In 5 cases, date of appointment of adjudicating
officer is after the date of show cause notice which are
essentially show causes issued by enquiry officer, these
have been taken as enquiry cases.
4. In one case, no show cause notice has been issued, hence
the date of show cause cannot be analysed.
5. To ascertain whether the outcome of SAT order was in
favour of SEBI/ Appellant, following assumptions have
been taken:
Appeals decided in favour of Appellant comprise of
cases where the order has been completely set aside or the
monetary penalty has been reduced to zero.
Appeals decided in favour of SEBI consist of cases
where there is no reduction in the penalty or the order has
been withheld by Appellant.
Cases withdrawn unconditionally or cases settled thru
consent order have been also clubbed under the category
of favourable to SEBI.
Appeals where the order has been withheld but the
quantum or conditions or amount of penalty has been
reduced by Appellate have been taken as Relief to
Appellant. In case the order has been sent back to SEBI
About Thought Arbitrage Research Institute
Thought Arbitrage Research Institute (TARI) is a not for profit organization set up under Section 25 of the Indian Companies Act. TARI is one of the few privately-funded, independent and non-partisan Indian think-tanks on Corporate Governance, Sustain ability, Economics, Public Policy.Today research in such areas is usually funded by the government, bilateral agencies or foreign universities; there is very little privately funded research that puts forth an unbiased and a non-partisan point of view.
TARI attempts to bridge the gap in the area of thought development. This research will ultimately contribute to reducing the cost of capital for India as more business decisions will be based on researched facts rather than opinions.
Tomorrow’s arbitrage will not be on labour, cost or capital—but on knowledge, ideas and thought. Countries that are ahead in these areas will control the course of global economic power.We intend to become an intellectual bridge between business and society so as to ensure that; Business can be more responsive to needs of society and can add more value, Society can create an environment in which business can thrive, Business & Society can transcend their pre-dispositions/concerns and come together to address critical human issues.
About Grant Thornton India LLP
Grant Thornton India LLP is a member firm within Grant Thornton International Ltd, one of the six largest global accountancy organizations, and the global leader in serving the needs of dynamic privately held businesses. From its origins in 1935, the firm has today grown to be one of the largest accounting and advisory firms in India with over 1,100 professional staff based out of 10 locations in the country.
The firm’s mission is to be the advisers of choice to dynamic Indian businesses who have global ambitions- raise global capital, expand into global markets or adopt global standards. The firm specialises in providing compliance and advisory services to growth oriented, entrepreneurial companies and adopts best in class international tools, methodologies and risk management standards for all its services
Capital market solutionsAt Grant Thornton, we help dynamic Indian businesses raise finance by evaluating the available options and selecting the right debt and equity partners. We negotiate and project-manage the deal through till completion. In addition, we utilise the close relationships we enjoy with major private equity houses and other financial institutions to match the right team with the right funder.On public equity markets, our partners coordinate Indian and cross-border capital-raising exercises such as listing on the Bombay Stock Exchange (BSE), National Stock Exchange (NSE) or in other markets. Such transactions are complicated and need to be carefully considered. As the most active nominated adviser on the London Alternative Investment Market (AiM) and a member of the NASDAQ listing committee, we are well-placed to work through the rationale with a client to ensure that a cross-border listing is in the best interest of organisation.
Forensic and Investigation ServicesThe Forensic and Investigation Services (FIS) practice of Grant Thornton India LLP include accountants, former police officers, certified fraud examiners, business valuators, criminologists, IT and other specialists that work together to provide a full range of services associated with fraud risk, investigation and prevention. They have extensive international experience in the investigation of complex fraud cases.
The team strives to understand your requirements quickly and in an in-depth manner. The range of solutions includes: Fraud investigations Dispute resolution & Litigation support Corporate intelligence Pre-employment background checks Brand protection/ IPR investigation Fraud risk assessments Fraud awareness workshops Asset tracing
Contact:
Thought Arbitrage Research Institute
Kaushik Dutta
Kshama V Kaushik
C-16 Qutab Institutional Area, New Delhi 110016
Tel: 011-41022447; 41022448
E-mail: [email protected]
Website: www.tari.co.in
Grant Thornton India LLP
Anil Roy
L 41 Connaught Circus
New Delhi 110001
Tel: +91 11 4278 7070
E-mail: [email protected]
Website: www.grantthornton.in
Disclaimer:
Thought Arbitrage Research Institute and Grant Thornton, India have exercised due care and diligence in preparing the
report. However, the information contained is of statistical nature and has been compiled or arrived at from sources
believed to be reliable, but no representation or warranty is made to their accuracy, completeness or correctness and
hence Thought Arbitrage Research Institute and Grant Thornton, India cannot be held responsible for omissions or
errors.