Embed Size (px)
DESCRIPTION
Capital is Back: Wealth-Income Ratios in Rich Countries 1870-2010. Thomas Piketty & Gabriel Zucman Paris School of Economics September 2012. How do aggregate wealth-income ratios evolve in the long run, and why? - PowerPoint PPT Presentation
Citation preview
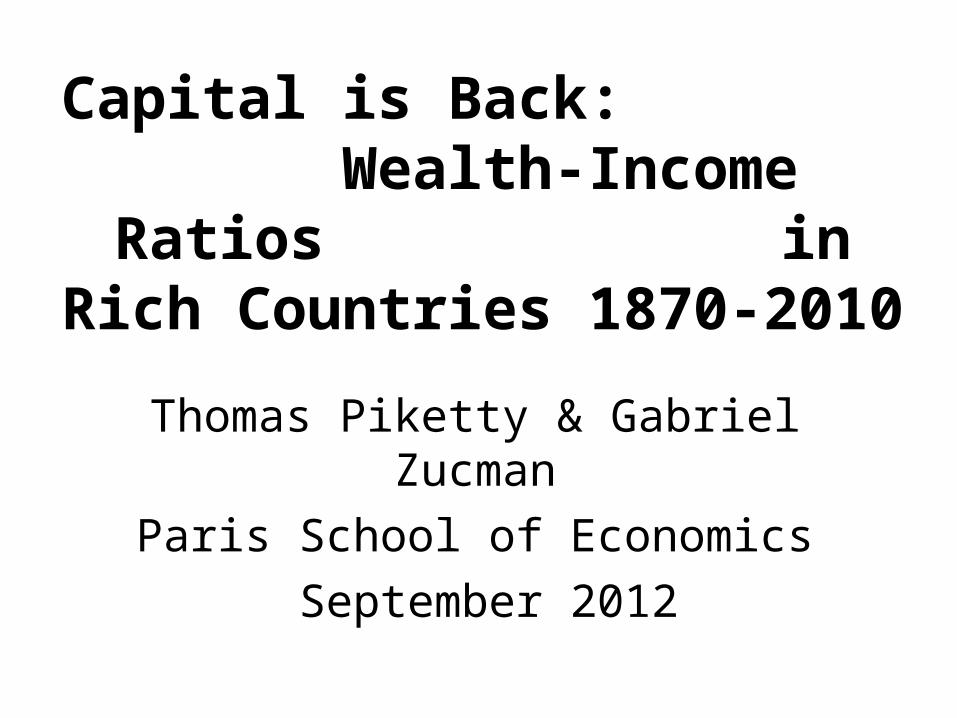
Capital is Back: Wealth-Income Ratios in Rich Countries 1870-2010
Thomas Piketty & Gabriel Zucman
Paris School of Economics
September 2012
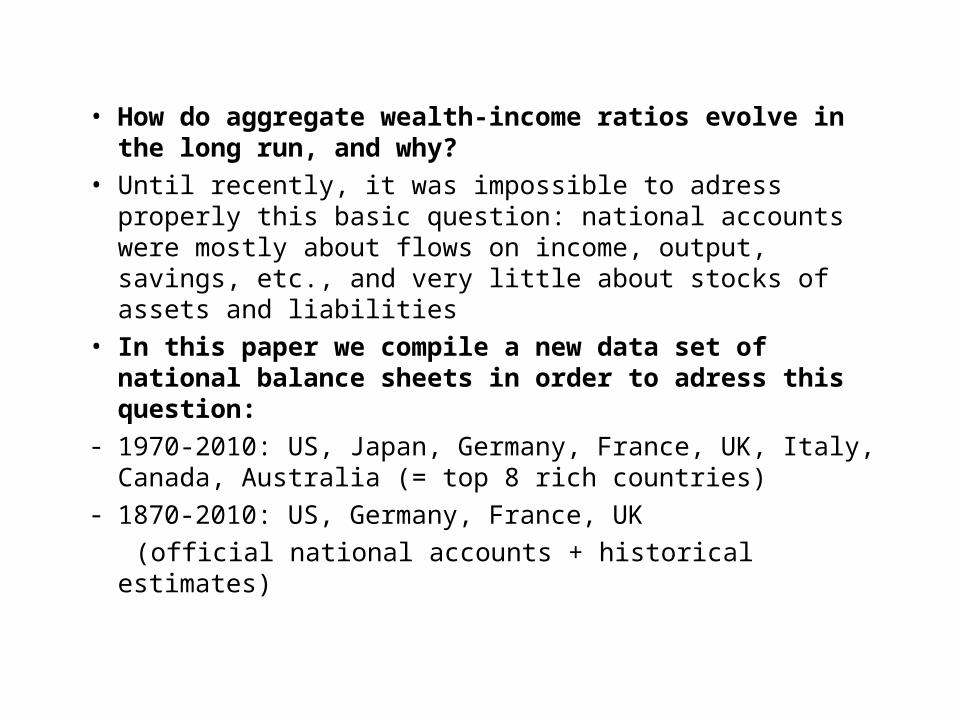
• How do aggregate wealth-income ratios evolve in the long run, and why?
• Until recently, it was impossible to adress properly this basic question: national accounts were mostly about flows on income, output, savings, etc., and very little about stocks of assets and liabilities
• In this paper we compile a new data set of national balance sheets in order to adress this question:
- 1970-2010: US, Japan, Germany, France, UK, Italy, Canada, Australia (= top 8 rich countries)
- 1870-2010: US, Germany, France, UK
(official national accounts + historical estimates)
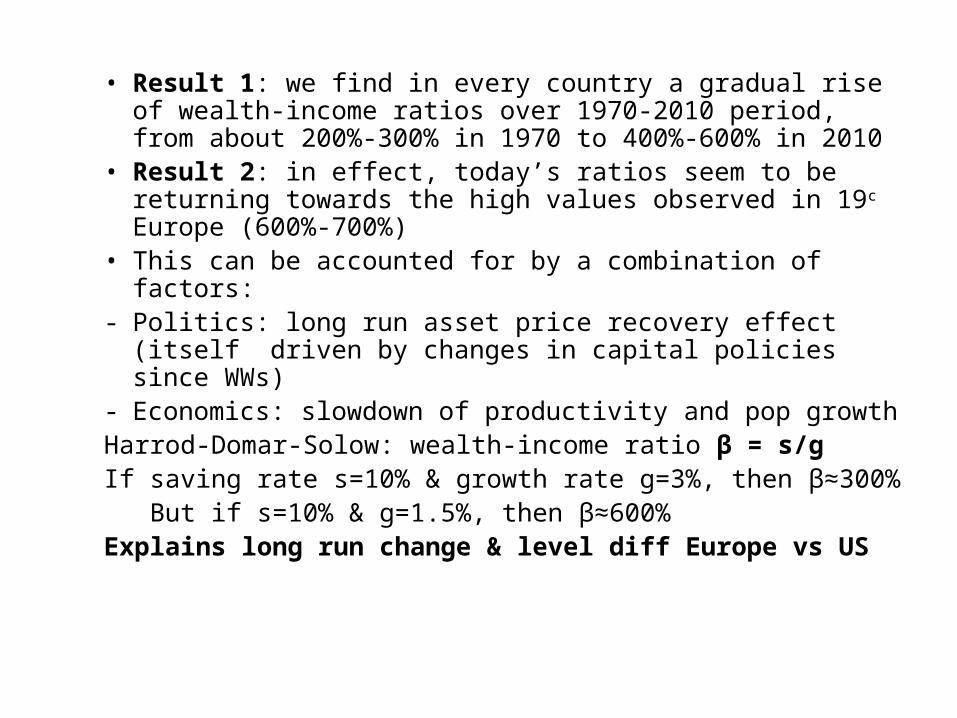
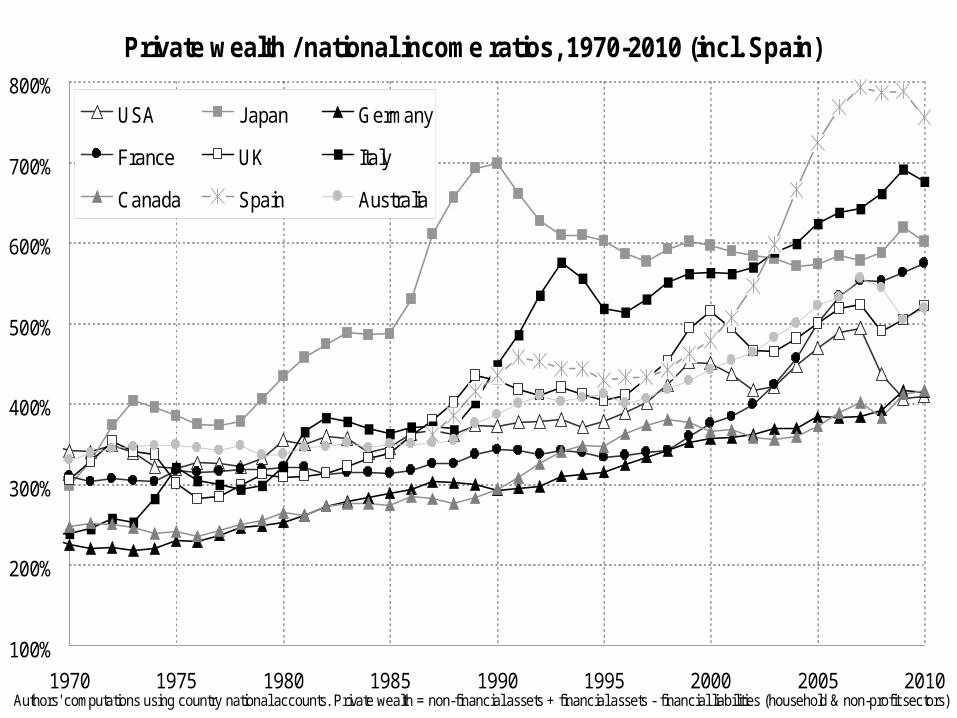
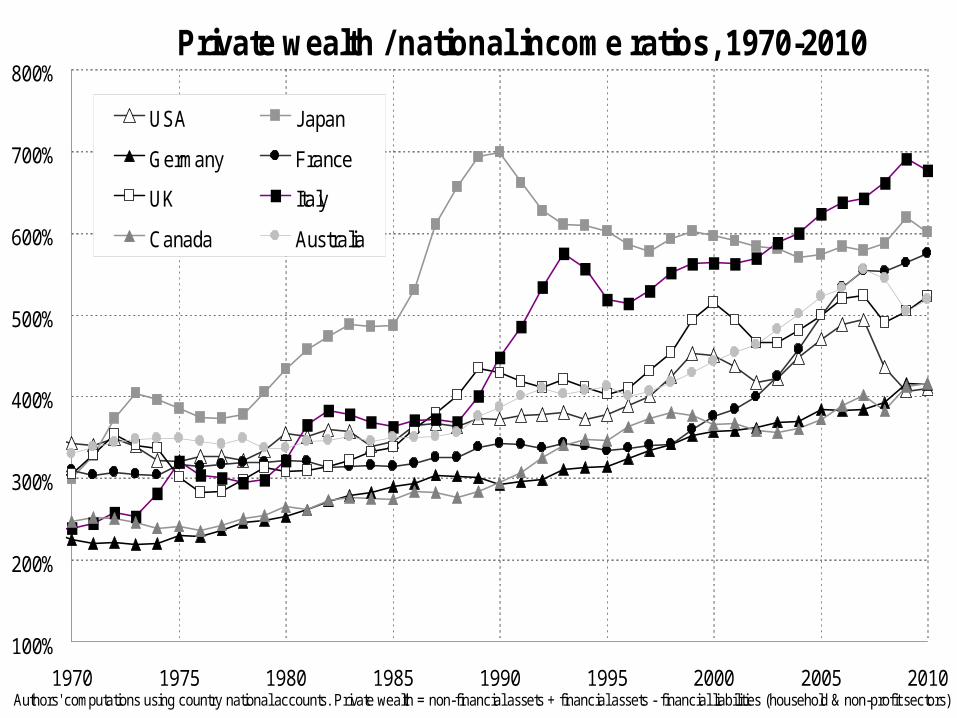
• Result 1: we find in every country a gradual rise of wealth-income ratios over 1970-2010 period, from about 200%-300% in 1970 to 400%-600% in 2010
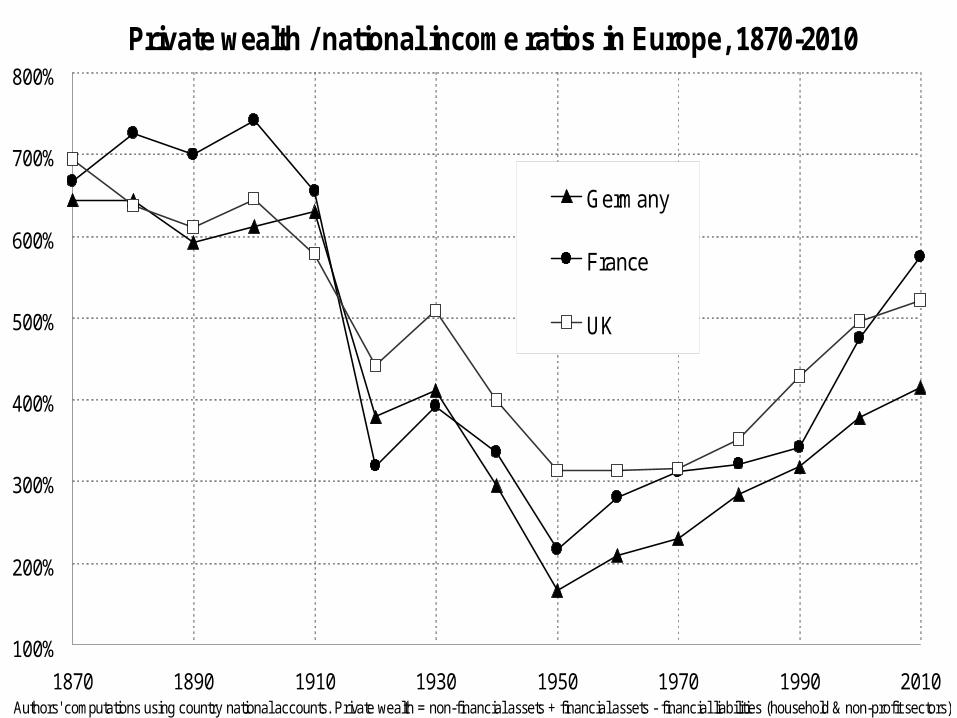
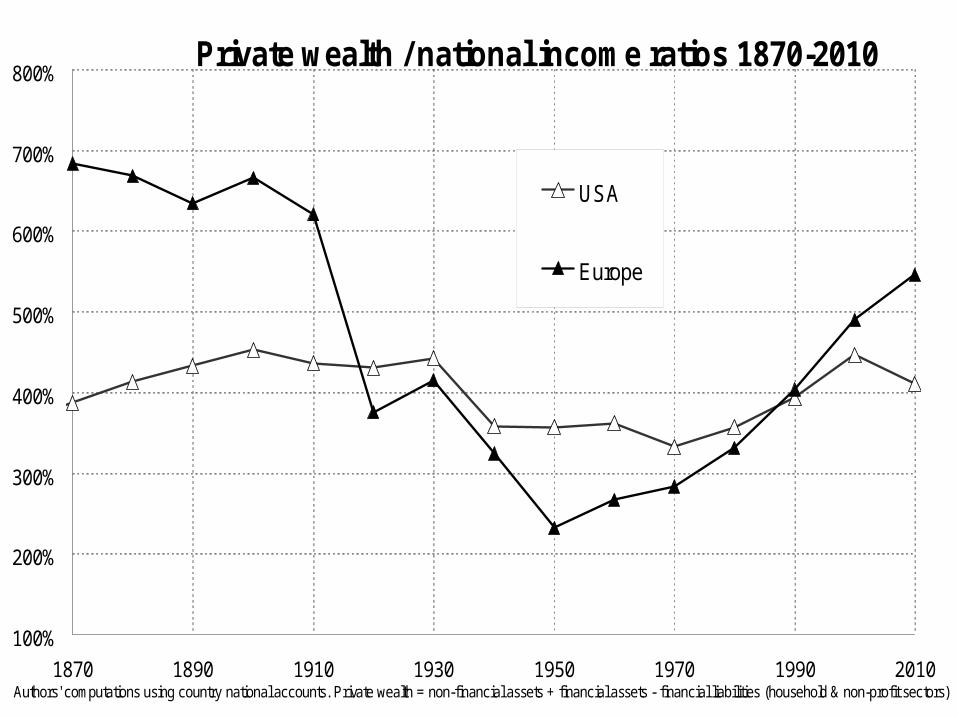
• Result 2: in effect, today’s ratios seem to be returning towards the high values observed in 19c Europe (600%-700%)
• This can be accounted for by a combination of factors:- Politics: long run asset price recovery effect (itself
driven by changes in capital policies since WWs)- Economics: slowdown of productivity and pop growthHarrod-Domar-Solow: wealth-income ratio β = s/gIf saving rate s=10% & growth rate g=3%, then β≈300% But if s=10% & g=1.5%, then β≈600% Explains long run change & level diff Europe vs US

Private wealth / national income ratios, 1970-2010
100%
200%
300%
400%
500%
600%
700%
800%
1970 1975 1980 1985 1990 1995 2000 2005 2010Authors' computations using country national accounts. Private wealth = non-financial assets + financial assets - financial liabilities (household & non-profit sectors)
USA Japan
Germany France
UK Italy
Canada Australia
Private wealth / national income ratios, 1970-2010 (incl. Spain)
100%
200%
300%
400%
500%
600%
700%
800%
1970 1975 1980 1985 1990 1995 2000 2005 2010Authors' computations using country national accounts. Private wealth = non-financial assets + financial assets - financial liabilities (household & non-profit sectors)
USA Japan Germany
France UK Italy
Canada Spain Australia
Private wealth / national income ratios in Europe, 1870-2010
100%
200%
300%
400%
500%
600%
700%
800%
1870 1890 1910 1930 1950 1970 1990 2010Authors' computations using country national accounts. Private wealth = non-financial assets + financial assets - financial liabilities (household & non-profit sectors)
Germany
France
UK
Private wealth / national income ratios 1870-2010
100%
200%
300%
400%
500%
600%
700%
800%
1870 1890 1910 1930 1950 1970 1990 2010Authors' computations using country national accounts. Private wealth = non-financial assets + financial assets - financial liabilities (household & non-profit sectors)
USA
Europe
• Lesson 1: one-good capital accumulation model with factor substitution works relatively well in the long run; but in short & medium run, volume effects (saving flows) can be vastly dominated by relative price effects (capital gains or losses)
• Lesson 2: long run wealth-income ratios β=s/g can vary a lot btw countries: s and g determined by diff. forces; countries with low g and high s naturally have high β; high β is not bad per se (capital is useful); but high β raises new issues about capital regulation and taxation:
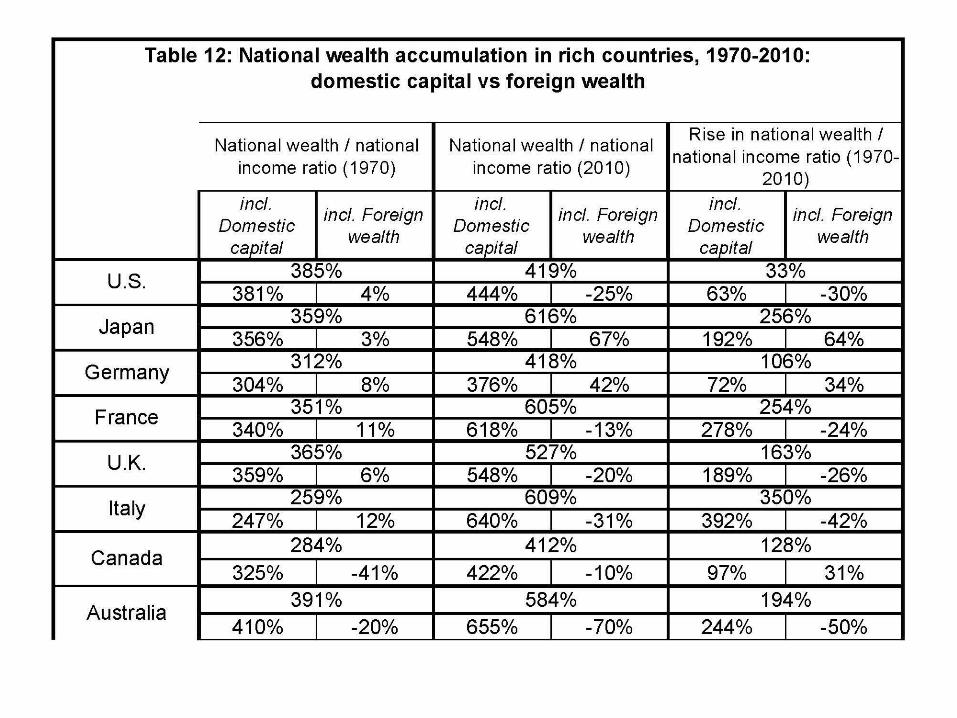
• With integrated capital markets, this can generate large net foreign asset positions, even in the absence of income diff (or reverse to income diff); so far net positions are smaller than during colonial period; but some countries positions are rising fast (Japan, Germany,.)
• With limited capital mobility, and/or home portfolio biais, high β can lead to large domestic asset price bubbles: see Japan, UK, Italy, France, Spain,.
• Lesson 3: wealth and technology in 21c : σ>1 Global rate of return r doesn’t seem to decline as much as the
rise in global β, i.e. global capital share α=rβ↑ as β↑ since 1970 → long run K/L elasticity of substitution σ>1, or rising market power for K, or both ?
• Lesson 4: wealth and technology in 18c : σ<1• In the very long run, i.e. using national wealth estimates over
1700-2010 for UK & France, we find β stable around 600%-700%, in spite of huge changes in wealth composition, from agricultural land to manufacturing and housing
• In agrarian, very-low-growth societies, however, it is unclear which forces dominate: β = s/g or β = α/r ? Probably β = α/r
• I.e. with α = capital share = mostly land rent: determined by technology, politics, & land availability (α≈30%-40% in Europe, vs 10%-15% in land-rich New world, i.e. elast. subst. σ<1), and r = rate of return = 4%-5% = rate of time preference
→ β = 600%-700% in Europe, vs 200%-300% in New World(simply bc very abundant land is worthless; nothing to do with the
β = s/g mechanism, which bumped it in later, with migration)
The changing nature of national wealth, UK 1700-2010
0%
100%
200%
300%
400%
500%
600%
700%
800%
1700 1750 1810 1850 1880 1910 1920 1950 1970 1990 2010National wealth = agricultural land + housing + other domestic capital goods + net foreign assets
(% n
atio
nal
inco
me)
Net foreign assets
Other domestic capital
Housing
Agricultural land
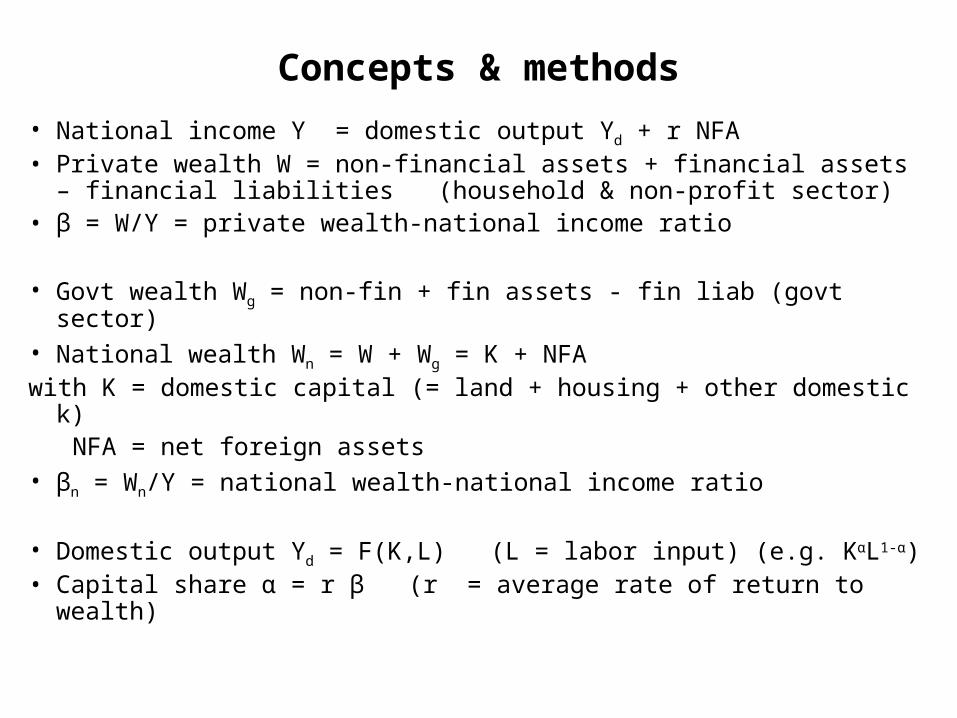
Concepts & methods
• National income Y = domestic output Yd + r NFA• Private wealth W = non-financial assets + financial assets –
financial liabilities (household & non-profit sector)• β = W/Y = private wealth-national income ratio
• Govt wealth Wg = non-fin + fin assets - fin liab (govt sector)• National wealth Wn = W + Wg = K + NFAwith K = domestic capital (= land + housing + other domestic k) NFA = net foreign assets • βn = Wn/Y = national wealth-national income ratio • Domestic output Yd = F(K,L) (L = labor input) (e.g. KαL1-α)• Capital share α = r β (r = average rate of return to wealth)
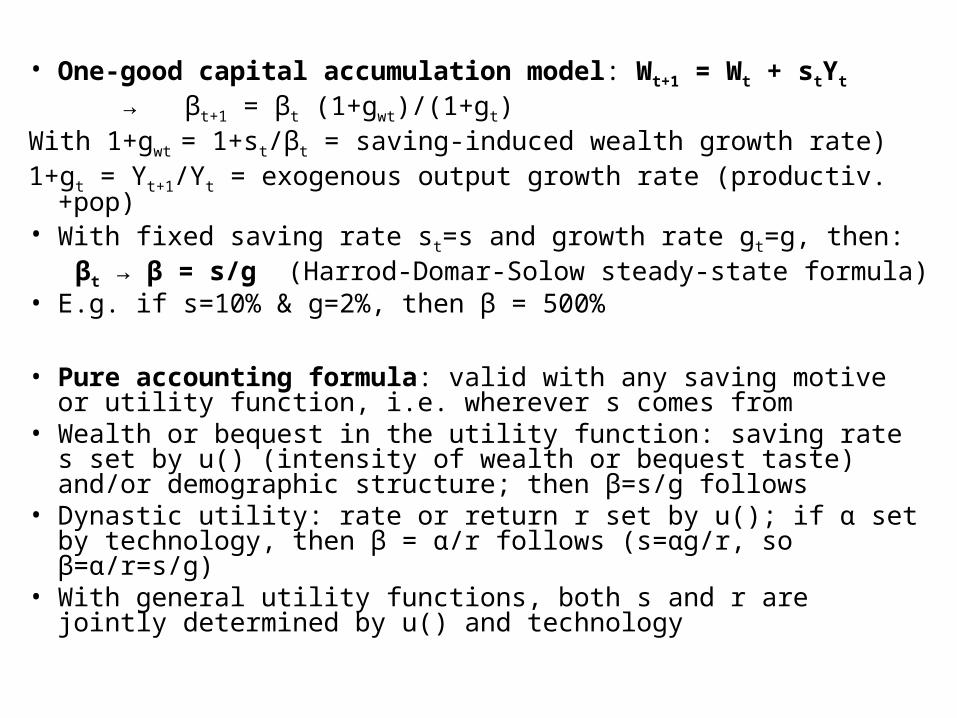
• One-good capital accumulation model: Wt+1 = Wt + stYt
→ βt+1 = βt (1+gwt)/(1+gt)With 1+gwt = 1+st/βt = saving-induced wealth growth rate)1+gt = Yt+1/Yt = exogenous output growth rate (productiv.+pop)• With fixed saving rate st=s and growth rate gt=g, then: βt → β = s/g (Harrod-Domar-Solow steady-state formula) • E.g. if s=10% & g=2%, then β = 500%
• Pure accounting formula: valid with any saving motive or utility function, i.e. wherever s comes from
• Wealth or bequest in the utility function: saving rate s set by u() (intensity of wealth or bequest taste) and/or demographic structure; then β=s/g follows
• Dynastic utility: rate or return r set by u(); if α set by technology, then β = α/r follows (s=αg/r, so β=α/r=s/g)
• With general utility functions, both s and r are jointly determined by u() and technology
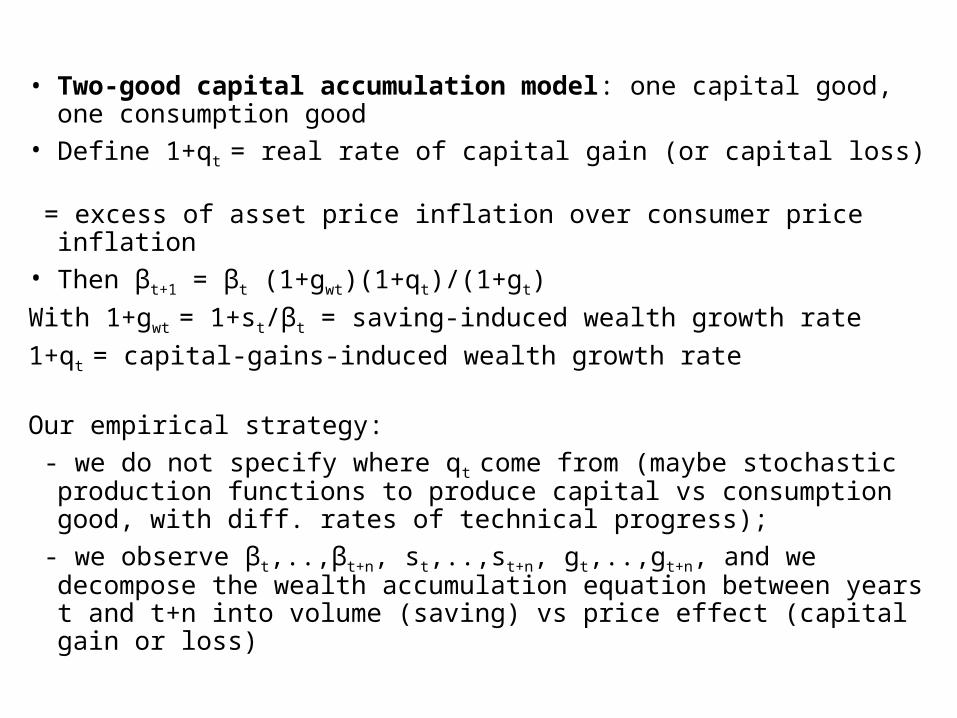
• Two-good capital accumulation model: one capital good, one consumption good
• Define 1+qt = real rate of capital gain (or capital loss) = excess of asset price inflation over consumer price inflation• Then βt+1 = βt (1+gwt)(1+qt)/(1+gt)
With 1+gwt = 1+st/βt = saving-induced wealth growth rate
1+qt = capital-gains-induced wealth growth rate
Our empirical strategy:
- we do not specify where qt come from (maybe stochastic production functions to produce capital vs consumption good, with diff. rates of technical progress);
- we observe βt,..,βt+n, st,..,st+n, gt,..,gt+n, and we decompose the wealth accumulation equation between years t and t+n into volume (saving) vs price effect (capital gain or loss)
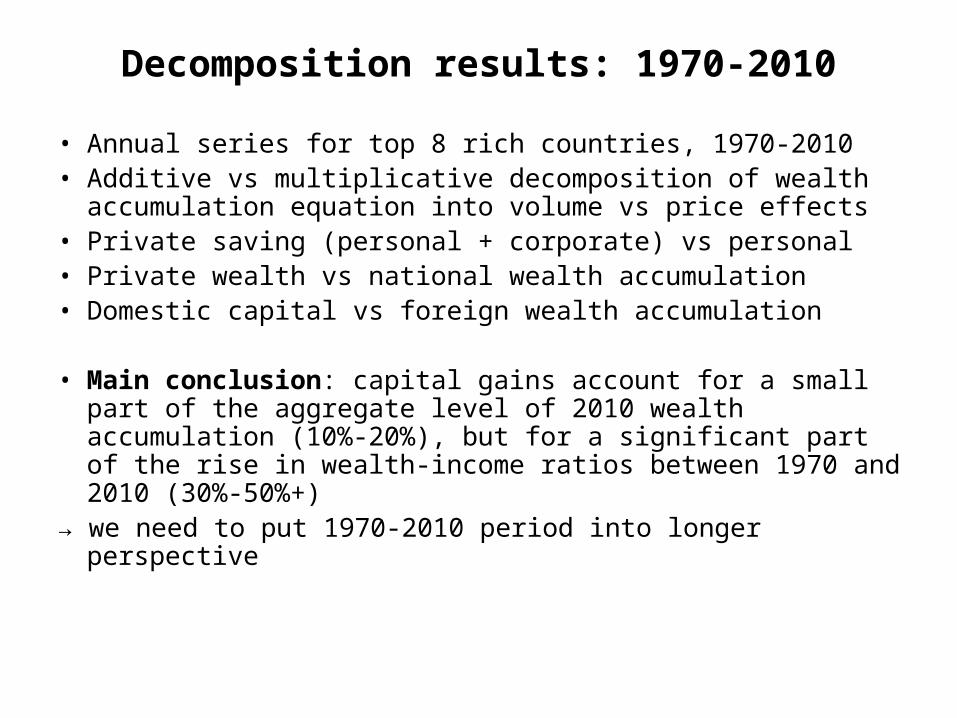
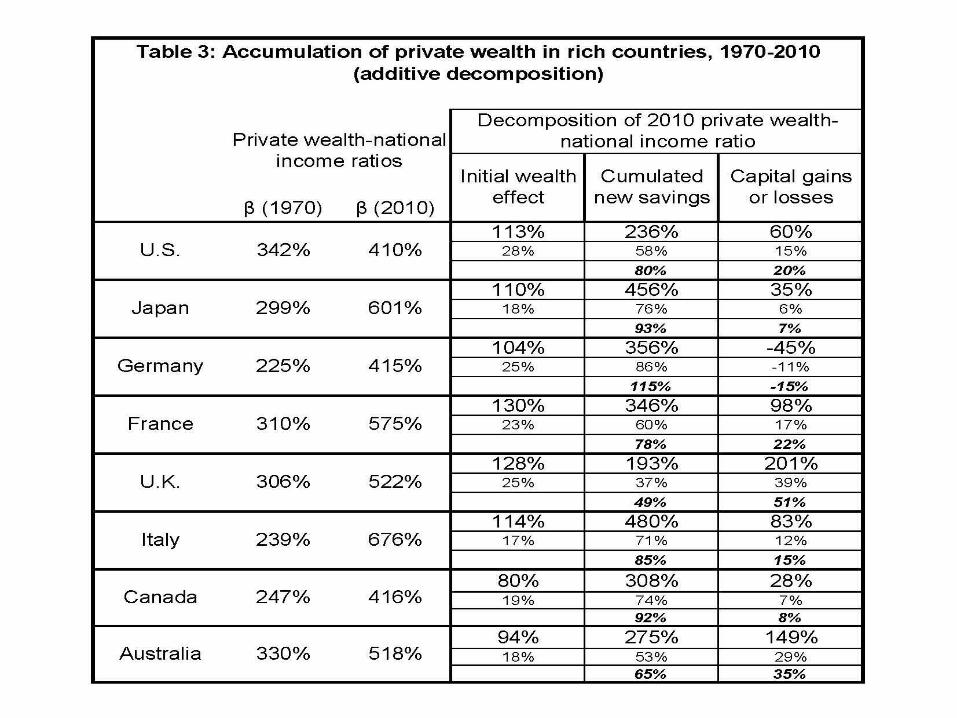
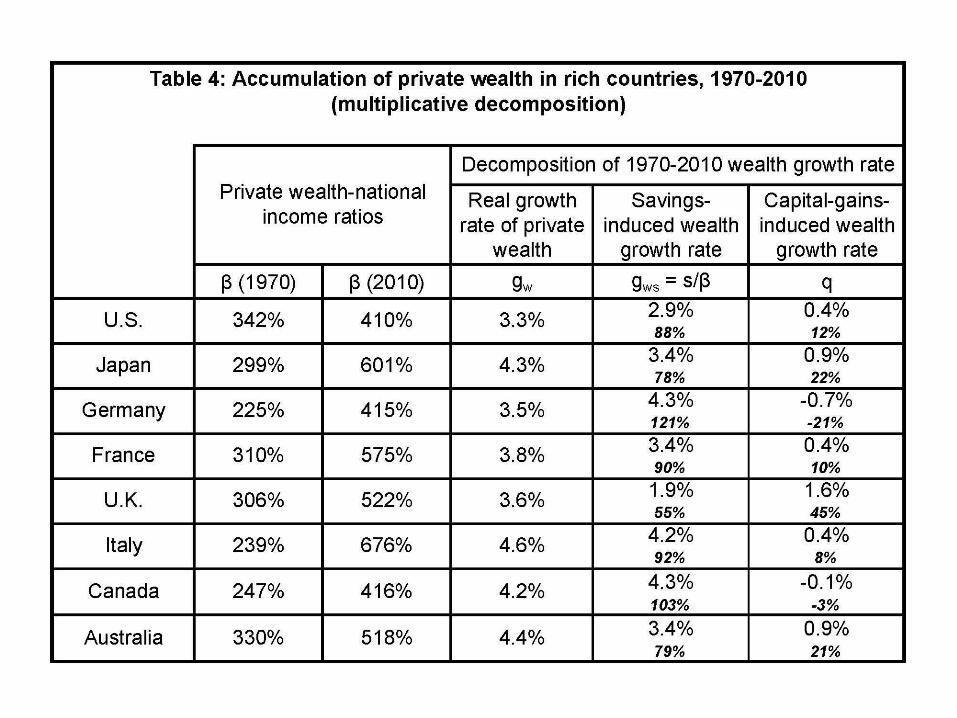
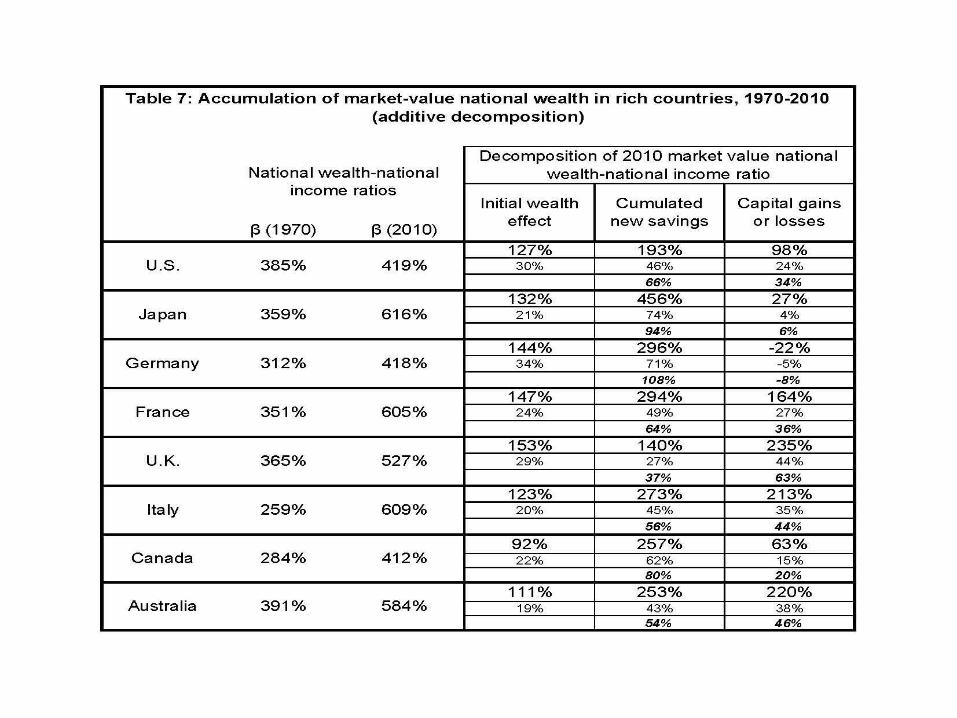
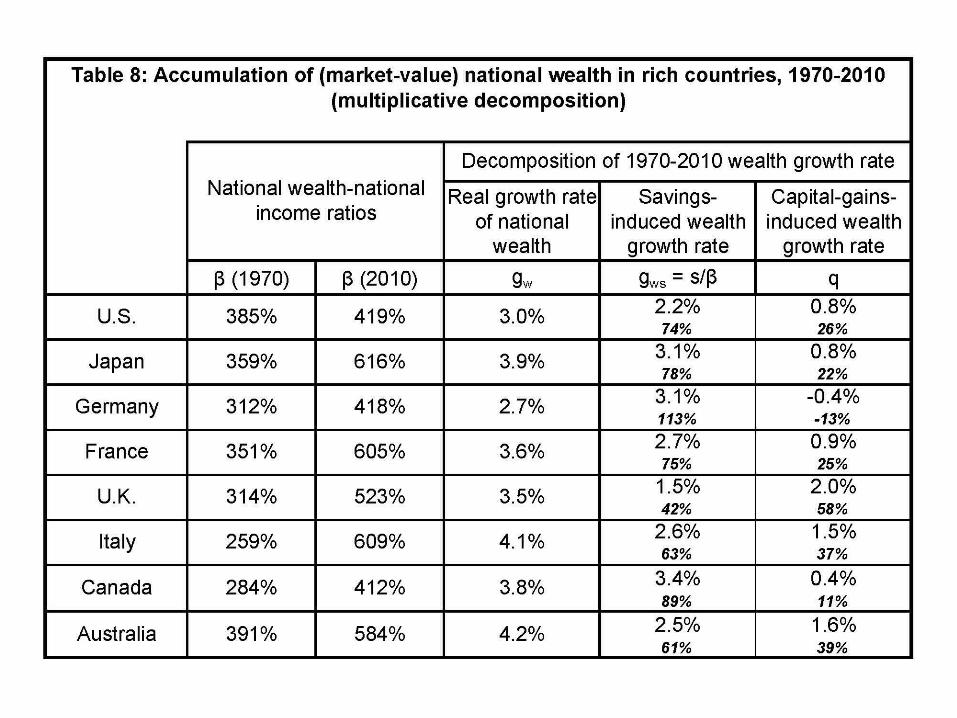
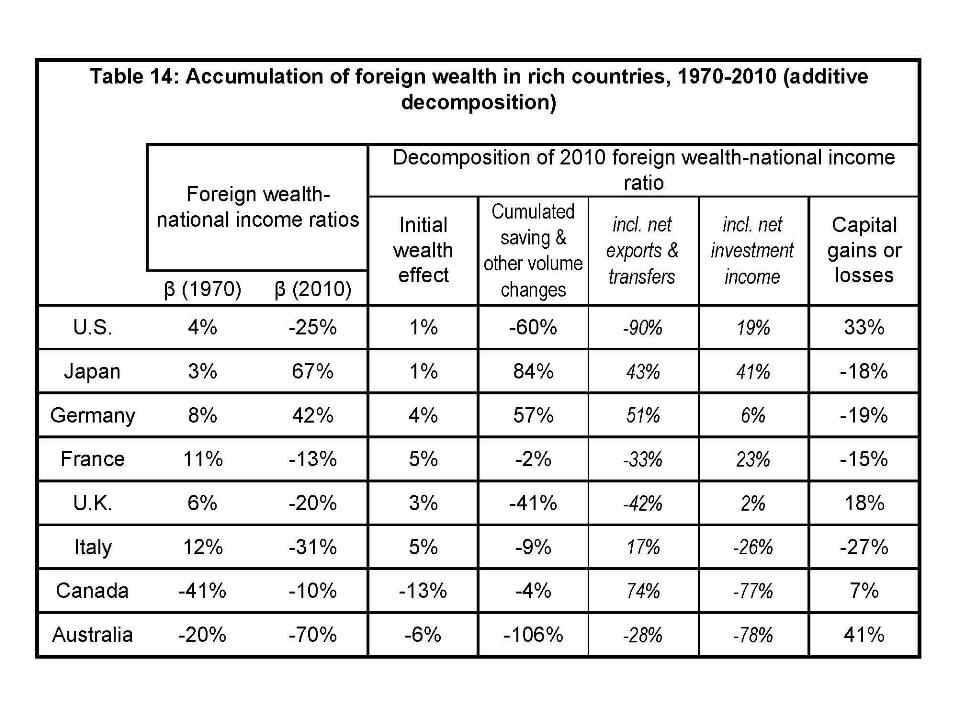
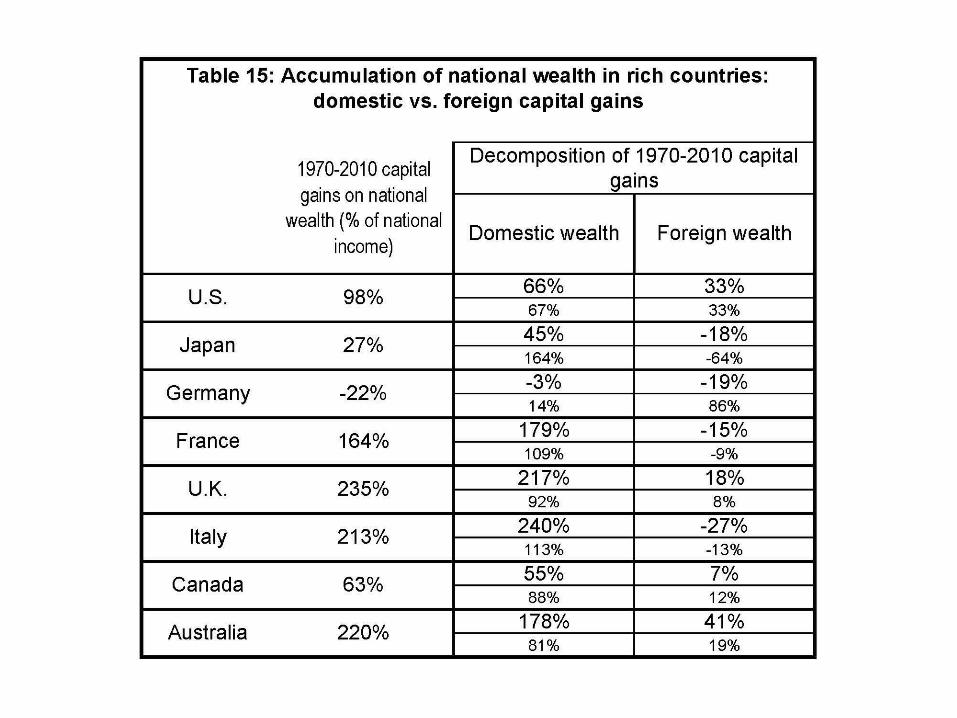
Decomposition results: 1970-2010
• Annual series for top 8 rich countries, 1970-2010• Additive vs multiplicative decomposition of wealth
accumulation equation into volume vs price effects• Private saving (personal + corporate) vs personal• Private wealth vs national wealth accumulation• Domestic capital vs foreign wealth accumulation
• Main conclusion: capital gains account for a small part of the aggregate level of 2010 wealth accumulation (10%-20%), but for a significant part of the rise in wealth-income ratios between 1970 and 2010 (30%-50%+)
→ we need to put 1970-2010 period into longer perspective
Private wealth / national income ratios, 1970-2010
100%
200%
300%
400%
500%
600%
700%
800%
1970 1975 1980 1985 1990 1995 2000 2005 2010Authors' computations using country national accounts. Private wealth = non-financial assets + financial assets - financial liabilities (household & non-profit sectors)
USA Japan
Germany France
UK Italy
Canada Australia
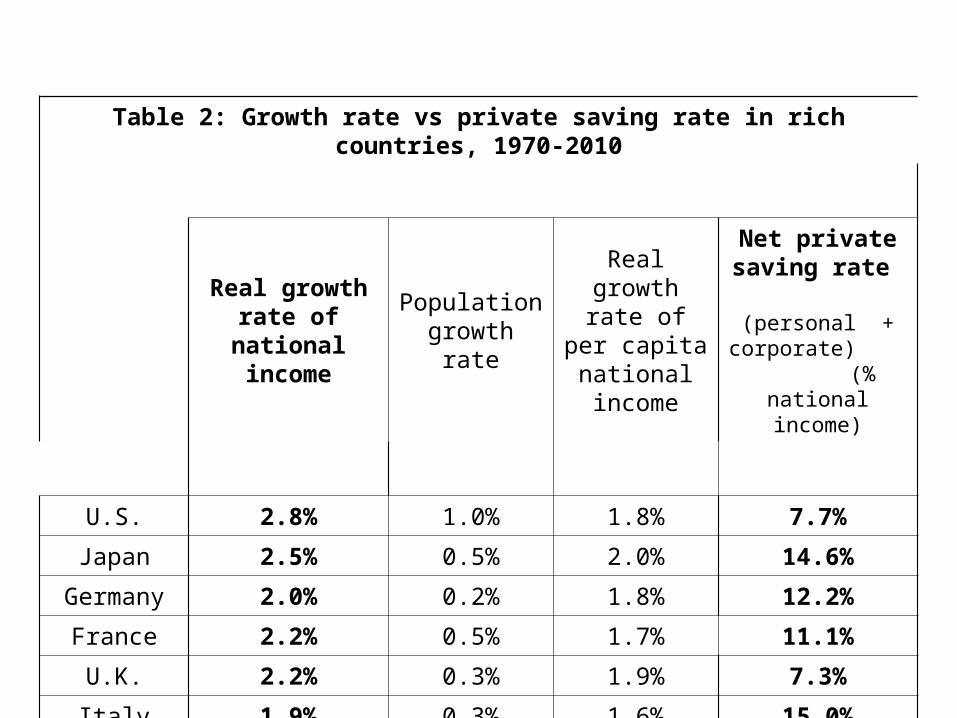
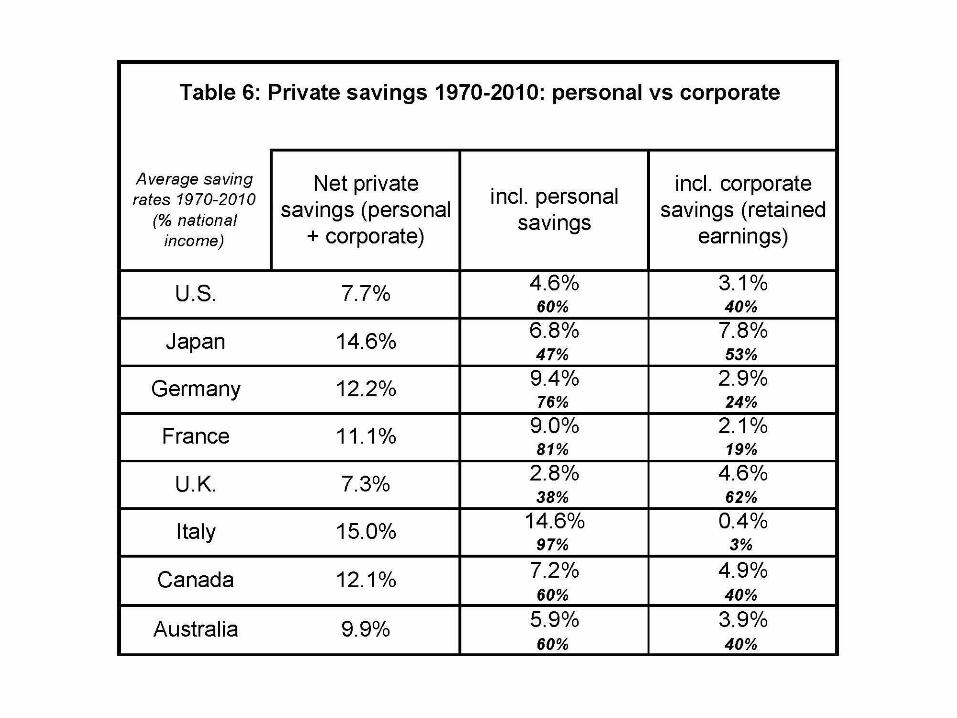
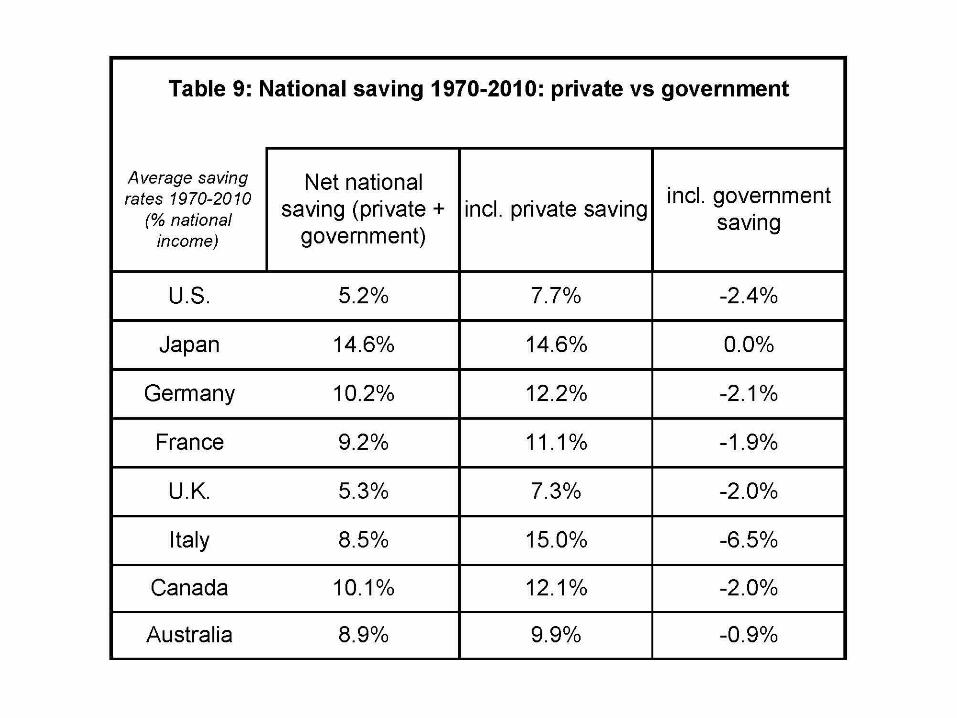
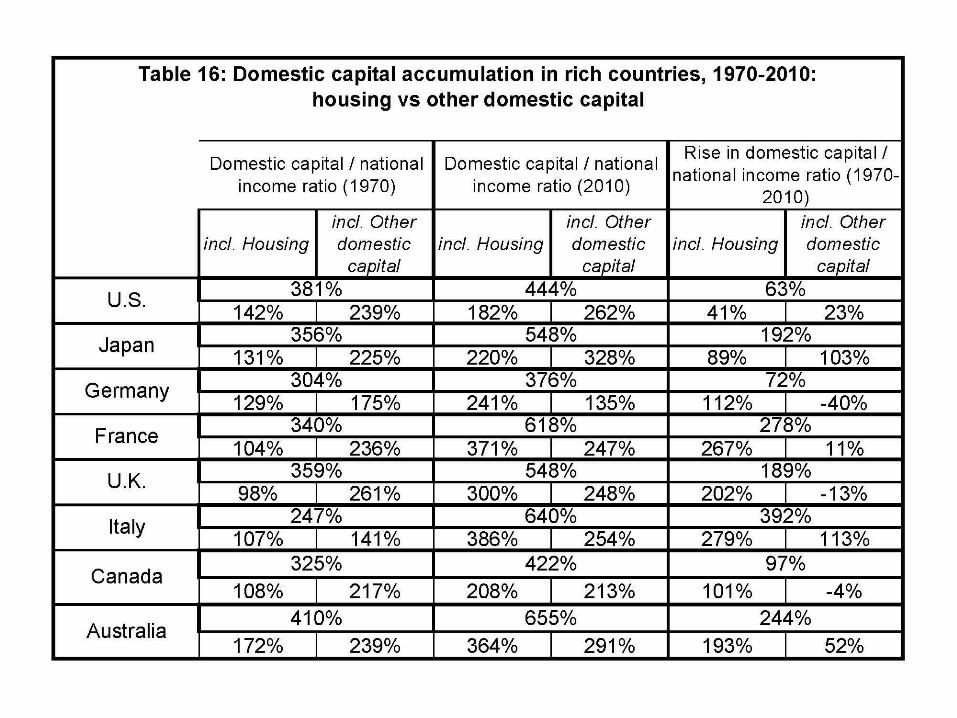
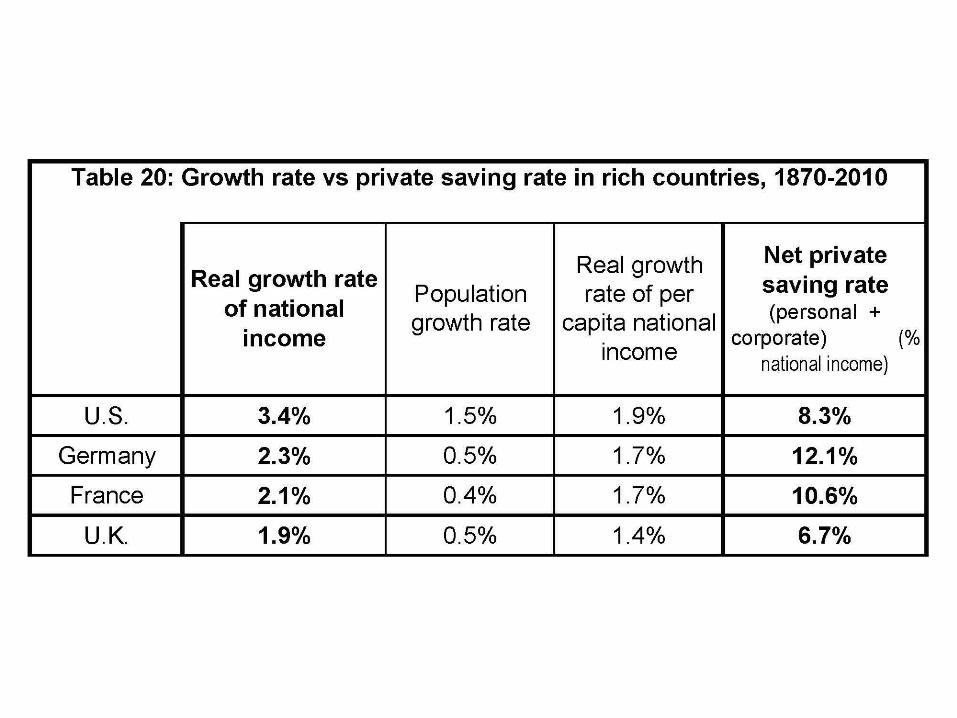
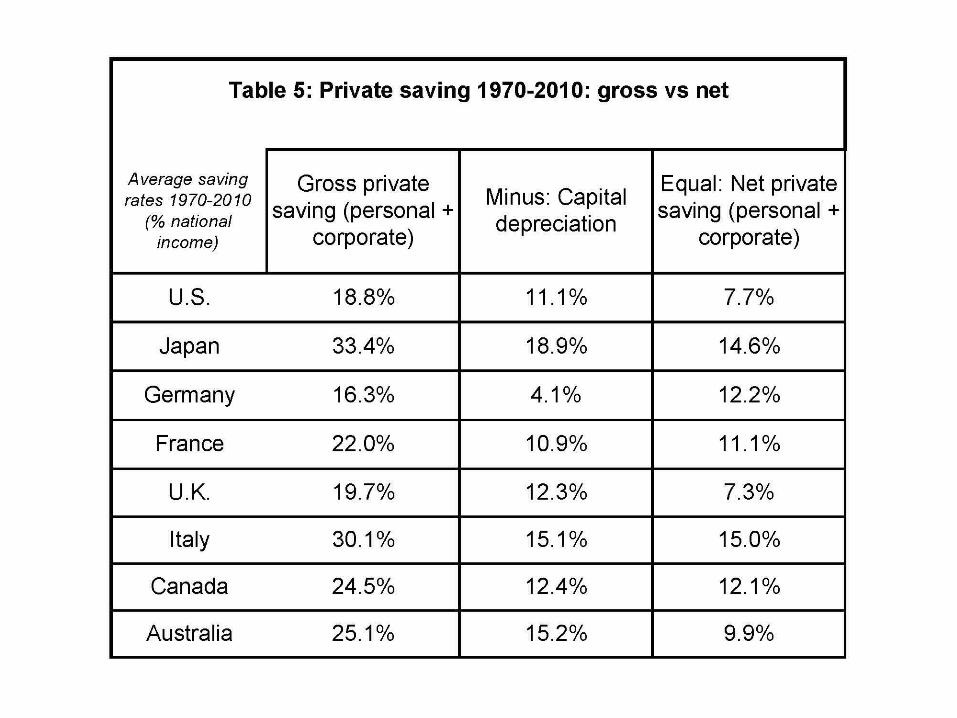
Table 2: Growth rate vs private saving rate in rich countries, 1970-2010
Real growth rate of national
income
Population growth rate
Real growth rate of per
capita national income
Net private saving rate
(personal + corporate) (% national income)
U.S. 2.8% 1.0% 1.8% 7.7%
Japan 2.5% 0.5% 2.0% 14.6%
Germany 2.0% 0.2% 1.8% 12.2%
France 2.2% 0.5% 1.7% 11.1%
U.K. 2.2% 0.3% 1.9% 7.3%
Italy 1.9% 0.3% 1.6% 15.0%
Australia 3.2% 1.4% 1.7% 9.9%
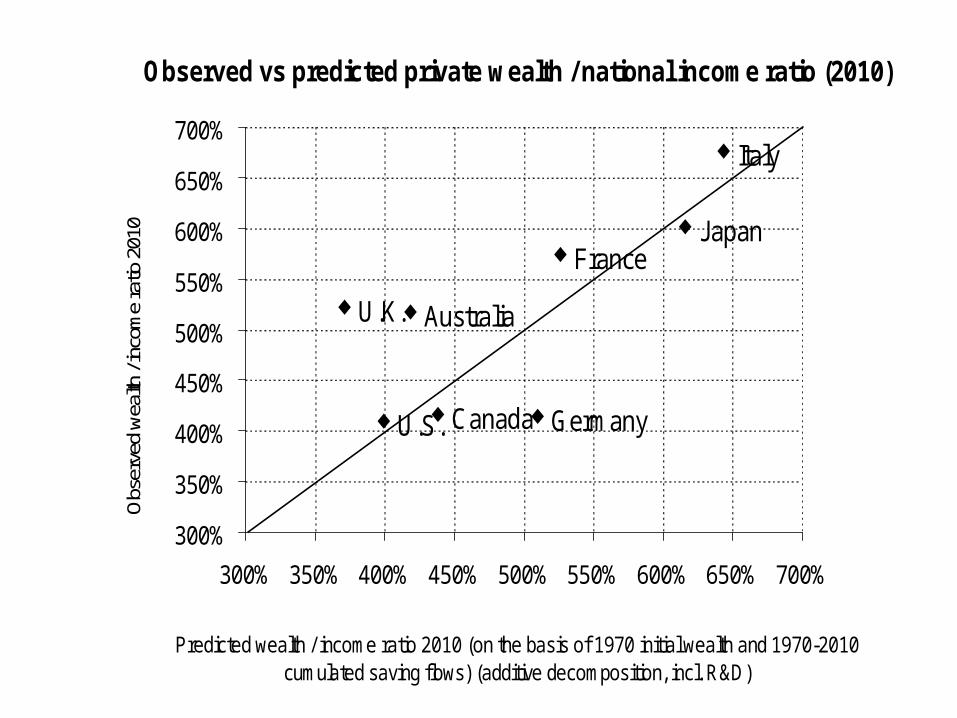
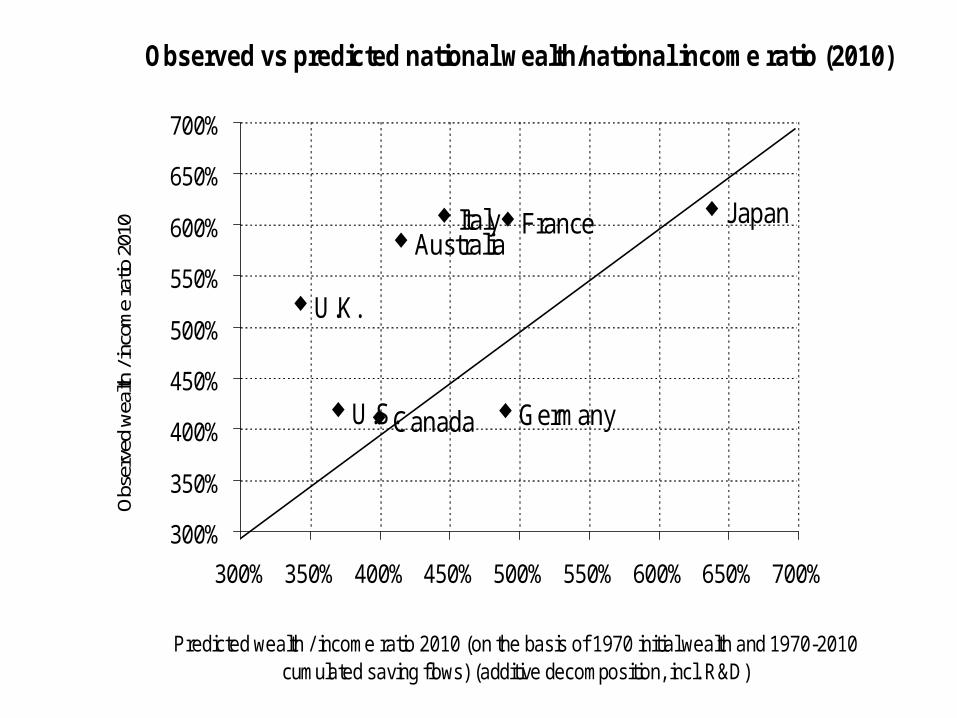
Observed vs predicted private wealth / national income ratio (2010)
U.S.
Japan
Germany
France
U.K.
Italy
Canada
Australia
300%
350%
400%
450%
500%
550%
600%
650%
700%
300% 350% 400% 450% 500% 550% 600% 650% 700%
Predicted wealth / income ratio 2010 (on the basis of 1970 initial wealth and 1970-2010 cumulated saving flows) (additive decomposition, incl. R&D)
Obs
erve
d w
ealth
/ in
com
e ra
tio 2
010
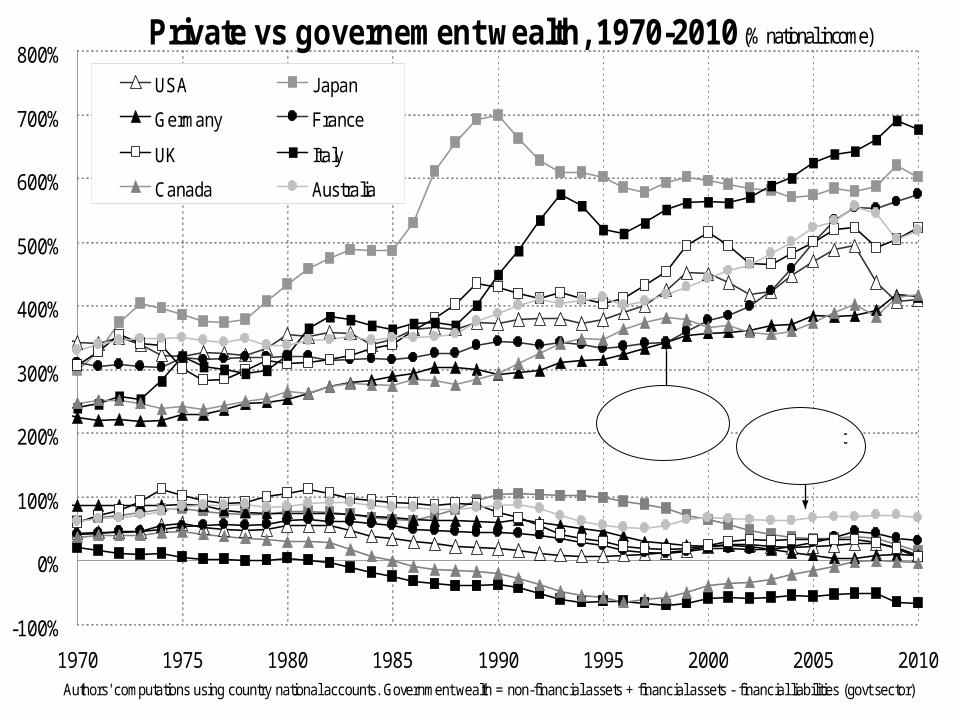
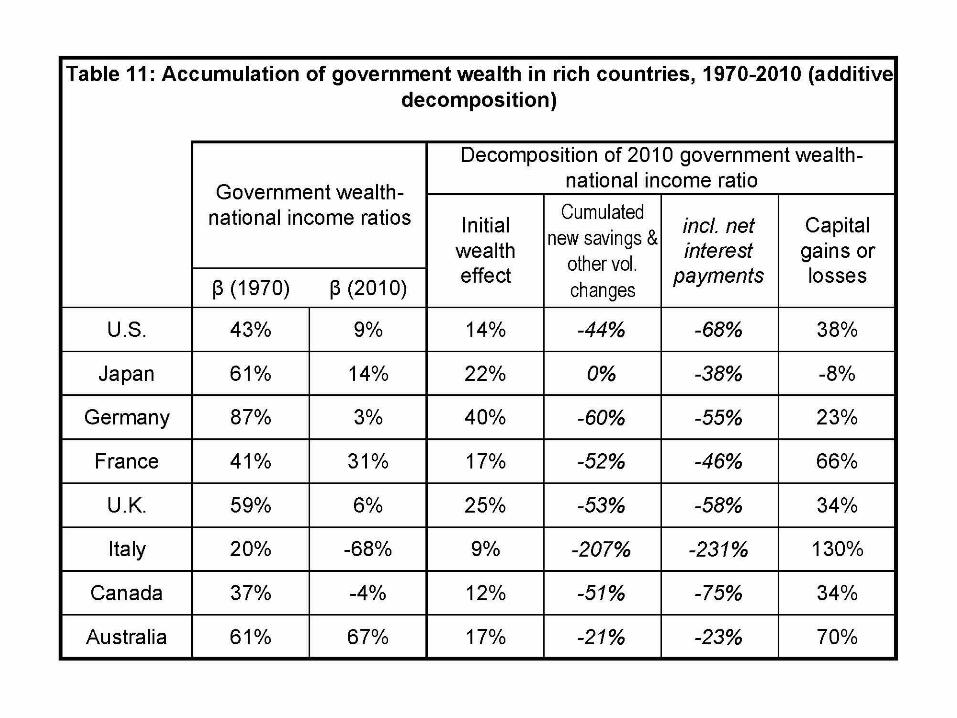
Private vs governement wealth, 1970-2010 (% national income)
-100%
0%
100%
200%
300%
400%
500%
600%
700%
800%
1970 1975 1980 1985 1990 1995 2000 2005 2010Authors' computations using country national accounts. Government wealth = non-financial assets + financial assets - financial liabilities (govt sector)
USA Japan
Germany France
UK Italy
Canada Australia
Government wealth
Private wealth
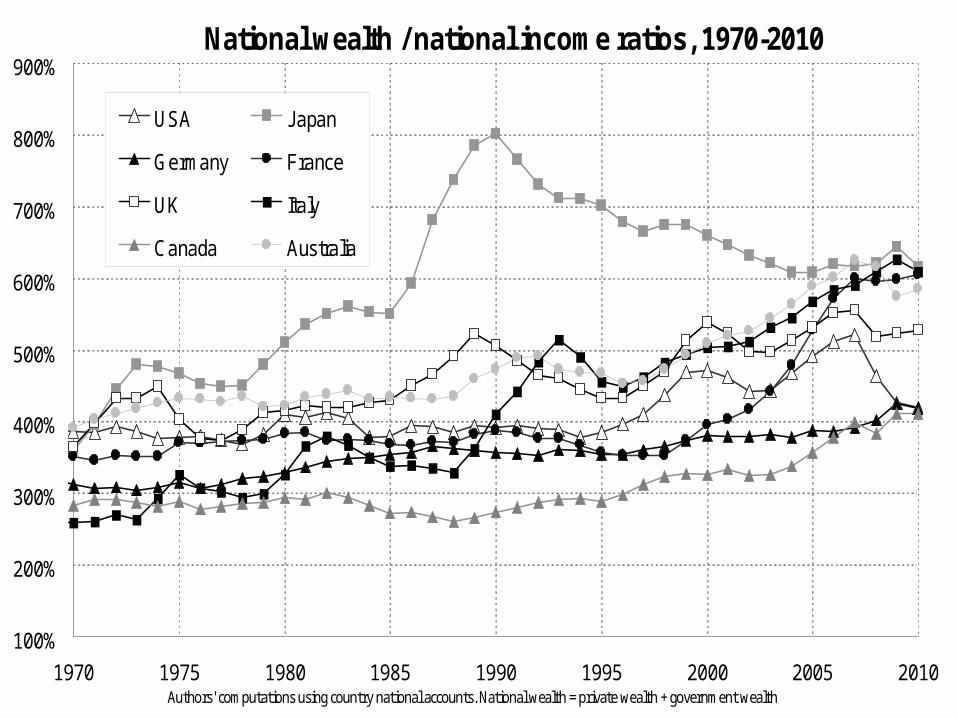
National wealth / national income ratios, 1970-2010
100%
200%
300%
400%
500%
600%
700%
800%
900%
1970 1975 1980 1985 1990 1995 2000 2005 2010Authors' computations using country national accounts. National wealth = private wealth + government wealth
USA Japan
Germany France
UK Italy
Canada Australia
Observed vs predicted national wealth/national income ratio (2010)
U.S.
Japan
Germany
France
U.K.
Italy
Canada
Australia
300%
350%
400%
450%
500%
550%
600%
650%
700%
300% 350% 400% 450% 500% 550% 600% 650% 700%
Predicted wealth / income ratio 2010 (on the basis of 1970 initial wealth and 1970-2010 cumulated saving flows) (additive decomposition, incl. R&D)
Obs
erve
d w
ealth
/ in
com
e ra
tio 2
010
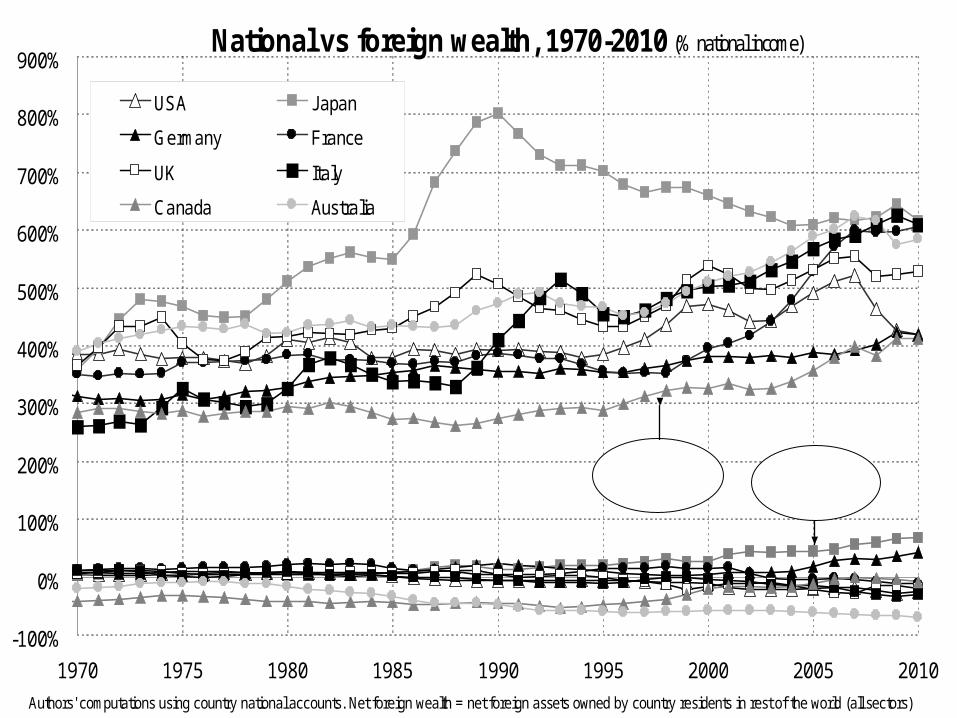
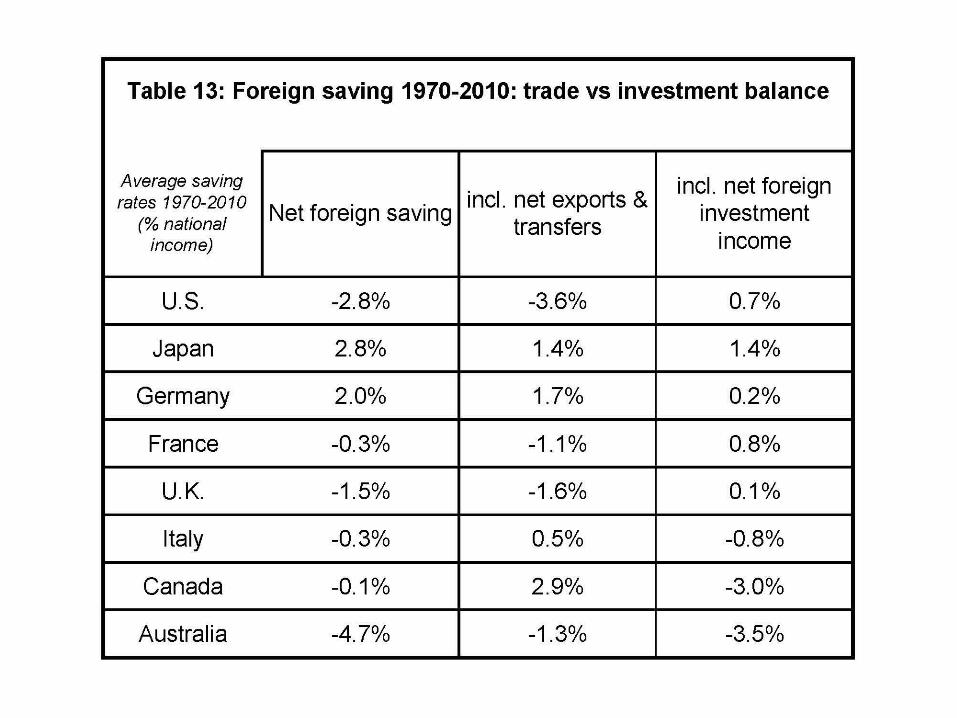
National vs foreign wealth, 1970-2010 (% national income)
-100%
0%
100%
200%
300%
400%
500%
600%
700%
800%
900%
1970 1975 1980 1985 1990 1995 2000 2005 2010
Authors' computations using country national accounts. Net foreign wealth = net foreign assets owned by country residents in rest of the world (all sectors)
USA Japan
Germany France
UK Italy
Canada Australia
Net foreign wealth
National wealth
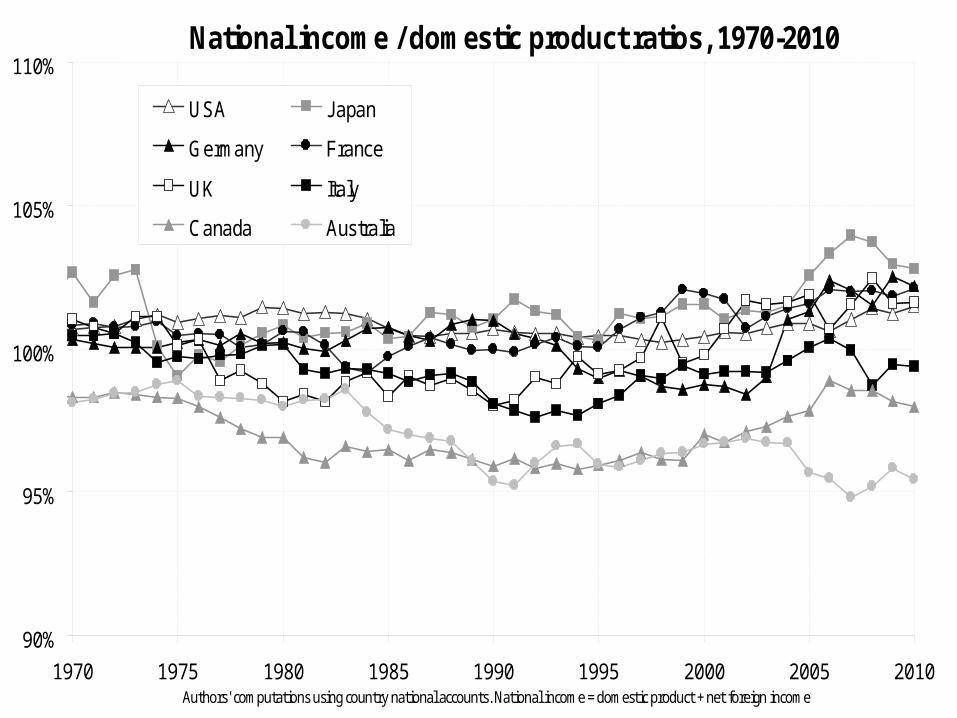
National income / domestic product ratios, 1970-2010
90%
95%
100%
105%
110%
1970 1975 1980 1985 1990 1995 2000 2005 2010Authors' computations using country national accounts. National income = domestic product + net foreign income
USA Japan
Germany France
UK Italy
Canada Australia
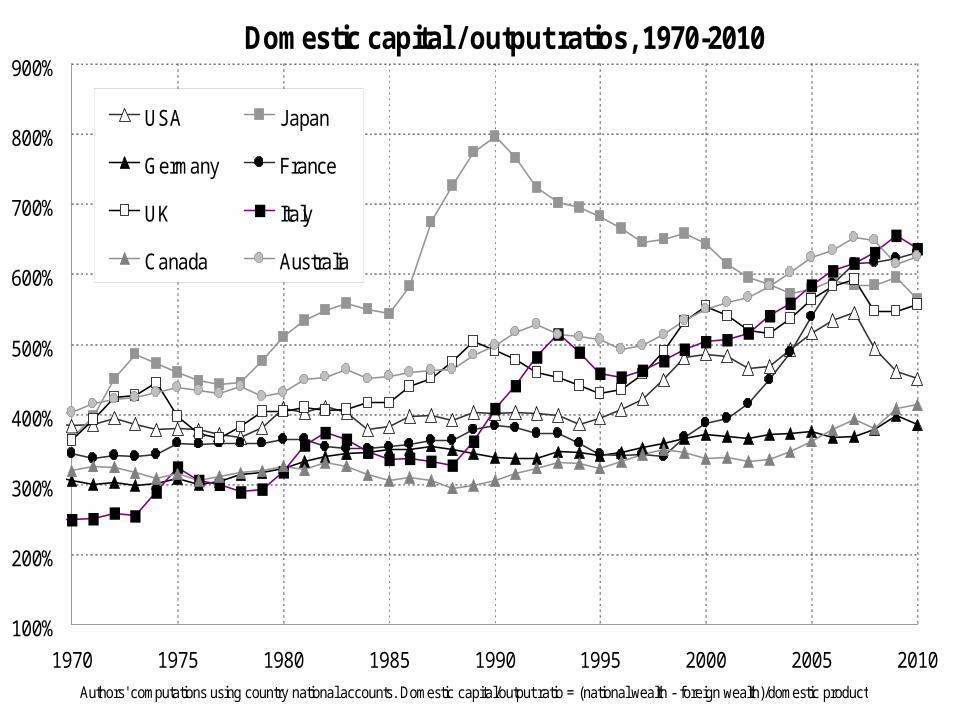
Domestic capital / output ratios, 1970-2010
100%
200%
300%
400%
500%
600%
700%
800%
900%
1970 1975 1980 1985 1990 1995 2000 2005 2010
Authors' computations using country national accounts. Domestic capital/output ratio = (national wealth - foreign wealth)/domestic product
USA Japan
Germany France
UK Italy
Canada Australia
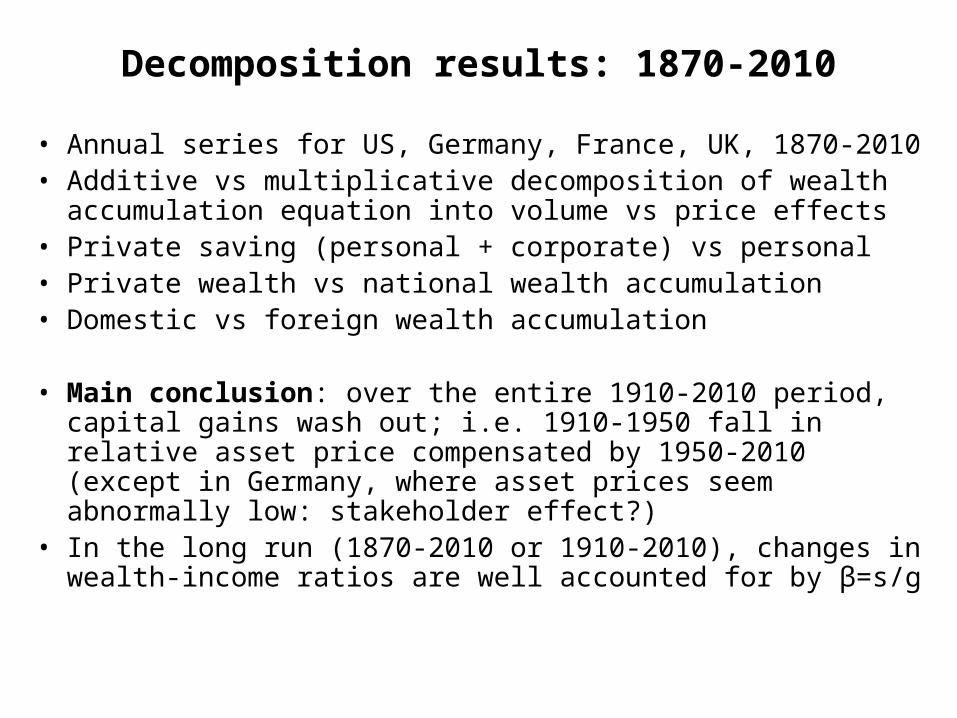
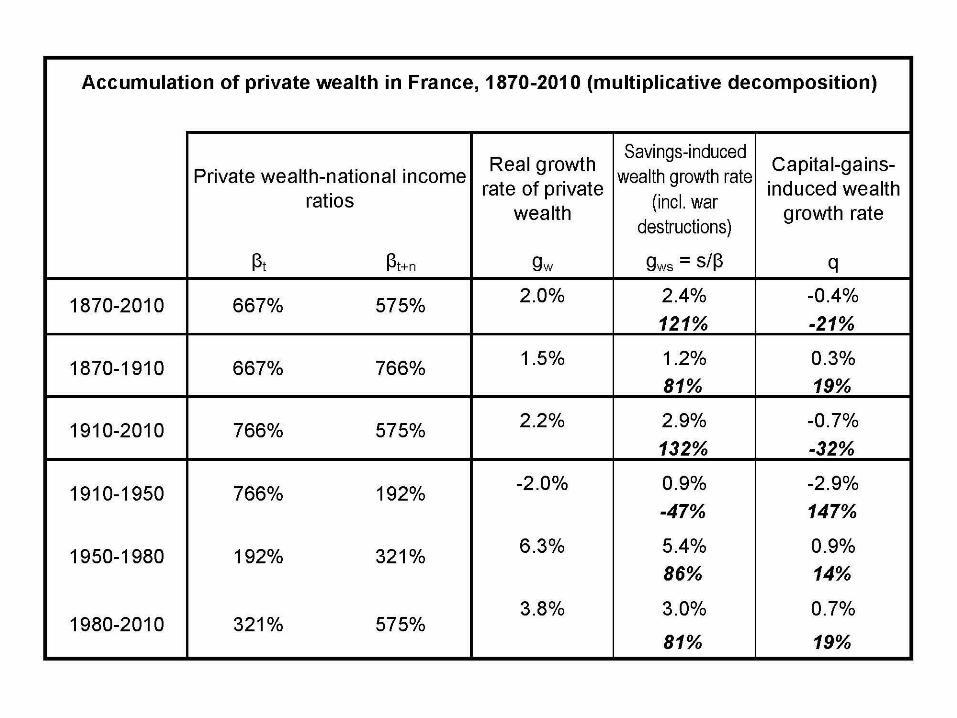
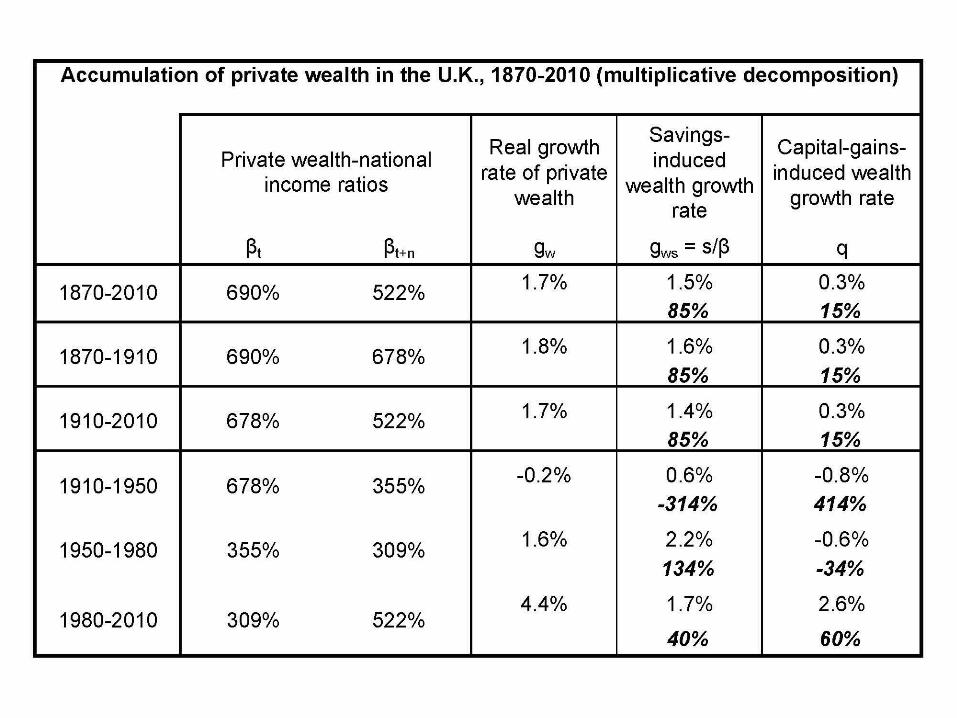
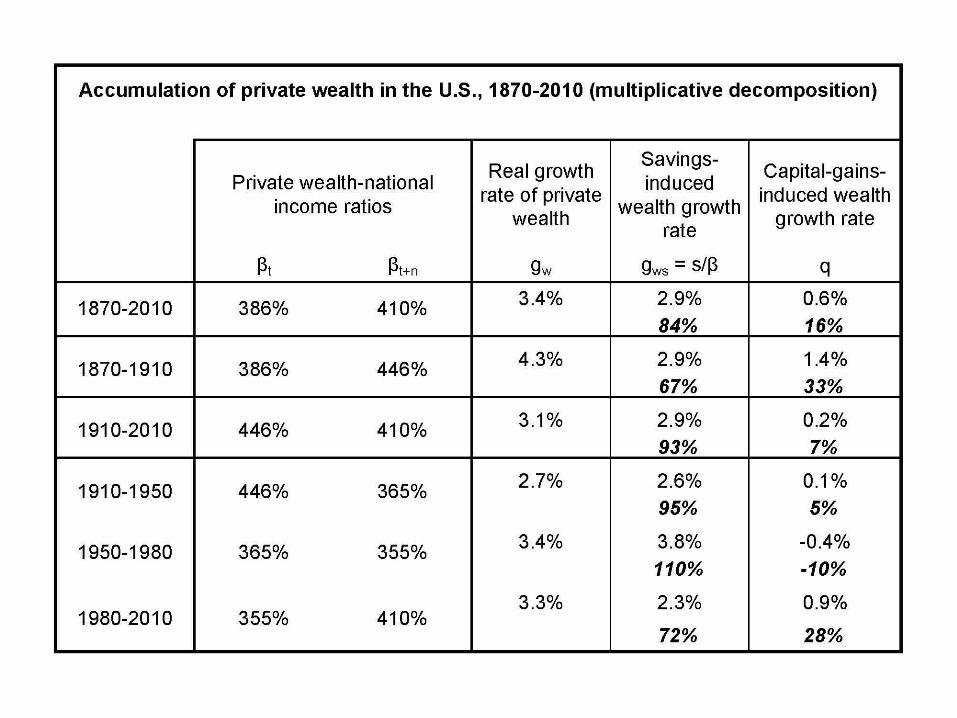
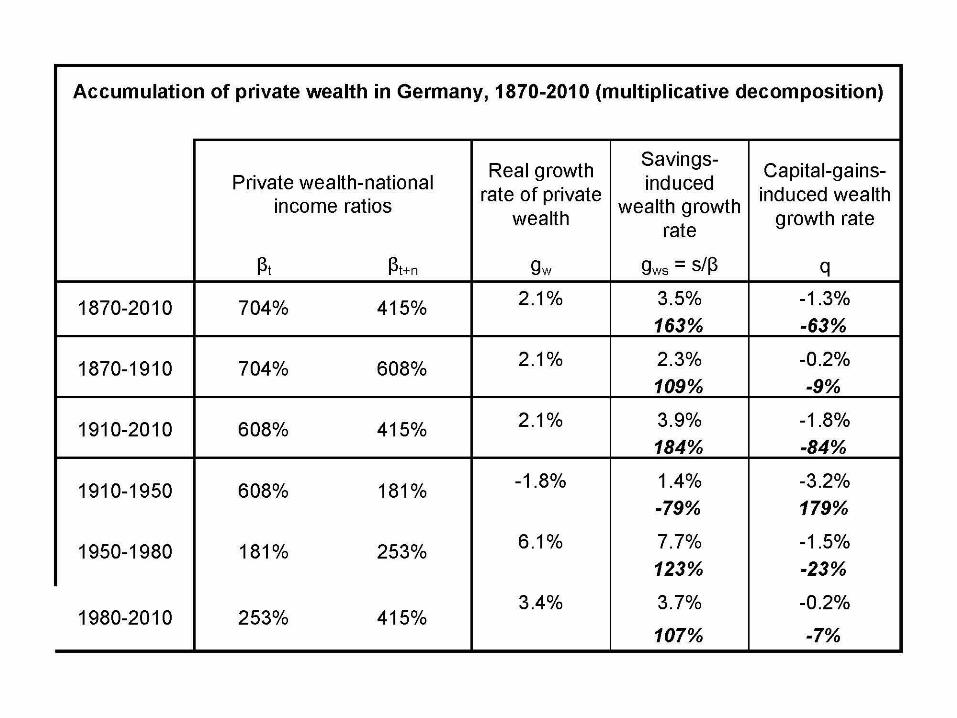
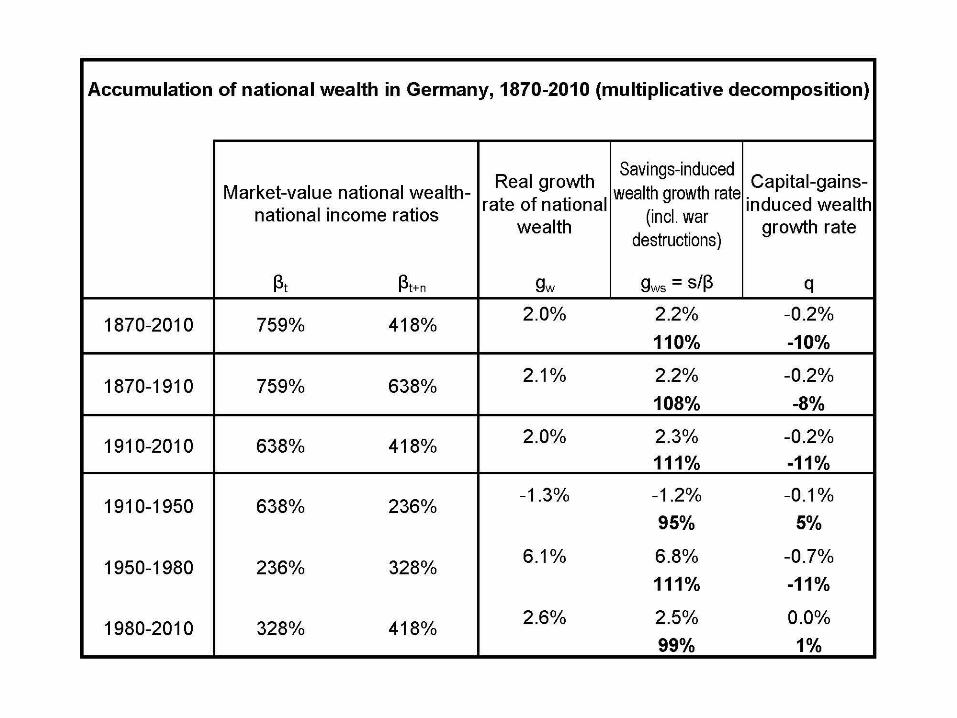
Decomposition results: 1870-2010
• Annual series for US, Germany, France, UK, 1870-2010• Additive vs multiplicative decomposition of wealth
accumulation equation into volume vs price effects• Private saving (personal + corporate) vs personal• Private wealth vs national wealth accumulation• Domestic vs foreign wealth accumulation
• Main conclusion: over the entire 1910-2010 period, capital gains wash out; i.e. 1910-1950 fall in relative asset price compensated by 1950-2010 (except in Germany, where asset prices seem abnormally low: stakeholder effect?)
• In the long run (1870-2010 or 1910-2010), changes in wealth-income ratios are well accounted for by β=s/g

Private wealth / national income ratios in Europe, 1870-2010
100%
200%
300%
400%
500%
600%
700%
800%
1870 1890 1910 1930 1950 1970 1990 2010Authors' computations using country national accounts. Private wealth = non-financial assets + financial assets - financial liabilities (household & non-profit sectors)
Germany
France
UK

Private wealth / national income ratios 1870-2010
100%
200%
300%
400%
500%
600%
700%
800%
1870 1890 1910 1930 1950 1970 1990 2010Authors' computations using country national accounts. Private wealth = non-financial assets + financial assets - financial liabilities (household & non-profit sectors)
USA
Europe
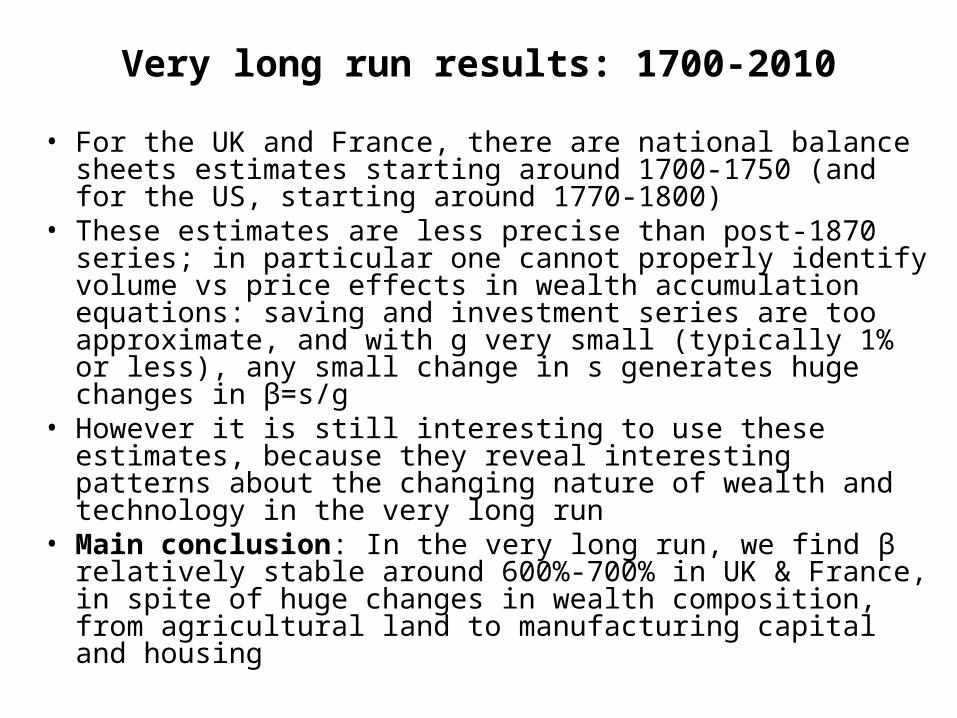
Very long run results: 1700-2010
• For the UK and France, there are national balance sheets estimates starting around 1700-1750 (and for the US, starting around 1770-1800)
• These estimates are less precise than post-1870 series; in particular one cannot properly identify volume vs price effects in wealth accumulation equations: saving and investment series are too approximate, and with g very small (typically 1% or less), any small change in s generates huge changes in β=s/g
• However it is still interesting to use these estimates, because they reveal interesting patterns about the changing nature of wealth and technology in the very long run
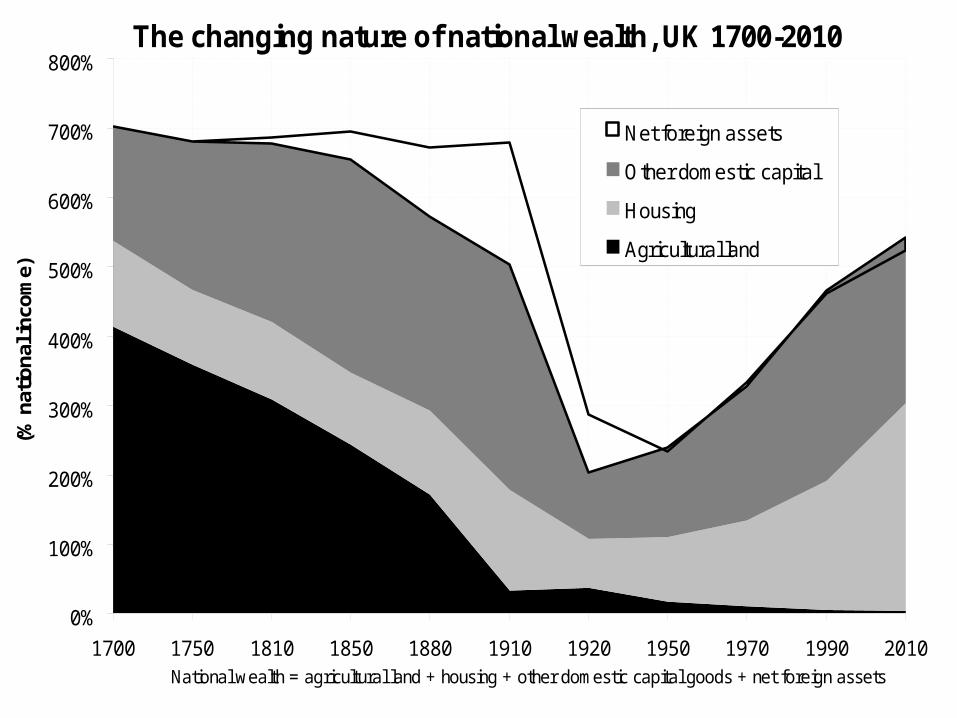
• Main conclusion: In the very long run, we find β relatively stable around 600%-700% in UK & France, in spite of huge changes in wealth composition, from agricultural land to manufacturing capital and housing

The changing nature of national wealth, UK 1700-2010
0%
100%
200%
300%
400%
500%
600%
700%
800%
1700 1750 1810 1850 1880 1910 1920 1950 1970 1990 2010National wealth = agricultural land + housing + other domestic capital goods + net foreign assets
(% n
atio
nal
inco
me)
Net foreign assets
Other domestic capital
Housing
Agricultural land
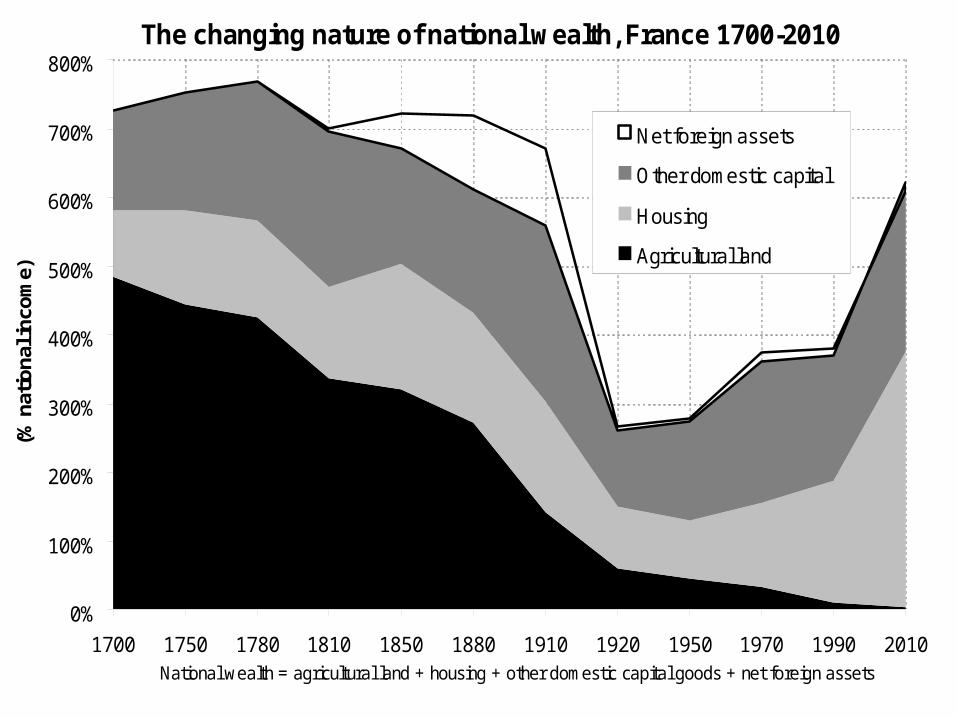
The changing nature of national wealth, France 1700-2010
0%
100%
200%
300%
400%
500%
600%
700%
800%
1700 1750 1780 1810 1850 1880 1910 1920 1950 1970 1990 2010National wealth = agricultural land + housing + other domestic capital goods + net foreign assets
(% n
atio
nal
inco
me)
Net foreign assets
Other domestic capital
Housing
Agricultural land
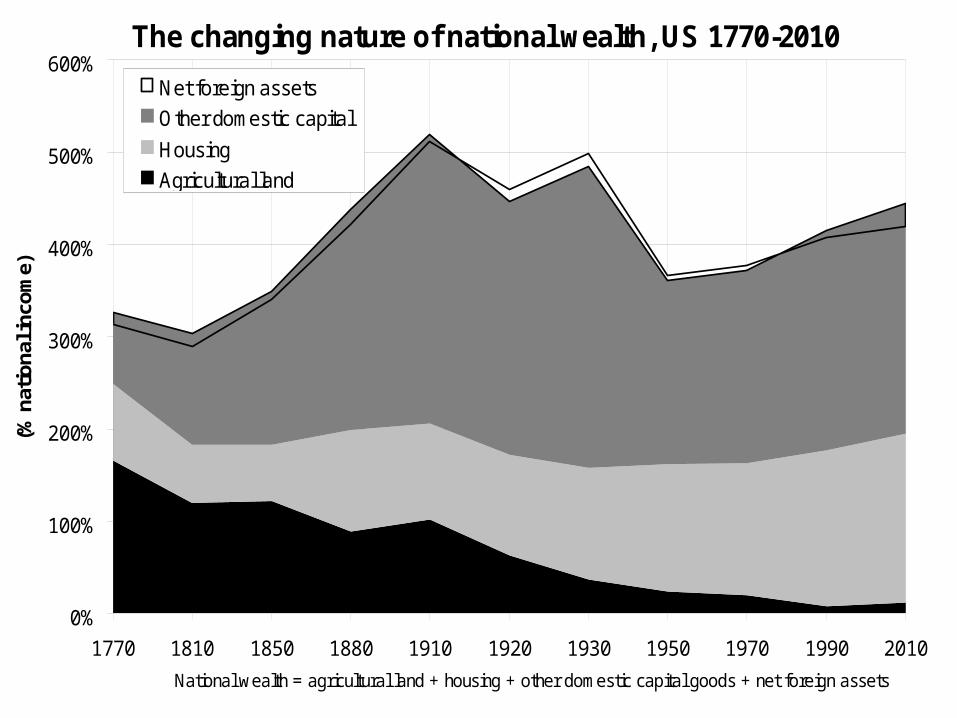
The changing nature of national wealth, US 1770-2010
0%
100%
200%
300%
400%
500%
600%
1770 1810 1850 1880 1910 1920 1930 1950 1970 1990 2010
National wealth = agricultural land + housing + other domestic capital goods + net foreign assets
(% n
atio
nal
inco
me)
Net foreign assets
Other domestic capital
Housing
Agricultural land
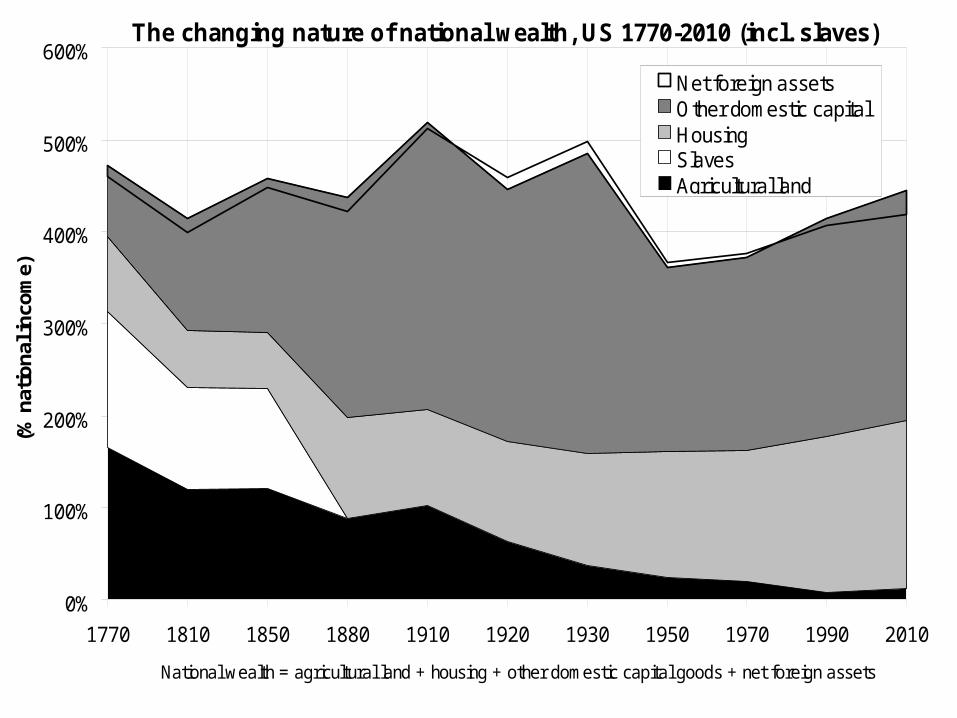
The changing nature of national wealth, US 1770-2010 (incl. slaves)
0%
100%
200%
300%
400%
500%
600%
1770 1810 1850 1880 1910 1920 1930 1950 1970 1990 2010
National wealth = agricultural land + housing + other domestic capital goods + net foreign assets
(% n
atio
nal
inco
me)
Net foreign assetsOther domestic capitalHousingSlavesAgricultural land
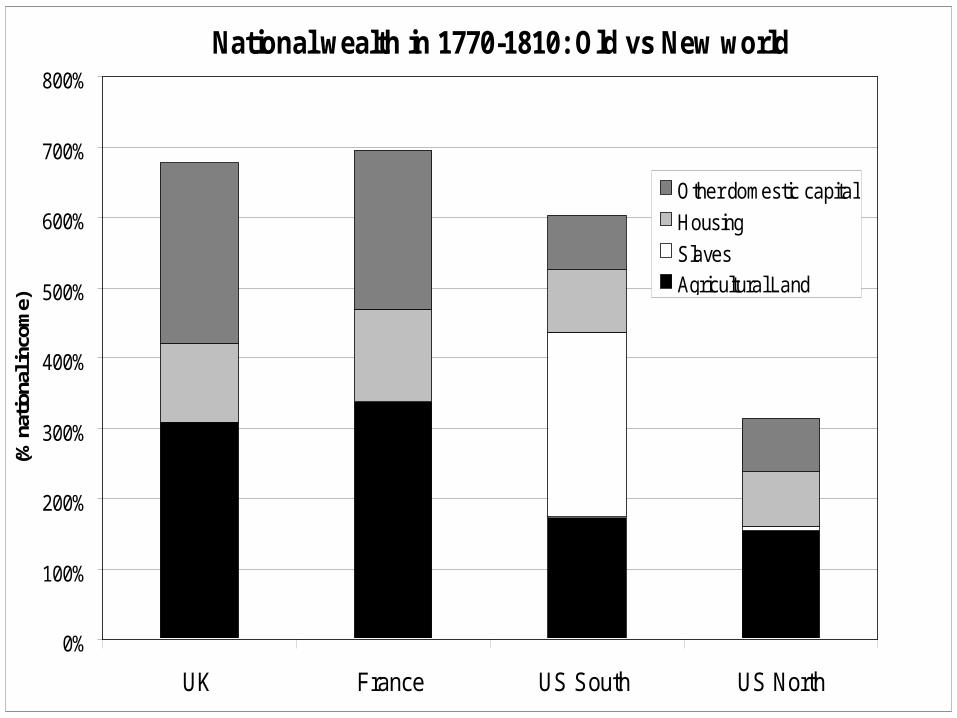
National wealth in 1770-1810: Old vs New world
0%
100%
200%
300%
400%
500%
600%
700%
800%
UK France US South US North
(% n
atio
nal i
ncom
e)
Other domestic capital
Housing
SlavesAgricultural Land
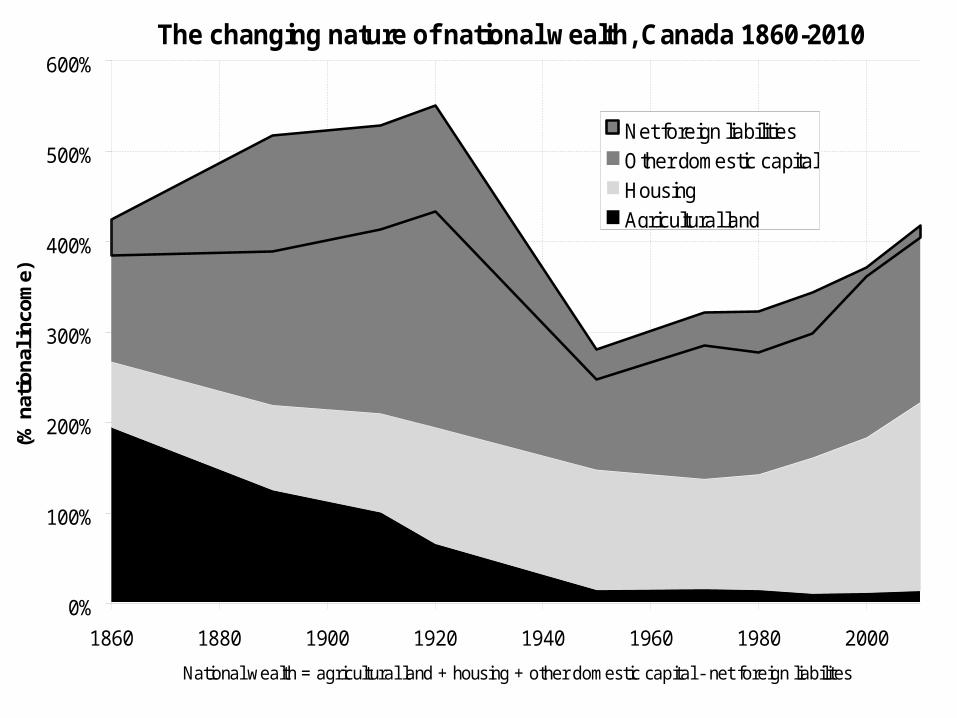
The changing nature of national wealth, Canada 1860-2010
0%
100%
200%
300%
400%
500%
600%
1860 1880 1900 1920 1940 1960 1980 2000
National wealth = agricultural land + housing + other domestic capital - net foreign liabilites
(% n
atio
nal
inco
me)
Net foreign liabilitiesOther domestic capitalHousingAgricultural land
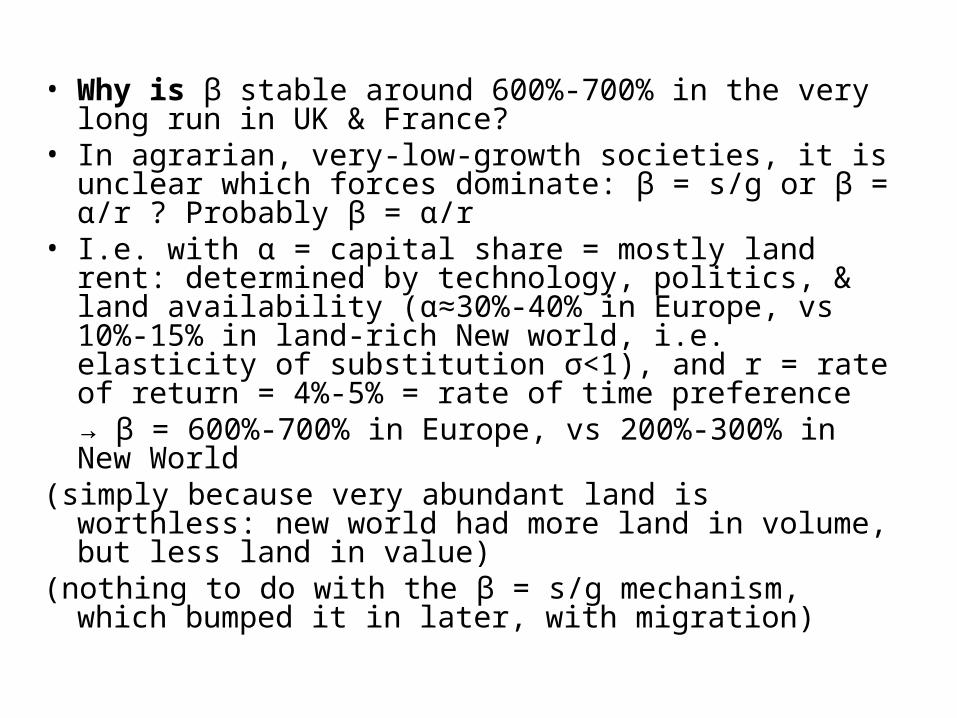
• Why is β stable around 600%-700% in the very long run in UK & France?
• In agrarian, very-low-growth societies, it is unclear which forces dominate: β = s/g or β = α/r ? Probably β = α/r
• I.e. with α = capital share = mostly land rent: determined by technology, politics, & land availability (α≈30%-40% in Europe, vs 10%-15% in land-rich New world, i.e. elasticity of substitution σ<1), and r = rate of return = 4%-5% = rate of time preference
→ β = 600%-700% in Europe, vs 200%-300% in New World
(simply because very abundant land is worthless: new world had more land in volume, but less land in value)
(nothing to do with the β = s/g mechanism, which bumped it in later, with migration)
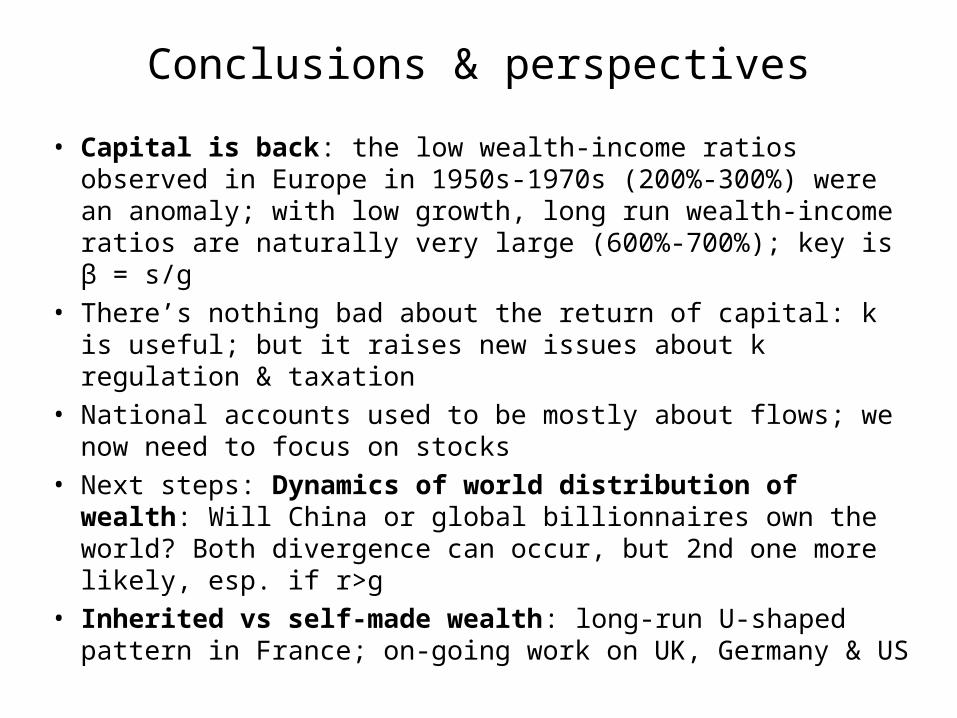
Conclusions & perspectives
• Capital is back: the low wealth-income ratios observed in Europe in 1950s-1970s (200%-300%) were an anomaly; with low growth, long run wealth-income ratios are naturally very large (600%-700%); key is β = s/g
• There’s nothing bad about the return of capital: k is useful; but it raises new issues about k regulation & taxation
• National accounts used to be mostly about flows; we now need to focus on stocks
• Next steps: Dynamics of world distribution of wealth: Will China or global billionnaires own the world? Both divergence can occur, but 2nd one more likely, esp. if r>g
• Inherited vs self-made wealth: long-run U-shaped pattern in France; on-going work on UK, Germany & US
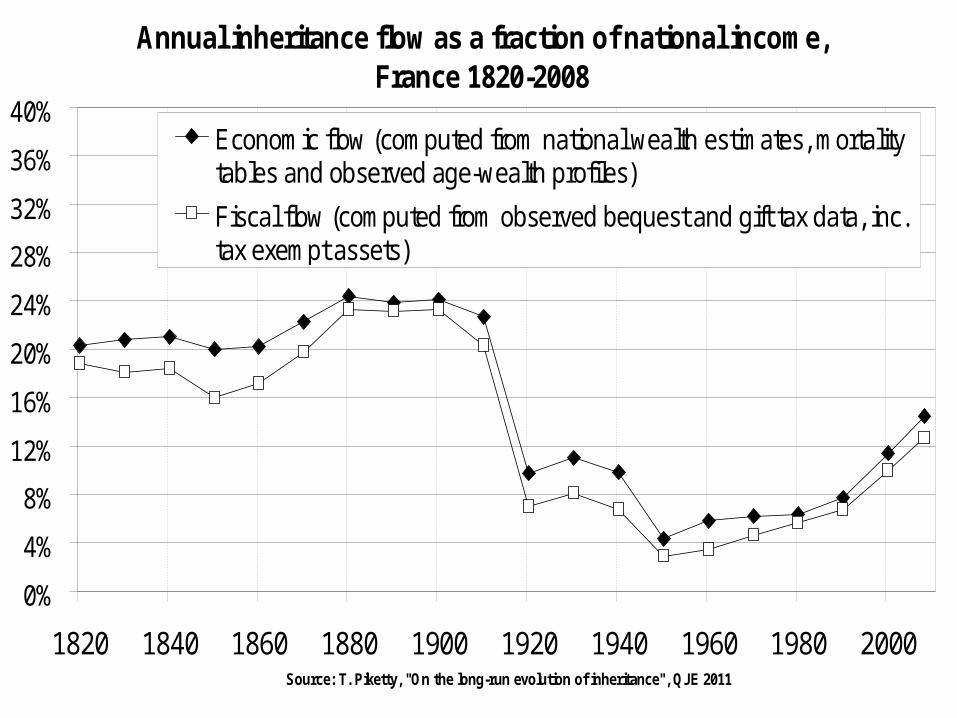
Annual inheritance flow as a fraction of national income, France 1820-2008
0%
4%
8%
12%
16%
20%
24%
28%
32%
36%
40%
1820 1840 1860 1880 1900 1920 1940 1960 1980 2000Source: T. Piketty, "On the long-run evolution of inheritance", QJE 2011
Economic flow (computed from national wealth estimates, mortalitytables and observed age-wealth profiles)
Fiscal flow (computed from observed bequest and gift tax data, inc.tax exempt assets)

Supplementary slides
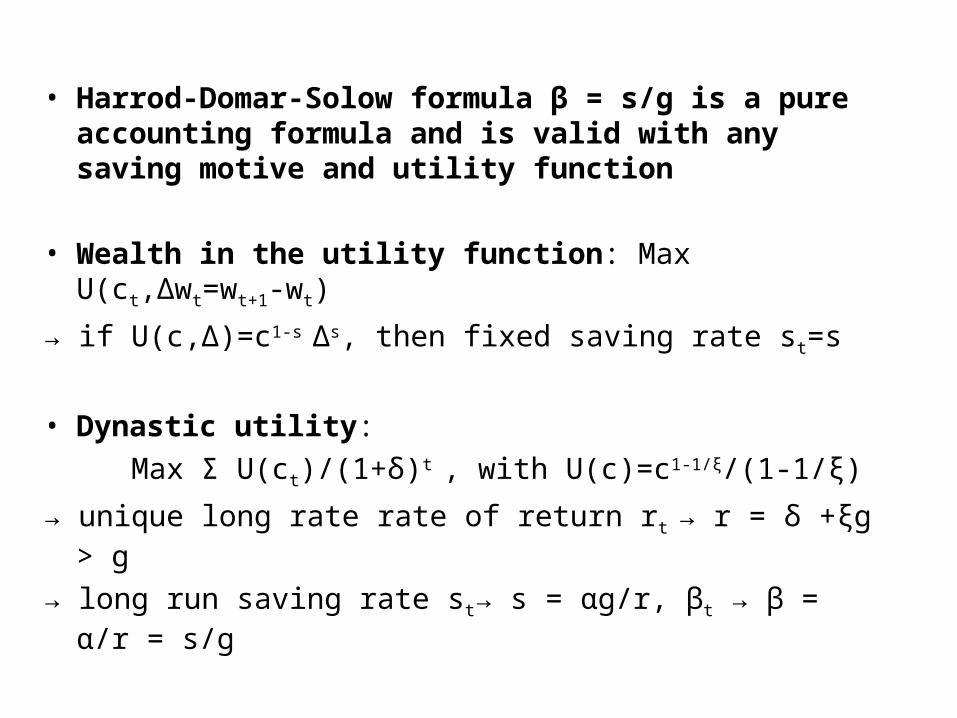
• Harrod-Domar-Solow formula β = s/g is a pure accounting formula and is valid with any saving motive and utility function
• Wealth in the utility function: Max U(ct,Δwt=wt+1-wt)
→ if U(c,Δ)=c1-s Δs, then fixed saving rate st=s
• Dynastic utility:
Max Σ U(ct)/(1+δ)t , with U(c)=c1-1/ξ/(1-1/ξ)
→ unique long rate rate of return rt → r = δ +ξg > g
→ long run saving rate st→ s = αg/r, βt → β = α/r = s/g
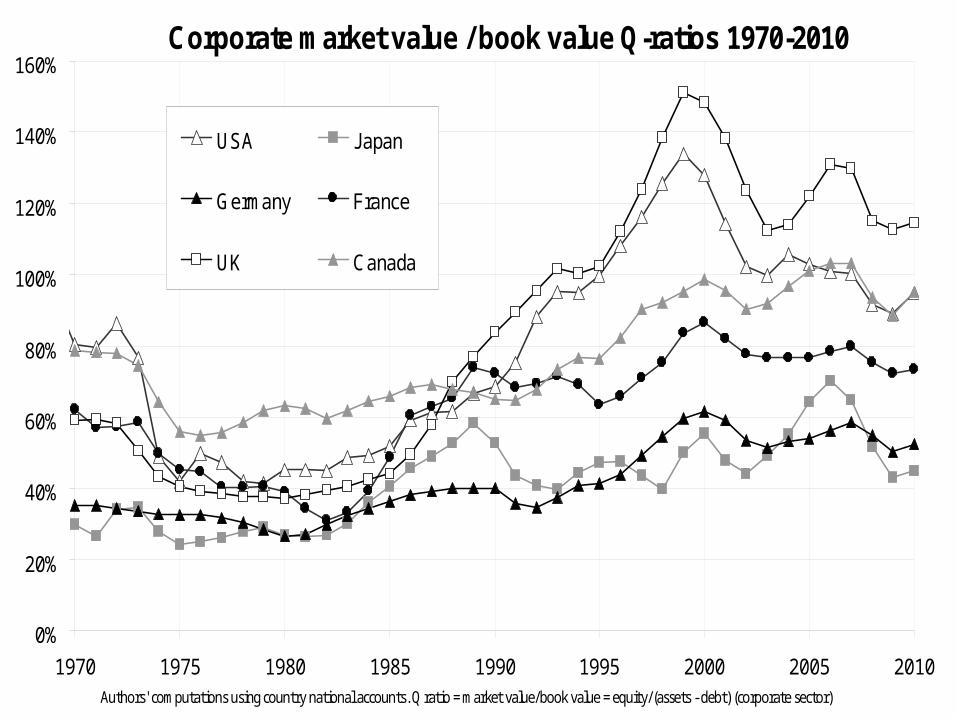
Corporate market value / book value Q-ratios 1970-2010
0%
20%
40%
60%
80%
100%
120%
140%
160%
1970 1975 1980 1985 1990 1995 2000 2005 2010Authors' computations using country national accounts. Q ratio = market value/book value = equity/(assets - debt) (corporate sector)
USA Japan
Germany France
UK Canada