Embed Size (px)
Citation preview

No 252– March 2017
Capital flow surges and economic growth in sub-Saharan
Africa: Any role for capital controls?
Ibrahim Alley

Editorial Committee
Shimeles, Abebe (Chair) Anyanwu, John C. Faye, Issa Ngaruko, Floribert Simpasa, Anthony Salami, Adeleke O. Verdier-Chouchane, Audrey
Coordinator
Salami, Adeleke O.
Copyright © 2017 African Development Bank Headquarter Building Rue Joseph Anoma 01 BP 1387, Abidjan 01 Côte d'Ivoire E-mail: [email protected]
Rights and Permissions
All rights reserved.
The text and data in this publication may be
reproduced as long as the source is cited.
Reproduction for commercial purposes is
forbidden.
The Working Paper Series (WPS) is produced by the
Macroeconomics Policy, Forecasting and Research
Department of the African Development Bank. The
WPS disseminates the findings of work in progress,
preliminary research results, and development
experience and lessons, to encourage the exchange
of ideas and innovative thinking among
researchers, development practitioners, policy
makers, and donors. The findings, interpretations,
and conclusions expressed in the Bank’s WPS are
entirely those of the author(s) and do not
necessarily represent the view of the African
Development Bank, its Board of Directors, or the
countries they represent.
Working Papers are available online at
http:/www.afdb.org/
Correct citation: Alley, Ibrahim (2017), Capital flow surges and economic growth in sub-Saharan Africa: Any role for capital
controls?, Working Paper Series N° 252, African Development Bank, Abidjan, Côte d’Ivoire.

Capital flow surges and economic growth in sub-Saharan Africa: Any role for capital controls?
Ibrahim Alleya
a The author would like to express gratitude for valuable comments and suggestions from Jacob Oduor. Other
members of the Macroeconomics Policy, Forecasting and Research Department, African Development Bank,
especially John Anyanwu, Momoudu Sy, Adeleke Salami, Anthony Simpasa and Qingwei Meng are well
appreciated for useful information ans support. Many thanks to Andres Fernandez of Inter-American Development
Bank (IADB) for providing the IMF AREAR documents and technical guidelines used in extending FKRU capital
control dataset for this research.
AFRICAN DEVELOPMENT BANK GROUP
Working Paper No. 252
March 2017
Office of the Chief Economist

Abstract
This study provides explanation for weak
linkage between private capital flows and
economic growth of the sub-Saharan
African region and offers policy
recommendations for stronger linkage
and growth optimization. Estimation of a
simple growth equation shows, in
support of stylized facts, that the flows do
not significantly affect growth. Further
analyses controlling for surge
components of these flows and the effects
of capital controls provides useful
insights. Risk-sharing private capital
(foreign direct investment and equity
capital) proved beneficial in terms of
growth contribution and improved
credit supply while risk-apathetic capital
(bond) harmed growth and weakened
competitiveness. Surges to these flows
imposed costs in terms of growth loss,
reduced credit supply and poor capital
formation. These costs detracted from
the benefits and resulted in the weak
linkage. Capital controls were more
effective at containing surges to risk-
sharing capital and when selectively
targeted. Financial institutions (national
and regional) should be encouraged to
attract more of risk-sharing private
capital to finance the region while
governments should appropriately
target controls to optimise benefits from
the flows.
Keywords: Private capital flows, Shocks, Capita controls, Economic growth
JEL classifications: F21, F32, F36, F38, F41, F43

5
1. Introduction
International capital flows not only offer a great deal of benefits to financially integrated
countries, they also pose numerous macroeconomic challenges (Reinhart and Reinhart, 2008;
Furceri, Guichard and Rusticelli, 2011). While countries with some degrees of financial
openness are able to share income risks with rest of the world, smooth their consumption path
and bridge saving-investment and foreign exchange gaps (Prasad et al., 2003; Chenery and
Strout, 1966; Taylor, 1991; Akinboade, Siebrits and Roussot, 2006), they also face the risks of
having their economies exposed to exogenous shocks transmitted through capital flow
volatility which, in turn, induce domestic instability (Kaminsky, 2005; Fernandez et al., 2015)
and weaken economic growth (Cavallo, 2005).
Capital flows, gross and net, have been generally volatile (Broner et al., 2012; IMF, 2012; Lee,
Park and Byun, 2012) and subject to overshootings, brutal reversal and sudden stops (Boudias,
2014; Broner et al., 2012; Calderon and Kubota, 2011; Agosin and Huaita, 2010; Calvo and
Reinhart, 2000). Financial flows to sub-Saharan Africa (SSA) have not been exceptional:
capital flows to the SSA region are very volatile, and in addition very stupendous relative to
economic sizes of recipients (IMF, 2011). The large inflows of capital into the region are not
unconnected with performance of frontier market in the region. These market have attracted
considerable private capital (bond, equity and direct investment)2 from the rest of the world
(IMF, 2011), especially the advanced countries (Boudias, 2014), due to so many factors. They
are attractive to international investors because relevant financial indicators - e.g. real interest
rates and interest rate spread - in these economies are impressive. With respect to these
indicators, seven selected representative frontier markets (FM73) outperform the major
advanced economies4 (the G7) throughout 1980-2014 period. The rate of inflows of these
private external finances to the FM7 has been explicably larger than to the G75 for the foregoing
reasons.
While these inflows of the private capital should be beneficial to the region from the theoretical
perspective, data suggest a weak linkage between these flows and economic growth6 (Figures
1-4) in the SSA. The figures, which plot the average real GDP growth for each of the FM7
against their inflows of aggregate private capital, foreign direct investment, equity capital and
bond capital respectively in 2003-2008 (pre-financial crisis) and 2009-2013 (post-financial
crisis) periods show that equity capital and bond capital flows are negatively correlated with
growth while FDI and aggregate private capital’s positive correlation with growth are weak
and statistically insignificant.
This study thus re-examines the nexus to unravel the weak linkage between the flows and
economic growth, as well as the disconnect between the theory and empirical evidence, by
controlling for the flow characteristics of private capital in terms of surges to these flows. This
research perspective is informed by the fact that private capital flows are volatile and transmit
disturbances in the origin economies to recipient countries. This perspective is important
because the role of recipient economies’ characteristics such as the absorptive characteristics
2 These capital flows, unlike the official capital flows, are market based in nature and responsive to market
(economic) fundamentals; thus they are our main focus in this study. 3 These frontier markets identified by IMF (2011) are important in terms of size and geographical
representativeness of the sub-Saharan Africa economy, and are covered for analysis in this study. They include
Nigeria Mauritius, Mozambique, Senegal, Tanzania, Uganda and Zambia. 4 See Figure 1 in the section 2 of this article. 5 See figures 2-5 in section 2. 6 See figures 1A-4A in the apendix
6
(IMF, 2011), financial market depth (Klein and Olivei, 2008), and level of economic and
financial sector development (Bailliu, 2000; Edwards, 2001; Arteta et al., 2003) only matter
when the flow patterns of private capital in terms of magnitude and timing are not consistent
with the need and size of the recipient economy7. By controlling for surges to these flows, it
will be possible to determine the true effects of the flows. Then, policy directive regarding what
recipient countries should do in terms of designing and targeting capital controls would be
clear. If a flow is beneficial but its surges are harmful, then, the control should target the surges,
and vice versa. Specifically, this study analyses the effects of the private flows and their surges
(positive and negative) on economic growth directly, and indirectly through capital formation,
credit supply and exchange rate transmission mechanisms. It also assesses the effectiveness of
capital controls in the SSA with respect to managing the surges and any negative growth effects
of capital flows.
The study estimated extended Blanchard et al.’s (2016) growth equations8 for a panel of 25
SSA countries in 2003-2013 period with a System Generalized Methods of Moment
(Sys.GMM) and established that private capital flows had insignificant effects on economic
growth when the effects of surges were not controlled for. Once the surges were accounted for,
equity capital and foreign direct investment (known to share income risks of recipient
economies) had positive effects on economic growth while bond flows (risk-apathetic capital)
exerted negative impact on the economies. Further investigations into these effects show that
risk-sharing capital (equity and direct investment) support credit supply and did not conduce
to loss of international competitiveness by not appreciating the real effective exchange rate
(REER). Bond flows, on the other hand, neither supported capital formation nor credit supply;
rather, they contributed to weakening trade competitiveness by engendering REER
appreciation. Surges to these capital flows negatively affected economic growth and detract
from the positive effects of the flows. This detraction explains the weak linkage between capital
flows and economic growth observed in reality. Capital control measures are found to be
effective in stemming shocks to capital flows and their negative growth effects when carefully
targeted.
This study contributes to the literature in two main ways. It presents evidence on the effects of
surges to capital inflows (measured using methodologies for measuring surges in capital flows
literature) on economic growth of sub-Saharan Africa. Most studies in this strand of literature
rarely focus on the SSA, perhaps due to data issues; and their best shot at the region is to include
one or two SSA countries in their samples (Cardarelli et al., 2010 [South Africa, non-SSA-
Egypt, Morocco, Tunisia]; Gosh et. 2014 [Mauritius, non SSA – Egypt]; Benigno et al, 2015
[Mauritius and South Africa, non-SSA – Egypt, Morroco and Tunisia]). Most others totally
exclude SSA (e.g. Forbes and Warnock, 2012). Thus, this study is a major contribution to
literature on capital flow surges. It is close to Cardarelli et al. (2010) and Caballero (2014) in
that it focuses on surges of private capital flows, and Caballero (2014) and Benigno et. al (2015)
in their measurement of surges. It differs from Caballero (2014) in not examining the effect of
the surges/shocks to private capital on likelihood of banking crises, from Benigno et al. (2015)
7 Felices and Orskaug (2005) note that international capital markets, rather the forces of demand and supply,
arbitrarily allocate capital in ways that may not match with the quantity and timing of capital need of domestic,
capital recipient economy. 8 Simple partial-equilibrium growth equations not derived from optimisation of general equilibrium model was
adopted on the basis cost-benefit comparison. While derived equations estimated in micro-foundation general
equilibrium (GE) models (e. g. Gabaix and Maggiori, 2015) are not significantly different from the simple partial
equilibrium analyses (e. g. Blanchard et al. 2016; Alley, 2015). Besides the latter are more transparent and obviate
the need for calibrations and simulation requisite in many GE models (Korinek, 2014) which rely on many
assumptions about parameters and structural relationships that are difficult to verify (Chetty, 2009).

7
in not examining surges to aggregate capital flows proxied by adjusted current account balance,
and from Forbes and Warnock (2012) and Ghosh et al. (2014) in that it does not focus on
determinants of surges or their probability of occurrence.
Secondly, this study presents evidence on effectiveness of capital controls in managing capital
flows problems facing small open economies, which most SSA countries are. In addition, it
contributes to the literature on capital flows management by extending the Fernandez et al.
(2015) datasets on capital controls to cover 14 additional SSA countries. While this study is
similar to many previous studies on effectiveness of capital control in reducing volume of
surges and composition of flows, it differs from them in use of capital control index that draws
information from individual capital controls.
The rest of the paper is organised as follows. Section 2 presents stylised facts while section 3
briefly reviews related literature. Section 4 discuses methodology and preliminary analyses are
conducted in section 5. Empirical evidence is discussed in section 6 while section 7 offers
concluding remarks and policy lessons.
2. Stylized Facts
The financial performance of SSA, from the perspectives of international investors, has been
impressive. Real interest rates and interest rate spread in the SSA, especially the FM7 are far
higher than in the G79. Many factors are responsible for this differential. Capital stock in
developed economies, the G7 for examples, is far larger than in developing economies like the
SSA10. Hence, the return on capital would be far higher in the latter than in the former. Given
the diminishing return of factor inputs to which production functions are generally subject to,
larger capital stock in the G7, 7
2
Gk , engenders lower return )( 7
2
Gkr because it produces, in
autarky, output 7
2
Gy which is lower than optimal output 7
1
Gy , (figure 11A) 11. On the other
hand, lower capital stock in the FM7 corresponds to higher return on capital )( 7
1
FMkr in figure
10A (appendix).
With financial globalisation, international investors arbitrage and reallocate more capital from
the G7 to the FM7, leading to convergence of interest rates to )( GLOkr which is less than
)( 7
1
FMkr and higher than )( 7
2
Gkr in figure 10. This is expected to lead to growth in both the G7
and FM7 as more capital in the latter leads to higher output level 7
2
FMy (figure 9A) 12 and the
interest income on exported capital (flows to the FM7 from GM7) increase the gross national
income of the former to7
3
Gy on a new income function/path )()( 7
2
7
2
GG kkf .
Evidence on interest rate convergence can be seen in figure 6A (appendix). Though the world
real interest rate data is not available on World Bank WDI database, it is obvious from figure
6A that the gap (divergence) between the real interest rate in FM7 and G7 fell over time. The
rate in both country groups albeit declined in absolute terms, perhaps due to several factors
such as global liquidity, the gap between the real interest rate in FM7 and G7 decline from
about 8.6 in 2002 to about 4.4 in 2014.
9 See figures 5A-7A in the appendix. 10 See figures 8A in the appendix. 11 See appendix 12 See appendix

8
Evidence on reallocation of private capital from the G7 to the FM7 is presented below. Figures
12A-15A (see appendix) highlight the growth rate of FDI, equity capital, debt capital and
aggregate capital inflows to the FM7 and G7 respectively. The figures support the theoretical
prediction in figures 6A-8A in the appendix. The rate at which private capital flows to the FM7
has been higher than to the G7. Though the rate generally fell for both country groups around
2007-2009 global financial crisis, the rate of flow to the FM7 has been larger than to the G7 in
post-crises period. During the crises, the rate of flow to the FM7 is visibly less than to G7 and
this is evident of flight to safety which describes the herd behaviour of international investors
who repatriate their investment from developing, perceptibly riskier, economies to the
developed, perceptibly less risky economies during the crises.
Though capital flows to the SSA (especially the FM7) have been on the rise, neither the region
nor the group appear to achieve growth gains from the flows. This is evident in figures 1A-4A
and figures 16A-19A (see appendix) below.
Figures 16A-19A suggest a weak linkage between growth of private capital inflows to the FM7
and GDP growth in FM7 and the region. While the rate of inflows has been very huge, real
GDP growth rates have been very small. Both the rate of flows and the real GDP growth rates
were affected however by the global financial crises. The weak linkage between the private
capital flows and the real GDP in the region is supported by the correlation matrix in table 1
below. While the correlations between the flows are mostly high, private flows are weakly
correlated with GDP.
Table 1: Correlation Matrix on Private Capital Flows and GDP in FM7 and SSA
FDI EQUITY BOND AGG.
FLOWS
FM7
GDP
SSA
GDP
FDI 1.000
EQUITY 0.610 1.000
BOND 0.467 0.781 1.000
AGG. FLOWS 0.781 0.631 0.739 1.000
FMGDP -0.008 0.257 -0.055 0.423 1.000
SSAGDP 0.282 0.440 0.474 0.161 0.387 1.000
Source: WEO and WDI (2016)
3. Literature Review
This section reviews the literature on capital flows, their effects on the economy and the role
of capital controls in addressing the challenges that accompany international capital flows.
3.1 Capital Flows and Economic Growth
Many of the empirical studies on capital flows and economic growth kick off their analyses
with the assumptions of the neoclassical growth theory13, which they test against empirical
reality. Relying on the assumption of diminishing marginal productivity of capital, the theory
predicts that (developed) countries with large capital stock would pay low return on capital 13 As developed in Solow (1956) and Swan (1956) growth model.

9
while the reverse holds for (developing) countries with lower capital stock (Barro and Salai-
Martin, 1996, Romer, 2012). Thus, in a scenario of financial integration, capital should flow
from developed countries (in the North) to developing countries (in the south), and both
categories of countries benefit as productivity rise in developed countries and developing
countries use the inflow of capital to augment the domestic resources for higher growth. Alley
(2014) provides a graphical analysis of neoclassical theoretic explanation of how capital would
naturally flow from capital surplus country to a capital-deficit one, and how both gain from the
flows. Prasad, Rogoff, Wei and Kose (2003) describe the direct and indirect channels by which
capital flows, in theory, enhance growth of recipient economies.
Testing this prediction has been the main focus of empirical studies. The literature is replete
with many inconclusive findings. Many find evidence in support of the prediction, some no
evidence, while a host of studies find evidence disproving the theory. The bulk of the arguments
in the empirical literature centres around explanations for the contradictory evidences on the
nexus between capital flows and economic growth. Prasad et al (2003) documents how data on
countries’ growth and capital level of financial integration (capital inflows) provide a platform
for mixed evidences reported in several studies. As against the theory’s prediction that capital
flows more to fast-growing economies, less financially integrated14 countries like Mauritius
and Botswana have high per capita GDP growth while more financially integrated countries
like South Africa and Jordan have negative per capita GDP growth. In support of the theory,
on the other hand, more financially integrated countries like Korea, Singapore and Thailand
record super economic growth while economic performance of less financially integrated
countries like Haiti, Niger and Nicaragua is appalling.
Capital flows have been noted to benefit recipient economies by augmenting domestic savings,
lowering the cost of capital owing to better risks allocation, enhancing transfer of technology,
developing the financial sector and inducing better policy formulation (Prasad et al., 2003) as
well as improving welfare by supporting consumption smoothing (Bekeart et. al., 2005). Given
the inherent benefits, capital flows enable the recipient economy to improve its economic
growth. Many other studies (Aizenman, Jinjarak and Park, 2013; Alfaro, Kalemli-Ozcan and
Volosovych, 2011; Kose, Prasad and Terrones, 2009) also agree that international capital flows
positively affect economic growth. For a survey of literature on studies that found positive
evidence for capital flows-growth nexus, see Bunmann, Hermes and Lensink (2013).
Some studies however posit that the positive effects of capital flows are only conditional. Klein
and Olivei’s (2008) show that that the positive effects of capital account liberalisation and the
associated flows on economic growth depend on financial depth. Edwards (2001) and Arteta,
Eichengreen and Wyplosz (2003) find that, conditional upon a significant level of economic
development - specifically financial - capital account openness (and the associated flows)
positively affects growth. In the same vein, Bailliu (2000), on examination of the role of capital
flows on economic growth using data on 40 developing countries, finds that the impact of
capital flows on the economy depends on the level of financial market development: capital
inflows have positive (negative) effect on growth when the country is financially developed
(underdeveloped).
In variance to the foregoing, some studies establish that capital flows do not positively affect
economic growth. Prasad, Rajan and Subramanian (2007) show that capital flows negatively
correlate with growth. The study finds that countries with lower inflows of capital grow more
14 Degree of financial integration is associated with level of capital flows.

10
than those with larger inflows. Gourinchas and Jeanne (2011) also noted that capital flows
correlates with growth, as countries with slower growth attract more flows that faster growth
counterparts. In separate studies, Edison et al. (2002) and Kraay (1998) find that capital flows
do not affect growth at all. A comprehensive survey of literature on similar evidence is
available in Bunmann, Hermes and Lensink (2013).
The divergence between the findings of the studies above may result from the type of flows
analysed. Some studies find that different components of capital flows have different effects
on economic growth. Choong et al’s (2010) show that FDI positively affects growth while
foreign debt and portfolio investment do not. In the same vein, Kose, Prasad and Terrones
(2009) had found that both FDI and portfolio flows enhance total factor productivity growth
(TFP) but foreign debts do not. In their analysis of the impact of capital flows on the economic
growth of one hundred countries over the period of twenty years (1990-2010), Aizenman,
Jinjarak and Park (2013) find that FDI positively influence growth while non-FDI flows
(portfolio investment, debt and equity) do not have significant positive effects on economic
growth other than provision of access to foreign savings.
3.2 Capital Flow Volatility and Economic Growth
Capital flows have been noted to very volatile, and subject to over-shootings, brutal reversal
or sudden stops15 (Broner et al., 2012; Calderon and Kubota, 2011). However, some
components are more volatile than others (Becker and Noone, 2009). Portfolio flows and
foreign debt are generally considered to be the more volatile than FDI (Ferreira and Laux, 2008;
Becker and Noone (2009).
Volatility of capital flows has been noted to have significant negative effects on the economy.
Surges in gross and net capital flows have been associated with exchange rate appreciation,
macroeconomic overheating and inflation assets bubbles, which in turn exacerbates financial
fragilities and credit risks (Ostry et al., 2010). Broner and Rigobon (2004) find that capital
flows volatility is negatively correlated with level of GDP, institutional quality and financial
development. Alfaro, Kalemli-Ozcan and Volosovych (2007) also show that capital flows
volatility is negatively correlated with sound macroeconomic policies and institutional quality.
Broto, Diaz-Cassou and Erce-Dominguez (2008) find that volatility of portfolio flows is
negatively correlated with GDP per capita, its growth, bank sector development and trade
openness. In the same vein, Aizenman and Sushko (2011) as well as Mody and Murshid (2005)
report that portfolio flows have less beneficial effects on the economy than FDI flows because
the former is more volatile. In a panel regression using data on 15 emerging countries from
1991-2011, Converse (2012) finds that while portfolio flow positively affects output but its
volatility reduces output via its dampening effect on investment. Ferreira and Laux (2008)
however disagree. On the basis of their analysis of data on 50 countries including 14 developed
countries between 1988 to 2001, this study show that openness to portfolio flows is conducive
to growth, and that the volatility associated with the flows does not hurt economic growth
because the results are statistical insignificant.
Similarly, capital flow shocks have been established to negatively correlate with economic
growth. Using data on fourteen sub-Saharan African counties in a vector Autoregressive (VAR)
model, Alley and Poloamina (2015) show that shocks to portfolio investment and foreign debt
(bank lending flows) reduce economic growth. The study however finds that shocks to FDI, a 15A sudden stop is conceived in literature as unexpected, persistent and significant reversal of net inflows of
capital.

11
more stable flow with longer maturity, do not. In this same vein, Alley (2014) using Devereux
and Sutherland’s (2011) definition of capital flow shocks, find that shocks to capital flows
detract from economic growth of sub-Saharan African countries.
3.3 Capital Flows Shocks and Capital Controls
Several studies have examined capital flow shocks and capital controls from different
perspectives. While some studies attempt to examine the effectiveness of capital controls in
curbing capital flows shocks - surges, stops, retrenchment and flight - and their probability of
occurrence (Forbes and Warnock, 2012; Ghosh et al., 2014), others seek to analyse the
determinants capital controls deployment (Fratzscher, 2012).
Estimating data on 58 countries in a logistic regression, Forbes and Warnock (2012), find that
capital controls, as well as other domestic factors, do not significantly affect probability that a
country experiences capital flows shocks. The study however finds that global factors, such as
global economic risk (measured by VIX index), global growth increases and regional
contagion, increase the probability that a country experiences capital flow shocks.
Similarly, Ghosh et al. (2014) analysed data on 56 emerging economies to estimate the effects
of global push factors and domestic pull factors on likelihood and magnitude of capital flow
surges. The study finds that both global factors and domestic factors matter for capital flow
surges. Unlike Forbes and Warnock (2012), Ghosh et al. (2014) find that capital controls reduce
the probability and the magnitude of capital flow shocks that a country experiences.
Ostry et al. (2011) examined the effects of capital controls (measured with Schindler (2009)
index) on composition of capital flow, credit boom and foreign exchange lending. The study
finds that capital control measures are effective against credit boom, debt composition and FX
lending. It also finds that maturity composition of capital flows affects growth resilience. While
nonfinancial FDI enhances resilience, debt and financial FDI negatively do because they are
associated with credit booms and growth vulnerabilities (decline in output growth). Ostry, et
al. (2010) however note that the effectiveness of controls in regulating inflows thus depends
on how extensive they are, whether the country maintains the necessary administrative and
institutional infrastructure to enforce the controls, and whether investors have incentives
circumventing them. The study also finds that capital controls negatively correlate with growth
decline and crisis. The study finds that capital controls on total flows, equity investment and
bond inflow reduce probability of growth crises.
Fratzscher (2012) estimated data on 79 countries from 1984 to 2009 to analyse factors that
influence the probability that a country imposes capita controls. The study finds that the
probability is significantly influenced by exchange rate regime, exchange rate volatility and
interest rate differentials. Countries with higher volatility of real effective exchange rate,
undervalued currency, fixed/pegged exchange rate regimes, favourable interest rates
differentials and equity returns volatility are more likely to impose capital controls than others;
while countries that are open to trade, and have well developed financial sector are less likely
to impose controls.
4. Methodology
This section presents the methods employed in analysing the effects of private capital inflows
on the economic growth of SSA, the role of surges to the flows in the growth nexus and the
effectiveness of capital control measures in managing the growth effects of the flows and the
related surges. Data description, measurement and sources are also highlighted.
12
4.1 Theoretical Framework and Model Specification
The neoclassical growth model extended by Alley (2015) to analyze the effects of shocks to
private capital flows on growth of 14 SSA countries provides the theoretical framework. Within
this framework, the Blanchard et al.’s (2016) growth equation (which analyzed the role of bond
and non-bond inflows on growth of 19 emerging economies) was extended to incorporate the
effects of surges to inflows of bond, equity, direct investment and aggregate private capital
flows on economic growth of 25 SSA countries. The effects of capital controls in the growth
nexus are also examined within the extended model.
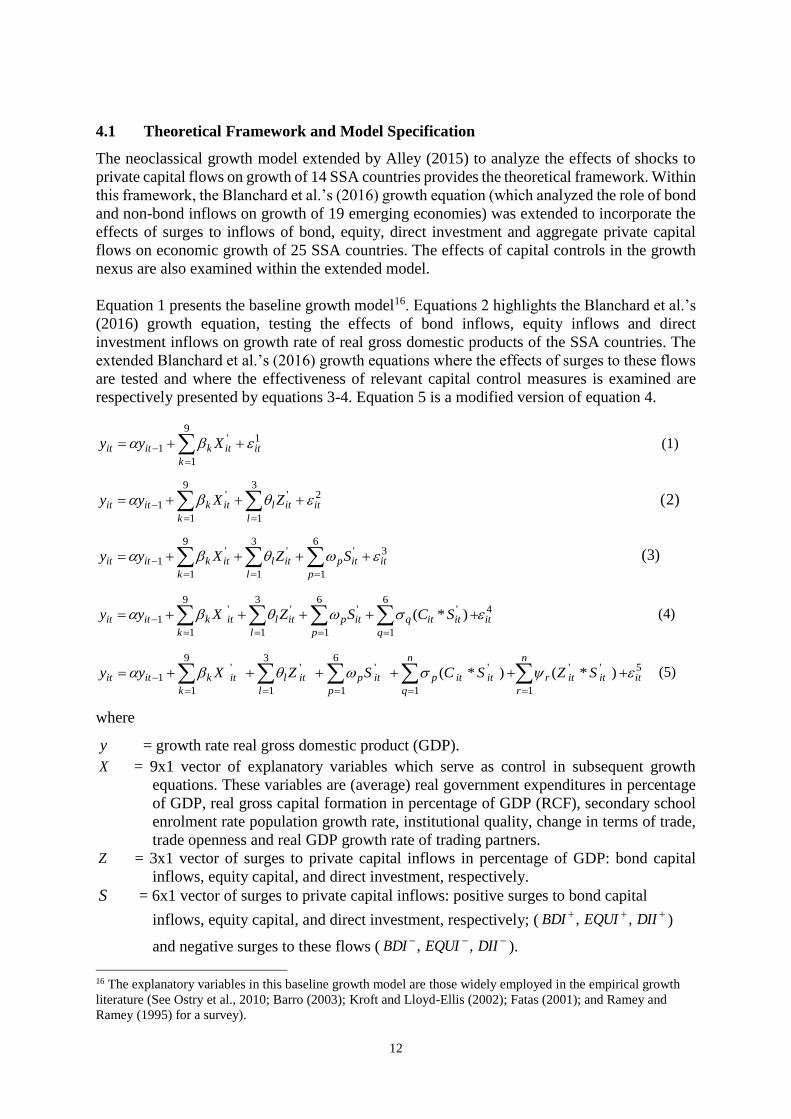
Equation 1 presents the baseline growth model16. Equations 2 highlights the Blanchard et al.’s
(2016) growth equation, testing the effects of bond inflows, equity inflows and direct
investment inflows on growth rate of real gross domestic products of the SSA countries. The
extended Blanchard et al.’s (2016) growth equations where the effects of surges to these flows
are tested and where the effectiveness of relevant capital control measures is examined are
respectively presented by equations 3-4. Equation 5 is a modified version of equation 4.
19
1
'1 it
k
itkitit Xyy
(1)
23
1
'9
1
'1 it
l
itl
k
itkitit ZXyy
)2(
36
1
'3
1
'9
1
'1 it
p
itp
l
itl
k
itkitit SZXyy
)3(
46
1
'6
1
'3
1
'9
1
'1 )*( it
q
ititq
p
itp
l
itl
k
itkitit SCSZXyy
(4)
5
1
''
1
'6
1
'3
1
'9
1
'1 )*()*( it
n
r
ititr
n
q
ititp
p
itp
l
itl
k
itkitit SZSCSZXyy
(5)
where
y = growth rate real gross domestic product (GDP).
X = 9x1 vector of explanatory variables which serve as control in subsequent growth
equations. These variables are (average) real government expenditures in percentage
of GDP, real gross capital formation in percentage of GDP (RCF), secondary school
enrolment rate population growth rate, institutional quality, change in terms of trade,
trade openness and real GDP growth rate of trading partners.
Z = 3x1 vector of surges to private capital inflows in percentage of GDP: bond capital
inflows, equity capital, and direct investment, respectively.
S
= 6x1 vector of surges to private capital inflows: positive surges to bond capital
inflows, equity capital, and direct investment, respectively; ( DIIEQUIBDI ,, )
and negative surges to these flows ( DIIEQUIBDI ,, ).
16 The explanatory variables in this baseline growth model are those widely employed in the empirical growth
literature (See Ostry et al., 2010; Barro (2003); Kroft and Lloyd-Ellis (2002); Fatas (2001); and Ramey and
Ramey (1995) for a survey).

13
C =6x1 vector of capital controls on positive surges ),,( DIIEQUIBDI ContrlContrlContrl
and negative surges ),,( DIIEQUIBDI ContrlContrlContrl
= error terms, as captured in the equations.
Equations 6-9 below replicate equations 2-5 for aggregate capital inflows. The equations are
the only but representation of the nexus between real economic growth rate, aggregate inflows,
related surges and capital controls.
6'9
1
'1 ititl
k
itkitit KXyy
)6(
72
1
''9
1
'1 it
p
itpitl
k
itkitit GSKXyy
)7(
82
1
'2
1
''9
1
'1 )*( it
q
ititqq
p
itpitl
k
itkitit GSLGSKXyy
)8(
9
1
'2
1
'2
1
''9
1
'1 )*()*( it
n
r
ititr
q
ititqq
p
itpitl
k
itkitit GSKGSLGSKXyy
)9(
where
y = as earlier denoted.
X = as earlier denoted.
K = aggregate private capital inflows (KAI).
GS = 2x1 vector of surges to aggregate private capital inflows: positive surges and negative
surges to these flows KAI and KAI respectively. L =2x1 vector of capital controls on positive surges and negative surges respectively
KAIContrl and KAIContrl .
= error terms, as captured in the equations
To probe the effects of the capital flows on GDP, this study examines three main transmission
mechanisms: the investment, finance and trade (international competitiveness). Analyzing
these transmission mechanisms entails estimating the effects of the private capital inflows on
real capital formation (investment), credit to the private sector by the financial industry and
real effective exchange rate.
A simple accelerator model (equation 10) was specified as the baseline model for investment
transmission mechanism. This model was then extended to analyse the effects of the private
capital flows on investment in equation (11). Further extensions (equations 12 and 13) examine
the role of surges to these flows and effectiveness of relevant capital control measures in the
nexus between investment, private capital flows and related surges.
103
1
'1 it
k
itkitit PRCFRCF
)10(
113
1
3
1
'1 it
k
itl
k
itkitit ZPRCFRCF
)11(

14
126
1
'3
1
3
1
'1 it
p
itp
k
itl
k
itkitit SZPRCFRCF
)12(
136
1
'1
6
1
'3
1
3
1
'1 )*( it
q
ititq
p
itp
k
itl
k
itkitit SCSZPRCFRCF
)13(
where
RCF = real capital formation in percentage of GDP
P = 3x1 vector of explanatory variables which serve as control in subsequent capital
formation equations. These variables are change in the natural logarithm of real GDP,
real interest rate and domestic credit availed to the private sector.
= error terms, as captured in the equations
Others = as earlier defined.
The financial transmission mechanism is exploited by estimating equations 14-17 below, with
equation 14 being the baseline equation. Equations 15-17 are extensions where the effects of
capital flows, related surges and capital controls measures are respectively tested.
144
1
'1 itit
k
itkitit IQMDCRDCR
)14(
153
1
4
1
'1 it
k
itl
k
itkitit ZMDCRDCR
)15(
166
1
'3
1
4
1
'1 it
p
itp
k
itl
k
itkitit SZMDCRDCR
)16(
176
1
'1
6
1
'3
1
4
1
'1 )*( it
q
ititq
p
itp
k
itl
k
itkitit SCSZMDCRDCR
)17(
where
DCR = credit availed to the private sector in percentage of GDP
M = 4x1 vector of explanatory variables which serve as control in subsequent capital
formation equations. These variables are change in the natural logarithm of real
GDP, real interest rate and real capital formation and institutional quality. Both real
GDP real capital formation drive the demand for credit availed by the financial
sector. Real interest rate is the real price of credit (and serves as both demand and
supply factor). Institutional quality may also affect credit availed by the financial
sector as this variable affect the property right and other factors affecting credit
expansion.
= error terms, as captured in the equations
Others = as earlier defined.
A rearranged current account equation used in Alley (2016) to explain exchange rate in Nigeria
was extended, using the optimal current account deficit equation of Ghosh et al.’s (2014). This
extended equation (18) serves as the baseline model, and further extensions (equations 19-21)
were employed to capture the effects of capital flows, surges to these flows and capital flow
controls on the real effective exchange rate in the SSA countries.
189
1
'1 it
k
itkitit WREERREER
)18(

15
193
1
'9
1
'1 it
l
itl
k
itkitit ZWREERREER
)19(
206
1
'3
1
'9
1
'1 it
p
itp
l
itl
k
itkitit SZWREERREER
)20(
216
1
''6
1
'9
1
'1 )*( it
q
ititq
p
itp
k
itkitit SCSWREERREER
)21(
where:
REER = real effective exchange rate
W = 9x1 vector of explanatory variables which serve as control in subsequent growth
equations. These variables are natural logarithms of real GDP, real government
expenditures, real capital formation, change in terms of trade, trade openness and
trade partners’ growth rate.
= error terms, as captured in the equations
Others = as earlier defined.
The effectiveness of capital control measures in curtailing surges to private capital flows was
analysed using equations 22-25 below
nitititp
k
itkitit cxRxx
)*( '6
1
'1 )22(
where
x = each member of the vector S above.
R = 6x1 vector of explanatory variables which serve as control in subsequent growth
equations. These variables are real GDP growth rate, real interest rate institutional
qualities (all three being domestic variables) foreign interest rates, VIX and trade
partners growth rate (foreign variables).
Z = 3x1 vector of surges to private capital inflows in percentage of GDP: bond capital inflows,
equity capital, and direct investment, respectively.
c = each member of the vector C above that corresponds to x above
= error terms, as captured in the equations
4.2 Data
Data on relevant variables for 25 SSA countries from 2003 to 2013 were employed, based on
data availability. Data on private capital flows (bond capital, equity and direct) were collected
from the International Monetary Fund’s (IMF) International Financial Statistics (IFS) and
Balance of Payment (BoP) statistics databases. Surges to capital flows were calculated
following Benigno et al. (2015). This method is standard in determination and measurement of
surges in the literature on capital flows surges. Data on capital flows were scaled by the GDP
and detrended using the Hodrick-Prescott filter. The divergence between the detrended capital
flow series from one standard deviation represents the capital flows surges, which were then
sieved into the positive and the negative. Positive surges occur when the detrended series in
excess of one standard deviation of same series, while negative surges represents the magnitude
by which the detrended series fall short of one standard deviation.
Capital control variables were created for 14 SSA countries, in additions to 11 SSA countries
in our sample which Fernandez et al.’s (2015) dataset covers. The technical guidelines by
16
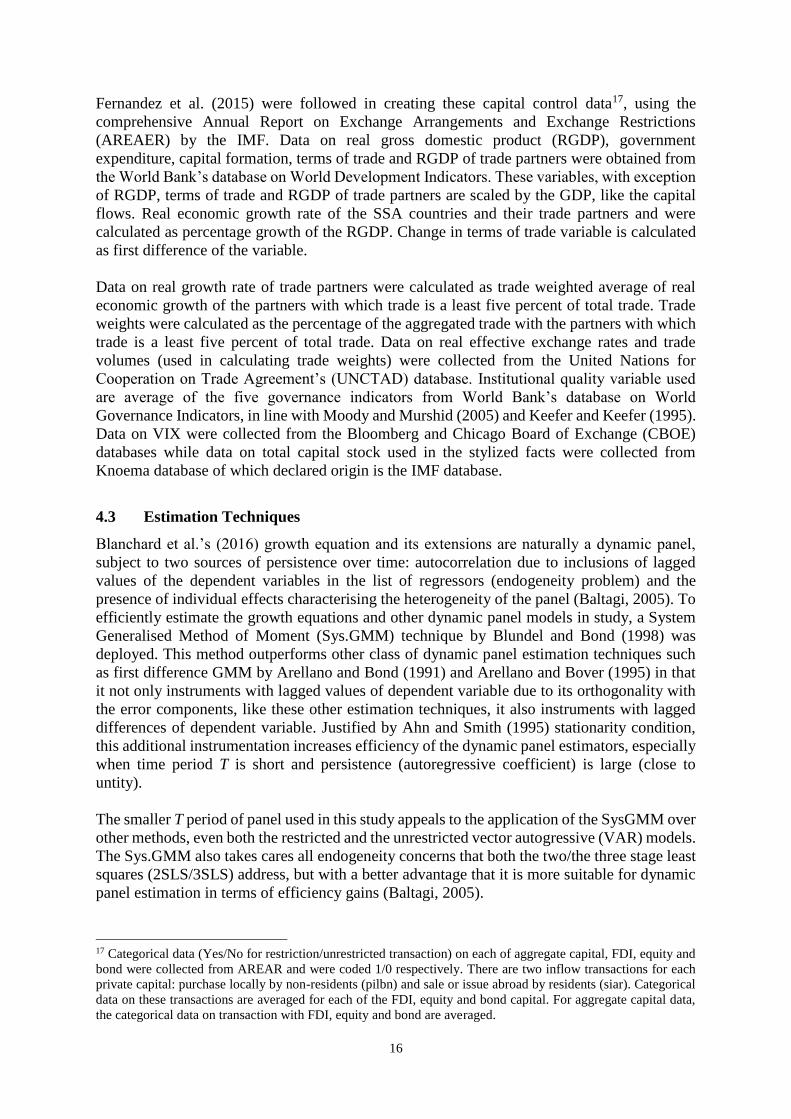
Fernandez et al. (2015) were followed in creating these capital control data17, using the
comprehensive Annual Report on Exchange Arrangements and Exchange Restrictions
(AREAER) by the IMF. Data on real gross domestic product (RGDP), government
expenditure, capital formation, terms of trade and RGDP of trade partners were obtained from
the World Bank’s database on World Development Indicators. These variables, with exception
of RGDP, terms of trade and RGDP of trade partners are scaled by the GDP, like the capital
flows. Real economic growth rate of the SSA countries and their trade partners and were
calculated as percentage growth of the RGDP. Change in terms of trade variable is calculated
as first difference of the variable.
Data on real growth rate of trade partners were calculated as trade weighted average of real
economic growth of the partners with which trade is a least five percent of total trade. Trade
weights were calculated as the percentage of the aggregated trade with the partners with which
trade is a least five percent of total trade. Data on real effective exchange rates and trade
volumes (used in calculating trade weights) were collected from the United Nations for
Cooperation on Trade Agreement’s (UNCTAD) database. Institutional quality variable used
are average of the five governance indicators from World Bank’s database on World
Governance Indicators, in line with Moody and Murshid (2005) and Keefer and Keefer (1995).
Data on VIX were collected from the Bloomberg and Chicago Board of Exchange (CBOE)
databases while data on total capital stock used in the stylized facts were collected from
Knoema database of which declared origin is the IMF database.
4.3 Estimation Techniques
Blanchard et al.’s (2016) growth equation and its extensions are naturally a dynamic panel,
subject to two sources of persistence over time: autocorrelation due to inclusions of lagged
values of the dependent variables in the list of regressors (endogeneity problem) and the
presence of individual effects characterising the heterogeneity of the panel (Baltagi, 2005). To
efficiently estimate the growth equations and other dynamic panel models in study, a System
Generalised Method of Moment (Sys.GMM) technique by Blundel and Bond (1998) was
deployed. This method outperforms other class of dynamic panel estimation techniques such
as first difference GMM by Arellano and Bond (1991) and Arellano and Bover (1995) in that
it not only instruments with lagged values of dependent variable due to its orthogonality with
the error components, like these other estimation techniques, it also instruments with lagged
differences of dependent variable. Justified by Ahn and Smith (1995) stationarity condition,
this additional instrumentation increases efficiency of the dynamic panel estimators, especially
when time period T is short and persistence (autoregressive coefficient) is large (close to
untity).
The smaller T period of panel used in this study appeals to the application of the SysGMM over
other methods, even both the restricted and the unrestricted vector autogressive (VAR) models.
The Sys.GMM also takes cares all endogeneity concerns that both the two/the three stage least
squares (2SLS/3SLS) address, but with a better advantage that it is more suitable for dynamic
panel estimation in terms of efficiency gains (Baltagi, 2005).
17 Categorical data (Yes/No for restriction/unrestricted transaction) on each of aggregate capital, FDI, equity and
bond were collected from AREAR and were coded 1/0 respectively. There are two inflow transactions for each
private capital: purchase locally by non-residents (pilbn) and sale or issue abroad by residents (siar). Categorical
data on these transactions are averaged for each of the FDI, equity and bond capital. For aggregate capital data,
the categorical data on transaction with FDI, equity and bond are averaged.

17
5. Preliminary Analyses
The statistical properties of the data are examined with a view to understanding their behaviour,
requirement for any possible transformation and making an appropriate choice of analytical
techniques for accurate estimation and reliable research findings. Since the time length of the
panels is small, the time series properties such as the unit roots and their cointegrational
properties are of little consequence and are not presented here18.
5.1 Descriptive Analyses and Statistics
Table 1A in the appendix presents the descriptive statistics of the data. The skewness statistics
show that most of the series are positively skewed. This suggests that there are larger than
average countries in the sample, and this is reflected in the Jacque-Bera statistics which show
non-normal distribution. The Kurtosis statistics show that most of the series are platykurtic,
with exception of a few cases. This indicates that the countries are within a small range and are
fairly close to each other in terms of variables’ magnitude. Hence, the effects of non-normal
distribution on pooling for panel estimation are limited.
5.2 Correlation Analyses
Correlation matrix in table 2A of the appendix shows that most of the series are weakly
correlated. Some exceptions such as correlation between government expenditures and capital
formation are due to their own individual correlation with GDP. This is not a problem as these
three series feature simultaneously in equations 1-9 where GDP growth is the dependent
variable: the endogeneity resulting from the correlation of each of the government expenditures
and capital formation with GDP (growth) which underlies correlation between the two
explanatory series is taken care of by the estimation technique. Only bond capital and equity
are moderately correlated and this is due to both being portfolio capital. Neither of the two is
correlated with the FDI. Besides these very few exceptions, virtually all series are weakly
correlated. Hence, likelihood of multicollinearity problem is remote.
6. Empirical Evidence
Evidence on the effects of private capital flows on economic growth and related economic
indicators from a panel of 25 sub-Saharan Africa are presented and discussed in terms of their
economic implications and requirement for policy reactions. The results discussed relate to
various estimation scenarios: when the surges components of the private capital surges are
controlled for, when they are not, when the effects of capital control measures are taken into
consideration, and when not. These results emanate from GMM estimation of equations
specified in the preceding section. The estimations were such that the variances of the equations
are robust to many types of mis-specification. The Arellano-Bond test show that the error are
not correlated and the Sargan tests were not necessary (obtainable) once the variances are
robust. Section 6.1 provides empirical evidence of the growth nexus while sections 6.2, 6.3 and
6.4 highlight the dynamics on capital formation nexus, credit supply nexus, and exchange rate
nexus respectively. Evidence on the effects on capital controls on surges to capital flows is
presented in section 6.5.
18 They are however available and be supplied on request.

18
6.1 Private Capital Related Surges, Capital Controls and Economic Growth
Findings from the baseline regression (equation 1) in table 4 show that lags of real economic
growth rate and institutional quality significantly enhanced growth while capital formation did
not. These results are consistent with findings in Alley (2015) on the effects of lagged values
of economic growth, capital formation and institution quality on current economic growth.
Significance of lagged values of growth to current economic growth indicates persistence and
growth inertia in the region. The fundamentals supporting growth in the previous period still
remained effective in spurring current economic growth. Improvement in institution quality
coming from reduction in corruption, reduction in political instability and improvement in rule
of law, accountability and government effectiveness all bear positively on the region’s
economic growth. The negative effects of capital formation suggest low capital productivity or
poor allocation of investment resources. These results are consistent with findings in Korinek
(2014) and Blanchard et al. (2016). Equity capital had no significant effects.
These results suggest that the surge components of private capital dampened the effects of
private capital inflows on economic growth and explain why they do not have significant
effects in the growth equation 2. These two growth equations 2 and 3 may explain the reality
of the nexus between capital flows and economic growth in the SSA (as shown in figures 1A-
4A and 16A-19A in the appendix); that is, why the region has not really fared well despite large
inflows of private capital. The significance of determinants and other variables in the baseline
equation is preserved in all other growth equations.
All private capital flows - bond capital, equity capital and direct investment capital - had
insignificant effects on economic growth in equation 2 where the effects of surges components
to these flows were not controlled for. Once these surges were accounted for in growth equation
3, bond capital had significantly negative effects while direct investment capital had
significantly positive effects on economic growth.

19
Table 4: Inflows of Bond, Equity and Direct Investment and Real GDP Growth rate in SSA Dependent Variable: Real GDP growth rate (RGDPG)
Series 1 2 3 4 5
lag(RGDPG) 0.203***
(0.000)
0.198***
(0.000)
0.202***
(0.000)
0.187***
(0.000)
0.196***
(0.001)
School enrolment 0.008
(0.672)
0.011
(0.557)
0.001
(0.945)
0.004
(0.850)
0.006
(0.763)
Real govt. expenditure 0.052
(0.683)
0.046
(0.688)
0.049
(0.709)
0.026
(0.842)
0.036
(0.787)
Real capital formation -0.144**
(0.012)
-0.147**
(0.013)
-0.169***
(0.004)
-0.162***
(0.006)
-0.158***
(0.008)
Population growth 1.619
(0.123)
1.185*
(0.091)
2.351**
(0.041)
2.701**
(0.026)
2.805**
(0.019)
Institutional quality 17.738***
(0.000)
17.981***
(0.000)
14.352***
(0.000)
15.917***
(0.000)
15.507***
(0.000)
Change in terms of trade -0.058
(0.127)
-0.061
(0.112)
-0.057
(0.140)
-0.046
(0.266)
-0.044
(0.269)
Trade openness -0.000
(0.893)
-0.000
(0.890)
-0.000
(0.953)
0.000
(0.905)
0.000
(0.933)
Domestic credit -0.027
(0.588)
-0.019
(0.725)
-0.028
(0.591)
-0.021
(0.708)
-0.019
(0.708)
Trade Partners growth rate -0.098
(0.479)
-0.095
(0.499)
-0.131
(0.355)
-0.068
(0.642)
-0.085
(0.560)
Bond inflows (BDI)
-0.368
(0.246)
-1.567***
(0.001)
-1.346***
(0.006)
-1.510*
(0.066)
Equity inflows (EQI)
0.021
(0.844)
-0.079
(0.652)
-0.064
(0.732)
-0.060
(0.739)
Foreign Direct investment (FDI)
-0.007
(0.827)
0.129***
(0.003)
0.129***
(0.004)
0.127***
(0.004)
Positive shocks to BDI (BDI+)
1.580**
(0.018)
1.430
(0.388)
1.516**
(0.026)
Positive shocks to Equity inflows
(EQI+)
-0.181
(0.628)
-0.241
(0.706)
-0.284
(0.706)
Positive shocks to FDI (FDI+) -0.290***
(0.001)
-0.177
(0.117)
-0.166
(0.125)
Negative shocks to BDI 0.420
(0.709)
-0.714
(0.728)
0.493
(0.668)
Negative shocks to Equity inflows
(EQI+)
-0.556*
(0.099)
-1.199
(0.161)
-1.060
(0.208)
Negative shocks to FDI(FDI-)
0.137
(0.113)
0.090
(0.485)
0.090
(0.485)
BDI+ *Control BDI
-1.089
(0.971)
EQI+ *Control EQI
-0.006
(0.996)
DII+ *Control DDI
-0.216
(0.134)
-0.234*
(0.081)
BDI- *Control BDI
3.446
(0.474)
EQI-*Control EQI
0.819
(0.390)
0.648
(0.390)
DII+*Control FDI
0.076
(0.649)
BDI *Control BDI
0.114
(0.937)
Constant 6.173
(0.163)
6.630
(0.145)
-5.876
(0.227)
-8.475
(0.108)
-8.475
(0.108)
Wald Stat 174.57***
177.14***
207.59***
209.86***
207.73***
Arellano-Bond Test 1st Order
2nd Order
-1.215
-0.552
-1.483
-0.680
-1.392
-0.734
-1.526
-0.726
-1.502
-0.626
*, **, *** indicate 10%, 5% and 1% degree of statistical significance respectively, Control** = capital control on flow **
Source: Author’s computation

20
The significant effects of the bond capital and FDI on economic growth may be explained and
understood from two related perspectives: tenure and risk. Bond capital and equity capital are
short term flows while foreign direct investment is of much longer term. Bond capital is a debt
flow, sharing no risk in terms of dependence on states of economic performance. Equity capital
and direct investment capital are however risk-sharing flows whose performance in terms of
total return hinges on states of the economy. The short term riskless flow (bond capital)
negatively affects the economy while the long term risk-sharing flow (FDI) significantly
enhances growth. Equity capital belongs to both classes of flows; hence, the negative aspect of
the short terminal characteristics neutralises the positive effects of the risk-sharing capacities.
It thus has no significant effect on growth.
Positive and negative surges to inflows of private capital have divergent effects on economic
growth. Positive surges to foreign direct investment have negative effects. This may be
explained with the fact that foreign direct investment inflows are large relative to other inflows;
hence positive surges to this capital are correspondingly large and may not be effectively
absorbed and efficiently allocated to the best uses. The surge thus negatively affects on
economic growth. Positive surges to equity capital had no impact on economic growth, possibly
for reason that the regular flows had no significant effect as well. Negative surges to bond
capital and direct investment capital had no effects while negative surges to equity had negative
significant effects on the economy. Sharp declines in equity (denoted by negative surges) may
undermine the optimal finance mix of equity-financed business investments in the region and
this, in turn, negatively affects their profitability and hence economic performance.
When capital controls are selectively targeted at the surges (equation 5, table 4), surges to risk-
sharing capital no longer affect the economy. To this extent, the controls may be said to be
effective. However, the effects of regular flows seem not be affected by capital control. When
the controls are interacted with the flows (equation 5) they don’t change the impacts of the
regular flows on economic growth. Specifically, capital control did not change the negative
effects of bond flows on growth. This suggests that controls targeted at risk-sharing capital,
especially their surges, are more effective than those targeted at bond flows.
Findings on the effects of aggregate flows of capital on economic growth are presented in table
5 below. The effects and statistical significance of growth determinants in growth equations
testing the aggregate flows effects on growth are the same as in baseline equation, as they in
the growth equations involving individual components of private capital flows.
21
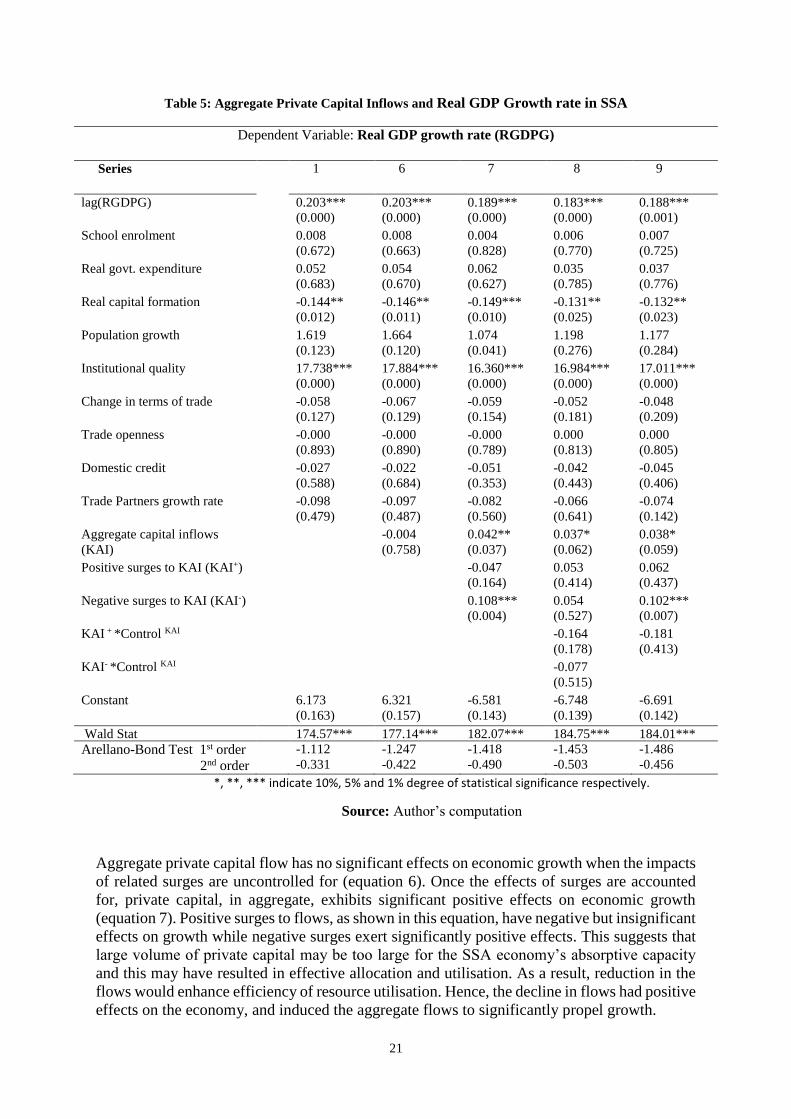
Table 5: Aggregate Private Capital Inflows and Real GDP Growth rate in SSA
Dependent Variable: Real GDP growth rate (RGDPG)
Series 1 6 7 8 9
lag(RGDPG) 0.203***
(0.000)
0.203***
(0.000)
0.189***
(0.000)
0.183***
(0.000)
0.188***
(0.001)
School enrolment 0.008
(0.672)
0.008
(0.663)
0.004
(0.828)
0.006
(0.770)
0.007
(0.725)
Real govt. expenditure 0.052
(0.683)
0.054
(0.670)
0.062
(0.627)
0.035
(0.785)
0.037
(0.776)
Real capital formation -0.144**
(0.012)
-0.146**
(0.011)
-0.149***
(0.010)
-0.131**
(0.025)
-0.132**
(0.023)
Population growth 1.619
(0.123)
1.664
(0.120)
1.074
(0.041)
1.198
(0.276)
1.177
(0.284)
Institutional quality 17.738***
(0.000)
17.884***
(0.000)
16.360***
(0.000)
16.984***
(0.000)
17.011***
(0.000)
Change in terms of trade -0.058
(0.127)
-0.067
(0.129)
-0.059
(0.154)
-0.052
(0.181)
-0.048
(0.209)
Trade openness -0.000
(0.893)
-0.000
(0.890)
-0.000
(0.789)
0.000
(0.813)
0.000
(0.805)
Domestic credit -0.027
(0.588)
-0.022
(0.684)
-0.051
(0.353)
-0.042
(0.443)
-0.045
(0.406)
Trade Partners growth rate -0.098
(0.479)
-0.097
(0.487)
-0.082
(0.560)
-0.066
(0.641)
-0.074
(0.142)
Aggregate capital inflows
(KAI)
-0.004
(0.758)
0.042**
(0.037)
0.037*
(0.062)
0.038*
(0.059)
Positive surges to KAI (KAI+)
-0.047
(0.164)
0.053
(0.414)
0.062
(0.437)
Negative surges to KAI (KAI-)
0.108***
(0.004)
0.054
(0.527)
0.102***
(0.007)
KAI + *Control KAI
-0.164
(0.178)
-0.181
(0.413)
KAI- *Control KAI
-0.077
(0.515)
Constant 6.173
(0.163)
6.321
(0.157)
-6.581
(0.143)
-6.748
(0.139)
-6.691
(0.142)
Wald Stat 174.57*** 177.14*** 182.07***
184.75*** 184.01***
Arellano-Bond Test 1st order
2nd order
-1.112
-0.331
-1.247
-0.422
-1.418
-0.490
-1.453
-0.503
-1.486
-0.456
*, **, *** indicate 10%, 5% and 1% degree of statistical significance respectively.
Source: Author’s computation
Aggregate private capital flow has no significant effects on economic growth when the impacts
of related surges are uncontrolled for (equation 6). Once the effects of surges are accounted
for, private capital, in aggregate, exhibits significant positive effects on economic growth
(equation 7). Positive surges to flows, as shown in this equation, have negative but insignificant
effects on growth while negative surges exert significantly positive effects. This suggests that
large volume of private capital may be too large for the SSA economy’s absorptive capacity
and this may have resulted in effective allocation and utilisation. As a result, reduction in the
flows would enhance efficiency of resource utilisation. Hence, the decline in flows had positive
effects on the economy, and induced the aggregate flows to significantly propel growth.

22
Since the surges to aggregate capital inflows have no significant negative effect on the
economy, there is less worry on the control. However, the insignificant negative effects of
positive surges turned positive with capital controls while the significant positive effects of
negative surges disappeared (equation 8). This means that unfiltered application of capital
control may not be efficient. When selectively applied to check positive surges alone (equation
9), the negative effects of positive surge in equation 7 turn positive while the positive effects
of negative surges to aggregate flows remain.
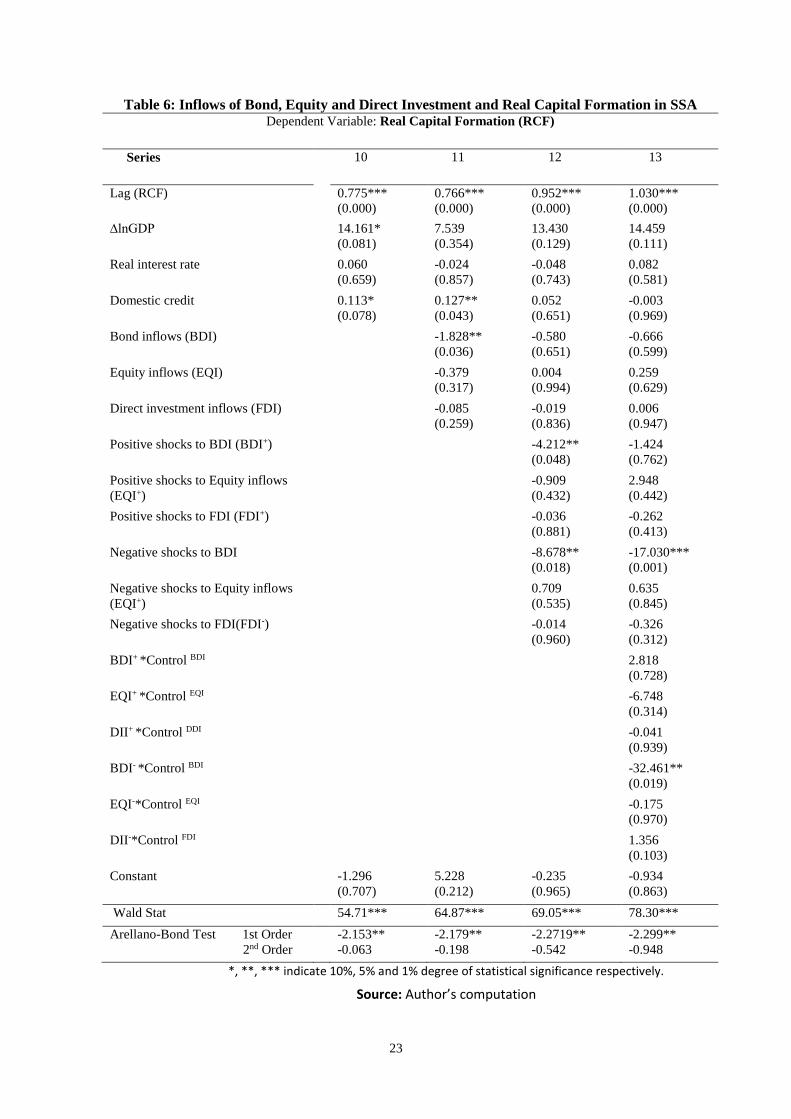
6.2 Private capital flows, related surges, capital controls and Capital Formation
To probe the effects of private capital flows on economic growth, three transmission
mechanisms or pathways were analysed: the capital formation link, the credit growth pathway
and international competitiveness mechanisms. Table 6 below presents the effects of private
flows on capital formation in the SSA.
Besides the persistence in real capita formation - suggesting that fundamental driving capital
formation in the last period are still effective in the current period - difference of natural log of
real GDP and domestic credit exert strongly significant positive effects on real capital
formation in the baseline equation. These results lend credence to the validity of the simple
accelerator model of investment in the SSA. Economic growth and supply of credits are shown
to be supportive for capital formation (investment). The effects of change in real GDP and
domestic credit fade in many other capital formation equations where the effects of private
capital flows are tested. This suggests that private capital flows exert powerful, perhaps
overriding, influence on capital formation.
Equity capital and foreign direct investment bear no significant effects on capital formation in
all the equations, whether or not the surges and capital control effects are accounted for. Bond
flows, on the other hand, had strong significant negative effects on capital formation when the
effects of surges were not controlled for (equation 11). The flow no longer had significant
negative effects on capital formation once the surges were controlled for (equation 12). Both
positive and negative surges to bond capital significantly detract from capital formation.
Capital control measures were only effective in curtailing the negative effects of positive
surges; they were not in case of negative surges (equation 13). This suggests that more controls
are needed against the negative surges of bond capital flows.
23
Table 6: Inflows of Bond, Equity and Direct Investment and Real Capital Formation in SSA Dependent Variable: Real Capital Formation (RCF)
Series 10 11 12 13
Lag (RCF) 0.775***
(0.000)
0.766***
(0.000)
0.952***
(0.000)
1.030***
(0.000)
∆lnGDP 14.161*
(0.081)
7.539
(0.354)
13.430
(0.129)
14.459
(0.111)
Real interest rate 0.060
(0.659)
-0.024
(0.857)
-0.048
(0.743)
0.082
(0.581)
Domestic credit 0.113*
(0.078)
0.127**
(0.043)
0.052
(0.651)
-0.003
(0.969)
Bond inflows (BDI) -1.828**
(0.036)
-0.580
(0.651)
-0.666
(0.599)
Equity inflows (EQI) -0.379
(0.317)
0.004
(0.994)
0.259
(0.629)
Direct investment inflows (FDI) -0.085
(0.259)
-0.019
(0.836)
0.006
(0.947)
Positive shocks to BDI (BDI+) -4.212**
(0.048)
-1.424
(0.762)
Positive shocks to Equity inflows
(EQI+)
-0.909
(0.432)
2.948
(0.442)
Positive shocks to FDI (FDI+) -0.036
(0.881)
-0.262
(0.413)
Negative shocks to BDI
-8.678**
(0.018)
-17.030***
(0.001)
Negative shocks to Equity inflows
(EQI+)
0.709
(0.535)
0.635
(0.845)
Negative shocks to FDI(FDI-)
-0.014
(0.960)
-0.326
(0.312)
BDI+ *Control BDI
2.818
(0.728)
EQI+ *Control EQI
-6.748
(0.314)
DII+ *Control DDI
-0.041
(0.939)
BDI- *Control BDI
-32.461**
(0.019)
EQI-*Control EQI
-0.175
(0.970)
DII-*Control FDI
1.356
(0.103)
Constant -1.296
(0.707)
5.228
(0.212)
-0.235
(0.965)
-0.934
(0.863)
Wald Stat 54.71***
64.87***
69.05***
78.30***
Arellano-Bond Test 1st Order
2nd Order
-2.153**
-0.063
-2.179**
-0.198
-2.2719**
-0.542
-2.299**
-0.948
*, **, *** indicate 10%, 5% and 1% degree of statistical significance respectively.
Source: Author’s computation

24
6.3 Private capital flows, related surges, capital controls and Domestic Credit
Evidence on the effects of determinants of domestic credit supply in the SSA in presented in
table 7 below. The previous value of domestic credit and interest rate are significant in all the
credit equation including the baseline, and these results show that credit formation was
persistent due to the enduring fundamentals and that price of capital (payment on borrowing)
was a critical supply factor in the credit supply nexus.
Table 7: Inflows of Bond, Equity and Direct Investment and Domestic Credit in SSA
Dependent Variable: Domestic Credit (DCRD)
Series 14 15 16 17
Lag (DCRD ) 1.101***
(0.000)
0.930***
(0.000)
0.985***
(0.000)
0.996***
(0.000)
Real capital formation -0.019
(0.799)
0.024
(0.731)
0.013
(0.843)
0.003
(0.953)
∆lnGDP 1.660*
(0.082)
-1.192
(0.220)
-1.124
(0.224)
-1.636*
(0.2069)
Real interest rate 0.291***
(0.000)
0.311***
(0.000)
0.292***
(0.000)
0.291***
(0.000)
Institutional quality -9.761
(0.129)
-11.050*
(0.067)
-8.893
(0.110)
-8.548
(0.118)
Bond inflows (BDI) -0.179
(0.646)
-0.662
(0.201)
-0.876*
(0.079)
Equity inflows (EQI) 0.526**
(0.011)
0.514**
(0.029)
0.445**
(0.051)
Foreign Direct investment (FDI) 0.026
(0.612)
0.014
(0.806)
0.050
(0.345)
Positive shocks to BDI (BDI+) 1.573
(0.154)
1.794
(0.525)
Positive shocks to Equity inflows (EQI+) -2.057***
(0.001)
0.065
(0.974)
Positive shocks to FDI (FDI+)
-0.233
(0.106)
-0.123
(0.488)
Negative shocks to BDI
0.468
(0.814)
3.613
(0.168)
Negative shocks to Equity inflows
(EQI+)
-2.714***
(0.188)
-6.446***
(0.000)
Negative shocks to FDI(FDI-)
0.229
(0.188)
0.026
(0.883)
BDI+ *Control BDI
2.593
(0.266)
EQI+ *Control EQI
-4.114
(0.252)
DII+ *Control DDI
-0.249
(0.401)
BDI- *Control BDI
-9.609
(0.196)
EQI-*Control EQI
6.292**
(0.011)
DII-*Control FDI
-0.207
(0.657)
Constant -34.02
(0.106)
-21.33
(0.319)
-21.68
(0.300)
-35.33*
(0.084)
Wald Stat 2640.95***
(0.000)
3086.79***
(0.000)
3701.67***
(0.000)
4154.74***
(0.000) Arellano-Bond Test 1st Order
2nd Order
-2.114**
-0.709
-2.670***
-0.735
-2.927***
0.747
-2.929***
1.024
*, **, *** indicate 10%, 5% and 1% degree of statistical significance respectively.
Source: Author’s computation

25
Only equity capital had positive and significant effects on domestic credits in all the relevant
credit equations, whether or not the effects of surges and capital controls were controlled for
(equations 15 and 16). Other private capital flows play no significant roles in all the domestic
credit equations except in equation (17) where bond flows had significant negative effect.
These results are consistent with Blanchard et al. (2016) who find that bond flows did not
significantly affect credit formation. In contrast, they find that portfolio equity had insignificant
effects. While we find that FDI did not significantly affect credit formation, Blanchard et al.
(2016) finds that it negatively affects credit supply, with an explanation that some of the
intermediation which would have taken place through banks is now replaced by FDI financing.
The short term nature and the risk-sharing capacity of equity flows may have made the flows
amenable to lending. Compared to bond flow, it is more stable due to risk-sharing nature; and
compared to direct investment, it is of shorter term in nature. Moreover, equity capital flows
through the stock exchange market and end up in banking system as deposit, unlike the direct
investment flows which are expeditiously used up in some business directly by its foreign
owners. These make equity flows more amenable for lending and credit supply.
Both positive and negative surges to equity negatively affect credit supply, and this suggests
that the banking system are not sophisticated enough to handle the surges. While the negative
effects of negative surges to the flows on credit could be explained in terms of supply effects,
the negative effects of positive surges may be due to balance sheet pressure, leading to poor
credit, risk asses losses and reactive caution on credit expansion. With capital controls in place,
the negative effects of the positive surges disappear but those of the negative surges did not:
the negative effects of negative surges to equity capital were so large that capital controls could
not wipe them out completely.
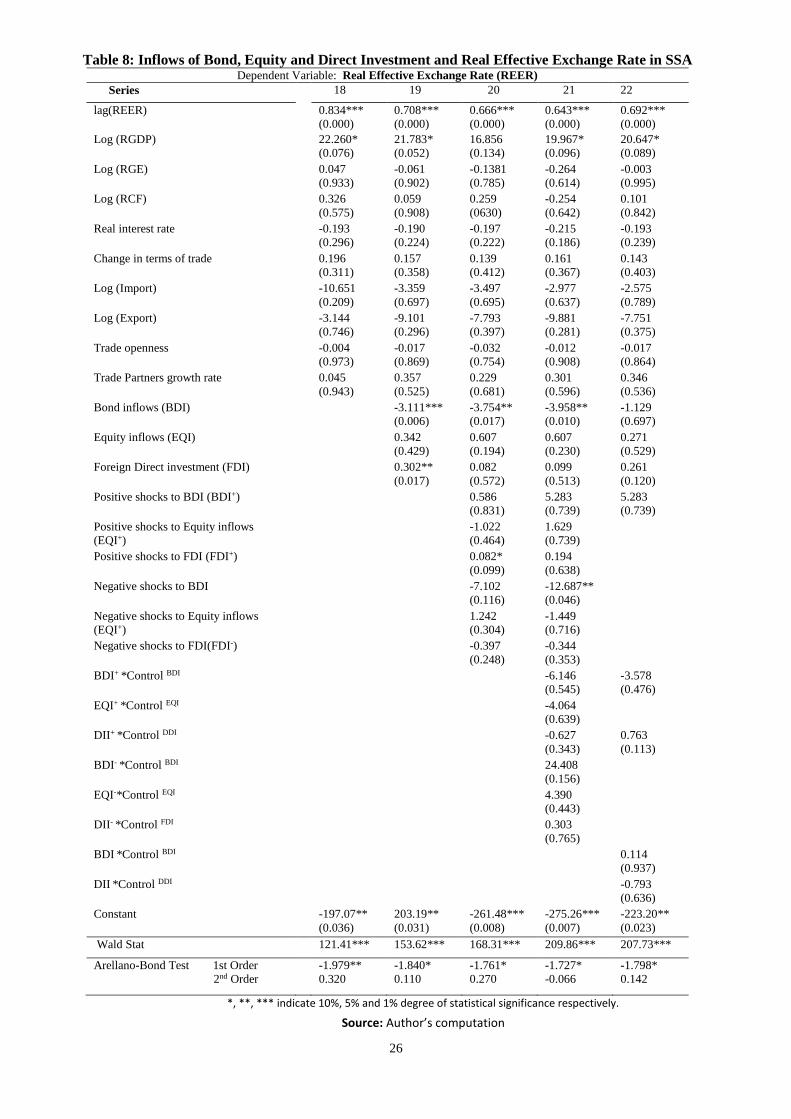
6.4 Private capital flows, related surges, capital controls and real effective exchange
rate
Apart from the previous values of the real exchange rate, only real GDP had positive effects
on real exchange rate in the baseline equation (18). Given the definition of exchange rate as
the trade weighted average price of foreign currency (of trade partners) in domestic currency
in real terms, a positive coefficient denotes that an explanatory variable leads to currency
depreciation while a negative coefficient indicates currency appreciation. The currency
depreciation effects of real GDP can be explained in terms of income effects on import, its
effect on current account balance, and implication for relatively higher demand for foreign
currency; hence, domestic currency depreciates relative to the foreign currencies as real GDP
rises. The effects of real GDP remain significant in all the equations except equation 20. Bond
capital inflows have significant negative effects, showing that real exchange rate significantly
appreciates with inflows of bond capital (equation 19). These effects endured whether or not
surges to these flows were controlled for: bond inflows led to appreciation of domestic currency
when surges were controlled for (equation 20) and when the roles of capital control measures
were accounted for (equation 21). The currency appreciation effect of the bond inflows is
explicable in terms of the financial flows effects (relative currency demand) leading to nominal
exchange rate appreciation, real sector effects and the engendered inflation effects.
26
Table 8: Inflows of Bond, Equity and Direct Investment and Real Effective Exchange Rate in SSA Dependent Variable: Real Effective Exchange Rate (REER)
Series 18 19 20 21 22
lag(REER) 0.834***
(0.000)
0.708***
(0.000)
0.666***
(0.000)
0.643***
(0.000)
0.692***
(0.000)
Log (RGDP) 22.260*
(0.076)
21.783*
(0.052)
16.856
(0.134)
19.967*
(0.096)
20.647*
(0.089)
Log (RGE) 0.047
(0.933)
-0.061
(0.902)
-0.1381
(0.785)
-0.264
(0.614)
-0.003
(0.995)
Log (RCF) 0.326
(0.575)
0.059
(0.908)
0.259
(0630)
-0.254
(0.642)
0.101
(0.842)
Real interest rate -0.193
(0.296)
-0.190
(0.224)
-0.197
(0.222)
-0.215
(0.186)
-0.193
(0.239)
Change in terms of trade 0.196
(0.311)
0.157
(0.358)
0.139
(0.412)
0.161
(0.367)
0.143
(0.403)
Log (Import) -10.651
(0.209)
-3.359
(0.697)
-3.497
(0.695)
-2.977
(0.637)
-2.575
(0.789)
Log (Export) -3.144
(0.746)
-9.101
(0.296)
-7.793
(0.397)
-9.881
(0.281)
-7.751
(0.375)
Trade openness -0.004
(0.973)
-0.017
(0.869)
-0.032
(0.754)
-0.012
(0.908)
-0.017
(0.864)
Trade Partners growth rate 0.045
(0.943)
0.357
(0.525)
0.229
(0.681)
0.301
(0.596)
0.346
(0.536)
Bond inflows (BDI)
-3.111***
(0.006)
-3.754**
(0.017)
-3.958**
(0.010)
-1.129
(0.697)
Equity inflows (EQI)
0.342
(0.429)
0.607
(0.194)
0.607
(0.230)
0.271
(0.529)
Foreign Direct investment (FDI)
0.302**
(0.017)
0.082
(0.572)
0.099
(0.513)
0.261
(0.120)
Positive shocks to BDI (BDI+)
0.586
(0.831)
5.283
(0.739)
5.283
(0.739)
Positive shocks to Equity inflows
(EQI+)
-1.022
(0.464)
1.629
(0.739)
Positive shocks to FDI (FDI+) 0.082*
(0.099)
0.194
(0.638)
Negative shocks to BDI -7.102
(0.116)
-12.687**
(0.046)
Negative shocks to Equity inflows
(EQI+)
1.242
(0.304)
-1.449
(0.716)
Negative shocks to FDI(FDI-)
-0.397
(0.248)
-0.344
(0.353)
BDI+ *Control BDI
-6.146
(0.545)
-3.578
(0.476)
EQI+ *Control EQI
-4.064
(0.639)
DII+ *Control DDI
-0.627
(0.343)
0.763
(0.113)
BDI- *Control BDI
24.408
(0.156)
EQI-*Control EQI
4.390
(0.443)
DII- *Control FDI
0.303
(0.765)
BDI *Control BDI
0.114
(0.937)
DII *Control DDI
-0.793
(0.636)
Constant -197.07**
(0.036)
203.19**
(0.031)
-261.48***
(0.008)
-275.26***
(0.007)
-223.20**
(0.023)
Wald Stat 121.41***
153.62***
168.31***
209.86***
207.73***
Arellano-Bond Test 1st Order
2nd Order
-1.979**
0.320
-1.840*
0.110
-1.761*
0.270
-1.727*
-0.066
-1.798*
0.142
*, **, *** indicate 10%, 5% and 1% degree of statistical significance respectively.
Source: Author’s computation
27
Inflows of bond, like any private capital, would increase demand for domestic currency relative
to foreign currencies and lead to appreciation (the financial flows effects) of the currency,
hence the nominal exchange rate appreciation. The negative effects of bond inflows on capital
formation and lack of any positive effects on domestic credit supply would invariably drag on
the real sector, leading to output loss (real sector effects). The induced output loss would lead
to relative supply reduction and, inflation results. The combination of nominal exchange rate
appreciation and increased price level resulted in real exchange rate appreciation. The
appreciation effects of bond flows was however removed when capital control is targeted at
the bond flows (equation 22).
Other private flows (non-bond or risk-sharing flows) did not lead to real exchange rate
appreciation, not due to the financial flows effects but the real sector effects (equation 20 &
21). Equity flows did not undermine capital formation but improved credit formation. These
positive effects on real sector and price levels appear to have neutralised the financial flow
effects; hence equity flows did not lead to real exchange appreciation. The real sector effects
also appear to be stronger than the financial flows effects for direct investment, and this
explains why it did not lead to appreciation. However, the means by which direct investment
affect the real sector is not clear because neither did it improve capital formation nor enhance
credit supply. One plausible means, though not empirically validated in this study, is
technological spill-over. With this effect, foreign direct investment, and the related positive
surges would have positive output (and relative supply expansion) effects, reduced price level
effects and hence lead to depreciation of real effective exchange rate (as shown in equation
20).
6.5 Surges to private capital flows and effectiveness of capital controls
Empirical evidence from this study (equations 23-28) shows that capital controls were not
effective in stemming the positive and negative surges except when appropriately targeted.
None of the non-flow variables were significant in all the capital flow surge equations. Table
9 shows that increase in the private capital inflows significantly induced positive surges and
this is an unsurprising indicator of positive surges. Capital controls did not reduce positive
surges but rather worsen it in many cases, except when carefully targeted at the flows
themselves rather than the surges. The controls performed poorly when untargeted at all. Table
10 shows that increase in the flows reduces negative surges and this is unsurprising, as it in the
case of positive surges ineffective. The issue is appropriateness of targeting. When properly
targeted, capital controls become effective in not only checking the surges (tables 10-11) but
also reducing the negative effects of these surges on growth (tables 5-6 above).

28
Table 9: Capital Control and Shocks to Bond, Equity and Direct Investment Inflows
Dependent Variables BDI+ EQUI+ DII+
Series 23 24 25
Lag ( BDI+) -0.029**
(0.015)
Lag ( EQUI+) -0.024
(0.257)
Lag ( FDI+) 0.026
(0.438) RGDPG 0.010**
(0.015)
0.008**
(0.034)
0.079
(0.285) Real interest rate 0.0003
(0.671)
0.001
(0.628)
0.013
(0.436) Institutional quality -0.100
(0.466)
0.790
(0.177)
11.389*
(0.055) Foreign interest rate -0.029*
(0.087)
0.030*
(0.086)
0.515*
(0.145) VIX 0.0001
(0.855)
-0.0004
(0.808)
-0.053
(0.145) Trade Partners growth rate -0.002
(0.563)
-0.006
(0.445)
-0.183
(0.384) Bond inflows (BDI)
0.466***
(0.000)
Equity capital (EQI)
0.053***
(0.002)
Foreign Direct investment (FDI)
0.354***
(0.000) Control BDI
0.097**
(0.027)
Control EQUI
-0.054
(0.631)
Control DDI
8.676**
(0.022) BDI+ *Control BDI
1.907***
(0.000)
EQI+ *Control EQUI
1.405***
(0.000)
FDI+ *Control FDI
0.953***
(0.000) BDI *Control BDI
-0.937***
(0.000)
EQI *Control EQUI
-0.071**
(0.015)
FDI *Control FDI
0.364
(0.213) Constant -0.089
(0.190)
-0.489
(0.182)
-14.337**
(0.011) Wald Stat 41162***
(0.000)
351383***
(0.000)
11250***
(0.000)
Arellano-Bond Test 1st order
2nd order
-0.316
-1.516
-1.501
-1.399
-1.622
-0.214
Sargan test not available for vce(robust) GMM estimation
*, **, *** indicate 10%, 5% and 1% degree of statistical significance respectively.
Source: Author’s computation

29
That capital controls did not directly curtail surges (positive and negative) may though agree
with previous studies which find that that capital controls are not effective in reducing the
volume of surges (e.g. Forbes and Warnock, 2012), this does not mean that they are
Table 10: Capital Control and Negative Shocks to Bond, Equity and Direct Investment Inflows
Dependent Variables BDI- EQUI- DII-
Series 26 27 28
Lag ( BDI-) -0.010
(0.846)
Lag ( EQUI-) 0.004
(0.889)
Lag ( DII-) 0.074
(0.257) RGDPG 0.003
(0.731)
0.030**
(0.043)
0.192*
(0.068) Real interest rate 0.002
(0.385)
0.001
(0.817)
0.008
(0.820) Institutional quality -0.180
(0.453)
0.480
(0.213)
-6.855**
(0.029) Foreign interest rate -0.030
(0.173)
0.021
(0.588)
0.098
(0.774) VIX 0.005**
(0.021)
-0.005
(0.172)
-0.015
(0.678) Trade Partners growth rate -0.000
(0.973)
-0.009
(0.597)
-0.155
(0.342) Bond inflows
-0.122***
(0.000)
Equity capital
-0.075***
(0.006)
Direct investment
-0.239***
(0.000) Control BDI
-0.293***
(0.001)
Control EQI
-0.281
(0.131)
Control DDI
-9.537***
(0.000) BDI- *Control BDI
1.910***
(0.000)
EQI- *Control EQUI
1.497***
(0.000)
DII- *Control DDI
1.029***
(0.000) BDI *Control BDI
0.202***
(0.001)
EQI *Control EQUI
1.295***
(0.005)
DII *Control DDI
0.243***
(0.000) Constant 0.265
(0.148)
-0.084
(0.777)
-11.666***
(0.000) Wald Stat 216.27***
(0.000)
1012.93***
(0.001)
72.08***
(0.000)
Arellano-Bond Test 1st Order
2nd Order
-1.939*
0.693
-1.581
-1.410
-2.283***
1.376
Sargan Test not available for vce(robust) GMM estimation
*, **, *** indicate 10%, 5% and 1% degree of statistical significance respectively.
Source: Author’s computation

30
7. Concluding remarks and policy lessons
Private capital flows to sub-Saharan African region dramatically rose in the last two decades,
compared to the previous. Though the global financial crises stemmed the flows, private capital
flows after the crises have been positive and increasing. However, stylised facts do not show
that the region’s economy has been growing with the inflows; hence, there is limited evidence
of linkage between private capital flows and economic growth, in contrast with the theoretical
predictions. Blanchard et al.’s (2016) neoclassical growth equation testing the effects of
individual components of private capital on economic growth was extended to test the role of
surges to these flows and the effectiveness of capital controls in managing the surges. System-
GMM estimation of data on 25 sub-Saharan African economies in 2003-2013 period provided
interesting results.
Private capital flows did not significantly affect economic growth when the flow characteristics
of the flows were not taken into consideration. Once surges to the flows were controlled for,
risk-sharing capital flows (FDI and equity capital) positively affected economic growth while
risk-apathetic capital (bond) negatively did. While there was no evidence that FDI and equity
capital affected economic via the capital formation mechanism, equity capital proved positive
for growth by enhancing credit supply. The negative effects of bond capital on growth is
explicable through capital formation link and international competitiveness mechanisms as
bond capital led to reduction in capital formation and appreciation of the real exchange rate.
Surges generally affected economic growth negatively and there was no strong evidence that
the type of economic effects depends on whether the surge is positive or negative. When
appropriately targeted, capital controls reduced the magnitude of capital flows surges hitting
the sub-Saharan African economies, and were successful in mitigating negative effects of
surges and bond flows on economic growth. Generally, capital controls were more successful
with surges to risk-sharing flows than bond flows.
As the risk-sharing capital enhanced economic growth while bond capital detracts from it,
governments of the SSA should encourage the financial sector operators - commercial banks
and development banks, whether national or regional - to attract more of risk-sharing capital
than bond capital. As most banks’ working capital are sourced as bond capital rather than risk-
sharing capital due to international investors’ risk-aversion weak preference for equity, the
structure of bond finance should be negotiated to longer maturity. This has the capacity to
reduce the negative effects of bond capital arising from its other property: short maturity.
Financial institutions (bank and non-bank) should develop products that will assist local firms
to secure direct equity finance in forms of FDI and equity capital. This will go a long way in
reducing overdependence of local firms on commercial and development banks for finance,
and the latter’s pressure to obtain bond finance from the international financial markets, no
matter how cheap. In this respect, governments of the sub-Saharan African economies region
should develop virile capital markets - domestic, regional and continental - as this will serve
as a conduit to international capital market and open up the region to more of risk-sharing
finance than bond financing. It should be noted that this would not necessarily reduce the role
of commercial banks and development banks in the finance landscape, it would merely shift
their functions from being a mere channel of resource-sapping bond finance (which takes
interest income without sharing the growth risk of the economy’s production processes), to
becoming active players in business support and economic growth. This will be achieve
through being vibrant channels of reliable (equity) finance and providers of business
management support, a function that generally develops in the wake of increase in equity
31
finance. Indirectly, performance in this area would encourage domestic growth of equity funds
as residents buy in when results become visible.
Evidence that capital controls are more successful with risk-sharing capital is another clear
indication that bond capital should be less encouraged in favour of non-bond flows. Once more
of equity and FDI finance the economy, the pressure to combat the negative effects of the bond
capital would be minimised. The facts that surges to bond capital prove less tractable to control
on bond capitals suggest that tougher measures are needed in this respect. Government should
however be more careful with other flows when designing relevant controls so as not to
undermine relationship with international equity capital investors.
References
Agosin, M. R. and Huaita F. 2010. Capital flows to emerging economies: Minsky in the tropics.
Cambridge Journal of Economics, Vol. 35, No. 4, Pp. 663-683.
Ahn, S. C. and Schmidt, P. 1995. Efficient estimation of models for dynamic panel data. Journal of
Econometrics, Vol. 68, Pp. 5–27.
Aizenman, Joshua and Y. Jinjarak. 2009. Current account patterns and national real estate markets.”
Journal of Urban Economics 66 (2): 75-89.
Aizenman, J., Jinjarak, Y. and Park, D. 2013. Capital flows and economic growth in the era of financial
integration and crisis, 1990–2010. Open Economic Review, 24
Aizenman, J. and Sushko, V. 2011. Capital flow types, external financing needs, and industrial growth:
99 countries, 1991-2007. NBER Working Paper No. 17228. (Cambridge, Massachusetts:
National Bureau of Economic Research).
Akinboade, O. A., Siebrits, F. K. and Elizabeth W. N. R. 2006. Foreign direct investment in South
Africa. Foreign Direct Investment in Sub-Saharan Africa: Origins, Targets, Impact and
Potential. Ajayi, S. I. 2006. Eds. African Economic Research Consortium. Chapter 9:177-208
Alfaro, L., Kalemli-Ozcan, S. and Volosovych, V. 2011. Sovereigns, Upstream Capital Flows, and
Global Imbalances. NBER Working Paper No. 17396. (Cambridge, Massachusetts: National
Bureau of Economic Research).
Alfaro, L., Kalemli-Ozcan, S. and Volosovych, V. 2007. Capital flows in a globalized world: the role
of policies and institutions. Capital Controls and Capital Flows in Emerging Economies:
Policies, Practices and Consequences Edwards. Eds. National Bureau of Economic Research.
Alley, I. S. 2016. Oil Price and Exchange Rate Crash: Can Economic Diversification Save the Naira.
Energy Policy, Vol. 96. Forthcoming.
Alley, I. S. 2015. Private capital flows and economic growth of sub-Saharan African countries. African
Development Review, Vol. 27, No. 4, Pp. 469-483.
Alley, I. S. and Poloamina, 2015. Private Capital flow surges and sub-Saharan African macroeconomic
performance. Journal of International Economic Studies, Vol.29, Pp. 61-84.

32
Alley, I. S. 2014. Private capital flows and macroeconomic performance: growth implication of surges
for sub-Saharan economies. An unpublished PhD thesis submitted at the University of Ibadan,
Nigeria.
Arellano, M. and S. Bond. 1991. Some tests of specification for panel data: Monte Carlo evidence and
an application to employment equations, Review of Economic Studies 58, 277–297.
Arellano, M. and O. Bover. 1995. Another look at the instrumental variables estimation of
errorcomponent models, Journal of Econometrics 68, 29–51.
Arteta, C.O., Eichengreen, B., Wyplosz, C. 2003. On the growth effects of capital account liberalization.
Economic Policy in the International Economy: Essays in Honor of Assaf Razin. Helpman E.,
Sadka, E. Eds. Cambridge University Pres.
Bailliu, J. N. 2000. Private capital flows, financial development, and economic growth in developing
countries. Bank of Canada Working Paper 2000-15
Baltagi, B. H. 2005. Econometric analysis of Panel Data. John Wiley and Sons Ltd. Third edition.
Becker, C. and Noone, C. 2009. Volatility in international capital movements. Reserve Bank of
Australia Research Discussion Paper No. 2009-09.
Benigno, G., Converse, N. And Fornaro, L. 2015. Large Capital Inflows, Sectoral Allocation, and
Economic Performance. International Finance Discussion Papers 1132. Available from
http://dx.doi.org/10.17016/IFDP.2015.1132
Benigno, G. et al. 2014. “Optimal Capital Controls and Exchange Rate Policy? A Pecuniary Externality
Perspective.” CEPR Discussion Paper 9936. London, United Kingdom: Centre for Economic
Policy Research.
Bianchi, J. 2011. Overborrowing and Systemic Externalities in the Business Cycle. American Economic
Review 101(7): 3400–3426.
Binici, M., M. Schindler and M. Hutchison. 2010. “Controlling Capital? Legal Restrictions and the
Asset Composition of International Financial Flows.” Journal of International Money and
Finance 29(4): 666–684.
Blanchard, O., Ostry, J. D. Ghosh, A. T. and Chamon, M. 2016. Capital Flows: expansionary or
contractionary? American Economic Review, Vol. 106, No. 5, Pp. 565-69.
Blundell, R. and S. Bond, 1998, Initial conditions and moment restrictions in dynamic panel data
models, Journal of Econometrics 87, 115–143.
Boudias, R. 2014. Capital Inflows, Exchange Rate Regimes and Credit Dynamics. Centre d’Etudes
Prospectives et d’Informations Internationales (CEPII) Working Paper No. 2014-17.
Borensztein, E., De Gregorio, J. and Lee, J. W. 1998. How does foreign direct investment affect
economic growth? Journal of International Economics. 45: 115-135.
Broner, F. Didier, T., Erce, A. and Schmukler, S. L. 2012 Gross Capital Flows: Dynamics and Crises
33
Broner, F. A. and Rigobon, R. 2004. Why are capital flows so much more volatile in emerging than in
developed countries? External Vulnerability and Preventive Policies, Caballero, R., Calderón,
C. and Céspedes, L. Central Bank of Chile. 15-40.
Broto, C., Diaz-Cassou, J. and Erce-Dominguez, A. 2008. The sources of capital flows volatility:
empirical evidence for emerging countries. Money Affairs. 21.1.
Bunmann, S., Hermes, N. and Lensink, R. 2013. Financial liberalisation and economic growth: a meta
analysis.
Caballero, Julian. (2014). “Do Surges in International Capital Flows Influence the Likelihood of
Banking Crises? Cross-Country Evidence on Capital Flows Bonanzas and Bonanza-Boom-Bust
Cycles. The Economic Journal, Vol. 126, Issue 591, Pp. 281-316.
Calderon, C. and Kubota, M. 2008. Sudden stops are global and local investors alike? World Bank
Policy Research Working Paper No. 5569
Calvo, G.A. and Reinhart, C.M., 2000. When capital inflows suddenly stop: consequences and policy
option. Reforming the International Monetary and Financial System. Kenen, P.B. and
Swoboda, A.K. Eds. International Monetary Fund, Washington, D.C. 175-201
Cecchetti, S. G. 2011. Global imbalances: current accounts and financial flows. Myron Scholes Global
Markets Forum University of Chicago.
Chenery, H. and Strout, A. 1966. Foreign assistance and economic development. American Economic
Review. 56. 4: 679-733.
Chinn, M.D., and Hiro Ito. 2006. “What Matters for Financial Development? Capital controls,
Institutions, and Interactions.” Journal of Development Economics 81(1): 163-192.
Chinn, M., and H. Ito, 2008, “A New Measure of Financial Openness,” Journal of Comparative Policy
Analysis, Vol. 10(3), pp. 309-322.
Choong, C., Baharumshah, A. Z., Yusop, Z. and Habibullah, M. S. 2010. Private capital flows, stock
market and economic growth in developed and developing countries: A comparative analysis.
Japan and the World Economy. 22: 107-117.
Converse, N. 2014. Capital flow volatility and maturity mismatch. Mimeo.
Edison, H., Levine, R., Ricci, L., Slok, T., 2002. International financial integration and economic
growth. Journal of International Money and Finance. 21: 749–776.
Edwards, S. 2001. Capital Mobility and Economic Performance: Are Emerging Economies Different?
NBER Working Paper No. 8076 (Cambridge, Massachusetts: National Bureau of Economic
Research).
Farhi, E., and I. Werning. 2012. “Dealing with the Trilemma: Optimal Capital Controls with Fixed
Exchange Rates.” NBER Working Paper 18199. Cambridge, United States: National Bureau of
Economic Research.

34
Felices, G. and Orskaug, B. 2005. Estimating the determinants of capital flows to emerging market
economies: a maximum-likelihood disequilibrium approach. Bank of England Quarterly
Bulletin. 48: 416-435
Ferreira, M. A. and Laux P. A. 2009. Portfolio flows, volatility and growth. Journal of International
Money and Finance. 28: 271-29
Fernandez, A., Klein, M. W., Rebucci, A., Schindler, M. and Uribe, M. 2015; Capital Control Measures:
A New Dataset. IMF WP/15/80
Fernández, A., A. Rebucci and M. Uribe. 2014. “Are Capital Controls Countercylical?” New York,
United States: Columbia University. Mimeographed document.
Forbes, K. 2007. “One Cost of Chilean Capital Controls: Increased Financial Constraints for Smaller
Traded Firms.” Journal of International Economics 71: 294–323.
Forbes, K. et al. 2012. “Bubble Thy Neighbor: Direct and Spillover Effects of Capital Controls.” NBER
Working Paper 18052. Cambridge, United States: National Bureau of Economic Research.
Forbes, K., and F. Warnock, 2012. Capital Flow waves: surges, stops, flight and retrenchment. Journal
of International Economics, 88 (2):235–251.
Fratzscher, M., 2012, “Capital Controls and Foreign Exchange Policy. European Central Bank Working
Paper Number 1415.
Furceri, D., Guichard, S. and Rusticelli, E. 2011. Episodes of large capital inflows and the likelihood
of banking and currency crises and sudden stops. OECD Economics Department Working
Papers No. 865 (Paris: Organization for Economic Cooperation and Development).
Gheeraert, J. and Mansour, L. M. 2005. On the impact of private capital flows on economic growth and
development. CEB Working Paper No 05/003. (Centre Emile Bernheim Research Institute in
Management Sciences, Solvay Business School)
Ghosh, A., 1995, “International Capital Mobility amongst the Major Industrialised Countries: Too Little
or Too Much?” Economic Journal, Vol. 105 (428), pp. 107-128.
Ghosh, A. R., Qureshi, M. S., Kim, J. I., and Zalduendo, J. 2014. Surges. Journal of International
Economics, 92(2):266 – 285.
von Hagen, J. and Zhang, H. 2011. International Capital Flows and Aggregate Output. Singapore
Management University, School of Economics Working Paper No 10-2010
International Monetary Fund. 2012. The liberalization and management of capital flows: an institutional
view. Washington DC: IMF
Jeanne, O. 2012. “Capital Flow Management.” American Economic Review Papers and Proceedings
102(3): 203–06.
Kaminsky, G. and Schmukler, S. 2003. Short-run pain, long-run gain: the effects of financial
liberalization. World Bank Working Paper No. 2912.
Klein, M., Olivei, G., 2008. Capital account liberalization, financial depth and economic growth.
Journal of International Money and Finance. 27: 861–875.

35
Klein, M.W. 2012. “Capital Controls: Gates versus Walls.” Brookings Papers on Economic Activity
2012 (Fall): 317-355.
Klein, M.W. and J. Shambaugh. 2015. “Rounding the Corners of the Policy Trilemma: Sources of
Monetary Policy Autonomy.” Forthcoming in American Economic Journal: Macroeconomics.
Korinek, A. 2014. Regulating Capital Flows to Emerging Markets: An Externality View. College Park,
United States: University of Maryland. Mimeographed document.
Kraay, A. 1998. In search of the macroeconomic effect of capital account liberalization. Unpublished.
Washington :World Bank.
Kose, M. A., Prasad, E. S. and Terrones, M. E. 2009. Does openness to international financial flows
raise productivity growth? Journal of International Money and Finance. 28: 554
Lane, P., and G-M. Milesi-Ferretti. 2007. “The External Wealth of Nations Mark II.” Journal of
International Economics 73: 223-250.
Lee, H., Park, C. and Byun, H. 2012: Do Contagion Effects Exist in Capital Flow Volatility? Asian
Development Bank WP No 302.
Magud, Nicolas, Carmen Reinhart, and Kenneth Rogoff. (2011). “Capital Controls: Myth and Reality
– A Portfolio Balance Approach.” Peterson Institute of International Economics. WP 11-7.
Mendoza, Enrique and Marco Terrones. (2008). “An Anatomy of Credit Booms: Evidence from Macro
Aggregates and Micro Data.” NBER Working Paper #14049.
Milesi-Ferretti, G. M., and C. Tille, 2011, “The Great Retrenchment: International Capital Flows During
the Global Financial Crisis,” Economic Policy, Vol. 26(66), pp. 285-342.
Mileva, E. 2008. The impact of capital flows on domestic investment in transition economies. European
Central Bank, Working Papers No.871.
Mody, A and Murshid, A. P. 2011. Growth from International Capital Flows: The Role of Volatility
Regimes.
Nier, E, Sedik, T. S. and Mondino, T. 2012. Gross Private Capital Flows to Emerging Markets: Can the
Global Financial Cycle be Tamed? International Monetary Fund WP/14/196.
Obstfeld, M. 2012. Does the current account still matter? American Economic Review. 102. 3: 1-23.
Ostry, Jonathan, Atish Ghosh, Karl Habermeier, Marcos Chamon, Mahvash Qureshi, and Dennis
Reinhardt (2010). “Capital Inflows: The Role of Controls.” IMF Staff Position Note 10/04.
Ostry, J., A. Ghosh, K. Habermeier, L. Laeven, M. Chamon, M. Qureshi, and A. Kokenyne, “Managing
Capital Inflows: What Tools to Use?” Staff Discussion Notes 11/06 (Washington DC:
International Monetary Fund).
Prassad, E., Rogoff, K., Wei, S., and Kose, M.A., 2003. Effects of Financial Globalization on
Developing Countries: Some Empirical Evidence. International Monetary Fund Occasional
Paper No. 220
Prasad, E. S; Rajan, R. G. and Subramanian. A. 2007. Foreign Capital and Economic Growth. Available
from: http://www.bupedu.com/lms/admin/uploded article/eA.1174.pdf
36
Reinhart, Carmen and Vincent Reinhart. (2009). “Capital Flow Bonanzas: An Encompassing View of
the Past and Present,” in Jeffrey Frankel and Francesco Giavazzi, eds. NBER International
Seminar in Macroeconomics 2008. Chicago: Chicago University Press.
Reinhart, C., and V. Reinhart, 2008, “Capital Flow Bonanzas: An Encompassing View of the Past and
Present,” NBER Working Paper 14321 (Cambridge: NBER).
Schindler, Martin. (2009). “Measuring Financial Integration: A New Data Set.” IMF Staff Papers 56(1):
222-238.
Schmitt-Grohé, S., and M. Uribe. 2012. “Prudential Policy for Peggers.” NBER Working Paper 18031.
Cambridge, United States: National Bureau of Economic Research.
Taylor, L. 1991. Foreign resource growth and developing country growth. World Institute for
Development Economics Research of the United Nations University.

37
APPENDIX
Figure 5A: Interest rate spread in SSA, LAC,
G7 & OECD
Figure 6A: Interest rate spread in
FM7, China and G7
Sources: World Bank’s (2016) World Development
Indicator (WDI)
Sources: IMF’s (2016) World Economic Outlook
(WEO)
Figure 3A: Equity capital and Real GDP growth Figure 4A: Bond capital and Real GDP growth
Source: IMF’s (2016) IFS database Source: IMF’s (2016) IFS database
Figure1A: Aggregate capital flows and Real GDP growth Figure 2A: FDI and real GDP growth
Source: IMF’s (2016) IFS database Source: IMF’s (2016) IFS database
Mauritius
Mauritius
Mozambique
Mozambique
Nigeria
Nigeria
Senegal
Senegal
TanzaniaTanzania
Uganda
Uganda
Zambia
Zambia
46
81
01
2
Rea
l G
DP
gro
wth
0 50 100 150Aggregate capital flows (%GDP)
n = 14 RMSE = 2.13009
growth = 6.20 + 0.003 capital (t-stat:0.22) R2 = 0.4%
Mauritius
Mauritius
Mozambique
Mozambique
Nigeria
Nigeria
Senegal
Senegal
TanzaniaTanzania
Uganda
Uganda
Zambia
Zambia
46
81
01
2
Rea
l G
DP
gro
wth
0 20 40 60 80Foreign direct investment (%GDP)
n = 14 RMSE = 2.10355
growth = 5.98 + .017 fdi (t-stat: 0.60) R2 = 2.9%
Mauritius
Mauritius
Mozambique
Mozambique
Nigeria
Nigeria
Senegal
Senegal
TanzaniaTanzania
Uganda
Uganda
Zambia
Zambia
46
81
01
2
Rea
l GD
P g
row
th
0 5 10 15 20Equity capital (%GDP)
n = 14 RMSE = 1.84067
growth= 6.82 - 0.17equity (t-stat:2.03) R2 = 25.6%
Mauritius
Mauritius
Mozambique
Mozambique
Nigeria
Nigeria
Senegal
Senegal
TanzaniaTanzania
Uganda
Uganda
Zambia
Zambia
46
81
01
2
Rea
l G
DP
gro
wth
0 1 2 3 4Bond capital (%GDP)
n = 14 RMSE = 1.80833
growth = 7.20- 0.96 bond (t-stat: 2.17) R2 = 28.2%

38
Source: Figure 6 and 8 are Author’s extension of Romer’s (2006) graphical presentation of Solow’s
capital dynamics while figure 7 is an extension of Cardoso and Dornbusch (1989).
Figure 10A: International Capital
Flows and Domestic Interest Rate
Movement
Figure 9A:
Capital Dynamics and Output in FM7
Figure 11A:
Capital Dynamics and Output in
G7
Figure 7A: Real interest rate in
FM7, China and G7
Figure 8A: Capital stock in
FM7, China and G7
Sources: World Bank’s (2016) WDI
Sources: World Bank’s (2016) WDI
kd1
kd1
m a b
c
e
h
sa2f(k)
sa1f(k)
fa(k)
(na+ga+ a)k
0
h
l u
0
MVK
n (nd+gd+ d)k
fd(k)
sfd(k)
sfd(k )+ (v,ka)
0
q
kd1
kd1
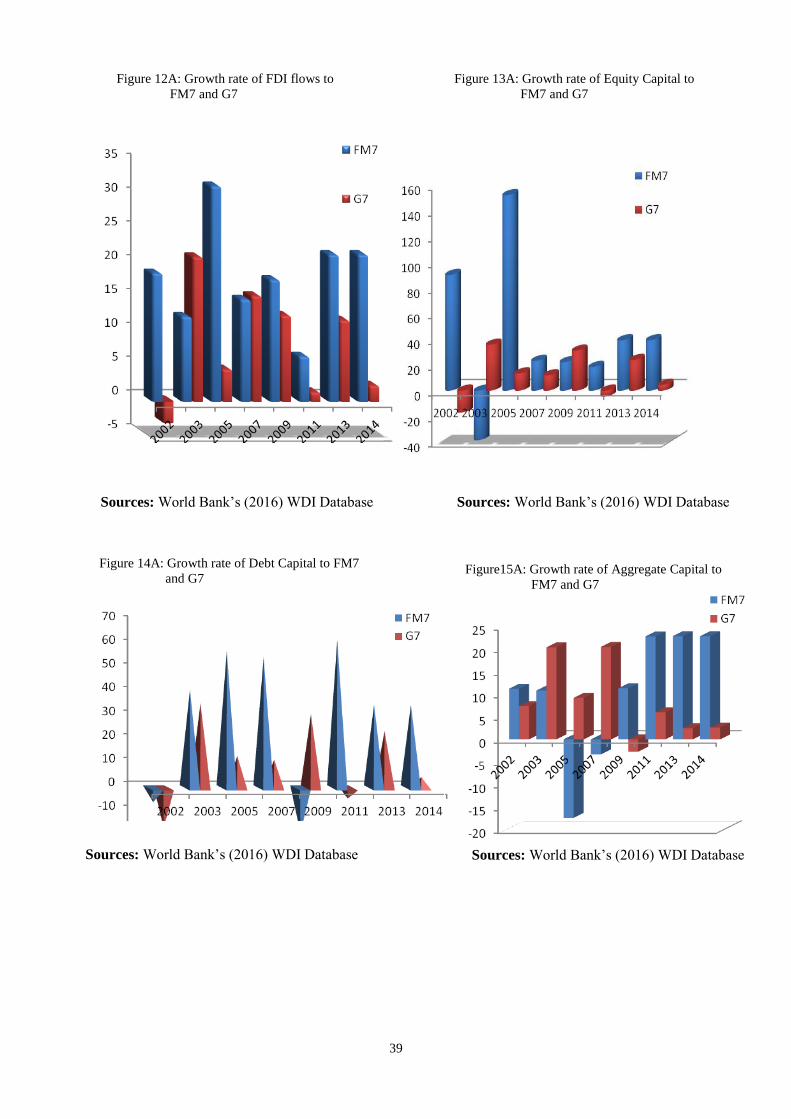
39
Figure 12A: Growth rate of FDI flows to
FM7 and G7
Figure 13A: Growth rate of Equity Capital to
FM7 and G7
Figure 14A: Growth rate of Debt Capital to FM7
and G7
Figure15A: Growth rate of Aggregate Capital to
FM7 and G7
Sources: World Bank’s (2016) WDI Database
Sources: World Bank’s (2016) WDI Database
Sources: World Bank’s (2016) WDI Database
Sources: World Bank’s (2016) WDI Database
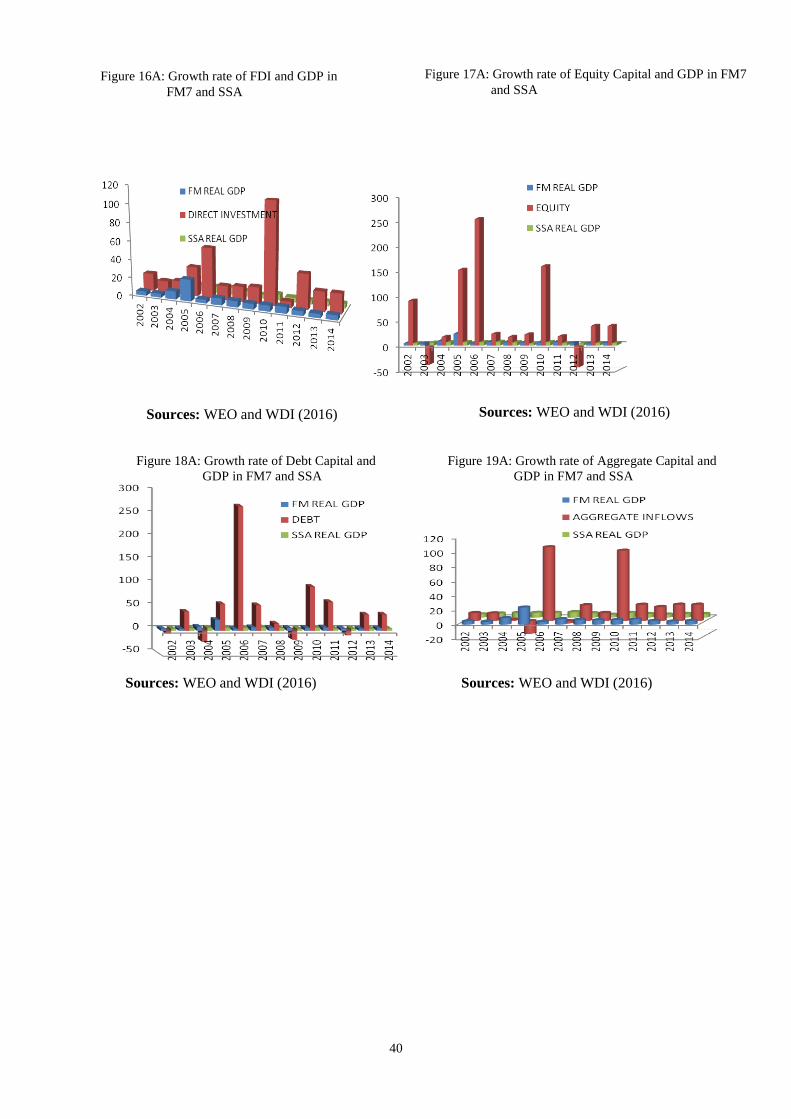
40
Figure 18A: Growth rate of Debt Capital and
GDP in FM7 and SSA
Figure 19A: Growth rate of Aggregate Capital and
GDP in FM7 and SSA
Sources: WEO and WDI (2016)
Sources: WEO and WDI (2016)
Sources: WEO and WDI (2016)
Sources: WEO and WDI (2016)
Figure 16A: Growth rate of FDI and GDP in
FM7 and SSA
Figure 17A: Growth rate of Equity Capital and GDP in FM7
and SSA
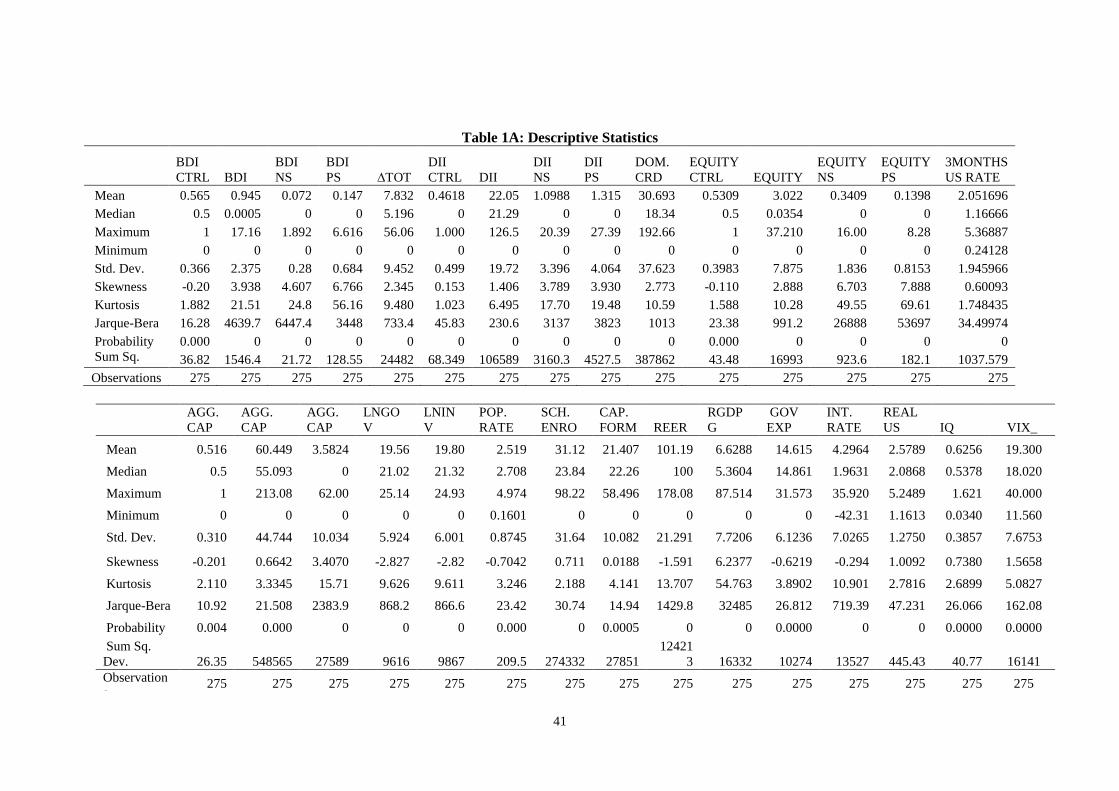
41
Table 1A: Descriptive Statistics
BDI
CTRL BDI
BDI
NS
BDI
PS ∆TOT
DII
CTRL DII
DII
NS
DII
PS
DOM.
CRD
EQUITY
CTRL EQUITY
EQUITY
NS
EQUITY
PS
3MONTHS
US RATE
Mean 0.565 0.945 0.072 0.147 7.832 0.4618 22.05 1.0988 1.315 30.693 0.5309 3.022 0.3409 0.1398 2.051696
Median 0.5 0.0005 0 0 5.196 0 21.29 0 0 18.34 0.5 0.0354 0 0 1.16666
Maximum 1 17.16 1.892 6.616 56.06 1.000 126.5 20.39 27.39 192.66 1 37.210 16.00 8.28 5.36887
Minimum 0 0 0 0 0 0 0 0 0 0 0 0 0 0 0.24128
Std. Dev. 0.366 2.375 0.28 0.684 9.452 0.499 19.72 3.396 4.064 37.623 0.3983 7.875 1.836 0.8153 1.945966
Skewness -0.20 3.938 4.607 6.766 2.345 0.153 1.406 3.789 3.930 2.773 -0.110 2.888 6.703 7.888 0.60093
Kurtosis 1.882 21.51 24.8 56.16 9.480 1.023 6.495 17.70 19.48 10.59 1.588 10.28 49.55 69.61 1.748435
Jarque-Bera 16.28 4639.7 6447.4 3448 733.4 45.83 230.6 3137 3823 1013 23.38 991.2 26888 53697 34.49974
Probability 0.000 0 0 0 0 0 0 0 0 0 0.000 0 0 0 0
Sum Sq.
Dev. 36.82 1546.4 21.72 128.55 24482 68.349 106589 3160.3 4527.5 387862 43.48 16993 923.6 182.1 1037.579
Observations 275 275 275 275 275 275 275 275 275 275 275 275 275 275 275
AGG.
CAP
CTRL
AGG.
CAP
AGG.
CAP
NS
LNGO
V
LNIN
V
POP.
RATE
SCH.
ENRO
L
CAP.
FORM REER
RGDP
G
GOV
EXP
INT.
RATE
REAL
US
RATE
IQ VIX_
Mean 0.516 60.449 3.5824 19.56 19.80 2.519 31.12 21.407 101.19 6.6288 14.615 4.2964 2.5789 0.6256 19.300
Median 0.5 55.093 0 21.02 21.32 2.708 23.84 22.26 100 5.3604 14.861 1.9631 2.0868 0.5378 18.020
Maximum 1 213.08 62.00 25.14 24.93 4.974 98.22 58.496 178.08 87.514 31.573 35.920 5.2489 1.621 40.000
Minimum 0 0 0 0 0 0.1601 0 0 0 0 0 -42.31 1.1613 0.0340 11.560
Std. Dev. 0.310 44.744 10.034 5.924 6.001 0.8745 31.64 10.082 21.291 7.7206 6.1236 7.0265 1.2750 0.3857 7.6753
Skewness -0.201 0.6642 3.4070 -2.827 -2.82 -0.7042 0.711 0.0188 -1.591 6.2377 -0.6219 -0.294 1.0092 0.7380 1.5658
Kurtosis 2.110 3.3345 15.71 9.626 9.611 3.246 2.188 4.141 13.707 54.763 3.8902 10.901 2.7816 2.6899 5.0827
Jarque-Bera 10.92 21.508 2383.9 868.2 866.6 23.42 30.74 14.94 1429.8 32485 26.812 719.39 47.231 26.066 162.08
Probability 0.004 0.000 0 0 0 0.000 0 0.0005 0 0 0.0000 0 0 0.0000 0.0000
Sum Sq.
Dev. 26.35 548565 27589 9616 9867 209.5 274332 27851
12421
3 16332 10274 13527 445.43 40.77 16141
Observation
s 275 275 275 275 275 275 275 275 275 275 275 275 275 275 275

42
Table 2A: Correlation Statistics
Correlation DOMCRD RCAPFORM LNGDP RINT IQ BOIFP DIIFP EQIFP BOIFSN BOIFSP
DOMCRD 1.000000
RCAPFORM 0.011047 1.000000
LNGDP 0.321188 0.039948 1.000000
RINT 0.104924 -0.120934 -0.173371 1.000000
IQ -0.148474 -0.075333 0.126520 -0.140207 1.000000
BOIFP 0.671372 -0.065862 0.412014 -0.074614 -0.164581 1.000000
DIIFP 0.295258 0.121052 0.093978 0.196201 -0.140362 0.248783 1.000000
EQIFP 0.523769 -0.074635 0.265490 -0.009648 -0.176846 0.716184 0.083639 1.000000
BOIFSN 0.097804 -0.027257 0.032723 -0.012191 -0.042313 0.005628 0.022917 0.009246 1.000000
BOIFSP 0.020405 -0.068379 0.010571 -0.043162 -0.018260 0.452136 0.145853 0.251307 -0.053284 1.000000
DIIFSN -0.018790 -0.006727 0.070463 -0.051152 0.027268 -0.047690 -0.088799 -0.035022 0.128897 -0.067815
DIIFSP 0.012092 0.021588 0.029802 0.094005 -0.027737 0.036750 0.385007 0.005753 -0.008601 0.109781
EQUIFSN 0.095634 0.008062 0.060374 -0.042247 -0.152914 0.061226 -0.111768 0.073382 0.232354 -0.036617
EQUIFSP 0.211870 -0.027307 0.098818 -0.019713 -0.049852 0.246657 0.089929 0.400847 -0.022766 0.221673
FINT 0.006636 0.053420 0.066093 0.082477 -0.031926 0.035227 0.080516 0.019639 -0.075347 -0.045032
REER -0.041495 0.052588 0.165574 0.010444 0.047485 -0.066549 0.105126 -0.121762 -0.068699 -0.011930
LNGOV 0.073573 0.591416 0.358792 -0.195404 0.131630 0.072630 -0.240729 0.043077 -0.008539 -0.124251
LNINV 0.067435 0.506832 0.213298 -0.198322 0.039502 0.085050 -0.270356 0.040027 0.005433 -0.111619
POPGRATE -0.602875 0.067347 -0.022148 -0.126788 0.013785 -0.233945 -0.280371 -0.147606 -0.066781 0.009212
RGDPG -0.201612 0.059878 0.186272 -0.019541 0.146565 -0.144021 0.089779 -0.097258 -0.051279 0.016465
RGOVEXP 0.108068 0.613566 0.003408 -0.111678 -0.081383 0.060488 -0.099385 0.001818 -0.019131 -0.118275
RUS -0.055376 -0.073447 -0.091094 0.058172 -0.008971 -0.060185 -0.122615 0.006711 -0.094145 -0.032498
CHGTOT -0.155407 -0.086884 0.245160 0.100959 0.317948 -0.129965 0.126549 -0.061864 -0.069385 -0.011635
CHLNGDP -0.159171 -0.005443 0.101529 -0.308089 0.081604 -0.148520 -0.142041 -0.086944 0.002652 -0.036190
TRWRGDPG -0.088798 -0.012225 -0.059073 -0.040969 0.066618 -0.100074 -0.105064 -0.165595 0.067510 -0.034824
TRADEOP 0.012307 0.035282 -0.032860 -0.027046 -0.063528 -0.022206 -0.002434 -0.063509 0.009092 -0.023019
SECENROL 0.582465 0.072834 0.037921 0.217511 -0.235455 0.287666 0.225235 0.224106 -0.029354 0.039302
VIX -0.009150 0.110880 0.067284 -0.027604 -0.036122 0.027596 0.014168 0.007454 0.153558 0.038596
EQI -0.034128 0.218484 -0.053142 -0.029533 0.084919 0.032271 0.103947 0.129931 0.027290 0.096142
DII 0.175785 -0.039892 -0.106799 -0.095436 0.054040 0.138524 0.184724 0.135826 -0.071541 0.041514
BOI -0.262389 0.245142 0.021087 -0.095810 0.034559 -0.112959 -0.110829 -0.013091 -0.154830 -0.037020

43
Table 2A: Correlation Statistics (Contd.)
Correlation DIIFSN DIIFSP EQUIFSN EQUIFSP FINT REER LNGOV LNINV POPGRATE RGDPG RGOVEXP
DOMCRD
RCAPFORM
LNGDP
RINT
IQ
BOIFP
DIIFP
EQIFP
BOIFSN
BOIFSP
DIIFSN 1.000000
DIIFSP -0.106376 1.000000
EQUIFSN 0.110220 -0.055506 1.000000
EQUIFSP -0.034175 0.065091 -0.029472 1.000000
FINT 0.006161 0.047403 0.016535 0.074323 1.000000
REER 0.026655 0.141840 0.005981 -0.073665 0.065611 1.000000
LNGOV 0.028048 -0.152088 0.017212 -0.020608 0.011838 -0.126170 1.000000
LNINV 0.033823 -0.159089 0.019255 -0.016684 0.030249 0.013973 0.815540 1.000000
POPGRATE -0.018087 0.053000 0.014515 -0.071039 0.006276 0.067125 0.083950 0.035973 1.000000
RGDPG 0.254034 0.076294 -0.069722 -0.020571 -0.058572 0.214159 -0.017913 -0.033687 0.250538 1.000000
RGOVEXP 0.019579 -0.052054 -0.001975 0.000621 0.048424 -0.092082 0.695604 0.627144 0.078581 -0.035669 1.000000
RUS 0.081478 -0.021972 -0.091705 0.037433 0.215584 -0.049031 0.033085 0.046536 -0.007984 0.076217 -0.000304
CHGTOT 0.131658 0.226942 -0.093300 -0.056358 0.036081 0.114274 -0.117456 -0.247828 0.067339 0.385284 -0.194321
CHLNGDP 0.111782 -0.088297 -0.037072 0.006868 -0.228659 0.196915 -0.009893 -0.034302 0.107553 0.301354 -0.119328
TRWRGDPG -0.031950 -0.103007 -0.085126 -0.047534 -0.168942 -0.230130 0.093634 0.116789 -0.191751 -0.219525 -0.022178
TRADEOP 0.011460 -0.000477 0.030806 -0.027764 0.036596 0.023507 0.048842 0.069230 -0.068105 -0.019939 0.048742
SECENROL -0.045085 -0.021877 -0.017771 0.121096 -0.007135 0.003389 0.012477 0.109506 -0.551138 -0.149848 0.010680
VIX 0.066008 -0.074801 0.028085 0.009150 0.341455 0.053928 0.041159 0.074056 0.006708 -0.065868 0.039763
EQI 0.091848 0.039327 0.131307 -0.014460 -0.021171 -0.009577 0.136825 0.129110 0.018513 0.249089 0.134864
DII -0.001081 -0.006099 -0.049495 0.118930 0.000408 0.025723 -0.043341 0.067923 -0.011161 0.059388 0.176348
BOI 0.037683 0.021690 -0.026296 -0.028327 -0.029901 -0.105219 0.319608 0.262031 0.343931 0.202464 0.413808
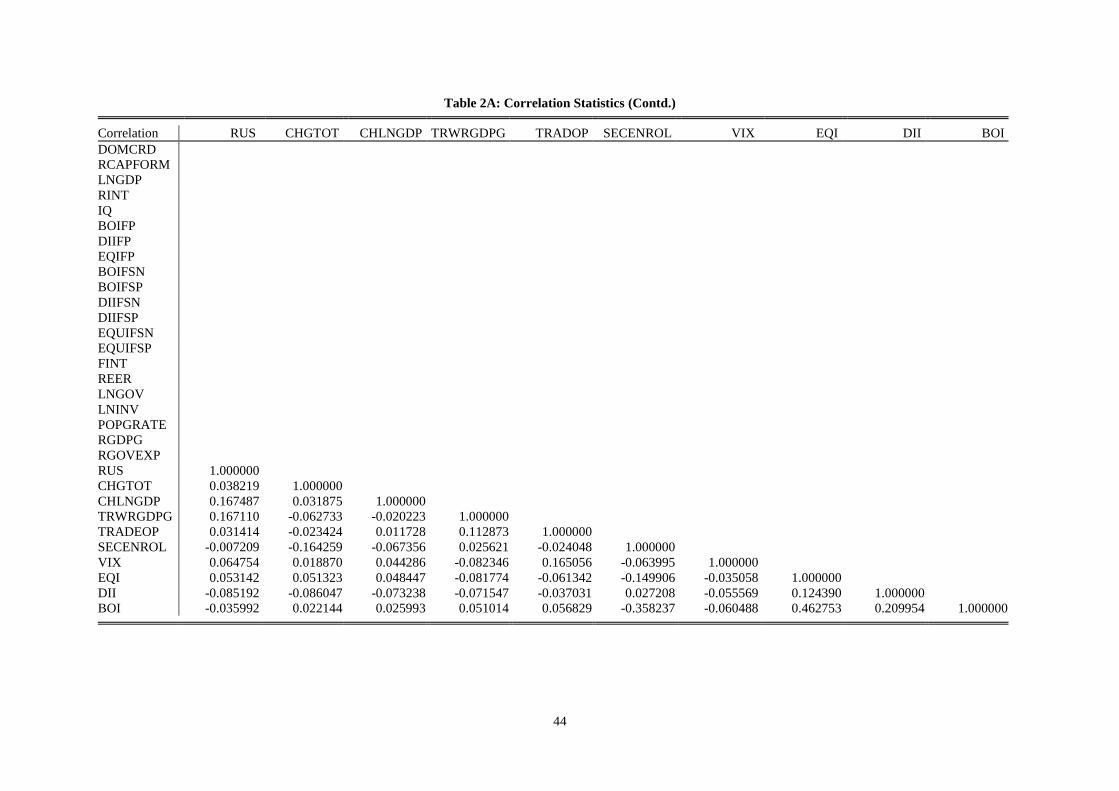
44
Table 2A: Correlation Statistics (Contd.) Correlation RUS CHGTOT CHLNGDP TRWRGDPG TRADOP SECENROL VIX EQI DII BOI
DOMCRD
RCAPFORM
LNGDP
RINT
IQ
BOIFP
DIIFP
EQIFP
BOIFSN
BOIFSP
DIIFSN
DIIFSP
EQUIFSN
EQUIFSP
FINT
REER
LNGOV
LNINV
POPGRATE
RGDPG
RGOVEXP
RUS 1.000000
CHGTOT 0.038219 1.000000
CHLNGDP 0.167487 0.031875 1.000000
TRWRGDPG 0.167110 -0.062733 -0.020223 1.000000
TRADEOP 0.031414 -0.023424 0.011728 0.112873 1.000000
SECENROL -0.007209 -0.164259 -0.067356 0.025621 -0.024048 1.000000
VIX 0.064754 0.018870 0.044286 -0.082346 0.165056 -0.063995 1.000000
EQI 0.053142 0.051323 0.048447 -0.081774 -0.061342 -0.149906 -0.035058 1.000000
DII -0.085192 -0.086047 -0.073238 -0.071547 -0.037031 0.027208 -0.055569 0.124390 1.000000
BOI -0.035992 0.022144 0.025993 0.051014 0.056829 -0.358237 -0.060488 0.462753 0.209954 1.000000

Recent Publications in the Series
nº Year Author(s) Title
251 2017 Solomon Abayomi Olakojo
Foreign trade and international financial flows:
Implications for economic stability in ECOWAS
countries
250 2017 Anthonia T. Odeleye Quality of Corporate Governance on Dividend Payouts:
The Case of Nigeria
249 2017
Arcade Ndoricimpa
Threshold Effects of Inflation on Economic Growth in
Africa: Evidence from a Dynamic Panel Threshold
Regression
248 2017 Boris Odilon Kounagbè Lokonon Farmers’ Vulnerability to Climate Shocks: Insights from
the Niger Basin of Benin
247 2017 Adamon N. Mukasa, Anthony M.
Simpasa, Adeleke O. Salami
Credit constraints and farm productivity: Micro-level
evidence from smallholder farmers in Ethiopia
246 2017 Abebe Shimeles and Tiguene
Nabassaga Why is inequality high in Africa?
245 2016 Anthony Simpasa and Lauréline Pla Sectoral Credit Concentration and Bank Performance in
Zambia
244 2016 Ellen B. McCullough Occupational Choice and Agricultural Labor Exits in
Sub-Saharan Africa
243 2016 Brian Dillon Selling crops early to pay for school: A large-scale
natural experiment in Malawi
242 2016 Edirisa Nseera
Understanding the Prospective Local Content in the
Petroleum Sector and the Potential Impact of High
Energy Prices on Production Sectors and Household
Welfare in Uganda
241 2016 Paul Christian and Brian Dillon Long term consequences of consumption seasonality

46