Embed Size (px)
Citation preview

Capital City Planning Framework
central Perth regional parklands conceptVegetation connectivity analysis
February 2013
support document
Prepared by:Perth Biodiversity Project
Prepared for:
The Department of Planning engaged the Perth Biodiversity Project to prepare this report as a background guidance document.
The Perth Biodiversity Project (PBP) is a local government initiative subscribed to by 32 Perth Metropolitan Region Local Governments and several peri-urban Local Governments. The project is supported by the Western Australian Local Government Association (WALGA) and the Western Australian Government (NRM program) through the Department of Planning/Western Australian Planning Commission.
© State of Western Australia
Published by the Western Australian Planning Commission Gordon Stephenson House 140 William Street Perth WA 6000
Locked Bag 2506 Perth WA 6001
Published February 2013
website: www.planning.wa.gov.au email: [email protected]
tel: 08 655 19000 fax: 08 655 19001 National Relay Service: 13 36 77 infoline: 1800 626 477
Western Australian Planning Commission owns all photography in this document unless otherwise stated.
This document is available in alternative formats on application to Communication Services.
Disclaimer This document has been published by the Western Australian Planning Commission. Any representation, statement, opinion or advice expressed or implied in this publication is made in good faith and on the basis that the government, its employees and agents are not liable for any damage or loss whatsoever which may occur as a result of action taken or not taken, as the case may be, in respect of any representation, statement, opinion or advice referred to herein. Professional advice should be obtained before applying the information contained in this document to particular circumstances.
Perth Biodiversity ProjectRenata ZelinovaTeik Oh
WALGAPO Box 1544West Perth 687208 9321 5055

central Perth regional parklands concept Vegetation connectivity analysis 1
Executive Summary 2
1 Objective 4
2 Study area 4
3 Background 5Principles for identifying ecological linkages 53.1 Impact of landscape fragmentation 53.2 Guiding principles for identifying regional and local ecological linkages 5
4 Methodology 64.1 Identification of the network of natural areas and assessment of their biodiversity conservation significance 64.2 Vegetation and wetlands connectivity modelling 94.3 Feasibility assessment for connectivity establishment within the Target Areas 9
5 Results 105.1 Network of natural areas and their biodiversity conservation significance 105.2 Vegetation and wetland connectivity modelling 13
6 Recommendations 176.1 Thoughts on connectivity improvement strategies within Target Areas 176.2 Recommendations applicable to all Target Areas and other parts of the proposed Regional Parklands 21
References 23
Appendices 24Appendix A New Shape Classifiers for Remnant Vegetation 24Appendix B List of figures from Section 5: Results 35Appendix C Table 1: Level 1 Prioritisation – Assessment of ecological values within any portion of remnant vegetation (from page 6) 47Table 2: List of datasets used in Level 1 Prioritisation 55

support documentCapital City Planning Framework
2
Executive SummaryThe purpose of this study was to investigate options for establishing a well-connected green network within the Capital City Planning Framework area that will provide for recreational needs of residents and visitors and will assist the maintenance of ecosystem functions provided by green spaces. Maintaining connectivity between natural areas is important for building resilience and the long-term viability of the high conservation values of regionally significant natural areas within the City and its surrounds.
Bushland areas with recognised conservation values such as Bush Forever Sites and wetlands protected under the EPA policy form the key components of the green network. While limited amount of remnant vegetation outside these protected areas remains, these remnants play an important role in retaining biodiversity locally and contributing to connectivity of natural areas.
Most local natural areas in the study area are of high conservation value as they are representative of vegetation complexes that are underrepresented and under-protected on the Swan Coastal Plain and in Perth, and most potentially provide habitat to listed species of flora and fauna, in particular to the Carnaby’s black cockatoos listed as Endangered under the Environmental Protection and Biodiversity Conservation Act 1999. Most remaining vegetation outside the protected lands has been identified to act as a stepping stone within regional ecological linkages.
This report provides a brief summary of biodiversity conservation values of regionally and locally significant remnant vegetation in the study area, with some specific information regarding values of these areas for fauna.
Guiding principles for establishment of effective ecological corridors are provided as well as thresholds for the spatial connectivity analysis are defined.
Analysis of the spatial distribution and the size of patches of remnant vegetation in the study area was undertaken to identify those patches that contribute to connectivity of patches across the landscape. Two scenarios were tested to demonstrate the impact of further clearing on the connectivity status of protected natural areas and potential benefits of strengthening connectivity through restoration or selected parklands. The connectivity analysis was based on a new methodology developed through the Regional Framework for Local Biodiversity Conservation Priorities for Perth and Peel and further adapted for this study.
Nine Target Areas were investigated closely to identify opportunities and constraints to improving connectivity
between protected areas. Specific recommendations are provided.
The following recommendations are provided to address issues relating to the establishment of ecological linkages across the study area:
• Aim to retain all remaining vegetation, particularly if in close proximity to any protected area. Manage these areas to maintain their biodiversity values.
• Consider introducing local planning scheme provisions that acknowledge the importance of selected local reserves as ecological linkages and where appropriate, provide for their long-term protection.
• Consider introduction of a planning policy or a Special Control Area for those parts of the landscape that form part of the regional ecological linkage.
• Consolidate remnant vegetation within protected areas through restoration of degraded parts and reduction of excessive verges along the boundaries of most of the reserved conservation areas.
• When undertaking transport corridor infrastructure projects, always consider provision of underpasses or overpasses within sections that cross the path of an ecological linkage to accommodate movement of people but also local fauna, minimising barriers in the vicinity of bushland and wetland reserves.
• Engage expert advice when designing habitat restoration projects to ensure that any specialist fauna needs are considered, such as Carnaby’s cockatoos, reptiles, small honeyeaters or insectivorous birds.
• Use the connectivity model to assess the effectiveness of a proposed restoration project.
• Use the vegetation height mapping combined with other information that identifies the vegetation origin to identify areas where habitat restoration can be achieved at least cost (because for example the tree canopy of local species might already be present).
• Refer to the guiding principles for establishment of ecological linkages (see section 2.2).
• Investigate use of small public spaces, not considered effective in accommodating fauna movement, to be used as orchards of local species. While providing benefits of a green landscaped space, these areas could be a sustainable source of plant material for future restoration and landscaping projects.
• Establish the use of local species in public landscaping as a standard, as an implementation

central Perth regional parklands concept Vegetation connectivity analysis 3
mechanism for the Capital City Planning Framework and as adopted Local Government Policy.
• Provide targeted incentives for long term establishment of local species in private gardens and along street verges.
• Develop a promotional package to raise awareness about the benefits of establishing ecological connectivity in urban areas. For example, support key stakeholders in running programs such as adopt-a-park. Schools, private institutions, Local Government and not-for-profit community organisations might be interested in running the programs with support.
• Establish demonstration gardens in strategic locations to promote local species as an effective option for attractive and functional private and public garden design.
• Educate people how to deal with wildlife that comes to their private backyards.
• Educate people about responsible cat ownership.

support documentCapital City Planning Framework
4
1 ObjectiveTo identify the key components of the proposed Capital City Regional Parklands, including areas acting as stepping stones and connecting corridors between existing conservation areas, contributing to the maintenance and improvement of ecological functions of these natural areas.
2 Study areaSpatial outputs will be generated for the study area as defined on Map 1 in the project brief provided by the Department of Planning. However, the spatial analysis will include remnant vegetation within an 8 km buffer.
Figure 1: Study area extent and potential target areas
6
1 Objective To identify the key components of the proposed Capital City Regional Parklands, including areas acting as stepping stones and connecting corridors between existing conservation areas, contributing to the maintenance and improvement of ecological functions of these natural areas.
2 Study area Spatial outputs will be generated for the study area as defined on Map 1 in the project brief provided by the Department of Planning. However, the spatial analysis will includes remnant vegetation within an 8km buffer.
Figure 1: Study area extent and potential target areas.
Potential target areas – approximate extent based on map from draft CCPF
Extent of study area

central Perth regional parklands concept Vegetation connectivity analysis 5
but also many other characteristics of the remaining habitat, such as patch size, inter patch connectivity, isolation, barriers, edge effects as well as vegetation type and its condition. Importance of the presence of fallen logs, leaf litter, litter depths or tree hollows was highlighted.
3.2 Guiding principles for identifying regional and local ecological linkagesEcological linkages for the purposes of this study can be defined as a series of continuous and non-continuous patches of remnant vegetation which, by virtue of their proximity to each other, act as stepping stones of habitat which facilitate the maintenance of ecological processes and the movement of organisms within, and across, a landscape (Molloy et al 2009).
Regional ecological linkages were identified for the Perth Metropolitan Region (del Marco et al, 2004) and link Regionally Significant Natural Areas through Local Natural Areas available between them that act as stepping stones. The regional ecological linkages were designed to provide the framework that can be used to identify ecological linkages locally.
The Perth Metropolitan Region regional ecological linkages are available as a spatial dataset and were compiled in consultation with relevant State agencies (See Figure 1, Appendix B). The linkage lines were drawn to be broadly reflective of the intended direction of the linkage. A distance of 250 m either side of this linkage line was created, resulting in a 500 m wide linkage. However, it is important that any natural areas identified as part of the regional ecological linkage due to them being within or touching the 500 m wide ecological linkage line, are retained in their entirety, not only the portion within the mapped 500 m wide linkage (del Marco et al 2004).
When identifying areas to be retained and managed as parts of a regional or local ecological linkage it is recommended these guiding principles are followed (del Marco et al 2004, Davis and Brooker 2008, Molloy et al 2009):
3 Background
Principles for identifying ecological linkages
3.1 Impact of landscape fragmentationThe long term survival of species, their genetic variation, their ability to adapt to changes in the environment and the maintenance of ecosystem services depend on how well individual living organisms and the associated genetic material can move between natural areas. Thus the viability of any natural area depends on its proximity to other natural areas and the quality of linkages between them (del Marco et al 2004, Davis and Brooker 2008, Molloy et al 2009, EPA, 2009).
One of the key threatening processes to biodiversity conservation in urban landscapes is habitat fragmentation (EPA 2007, How and Dell 1994). It is expected, that the current loss of species due to habitat loss and fragmentation will be further exacerbated with predicted changes in temperatures and rainfall due to climate change (CSIRO 2007, Dunlop and Brown 2008, Kauhanen 2011).
To increase the capacity of natural areas to retain biodiversity in fragmented urban landscapes and adapt to climate change, management responses should include the following (Molloy et al 2009, Commonwealth of Australia 2010):
• provision of access to a greater number and diversity of resources;
• conservation of larger and more viable populations;
• enabling species dispersal and migration;
• provision of a more representative mosaic of habitat types and structures;
• facilitation of greater genetic variation within species; and
• increase the capacity of species and communities to persist through removal of threats and adapting to disturbances.
Many of the above requirements can be facilitated by improving landscape connectivity through maintenance and/or establishment of ecological linkages.
A study by Davis and Brooker (2008) concluded that a large number of fauna species are at risk on the Swan Coastal Plain, primarily due to habitat fragmentation and barriers to dispersal. The study also highlighted the importance of not only remnant vegetation retention,
• Aim for a heterogeneous matrix of habitats rather than a homogenous one. Utilise existing native vegetation matrix and complex landscapes with minimal disturbance.
• The widest possible diversity of habitat types should be sought within a linkage with similar habitats (preferably) with less than 500 m – 1000 m apart.

support documentCapital City Planning Framework
6
When using the regional ecological linkages and connectivity concepts presented in this study, it is important to acknowledge the following:
• Ecological linkages or measures of connectivity are just one measure of biodiversity conservation value of a patch of remnant vegetation and does not detract from any other existing ecological value of other remnant patches.
• The methodologies are based on general biodiversity management principles and do not recognise the specific requirements of all taxa occupying the landscape. It cannot be used as a substitute for focused species or communities management planning.
4 MethodologyThe assessment of vegetation connectivity in the study area involved three main steps:
4.1 Identification of the network of natural areas and assessment of their biodiversity conservation significanceThe Regional Framework for Local Biodiversity Conservation Priorities for Perth and Peel, developed by the Perth Biodiversity Project (2011) provides a frame of reference for identifying priorities for further investigation of Local Natural Areas’ conservation values. It formed a basis for this assessment.
The following section describes a methodology developed to prioritise Local Natural Areas for further studies to confirm the implied conservation significance of any Local Natural Area with remnant vegetation.
Remnant vegetation is classified using three levels of prioritisation:
• Level 1 Prioritisation – based on assessment of ecological values within any portion of remnant vegetation.
• Level 2 Prioritisation – based on opportunities and constraints provided by the current regional and local land uses (provisions of zones and reserves of the Metropolitan Region Scheme and Local Planning Schemes).
• Level 3 Prioritisation – identifies potentially threatened vegetation complexes for Perth and Peel Region Scheme areas.
• Where continuous stands of native vegetation are not available, ecological linkages should be made up of remnants that form stepping stones between larger intact patches.
• Provision of large regional linkages is preferable in supporting a wide range of communities and species, supporting their movement over generations to localised corridors.
• Regional corridors should be 500 m wide where possible and a minimum of 300 m.
• The number of linkages connecting to any given patch should be maximized as this improves overall connectivity and long-term viability.
• Ecological linkages should be selected along directions that facilitate normal migrations and aid in adaptation of species and assemblages to climate change, such as North-South, East-West, high points in the landscape, riparian communities. Patches at high points in the landscape, in the line of sight of other patches are important for species dispersal and home range utilisation.
• Re-vegetation is a viable strategy for establishing or strengthening corridors in cleared landscapes, with priority given to opportunities to expand existing remnant vegetation. Aim to form continuous vegetated linkages or corridors at least 100 m wide. If this is not possible, ensure stepping stones of reconstructed or created habitat are at least 2 ha to 4 ha in size and no more than 500 m to 1000 m apart.
• Avoid or mitigate impacts of gaps in linkages caused by roads and other barriers to fauna mobility.
• Open canopies over highly disturbed understorey may be of little value, except for highly mobile species.

central Perth regional parklands concept Vegetation connectivity analysis 7
buffers might overlap within an area. In these instances each type of ecological community will be assigned a score.
Greater the number of criteria being met within a portion of remnant vegetation, the higher priority for further investigation. Patches where a record of at least one biodiversity feature triggers the Federal or State legislation become high priority for further investigation regardless of the number of other criteria being met within that patch. The presence of attributes that trigger the legislation can be identified with an overlay of a spatial layer ‘Legislative protection’ that forms part of the spatial model of the Regional Framework.
Considering the limitations of the datasets used to prioritise Local Natural Areas, these values need to be confirmed through field assessments. Limitations are listed below (Section 1.4).
Level 2 Prioritisation
To assess the opportunities and constraints for natural area retention, land use categories (zones and reserves) of the Metropolitan Region Scheme (MRS) and Peel Region Scheme (PRS) are classified into the following four categories in accordance with provisions for vegetation retention or natural areas retention or protection:
1. those considered providing protection, such as a type conservation zone;
2. those with good opportunities, such as Parks and Recreation, Recreation, Rural conservation, State Forest, and other;
3. those with varied opportunities, such as Public Purposes, Special Use, Rural Small Holdings, and other; and
4. those with limited opportunities to natural area retention, Urban, Urban Deferred, Industrial, Roads and other.
The same classification was applied to land use categories in 33 Local Planning Schemes that overlap with the Regional Framework’s study area. Land use categories are current as in January 2012.
The land use categorisation was then intersected with Level 1 Prioritisation. Greater number of criteria being met within a patch of remnant vegetation within each of the four land use opportunity categories, higher priority for further investigation. However, different land use planning mechanisms will be used to achieve conservation of these areas.
The prioritisation is based on 2010 remnant vegetation mapping (DAFWA, 2010) and a range of ecological criteria represented by a spatial dataset. Some prioritisation criteria are represented by surrogate spatial datasets created specifically for the Regional Framework.
Level 1 Prioritisation
Remnant vegetation in Perth and Peel was assessed against 32 attributes or criteria, the Level 1 Prioritisation criteria, which can be divided into four main groups of ecological attributes:
• regional and local representation of ecological communities based on 2010 remnant vegetation mapping by vegetation complexes;
• rarity of ecological communities, flora and fauna;
• maintenance of ecological functions through preservation of connectivity; and
• preservation of wetlands, riparian, estuarine vegetation and their buffers and preservation of coastal communities.
The criteria provide for the assessment of vegetation complex status against accepted biodiversity conservation thresholds (EPA 2008, EPA 2003). Research indicates that at least 30% of pre-European extent of each ecological community strategically located across a landscape is required to maintain sustainable levels of biodiversity. Where only 10% or less of the pre-European extent of an ecological community remains that community is considered threatened (Department of Natural Resources and Environment 2002).
Numerous spatial datasets were used to represent the 32 criteria, including several datasets that were created as surrogates for special ecological attributes. Overlay and intersection of these datasets generates the Level 1 Prioritisation. Appendix C shows the list of the criteria, their descriptions; spatial data used and includes a reference to any legislation or policy supporting the attributes being represented by the criteria. List of datasets, relevant data custodians and data currency are also included.
Portions of remnant vegetation are classified according to a number of ecological attributes of Level 1 Prioritisation criteria being met within that portion. Each criteria met receives a count, except when Threatened and Priority ecological communities are present. Threatened and priority ecological communities are buffered and thus two different ecological community

support documentCapital City Planning Framework
8
limited to the Perth and Peel Scheme Regions being at highest risk:
• vegetation complexes with >90% regional extent within the study area and assumed <10% retention in the study area;
• vegetation complexes with >90% regional extent in the study area and assumed <30% retention in the study area;
• vegetation complexes with >60% regional extent in the study area and assumed <10% retention in the study area;
• vegetation complexes with >60% regional extent in the study area and assumed <30% retention in the study area;
• vegetation complexes with <10% assumed retention in the study area; and
• vegetation complexes with <30% assumed retention in the study area.
Retention and protection of Local Natural Areas representative of any of the above listed vegetation complexes should be a priority in the Perth and Peel Regions.
Limitations of the Regional Framework spatial model
When referring to the Regional Framework local natural area prioritisation, it is important to consider the limitations of the datasets used and thus the limitation of the final products:
• Remnant vegetation extent mapping is primarily based on 1:20,000 scale and includes areas that are highly degraded as well as sites that were revegetated after being completely cleared.
• Vegetation complex mapping is a composite of two datasets that overlap along the Darling Scarp area. Field assessment is essential to confirm the type of vegetation represented within remnants as along this joining line extends one of the most threatened vegetation complex.
• Datasets representing threatened ecological communities, rare and priority flora and threatened and priority fauna do not represent the full extent of known records. These datasets do not necessarily represent a comprehensive listing of all threatened species and communities, as comprehensiveness is dependent on the amount of survey done in an area.
• Current flora and fauna data records or vegetation type mapping do not provide adequate information to
Limitations
• Does not differentiate between urban zoned lands prior to 1986 where native vegetation and other environmental issues were not considered.
• Does not consider basic raw materials.
• Does not consider Aboriginal Heritage.
• Does not consider ‘vegetation protection zones’ identified through structure plans for rural subdivisions approved under Local Planning Schemes.
• Does not consider areas that will be retained as conditions of development approvals or as offsets.
• Does not consider catchment protection zones (aquifer recharge).
Level 3 Prioritisation
A potential level of native vegetation retention by vegetation complexes was estimated for the Perth Metropolitan and Peel Region Scheme area with the following assumptions (Perth Biodiversity Project 2011):
• no vegetation was retained within zones or reserves such as Urban, Urban Deferred, Industrial, Roads and Railways; except where these were also Bush Forever Sites where 30% retention is assumed;
• 70% of remaining vegetation within rural zoned land and land reserved for public purposes was retained, except where these were also Bush Forever Sites, then a 90% and 80% retention is assumed; and
• all vegetation reserved for Parks and Recreation and State Forest was retained.
The statistical analysis was based on 2010 remnant vegetation extent and Metropolitan Region Scheme zones and reservation extent as in August 2011.
Please note, these are only hypothetical considerations as native vegetation is being retained within zones that provide limited opportunities, for example through Public Open Space or development design modifications, but these are usually limited to less than 10% of the total development area. At the same time, some clearing of native vegetation occurs within lands reserved for Parks and Recreation.
Vegetation complexes are divided into six categories based on the potential level of retention when compared to their pre-European extent, with those

central Perth regional parklands concept Vegetation connectivity analysis 9
Biodiversity Conservation Priorities for Perth and Peel (Oh 2011) to identify various levels of connectivity through the study area and its surrounds (at least 8 km beyond study area).
3. Development of a new connectivity measure (connectivity reach) (Oh 2012).
4. Testing of three scenarios of connectivity and potential impacts on the existing protected natural areas (using a remnant patch connectivity and viability index as a measure).
The surrogate ‘green spaces’ consist of buffered boundaries of areas reserved for Parks and Recreation in the Metropolitan Region Scheme and Local Planning Schemes and selected Public Purpose reserved lands. A buffer of 25 m was added inwards each selected area boundary.
The vegetation connectivity model, developed by Teik Oh of Fluffy Software for the Regional Framework for Local Biodiversity Conservation Planning for Perth and Peel project in 2010-2011 formed the basis for this analysis. This model was extended by a new remnant classifier measure named ‘connectivity reach’. The remnant connectivity model generates a set of three attributes for each green space patch, consisting of current remnant vegetation, selected wetlands and the surrogate green spaces, describing the extent to which the patch is connected (connectivity reach), the quality of connection within the networks (connectivity quality) and the quality of the connected network immediately surrounding the patch (connectivity viability). The mathematical functions describing the three classifiers are explained in Appendix A.
The connectivity model’s parameters are based on thresholds recommended in literature (see section Ecological Linkages).
4.3 Feasibility assessment for connectivity establishment within the Target AreasOpportunities and constraints for establishing ecological linkages that will support connectivity in Target Areas, identified in Figure 1, were assessed using the following information:
• ecological significance criteria and legislative requirements;
• results of the remnant connectivity analysis;
• size of Public Open Space areas considered in the connectivity analysis; and
• current land use provisions.
identify areas where conservation values of natural areas are not well documented or those where biological surveys were not done. Field assessments are essential to confirm the presence or absence of significant biodiversity features.
• The Metropolitan Region Scheme, Peel Region Scheme and Local Planning Schemes are continuously being updated as amendments are being approved. With datasets supporting the Regional Framework being updated every six months, there might be some discrepancies between the displayed information and the actual approved land uses.
• The opportunities and constraints analysis does not consider basic raw material locations, Aboriginal Heritage sites or land subject to Native Title claims.
• Datasets that were created to act as surrogates for specific prioritisation criteria, such as coastal vegetation of foredunes and secondary dunes or riparian vegetation, are based on generalisations. The real extent of these features needs to be determined on ground.
• Wetland buffers and buffers to waterways represent minimal width requirements and might not be adequate for some wetlands. Adequate buffers need to be determined after consideration of a range of local conditions. Some guidance is provided in the EPA Guidance Statement No 33 (2008).
• Remnant patch connectivity and viability index values are based on 2010 vegetation extent mapping (provided by DAFWA, August 2010). Clearing of any vegetation will affect the connectivity and viability index of remnant patches adjoining any area cleared since January 2010.
• Spatial data, representative of a range of issues relevant to biodiversity conservation planning, is not available at the regional scale, for example; vegetation condition or distribution of threatening processes.
4.2 Vegetation and wetlands connectivity modellingThe vegetation connectivity analysis is based on a spatial analysis, consisting of several steps including:
1. Development of a layer for ‘green spaces’ in the study area, consisting of remnant vegetation, selected wetlands and surrogate ‘green spaces’. Included testing of effects of tree canopy mapping provided by the CSIRO on the connectivity measure.
2. Testing of the connectivity analysis model developed through the Regional Framework for Local

support documentCapital City Planning Framework
10
conservation significance wetlands in the study area, but only one more is listed as a BFS, Lake Claremont (BFS 220). Both BFS 119 and BFS 218 are representative of plant communities on Karrakatta soils and form a critical link between Kings Park and Bold Park.
Kings Park and Bold Park are good examples of degrees of changes in the diversity of flora across relatively short distances in Perth (Barrett and Pin Tay, 2005). Despite the short distance, at less than 10 km apart, the floras of Kings Park (BFS 317) and Bold Park (BFS 312) differ by hundreds of species.
There are two reasons that Bold Park’s significance as fauna habitat is significant at the regional scale. Bold Park has the richest recorded reptile fauna in the Perth Metropolitan Region, with 32 species capture (How, 1998, How & Dell 1990, Botanic Gardens and Parks Authority 2000) as well as it includes a section that is the only bushland remnant in Perth where all three species of fairy wrens, the splendid, variegated and white-winged, occur together (Botanic Gardens and Parks Authority 2000).
Along the Swan and Canning Rivers, several Bush Forever Sites were identified to provide protection to a range of estuarine and riverine plant communities.
In the South Peth section of the study area, one of the most isolated Bush Forever Sites occurs, BFS 48. The BFS include over 13 ha of bushland representative of plant communities of the Bassendean Dune system.
Conservation significance of these sites is well documented in various publications (Government of Western Australia 2000, Botanic Gardens and Parks Authority 2000, CALM 2004).
Wetlands and Swan and Canning Rivers
Waterways play an important role in conserving biodiversity not only through conservation of water dependent ecosystems but also by facilitating connectivity across landscapes. This is particularly important in fragmented landscapes, such as the large parts of the Swan Coastal Plain portion of the Perth and Peel Scheme Regions. Fringing vegetation of wetlands and waterways provide a natural connection between the water dependent and terrestrial ecosystems but also accommodate movement between major landforms (Government of Western Australia, 2000; del Marco et al. 2004; Government of Western Australia, 2009).
In the Framework Focus area (Figure 1) there are several wetlands of high conservation value, recognized by Federal and State policies.
5 Results
5.1 Network of natural areas and their biodiversity conservation significance
Natural areas – definition
In the context of this document, natural area is used to describe an area that contains native species or communities in a relatively natural state and hence contains biodiversity. Natural areas can be areas of native vegetation, vegetated or open water bodies (lakes, swamps), or waterways (rivers, streams, creeks – often referred to as channel wetlands, estuaries), springs, rock outcrops, bare ground (generally sand or mud), caves, coastal dunes or cliffs (adapted from Environmental Protection Authority 2003). Note that natural areas exclude parkland cleared areas, isolated trees in cleared settings, ovals and turfed areas.
The following section will address the assessment of potential conservation significance of natural areas. The potentials of parkland cleared areas and ovals on improving connectivity of natural areas are also discussed.
5.1.1 Natural areas with recognised conservation values
Bush Forever Sites
The study area spreads over a wide range of environments that provide for diverse natural ecosystems. The conservation significance of many of these natural areas was recognised by their inclusion in the Bush Forever (Government of Western Australia, 2000).
There are eight Bush Forever Sites (BFS) between the City centre and the coast, spreading over two major dune landform systems, the Quindalup and Spearwood Dunes, including a range of vegetation types and plant communities and associated assemblages of fauna.
Plant communities of BFS 310 and BFS 315 change from the young coastal communities of the Quindalup dune system to communities of the older Cottesloe soils of the Spearwood dune system. Three largest BFSs are each representative of communities developed on different soil systems; Bold Park (BFS 312) includes primarily plant communities evolved on Cottesloe soils, Kings Park (BFS 317) spreads over Karrakatta soils of the Spearwood Dunes and the Herdsman Wetland (BFS 281) are representative of wetland communities. There are several other

central Perth regional parklands concept Vegetation connectivity analysis 11
defined as ‘local natural areas’ for the purposes of local biodiversity conservation planning (del Marco 2004). Remnant vegetation, wetlands or sandy dunes are retained in the study area outside the protected lands, in various land tenures. Most of remaining natural areas are retained within lands managed or vested in Local Government for recreational purposes, State Government or are privately owned and are reserved for various Public Use purposes.
Results of the Regional Framework prioritisation can be used to identify priorities for further investigations of biodiversity conservation values within remaining vegetation on lands not already afforded some level of protection in the study area. Figure 1 in Appendix B shows the number of Level 1 prioritisation criteria being met by portions of remnant vegetation within the study area, identifying those areas considered having some level of protection with blue hatching and those defined as Local Natural Areas (no hatching). The following section provides an overview of the prioritisation outcomes. The best method for analysing the results is to access the on-line version of the spatial model for the Regional Framework, which allows detailed analysis of individual portions of remnant vegetation and the ecological criteria being met.
Level 1 Prioritisation and Level 3 Prioritisation
Remnant vegetation is categorised according to a number of Level 1 Prioritisation criteria (see Appendix C) being met by any portion of remnant vegetation. Higher the number of criteria being met by a portion of remnant vegetation, the darker is the colouring of that portion of remnant vegetation mapping (See Figure 1, Appendix B).
Local natural areas that are of highest priority for further investigation of their biodiversity conservation values occur within close proximity to several Bush Forever Sites; including areas adjoining BFS 218, BFS 119, BFS 312 and BFS 315 in the western portion of the study area, but also local natural areas adjoining the BFS 314 on the eastern boundary of the study area. The significance of these areas is due to the following factors:
• they are representative of vegetation complexes that are currently retained at less than 30% of their pre-European extent and protected at less 10% at the regional and local level;
• include vegetation mapped as potential feeding habitat for Carnaby’s cockatoos, vegetation within a buffer of a confirmed roosting site and unconfirmed breeding site;
The Swan-Canning Estuary and the Herdsman Lake (BFS 281) are listed in A Directory of Important Wetlands in Australia (Commonwealth of Australia 2001) which lists 120 nationally important wetlands in Western Australia.
Despite high modifications, the Swan-Canning estuary remains one of the most important wetland systems in the region, supporting very high diversity and abundance of waterbirds, comparable to the Ramsar listed wetland systems (Brearley, 2005).
Herdsman Lake is the largest wetland within Perth’s inner metropolitan region and is part of a chain of wetlands that extend north to south in the Spearwood Dune System. The Lake supports a high diversity of wildlife. It is a significant breeding site for over 30 species and a summer refuge for waterfowl, bushbirds and birds of prey. Transequatorial migratory waders visit the lake seasonally. The abundance and diversity of birdlife recorded at Herdsman Lake is unusual considering the urban setting of the Lake (CALM 2004).
Herdsman Lake Regional Park management plan recognizes the importance of establishing good connections between the Lake and other natural areas to maintain the high conservation values of the Lake. This is particularly important due to the close proximity of urban and industrial development that isolates the lake from other open space areas (CALM 2004).
Lake Monger and Jackadder Lake are within 500-600 m from the Herdsman Lake. Both lakes were significantly modified, provide limited breeding habitat and include many introduced species in the limited vegetation structure. In fact, Lake Monger reserve does not retain any of the original vegetation. However, both lakes are still used by a variety of birds and Lake Monger supports a population of Long-necked tortoises (Chelodina oblonga) that showed signs of recruitment from other areas (City of Perth 1992). The environmental values of both lakes are recognized through listing under the Environmental Protection (Swan Coastal Plain Lakes) Policy 1992.
Other lakes listed under the Environmental Protection (Swan Coastal Plain Lakes) Policy 1992 within the study area include: Jualbup Lake in Shenton Park, unmanned wetland in the Mabel Talbot Park in Jolimont, West and East Lake in the Perry Lakes Reserve and Lake Claremont in Swanbourne. Most of these wetlands are also classified as Conservation Category wetlands.
5.1.2 Local Natural Areas and their conservation significanceAny natural areas that are not managed by the DEC or have not been identified as Bush Forever Sites are

support documentCapital City Planning Framework
12
• some sites are within a buffer of known location of threatened or priority flora or fauna; and
• some sites are within a buffer of significant flora or fauna.
Nearly all Local Natural Areas in the study area form stepping stones in the regional ecological linkage identified by the Perth Biodiversity Project in 2004.
All vegetation complexes retained within the study meet the criteria of ‘Potentially threatened vegetation complexes’ (Level 3 Prioritisation):
Table 1: Potentially threatened vegetation complexes in the study area
Criteria descriptionVegetation complexes meeting the criteria in the study area
CP2 Vegetation complexes with >90% regional extent in the study area and assumed <30% retention in the study area
Cottesloe Central and SouthHerdsman
CP3 Vegetation complexes with >60% regional extent in the study area and assumed <10% retention in the study area
Bassendean Central and SouthKarrakatta Central and South
CP4 Vegetation complexes with >60% regional extent in the study area and assumed <30% retention in the study area Quindalup
CP6 Vegetation complexes with <30% assumed retention in the study area Vasse
It should be noted that BFS 119 might not be retained in its entirety. This site is zoned for Urban development in the Metropolitan Region Scheme and the recommended site implementation option for this site is to negotiate a solution through statutory planning and environmental approval processes. Loss of any portion of BFS 119 is likely to affect the viability of BFS 218 and connectivity between BFS 317 and BFS 312.
It is important to emphasize that the Regional Framework prioritisation is based on 2010 remnant vegetation extent and does not show wetland areas where no remnant vegetation is mapped, such as conservation category wetlands Lake Monger, Lake Claremont or the lake in Hyde Park. However, they and all other mapped wetlands are considered in the connectivity analysis.
The capacity and significance of local natural areas in supporting populations of fauna can be documented on an example of the sand monitor (Varanus gouldii) that survives in small reserves in the inner City, for example at the Karrakatta Cemetery, with a home range averaging just 8.9 ha. Dispersal of juveniles into surrounding areas may be dependent on habitat corridors but research is needed into this aspect of species ecology (Davis and Brooker 2008).
While generally it is recommended to aim for retention of larger natural areas, reptile populations show some resilience to changes in the landscape matrix surrounding patches of bushland and persist in smaller patches. For example, 12 reptile species including the rare gecko Diplodactylus alboguttatus were recorded from an isolated 6 ha bushland in South Perth. Eight species of reptile were recorded from 1 ha of bushland in Inglewood, one of the most isolated Local Natural Areas in the study area (Davis and Brooker 2008).

central Perth regional parklands concept Vegetation connectivity analysis 13
Portions of Local Natural Areas are retained within lands reserved for various Public Purposes and vested in relevant State or Commonwealth agencies, such as the Water Corporation or Defence. In some instance the remaining vegetation is retained to provide buffers to surrounding land uses and these could be investigated for possible extensions. Local Natural areas east of BFS 218 are reserved for a Hospital and a Public School. These might be at risk of being cleared due to potential future expansions of these public facilities. Any future development should aim to retain the existing vegetation in good condition and investigate opportunities for restoration of areas that will not be built on.
Significant portions of remaining Local Natural Areas in the study area are zoned for Urban development or reserved for major roads, including the BFS 119 and portions of BFS 310 and BFS 312. However, some of these are in the relevant Local Planning Scheme reserved for Parks and Recreation and therefore good opportunities exist to retain these areas for the future. Many are reserves managed by Local Government as conservation reserves, such as Town of Cambridge bushland reserves. Others are reserved as Public Open Space and also provide good opportunities for retention of remnant vegetation and possibly extension of its current extent.
Areas reserved for Parks and Recreation in the Metropolitan Region Scheme and Parks and Recreation, Public Open Space or Recreation in Local Planning Schemes provide best opportunities for remnant vegetation retention and restoration. These areas were included in the connectivity modelling (Figures 4, 7 and 10 in Appendix B).
Retention of remnant vegetation within other land uses varies on the proposed development and the environmental values within the site that will affect the outcomes of the planning and environmental approval process.
5.2 Vegetation and wetland connectivity modellingTo further assist with the assessment of how individual patches contribute to connectivity locally and regionally, three new vegetation remnant classification measures have been developed.
The measures provide a visual indication of what role a remnant patch plays in connecting the landscape and how vulnerable that connection is. For the purpose of this discussion a “patch” is defined as a physically isolated piece of green space as defined by the composite of remnant vegetation, wetlands and other modelling inputs defining habitat.
The common brushtail possum is still believed to be common in parts of the study area, utilising tree hollows on mature trees. However, it is likely that it will lost from new developments that involve clearing of all mature trees and other vegetation. Therefore retention of trees in housing estates as well as well-designed corridors would benefit this species and help with their retention in the study area (Davis and Brooker 2008).
Dune restoration efforts along the Town of Cambridge foreshore areas demonstrate the effectiveness of such efforts in expanding fauna habitat. Following several years of re-vegetating cleared parts of the coastal reserve by the Cambridge Coastcare Group, in 2007, the white-winged fairy-wren (Malurus leucopterus) was recorded at the restored site after many years of absence (Dixon 2011). This is a significant finding as fairy-wrens are particularly considered at risk from ongoing habitat loss and fragmentation (Davis and Brooker 2008).
As already discussed before, many highly modified green spaces provide habitat for certain species of fauna and thus in urban settings facilitate opportunities for people to observe nature. Heirisson Island, in the highly modified part of the study area, is visited by more than 20 different species of birds. While most are common species, eight are limited to the southern hemisphere and therefore, the island is well positioned for interested visitors from the northern hemisphere (van Delft 1997).
Local Natural Areas retain significant biodiversity in the study area and their retention and management for conservation will assist with biodiversity retention in protected areas of the inner metropolitan region.
Level 2 Prioritisation
In the study area, several Local Natural Areas are reserved for Parks and Recreation, including few for specific use such as golf courses. Retention of vegetation and opportunities for enhancement of ecological linkages are most feasible within these lands. Management of threats such as weeds, altered fire regimes and maintenance of key habitat structures should be a priority. In many instances, extensive grass areas that are not used by visitors are available for re-establishment of native vegetation. For example, surroundings of Lake Monger, parts of Bold Park and the local golf courses should be investigated for opportunities to restore native vegetation in strategic locations to improve connectivity.

support documentCapital City Planning Framework
14
Testing of connectivity and fragmentation scenariosConnectivity quality and viability and connectivity reach were modelled to test the impacts of further clearing as well as the effectiveness of additional areas of remnant vegetation on improving the connectivity quality within the study area. The set of distances between discrete patches that were tested are 10, 20, 50, 100, 250 and 500 m.
Three scenarios were examined:
1. Status-quo of mapped remnant vegetation and wetlands (EPP Lakes and CCWs).
2. Further clearing of remnant vegetation was assumed with only areas that were retained were those identified as Bush Forever Sites (BFS) and the EPP Lakes.
3. An assumption that restoration of a 25 m wide strip along inner boundaries of all Public Open Space areas would be established in addition to current remnant vegetation (as mapped by DAFWA, 2010).
A new spatial layer was created to test the third scenario, identifying areas reserved Parks and Recreation in the Metropolitan Region Scheme and areas within the following land use categories of the Local Planning Schemes: Recreation, Public Open Space, Open Space, Parks and Recreation, Recreation and Drainage, Local Recreation, Local Open Space, Local Parks and Recreation, Private Recreation. A 25 m buffer was added along the inside boundary of an area based on an assumption that these edges could be restored using locally indigenous species.
All three scenarios were tested for ‘connectivity quality (regional), ‘connectivity viability (local)’ and for ‘connectivity reach’.
Connectivity Reach
In Appendix B, Figure 2 clearly distinguishes between areas of remnant vegetation and selected wetlands that are surrounded by other remnant patches within the defined distances, identified by dark shades of green; and those that are isolated, with no or limited number of other remnant patches within the defined distances (identified by shades of orange). Most remnant vegetation within Bush Forever Sites (BFS) appear to be surrounded by several other areas with remnant vegetation. Most isolated BFSs are located along the Swan River foreshore and the BFS48.
Figure 3 examines the impact of vegetation loss from all areas except the BFSs and the EPP wetlands. ‘Connectivity reach’ values decrease in all BFSs and
The development of the new remnant vegetation connectivity classification was based on the following observations:
• small, isolated patches tend to require high intensity management to maintain their ecological values than large patches;
• large patches can support larger populations of particular species as there is more land area;
• the distance between patches affects the ability of animals to move between them and for plant propagules to be dispersed; and
• remnant patch shape is important as thin, linear patches are subject to greater ‘edge’ effects (weed infestation, disturbances) than compact patches (del Marco et al, 2004).
Connectivity Reach
Connectivity reach is a measure of the scale of the connected network a patch is part of. It is calculated across a landscape. Higher values indicate patches which are part of larger connected networks, within a defined set of distances (10, 20, 50, 100, 250 and 500 m), than patches with smaller ‘reach’ values.
Connectivity Quality (Regional)
Connectivity quality is a measure for a patch of the connected network to which it belongs in how the network deviates from the “ideal” shape of a connected network (a circle). Networks that are fragmented with lots of thin linear patches have a low connectivity quality score. Networks that are compact with large adjacent compact patches have a high connectivity quality score.
Connectivity viability (Connectivity quality - Local)
Connectivity viability is a measure for a patch and it’s immediate surrounds and how this local network deviates from the ideal circle. Thin, small patches not closely bordering large patches have a low viability score. Large compact patches have a high score.
Further description of the mathematical expressions of the model identifying the three new vegetation classification measures is available in the Appendix A.

central Perth regional parklands concept Vegetation connectivity analysis 15
Connectivity Quality (Regional)
This classification is complementary to ‘connectivity reach’. While ’reach’ describes the size of the connected network of natural areas, the ‘connection quality (regional)’ describes the quality of this network connection; or how far it deviates from the ideal circular shape (see Appendix A).
Thus effects of very narrow remnant patches on overall connectivity quality are even more exacerbated when the three scenarios are tested using the ‘connectivity quality (regional)’ measure (Figures 8-10, Appendix B). However, increases in ‘connectivity quality’ are recorded within patches of remnant vegetation where the additions of POS are in close proximity to the remnant patches (see BFS 218, BFS 119 or BFS310), further supporting general recommendations in literature to improve connectivity and viability of remnant patches in landscapes by extending existing remnant patches rather than adding too narrow corridors of remnant vegetation.
Together, all three indicators provide a useful insight into the distribution of vegetation in the landscape and the possible role individual patches of remnant vegetation may play in connecting significant conservation areas. Potential impacts of further vegetation clearing can also be investigated. The models demonstrate the capacity of the modelling methodology to be used to support identification of areas where retention of current vegetation and further restoration would contribute to improved connectivity between regionally significant parts of the landscape. Vegetation clearing and linkage scenarios are readily modelled using the automated software.
Use of the tree and shrub mapping dataset
The vegetation height maps at resolution of 2 m and 5 m were provided by CSIRO (2012), classifying all remnant vegetation into five classes:
• Large tree canopy (over 25 m);
• Medium tree canopy (10-25 m);
• Small and medium tree canopy (4-10 m);
• Small and tall shrubs (0.5-4 m); and
• Ground cover (<0.5 m).
Due to the delays with data delivery, only two datasets representing two categories of vegetation classes, large and medium tree layer were used in the ‘connectivity quality (regional)’ and ‘connectivity viability (local)’ model. The effect was similar to the scenarios with addition of the buffered POS (Figures 7 and 10).
wetlands even if the shading on Figure 3 for some might remain the same. Most significant changes in the ‘reach’ value can be observed in BFS220, BFS218, portions of BFS310.
The ‘connectivity reach’ measure best demonstrates the benefits of increasing remnant vegetation between areas with existing vegetation to improve connectivity. Including the buffered POS areas to the model, increases the ‘connectivity reach’ in all Bush Forever Sites (Figure 4), even though the connectivity quality or viability as demonstrated in Figures 7 and 10 might not be ideal.
Connectivity reach readily identifies those POS areas that are part of larger networks (green), facilitating connection and those which do not (red).
Connectivity viability (Connectivity quality - Local)
This measure explores what is happening in areas adjoining each patch of remnant vegetation. Local connectivity is not particularly affected by linkages or the removal of remnant vegetation (except in some cases where the shapes of the patches are changed). If we consider local density to be a surrogate for how viable a patch is in the landscape then, the thin linear features of linkages score a low viability score (they are expensive and difficult shapes to manage) but they serve a role in joining the large, compact remnant vegetation patches such as Bold Park or Kings Park.
Figure 5 (Appendix B) shows the impact of increased vegetation within the landscape by incorporating vegetation within 25 m buffers of all POS areas with no remnant vegetation mapped. In most instances, the ‘connectivity quality (local)’ or ‘connectivity viability’ increased compared to its status in the scenario with only remnant vegetation and wetlands. In some instances, where the shape of the remnant patch is extended by adding the 25 m wide strip to the cadastral boundary of the reserve, the impact is reversed, the connectivity viability value decreased (See portions of BFS 315, BFS 331, BFS 220 or BFS 48 in Figure 7). This is due to large cleared areas being added to the existing remnant patch group within the defined 10, 20, 50, 100, 250 m buffers. It is reasonable to assume that if the same amount of assumed vegetation increase due to the 25 m buffer within that reserve was added to the remnant patch rather than distributed along the reserve boundary, the connectivity viability for that patch would increase. However, this variation would need to be tested.

support documentCapital City Planning Framework
16
Adding large and medium trees to the landscape has effects on ‘connectivity quality’ and ‘connectivity viability’. There is a minor positive benefit (in the order of 5-10%) to the viability of remnant bushland (particularly small patches) as the increased density in surrounding vegetation reinforces what is in a remnant.
However, because the tree canopies in the urban landscape are very fragmented and dispersed - like grains of sand scattered on the map - they have a small negative effect on connectivity quality (regional) in remnants. This is because connectivity quality is calculated not just for individual patches but across a whole matrix of patches (based on proximity to each other at several distances) and free-standing trees of a certain class tend to drag the quality down because they are very small patches surrounded by a lot of space.
If the combined data layer was created using all vegetation height classes which would represent areas where native vegetation can be identified within lands adjoining mapped remnant vegetation, these areas could be included in future ‘connectivity reach’ and ‘connectivity viability and quality’ modelling. However, without the ability to identify what proportion of the mapped trees and shrubs are native or the consideration of the ability of some target native fauna to utilise the present exotic species, use of the dataset is limited. The vegetation height information can be used to support future field assessment planning during the implementation phase of the Regional Parklands.
Additional comments
The vegetation heights data was captured at a very high resolution, 10cm. Even when supplied at reduced resolution (2 m and 5 m), the generated products consisted of very large files considering the relatively small project areas. Using the datasets across the whole metropolitan area will be beyond the technical capacity of many spatial data users.

central Perth regional parklands concept Vegetation connectivity analysis 17
6 Recommendations
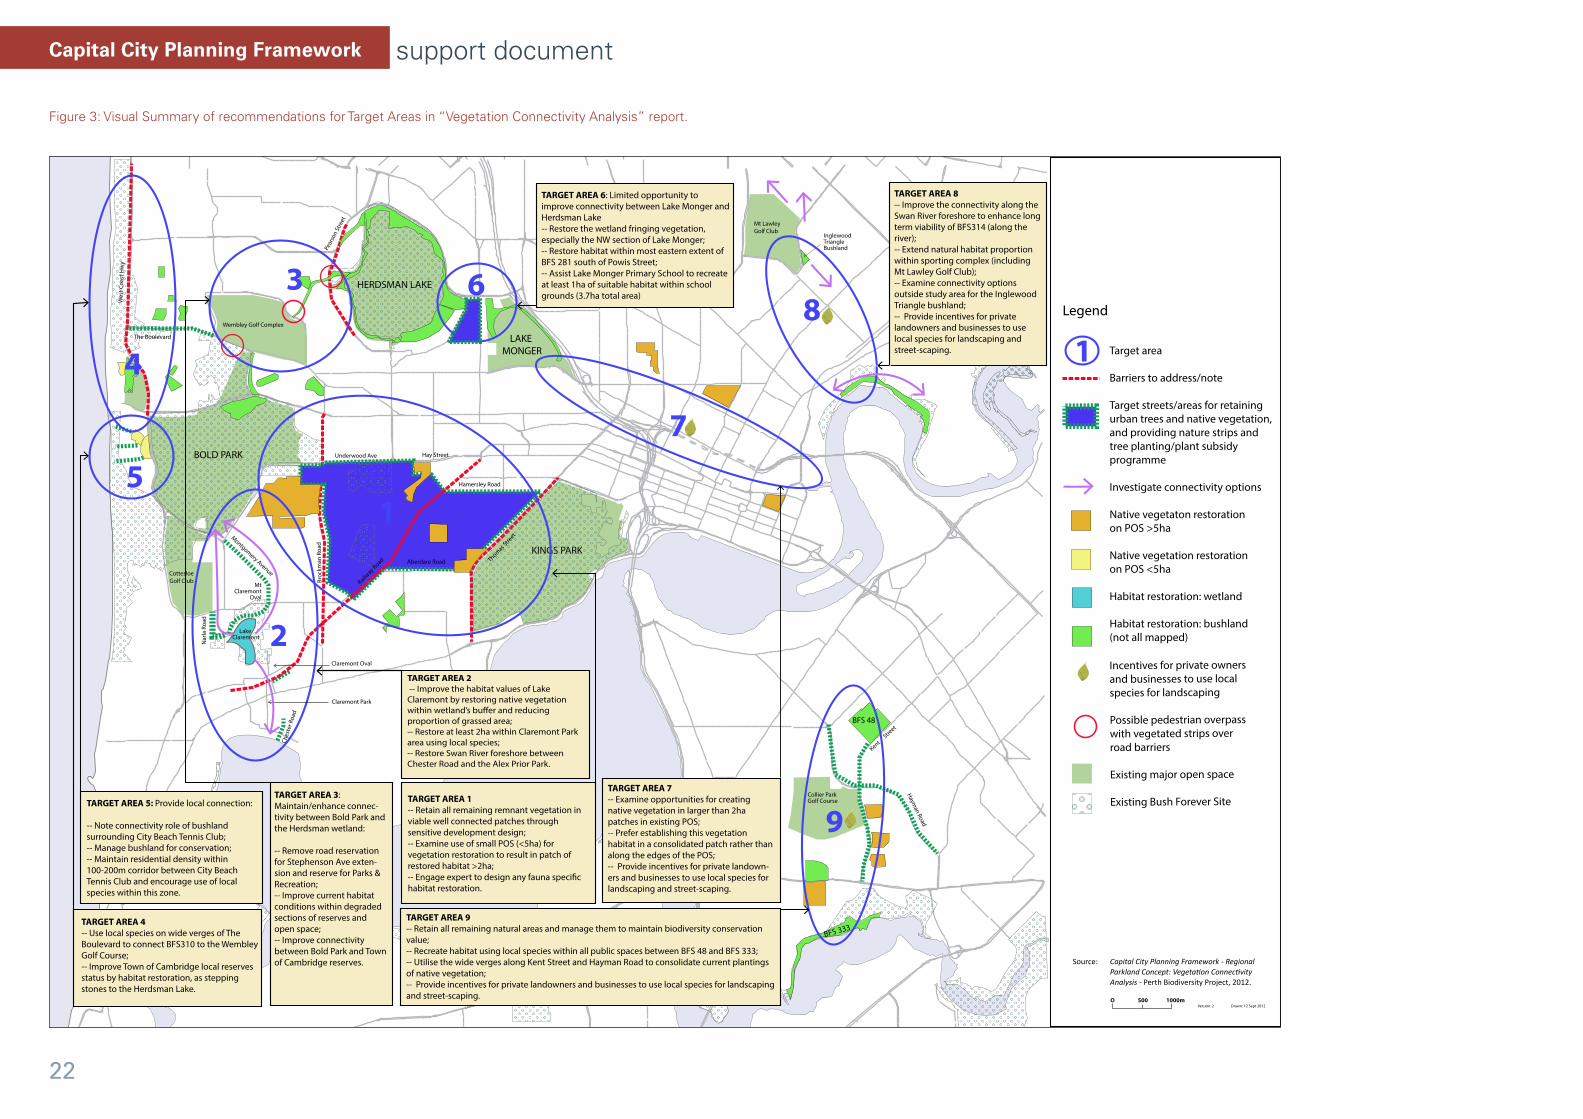
6.1 Thoughts on connectivity improvement strategies within Target AreasFigure 2 shows the location of Target Areas discussed in this section.
See also Figure 3 Visual Summary Recommendations Target Areas in Vegetation Connectivity Analysis Report.
21
5 Recommendations 5.1 Thoughts on connectivity improvement strategies within Target Areas Figure 2 shows the location of Target Areas discussed in this section.
Figure 2: Location of Target Areas where opportunities for improved connectivity were examined in more detail. Target Area 1 Target Area 1 includes two BFSs between Kings Park and Bold Park. While these two smaller BFSs, including the adjoining remnant vegetation are separated from each other by less than 100m of cleared area, they are more than 1000m away from Bold Park and Kings Park, the two large bushland reserves. Securing the remaining vegetation between BFS 218 and BFS 119 and improving connections to Bold Park and Kings Park would improve the long term viability of all connected bushland areas.
8
4
3
2 1
6
7
9
5
Figure 2: Location of Target Areas where opportunities for improved connectivity were examined in more detail.

support documentCapital City Planning Framework
18
• Review the use of small POS areas (<5 ha) and examine opportunities for vegetation restoration within these that would result in a patch of restored habitat larger than 2 ha.
• Engage the services of an adequately qualified expert to assist with the design of any fauna specific habitat restoration project.
• Examine opportunities for minimising the impacts of major roads intersecting the direction of the corridor between Bold Park and Kings Park, such as Thomas Street, Railway Road and Brockway Road.
• Consider retaining residential densities and street scapes that provide for nature strips and private gardens with native trees and native vegetation of varied structure. Target households within these residential areas with native plant subsidy programs, already operating in the study area. In particular, consider the residential and other use bounded by the following streets: Hamersley Road to Railway Road, McCallum Avenue, Robert Street through Wilsmore to Hay Street, Underwood Avenue to Bold Park; and in the southern extent from Aberdare Road, Railway Road, Quintilian Road, Brockway and through the UWA Sports Park to Bold Park.
Target Area 2
The main objective for Target Area 2 should be improving the habitat values of the Lake Claremont (BFS 220) and improving its connectivity to the Swan River and through to Bold Park.
Recommendations for Target Area 2
• Improve the habitat value of Lake Claremont by restoring the native vegetation within the wetland’s buffer and reducing the proportion of grassed areas.
• Connectivity to Bold Park can be facilitated through remnant bushland adjoining the Mt Claremont oval, through Pine Tree Park and street-scaping. Any restoration work and planting within the Mt Claremont Reserve should adjoin the existing remnant vegetation as well as improve its quality. Consider introducing local species in street-scaping along Montgomery Avenue at least to the extent of the remnant patch on the corner of Rochdale Road and Stephenson Avenue in Mt Claremont.
• Another opportunity to connect Lake Claremont to Bold Park exists through the green link along the Eastway Cr, along Narla Road and through the Cottesloe Golf Course.
Target Area 1
Target Area 1 includes two BFSs between Kings Park and Bold Park. While these two smaller BFSs, including the adjoining remnant vegetation are separated from each other by less than 100 m of cleared area, they are more than 1000 m away from Bold Park and Kings Park, the two large bushland reserves. Securing the remaining vegetation between BFS 218 and BFS 119 and improving connections to Bold Park and Kings Park would improve the long term viability of all connected bushland areas.
As Figure 3 (Appendix B) demonstrates, further loss of vegetation in this area will result in significant change of connectivity status of BFS 119 and BFS 218. The ‘connectivity reach’ value is higher for BFS119 due to its proximity to Bold Park. However, loss of any part of this bushland would affect not only the viability of the BFS119 but also BFS 218.
The important role of well-connected local reserves can be demonstrated through results of the connectivity analysis presented in Figure 4 (Appendix B). The POS areas with ‘connectivity reach’ value over 26.97 are within 500-600 m of each other. Many of these areas are larger than 5 ha and therefore it is reasonable to consider them as opportunities for future restoration projects using native vegetation, where areas between 2-4 ha of restored native vegetation could be created while still allowing the current, possibly more active uses of the reserves. For example, Jualbup Lake is within a reserve of 8.8 ha. While achievement of a 100 m wide vegetated area, as recommended by the guiding principles in Section 3.2, is not feasible due to the wetland’s location in the centre of the reserve, 50-80 m wide east-west corridor of restored native vegetation could be created. It should be noted that large proportion of the current vegetation consists of mostly introduced species and the need to replace them with more suitable local plants is acknowledged (ATA Environmental 2005).
Recommendations for Target Area 1
• Aim to retain all remaining remnant vegetation in viable well connected patches through sensitive development design.
• Assess the opportunities for native vegetation restoration within POS areas larger than 5 ha and with ‘connectivity reach’ value higher than 26.97. When designing areas to be re-planted, consider the general principles for the establishment of ecological linkages.

central Perth regional parklands concept Vegetation connectivity analysis 19
Target Area 4
Consolidating and restoring the remaining vegetation along the coastal zone is critical to accommodating the south-north migration and to maintaining the high diversity of reptile species in the region. There is evidence of species exchange between the foreshore populations and those in the Bold Park. However, the West Coast Highway forms a significant barrier (Botanic Garden and Parks Authority 2000).
Opportunities exist to strengthen the connection between the Herdsman Lake and the coast through local parks managed by the Town of Cambridge such as the Beecroft Park in City Beach; and along The Boulevard.
Recommendations for Target Area 4
• Investigate options for reducing the barrier effect of the West Coast Highway on portions of BFS 310.
• Use local species on the wide verges of The Boulevard to connect the BFS 310 to the Wembley Golf Course.
• Through habitat restoration, improve the status of all local reserves managed by the Town of Cambridge as stepping stones to the Herdsman Lake.
Target Area 5
This area has been included as it provides for connection at local level, between Bold Park and the Coastal Reserve. There are two POS areas including remnant vegetation that creates a 45-200 m wide corridor. The widest break between the POS areas in the foreshore bushland reserve is around 100 m. Maintenance of connectivity between these POS area and the coastal foreshore reserve could be improved by retaining at current densities residential areas within a 100-200 m wide corridor and through targeted plant subsidy scheme to encourage use of local species in residential areas within this section.
Recommendations for Target Area 5
• Recognise the connectivity role of the bushland surrounding the City Beach Tennis Club.
• Manage bushland for conservation.
• Connect Lake Claremont to the Swan River through the southern corner the Claremont oval, Claremont Park (<600 m) and along Chester Road to the Swan River foreshore (adjoining the Alex Prior Park). The railway and Stirling Highway present a major barrier, but to minimise its impact, consider planting of suitable local species within the section of the railway reserve between Leura Avenue and Vaucluse Avenue.
• Identify at least 2 ha within the Claremont Park area to be restored using local species.
• Restore the Swan River foreshore between Chester Road and the Alex Prior Park.
Target Area 3
The primary objective for this area is to maintain and where possible enhance the connectivity between Bold Park and the Herdsman wetland. There are significant remnant vegetation patches between the northern section of Bold Park and the western section of the Herdsman Lake, within the Wembley Golf Course and within the proposed Stephenson Road extension. The largest gap within this link is the 25 m wide Pearson Street. The narrowest section of this corridor is around 55 m which could be potentially extended within the adjoining school grounds. There is a major drain between the Herdsman wetland and the Wembley golf course that provides another opportunity for connecting the two significant bushland areas.
Recommendations for Target Area 3
Remove the road reservation for the proposed Stephenson Avenue extension and reserve for Parks and Recreation.
• Improve current habitat conditions and provisions within degraded sections of the Herdsman wetlands reserve, potential new Parks and Recreation reservation (Stephenson Road reserve), the POS on the corner of Silkwood Turn and Dolomite Court, Wembley Golf Course, the northern section of Bold Park and along the drain.
• Investigate the feasibility of pedestrian overpasses with vegetated strips over Pearson Street, Empire Avenue and The Boulevard at strategic locations to maximise opportunities for fauna movement.
• Improve connectivity between Bold Park and Town of Cambridge reserves, including the Roscommon Reserve and the McLean Park.

support documentCapital City Planning Framework
20
• When establishing native vegetation habitat, do not spread the planted area along the edges of the POS but rather aim to create a consolidated patch within a section of the POS.
• Provide incentives for private landowners and businesses to use local species for landscaping and street-scaping.
Target Area 8
Similar to Target Area 7, this section is within highly urbanised landscape, with no remnant vegetation mapped, except within the two areas to be connected. Along the Swan River, BFS 314 extends and the nearest bushland area, the Inglewood Triangle Reserve and the adjoining Mt Lawley Golf Club, are more than 2 km away in the north-west direction. There are four POS areas between the BFS 314 and the Inglewood Triangle Bushland, with only one being about 2 ha.
Recommendations for Target Area 8
• To improve long term viability of the BFS 314, improve connectivity along the Swan River foreshore.
• Extend natural habitat proportion within the sporting complex that includes the Mt Lawley golf club.
• Examine connectivity options outside the study area for the Inglewood Triangle bushland.
• Provide incentives for private landowners and businesses to use local species for landscaping.
Target Area 9
The main objective in the Target Area 9 is to increase the connectivity of one of the most isolated regionally significant bushland areas, BFS 48. There are negligible opportunities to connect BFS 48 to the Swan River north. However, opportunities exist to improve connectivity to the Canning River, south of the BFS 48. This area includes the DEC offices, CSIRO Science Park, Collier Park golf course and the Curtin University. Through couple of local POS areas, including some with native vegetation, the BFS 333 can be reached.
• Maintain residential density within a 100-200 m corridor between the City Beach Tennis Club and encourage use of local species within this zone.
Target Area 6
While the overall distance between Lake Monger and the Herdsman Lake is less than 1000 m, opportunities for improving the connectivity quality are limited.
Recommendations for Target Area 6
• Restore the wetland fringing vegetation and vegetation within the wetland buffer with high priority given to the north-west section of Lake Monger.
• Restore the habitat within the most eastern extent of BFS 281 south of Powis Street.
• Assist the Lake Monger Primary School to recreate at least 1 ha of suitable habitat within school grounds (3.7 ha total area).
• All street scaping and residential areas between Powis Street and Collier Street level should be encouraged through local plant subsidy programs to use local plants.
Target Area 7
This area represents a region where wetlands stretched from the Swan River to Lake Monger which was twice its current size. The area is densely urbanised, with no remnant vegetation mapped. However, it includes several local reserves, where opportunities for establishment of habitat to accommodate more mobile bird species could be examined. Most POS areas are less than 2 ha in size and are more than 500 m apart.
Recommendations for Target Area 7
• Examine opportunities for recreating native vegetation in larger than 2 ha patches, with particular focus on the following POS areas: Wellington Square, Hyde Park, Len Fletcher Sports Pavilion and the adjoining Charles Veryard Reserve and the Brittania Road Reserve.
central Perth regional parklands concept Vegetation connectivity analysis 21
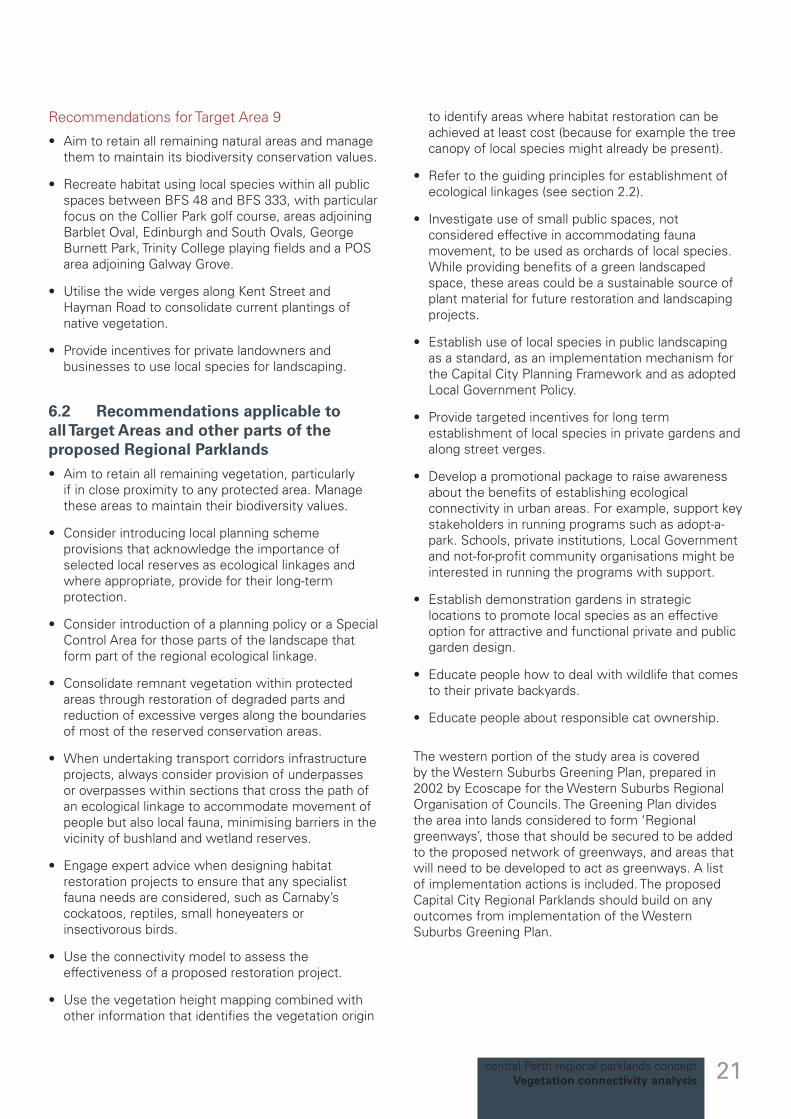
to identify areas where habitat restoration can be achieved at least cost (because for example the tree canopy of local species might already be present).
• Refer to the guiding principles for establishment of ecological linkages (see section 2.2).
• Investigate use of small public spaces, not considered effective in accommodating fauna movement, to be used as orchards of local species. While providing benefits of a green landscaped space, these areas could be a sustainable source of plant material for future restoration and landscaping projects.
• Establish use of local species in public landscaping as a standard, as an implementation mechanism for the Capital City Planning Framework and as adopted Local Government Policy.
• Provide targeted incentives for long term establishment of local species in private gardens and along street verges.
• Develop a promotional package to raise awareness about the benefits of establishing ecological connectivity in urban areas. For example, support key stakeholders in running programs such as adopt-a-park. Schools, private institutions, Local Government and not-for-profit community organisations might be interested in running the programs with support.
• Establish demonstration gardens in strategic locations to promote local species as an effective option for attractive and functional private and public garden design.
• Educate people how to deal with wildlife that comes to their private backyards.
• Educate people about responsible cat ownership.
The western portion of the study area is covered by the Western Suburbs Greening Plan, prepared in 2002 by Ecoscape for the Western Suburbs Regional Organisation of Councils. The Greening Plan divides the area into lands considered to form ‘Regional greenways’, those that should be secured to be added to the proposed network of greenways, and areas that will need to be developed to act as greenways. A list of implementation actions is included. The proposed Capital City Regional Parklands should build on any outcomes from implementation of the Western Suburbs Greening Plan.
Recommendations for Target Area 9
• Aim to retain all remaining natural areas and manage them to maintain its biodiversity conservation values.
• Recreate habitat using local species within all public spaces between BFS 48 and BFS 333, with particular focus on the Collier Park golf course, areas adjoining Barblet Oval, Edinburgh and South Ovals, George Burnett Park, Trinity College playing fields and a POS area adjoining Galway Grove.
• Utilise the wide verges along Kent Street and Hayman Road to consolidate current plantings of native vegetation.
• Provide incentives for private landowners and businesses to use local species for landscaping.
6.2 Recommendations applicable to all Target Areas and other parts of the proposed Regional Parklands• Aim to retain all remaining vegetation, particularly
if in close proximity to any protected area. Manage these areas to maintain their biodiversity values.
• Consider introducing local planning scheme provisions that acknowledge the importance of selected local reserves as ecological linkages and where appropriate, provide for their long-term protection.
• Consider introduction of a planning policy or a Special Control Area for those parts of the landscape that form part of the regional ecological linkage.
• Consolidate remnant vegetation within protected areas through restoration of degraded parts and reduction of excessive verges along the boundaries of most of the reserved conservation areas.
• When undertaking transport corridors infrastructure projects, always consider provision of underpasses or overpasses within sections that cross the path of an ecological linkage to accommodate movement of people but also local fauna, minimising barriers in the vicinity of bushland and wetland reserves.
• Engage expert advice when designing habitat restoration projects to ensure that any specialist fauna needs are considered, such as Carnaby’s cockatoos, reptiles, small honeyeaters or insectivorous birds.
• Use the connectivity model to assess the effectiveness of a proposed restoration project.
• Use the vegetation height mapping combined with other information that identifies the vegetation origin
22
support documentCapital City Planning Framework
Figure 3: Visual Summary of recommendations for Target Areas in “Vegetation Connectivity Analysis” report.
BOLD PARK
KINGS PARK
HERDSMAN LAKE
LAKE MONGER
Mt LawleyGolf Club
Collier Park Golf Course
O 500 1000mVersion: 2 Drawn: 12 Sept 2012
Target area
Barriers to address/note
Target streets/areas for retaining urban trees and native vegetation, and providing nature strips and tree planting/plant subsidy programme
Investigate connectivity options
Native vegetaton restoration on POS >5ha
Native vegetation restorationon POS <5ha
Habitat restoration: wetland
Habitat restoration: bushland (not all mapped)
1
Incentives for private ownersand businesses to use local species for landscaping
Possible pedestrian overpass with vegetated strips over road barriers
Existing major open space
Existing Bush Forever Site
Source: Capital City Planning Framework - Regional Parkland Concept: Vegetation Connectivity Analysis - Perth Biodiversity Project, 2012.
Legend
BFS 333
BFS 48
Inglewood TriangleBushland
2
1
3
4
5
6
7
8
9TARGET AREA 1-- Retain all remaining remnant vegetation in viable well connected patches through sensitive development design;-- Examine use of small POS (<5ha) for vegetation restoration to result in patch of restored habitat >2ha;-- Engage expert to design any fauna speci�c habitat restoration.
TARGET AREA 2 -- Improve the habitat values of Lake Claremont by restoring native vegetation within wetland’s bu�er and reducing proportion of grassed area;-- Restore at least 2ha within Claremont Park area using local species;-- Restore Swan River foreshore between Chester Road and the Alex Prior Park.
CottesloeGolf Club
Lake Claremont
MtClaremont
Oval
Claremont Oval
TARGET AREA 5: Provide local connection:
-- Note connectivity role of bushland surrounding City Beach Tennis Club;-- Manage bushland for conservation;-- Maintain residential density within 100-200m corridor between City Beach Tennis Club and encourage use of local species within this zone.
TARGET AREA 4-- Use local species on wide verges of The Boulevard to connect BFS310 to the Wembley Golf Course;-- Improve Town of Cambridge local reserves status by habitat restoration, as stepping stones to the Herdsman Lake.
TARGET AREA 3: Maintain/enhance connec-tivity between Bold Park and the Herdsman wetland:
-- Remove road reservation for Stephenson Ave exten-sion and reserve for Parks & Recreation;-- Improve current habitat conditions within degraded sections of reserves and open space;-- Improve connectivity between Bold Park and Town of Cambridge reserves.
TARGET AREA 6: Limited opportunity to improve connectivity between Lake Monger and Herdsman Lake-- Restore the wetland fringing vegetation, especially the NW section of Lake Monger;-- Restore habitat within most eastern extent of BFS 281 south of Powis Street;-- Assist Lake Monger Primary School to recreate at least 1ha of suitable habitat within school grounds (3.7ha total area)
TARGET AREA 7-- Examine opportunities for creating native vegetation in larger than 2ha patches in existing POS;-- Prefer establishing this vegetation habitat in a consolidated patch rather than along the edges of the POS;-- Provide incentives for private landown-ers and businesses to use local species for landscaping and street-scaping.
TARGET AREA 8-- Improve the connectivity along the Swan River foreshore to enhance long term viability of BFS314 (along the river);-- Extend natural habitat proportion within sporting complex (including Mt Lawley Golf Club);-- Examine connectivity options outside study area for the Inglewood Triangle bushland;-- Provide incentives for private landowners and businesses to use local species for landscaping and street-scaping.
TARGET AREA 9-- Retain all remaining natural areas and manage them to maintain biodiversity conservation value;-- Recreate habitat using local species within all public spaces between BFS 48 and BFS 333;-- Utilise the wide verges along Kent Street and Hayman Road to consolidate current plantings of native vegetation;-- Provide incentives for private landowners and businesses to use local species for landscaping and street-scaping.
Kent S
treet
Hayman Road
Claremont Park
Broc
kman
Roa
d
Aberdare Road
Hamersley Road
Railway Road
Wes
t Coa
st H
wy
Pear
son
Stre
et
Thomas S
treet
Hay StreetUnderwood Ave
Montgomery Avenue
Nar
la R
oad
Ches
ter R
oad
The Boulevard
Wembley Golf Complex

central Perth regional parklands concept Vegetation connectivity analysis 23
Dixon K (2011) Coastal Plants. A guide to the identification and restoration of plants of the Perth region. CSIRO Publishing, Collingwood.
Environmental Protection Authority (2003). Guidance for the Assessment of Environmental Factors No 10: level of assessment for proposals affecting natural areas within System 6 region and Swan Coastal Plain portion of the System 1 Region. Environmental Protection Authority, Perth.
Environmental Protection Authority (2008). Guidance Statement No 33: Environmental Guidance for Planning and Development. Environmental Protection Authority, Perth.
Environmental Protection Authority (2009). Environmental Protection Bulletin No 8: South West Regional Ecological Linkages. Environmental Protection Authority, Perth.
Government of Western Australia (2000). Bush Forever Volume 2: Directory of Bush Forever Sites. Western Australian Planning Commission, Perth.
Government of Western Australia (2007). State of the Environment Report, draft 2006. Environmental Protection Authority, Perth.
How R.A. (1998). Long-term sampling of a herpetofaunal assemblage on an isolated urban bushland remnant, Bold Park, Perth. Journal of the Royal Society of Western Australia 81, 143-8.
How R.A. and Dell J. (1990). Vertebrate fauna of Bold Park, Perth. The Western Australian Naturalist 18, 122-31.
How R.A. and Dell J. (1994). The zoogeographic significance of urban bushland remnants to reptiles in the Perth region, Western Australia. Pacific Conservation Biology, 1, 132-140.
K. Kauhanen, J. Chambers and F. D’Souza (Eds.) (2011) Report Card of Climate Change and Western Australian Aquatic Ecosystems. National Climate Change Adaptation Facility, Murdoch University.
Molloy, S., Wood, J., Hall, S., Wallrodt, S. and Whisson, G. (2009). South West Regional Ecological Linkages Technical Report, Western Australian Local Government Association and Department of Environment and Conservation, Perth.
Perth Biodiversity Project (2011). Regional Framework for Local Biodiversity Conservation Priorities for Perth and Peel. Unpublished report.
Van Delft, R. (1997). Birding Sites around Perth. UWA Publishing, Perth.
ReferencesATA Environmental (2005). Environmental Improvement Assessment Stage 1 – Jualbup Lake, Shenton Park. Report prepared for the City of Subiaco.
Australian New Zealand Environment and Conservation Council (ANZECC) (2000). Core Environmental Indicators for Reporting on the State of the Environment. ANZECC State of the Environment Reporting Task Force. March 2000.
Barrett, R. L. and Eng Pin Tay (2005). Perth plants: a field guide to the bushland and coastal flora of Kings Park and Bold Park, Perth, Western Australia. Botanic Gardens and Parks Authority, Perth.
Brearley, A (2005). Ernest Hodgkin’s Swanland: Estuaries and Coastal lagoons of South-Western Australia, National Trust and Anne Brearly, UWA Publishing, Perth.
Botanic Gardens and Parks Authority (2000). Bold Park Environmental Management Plan 2000-2005. Botanic Gardens and Parks Authority, Perth.
City of Perth (1992). Lake Monger Management Plan 1993-1998 Part 1: Background. City of Perth.
Commonwealth of Australia (2010). Australia’s Biodiversity Conservation Strategy. Natural Resource Management Ministerial Council, Canberra.
Commonwealth of Australia (2001). National targets and Objectives for Biodiversity Conservation 2001-2005, AGPS, Canberra.
CSIRO, Australian Bureau of Meteorology. 2007. Climate change in Australia: technical report 2007. CSIRO. 148 pp.
Environment Australia (2001). A Directory of Important Wetlands in Australia. Environment Australia, Canberra.
Davis, R.A. and Brooker, L. (2008). Ecological Linkages and Urban Fauna at Risk on the Swan Coastal Plain, Perth, Western Australia. Final Report. Unpublished report prepared for the Swan Catchment Council.
Del Marco, A., Taylor, R., Clarke, K., Savage, K., Cullity, J. and Miles, C. (2004). Local Government Biodiversity Planning Guidelines for the Perth Metropolitan Region. Western Australian Local Government Association and Perth Biodiversity Project, Perth.
Department of Agriculture and Food (2011). 2010 remnant vegetation extent mapping. Metadata statement. Department of Agriculture and Food, Western Australia.
Department of Conservation and Land Management (2004). Herdsman Lake Regional Park 2004-2013 Management Plan, Department of Conservation and Land Management and the City of Stirling.

support documentCapital City Planning Framework
24
Appendices
Appendix ANew Shape Classifiers for Remnant Vegetation
APPENDIX A
New Shape Classifiers for Remnant Vegetation by Teik Oh, of Fluffy Software PL What is the ideal shape for a vegetation remnant? Assuming there are no topographical, planning or other constraints a circle is the ideal shape for a remnant as drawn on a 2-D map. A circle has the following properties:
• Minimum boundary length to area ratio for a size of patch. A circle is the most compact shape to represent a particular size of patch.
• Greatest self-connectivity. With a circle the average distance of any two randomly chosen points within the patch (over many samples) is lower than any other shape.
These properties correspond to conventional wisdom in bushland management and ecology of minimising boundary lengths of remnant vegetation (fencing and weed management costs) and maximising ecological connectivity. Given that remnant vegetation is, by definition, “what’s left” we don’t have the luxury of reconfiguring remnant shapes but instead need measures for assessing the distribution and shape of remnants as they are. Shape classifiers can give insight into the spatial properties of remnant patches – not just how large they are as with a standard GIS summary – but how their shapes, positions and sizes affect their ecological attributes particularly connectivity. Shape classifiers produce a number to describe something about a shape. This paper examines a traditional and some new shape classifiers to see what they can tell us about remnant vegetation distribution. Remnant vegetation in a landscape is comprised of a collection of physically separate patches. A patch may contain different types of vegetation but this variation is not considered in this discussion. Perimeter to Area Ratio Perimeter to area ratio is widely used as a measure of remnant management viability in bushland management. PA = P / A The idea is that shorter boundaries and larger areas are good properties for a remnant so remnants with a low PA ratio are more viable than areas with a higher

central Perth regional parklands concept Vegetation connectivity analysis 25
PA ratio. The measure is not dimensionless with the units being the inverse of length. The definition is certainly intuitive but what does it look like when applied to a diverse range of remnants? Below is a map showing PA ratio for remnants from Garden Island to the scarp with dark green patches having lowest PA ratio and red the highest values:
When applied regionally we notice that patch size is the dominant parameter. As area varies to the square of length, large patches have a low PA ratio irrespective of their shape. Thin linear features are not well-distinguished from more compact shapes. Conversely, small areas have a high PA ratio. So, the PA ratio doesn’t tell us very much when looking across a diverse landscape. Perimeter Squared to Area Ratio - Circularity To counter the effect of patch size dominating PA ratio the following modification to the formula derived from the isoperimetric inequality for shapes (http://en.wikipedia.org/wiki/Isoperimetric_quotient) is introduced: P2A = P2 / A

support documentCapital City Planning Framework
26
By using the square of perimeter the formula is converted into a dimensionless measure of shape as the units cancel out. Further, the measure is scaleless and is a pure measure of the circularity of a shape – how much like a circle it is. Circles have the lowest P2A ratio and as described in the introduction are the “ideal” patch shape. The scaleless property means that a patch that has exactly the same boundary shape (e.g. rectangle) as one that is 10 times smaller (a smaller rectangle with same width to height ratio) will have the same P2A ratio. The following map is coloured as with P2A ratio such that green = low P2A ratio, red = high P2A ratio:
Compact patches are green and thin linear features are well identified as orange-red. Patches with a complicated boundary but otherwise compact show up as yellow-orange. Shape and Scale The P2A ratio provides a convenient single number to describe how close to the ideal circle the shape of a patch is. It is a scaleless measure independent of the size of the shape. However, much of our understanding of physical phenomena depends very much on scale – not just in the way we measure them but how we define them.

central Perth regional parklands concept Vegetation connectivity analysis 27
Consider a whole-of-state view of Western Australia. When displayed on a computer monitor and with the finite resolution of human vision we can perceive the Swan River estuary as a fairly simple shape. As we increase the magnification more detail of the estuary boundary and minor tributaries can be seen. As we zoom in further even minor tributaries become complicated shapes. At each zoom level we can see landscape features at a particular range of detail. Features that are too small cannot be seen and features that are very large may not be apparent because the rate of change of detail is low at the viewed scale. So, it is desirable to create scale-dependent measures of a distribution of shapes such as remnant vegetation in a landscape to help understand scale-specific phenomena. Buffered Boundary Classifier A new scale dependent shape classifier is introduced. For a given remnant patch P, a new shape is created by buffering P by a fixed distance d. The classifier is calculated as: C(P, d) = Area(P) / Area (P buf d) where Area() is a function calculating the area of a shape. C is a dimensionless measure as it is the ration of two areas. However, it is specified by d which is a distance and has a unit. Let’s apply these to some shapes:
The shapes are about the same size (10 units squared) with a buffer distance of 1 unit applied (green boundary). Shapes are labelled by calculated C value. Some observations:
• circle has highest C value – slightly larger than the square which is also very compact
• thin rectangle has lowest C value
• the fork shape has a higher value than you might expect given the complex shape but the distance between the fork tynes is < 1 unit.

support documentCapital City Planning Framework
28
Let’s reduce the buffer distance, d, to 0.1 units: Observations:
• circle and square have about the same values
• thin rectangle has moderate C value
• fork shape has lowest C value And with d increased to 10 units:
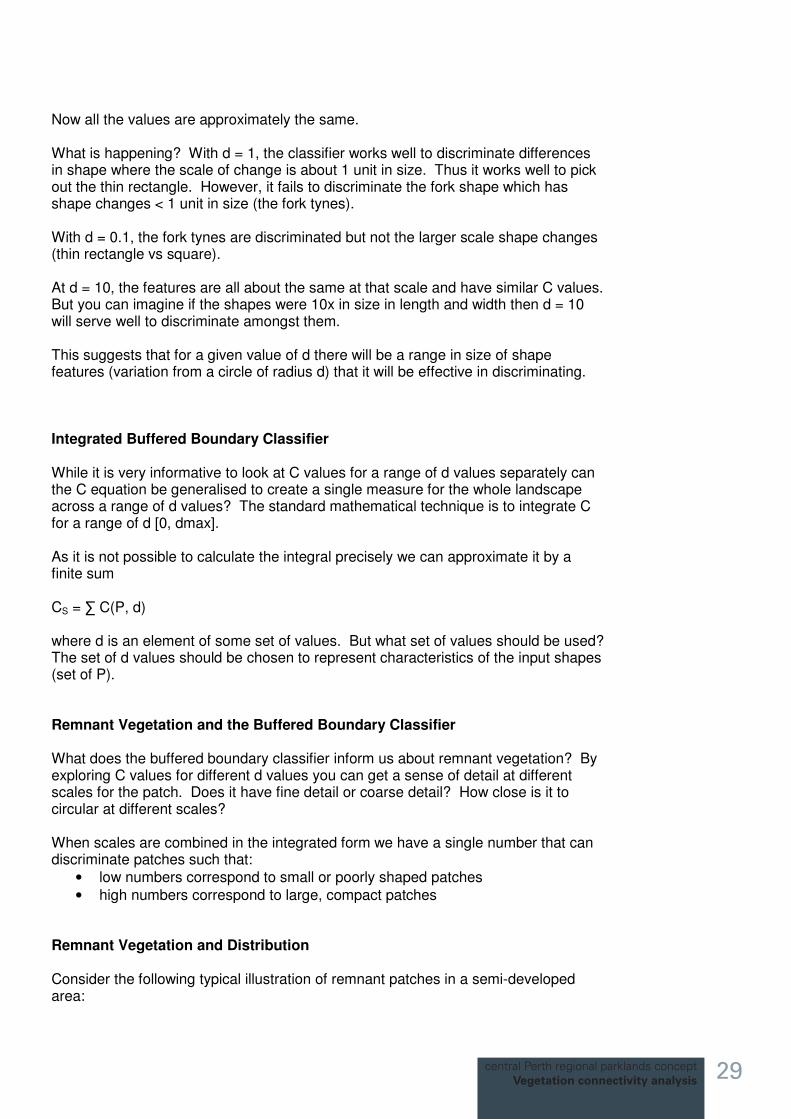
central Perth regional parklands concept Vegetation connectivity analysis 29
Now all the values are approximately the same. What is happening? With d = 1, the classifier works well to discriminate differences in shape where the scale of change is about 1 unit in size. Thus it works well to pick out the thin rectangle. However, it fails to discriminate the fork shape which has shape changes < 1 unit in size (the fork tynes). With d = 0.1, the fork tynes are discriminated but not the larger scale shape changes (thin rectangle vs square). At d = 10, the features are all about the same at that scale and have similar C values. But you can imagine if the shapes were 10x in size in length and width then d = 10 will serve well to discriminate amongst them. This suggests that for a given value of d there will be a range in size of shape features (variation from a circle of radius d) that it will be effective in discriminating. Integrated Buffered Boundary Classifier While it is very informative to look at C values for a range of d values separately can the C equation be generalised to create a single measure for the whole landscape across a range of d values? The standard mathematical technique is to integrate C for a range of d [0, dmax]. As it is not possible to calculate the integral precisely we can approximate it by a finite sum CS = C(P, d) where d is an element of some set of values. But what set of values should be used? The set of d values should be chosen to represent characteristics of the input shapes (set of P). Remnant Vegetation and the Buffered Boundary Classifier What does the buffered boundary classifier inform us about remnant vegetation? By exploring C values for different d values you can get a sense of detail at different scales for the patch. Does it have fine detail or coarse detail? How close is it to circular at different scales? When scales are combined in the integrated form we have a single number that can discriminate patches such that:
• low numbers correspond to small or poorly shaped patches
• high numbers correspond to large, compact patches Remnant Vegetation and Distribution Consider the following typical illustration of remnant patches in a semi-developed area:
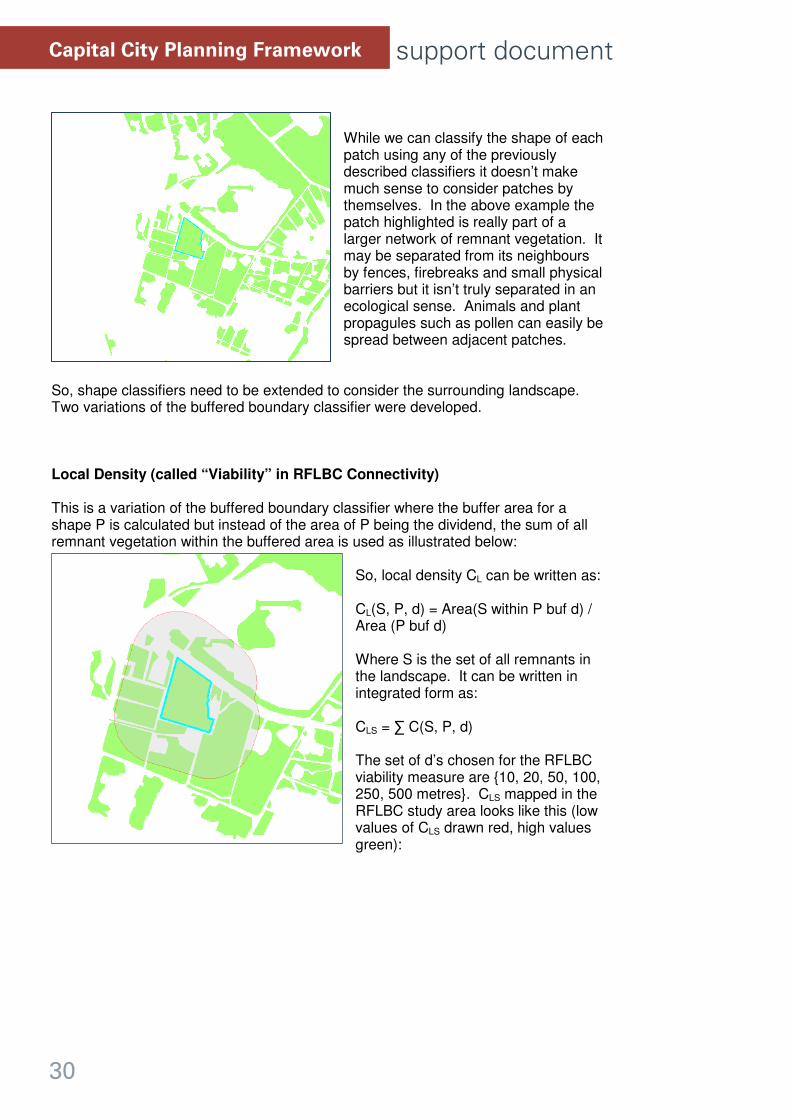
support documentCapital City Planning Framework
30
While we can classify the shape of each patch using any of the previously described classifiers it doesn’t make much sense to consider patches by themselves. In the above example the patch highlighted is really part of a larger network of remnant vegetation. It may be separated from its neighbours by fences, firebreaks and small physical barriers but it isn’t truly separated in an ecological sense. Animals and plant propagules such as pollen can easily be spread between adjacent patches.
So, shape classifiers need to be extended to consider the surrounding landscape. Two variations of the buffered boundary classifier were developed. Local Density (called “Viability” in RFLBC Connectivity) This is a variation of the buffered boundary classifier where the buffer area for a shape P is calculated but instead of the area of P being the dividend, the sum of all remnant vegetation within the buffered area is used as illustrated below:
So, local density CL can be written as: CL(S, P, d) = Area(S within P buf d) / Area (P buf d) Where S is the set of all remnants in the landscape. It can be written in integrated form as: CLS = C(S, P, d) The set of d’s chosen for the RFLBC viability measure are {10, 20, 50, 100, 250, 500 metres}. CLS mapped in the RFLBC study area looks like this (low values of CLS drawn red, high values green):

central Perth regional parklands concept Vegetation connectivity analysis 31
CLS discriminates patches such that:
• low numbers correspond to small, locally isolated or poorly shaped patches
• high numbers correspond to large, compact or locally well connected patches Regional Density (called “Vegetation Connection Quality” in RFLBC Connectivity) A variation on local density is regional density where the buffer is calculated on not just the selected patch but all patches that can be reached from the patch by travelling no more than d distance. This can be computed using standard GIS operations. CR(S, P, d) = Area(S within d of P) / Area ((S within d of P) buf d) There is a nice intuitive appeal to this. By using different values of d we can examine the potential range of an organism if it has a limited travel distance. In the following illustration a d of 20m is applied to the previous example patch:

support documentCapital City Planning Framework
32
You can see it is part of large network of patches all within 20m of each other. More isolated patches form smaller groups or are by themselves. The integrated form, CRS, can also be calculated and applied with same values of d as CLS {10, 20, 50, 100, 250, 500m}:

central Perth regional parklands concept Vegetation connectivity analysis 33
CRS discriminates patches such that:
• low numbers correspond to small, regionally isolated or poorly shaped patches
• high numbers correspond to large, compact or regionally well connected patches
Notice the Canning River system values for CLS and CRS. The high CRS value suggests it has a strong role in connecting the region. However, a low CLS value suggests that it is a fragile system. Reach Regional density for a patch involves calculating the neighbouring patches that may be traversable from the patch at a particular distance. Restated from above: CR(S, P, d) = Area(S within d of P) / Area ((S within d of P) buf d) The dividend of that expression: Area(S within d of P)

support documentCapital City Planning Framework
34
is the total area that can be accessed from a patch, P, by traversing no more than a patch gap of d. Calculated across the landscape larger area indicates patches which are part of a larger connective group than smaller areas. As there is tremendous variation within areas, a new parameter reach is calculated as follows: R(S, P, d) = log10(Area(S within d of P)) The logarithm is taken to give a sense of the scale of the area. Summed across a range of d distances this gives: RS = log10(Area(S within d of P)) where d is an element of some set of distances eg {10, 20, 50, 100, 250, 500m} Considered across a landscape, higher reach values indicate patches which are part of larger connected networks than patches with smaller reach values.

central Perth regional parklands concept Vegetation connectivity analysis 35
Appendix BList of figures from Section 5: Results
Fi
gure
1: 2
010
Rem
nant
veg
etat
ion
by n
umbe
r of e
colo
gica
l sig
nific
ance
crit
eria
, wet
land
s an
d pr
otec
ted
area
s

support documentCapital City Planning Framework
36
Fi
gure
2: 2
010
Rem
nant
veg
etat
ion
by ‘c
onne
ctiv
ity re
ach’
– S
cena
rio 1

central Perth regional parklands concept Vegetation connectivity analysis 37
Fi
gure
3: ‘
Con
nect
ivity
reac
h’ w
ithin
pro
tect
ed a
reas
onl
y –
Scen
ario
2

support documentCapital City Planning Framework
38
Fi
gure
4: 2
010
Rem
nant
veg
etat
ion
by ‘c
onne
ctiv
ity re
ach’
and
buf
fere
d PO
S ar
eas
– Sc
enar
io 3

central Perth regional parklands concept Vegetation connectivity analysis 39
Fi
gure
5: 2
010
Rem
nant
veg
etat
ion
by ‘c
onne
ctiv
ity v
iabi
lity’
– S
cena
rio 1

support documentCapital City Planning Framework
40
Fi
gure
6: ‘
Con
nect
ivity
via
bilit
y’ w
ithin
pro
tect
ed a
reas
onl
y –
Scen
ario
2

central Perth regional parklands concept Vegetation connectivity analysis 41
Fi
gure
7: 2
010
Rem
nant
veg
etat
ion
by ‘c
onne
ctiv
ity v
iabi
lity’
and
buf
fere
d PO
S ar
eas
– Sc
enar
io 3
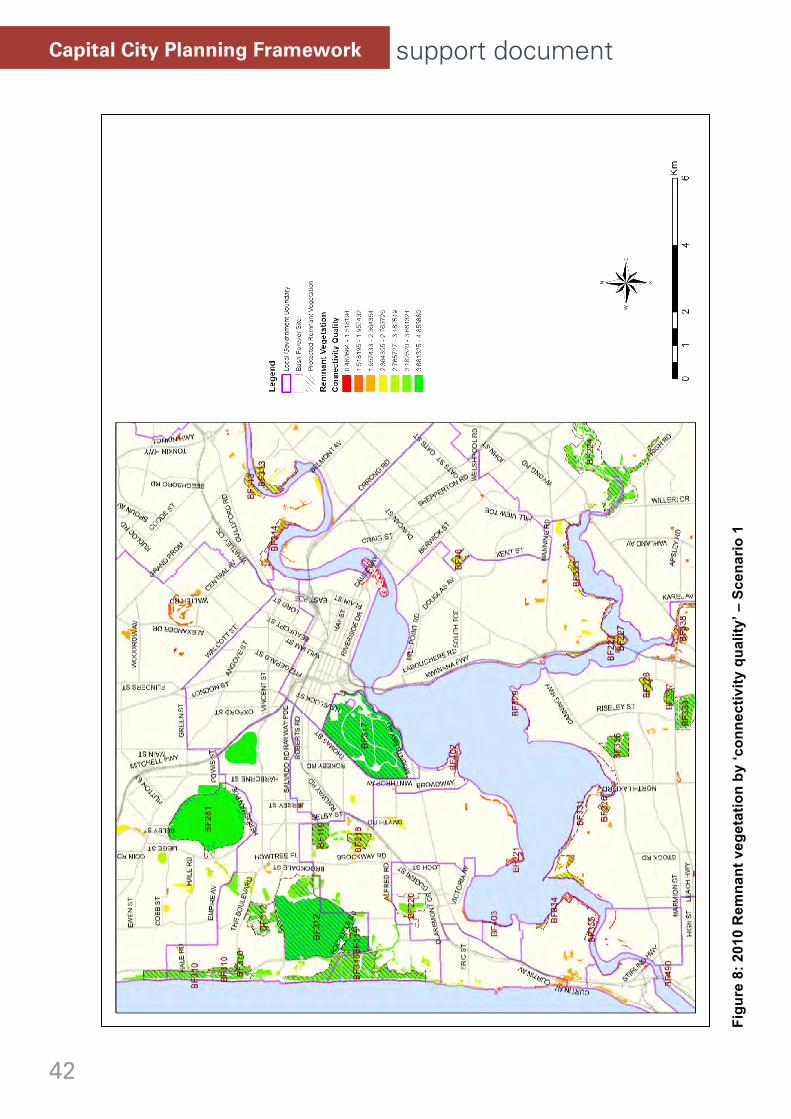
support documentCapital City Planning Framework
42
Fi
gure
8: 2
010
Rem
nant
veg
etat
ion
by ‘c
onne
ctiv
ity q
ualit
y’ –
Sce
nario
1
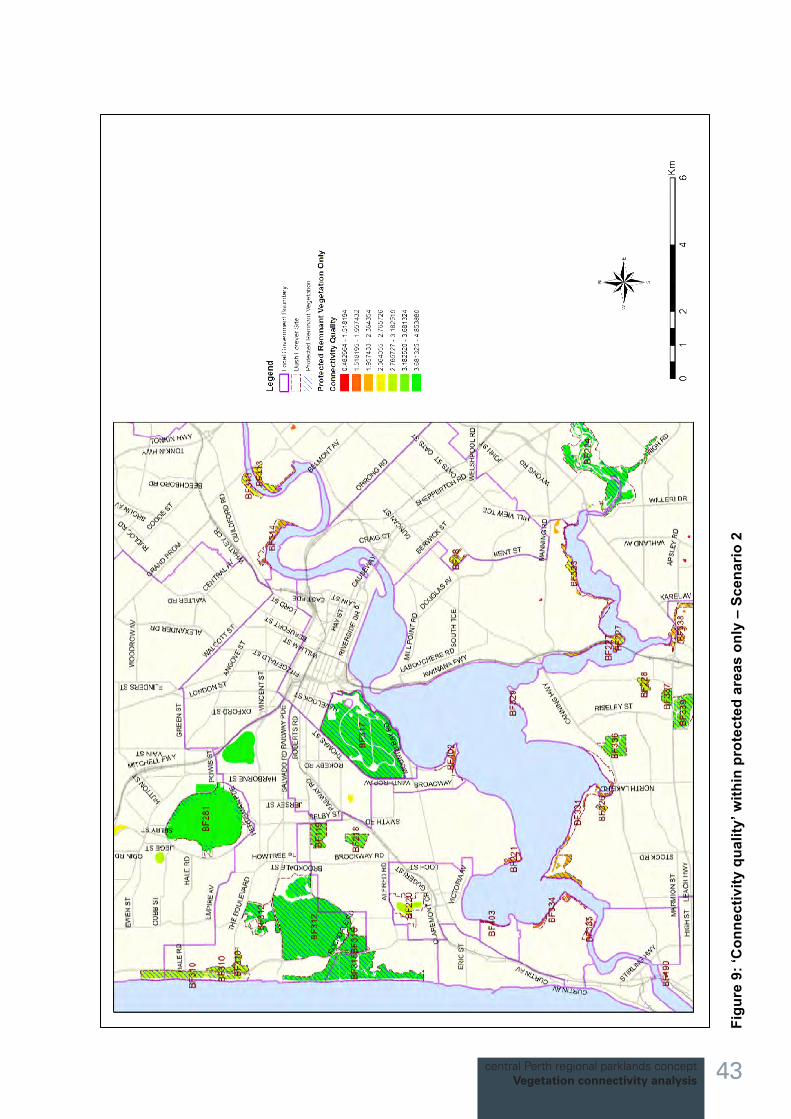
central Perth regional parklands concept Vegetation connectivity analysis 43
Fi
gure
9: ‘
Con
nect
ivity
qua
lity’
with
in p
rote
cted
are
as o
nly
– Sc
enar
io 2

support documentCapital City Planning Framework
44
Fi
gure
10:
201
0 R
emna
nt v
eget
atio
n by
‘con
nect
ivity
qua
lity’
and
buf
fere
d PO
S ar
eas
– Sc
enar
io 3

central Perth regional parklands concept Vegetation connectivity analysis 45
Fi
gure
11:
201
0 R
emna
nt v
eget
atio
n by
‘con
nect
ivity
reac
h’ w
ith b
uffe
red
POS
area
s an
d tr
ee a
nd s
hrub
ext
ent m
appi
ng

support documentCapital City Planning Framework
46
Fi
gure
12:
201
0 R
emna
nt v
eget
atio
n by
‘con
nect
ivity
qua
lity’
with
buf
fere
d PO
S ar
eas
and
tree
and
shr
ub e
xten
t map
ping

central Perth regional parklands concept Vegetation connectivity analysis 47
Appendix CTable 1: Level 1 Prioritisation – Assessment of ecological values within any portion of remnant vegetation (from page 6)
Table 1: Level 1 Prioritisation Criteria
Key to a Priority Field in the on-line
model Criteria
Spatial data representation of remnant vegetation extent within the
following categories
State and Federal Government legislation and policy supporting prioritisation criteria
Representation – Regional
P1_1
recognised international, national or regional conservation value
DEC Conservation Estate: National Park, Nature reserve, Conservation park, Section 5 (1) (g)
Environmental Protection and Biodiversity Conservation Act 1999 for some areas EPA Guidance Statement No 33 (Environmental Protection Authority, 2008) EPA Guidance Statement No 10 (Environmental Protection Authority, 2003) Forest Management Plan 2004-2013 (Conservation Commission, 2003) State Planning Policy 2.8: Bushland Policy for Perth Metropolitan Region (June 2010) Environmental Protection Bulletin No 12: Swan Bioplan – Peel Regionally Significant Natural Areas (December 2010) Statement of Planning Policy No 2: Environment and Natural Resources (Western Australian Planning Commission, 2003) Forest Management Plan 2004-2013 (Guidelines for Protection of the Values of Informal Reserves and Fauna Habitat Zones)
DEC Regional Parks
Bush Forever Sites
Peel Regionally Significant Natural Areas
Crown Reserves - 'Conservation type vesting'
Fauna Habitat Zone
Informal Reserves
DEC Conservation Covenants
Ramsar wetlands
Directory of Important Wetlands
P1_2a
of an ecological community with only 1500 ha or 30% or less remaining and <10% protected (formal) in the IBRA sub-region (here we use <or=40%))
2010 Vegetation extent by vegetation complexes: Bassendean complex Central & South, Beermullah, Cannington, Coolakin, Dardanup, Cottesloe Central & South, Dardanup, Forrestfield, Guildford, Karrakatta Central & South, Karrakatta -North, Mogumber South, Not mapped, Pinjar, Reagan, Serpentine River, Southern River, Swan, Vasse, Yanga
Environmental Protection Act 1986 (Environmental Protection (Clearing of Native Vegetation) Regulations 2004 EPA Guidance Statement No 33 (Environmental Protection Authority, 2008) EPA Guidance Statement No 10 (Environmental Protection Authority, 2003) Australia’s Biodiversity Conservation Strategy 2010-2030 (October 2010)

support documentCapital City Planning Framework
48
P1_2b
of an ecological community with only 1500 ha or 30% or less remaining in the IBRA sub-region (here we use <or=40%)
2010 Vegetation extent by vegetation complexes: Dardanup, Bassendean complex Central & South, Beermullah, Cannington, Coolakin, Cottesloe Central & South, Dardanup, Forrestfield, Guildford, Herdsman, Karrakatta Central & South, Karrakatta -North, Mogumber South, Not mapped, Pinjar, Reagan, Serpentine River, Southern River, Swan River, Vasse, Yanga, Yoongarillup
Environmental Protection Act 1986 (Environmental Protection (Clearing of Native Vegetation) Regulations 2004 EPA Guidance Statement No 33 (Environmental Protection Authority, 2008) EPA Guidance Statement No 10 (Environmental Protection Authority, 2003) Australia’s Biodiversity Conservation Strategy 2010-2030 (October 2010)
P1_2c
of an ecological community with 90-100% of its original proportion of the original extent occurs within the study area
2010 Vegetation extent by vegetation complexes: Beermulah, Cannington, Cottesloe Central and South, Forrestfield, Herdsman, Pinjar, Helena 2
P1_2d
of an ecological community with 60-89% of its original proportion of the original extent occurs within the study area
2010 Vegetation extent by vegetation complexes: Bassendean Central and South, Guildford, Karrakatta Central and South, Serpentine River, Swan, Darling Scarp, Quindalup, Dwellingup D2, Helena 1
P1_3
large (greater than 20ha) natural areas
Remnant vegetation in patches greater than 20ha.
P1_4
of an ecological community with only 1500 ha or 15% or less protected for conservation in the Jarrah Forest sub-region
2010 Vegetation extent by vegetation complexes: Cooke, Coolakin, DwelingupD1-D4, Darling Scarp, Murray 2, Pindalup, Yalanbee 5, Yalanbee6, Yarragil 1, Yarragil2
Environmental Protection Act 1986 (Environmental Protection (Clearing of Native Vegetation) Regulations 2004 EPA Guidance Statement No 33 (Environmental Protection Authority, 2008) EPA Guidance Statement No 10 (Environmental Protection Authority, 2003) Forest Management Plan 2004-2013 (Conservation Commission, 2003)
P1_5
of an ecological community with only 400 ha or 10% or less protected for conservation on the SCP portion of Perth and Peel
2010 Vegetation extent by vegetation complexes: Bassendean Central and South, Beermullah, Cannington, Coonambidgee, Cottesloe Central and South, Dardanup, Forrestfield, Guildford, Karrakatta Central & South, Mogumber-South, Not Mapped, Pinjar, Quindalup, Reagan, Serpentine River, Southern River, Swan, Yanga
Environmental Protection Act 1986 (Environmental Protection (Clearing of Native Vegetation) Regulations 2004 EPA Guidance Statement No 33 (Environmental Protection Authority, 2008) EPA Guidance Statement No 10 (Environmental Protection Authority, 2003) State Planning Policy 2.8: Bushland Policy for Perth Metropolitan Region (June 2010) Bush Forever (Government of Western Australia, 2000)

central Perth regional parklands concept Vegetation connectivity analysis 49
Rarity
P3_1
of an ecological community with only 1500 ha or 10% remaining in the IBRA sub-region
2010 Vegetation extent by vegetation complexes: Beermullah, Cannigton, Dardanup, Forrestfield, Guildford, Not mapped, Pinjar, Serpentine River complex, Swan River Complex,
Environmental Protection Act 1986 (Environmental Protection (Clearing of Native Vegetation) Regulations 2004 EPA Guidance Statement No 33 (Environmental Protection Authority, 2008) EPA Guidance Statement No 10 (Environmental Protection Authority, 2003)
P3_2
of an ecological community with only 400 ha or 10% or less remaining in the Bush Forever and Peel section of the Swan Bioplan Areas
2010 Vegetation extent by vegetation complexes: Beermullah, Cannigton, Coonambidgee, Dardanup, Forrestfield, Guildford, Mogumber South, Reagan, Serpentine River complex, Swan Complex, Not mapped
Environmental Protection Act 1986 (Environmental Protection (Clearing of Native Vegetation) Regulations 2004 EPA Guidance Statement No 33 (Environmental Protection Authority, 2008) EPA Guidance Statement No 10 (Environmental Protection Authority, 2003) State Planning Policy 2.8: Bushland Policy for Perth Metropolitan Region (June 2010) Bush Forever (Government of Western Australia, 2000)
P3_3
contains a Threatened Ecological Community (TEC)
TEC boundaries and buffers Environmental Protection and Biodiversity Conservation Act 1999 Environmental Protection Act 1986 (Environmental Protection (Clearing of Native Vegetation) Regulations 2004 EPA Guidance Statement No 33 (Environmental Protection Authority, 2008) EPA Guidance Statement No 10 (Environmental Protection Authority, 2003) Draft Policy Statement No 9: Conserving Threatened Species and Ecological Communities (Department of Conservation and Land Management, 2003)
P3_4
contains a Priority Ecological Community (PEC)
PEC (Priority 1,2,3) and buffers Environmental Protection Act 1986 (Environmental Protection (Clearing of Native Vegetation) Regulations 2004 EPA Guidance Statement No 33 (Environmental Protection Authority, 2008) EPA Guidance Statement No 10 (Environmental Protection Authority, 2003) Draft Policy Statement No

support documentCapital City Planning Framework
50
9: Conserving Threatened Species and Ecological Communities (Department of Conservation and Land Management, 2003)
P3_5
contains Threatened (Declared Rare) Flora (DRF)
DRF locations with buffers Environmental Protection and Biodiversity Conservation Act 1999 Environmental Protection Act 1986 (Environmental Protection (Clearing of Native Vegetation) Regulations 2004 Wildlife Conservation Act 1950 EPA Guidance Statement No 33 (Environmental Protection Authority, 2008) Draft Policy Statement No 9: Conserving Threatened Species and Ecological Communities (Department of Conservation and Land Management, 2003)
P3_6
contains Priority 1,2,3,4 Flora
Priority Flora with buffers EPA Guidance Statement No 33 (Environmental Protection Authority, 2008) EPA Guidance Statement No 10 (Environmental Protection Authority, 2003) Draft Policy Statement No 9: Conserving Threatened Species and Ecological Communities (Department of Conservation and Land Management, 2003)
P3_7
Threatened and specially protected fauna
Threatened Fauna (CR, EN, VU, OS - Other Specially Protected)
Environmental Protection and Biodiversity Conservation Act 1999 Wildlife Conservation Act 1950 EPA Guidance Statement No 33 (Environmental Protection Authority, 2008) EPA Guidance Statement No 10 (Environmental Protection Authority, 2003) Draft Policy Statement No 9: Conserving Threatened Species and Ecological Communities (Department of Conservation and Land Management, 2003)
P3_8
priority fauna Priority 1,2, 3, 4 Fauna EPA Guidance Statement No 33 (Environmental Protection Authority, 2008) EPA Guidance Statement No 10 (Environmental Protection Authority, 2003) Draft Policy Statement No 9: Conserving Threatened

central Perth regional parklands concept Vegetation connectivity analysis 51
Species and Ecological Communities (Department of Conservation and Land Management, 2003)
P3_9a
significant habitat for significant fauna
Areas requiring investigation for Carnaby's cockatoo feeding habitat (Swan Coastal Plain)
Environmental Protection and Biodiversity Conservation Act 1999 Wildlife Conservation Act 1950 EPA Guidance Statement No 33 (Environmental Protection Authority, 2008) EPA Guidance Statement No 10 (Environmental Protection Authority, 2003) Guidance Statement No 7: Protection of the Western Swamp Tortoise (2006) Revised Draft Environmental Protection (Western Swamp Tortoise) Policy (2010) Draft Policy Statement No 9: Conserving Threatened Species and Ecological Communities (Department of Conservation and Land Management, 2003)
Areas requiring investigation for Carnaby's cockatoo feeding habitat (Jarrah Forest)
P3_9b
Carnaby's Cockatoo habitat - breeding sites (confirmed & possible) with 12 km buffer
P3_9c
Carnaby's Cockatoo habitat - roosting sites (confirmed & unconfirmed) with 6 km buffer
P3_9d
Western Swamp Tortoise Critical Habitat Policy Area (EPP 2010)
P3_10
contains other significant flora
Significant flora - range ends and disjunct populations; Swan Coastal Plain endemics based on Gibson et al 1994
EPA Guidance Statement No 33 (Environmental Protection Authority, 2008) Draft Policy Statement No 9: Conserving Threatened Species and Ecological Communities (Department of Conservation and Land Management, 2003)
Tuart woodlands EPA Guidance Statement No 33 (Environmental Protection Authority, 2008) Draft Policy Statement No 9: Conserving Threatened Species and Ecological Communities (Department of Conservation and Land Management, 2003)
P3_11
or other significant fauna Decliner Bird Species EPA Guidance Statement No 33 (Environmental Protection Authority, 2008) Draft Policy Statement No 9: Conserving Threatened Species and Ecological Communities (Department of Conservation and Land Management, 2003)
Maintaining ecological processes or natural systems – connectivity

support documentCapital City Planning Framework
52
P4_1
natural areas acting as stepping stones in a regionally significant ecological link
Connectivity layer - current remnant vegetation that touches the Perth Metropolitan Region Regional Ecological Linkages or South West Regional Ecological Linkages 500m wide axis line (plus three additional lines from working group meeting in the Peel Region)
Australia’s Biodiversity Conservation Strategy 2010-2030 (October 2010) EPA Guidance Statement No 33 (Environmental Protection Authority, 2008) Environmental Protection Bulletin No 8: South West Regional Ecological Linkages (October 2010) Statement of Planning Policy No 2: Environment and Natural Resources (Western Australian Planning Commission, 2003)
Protection of wetland, streamline and estuarine fringing vegetation and coastal vegetation
P5_1
Remnant vegetation within Conservation Category Wetlands plus 50m buffer
Geomorphic wetland mapping Water and Rivers Commission Position Statement: Wetlands (2001) Wetlands Conservation Policy for Western Australia (Government of Western Australia, 1997) EPA Position Statement No 4: Environmental Protection of Wetlands (Environmental Protection Authority, 2004) Environmental Protection Act 1986 (Environmental Protection (Clearing of Native Vegetation) Regulations 2004 EPA Guidance Statement No 33 (Environmental Protection Authority, 2008) Statement of Planning Policy No 2: Environment and Natural Resources (Western Australian Planning Commission, 2003)
P5_1b
Remnant vegetation within Resource Enhancement Wetlands plus 50m buffer
Geomorphic wetland mapping Same as for Conservation Category Wetlands
P5_2
Remnant vegetation within Environmental Protection Policy (Swan Coastal Plain Lakes) 1992 plus 50m buffer
epp_1992_scp_lakes_policy_boundaries Environmental Protection Act 1986 (Environmental Protection (Clearing of Native Vegetation) Regulations 2004 Environmental Protection (Swan Coastal Plain Lakes) Policy 1992 (Government of Western Australia, 1992) EPA Guidance Statement No 33 (Environmental Protection Authority, 2008)

central Perth regional parklands concept Vegetation connectivity analysis 53
Statement of Planning Policy No 2: Environment and Natural Resources (Western Australian Planning Commission, 2003)
P5_3
riparian vegetation riparian vegetation surrogate - hydro lines buffered and used to intersect with current remnant vegetation
Swan and Canning River Management Act 2006 Statement of Planning Policy No 2: Environment and Natural Resources (Western Australian Planning Commission, 2003) Statement of Planning Policy No 2.1: Peel-Harvey Coastal Plain Catchment (Government of Western Australia, 1992) EPA Guidance Statement No 33 (Environmental Protection Authority, 2008) Development Control Policy No 2.3: Public Open Space (Western Australian Planning Commission, 2002)
P5_4
floodplain area floodplain areas Statement of Planning Policy No 2: Environment and Natural Resources (Western Australian Planning Commission, 2003) Swan and Canning River Management Act 2006 Statement of Planning Policy No 2.1: Peel-Harvey Coastal Plain Catchment (Government of Western Australia, 1992) Environmental Protection (Peel-Harvey Estuary) Policy (Government of Western Australia, 1992) EPA Guidance Statement No 33 (Environmental Protection Authority, 2008) Development Control Policy No 2.3: Public Open Space (Western Australian Planning Commission, 2002)
P5_5
estuarine area hydrography - estuarine EPA Guidance Statement No 33 (Environmental Protection Authority, 2008) Statement of Planning Policy No 2: Environment and Natural Resources (Western Australian Planning Commission, 2003) Development Control Policy

support documentCapital City Planning Framework
54
No 2.3: Public Open Space (Western Australian Planning Commission, 2002)
P5_6
coastal vegetation on foredunes and secondary dunes
Q3 and Q4 units in the Soil Landscape Units
EPA Guidance Statement No 33 (Environmental Protection Authority, 2008) Statement of Planning Policy No 2.6: State Coastal Planning Policy (Government of Western Australia, 2003) Position Statement – State Planning Policy No 2.6 State Coastal Planning Policy Schedule 1 Sea Level Rise (Western Australian Planning Commission, 2010) Statement of Planning Policy No 2: Environment and Natural Resources (Western Australian Planning Commission, 2003) Development Control Policy No 2.3: Public Open Space (Western Australian Planning Commission, 2002)
Remaining Quindalup Soil Landscape Units within 150m from the coastline
Representation – Local
P6_1
of an ecological community with 10% or less remaining within Local Government area
2010 remnant vegetation extent by vegetation complexes within each Local Government in the Perth and Peel Scheme Regions
EPA Guidance Statement No 33 (Environmental Protection Authority, 2008)
P6_2
of an ecological community with 30% or less remaining within a Local Government area
2010 remnant vegetation extent by vegetation complexes within each Local Government in the Perth and Peel Scheme Regions
EPA Guidance Statement No 33 (Environmental Protection Authority, 2008)
The spatial model for Level 1 Prioritisation was built with a range of original datasets and some datasets created specifically for this prioritisation to spatially capture criteria where mapping of specific attributes is not available. Table 2 lists the datasets used to build the model including brief descriptions, data custodians and currency.

central Perth regional parklands concept Vegetation connectivity analysis 55
Table 2: List of datasets used in Level 1 Prioritisation
Key to Criteria
Dataset Description Data Custodian Currency
P1_1
DEC Managed Lands and Waters
Used to identify national parks, nature reserves, conservation parks, Section 5 (1) (g) reserves,
Department of Environment & Conservation
2011
Regional Parks Includes all Regional Parks Department of Environment & Conservation
2010
Bush Forever Includes all Bush Forever Sites in the Perth Metropolitan Region
Department of Planning 2011
Crown reserves Crown reserves vested for conservation
Swan Bioplan – Peel Sector Regionally Significant Natural Areas
Peel Regionally Significant Natural Areas
Office of Environmental Protection Authority
2010
Forest Management Plan 2004-2013
Used to identify areas defined as Fauna Habitat Zones and Informal Reserves
Department of Environment & Conservation
2010
Ramsar wetlands Identified wetlands recognised under the international agreement
Department of Environment & Conservation
2009
DEC Conservation covenants
Identified properties with conservation covenants on title
Department of Environment & Conservation
2010
Directory of Important Wetlands
Identifies wetlands listed in A Directory of Important Wetlands in Australia (Auslig, 2001)
Auslig 2002
P1_2 to P3_2,
P6_1 & P6_2
2010 remnant vegetation extent by vegetation complexes
Most up-to-date remnant vegetation extent by vegetation complexes, excluding plantations
Perth Biodiversity Project 2010
IBRA 6.1 Sub-regions
Interim Biogeographic Regionalisation for Australia (IBRA) V 6.1 regions represent a landscape based approach to classifying the land surface.
Department of Sustainability, Environment, Water, Population and Communities
2010
RFLBC LGAs Local Government boundaries within the RFLBCP study area boundary. Use to calculate the local level of remnant vegetation retention
Landgate 2003
P3_5 &P3_6
Threatened and Priority Flora
Contains records of threatened and priority flora buffered
Department of Environment & Conservation
2012
P3_7 & Threatened and Contains records of threatened and Department of 2012
Table 2: List of datasets used in Level 1 Prioritisation

support documentCapital City Planning Framework
56
P3_8 Priority Fauna priority fauna buffered Environment & Conservation
P3_3 & P3_4
Threatened and Priority Communities
Contains records of threatened and priority ecological communities buffered
Department of Environment & Conservation
2012
P3_9
Carnaby's black cockatoo habitat
Includes four data layers including areas requiring investigation as Carnaby’s feeding habitat on the Swan Coastal Plain and in the Jarrah Forest, known roosting sites and known breeding sites.
Department of Environment & Conservation
2011
Western Swamp Tortoise Critical Habitat Policy Area
Western Swamp Tortoise Critical Habitat Policy Area as described in Schedule 2 of the Environmental Protection (Western Swamp Tortoise Habitat) Policy Approval Order 2011
Office of Environmental Protection Authority
2012
P3_10
Significant flora Contains records of flora considered significant for the Perth and Peel. The dataset was compiled by the Technical Working Group.
Perth Biodiversity Project 2011
Tuart Woodlands Identifies distribution of Tuart (Eucalyptus gomphocephala)
Department of Environment & Conservation
2003
P3_11
Decliner bird species Contains records of bird species declining in the Perth and Peel. The dataset was compiled by the Technical Working Group.
Perth Biodiversity Project 2011
P4_1
Connectivity A dataset contains remnant vegetation extent polygons that make up Regional ecological linkages in the Perth and Peel regions, based on the Perth Regional ecological linkages and the South West Regional Ecological Linkages.
Perth Biodiversity Project 2010
P5_1 Geomorphic Wetlands Swan Coastal Plain
Includes distribution of Conservation Category and Resource Enhancement wetlands.
Department of Environment & Conservation
2012
P5_2
EPP Lakes 1992 Represents areas subject to protection under the Environmental Protection Act 1986 (Environmental Protection (Swan Coastal Plain Lakes) Policy 1992)
Department of Environment & Conservation
2006
P5_3
Riparian vegetation Dataset created to represent a surrogate for riparian vegetation by identifying remnant vegetation (DAFWA, 2010) within buffers of waterways (Landgate, 2008)
Perth Biodiversity Project 2011
P5_4
Floodplain areas Dataset created to represent a surrogate for floodplain vegetation by identifying remnant vegetation (DAFWA, 2010) within floodplain mapping (Department of Water, 2008)
Perth Biodiversity Project 2011
P5_5 Hydrography - Dataset created to represent a Perth Biodiversity Project 2011

central Perth regional parklands concept Vegetation connectivity analysis 57
estuarine surrogate for estuarine vegetation by identifying remnant vegetation (DAFWA, 2010) within estuarine polylines from the Department of Water (2006) hydrography dataset
P5_6 Coastal vegetation Dataset created to represent a surrogate for coastal vegetation of foredunes and secondary dunes by identifying remnant vegetation (DAFWA, 2010) within specific soil-landscape units (DAFWA, 2005) or within 150m of the coastline (Geoscience Australia, 2004)
Perth Biodiversity Project 2011