Embed Size (px)
Citation preview

Capital and Risk Management Pillar 3 Disclosures
For Year Ended 31st December 2016
Pillar 3 Disclosures - Year Ended 31st December 2016
2 April 2017
Contents 1. Introduction .............................................................................................................................................. 3
1.1 Background ...................................................................................................................................... 3 1.2 Scope ............................................................................................................................................... 3 1.3 Frequency of Disclosure ................................................................................................................... 4
2. Key Measures & Ratios ............................................................................................................................ 5 2.1 Capital Resources & Ratios .............................................................................................................. 5 2.2 Capital Adequacy ............................................................................................................................. 6 2.3 Past Due & Provisions ...................................................................................................................... 8 2.4 Credit Risk Exposures ...................................................................................................................... 9
3. Governance & Risk Management ........................................................................................................... 10 3.1 Background .................................................................................................................................... 10 3.2 Credit Risk...................................................................................................................................... 11 3.3 Concentration Risk ......................................................................................................................... 11 3.4 Operational Risk ............................................................................................................................. 12 3.5 Cyber Risk...................................................................................................................................... 12 3.6 Market Risk .................................................................................................................................... 12 3.7 Interest Rate Risk ........................................................................................................................... 12 3.8 Basis Risk ...................................................................................................................................... 13 3.9 Reputational Risk ........................................................................................................................... 14 3.10 Liquidity Risk .................................................................................................................................. 14 3.11 Pension Risk .................................................................................................................................. 14 3.12 Securitisation Risk .......................................................................................................................... 14 3.13 Counterparty Credit Risk................................................................................................................. 14 3.14 Regulatory & Conduct Risk ............................................................................................................. 14
4. Remuneration ........................................................................................................................................ 15
Tables Table 1 : Capital Resources & Ratios ...................................................................................................................................... 5 Table 2 : Leverage Ratio ......................................................................................................................................................... 6 Table 3 : Capital Requirements for Credit Risk ....................................................................................................................... 6 Table 4 : Minimum Capital Resource Requirements ............................................................................................................... 7 Table 5 : Provisions for Bad & Doubtful Debts ........................................................................................................................ 8 Table 6 : Credit Risk Exposures .............................................................................................................................................. 9 Table 7 : Maturity of Regulated Credit Risk Exposures ........................................................................................................... 9 Table 8 : Geographical Exposure of Residential Secured Lending By Region ...................................................................... 11 Table 9 : Interest Rate Gap Analysis & Net Present Value Sensitivity .................................................................................. 13 Table 10 : Remuneration Breakdown for Staff with a Material Impact on The Bank’s Risk Profile ........................................ 15
Pillar 3 Disclosures - Year Ended 31st December 2016
3 April 2017
1. INTRODUCTION
1.1 Background
Weatherbys Bank Limited (“WBL” or the “Bank”) is subject to the European Union Capital Requirements Directive (CRD) and Capital Requirements Regulations (CRR), collectively known as CRD IV, which took legal effect from 1
st January 2014.
The aim of CRD IV is to provide for consistent capital adequacy standards across Banks and other financial institutions and these have been implemented under the Basel III framework of the Basel Committee on Banking Supervision. This is enforced in the UK by the Prudential Regulation Authority (PRA). The legislation provides the rules to determine the amount of capital Banks and other financial institutions must hold in order to provide security for depositors. The Basel III capital framework consists of 3 ‘pillars’:
Pillar 1 – sets the minimum regulatory capital requirements for credit, market and operational risk.
Pillar 2 – is a requirement for an internal assessment of the additional regulatory capital, in addition to Pillar 1 capital, required to cover specific risks related to the firm. This is part covered by the Internal Capital Adequacy Assessment Process (“ICAAP”) and is reviewed by the PRA.
Pillar 3 – a set of disclosure requirements allowing Banks and other financial institutions to assess the scope of the application of Basel III, capital, risk exposures and risk assessment processes, and therefore the capital adequacy of the firm.
1.2 Scope
Weatherbys Bank Limited is authorised by the Prudential Regulation Authority (PRA) and regulated by the Financial Conduct Authority (FCA) and the PRA. Weatherbys Bank Limited is a subsidiary of Weatherbys Bank Holdings Limited and Weatherbys Bank Holdings Limited together with Weatherbys Bank Limited and its subsidiaries comprise a ‘UK consolidated group’. The PRA supervises the group on a UK consolidated group basis (“Group”) and solo consolidated basis (“Solo”) and receives information on the capital adequacy of, and sets capital requirements of, the UK Consolidated group and Solo Consolidated group. There are no differences between the basis of consolidation for accounting and prudential purposes. WBL makes use of the provisions laid down in the PRA handbook BIPRU Chapter 2.1 and reports to the PRA on a solo-consolidated basis. This solo consolidated group includes WBL and its subsidiaries Arkle Finance Limited and Weatherbys (Nominees) Limited. All of the group’s subsidiaries are included in the Pillar 3 disclosures and the group does not foresee any practical or legal impediments to the transfer of capital resources or repayment of liabilities when due within the group. The information contained in this document covers the disclosure requirements of Pillar 3 and have been prepared in accordance with the rules laid out in the PRA handbook BIPRU chapter 11. Unless otherwise stated all figures are based on data as at 31
st December 2016.
The Pillar 3 disclosures have been prepared in order to:
comply with the regulatory requirements
provide information on the group’s risk management objectives and policies
provide information on the group’s capital position
provide information on the group’s approach to assessing the adequacy of its capital and its exposure to credit, market and operational risk.

Pillar 3 Disclosures - Year Ended 31st December 2016
4 April 2017
They do not constitute financial statements of the group and should not be relied on in making investment decisions in relation to the group.
1.3 Frequency of Disclosure
Pillar 3 disclosures will be issued as a minimum on an annual basis and will be published on the group’s website (www.weatherbys.co.uk/private-bank/about-the-bank/corporate-information) alongside the publication of the group’s annual report and accounts. The disclosures are not subject to audit except where they are equivalent to those prepared under accounting requirements for inclusion in the group’s annual report and accounts.
Pillar 3 Disclosures - Year Ended 31st December 2016
5 April 2017
2. KEY MEASURES & RATIOS
2.1 Capital Resources & Ratios
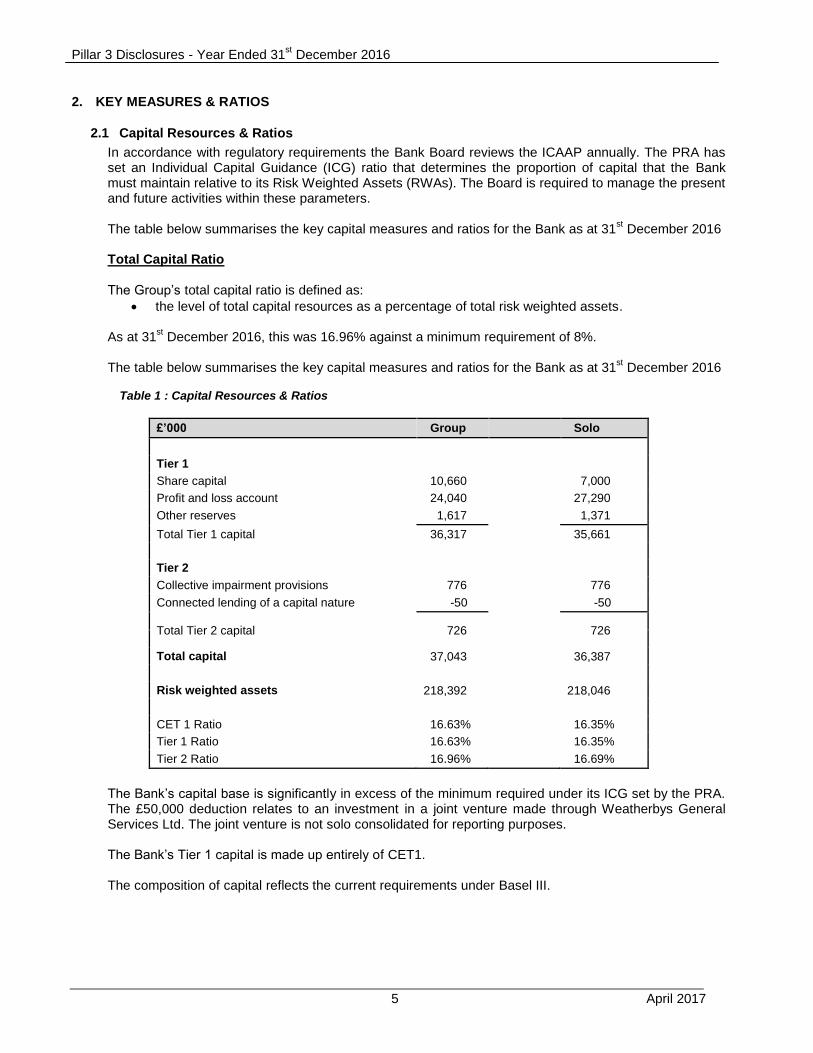
In accordance with regulatory requirements the Bank Board reviews the ICAAP annually. The PRA has set an Individual Capital Guidance (ICG) ratio that determines the proportion of capital that the Bank must maintain relative to its Risk Weighted Assets (RWAs). The Board is required to manage the present and future activities within these parameters. The table below summarises the key capital measures and ratios for the Bank as at 31
st December 2016
Total Capital Ratio The Group’s total capital ratio is defined as:
the level of total capital resources as a percentage of total risk weighted assets. As at 31
st December 2016, this was 16.96% against a minimum requirement of 8%.
The table below summarises the key capital measures and ratios for the Bank as at 31
st December 2016
Table 1 : Capital Resources & Ratios
£’000 Group Solo
Tier 1
Share capital 10,660
7,000
Profit and loss account 24,040
27,290
Other reserves 1,617 1,371
Total Tier 1 capital 36,317
35,661
Tier 2
Collective impairment provisions 776
776
Connected lending of a capital nature -50 -50
Total Tier 2 capital 726
726
Total capital 37,043
36,387
Risk weighted assets 218,392 218,046
CET 1 Ratio 16.63%
16.35%
Tier 1 Ratio 16.63%
16.35%
Tier 2 Ratio 16.96% 16.69%
The Bank’s capital base is significantly in excess of the minimum required under its ICG set by the PRA.
The £50,000 deduction relates to an investment in a joint venture made through Weatherbys General Services Ltd. The joint venture is not solo consolidated for reporting purposes.
The Bank’s Tier 1 capital is made up entirely of CET1. The composition of capital reflects the current requirements under Basel III.
Pillar 3 Disclosures - Year Ended 31st December 2016
6 April 2017
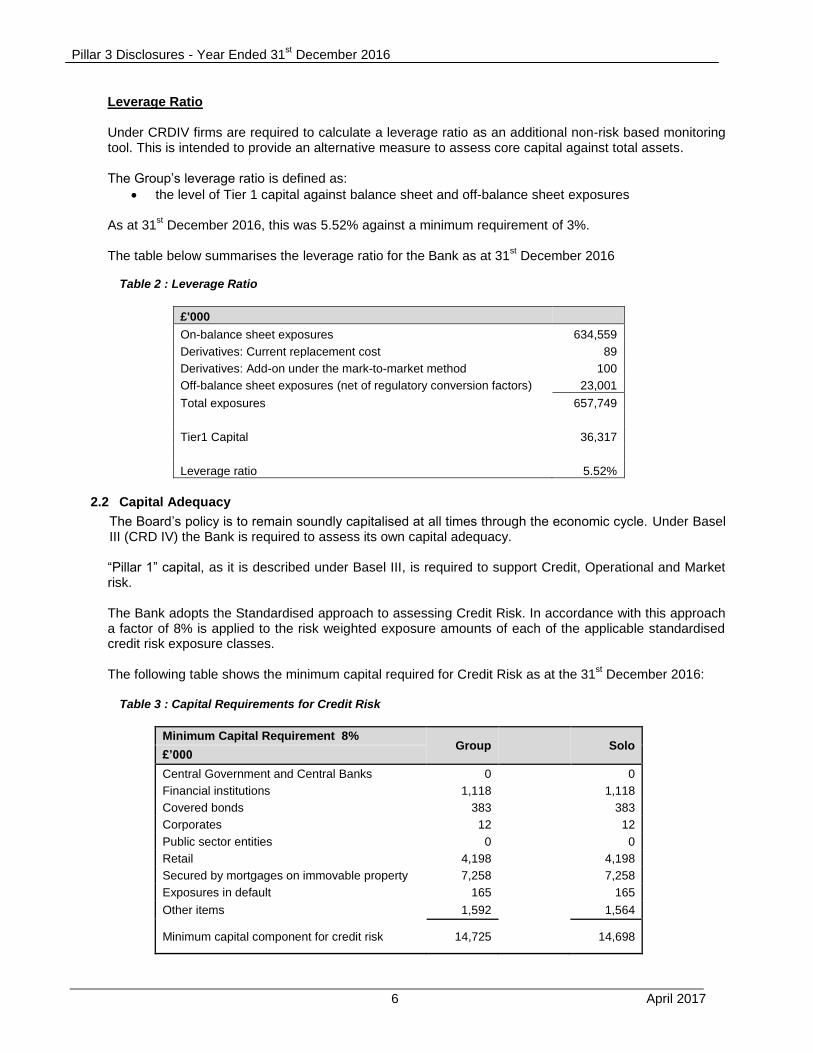
Leverage Ratio Under CRDIV firms are required to calculate a leverage ratio as an additional non-risk based monitoring tool. This is intended to provide an alternative measure to assess core capital against total assets. The Group’s leverage ratio is defined as:
the level of Tier 1 capital against balance sheet and off-balance sheet exposures As at 31
st December 2016, this was 5.52% against a minimum requirement of 3%.
The table below summarises the leverage ratio for the Bank as at 31
st December 2016
Table 2 : Leverage Ratio
£'000
On-balance sheet exposures 634,559
Derivatives: Current replacement cost 89
Derivatives: Add-on under the mark-to-market method 100
Off-balance sheet exposures (net of regulatory conversion factors) 23,001
Total exposures 657,749
Tier1 Capital 36,317
Leverage ratio 5.52%
2.2 Capital Adequacy
The Board’s policy is to remain soundly capitalised at all times through the economic cycle. Under Basel III (CRD IV) the Bank is required to assess its own capital adequacy.
“Pillar 1” capital, as it is described under Basel III, is required to support Credit, Operational and Market risk. The Bank adopts the Standardised approach to assessing Credit Risk. In accordance with this approach a factor of 8% is applied to the risk weighted exposure amounts of each of the applicable standardised credit risk exposure classes. The following table shows the minimum capital required for Credit Risk as at the 31
st December 2016:
Table 3 : Capital Requirements for Credit Risk
Minimum Capital Requirement 8% Group Solo
£’000
Central Government and Central Banks 0
0
Financial institutions 1,118 1,118
Covered bonds 383
383
Corporates 12
12
Public sector entities 0
0
Retail 4,198
4,198
Secured by mortgages on immovable property 7,258
7,258
Exposures in default 165
165
Other items 1,592
1,564
Minimum capital component for credit risk 14,725 14,698
Pillar 3 Disclosures - Year Ended 31st December 2016
7 April 2017
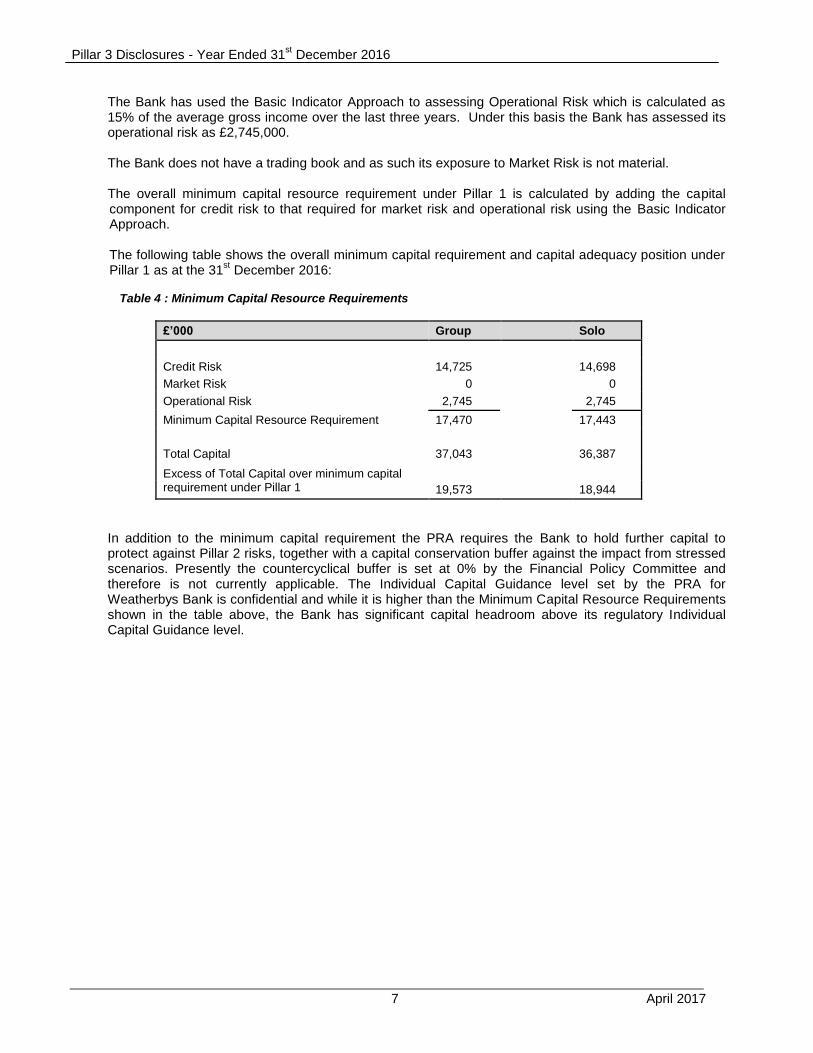
The Bank has used the Basic Indicator Approach to assessing Operational Risk which is calculated as 15% of the average gross income over the last three years. Under this basis the Bank has assessed its operational risk as £2,745,000.
The Bank does not have a trading book and as such its exposure to Market Risk is not material. The overall minimum capital resource requirement under Pillar 1 is calculated by adding the capital
component for credit risk to that required for market risk and operational risk using the Basic Indicator Approach.
The following table shows the overall minimum capital requirement and capital adequacy position under
Pillar 1 as at the 31st December 2016:
Table 4 : Minimum Capital Resource Requirements
£’000 Group Solo
Credit Risk 14,725 14,698
Market Risk 0
0
Operational Risk 2,745
2,745
Minimum Capital Resource Requirement 17,470
17,443
Total Capital 37,043
36,387
Excess of Total Capital over minimum capital requirement under Pillar 1
19,573 18,944
In addition to the minimum capital requirement the PRA requires the Bank to hold further capital to protect against Pillar 2 risks, together with a capital conservation buffer against the impact from stressed scenarios. Presently the countercyclical buffer is set at 0% by the Financial Policy Committee and therefore is not currently applicable. The Individual Capital Guidance level set by the PRA for Weatherbys Bank is confidential and while it is higher than the Minimum Capital Resource Requirements shown in the table above, the Bank has significant capital headroom above its regulatory Individual Capital Guidance level.
Pillar 3 Disclosures - Year Ended 31st December 2016
8 April 2017
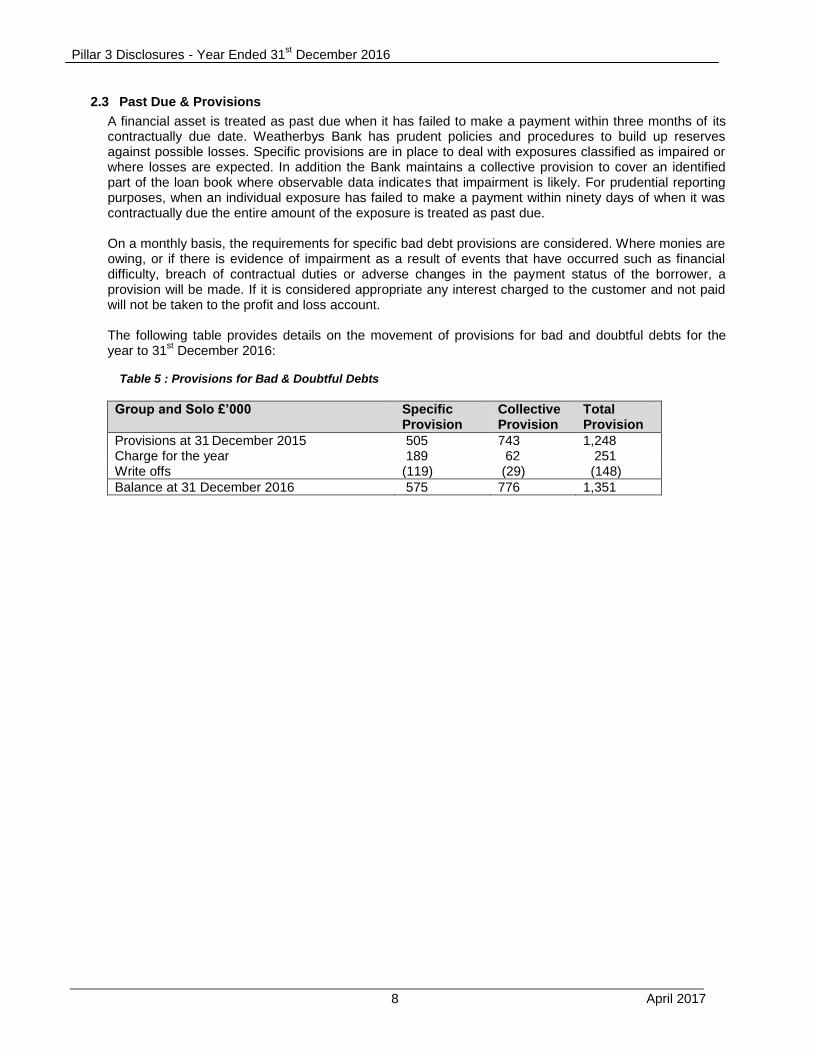
2.3 Past Due & Provisions
A financial asset is treated as past due when it has failed to make a payment within three months of its contractually due date. Weatherbys Bank has prudent policies and procedures to build up reserves against possible losses. Specific provisions are in place to deal with exposures classified as impaired or where losses are expected. In addition the Bank maintains a collective provision to cover an identified part of the loan book where observable data indicates that impairment is likely. For prudential reporting purposes, when an individual exposure has failed to make a payment within ninety days of when it was contractually due the entire amount of the exposure is treated as past due.
On a monthly basis, the requirements for specific bad debt provisions are considered. Where monies are owing, or if there is evidence of impairment as a result of events that have occurred such as financial difficulty, breach of contractual duties or adverse changes in the payment status of the borrower, a provision will be made. If it is considered appropriate any interest charged to the customer and not paid will not be taken to the profit and loss account.
The following table provides details on the movement of provisions for bad and doubtful debts for the year to 31
st December 2016:
Table 5 : Provisions for Bad & Doubtful Debts
Group and Solo £’000 Specific Provision
Collective Provision
Total Provision
Provisions at 31 December 2015 505 743 1,248
Charge for the year 189 62 251 Write offs (119) (29) (148)
Balance at 31 December 2016 575 776 1,351
Pillar 3 Disclosures - Year Ended 31st December 2016
9 April 2017
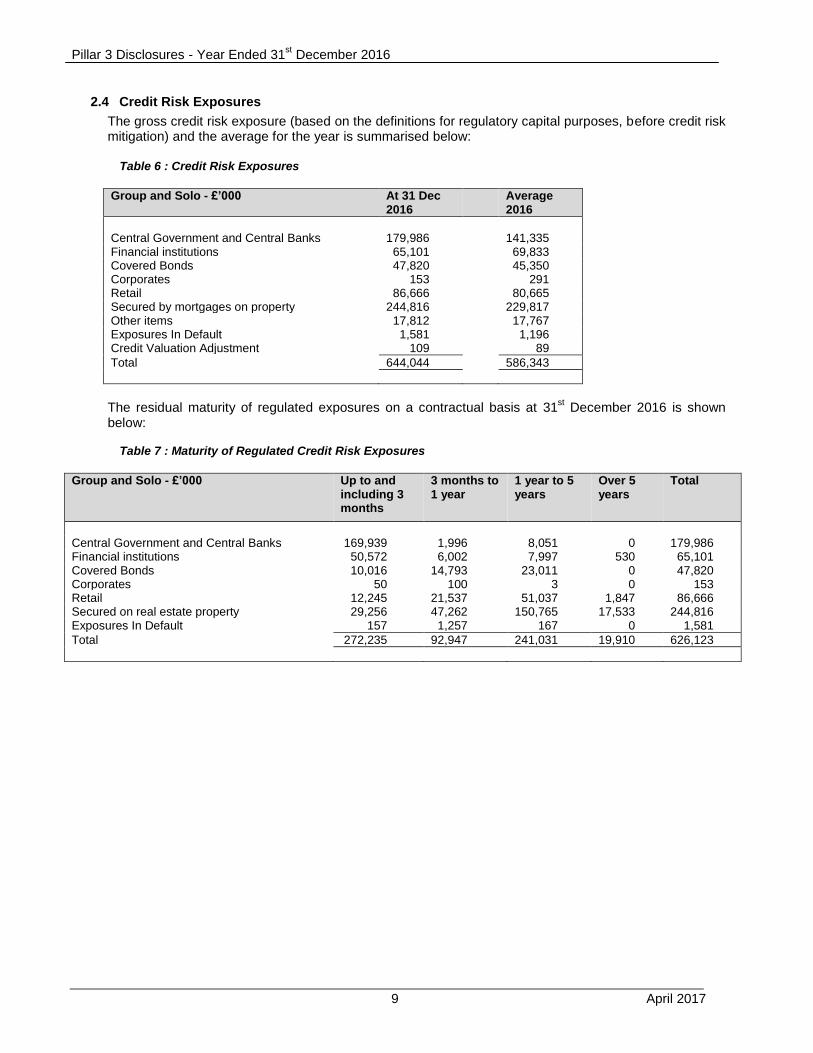
2.4 Credit Risk Exposures
The gross credit risk exposure (based on the definitions for regulatory capital purposes, before credit risk mitigation) and the average for the year is summarised below:
Table 6 : Credit Risk Exposures
Group and Solo - £’000 At 31 Dec
2016 Average 2016
Central Government and Central Banks 179,986 141,335 Financial institutions 65,101 69,833 Covered Bonds 47,820 45,350 Corporates 153 291 Retail 86,666 80,665 Secured by mortgages on property 244,816 229,817 Other items 17,812 17,767 Exposures In Default 1,581 1,196 Credit Valuation Adjustment 109 89
Total 644,044 586,343
The residual maturity of regulated exposures on a contractual basis at 31
st December 2016 is shown
below: Table 7 : Maturity of Regulated Credit Risk Exposures
Group and Solo - £’000 Up to and
including 3 months
3 months to 1 year
1 year to 5 years
Over 5 years
Total
Central Government and Central Banks 169,939 1,996 8,051 0 179,986 Financial institutions 50,572 6,002 7,997 530 65,101 Covered Bonds 10,016 14,793 23,011 0 47,820 Corporates 50 100 3 0 153 Retail 12,245 21,537 51,037 1,847 86,666 Secured on real estate property 29,256 47,262 150,765 17,533 244,816 Exposures In Default 157 1,257 167 0 1,581
Total 272,235 92,947 241,031 19,910 626,123
Pillar 3 Disclosures - Year Ended 31st December 2016
10 April 2017
3. GOVERNANCE & RISK MANAGEMENT
3.1 Background
Risk management is the process of identifying the principal risks to the group, establishing appropriate controls to manage those risks and to monitor and put in place reporting systems to ensure that those controls remain robust and evolve with the changing risk profile of the group.
The Bank’s primary risk management governing body is the Board of Directors. The Board is responsible for:
approving the framework for reporting and managing risk
approving the overall level of risk to which the Bank is exposed
ensuring that risk management is appropriate and functioning effectively.
The Board manages risk and internal capital requirements, for both current and future activities through a combination of committees that report to it through monthly Board reporting, covering all aspects of the Bank’s activities. The Bank’s Internal Capital Adequacy Assessment (ICAAP), Individual Liquidity Adequacy Assessment (ILAAP) and Recovery and Resolution Plan (RRP) are formally approved each year.
The Board’s primary committees that report to it include:
Executive Committee (EXCO) – comprising the executive directors and key members of senior management which meets monthly to review and discuss all financial and operational issues for the group.
Risk Committee – chaired by a non-executive director, it also comprises two executive directors and senior management. This meets bi-monthly to review all aspects of the Bank’s risk exposure as well as its systems, control and regulatory environment.
Assets and Liabilities Committee (ALCO) – comprising executive directors and senior management which meets monthly to review the following: o Credit Risk – where it sets and monitors sector limits as well as internal credit ratings o Counterparty Risk o Liquidity Risk o Interest Rate Risk o Funding Risk.
Credit Committee – comprising three executive directors and senior management which meets regularly to review and approve credit proposals and assess ongoing credit risk within the lending portfolio.
Audit Committee – this comprises four non-executive directors as well as the Chief Risk Officer and Internal Auditor and meets at least quarterly. Its primary role is to ensure that controls are both present and appropriate to mitigate risk in accordance with the Board’s expectations.
The Board regularly considers the principal risks facing the group and the main risk categories are shown
in the following sections.
Pillar 3 Disclosures - Year Ended 31st December 2016
11 April 2017
3.2 Credit Risk
Credit risk is the risk of a financial loss if a counterparty is unable to meet its obligations to the Bank and arises mainly from our lending and treasury activities.
In order to mitigate risk in the lending book the Bank has in place formal procedures to assess all borrowing applications as well as agreed authority limits. The majority of the loan book is relatively short term (with 94% repayable within 5 years) and has a low average loan size. Credit proposals are all graded using a loan grading system to assess risk and dependent on this, and the overall loan size, various sign-off levels are in place to approve new lending applications. Full Board approval is required in any event for new applications above a certain limit.
To mitigate risk in its treasury activities (counterparty risk) the Board has set minimum short and long
term credit ratings for approved counterparties where the Bank places its surplus funds, as well as individual monetary limits. These limits are reviewed on a regular basis by the ALCO and are set by reference to WBL’s assessment of the risk of default for each counterparty. The Bank uses appropriate agencies to provide credit ratings for financial institutions.
3.3 Concentration Risk
Concentration risk is the risk of loss due to either a large individual or connected exposure, or significant exposures to groups of counterparties who could be affected by common factors, including geographical location (“geographical risk”) In order to avoid concentration risk the Board has:
set limits on the maximum percentage exposure to any individual business sector against the total lending book,
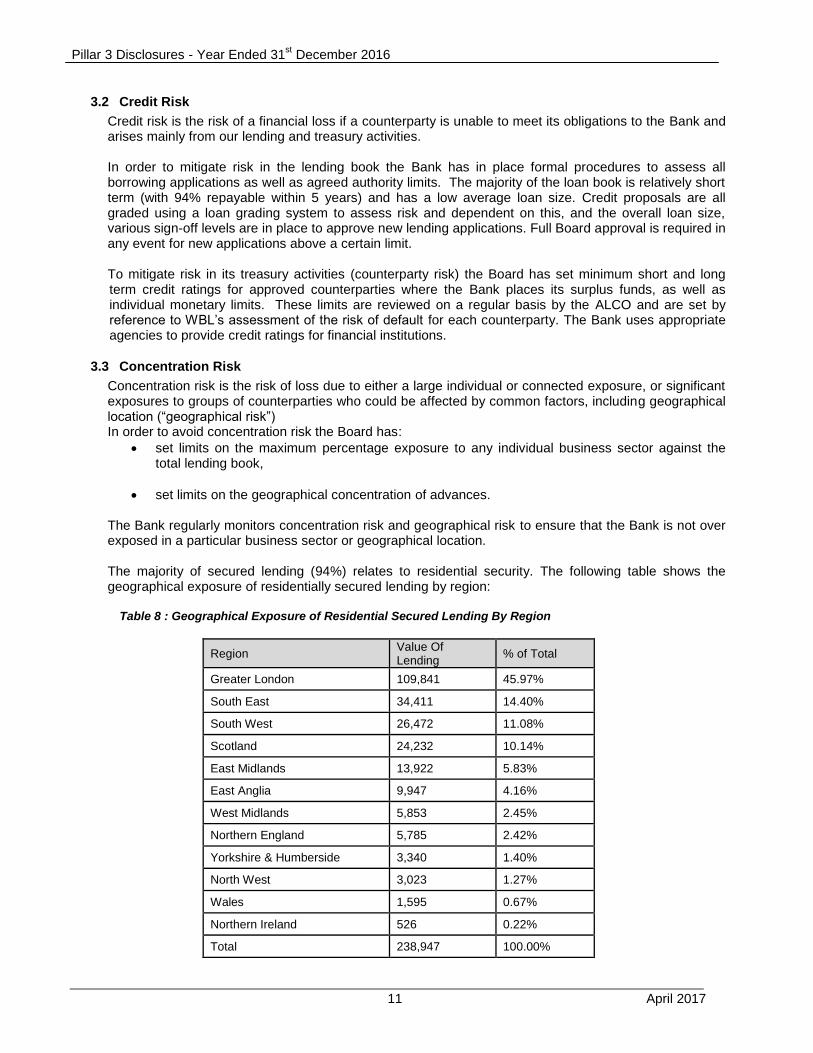
set limits on the geographical concentration of advances. The Bank regularly monitors concentration risk and geographical risk to ensure that the Bank is not over exposed in a particular business sector or geographical location. The majority of secured lending (94%) relates to residential security. The following table shows the geographical exposure of residentially secured lending by region:
Table 8 : Geographical Exposure of Residential Secured Lending By Region
Region Value Of Lending
% of Total
Greater London 109,841 45.97%
South East 34,411 14.40%
South West 26,472 11.08%
Scotland 24,232 10.14%
East Midlands 13,922 5.83%
East Anglia 9,947 4.16%
West Midlands 5,853 2.45%
Northern England 5,785 2.42%
Yorkshire & Humberside 3,340 1.40%
North West 3,023 1.27%
Wales 1,595 0.67%
Northern Ireland 526 0.22%
Total 238,947 100.00%
Pillar 3 Disclosures - Year Ended 31st December 2016
12 April 2017
3.4 Operational Risk
This is the risk associated with the internal failure of people, processes or systems, or the risk arising from external events. It includes risk events such as internal fraud, the failure of internal IT infrastructure (e.g. for payment and settlement) or external factors, such as terrorism, which have the potential to impact on the Bank’s ability to carry out its business. The Bank has in place a robust and comprehensive internal control environment which is reviewed and tested by internal audit and external compliance consultants. The Bank also has a full disaster recovery site from where it could operate if there were disruption at its principal location.
3.5 Cyber Risk
An increasing risk that the Group is subject to within its operational processes is cyber risk. This is the risk that the Group businesses are subject to some form of disruption arising from an interruption to its IT and data infrastructure.
3.6 Market Risk
Market risk is the risk of loss that arises from the sensitivity of the market value of a portfolio. This can be impacted by changes in financial asset prices such as interest rates, foreign exchange rates, equity and commodity prices.
The Bank has no trading book and has no material exposure to market risk as generally treasury assets are held to maturity.
3.7 Interest Rate Risk
Interest rate risk is the risk that a significant movement in interest rates will have a material impact on the Bank’s profitability, for example by reducing the net interest margin or through higher bad debts and delinquencies.
The Bank is exposed to interest rate risk that arises from a mismatch between the repricing of assets and
liabilities. The majority of the Bank’s lending is variable, although its lending to SMEs through its asset finance subsidiary is on fixed terms, generally between three and four years. On the liability side, credit interest paid on the majority of deposits is also variable. Partly as a consequence of its low loan to deposit ratio and surplus funds, the Bank’s net interest margin will fall when Base rate falls and correspondingly increase as rates rise.
The Bank regularly measures and reports to ALCO its interest rate risk based on 200bps positive or
negative shifts in the yield curve, which are then translated into a net present value. Interest rate risk is managed within the limits set by the Board.
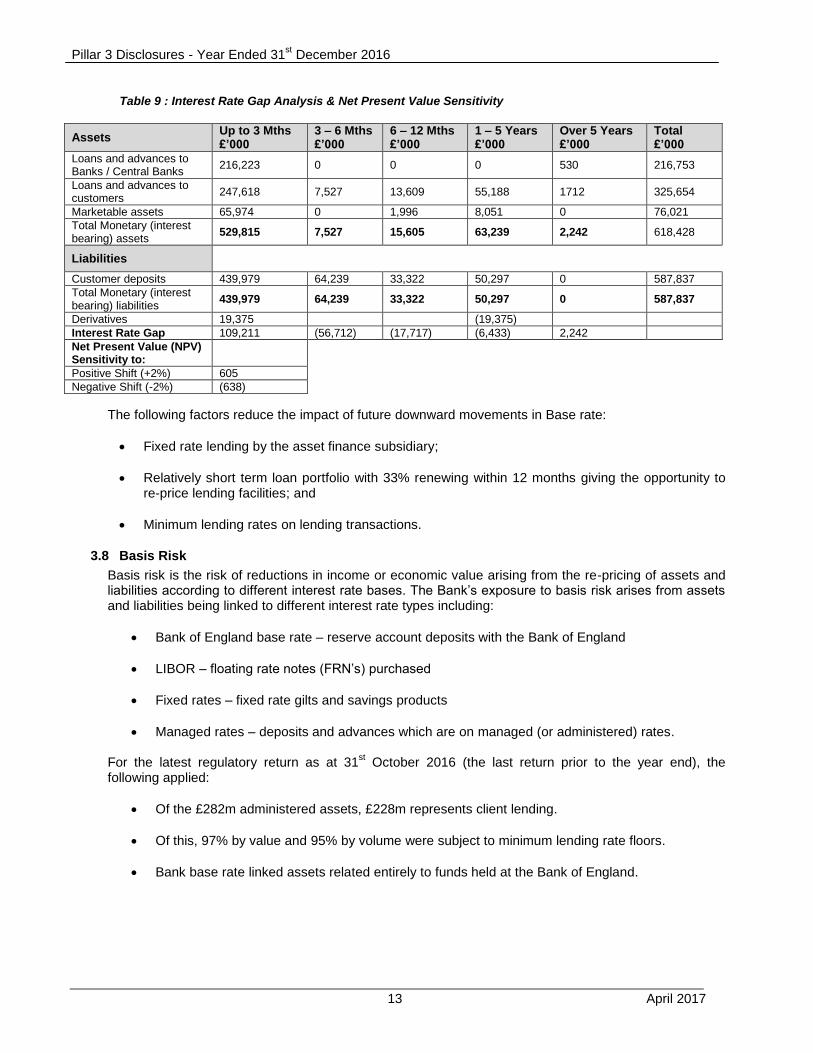
The table below shows the interest rate gap analysis and net present value sensitivity at 31
st December
2016:
Pillar 3 Disclosures - Year Ended 31st December 2016
13 April 2017
Table 9 : Interest Rate Gap Analysis & Net Present Value Sensitivity
Assets Up to 3 Mths £’000
3 – 6 Mths £’000
6 – 12 Mths £’000
1 – 5 Years £’000
Over 5 Years £’000
Total £’000
Loans and advances to Banks / Central Banks
216,223 0 0 0 530 216,753
Loans and advances to customers
247,618 7,527 13,609 55,188 1712 325,654
Marketable assets 65,974 0 1,996 8,051 0 76,021
Total Monetary (interest bearing) assets
529,815 7,527 15,605 63,239 2,242 618,428
Liabilities
Customer deposits 439,979 64,239 33,322 50,297 0 587,837
Total Monetary (interest bearing) liabilities
439,979 64,239 33,322 50,297 0 587,837
Derivatives 19,375 (19,375)
Interest Rate Gap 109,211 (56,712) (17,717) (6,433) 2,242
Net Present Value (NPV) Sensitivity to:
Positive Shift (+2%) 605
Negative Shift (-2%) (638)
The following factors reduce the impact of future downward movements in Base rate:
Fixed rate lending by the asset finance subsidiary;
Relatively short term loan portfolio with 33% renewing within 12 months giving the opportunity to re-price lending facilities; and
Minimum lending rates on lending transactions.
3.8 Basis Risk
Basis risk is the risk of reductions in income or economic value arising from the re-pricing of assets and liabilities according to different interest rate bases. The Bank’s exposure to basis risk arises from assets and liabilities being linked to different interest rate types including:
Bank of England base rate – reserve account deposits with the Bank of England
LIBOR – floating rate notes (FRN’s) purchased
Fixed rates – fixed rate gilts and savings products
Managed rates – deposits and advances which are on managed (or administered) rates. For the latest regulatory return as at 31
st October 2016 (the last return prior to the year end), the
following applied:
Of the £282m administered assets, £228m represents client lending.
Of this, 97% by value and 95% by volume were subject to minimum lending rate floors.
Bank base rate linked assets related entirely to funds held at the Bank of England.
Pillar 3 Disclosures - Year Ended 31st December 2016
14 April 2017
3.9 Reputational Risk
Reputational risk is the risk that the Bank’s reputation is damaged by an event, internal or external, leading to financial loss.
The Board is fully aware of the damage that can be caused if the Bank’s reputation is damaged and as such the corporate governance and control environment are designed to manage this risk.
3.10 Liquidity Risk
Liquidity risk is the risk that the Bank does not have sufficient financial resources to meet its liabilities as they fall due. This could be due to an inability to liquidate assets or obtain adequate funding (referred to as "funding liquidity risk") or that it cannot easily unwind or offset specific exposures without significantly lowering market prices because of inadequate market depth or market disruptions ("market liquidity risk").
The Bank’s liquidity position is monitored daily and reported on a number of levels throughout the business including at Board level. The Bank maintains a material liquidity buffer above the minimum requirements set by the PRA to allow for daily fluctuations as well as stressed scenarios.
The Bank’s latest ILAAP was completed and approved by the Board during 2016. The Bank has maintained holdings in eligible buffer assets in line with banking regulations at all times.
3.11 Pension Risk
Pension risk is the potential that the Bank will be unable to meet additional liabilities that might arise under a defined benefit pension scheme. This can be due to a number of factors:
A fall in the market value of investments held reducing the fair value of scheme assets
A fall in the discount rate increasing the present value of scheme liabilities
An increase in the life expectancy increasing the present value of scheme liabilities. Weatherbys Bank is part of a group of companies controlled by Weatherby family trusts. It is part of a
group defined benefit pension scheme and is therefore required to meet its share of the liabilities arising under the scheme. As at 31
st December 2016 the group scheme had a deficit and the Bank’s share of
this liability was estimated as £1,600,000. As with other such schemes the group has a recovery plan in place to meet this liability that has been agreed with the Pension Regulator. In addition the PRA requires the Bank to hold additional Pillar 2 capital well in excess of the estimated liability as at 31
st December
2016. This is to ensure that the Bank can meet potential increased pension liabilities should the actuarial assumptions on, for example, future mortality, equity and bond returns, deteriorate significantly.
3.12 Securitisation Risk
The Bank has not securitised any assets to date and has no plans to do so.
3.13 Counterparty Credit Risk
The Bank has no trading book and therefore has no material exposure to counterparty credit risk. Its clearing bank, Royal Bank of Scotland, is used for a small number of interest rate swap and foreign exchange derivatives, placed for the purposes of treasury and interest rate risk management.
3.14 Regulatory & Conduct Risk
As a provider of financial services the Company also faces potential risks arising from failures to meet customer expectations, to deal with complaints effectively and to ensure the products it provides are appropriate to their customer’s needs. The Company’s internal systems, controls and protocols are designed specifically to protect against such risks.
Pillar 3 Disclosures - Year Ended 31st December 2016
15 April 2017
4. REMUNERATION
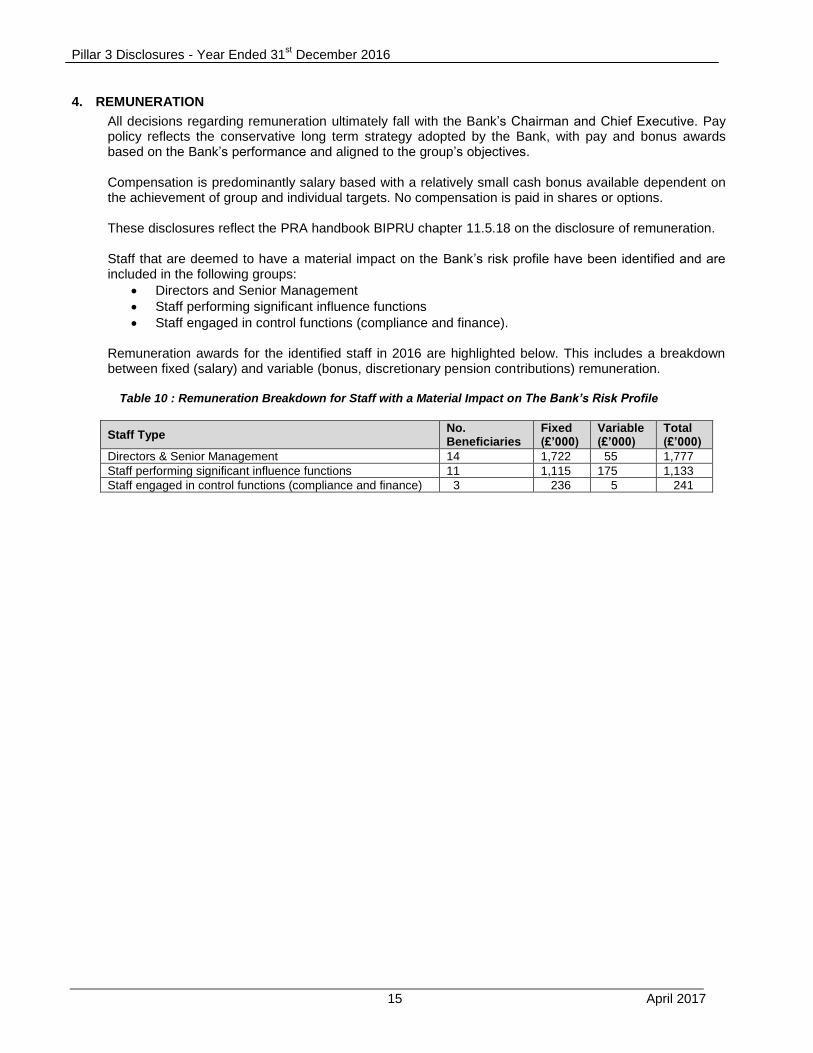
All decisions regarding remuneration ultimately fall with the Bank’s Chairman and Chief Executive. Pay policy reflects the conservative long term strategy adopted by the Bank, with pay and bonus awards based on the Bank’s performance and aligned to the group’s objectives. Compensation is predominantly salary based with a relatively small cash bonus available dependent on the achievement of group and individual targets. No compensation is paid in shares or options.
These disclosures reflect the PRA handbook BIPRU chapter 11.5.18 on the disclosure of remuneration. Staff that are deemed to have a material impact on the Bank’s risk profile have been identified and are included in the following groups:
Directors and Senior Management
Staff performing significant influence functions
Staff engaged in control functions (compliance and finance). Remuneration awards for the identified staff in 2016 are highlighted below. This includes a breakdown between fixed (salary) and variable (bonus, discretionary pension contributions) remuneration.
Table 10 : Remuneration Breakdown for Staff with a Material Impact on The Bank’s Risk Profile
Staff Type No. Beneficiaries
Fixed (£’000)
Variable (£’000)
Total (£’000)
Directors & Senior Management 14 1,722 55 1,777
Staff performing significant influence functions 11 1,115 175 1,133
Staff engaged in control functions (compliance and finance) 3 236 5 241