Embed Size (px)
Citation preview

CAPITA Activities as Part of the OAQPS Co-operative Agreement - 1998/99
Center for Air Pollution Impact and Trend Analysis
Washington University
Saint Louis, Missouri

Overview
CAPITA’s activities are divided into three areas of research:
PM Analysis - conduct data analysis research
PM Analyses Infrastructure - facilitate the organization and sharing of AQ resources
PM Analyses Management - Explore ways of analyzing and improving the AQ management process

PM Analysis - Overview
• PM2.5 National Maps
• Visibility (PM2.5) Trends
• Natural (out of EPA jurisdiction) Events
• Future Analyses

PM2.5 National Maps
• PM2.5 concentration maps are useful in understanding the pollutant’s spatial pattern and in identifying potential non-attainment areas of the PM2.5 NAAQS (annual average of 15 μg/m3 )
• Point monitoring data provide information at specific points and are used as input in generating maps
• The limited number of PM2.5 monitoring data are inadequate to generate meaningful maps and requires the application of surrogate data (PM10 and Visibility) in the mapping process

PM2.5 National Maps - Results
This is a work in progress. The maps are currently the best available but are expected to change as estimation methods improve and additional data is incorporated.
Visibility Aided PM2.5 PM10 Aided PM2.5
PM2.5 concentrations are above 15 μg/m3 in the San Joaquin Valley and South Coast Basin of California. Pittsburgh, St. Louis, Roanoke, and an area stretching from New York City to Washington D.C. are above 15 μg/m3 in both maps. The visibility aided estimates indicate a larger region above 15 μg/m3 along the eastern seaboard. Additional areas above 15 μg/m3 are shown with PM10 aided estimates including Atlanta and eastern Tennessee.
Annual Average PM2.5 Concentrations (1994-1996)

PM2.5 National Maps - Application
• PM2.5 Criteria Document
• NAS Report

Visibility Trends
• Updated US visibility trends for the period 1980-95. Husar et al., 1993 presents the 1960-1992 visibility trends.
• Data from 1996 and 1997 were excluded since these data were collected using the automated ASOS visibility measuring system.
• The analysis is conducted using the summer season (June, July, August), because this is the period during which the visibility degradation is the worst over most of the US

Visibility Trends - Results
In the Eastern US, throughout the 1980-95 period, the 75th percentile BEXT exceeded 0.15 or had an average visibility of less than 10 miles. Most notable are the hazy regions on both sides of the Appalachian Mountains where the BEXT exceeds 0.2 1/km. Since the early 1980s the BEXT decreased 10-15% with the largest decreases in the Southern and Central regions.
US Visibility Trend Maps, 1980 - 1995 Click on the images to view larger versions

Visibility Trends - Results
Over the Eastern US, the 75th percentile BEXT decreased about ~8 percent over the 15 years. The largest decreases occurred in the Southeast where the BEXT decreased 12% compared to 8% in the Northeast.
Trend StatisticsEastern US Northeastern US Southeastern US
75th %-ile 90th %-ile 75th %-ile 90th %-ile 75th %-ile 90th %-ile BEXT (1/km)
('80 - '95)0.015 0.042 0.014 0.042 0.024 0.053
Stnd Error (1/km) 0.0095 0.018 0.014 0.023 0.011 0.023/Error 1.58 2.29 1 1.83 2.14 2.32
Trend Confidencelimit (t distribution)
85% 95% 65% 90% 95% 95%
Light Extinction Trends of the 75th and 90th Percentiles
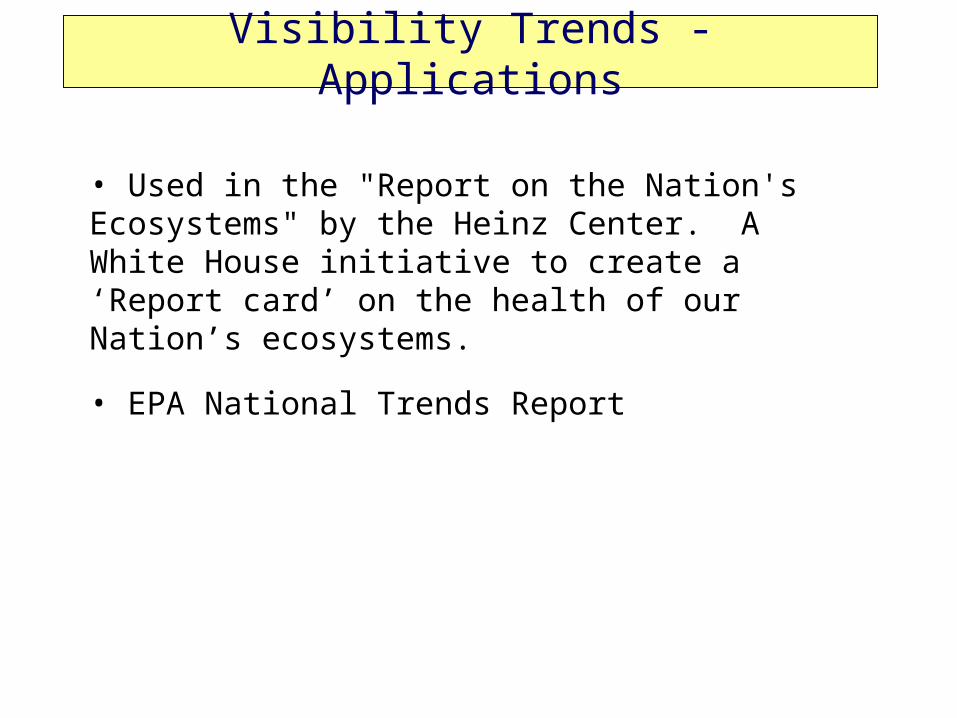
Visibility Trends - Applications
• Used in the "Report on the Nation's Ecosystems" by the Heinz Center. A White House initiative to create a ‘Report card’ on the health of our Nation’s ecosystems.
• EPA National Trends Report
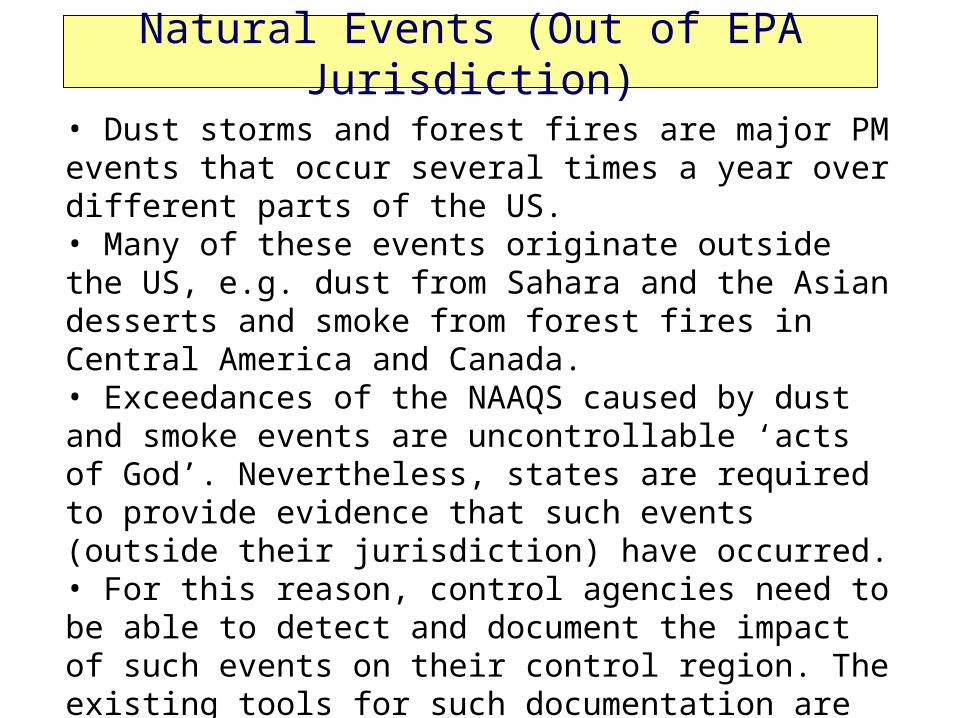
Natural Events (Out of EPA Jurisdiction)
• Dust storms and forest fires are major PM events that occur several times a year over different parts of the US.• Many of these events originate outside the US, e.g. dust from Sahara and the Asian desserts and smoke from forest fires in Central America and Canada. • Exceedances of the NAAQS caused by dust and smoke events are uncontrollable ‘acts of God’. Nevertheless, states are required to provide evidence that such events (outside their jurisdiction) have occurred.• For this reason, control agencies need to be able to detect and document the impact of such events on their control region. The existing tools for such documentation are poorly developed.• The natural PM events are illustrated by two extreme examples: Asian dust impacting on the West Coast and the Central American forest fire smoke impacting the Eastern US.

Natural Events - ResultsSmoke from C. American Forest Fires
• During a ten-day period, May 7-17, 1998, smoke from fires in Central America drifted northward into USA and Canada.
• The smoke caused exceedances of the PM standard, health alerts, and impairment of air traffic, as well as major reductions of visual range.
• It has been argued that some ozone exceedances in the Eastern US may have been due to ozone generated by the forest fire smoke.
GOES 8 View of the SmokeSeaWiFS View of the Smoke

Natural Events - ResultsAsian Dust over the West Coast
• In Vancouver and in Washington State the PM10 and PM2.5 concentrations reached 100 an 40 µg respectively.
• Based on public complaints and monitoring data, the State of Washington has issued a ban on open burning on April 29.

Natural Events - Applications
• Used in the assessment of the requests by States for ozone exceedance waivers for smoke generated ozone.
• Used in the criteria document??

Planned National PM Analyses
• PM Spatial and Temporal Pattern Analysis
• PM Transport Climatology - relate transport to ambient concentrations and vice versa.
• Surface Winds• Forward Airmass Histories• Backward Airmass Histories
• ??

PM Analysis Infrastructure - Overview
• PM Analysis Website & Repository
• PM2.5 Data Integration and Living Data Inventory
• PM2.5 Analysis Tools & Methods
• PM2.5 Analysis Workbook in Support of SIPS

PM2.5 Data Integration and Living Data Inventory
The ProblemThe researcher can not get access to the data;
if he can, he can not read them;
if he can read them,
he does not know how good they are;
and if he finds them good
he cannot merge them with other data.
Information Technology and the Conduct of Research:
The Users view
National Academy Press, 1989

Data Flow and Processing

Infrastructure support for a distributed system
• Data sharing standards. A set of open standards for the sharing of AQ data, tools and reports. Examples: TCP/IP, HTML, XML, FGDC
• Data catalog. A virtual centralized catalog with search and retrieval facilities. Examples: GCMD, web-indexes
• Web-based shared workspace. Place to share comments, feedback, plans, ...

North American Integrated Fine Particle Data SetsThe fine particle mass and composition data sets (1979-1997) consisting of ~600 urban and rural monitoring sites in the US and Canada from 18 networks. Data sets integrated include IMPROVE, AIRS, NAPS, CASTNet, and others.
o Other

Living Data Inventory - Data Catalog

Data Evolution: Comment and Feedback

Benefits of a Distributed and Shared System
• Access to data. Users can get data, tools, reports out of the system for specific projects. It can be a forum for the exchange of ideas, peer-feedback etc.
• Saving time and money. The data, tools and other resources in the system could be leveraging the dollars and time available for specific projects.
• Recycling Data. Data are costly resource. The system can help managing, accessing and documenting one's own data, and share it with others for re-use.

PM Analysis Tools & Methods - Motivation
PM2.5 Analysis Workbook in Support of SIPS
• EPA's Emissions, Monitoring, and Analysis Division has initiating a collaborative effort to explore relevant analyses of the PM2.5 data to be collected by the new National and State monitoring networks .
• The goals of the this collaboration are to foster an environment for the sharing of ideas and develop a workbook detailing useful analyses of the PM2.5 mass and speciated data.
• The PM Analysis workbook will be used to deliver

PM Analysis Website
• This website is a forum for the free exchange of fine particle data and information in support of these goals.
• The virtual community that shares this website consists of individuals from the federal EPA, regional, state and local air pollution agencies, industry and other groups. To make a submission, find the appropriate section of the outline on the left.
• Documents related to the official regulatory process are to be found on the companion EPA PM2.5 Data Analysis website.

PM Analysis Management - Overview
•AQ Management from a Systems Analysis Perspective
•National-local interaction for Monitoring and Assessment
•Interaction among ‘Programs’
•Megatrends
Processes of AQ Management
• Following the systems approach, the key AQ management steps are:– Setting of AQ Goals
– Monitoring and Assessment of Status and Trends
– Actions to Reduce Exceedances
• Each management module is well defined– Its function is clear
– Has specific information need
– The role of the AQ Analyst is to provide AQ information to these modules
• These steps are consistent with the current EPA practice (?)

Processes, Participants and Methods of AQ Management
• Table

Systems Concepts in Support of AQ Management Support
• Provides an inclusive framework• Identify the key players/stakeholders and their
relationship• Indicate their information needs and flow pattern

Air Quality and Management as a Feedback System
AirQuality
AssessmentDetermine Deviations
Plan ReductionsTrack Progress
ImplementingReductions
(Actions)
Monitoring(Sensing)
Set GoalsCAAA
NAAQS
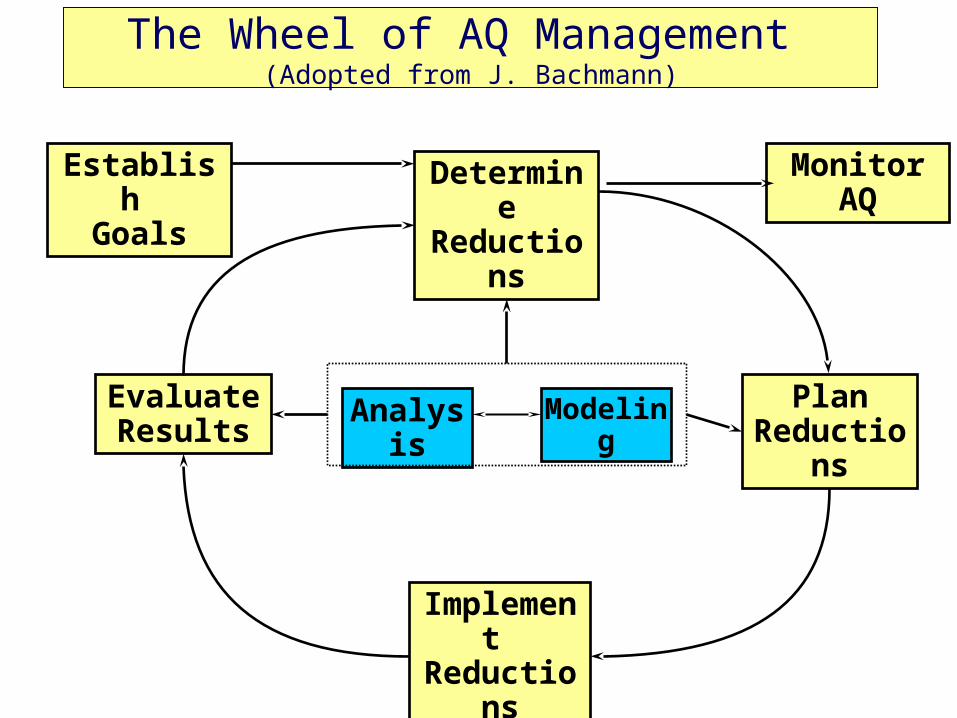
The Wheel of AQ Management (Adopted from J. Bachmann)
DetermineReductions
PlanReductions
EvaluateResults
Implement Reductions
Establish Goals
Analysis Modeling
Monitor AQ

National and Local AQ Analysis
• AQ data analysis needs to performed at both national (global) and local level
• The ‘global’ analysis establishes the large scale context
• Local analysis focuses on the specific and detailed local features
• National-local interaction needs to be mutually beneficial

Interaction Between National and Local Analysis
Activity BenefitData, tools, wisdom Improved local productivityGlobal data analysis Spatial context and ‘first cut’ local analysis
Analysis guidance document Standardized analysis and reporting
Activity BenefitLocal data analysis Improve, verify, explain ‘first cut’ analysis
Raise issues for global analysis Responsive, relevant global analysisData, tools, wisdom Improved global productivity

National-Local Information Sharing
• The national and local analysts maintain their own ‘workspace’
• However, part of the workspace ( data, reports, some discussion) can be shared (exposed)
• Networking can create a common virtual workspace
Local LocalLocalLocal
Global Data, Tools, Wisdomreports

Potential Applications of National-Local Interaction
• OAQPS-State Analyst• Supersite

Megatrends Related to PM2.5
• From SO2 and TSP to Ozone and Fine Particulates– Recent health and environmental effects studies implicate ozone and fine
particulates as two of the most serious current air quality problems in North America.
• From Primary to Secondary Pollutants– Ozone as fine particles are not primary (emitted) but formed in the atmosphere from
complex mixtures of precursor gases. There are no direct ways of identifying the impact of specific sources.
• From Short Range to Long Range Impact– The atmospheric lifetime of O3 and PM2.5 is several days, so the winds carries
them over 1,000 km from their source. The result is "long-range transport" across state and international boundaries.
• From Command and Control to ‘Weight of Evidence”– The new AQ management style strives to include stakeholders in the policy
development; encourages market-based resource allocations and applies 'weight of evidence' - to compliance management