Embed Size (px)
Citation preview
CE and TroubleshootingNYC OCME Forensic Biology Continuing Education Seminar
March 25, 2009
http://www.cstl.nist.gov/biotech/strbase/training.htm 1
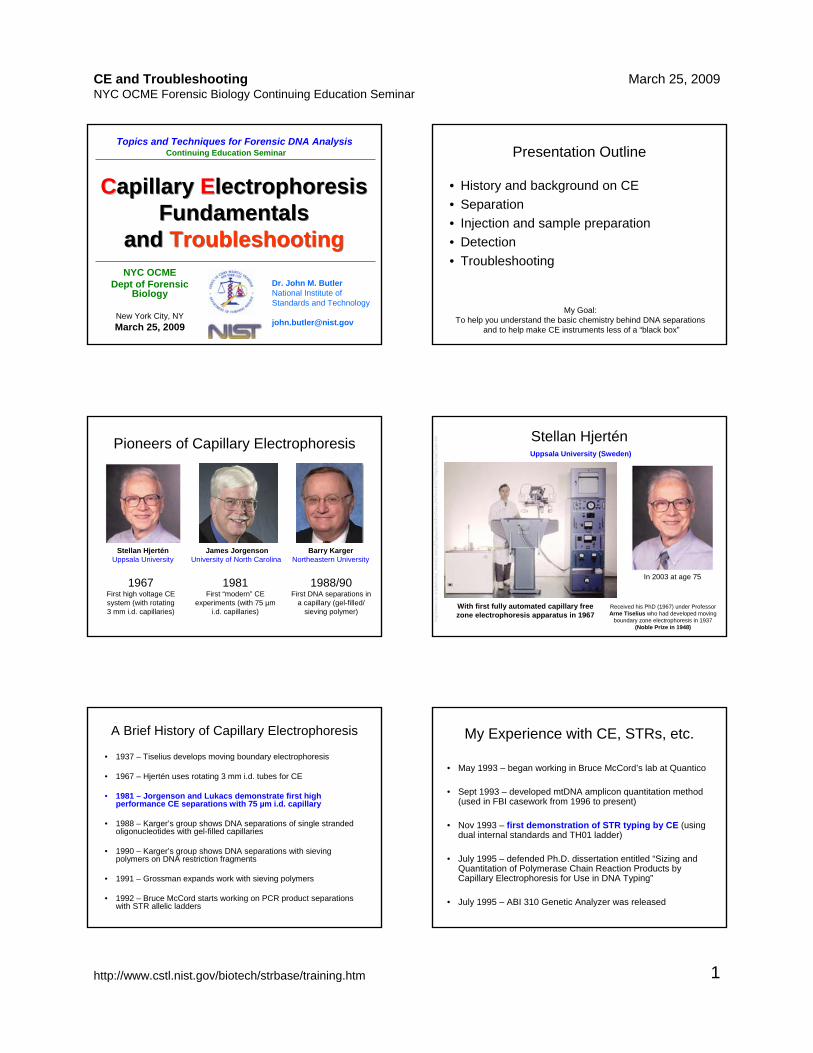
Capillary Electrophoresis Fundamentals
and Troubleshooting
CCapillary EElectrophoresis Fundamentals
and Troubleshooting
Dr. John M. ButlerNational Institute of Standards and Technology
Topics and Techniques for Forensic DNA Analysis
NYC OCMEDept of Forensic
Biology
New York City, NYMarch 25, 2009
Continuing Education Seminar Presentation Outline
• History and background on CE• Separation• Injection and sample preparation• Detection• Troubleshooting
My Goal: To help you understand the basic chemistry behind DNA separations
and to help make CE instruments less of a “black box”
Pioneers of Capillary Electrophoresis
James JorgensonUniversity of North Carolina
Barry KargerNortheastern University
Stellan HjerténUppsala University
1967First high voltage CE system (with rotating 3 mm i.d. capillaries)
1981First “modern” CE
experiments (with 75 µm i.d. capillaries)
1988/90First DNA separations in
a capillary (gel-filled/ sieving polymer)
Stellan Hjertén
In 2003 at age 75
With first fully automated capillary free zone electrophoresis apparatus in 1967
http
://w
ww
.rsc.
org/
deliv
ery/
_Arti
cleL
inki
ng/D
ispl
ayA
rticl
eFor
Free
.cfm
?doi
=b30
7798
p&Jo
urna
lCod
e=A
N
Uppsala University (Sweden)
Received his PhD (1967) under Professor Arne Tiselius who had developed moving
boundary zone electrophoresis in 1937 (Noble Prize in 1948)
A Brief History of Capillary Electrophoresis
• 1937 – Tiselius develops moving boundary electrophoresis
• 1967 – Hjertén uses rotating 3 mm i.d. tubes for CE
• 1981 – Jorgenson and Lukacs demonstrate first high performance CE separations with 75 µm i.d. capillary
• 1988 – Karger’s group shows DNA separations of single stranded oligonucleotides with gel-filled capillaries
• 1990 – Karger’s group shows DNA separations with sieving polymers on DNA restriction fragments
• 1991 – Grossman expands work with sieving polymers
• 1992 – Bruce McCord starts working on PCR product separations with STR allelic ladders
My Experience with CE, STRs, etc.
• May 1993 – began working in Bruce McCord’s lab at Quantico
• Sept 1993 – developed mtDNA amplicon quantitation method (used in FBI casework from 1996 to present)
• Nov 1993 – first demonstration of STR typing by CE (using dual internal standards and TH01 ladder)
• July 1995 – defended Ph.D. dissertation entitled “Sizing and Quantitation of Polymerase Chain Reaction Products by Capillary Electrophoresis for Use in DNA Typing”
• July 1995 – ABI 310 Genetic Analyzer was released
CE and TroubleshootingNYC OCME Forensic Biology Continuing Education Seminar
March 25, 2009
http://www.cstl.nist.gov/biotech/strbase/training.htm 2
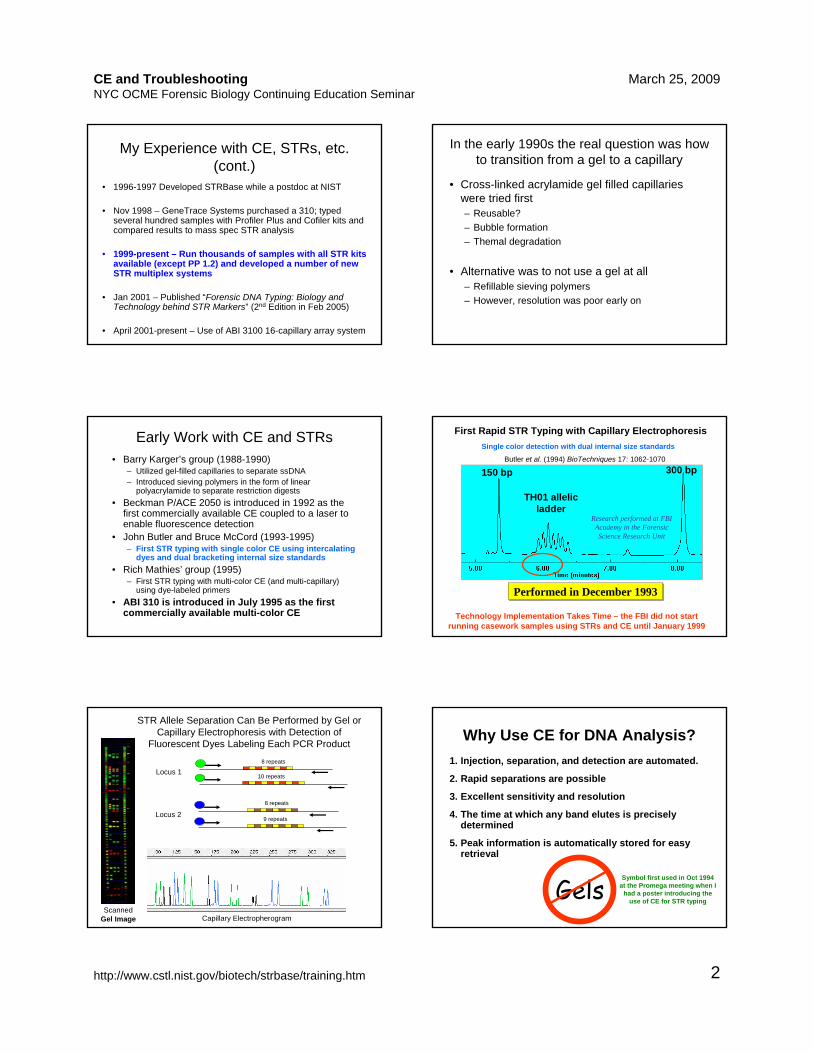
My Experience with CE, STRs, etc. (cont.)
• 1996-1997 Developed STRBase while a postdoc at NIST
• Nov 1998 – GeneTrace Systems purchased a 310; typed several hundred samples with Profiler Plus and Cofiler kits and compared results to mass spec STR analysis
• 1999-present – Run thousands of samples with all STR kits available (except PP 1.2) and developed a number of new STR multiplex systems
• Jan 2001 – Published “Forensic DNA Typing: Biology and Technology behind STR Markers” (2nd Edition in Feb 2005)
• April 2001-present – Use of ABI 3100 16-capillary array system
In the early 1990s the real question was how to transition from a gel to a capillary
• Cross-linked acrylamide gel filled capillaries were tried first– Reusable?– Bubble formation– Themal degradation
• Alternative was to not use a gel at all– Refillable sieving polymers– However, resolution was poor early on
Early Work with CE and STRs• Barry Karger’s group (1988-1990)
– Utilized gel-filled capillaries to separate ssDNA– Introduced sieving polymers in the form of linear
polyacrylamide to separate restriction digests• Beckman P/ACE 2050 is introduced in 1992 as the
first commercially available CE coupled to a laser to enable fluorescence detection
• John Butler and Bruce McCord (1993-1995)– First STR typing with single color CE using intercalating
dyes and dual bracketing internal size standards• Rich Mathies’ group (1995)
– First STR typing with multi-color CE (and multi-capillary) using dye-labeled primers
• ABI 310 is introduced in July 1995 as the first commercially available multi-color CE
150 bp 300 bp
TH01 allelic ladder
Technology Implementation Takes Time – the FBI did not start running casework samples using STRs and CE until January 1999
Performed in December 1993Performed in December 1993
Research performed at FBI Academy in the Forensic Science Research Unit
First Rapid STR Typing with Capillary ElectrophoresisSingle color detection with dual internal size standards
Butler et al. (1994) BioTechniques 17: 1062-1070
Scanned Gel Image Capillary Electropherogram
STR Allele Separation Can Be Performed by Gel or Capillary Electrophoresis with Detection of
Fluorescent Dyes Labeling Each PCR Product
8 repeats
10 repeatsLocus 1
8 repeats
9 repeatsLocus 2
Why Use CE for DNA Analysis?1. Injection, separation, and detection are automated.
2. Rapid separations are possible
3. Excellent sensitivity and resolution
4. The time at which any band elutes is precisely determined
5. Peak information is automatically stored for easy retrieval
GelsSymbol first used in Oct 1994
at the Promega meeting when I had a poster introducing the
use of CE for STR typing
CE and TroubleshootingNYC OCME Forensic Biology Continuing Education Seminar
March 25, 2009
http://www.cstl.nist.gov/biotech/strbase/training.htm 3
Inlet (cathode)
Outlet (anode)
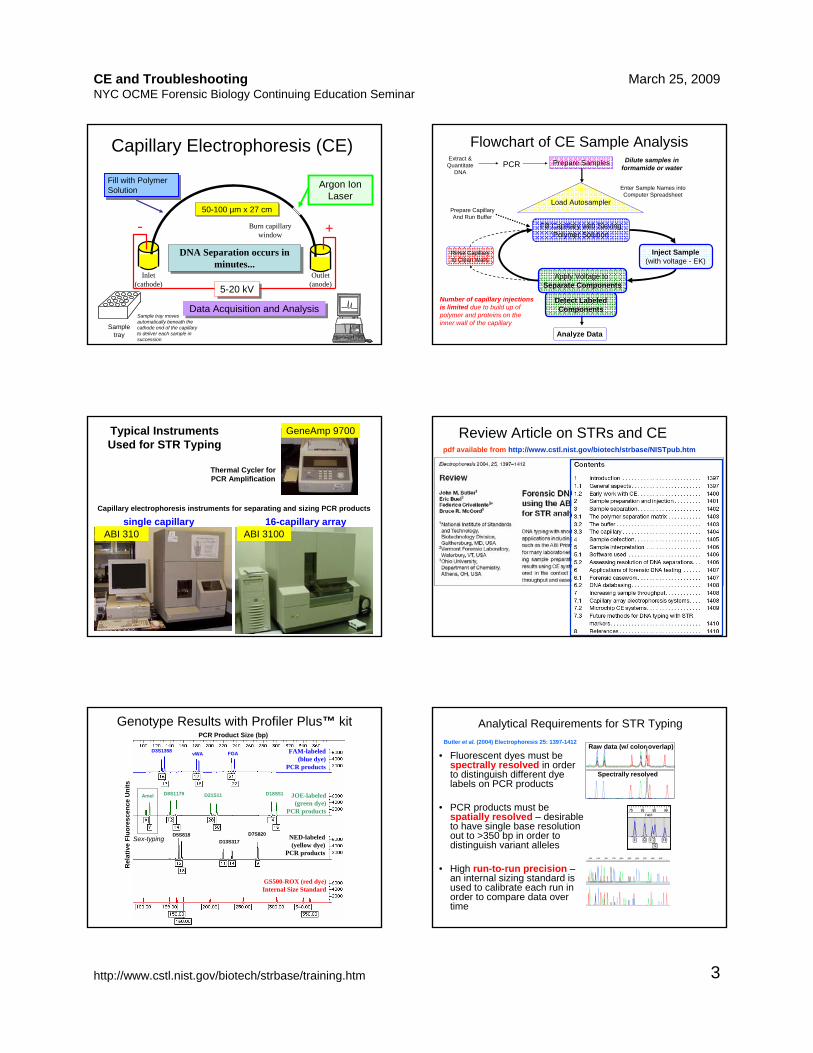
Capillary Electrophoresis (CE)
Argon Ion Laser
Fill with Polymer Solution
Fill with Polymer Solution
50-100 µm x 27 cm50-100 µm x 27 cm
5-20 kV5-20 kV
- +Burn capillary window
DNA Separation occurs in minutes...
DNA Separation occurs in minutes...
Sample tray
Sample tray moves automatically beneath the cathode end of the capillary to deliver each sample in succession
Data Acquisition and AnalysisData Acquisition and Analysis
Flowchart of CE Sample AnalysisPrepare SamplesPCR
Load Autosampler
Fill Capillary with Sieving Polymer Solution
Enter Sample Names into Computer Spreadsheet
Inject Sample(with voltage - EK)
Apply Voltage to Separate Components
Analyze Data
Rinse Capillary to Clean Walls
Prepare Capillary And Run Buffer
Extract &Quantitate
DNA
Number of capillary injections is limited due to build up of polymer and proteins on the inner wall of the capillary
Detect Labeled Components
Dilute samples in formamide or water
ABI 310
GeneAmp 9700Typical Instruments Used for STR Typing
ABI 310016-capillary arraysingle capillary
Thermal Cycler for PCR Amplification
Capillary electrophoresis instruments for separating and sizing PCR products
Review Article on STRs and CEpdf available from http://www.cstl.nist.gov/biotech/strbase/NISTpub.htm
D18S51D21S11
D3S1358 vWA
D5S818
D8S1179Amel
D13S317D7S820
FGA
GS500-ROX (red dye) Internal Size Standard
NED-labeled (yellow dye)
PCR products
JOE-labeled (green dye)
PCR products
FAM-labeled (blue dye)
PCR products
PCR Product Size (bp)
Rel
ativ
e Fl
uore
scen
ce U
nits
Sex-typing
Genotype Results with Profiler Plus™ kit Analytical Requirements for STR Typing
• Fluorescent dyes must be spectrally resolved in order to distinguish different dye labels on PCR products
• PCR products must be spatially resolved – desirable to have single base resolution out to >350 bp in order to distinguish variant alleles
• High run-to-run precision –an internal sizing standard is used to calibrate each run in order to compare data over time
Raw data (w/ color overlap)
Spectrally resolved
Butler et al. (2004) Electrophoresis 25: 1397-1412
CE and TroubleshootingNYC OCME Forensic Biology Continuing Education Seminar
March 25, 2009
http://www.cstl.nist.gov/biotech/strbase/training.htm 4
Mixture of dye-labeled PCR products from
multiplex PCR reaction
CCD Panel (with virtual filters)
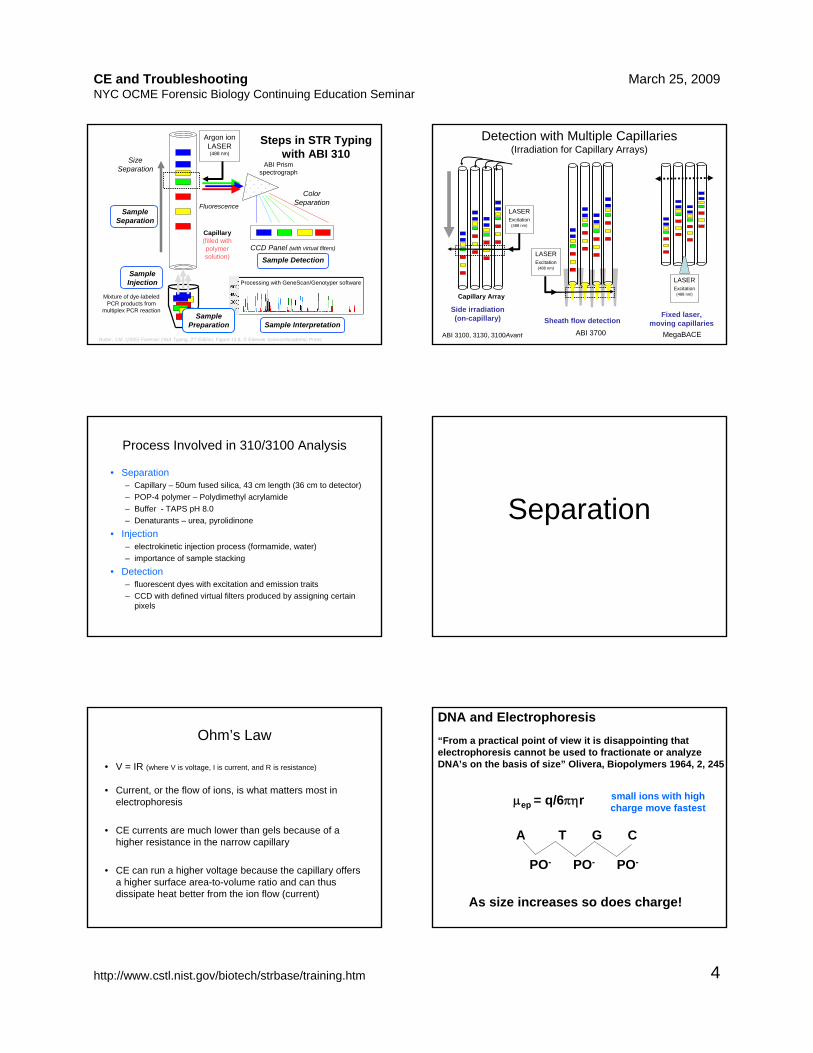
Argon ion LASER (488 nm)
ColorSeparationFluorescence
ABI Prism spectrograph
SizeSeparation
Processing with GeneScan/Genotyper software
Sample Interpretation
Sample Injection
Sample Separation
Sample Detection
Butler, J.M. (2005) Forensic DNA Typing, 2nd Edition, Figure 13.8, © Elsevier Science/Academic Press
Steps in STR Typing with ABI 310
Sample Preparation
Capillary(filled with polymer solution)
LASER Excitation
(488 nm)
Capillary Array
ABI 3100, 3130, 3100Avant
LASER Excitation
(488 nm)
Side irradiation (on-capillary) Sheath flow detection
Detection with Multiple Capillaries (Irradiation for Capillary Arrays)
ABI 3700
LASER Excitation
(488 nm)
Fixed laser, moving capillaries
MegaBACE
Process Involved in 310/3100 Analysis
• Separation– Capillary – 50um fused silica, 43 cm length (36 cm to detector)– POP-4 polymer – Polydimethyl acrylamide– Buffer - TAPS pH 8.0– Denaturants – urea, pyrolidinone
• Injection– electrokinetic injection process (formamide, water)– importance of sample stacking
• Detection– fluorescent dyes with excitation and emission traits – CCD with defined virtual filters produced by assigning certain
pixels
Separation
Ohm’s Law
• V = IR (where V is voltage, I is current, and R is resistance)
• Current, or the flow of ions, is what matters most in electrophoresis
• CE currents are much lower than gels because of a higher resistance in the narrow capillary
• CE can run a higher voltage because the capillary offers a higher surface area-to-volume ratio and can thus dissipate heat better from the ion flow (current)
DNA and Electrophoresis“From a practical point of view it is disappointing thatelectrophoresis cannot be used to fractionate or analyzeDNA’s on the basis of size” Olivera, Biopolymers 1964, 2, 245
μep = q/6πηr
A T G C
PO- PO- PO-
As size increases so does charge!
small ions with high charge move fastest
CE and TroubleshootingNYC OCME Forensic Biology Continuing Education Seminar
March 25, 2009
http://www.cstl.nist.gov/biotech/strbase/training.htm 5
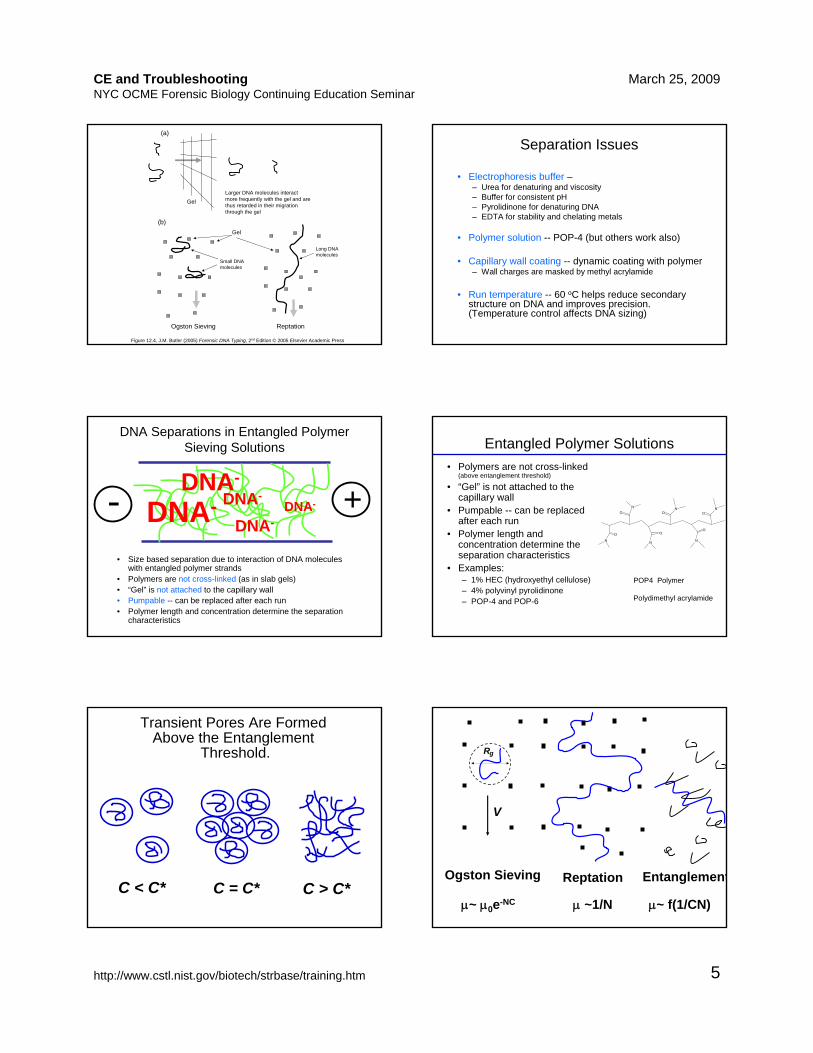
(a)
Larger DNA molecules interact more frequently with the gel and are thus retarded in their migration through the gel
Gel
(b)
Ogston Sieving Reptation
Small DNA molecules
Long DNA molecules
Gel
Figure 12.4, J.M. Butler (2005) Forensic DNA Typing, 2nd Edition © 2005 Elsevier Academic Press
Separation Issues
• Electrophoresis buffer –– Urea for denaturing and viscosity– Buffer for consistent pH– Pyrolidinone for denaturing DNA– EDTA for stability and chelating metals
• Polymer solution -- POP-4 (but others work also)
• Capillary wall coating -- dynamic coating with polymer– Wall charges are masked by methyl acrylamide
• Run temperature -- 60 oC helps reduce secondary structure on DNA and improves precision. (Temperature control affects DNA sizing)
DNA Separations in Entangled Polymer Sieving Solutions
+- DNA-DNA-
DNA-DNA- DNA-
• Size based separation due to interaction of DNA molecules with entangled polymer strands
• Polymers are not cross-linked (as in slab gels)• “Gel” is not attached to the capillary wall• Pumpable -- can be replaced after each run• Polymer length and concentration determine the separation
characteristics
Entangled Polymer Solutions• Polymers are not cross-linked
(above entanglement threshold)
• “Gel” is not attached to the capillary wall
• Pumpable -- can be replaced after each run
• Polymer length and concentration determine the separation characteristics
• Examples: – 1% HEC (hydroxyethyl cellulose)– 4% polyvinyl pyrolidinone– POP-4 and POP-6
ON
O
N
O
N
ON
O
N
ON
POP4 Polymer
Polydimethyl acrylamide
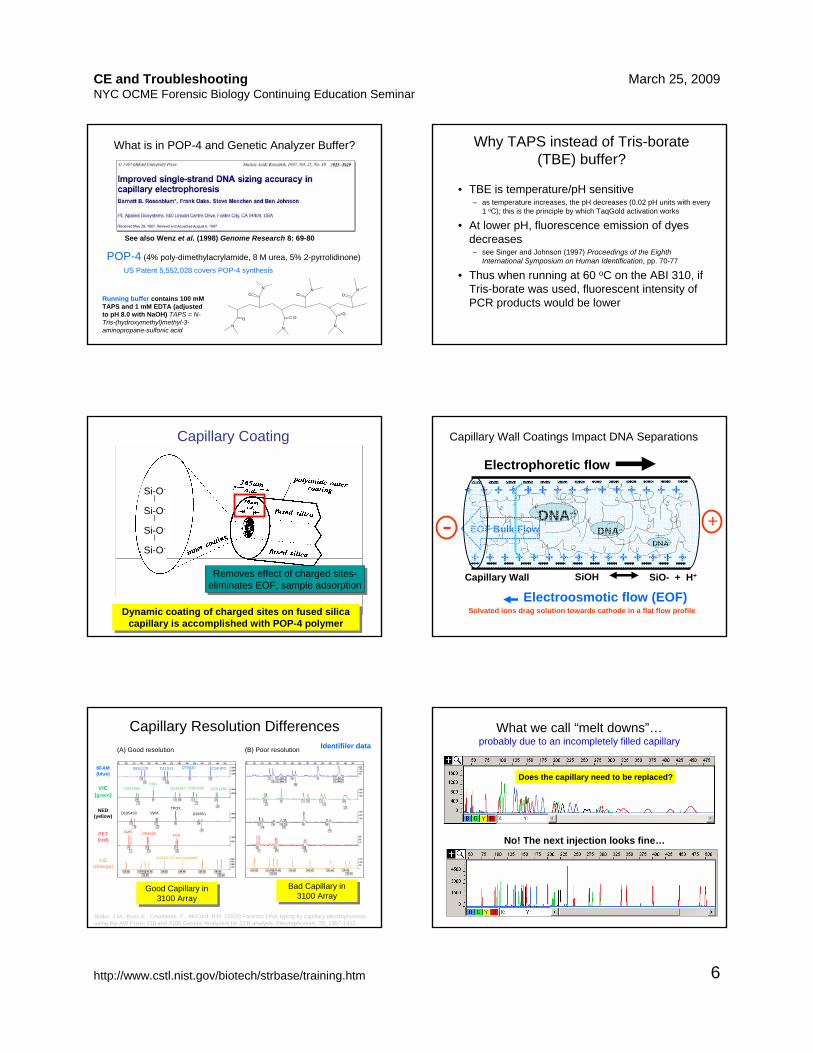
C < C* C = C* C > C*
Transient Pores Are Formed Above the Entanglement
Threshold. Rg
V
Ogston Sieving Reptation Entanglement
μ~ μ0e-NC μ ~1/N μ~ f(1/CN)
CE and TroubleshootingNYC OCME Forensic Biology Continuing Education Seminar
March 25, 2009
http://www.cstl.nist.gov/biotech/strbase/training.htm 6
What is in POP-4 and Genetic Analyzer Buffer?
POP-4 (4% poly-dimethylacrylamide, 8 M urea, 5% 2-pyrrolidinone)
Running buffer contains 100 mM TAPS and 1 mM EDTA (adjusted to pH 8.0 with NaOH) TAPS = N-Tris-(hydroxymethyl)methyl-3-aminopropane-sulfonic acid
US Patent 5,552,028 covers POP-4 synthesis
See also Wenz et al. (1998) Genome Research 8: 69-80
ON
O
N
O
N
ON
O
N
ON
Why TAPS instead of Tris-borate (TBE) buffer?
• TBE is temperature/pH sensitive– as temperature increases, the pH decreases (0.02 pH units with every
1 oC); this is the principle by which TaqGold activation works
• At lower pH, fluorescence emission of dyes decreases– see Singer and Johnson (1997) Proceedings of the Eighth
International Symposium on Human Identification, pp. 70-77
• Thus when running at 60 oC on the ABI 310, if Tris-borate was used, fluorescent intensity of PCR products would be lower
Capillary Coating
Removes effect of charged sites-eliminates EOF, sample adsorptionRemoves effect of charged sites-
eliminates EOF, sample adsorption
Dynamic coating of charged sites on fused silica capillary is accomplished with POP-4 polymer
Dynamic coating of charged sites on fused silica capillary is accomplished with POP-4 polymer
Si-O-|
Si-O-|
Si-O-|
Si-O-
+
Capillary Wall Coatings Impact DNA Separations
Electrophoretic flow
SiOH SiO- + H+Capillary Wall
Electroosmotic flow (EOF)
DNA--
DNA--
DNA--
+ + + + + + + + + + + + + + +
+ + + + + + + + + + + + + +
EOF Bulk Flow
Solvated ions drag solution towards cathode in a flat flow profile
+-
(A) Good resolution
D8S1179 D21S11 D7S820 CSF1PO
D3S1358TH01
D13S317 D16S539 D2S1338
D19S433 D18S51TPOX
VWA
AMEL D5S818 FGA
GS500 LIZ size standard
6FAM (blue)
VIC (green)
NED (yellow)
PET (red)
LIZ (orange)
(B) Poor resolution
Bad Capillary in 3100 Array
Bad Capillary in 3100 ArrayGood Capillary in
3100 ArrayGood Capillary in
3100 Array
Capillary Resolution DifferencesIdentifiler data
Butler, J.M., Buel, E., Crivellente, F., McCord, B.R. (2004) Forensic DNA typing by capillary electrophoresis: using the ABI Prism 310 and 3100 Genetic Analyzers for STR analysis. Electrophoresis, 25: 1397-1412.
What we call “melt downs”…probably due to an incompletely filled capillary
Does the capillary need to be replaced?
No! The next injection looks fine…
CE and TroubleshootingNYC OCME Forensic Biology Continuing Education Seminar
March 25, 2009
http://www.cstl.nist.gov/biotech/strbase/training.htm 7
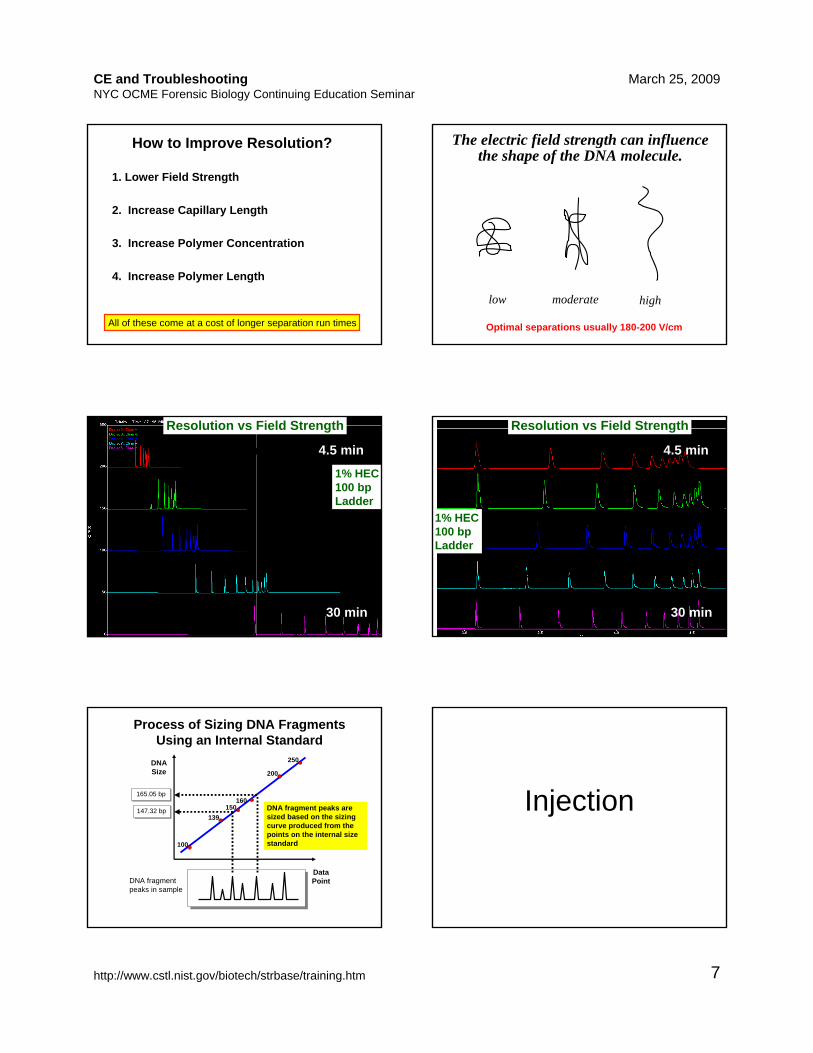
How to Improve Resolution?
1. Lower Field Strength
2. Increase Capillary Length
3. Increase Polymer Concentration
4. Increase Polymer Length
All of these come at a cost of longer separation run times
low moderate high
The electric field strength can influencethe shape of the DNA molecule.
Optimal separations usually 180-200 V/cm
500 V/cm
333 V/cm
266 V/cm
166 V/cm
100 V/cm
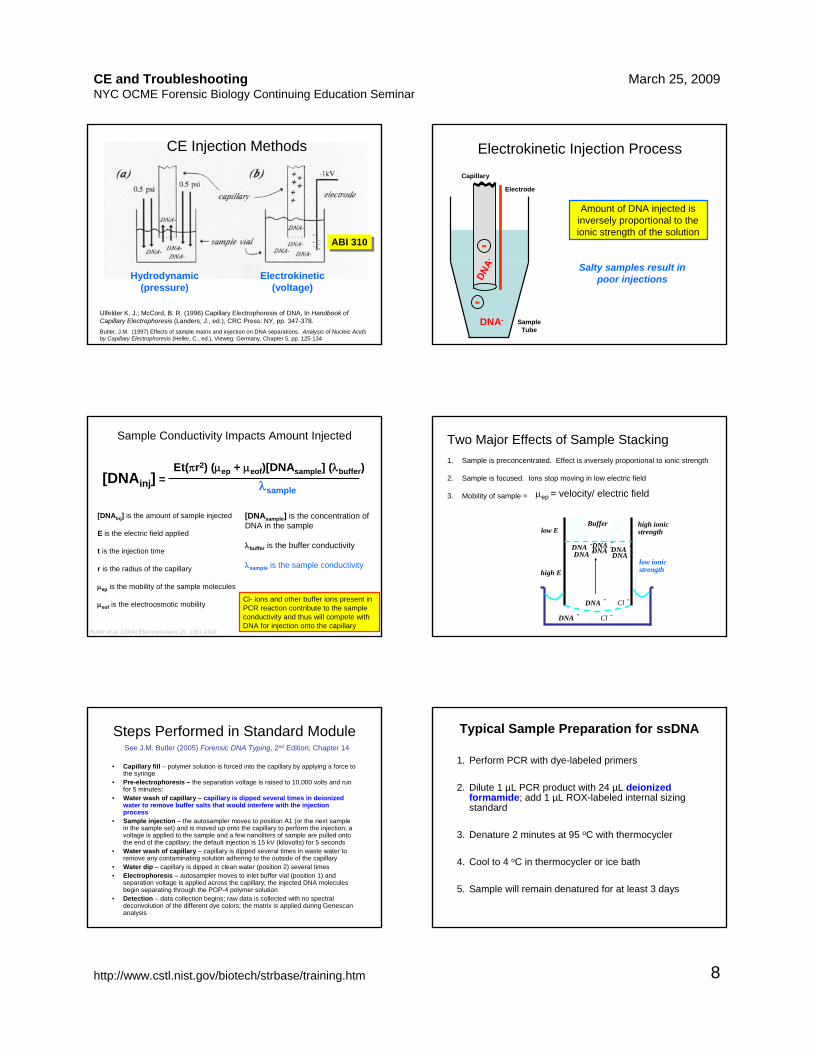
Resolution vs Field Strength
1% HEC100 bp Ladder
4.5 min
30 min
500 V/cm
333 V/cm
266 V/cm
166 V/cm
100 V/cm
Resolution vs Field Strength
1% HEC100 bp Ladder
4.5 min
30 min
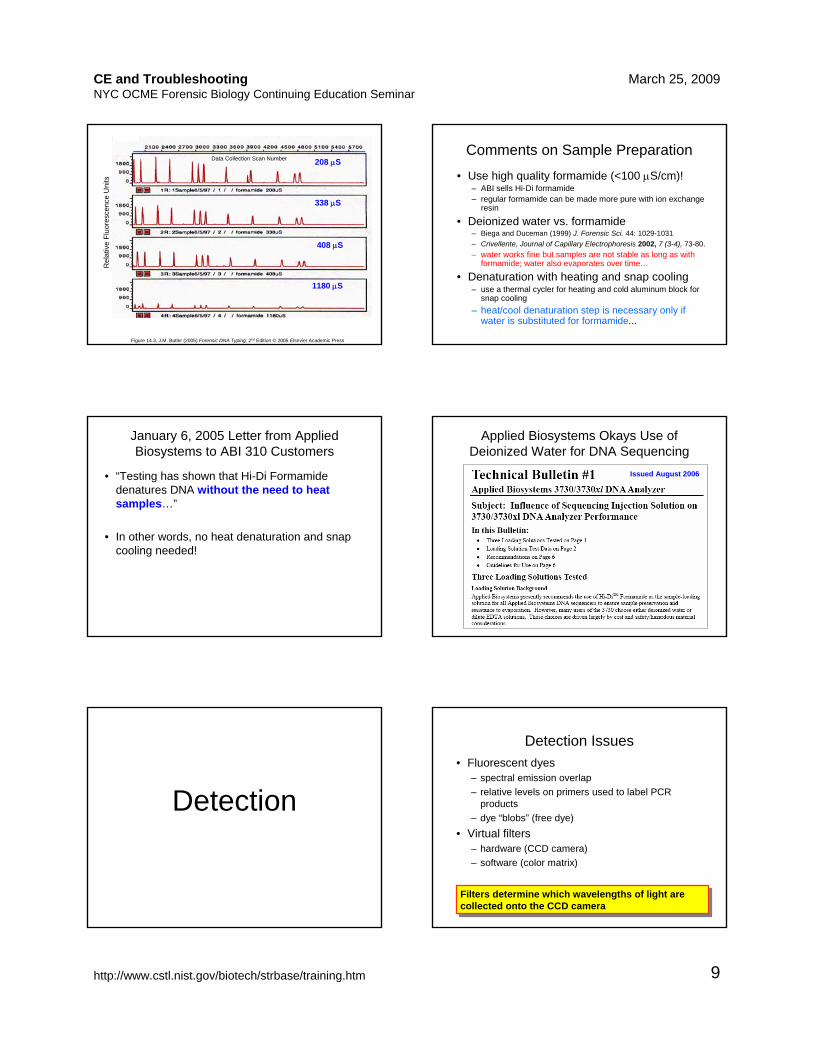
DNA fragment peaks in sample
DNA Size
Data Point
147.32 bp147.32 bp
165.05 bp165.05 bp
100
139150
160
200
250
DNA fragment peaks are sized based on the sizing curve produced from the points on the internal size standard
Process of Sizing DNA Fragments Using an Internal Standard
Injection
CE and TroubleshootingNYC OCME Forensic Biology Continuing Education Seminar
March 25, 2009
http://www.cstl.nist.gov/biotech/strbase/training.htm 8
CE Injection Methods
Hydrodynamic (pressure)
Electrokinetic (voltage)
Ulfelder K. J.; McCord, B. R. (1996) Capillary Electrophoresis of DNA, In Handbook of Capillary Electrophoresis (Landers, J., ed.), CRC Press: NY, pp. 347-378.Butler, J.M. (1997) Effects of sample matrix and injection on DNA separations. Analysis of Nucleic Acids by Capillary Electrophoresis (Heller, C., ed.), Vieweg: Germany, Chapter 5, pp. 125-134
ABI 310ABI 310
Sample Tube
DNA-
-
Electrokinetic Injection Process
Electrode
Capillary
DNA
-
-
Amount of DNA injected is inversely proportional to the ionic strength of the solution
Salty samples result in poor injections
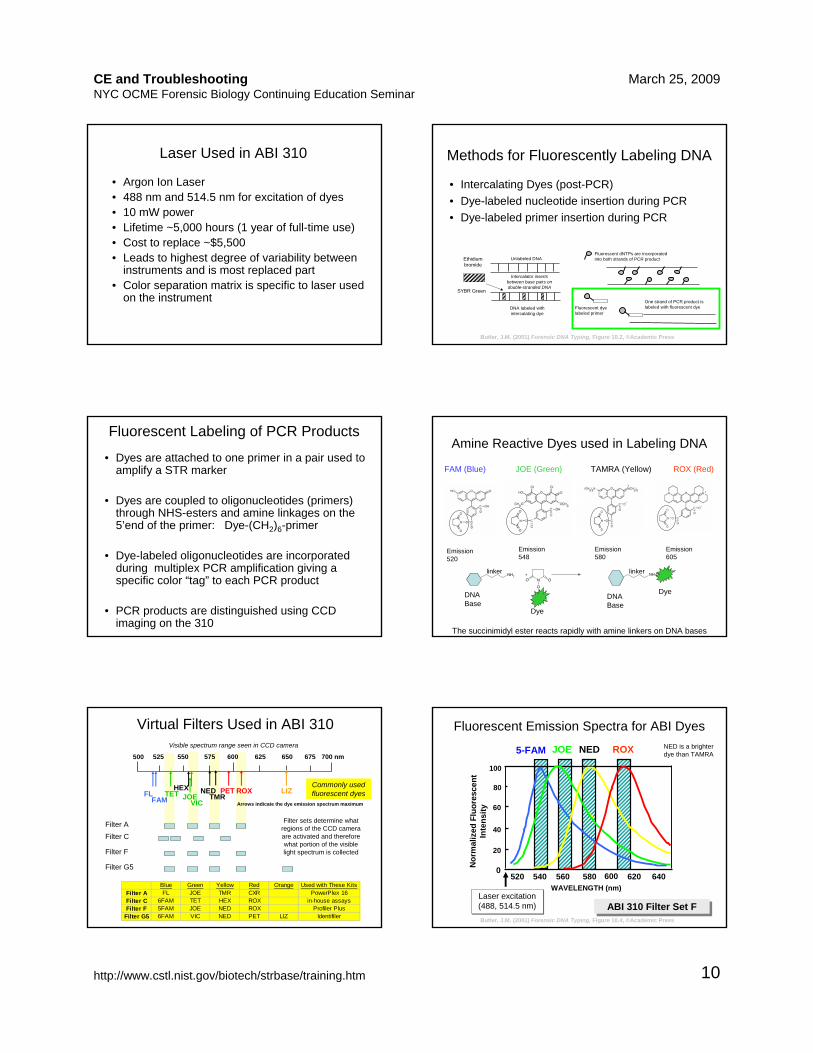
[DNAinj] is the amount of sample injected
E is the electric field applied
t is the injection time
r is the radius of the capillary
μep is the mobility of the sample molecules
μeof is the electroosmotic mobility
Et(πr2) (μep + μeof)[DNAsample] (λbuffer)λsample
[DNAinj] =
Butler et al. (2004) Electrophoresis 25: 1397-1412
[DNAsample] is the concentration of DNA in the sample
λbuffer is the buffer conductivity
λsample is the sample conductivity
Sample Conductivity Impacts Amount Injected
Cl- ions and other buffer ions present in PCR reaction contribute to the sample conductivity and thus will compete with DNA for injection onto the capillary
DNA -
DNA -DNA -DNA -DNA -
DNA -
DNA -DNA -
Buffer
low ionic strength
high ionic strengthlow E
high E
Cl -Cl -
Two Major Effects of Sample Stacking1. Sample is preconcentrated. Effect is inversely proportional to ionic strength
2. Sample is focused. Ions stop moving in low electric field
3. Mobility of sample = μep = velocity/ electric field
Steps Performed in Standard Module
• Capillary fill – polymer solution is forced into the capillary by applying a force to the syringe
• Pre-electrophoresis – the separation voltage is raised to 10,000 volts and run for 5 minutes;
• Water wash of capillary – capillary is dipped several times in deionized water to remove buffer salts that would interfere with the injection process
• Sample injection – the autosampler moves to position A1 (or the next sample in the sample set) and is moved up onto the capillary to perform the injection; a voltage is applied to the sample and a few nanoliters of sample are pulled onto the end of the capillary; the default injection is 15 kV (kilovolts) for 5 seconds
• Water wash of capillary – capillary is dipped several times in waste water to remove any contaminating solution adhering to the outside of the capillary
• Water dip – capillary is dipped in clean water (position 2) several times• Electrophoresis – autosampler moves to inlet buffer vial (position 1) and
separation voltage is applied across the capillary; the injected DNA molecules begin separating through the POP-4 polymer solution
• Detection – data collection begins; raw data is collected with no spectral deconvolution of the different dye colors; the matrix is applied during Genescananalysis
See J.M. Butler (2005) Forensic DNA Typing, 2nd Edition; Chapter 14
Typical Sample Preparation for ssDNA
1. Perform PCR with dye-labeled primers
2. Dilute 1 µL PCR product with 24 µL deionized formamide; add 1 µL ROX-labeled internal sizing standard
3. Denature 2 minutes at 95 oC with thermocycler
4. Cool to 4 oC in thermocycler or ice bath
5. Sample will remain denatured for at least 3 days
CE and TroubleshootingNYC OCME Forensic Biology Continuing Education Seminar
March 25, 2009
http://www.cstl.nist.gov/biotech/strbase/training.htm 9
208 μS
1180 μS
408 μS
338 μS
Data Collection Scan Number
Rel
ativ
e Fl
uore
scen
ce U
nits
Figure 14.3, J.M. Butler (2005) Forensic DNA Typing, 2nd Edition © 2005 Elsevier Academic Press
Comments on Sample Preparation
• Use high quality formamide (<100 μS/cm)!– ABI sells Hi-Di formamide– regular formamide can be made more pure with ion exchange
resin
• Deionized water vs. formamide– Biega and Duceman (1999) J. Forensic Sci. 44: 1029-1031– Crivellente, Journal of Capillary Electrophoresis 2002, 7 (3-4), 73-80. – water works fine but samples are not stable as long as with
formamide; water also evaporates over time…
• Denaturation with heating and snap cooling– use a thermal cycler for heating and cold aluminum block for
snap cooling– heat/cool denaturation step is necessary only if
water is substituted for formamide...
January 6, 2005 Letter from Applied Biosystems to ABI 310 Customers
• “Testing has shown that Hi-Di Formamide denatures DNA without the need to heat samples…”
• In other words, no heat denaturation and snap cooling needed!
Applied Biosystems Okays Use of Deionized Water for DNA Sequencing
Issued August 2006
Detection
Detection Issues• Fluorescent dyes
– spectral emission overlap– relative levels on primers used to label PCR
products– dye “blobs” (free dye)
• Virtual filters– hardware (CCD camera)– software (color matrix)
Filters determine which wavelengths of light are collected onto the CCD cameraFilters determine which wavelengths of light are collected onto the CCD camera
CE and TroubleshootingNYC OCME Forensic Biology Continuing Education Seminar
March 25, 2009
http://www.cstl.nist.gov/biotech/strbase/training.htm 10
Laser Used in ABI 310
• Argon Ion Laser• 488 nm and 514.5 nm for excitation of dyes• 10 mW power• Lifetime ~5,000 hours (1 year of full-time use)• Cost to replace ~$5,500• Leads to highest degree of variability between
instruments and is most replaced part• Color separation matrix is specific to laser used
on the instrument
Methods for Fluorescently Labeling DNA
• Intercalating Dyes (post-PCR)• Dye-labeled nucleotide insertion during PCR• Dye-labeled primer insertion during PCR
Ethidium bromide
DNA labeled with intercalating dye
Unlabeled DNA
SYBR Green
Intercalator inserts between base pairs on double-stranded DNA
One strand of PCR product is labeled with fluorescent dyeFluorescent dye
labeled primer
Fluorescent dNTPs are incorporated into both strands of PCR product
Butler, J.M. (2001) Forensic DNA Typing, Figure 10.2, ©Academic Press
Fluorescent Labeling of PCR Products
• Dyes are attached to one primer in a pair used to amplify a STR marker
• Dyes are coupled to oligonucleotides (primers) through NHS-esters and amine linkages on the 5’end of the primer: Dye-(CH2)6-primer
• Dye-labeled oligonucleotides are incorporated during multiplex PCR amplification giving a specific color “tag” to each PCR product
• PCR products are distinguished using CCD imaging on the 310
FAM (Blue) JOE (Green) TAMRA (Yellow) ROX (Red)
Amine Reactive Dyes used in Labeling DNA
The succinimidyl ester reacts rapidly with amine linkers on DNA bases
NH2O ON
O
Dye
NH-Dye+
DNABase
DNABase
Dye
Dye
Emission 520
Emission 548
Emission 580
Emission 605
linker linker
Virtual Filters Used in ABI 310
Blue Green Yellow Red Orange Used with These KitsFilter A FL JOE TMR CXR PowerPlex 16Filter C 6FAM TET HEX ROX in-house assaysFilter F 5FAM JOE NED ROX Profiler Plus
Filter G5 6FAM VIC NED PET LIZ Identifiler
500 600 700 nm525 550 575 625 650 675
Filter AFilter C
Filter F
Filter G5
FLFAM
TETVIC
JOEHEX NED
TMRPET ROX LIZ
Visible spectrum range seen in CCD camera
Commonly used fluorescent dyes
Filter sets determine what regions of the CCD camera are activated and therefore what portion of the visible light spectrum is collected
Arrows indicate the dye emission spectrum maximum
ABI 310 Filter Set FABI 310 Filter Set F
520 540 560 580 600 620 640WAVELENGTH (nm)
100
80
60
40
20
0
5-FAM JOE NED ROX
Laser excitation(488, 514.5 nm)Laser excitation(488, 514.5 nm)
Nor
mal
ized
Flu
ores
c en t
In
ten s
i ty
Fluorescent Emission Spectra for ABI DyesNED is a brighter dye than TAMRA
Butler, J.M. (2001) Forensic DNA Typing, Figure 10.4, ©Academic Press
CE and TroubleshootingNYC OCME Forensic Biology Continuing Education Seminar
March 25, 2009
http://www.cstl.nist.gov/biotech/strbase/training.htm 11
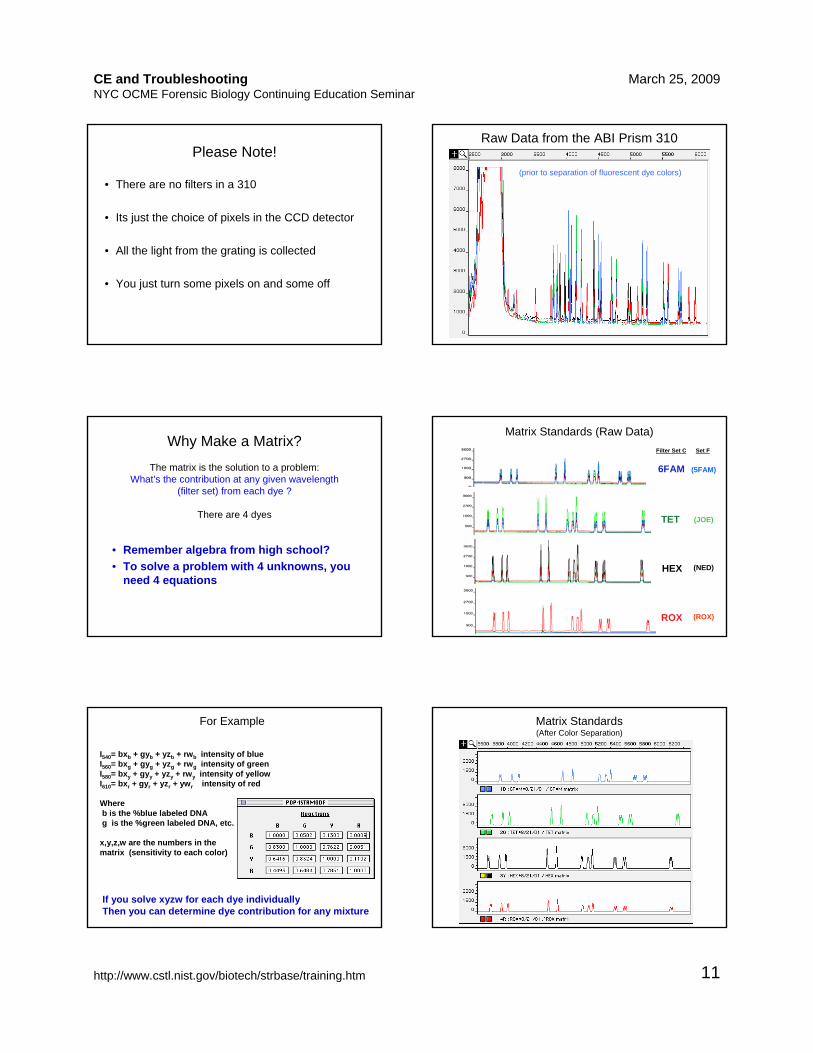
Please Note!
• There are no filters in a 310
• Its just the choice of pixels in the CCD detector
• All the light from the grating is collected
• You just turn some pixels on and some off
(prior to separation of fluorescent dye colors)
Raw Data from the ABI Prism 310
Why Make a Matrix?
The matrix is the solution to a problem:What’s the contribution at any given wavelength
(filter set) from each dye ?
There are 4 dyes
• Remember algebra from high school?• To solve a problem with 4 unknowns, you
need 4 equations
Matrix Standards (Raw Data)
6FAM
TET
HEX
ROX
Filter Set C
(JOE)
(NED)
(5FAM)
(ROX)
Set F
For Example
I540= bxb + gyb + yzb + rwb intensity of blueI560= bxg + gyg + yzg + rwg intensity of greenI580= bxy + gyy + yzy + rwy intensity of yellowI610= bxr + gyr + yzr + ywr intensity of red
Where b is the %blue labeled DNAg is the %green labeled DNA, etc.
x,y,z,w are the numbers in the matrix (sensitivity to each color)
If you solve xyzw for each dye individually Then you can determine dye contribution for any mixture
Matrix Standards(After Color Separation)
CE and TroubleshootingNYC OCME Forensic Biology Continuing Education Seminar
March 25, 2009
http://www.cstl.nist.gov/biotech/strbase/training.htm 12
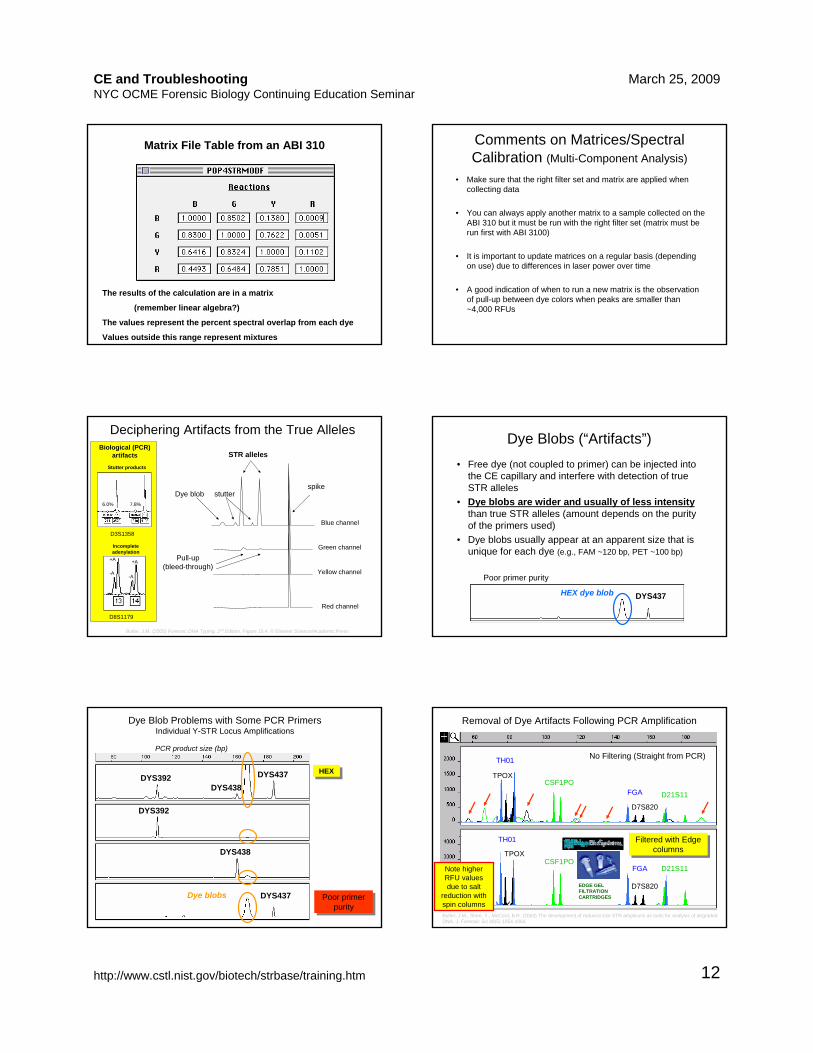
The results of the calculation are in a matrix
(remember linear algebra?)
The values represent the percent spectral overlap from each dye
Values outside this range represent mixtures
Matrix File Table from an ABI 310 Comments on Matrices/Spectral Calibration (Multi-Component Analysis)
• Make sure that the right filter set and matrix are applied when collecting data
• You can always apply another matrix to a sample collected on theABI 310 but it must be run with the right filter set (matrix must be run first with ABI 3100)
• It is important to update matrices on a regular basis (dependingon use) due to differences in laser power over time
• A good indication of when to run a new matrix is the observationof pull-up between dye colors when peaks are smaller than ~4,000 RFUs
Dye blob
STR alleles
stutter
Pull-up (bleed-through)
spike
Blue channel
Green channel
Yellow channel
Red channel
Butler, J.M. (2005) Forensic DNA Typing, 2nd Edition, Figure 15.4, © Elsevier Science/Academic Press
Deciphering Artifacts from the True Alleles
D3S1358
Stutter products
6.0% 7.8%
Incomplete adenylation
D8S1179
-A
+A
-A
+A
Biological (PCR) artifacts
Dye Blobs (“Artifacts”)
DYS437HEX dye blob
Poor primer purity
• Free dye (not coupled to primer) can be injected into the CE capillary and interfere with detection of true STR alleles
• Dye blobs are wider and usually of less intensitythan true STR alleles (amount depends on the purity of the primers used)
• Dye blobs usually appear at an apparent size that is unique for each dye (e.g., FAM ~120 bp, PET ~100 bp)
DYS392
DYS438
DYS437
HEXHEXDYS392
DYS438DYS437
Dye blobs
PCR product size (bp)
Dye Blob Problems with Some PCR Primers Individual Y-STR Locus Amplifications
Poor primer purity
Poor primer purity
Butler, J.M., Shen, Y., McCord, B.R. (2003) The development of reduced size STR amplicons as tools for analysis of degraded DNA. J. Forensic Sci 48(5) 1054-1064.
Filtered with Edge columns
Filtered with Edge columns
No Filtering (Straight from PCR)TH01
TPOXCSF1PO
D21S11
D7S820
FGA
TH01
TPOXCSF1PO
D21S11
D7S820
FGA
EDGE GEL FILTRATION CARTRIDGES
Removal of Dye Artifacts Following PCR Amplification
Note higher RFU values due to salt
reduction with spin columns
CE and TroubleshootingNYC OCME Forensic Biology Continuing Education Seminar
March 25, 2009
http://www.cstl.nist.gov/biotech/strbase/training.htm 13
439 389II438
437391 389I
426YCAII
a/b390 385 a/b
393
392H4460
19388
448447
6FAM(blue)
VIC(green)
NED(Yellow)
PET(Red)
LIZ(Orange)
439 389II438437
391 389I
426390
385 a/b
393
392H4460 19
388
448447
100 bp139
200 250* 300150160
340350
YCAII a/b
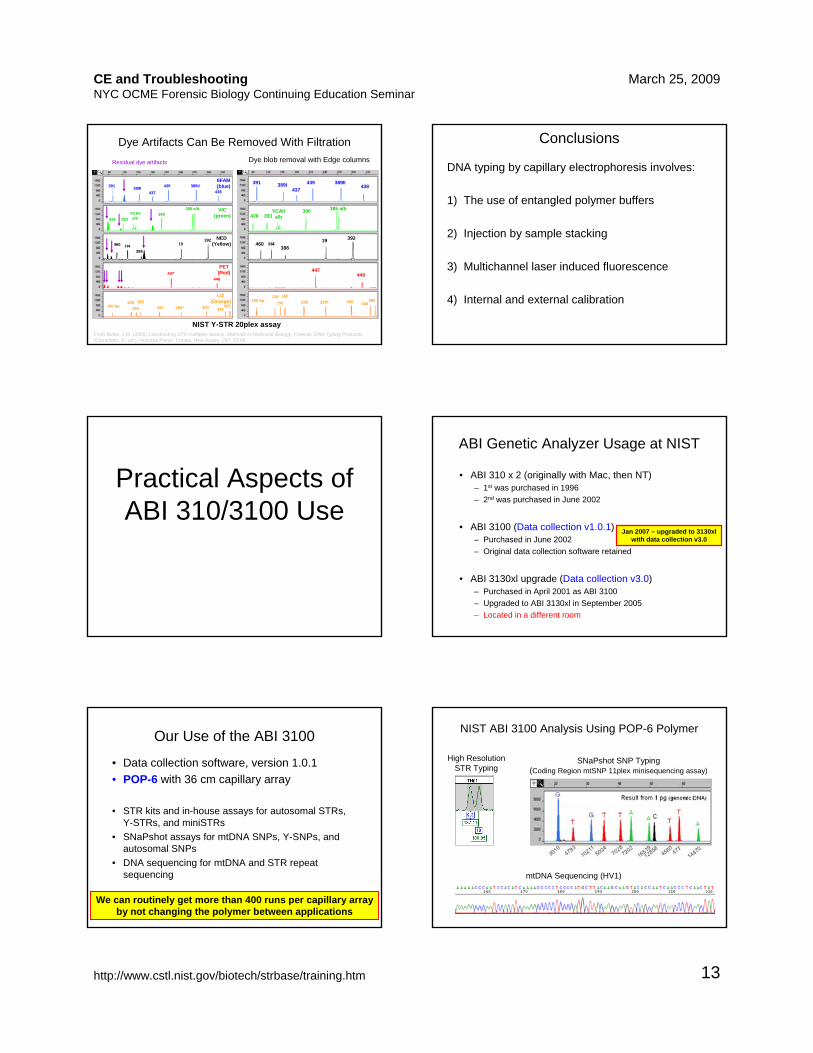
Residual dye artifacts
100 bp139
200 250* 300150160
340350
NIST Y-STR 20plex assay
Dye blob removal with Edge columns
From Butler, J.M. (2005) Constructing STR multiplex assays. Methods in Molecular Biology: Forensic DNA Typing Protocols(Carracedo, A., ed.), Humana Press: Totowa, New Jersey, 297: 53-66.
Dye Artifacts Can Be Removed With Filtration Conclusions
DNA typing by capillary electrophoresis involves:
1) The use of entangled polymer buffers
2) Injection by sample stacking
3) Multichannel laser induced fluorescence
4) Internal and external calibration
Practical Aspects of ABI 310/3100 Use
ABI Genetic Analyzer Usage at NIST
• ABI 310 x 2 (originally with Mac, then NT)– 1st was purchased in 1996– 2nd was purchased in June 2002
• ABI 3100 (Data collection v1.0.1)– Purchased in June 2002– Original data collection software retained
• ABI 3130xl upgrade (Data collection v3.0)– Purchased in April 2001 as ABI 3100– Upgraded to ABI 3130xl in September 2005– Located in a different room
Jan 2007 – upgraded to 3130xl with data collection v3.0
Our Use of the ABI 3100
• Data collection software, version 1.0.1• POP-6 with 36 cm capillary array
• STR kits and in-house assays for autosomal STRs, Y-STRs, and miniSTRs
• SNaPshot assays for mtDNA SNPs, Y-SNPs, and autosomal SNPs
• DNA sequencing for mtDNA and STR repeat sequencing
We can routinely get more than 400 runs per capillary array by not changing the polymer between applications
SNaPshot SNP Typing (Coding Region mtSNP 11plex minisequencing assay)
mtDNA Sequencing (HV1)
NIST ABI 3100 Analysis Using POP-6 Polymer
High Resolution STR Typing
CE and TroubleshootingNYC OCME Forensic Biology Continuing Education Seminar
March 25, 2009
http://www.cstl.nist.gov/biotech/strbase/training.htm 14
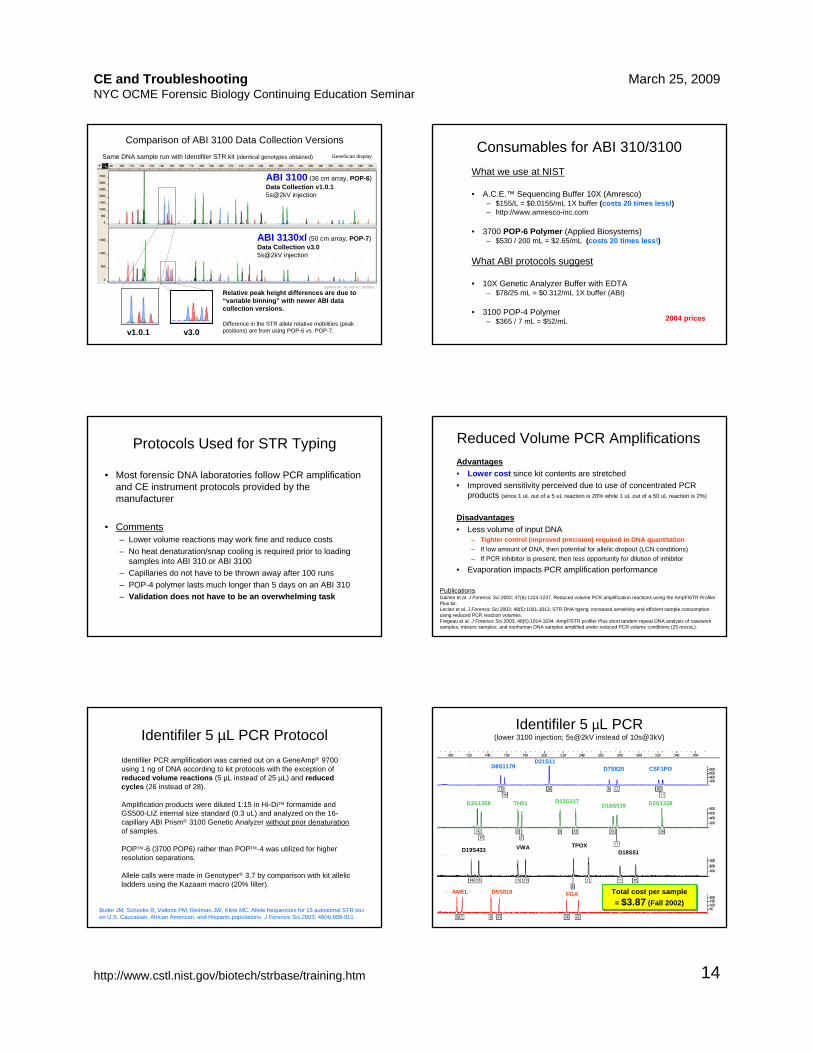
Comparison of ABI 3100 Data Collection Versions
ABI 3100 (36 cm array, POP-6)Data Collection v1.0.15s@2kV injection
ABI 3130xl (50 cm array, POP-7)Data Collection v3.05s@2kV injection
Same DNA sample run with Identifiler STR kit (identical genotypes obtained)
Relative peak height differences are due to “variable binning” with newer ABI data collection versions.
Difference in the STR allele relative mobilities (peak positions) are from using POP-6 vs. POP-7.
GeneScan display
10/04/05 KK_A4; well A2 (JK3993)
v1.0.1 v3.0
Consumables for ABI 310/3100What we use at NIST
• A.C.E.™ Sequencing Buffer 10X (Amresco)– $155/L = $0.0155/mL 1X buffer (costs 20 times less!)– http://www.amresco-inc.com
• 3700 POP-6 Polymer (Applied Biosystems)– $530 / 200 mL = $2.65/mL (costs 20 times less!)
What ABI protocols suggest
• 10X Genetic Analyzer Buffer with EDTA– $78/25 mL = $0.312/mL 1X buffer (ABI)
• 3100 POP-4 Polymer – $365 / 7 mL = $52/mL 2004 prices
Protocols Used for STR Typing
• Most forensic DNA laboratories follow PCR amplification and CE instrument protocols provided by the manufacturer
• Comments– Lower volume reactions may work fine and reduce costs– No heat denaturation/snap cooling is required prior to loading
samples into ABI 310 or ABI 3100– Capillaries do not have to be thrown away after 100 runs– POP-4 polymer lasts much longer than 5 days on an ABI 310– Validation does not have to be an overwhelming task
Reduced Volume PCR AmplificationsAdvantages• Lower cost since kit contents are stretched• Improved sensitivity perceived due to use of concentrated PCR
products (since 1 uL out of a 5 uL reaction is 20% while 1 uL out of a 50 uL reaction is 2%)
Disadvantages• Less volume of input DNA
– Tighter control (improved precision) required in DNA quantitation– If low amount of DNA, then potential for allelic dropout (LCN conditions)– If PCR inhibitor is present, then less opportunity for dilution of inhibitor
• Evaporation impacts PCR amplification performance
Publications:Gaines et al. J Forensic Sci 2002; 47(6):1224-1237. Reduced volume PCR amplification reactions using the AmpFlSTR Profiler Plus kit. Leclair et al. J Forensic Sci 2003; 48(5):1001-1013. STR DNA typing: increased sensitivity and efficient sample consumption using reduced PCR reaction volumes. Fregeau et al. J Forensic Sci 2003; 48(5):1014-1034. AmpFlSTR profiler Plus short tandem repeat DNA analysis of casework samples, mixture samples, and nonhuman DNA samples amplified under reduced PCR volume conditions (25 microL).
Identifiler 5 µL PCR ProtocolIdentifiler PCR amplification was carried out on a GeneAmp® 9700 using 1 ng of DNA according to kit protocols with the exception of reduced volume reactions (5 µL instead of 25 µL) and reduced cycles (26 instead of 28).
Amplification products were diluted 1:15 in Hi-Di™ formamide and GS500-LIZ internal size standard (0.3 uL) and analyzed on the 16-capillary ABI Prism® 3100 Genetic Analyzer without prior denaturationof samples.
POP™-6 (3700 POP6) rather than POP™-4 was utilized for higher resolution separations.
Allele calls were made in Genotyper® 3.7 by comparison with kit allelic ladders using the Kazaam macro (20% filter).
Butler JM, Schoske R, Vallone PM, Redman JW, Kline MC. Allele frequencies for 15 autosomal STR loci on U.S. Caucasian, African American, and Hispanic populations. J Forensic Sci 2003; 48(4):908-911.
Identifiler 5 µL PCR (lower 3100 injection; 5s@2kV instead of 10s@3kV)
D8S1179D21S11
D7S820 CSF1PO
D13S317D16S539 D2S1338
D18S51TPOXVWA
FGAD5S818AMEL
D19S433
TH01D3S1358
Total cost per sample = $3.87 (Fall 2002)
Total cost per sample = $3.87 (Fall 2002)
CE and TroubleshootingNYC OCME Forensic Biology Continuing Education Seminar
March 25, 2009
http://www.cstl.nist.gov/biotech/strbase/training.htm 15
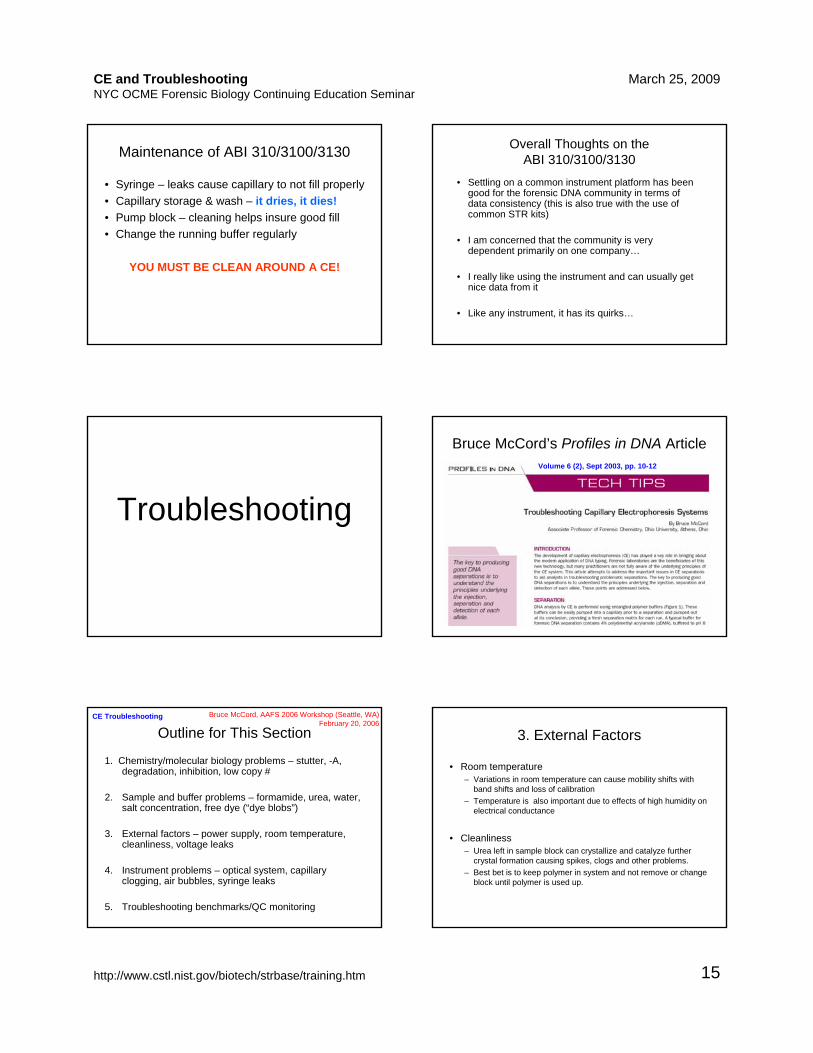
Maintenance of ABI 310/3100/3130
• Syringe – leaks cause capillary to not fill properly• Capillary storage & wash – it dries, it dies!• Pump block – cleaning helps insure good fill• Change the running buffer regularly
YOU MUST BE CLEAN AROUND A CE!
Overall Thoughts on the ABI 310/3100/3130
• Settling on a common instrument platform has been good for the forensic DNA community in terms of data consistency (this is also true with the use of common STR kits)
• I am concerned that the community is very dependent primarily on one company…
• I really like using the instrument and can usually get nice data from it
• Like any instrument, it has its quirks…
Troubleshooting
Bruce McCord’s Profiles in DNA ArticleVolume 6 (2), Sept 2003, pp. 10-12
Outline for This Section
1. Chemistry/molecular biology problems – stutter, -A, degradation, inhibition, low copy #
2. Sample and buffer problems – formamide, urea, water, salt concentration, free dye (“dye blobs”)
3. External factors – power supply, room temperature, cleanliness, voltage leaks
4. Instrument problems – optical system, capillary clogging, air bubbles, syringe leaks
5. Troubleshooting benchmarks/QC monitoring
CE Troubleshooting Bruce McCord, AAFS 2006 Workshop (Seattle, WA)February 20, 2006
3. External Factors
• Room temperature – Variations in room temperature can cause mobility shifts with
band shifts and loss of calibration– Temperature is also important due to effects of high humidity on
electrical conductance
• Cleanliness– Urea left in sample block can crystallize and catalyze further
crystal formation causing spikes, clogs and other problems. – Best bet is to keep polymer in system and not remove or change
block until polymer is used up.
CE and TroubleshootingNYC OCME Forensic Biology Continuing Education Seminar
March 25, 2009
http://www.cstl.nist.gov/biotech/strbase/training.htm 16
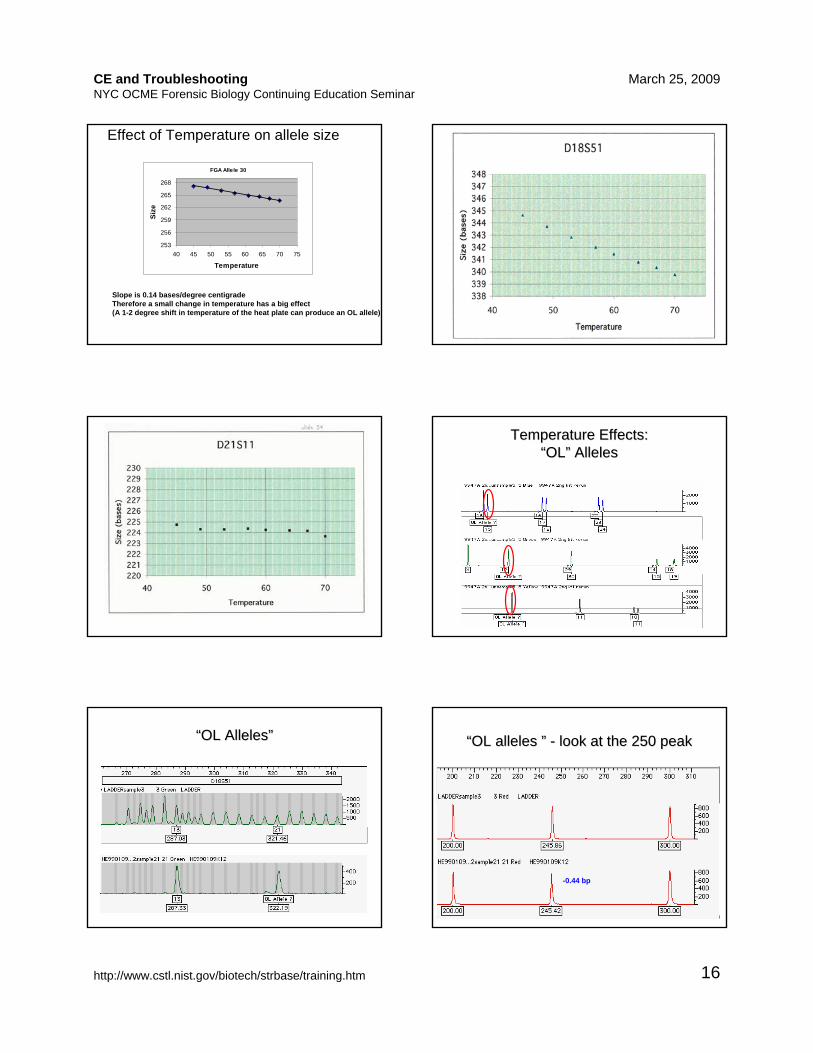
FGA Allele 30
253
256
259
262
265
268
40 45 50 55 60 65 70 75
Temperature
Size
Effect of Temperature on allele size
Slope is 0.14 bases/degree centigrade Therefore a small change in temperature has a big effect(A 1-2 degree shift in temperature of the heat plate can produce an OL allele)
Temperature Effects: Temperature Effects: ““OLOL”” AllelesAlleles
““OL AllelesOL Alleles”” ““OL alleles OL alleles ”” -- look at the 250 peaklook at the 250 peak
-0.44 bp
CE and TroubleshootingNYC OCME Forensic Biology Continuing Education Seminar
March 25, 2009
http://www.cstl.nist.gov/biotech/strbase/training.htm 17
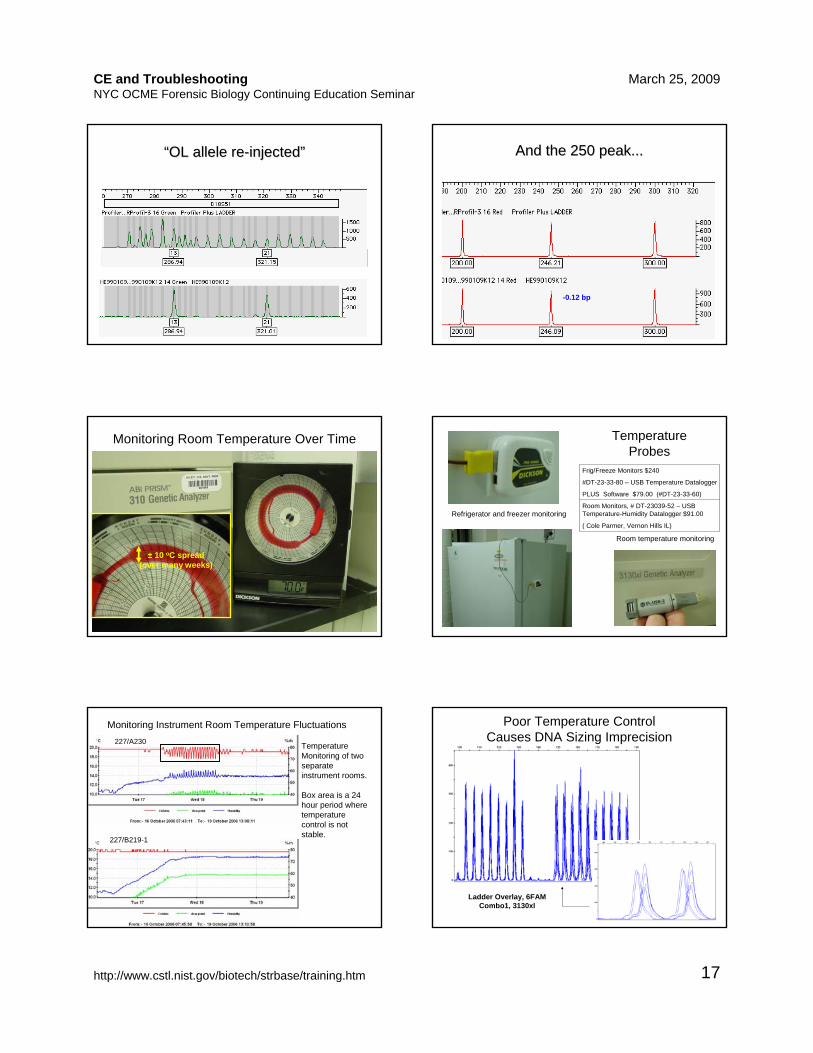
““OL allele reOL allele re--injectedinjected”” And the 250 peak...And the 250 peak...
-0.12 bp
Monitoring Room Temperature Over Time
± 10 oC spread (over many weeks)
Temperature Probes
Room temperature monitoring
Refrigerator and freezer monitoring
Frig/Freeze Monitors $240
#DT-23-33-80 – USB Temperature Datalogger
PLUS Software $79.00 (#DT-23-33-60)
Room Monitors, # DT-23039-52 – USB Temperature-Humidity Datalogger $91.00
( Cole Parmer, Vernon Hills IL)
227/A230
227/B219-1
Temperature Monitoring of two separate instrument rooms.
Box area is a 24 hour period where temperature control is not stable.
Monitoring Instrument Room Temperature Fluctuations
Ladder Overlay, 6FAMCombo1, 3130xl
Poor Temperature Control Causes DNA Sizing Imprecision
CE and TroubleshootingNYC OCME Forensic Biology Continuing Education Seminar
March 25, 2009
http://www.cstl.nist.gov/biotech/strbase/training.htm 18
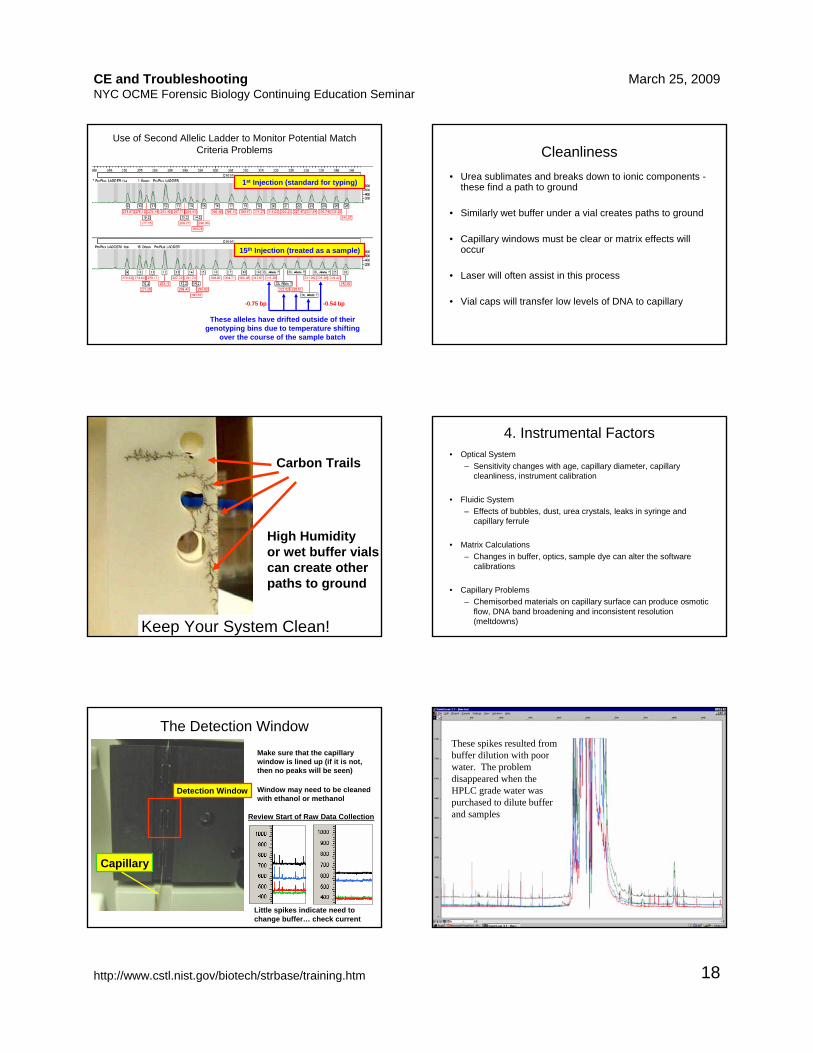
Use of Second Allelic Ladder to Monitor Potential Match Criteria Problems
1st Injection (standard for typing)
15th Injection (treated as a sample)
These alleles have drifted outside of their genotyping bins due to temperature shifting
over the course of the sample batch
-0.75 bp -0.54 bp
Cleanliness• Urea sublimates and breaks down to ionic components -
these find a path to ground
• Similarly wet buffer under a vial creates paths to ground
• Capillary windows must be clear or matrix effects will occur
• Laser will often assist in this process
• Vial caps will transfer low levels of DNA to capillary
Carbon Trails
High Humidity or wet buffer vials can create other paths to ground
Keep Your System Clean!
4. Instrumental Factors• Optical System
– Sensitivity changes with age, capillary diameter, capillary cleanliness, instrument calibration
• Fluidic System– Effects of bubbles, dust, urea crystals, leaks in syringe and
capillary ferrule
• Matrix Calculations– Changes in buffer, optics, sample dye can alter the software
calibrations
• Capillary Problems – Chemisorbed materials on capillary surface can produce osmotic
flow, DNA band broadening and inconsistent resolution (meltdowns)
The Detection WindowMake sure that the capillary window is lined up (if it is not, then no peaks will be seen)
Window may need to be cleaned with ethanol or methanol
Capillary
Detection Window
Review Start of Raw Data Collection
Little spikes indicate need to change buffer… check current
These spikes resulted from buffer dilution with poor water. The problem disappeared when the HPLC grade water was purchased to dilute buffer and samples
CE and TroubleshootingNYC OCME Forensic Biology Continuing Education Seminar
March 25, 2009
http://www.cstl.nist.gov/biotech/strbase/training.htm 19
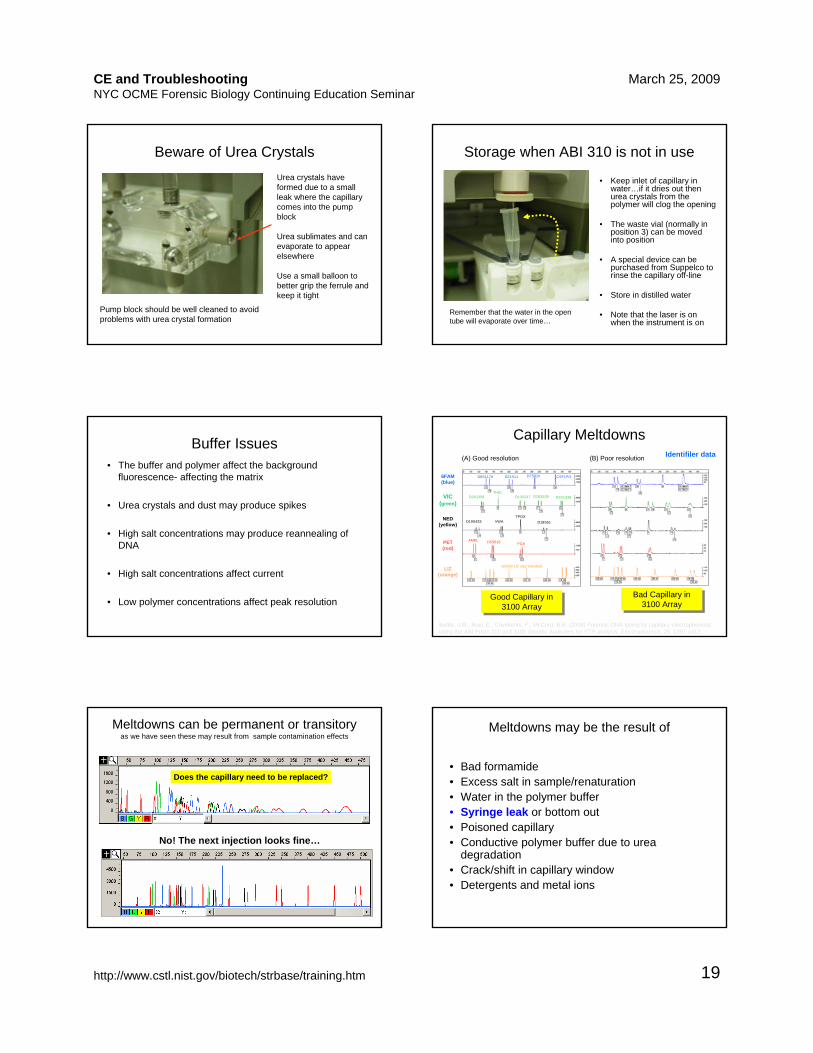
Beware of Urea CrystalsUrea crystals have formed due to a small leak where the capillary comes into the pump block
Urea sublimates and can evaporate to appear elsewhere
Use a small balloon to better grip the ferrule and keep it tight
Pump block should be well cleaned to avoid problems with urea crystal formation
Storage when ABI 310 is not in use
• Keep inlet of capillary in water…if it dries out then urea crystals from the polymer will clog the opening
• The waste vial (normally in position 3) can be moved into position
• A special device can be purchased from Suppelco to rinse the capillary off-line
• Store in distilled water
• Note that the laser is on when the instrument is on
Remember that the water in the open tube will evaporate over time…
Buffer Issues• The buffer and polymer affect the background
fluorescence- affecting the matrix
• Urea crystals and dust may produce spikes
• High salt concentrations may produce reannealing of DNA
• High salt concentrations affect current
• Low polymer concentrations affect peak resolution
(A) Good resolution
D8S1179 D21S11 D7S820 CSF1PO
D3S1358TH01
D13S317 D16S539 D2S1338
D19S433 D18S51TPOX
VWA
AMEL D5S818 FGA
GS500 LIZ size standard
6FAM (blue)
VIC (green)
NED (yellow)
PET (red)
LIZ (orange)
(B) Poor resolution
Bad Capillary in 3100 Array
Bad Capillary in 3100 ArrayGood Capillary in
3100 ArrayGood Capillary in
3100 Array
Capillary MeltdownsIdentifiler data
Butler, J.M., Buel, E., Crivellente, F., McCord, B.R. (2004) Forensic DNA typing by capillary electrophoresis: using the ABI Prism 310 and 3100 Genetic Analyzers for STR analysis. Electrophoresis, 25: 1397-1412.
Meltdowns can be permanent or transitoryas we have seen these may result from sample contamination effects
Does the capillary need to be replaced?
No! The next injection looks fine…
Meltdowns may be the result of
• Bad formamide• Excess salt in sample/renaturation• Water in the polymer buffer• Syringe leak or bottom out• Poisoned capillary• Conductive polymer buffer due to urea
degradation• Crack/shift in capillary window• Detergents and metal ions
CE and TroubleshootingNYC OCME Forensic Biology Continuing Education Seminar
March 25, 2009
http://www.cstl.nist.gov/biotech/strbase/training.htm 20
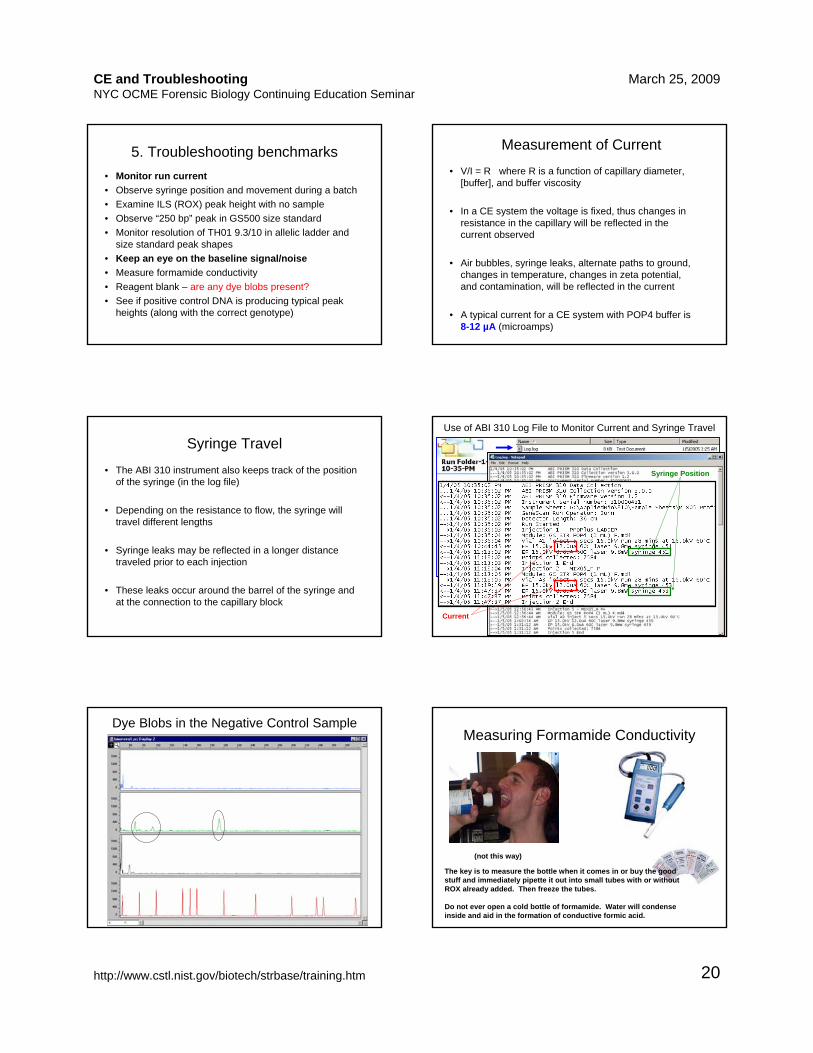
5. Troubleshooting benchmarks• Monitor run current• Observe syringe position and movement during a batch• Examine ILS (ROX) peak height with no sample• Observe “250 bp” peak in GS500 size standard• Monitor resolution of TH01 9.3/10 in allelic ladder and
size standard peak shapes• Keep an eye on the baseline signal/noise• Measure formamide conductivity• Reagent blank – are any dye blobs present?• See if positive control DNA is producing typical peak
heights (along with the correct genotype)
Measurement of Current
• V/I = R where R is a function of capillary diameter, [buffer], and buffer viscosity
• In a CE system the voltage is fixed, thus changes in resistance in the capillary will be reflected in the current observed
• Air bubbles, syringe leaks, alternate paths to ground, changes in temperature, changes in zeta potential, and contamination, will be reflected in the current
• A typical current for a CE system with POP4 buffer is 8-12 µA (microamps)
Syringe Travel
• The ABI 310 instrument also keeps track of the position of the syringe (in the log file)
• Depending on the resistance to flow, the syringe will travel different lengths
• Syringe leaks may be reflected in a longer distance traveled prior to each injection
• These leaks occur around the barrel of the syringe and at the connection to the capillary block
Use of ABI 310 Log File to Monitor Current and Syringe Travel
Current
Syringe Position
Dye Blobs in the Negative Control SampleMeasuring Formamide Conductivity
(not this way)
The key is to measure the bottle when it comes in or buy the good stuff and immediately pipette it out into small tubes with or without ROX already added. Then freeze the tubes.
Do not ever open a cold bottle of formamide. Water will condense inside and aid in the formation of conductive formic acid.
CE and TroubleshootingNYC OCME Forensic Biology Continuing Education Seminar
March 25, 2009
http://www.cstl.nist.gov/biotech/strbase/training.htm 21
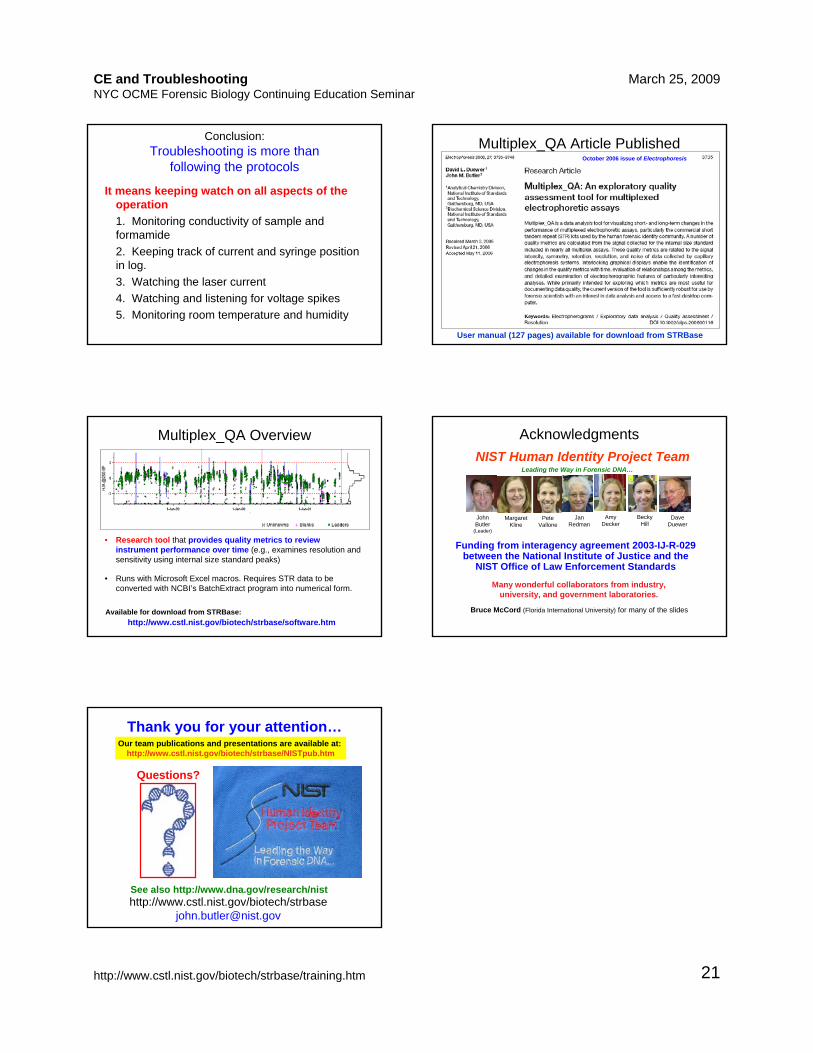
Conclusion:Troubleshooting is more than
following the protocols
It means keeping watch on all aspects of the operation1. Monitoring conductivity of sample and formamide2. Keeping track of current and syringe position in log.3. Watching the laser current 4. Watching and listening for voltage spikes5. Monitoring room temperature and humidity
Multiplex_QA Article Published
User manual (127 pages) available for download from STRBase
October 2006 issue of Electrophoresis
Multiplex_QA Overview
• Research tool that provides quality metrics to review instrument performance over time (e.g., examines resolution and sensitivity using internal size standard peaks)
• Runs with Microsoft Excel macros. Requires STR data to be converted with NCBI’s BatchExtract program into numerical form.
http://www.cstl.nist.gov/biotech/strbase/software.htmAvailable for download from STRBase:
Acknowledgments
Pete Vallone
John Butler
(Leader)
Margaret Kline
Amy Decker
Becky Hill
Dave Duewer
Jan Redman
Funding from interagency agreement 2003-IJ-R-029 between the National Institute of Justice and the
NIST Office of Law Enforcement Standards
NIST Human Identity Project Team
Many wonderful collaborators from industry, university, and government laboratories.
Bruce McCord (Florida International University) for many of the slides
Leading the Way in Forensic DNA…
Thank you for your attention…
http://www.cstl.nist.gov/biotech/[email protected]
Our team publications and presentations are available at: http://www.cstl.nist.gov/biotech/strbase/NISTpub.htm
Questions?
See also http://www.dna.gov/research/nist