Embed Size (px)
Citation preview
Copyright © 2018, California History-Social Science Project, Regents of the University of California, Davis; Desalination graphics copyrighted by KQED Current Context, February 2018 Edition, http://chssp.ucdavis.edu—Page 1
C alifornians know drought. It is an ever-present concern in this arid state, par-ticularly as its population and econo-my – and therefore the demand on
fresh water – continue to grow. A recent five-year drought prompted Governor Brown in 2015 to mandate a 25% reduction in urban water use, and state water officials set a goal of 55 gallons a day per resident for personal, indoor water use. After heavy rains last winter, the governor declared the drought over in April 2017 and lifted these tar-gets. Nearly every month since, Californians have been conserving less water. Meanwhile, the bulk of California’s water supply – approximately 60% - supports agricultural crops and livestock. When the inevitable happens and water supplies be-come low again, everyone and everything in Cali-fornia feels the impact – farmers make tough de-cisions about what and how much to grow, wild-life habitat declines, and certain jobs (in farming, food processing, winter recreation, and even semiconductors) can disappear.
Californians are far from the only people on the globe struggling to maintain a sufficient water
supply. The United Nation estimates that water scarcity affects more than 40% of the world’s population. And, with climate change and a growing global population, this number is ex-pected to rise. Right now, an unprecedented event is unfolding in South Africa due to a histor-ic drought that may cause the city of Cape Town (population 3.75 million) to turn off tap water. ‘Day Zero’ – when the city’s water supply runs dry – is expected to occur in early July. When Day Ze-ro arrives, residents of Cape Town will have ac-cess to 25 liters (less than 7 gallons) a day per person, and they will need to stand in line at guarded water stations around the city to collect their water ration. In anticipation of harder times, residents of Cape Town have already dramatically reduced their water consumption; the national government has declared a state of emergency in order to focus additional resources on the crisis; and farmers in the region have given over water in their own reservoirs to add to the city’s supply. These combined efforts have succeeded in pad-ding the small supply of water and holding off, for now, the water cutoff.
Cape
Crisis
Town
by Shelley Brooks, Ph.D.
Water Scarcity in a Warming World

Copyright © 2018, California History-Social Science Project, Regents of the University of California, Davis; Desalination graphics copyrighted by KQED Current Context, February 2018 Edition, http://chssp.ucdavis.edu—Page 2
Cape Town’s situation may be the most newsworthy, but it is likely that more and more places – especial-ly in arid regions of the world – will face similar challenges. So, what can be done to continue to provide sufficient drinking water, as well as enough water for household and industrial use? Moreover, what level of water management is necessary to grow enough food to support an ever-larger global population? Not surprisingly, nations with very dry conditions have pioneered methods for increasing the water sup-ply. No one can make the rain fall, but there is one method – called desalination – that can convert sea-water into fresh water. Given that over 95% of the Earth’s water is salt water, desalination is an appealing strategy. Israel – a country with a Mediterranean coastline and large desert regions – has developed pro-ductive desalination plants that today provide the country with approximately 60% of its domestic water. Saudi Arabia, the largest country on the Arabian Peninsula, also places greater reliance on desalinated water than on groundwater for its water supply. Cape Town, with its long coastline, has recently turned to desalination in order to alleviate its drought.
A careful desalination process (using the most effective technology) provides safe drinking water and causes only a minimal environmental footprint. But, scientists point out that desalination can pose certain health risks. For instance, a recent examination of seawater samples near Cape Town (water that could presumably be piped into desalination plants) found a number of chemicals from medicines and house-hold cleaners as well as the dangerous bacteria E. coli in the water. In Israel, desalinated water is found to be lacking in the important naturally-occurring mineral, magnesium, which supports heart health. Desali-nation accounts for approximately 1% of the world’s domestic water supply. This low number can be ex-plained in part by the fact that it is primarily arid coastal regions that currently need such water. But be-yond this factor and concerns about human health, desalinated water is small in quantity because of its high production costs. Desalination plants are very expensive to build (California’s largest – in Carlsbad – cost $1 billion) and the cost of the purified water can be many times that of water that flows to consum-ers in the traditional fashion. Moreover, desalination raises certain environmental concerns. The process by which saltwater is converted to fresh water is extremely energy-intensive, and can negatively impact the ocean habitats from which the water is removed and the extracted salt is later returned.
Pros and Cons of Desalination
How does desalination work?
Graphic courtesy of KQED
Copyright © 2018, California History-Social Science Project, Regents of the University of California, Davis; Desalination graphics copyrighted by KQED Current Context, February 2018 Edition, http://chssp.ucdavis.edu—Page 3
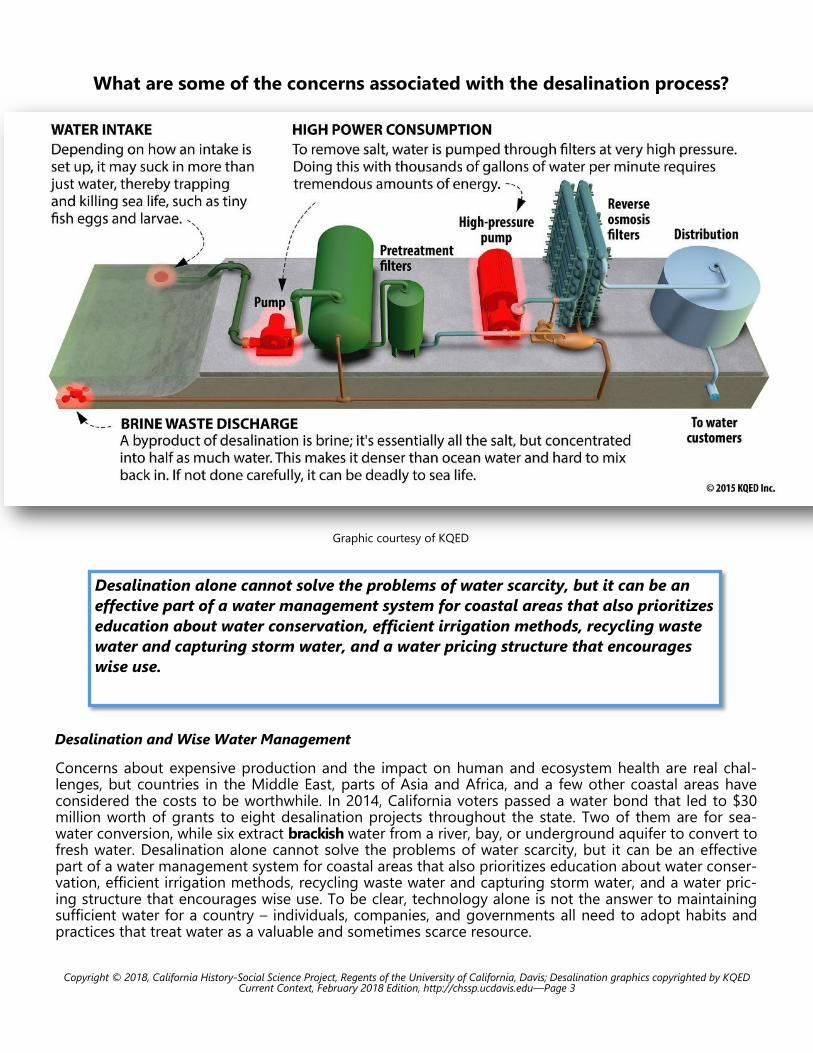
What are some of the concerns associated with the desalination process?
Graphic courtesy of KQED
Desalination and Wise Water Management
Concerns about expensive production and the impact on human and ecosystem health are real chal-lenges, but countries in the Middle East, parts of Asia and Africa, and a few other coastal areas have considered the costs to be worthwhile. In 2014, California voters passed a water bond that led to $30 million worth of grants to eight desalination projects throughout the state. Two of them are for sea-water conversion, while six extract brackish water from a river, bay, or underground aquifer to convert to fresh water. Desalination alone cannot solve the problems of water scarcity, but it can be an effective part of a water management system for coastal areas that also prioritizes education about water conser-vation, efficient irrigation methods, recycling waste water and capturing storm water, and a water pric-ing structure that encourages wise use. To be clear, technology alone is not the answer to maintaining sufficient water for a country – individuals, companies, and governments all need to adopt habits and practices that treat water as a valuable and sometimes scarce resource.
Desalination alone cannot solve the problems of water scarcity, but it can be an
effective part of a water management system for coastal areas that also prioritizes
education about water conservation, efficient irrigation methods, recycling waste
water and capturing storm water, and a water pricing structure that encourages
wise use.

Copyright © 2018, California History-Social Science Project, Regents of the University of California, Davis; Desalination graphics copyrighted by KQED Current Context, February 2018 Edition, http://chssp.ucdavis.edu—Page 4
Carlsbad Desalination Plant, 2017. Source: https://flic.kr/p/RZcjwW. Creative Commons License.
Word Bank
Arid - California, like most states west of the 100th meridian, is arid, with annual rainfall around 20 inches or below. But the term “average” is misleading, as rainfall varies dra-matically not only from the temperate rain-forest in the northwest corner of the state to the desert in the southeast portion of the state, but varies also from one year to the next.
Brackish – slightly salty, as in the water in coastal estuaries. The six desalination plants being developed in California to treat brack-ish water have an advantage over traditional desalination plants because brackish water is less salty than ocean water and are therefore less expensive/energy-intensive to convert to drinking water.
Desalination - Water desalination is the re-moval of salts and dissolved solids from sa-line water (brackish or seawater), also known as desalting or desalinization. In addition to removing minerals, the process removes most biological or organic chemical com-pounds. (from water.ca.gov)
Domestic water – The water that is used in and around the house, including everything from the shower to watering outdoor lawns and trees.
Infrastructure – the roads, plumbing, sew-age, communication network, energy supply, and other facilities and structures that sup-port a society.
What happens if we don’t address our water scarcity worldwide? Given our growing demands on fresh wa-ter, and the expected droughts associated with climate change, water scarcity will likely be an increasing source of political conflict among and within arid countries. Water is, after all, a required resource for all life on Earth. Beginning in the 1980s, a non-profit or-ganization began to track and record worldwide con-flicts related to water. The list (https://www.worldwater.org/water-conflict/) includes hun-dreds of historical events, many of which were caused at least in part by a lack of water. A recent example includes the civil war in Syria (http://chssp.ucdavis.edu/current-context/syrian-war.pdf). Some scholars point to the pro-longed drought in helping to create the conditions for the devastating war. When a million Syrian farmers felt compelled to abandon their dry fields in 2008, they moved to urban areas where they were unsuccessful in finding alternative work. The overcrowded, temporary housing, and lack of government services and infra-structure became the “heart of the developing un-rest” against President Bashar al-Assad. The fighting that ensued between Assad’s government forces and rebels has yet to subside. Historically, wars have been fought over oil, gemstones, access to seaports and other environmental goods; drought conditions, and the lack of food that can follow, can also lead to vola-tile political conditions.
Cape Town’s predicament is a good reminder for all communities that water conservation is everyone’s re-sponsibility, not just during times of drought but as a permanent response to changing climate conditions.
What Water Scarcity Could Mean in the Future
Copyright © 2018, California History-Social Science Project, Regents of the University of California, Davis; Desalination graphics copyrighted by KQED Current Context, February 2018 Edition, http://chssp.ucdavis.edu—Page 5
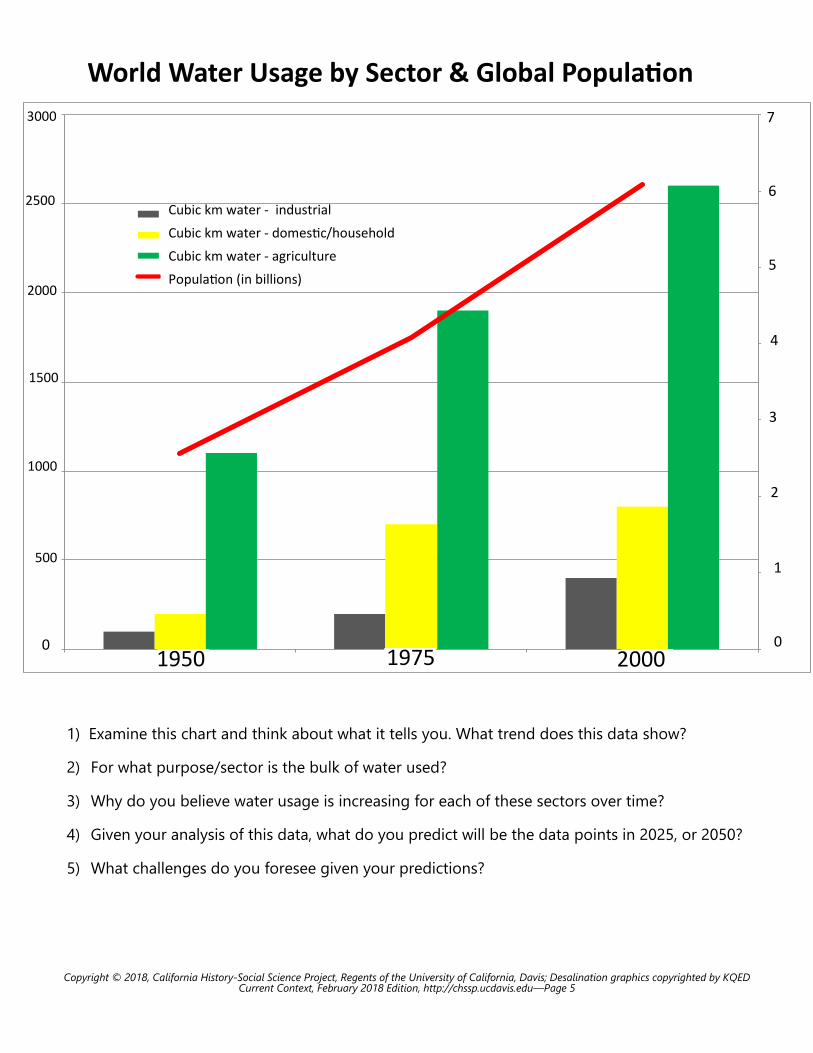
1) Examine this chart and think about what it tells you. What trend does this data show?
2) For what purpose/sector is the bulk of water used?
3) Why do you believe water usage is increasing for each of these sectors over time?
4) Given your analysis of this data, what do you predict will be the data points in 2025, or 2050?
5) What challenges do you foresee given your predictions?
0
1
2
3
4
5
6
7
0
500
1000
1500
2000
2500
3000
1950 1975 2000
cubic Km water--industry
cubic Km water--household
cubic Km water agriculture
population (billions)
Cubic km water - industrial
Cubic km water - domestic/household
Cubic km water - agriculture
Population (in billions)
1950 1975 2000
7
6
5
4
3
2
1
0
World Water Usage by Sector & Global Population
0
3000
2500
2000
1500
1000
500
Copyright © 2018, California History-Social Science Project, Regents of the University of California, Davis; Desalination graphics copyrighted by KQED Current Context, February 2018 Edition, http://chssp.ucdavis.edu—Page 6
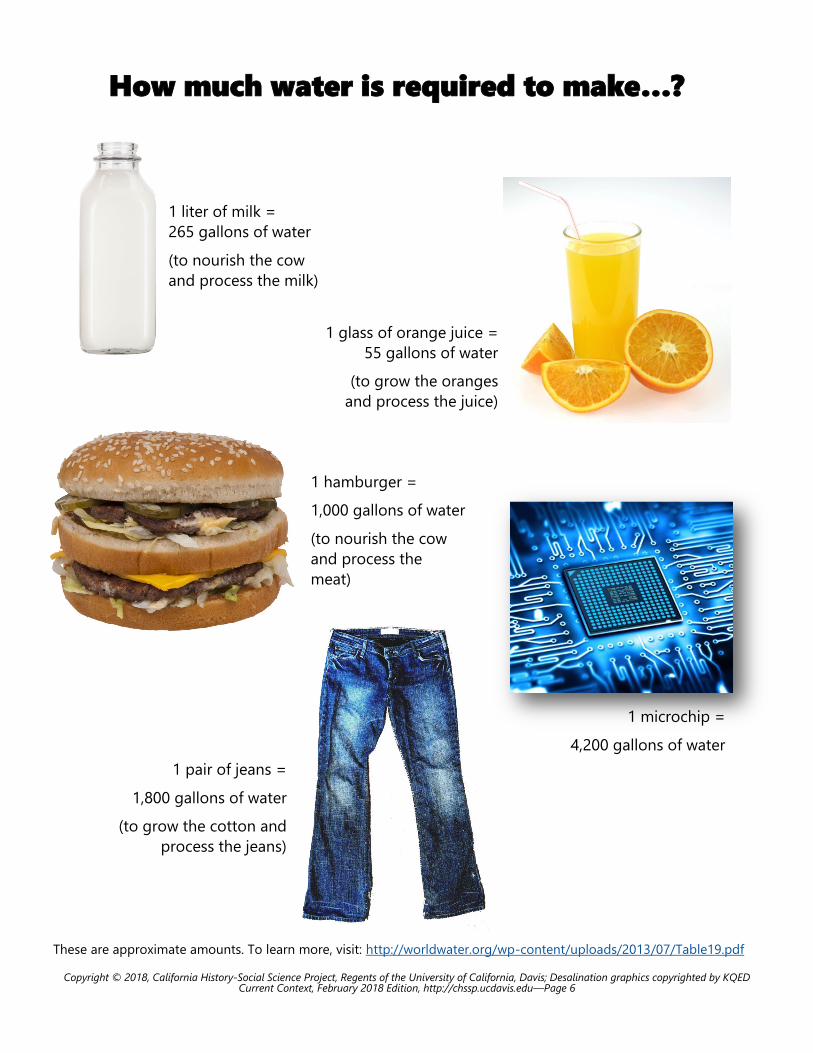
How much water is required to make…?
These are approximate amounts. To learn more, visit: http://worldwater.org/wp-content/uploads/2013/07/Table19.pdf
1 liter of milk =
265 gallons of water
(to nourish the cow
and process the milk)
1 glass of orange juice =
55 gallons of water
(to grow the oranges
and process the juice)
1 hamburger =
1,000 gallons of water
(to nourish the cow
and process the
meat)
1 microchip =
4,200 gallons of water
1 pair of jeans =
1,800 gallons of water
(to grow the cotton and
process the jeans)

Copyright © 2018, California History-Social Science Project, Regents of the University of California, Davis; Desalination graphics copyrighted by KQED Current Context, February 2018 Edition, http://chssp.ucdavis.edu—Page 7
Areas of Physical and Economic Water Scarcity
As you examine this map and information, keep in mind that this map reflects 2007 data, when the global population was 6.6 billion. Estimates expect the global population to grow by 3.3 bil-lion by 2050, while the total amount of fresh water is expected to remain roughly the same.
Physical water scarcity—more than 75% of river flows are withdrawn for agriculture,
industry, and domestic use.
Approaching water scarcity—more than 60% of river flows are withdrawn for agri-
culture, industry, and domestic use.
Economic water scarcity—less than 25% of river flows are withdrawn for human us-
es, but people in these regions cannot access adequate water due to a lack of
money to invest in water infrastructure.
Little or no water scarcity—there is more than enough water in rivers to meet hu-
man demands.
No data created for these regions.
This map comes from the Food and Agriculture Organization of the United Nations: http://www.fao.org/land-
water/outreach/graphs-and-maps/details/en/c/237285/
Copyright © 2018, California History-Social Science Project, Regents of the University of California, Davis; Desalination graphics copyrighted by KQED Current Context, February 2018 Edition, http://chssp.ucdavis.edu—Page 8
Copyright © 2018, California History-Social Science Project, Regents of the University of California, Davis Campus
Current Context, February 2018 Edition, http://chssp.ucdavis.edu—Page 8
Copyright © 2018, California History-Social Science Project, Regents of the University of California, Davis; Desalination graphics copyrighted by KQED Current Context, February 2018 Edition, http://chssp.ucdavis.edu—Page 9
Education and the Environment Initiative (EEI) Connections (http://www.californiaeei.org/)
A program of CalRecycle’s Office of Education and the Environment, EEI lessons are designed to foster environmental
literacy among California students. Below is a list of units and lessons to support student learning on the topic of water
use and stakeholders, water infrastructure, and environmental considerations related to water management.
Kindergarten – K.4.5. & K.6.3. Some Things Change and Some Things Stay the Same, Lesson 3 “When a Community Grows”
1st Grade – 1.2.4. People and Places, Lesson 2 “Where People Live” and Lesson 3 “Change Related to Natural Events” and
Lesson 5 “People and Places”
2nd Grade – 2.4.1. From Field to Table, Lesson 1 “How Does California Grow?”
3rd Grade – 3.1.1. and 3.1.2. The Geography of Where We Live, Lesson 4 “Changes in Our Local Region”
3.2.2. California Indians People: Exploring Tribal Regions, Lesson 2 “The Local Landscape Long Ago”
3.5.1/.2/.3 California’s Economy: Natural Choices, Lesson 3 “The Resources Our Industries Need and Use”
4th Grade – 4.1.3/.5 Reflections of Where We Live, Lesson 3 “Land Uses and Natural Resources”
4.2.6. Cultivating California, Lesson 5 “Changing Natural Systems”
4.3.3. Witnessing the Gold Rush, Lesson 5 “Flattening Mountains, Filling Valleys”
5th
Grade – 5.4.1. Human Settlement and the Natural Regions of the Eastern Seaboard, Lesson 1 “Coast to Coast Connections”
6th Grade – 6.2.1. River Systems and Ancient Peoples, Lesson 1 “The Importance of the Bay Delta to California”;
6.2.2. Agricultural Advances in Ancient Civilizations, Lesson 1 “The Power of Agriculture” and Lesson 2 “Radical Revolution: Ancient Agricultural Advancements”
6.2.6. & 6.2.8. Egypt and Kush: A Tale of Two Kingdoms, Lesson 1 “Sharing a River”
6.5.1. & 6.6.1. The Rivers and Ancient Empires of China and India, Lesson 6 “Our Use of Rivers Today”
8th Grade – 8.8.4. Struggles with Water, Lesson 1 “California and the Colorado” and Lesson 5 “The Colorado River Revisited”
10th Grade – 10.3.3. Growth of Population, Cities and Demands, Lesson 4 “Laws and Policies to Manage Natural Resources” and Lesson 5 “Government Responds to Managed Growth”
11th Grade – 11.8.6. Postwar Industries and Emerging Environmental Movement, Lesson 1 “Postwar Changes in the Great Central Valley” and Lesson 3 “Tracking the Postwar Boom” and Lesson 4 “Effects of the Postwar Boom”
11.9.7. The United States and Mexico Working Together, Lesson 4 “From a Different Perspective”
12th Grade – 12.1.4. Private Property and Resource Conservation, Lesson 3 “Applying Utilitarianism to Water Resources”
Current Context: A Publication of the California History-Social Science Project
Produced by the California History-Social Science Project (CHSSP), Current Context is a series of instructional materials designed to help students understand current events in historical context. All Current Context materials are copyrighted by the Regents of the University of California, Davis. This issue of Current Context is the seventh in a special series dedi-cated to helping students understand the connections between environmental literacy and the study of history-social science, and is funded through the generous support of Ten Strands. To download this issue and others, visit: http://chssp.ucdavis.edu/current-context.
For more information about the CHSSP, visit our website, http://chssp.ucdavis.edu, write to us: [email protected], or connect with us via Facebook (californiahistorysocialscienceproject) or Twitter (CHSSP_SO). Headquartered in the De-partment of History at the University of California, Davis, the CHSSP is one of nine disciplinary networks that make up the California Subject Matter Projects, administered by the University of California, Office of the President.
Would you like to learn more about water management and desalination in California? The Water Education Founda-
tion (http://www.watereducation.org/topic-desalination) provides a number of resources to better understand condi-
tions in our state.
Image citations: Trees at Theewaterskloof Dam, South Africa, 2018. https://flic.kr/p/K82pv8. Creative Commons License; Desalination graphics from KQED: https://ww2.kqed.org/science/2015/12/18/why-isnt-desalination-the-answer-to-all-californias-water-problems/; Carlsbad Desalination Plant. Source: https://flic.kr/p/RZcjwW. Creative Commons License; Graphics on Page 8 by CHSSP Staff Martin Gaona