Embed Size (px)
Citation preview
Q1
Q2
1
3
5
7
9
11
13
15
17
19
21
23
25
27
29
31
33
35
37
39
41
43
45
47
49
51
53
55
57
59
61
Available online at www.sciencedirect.com
journal homepage: www.elsevier.com/locate/nanoenergy
Nano Energy (]]]]) ], ]]]–]]]
http://dx.doi.org/12211-2855/& 2014 E
E-mail addresseschenghua.sun@mona
Please cite this arthttp://dx.doi.org/
RAPID COMMUNICATION
Capacity-controllable Li-rich cathodematerials for lithium-ion batteries
Delai Yea, Kiyoshi Ozawab, Bei Wanga,Denisa Hulicova-Jurcakovaa, Jin Zouc,Chenghua Sund, Lianzhou Wanga
aNanomaterials Centre, School of Chemical Engineering and Australian Institute for Bioengineeringand Nanotechnology, The University of Queensland, QLD 4072, AustraliabNational Institute for Materials Science, Tsukuba, Ibaraki 305-0047, JapancCentre for Microscopy and Microanalysis and Material Engineering, The University of Queensland,QLD 4072, AustraliadSchool of Chemistry, Monash University, Victoria 3800, Australia
Received 5 March 2014; accepted 22 March 2014
KEYWORDSCapacity increase;Capacity-control;Layered-spinelstructures;Li-rich cathodematerials;Lithium ion battery
0.1016/j.nanoen.2lsevier Ltd. All rig
: [email protected] (L. Wang).
icle as: D. Ye, et10.1016/j.nanoen
AbstractIn this study, we report a new type of Li-rich layered-spinel materials with a general compositionformula of xLi2[Mn0.857Co0.143]O3–(1�x)Li[Mn1.714Co0.286]O4 (x=0.95, 0.85, 0.75, and 0.65) for useas cathode materials in Li-ion batteries. These materials exhibit steadily increased specificcapacities upon cycling for up to several dozen of cycles, depending on the charge–dischargepotential windows. Various characterizations reveal that the specific capacity increase is due tothe gradual activation of the initial Li-rich layered phase from the surface of the compositeparticles. Both experimental and computational results suggest that small amount of Co dopantsplays a critical role in the continuous activation process of these materials and the structuralevaluation mechanism is also discussed. Based on this unique feature, controllable dischargecapacities of these cathode materials can be achieved in a broad range from 30 to 240 mA h g�1
by deliberately activating the materials at a potential window of 2–4.8 V.& 2014 Elsevier Ltd. All rights reserved.
63
65
67
69
014.03.013hts reserved.
u (C. Sun),
al., Capacity-controllable Li-rich.2014.03.013
Introduction
Rechargeable lithium-ion batteries (LIBs) have becomea dominant power source for portable electronics [1].In recent years, due to the global warming and shortage
71
73
cathode materials for lithium-ion batteries, Nano Energy (2014),
1
3
5
7
9
11
13
15
17
19
21
23
25
27
29
31
33
35
37
39
41
43
45
47
49
51
53
55
57
59
61
63
65
67
69
71
73
75
77
79
81
83
85
87
89
91
93
95
97
99
101
103
105
107
109
111
113
115
117
119
121
123
D. Ye et al.2
of fossil fuel, low-emission electric vehicles (EVs) haveattracted considerable interest and lithium-ion batteries havebeen considered as one of the most promising candidates asthe EV power source [2–4]. However, low energy density ofconventional LIBs remains the bottleneck mainly due toinadequate capacity of the cathode materials, for instanceLiCoO2 (ca.150 mA h g�1) or LiFePO4 (170 mA h g�1) [5,6]. Inthis respect, extensive studies have been devoted to devel-oping new cathode materials with potentially higher specificcapacities.
Early studies have revealed that Li-rich Mn-based oxideswith a general chemical composition of xLi2MnO3–(1�x)LiMO2 (M=Mn, Co or Ni) are presumed to be promisingcathode materials mainly because of their high specificcapacities over 250 mA h g�1 [7–11]. In this type of materi-als, C2/m Li-rich Li2MnO3 phase can be highly integratedwith R3m LiMO2, and Co/Ni doping with a (Co+Ni)/Mnmolar ratio of 1/3 or higher is usually applied to improvethe structure stability during cycling [9,11]. Typically, thisLi-rich Li2MnO3 component is fully activated in the firstcycle with a long charging plateau above 4.5 V, followed bya high discharge capacity in the first discharge process[9,11–14]. Currently, Li-rich layered cathode materials stillface some challenges such as poor long-term cycling stabi-lity and low power density mainly due to the drasticactivation and structure evolution of the Li-rich layeredphase in the first cycle and following deterioration uponfurther cycling [12,14,15]. Fortunately, the cycling stabilityand rate performance have been effectively improved bysome novel methods such as smart microstructure designand efficient surface coating in recent progress [16–18].However, due to the complicated composition and crystalstructures, the fundamental mechanisms of the origin of theultrahigh reversible capacity and the related structureevolution during cycling have not been fully revealed andremain the most challenging issue for Li-rich cathodematerial [19,20].
Considering the relatively high content of toxic andrelatively expensive Co dopants in these previously reportedLi-rich compounds, we recently studied layered Li-richcathode materials with much lower Co/Mn molar ratio of1/6 [21]. Interestingly, unlike most Li-rich cathode materi-als with continuous capacity decrease upon cycling, thislow-Co Li-rich material exhibited quite different electro-chemistry behavior. Its discharge capacity increased anom-alously from around 40 mA h g�1 to more than 200 mA h g�1
in the first several cycles. This phenomenon of capacityincrease upon cycling (CIUC) has been observed in someother materials systems like CoO [22] and Fe3O4 [23];however, the intrinsic reasons seem to be different fromthe Li-rich materials. In fact, this CIUC phenomenon in Li-rich materials has been reported by a few senior groupsrecently [24–27]. For example, in a recent paper by Kanget al., the overall capacity of their Ni-doped Li-rich materialgradually increased in the first 40 cycles, and the largeparticle size is suggested to be the cause [25]. Another morerecent study by Sung et al. reported specific capacityincrease in their materials in the first 20 cycles from187 mA h g�1 to 194 mA h g�1 and proposed the increase isrelated to the continuous activation of the remainingLi2MnO3 structure [28]. However, the increment of capacityin those reports was very limited and the information about
Please cite this article as: D. Ye, et al., Capacity-controllable Li-richhttp://dx.doi.org/10.1016/j.nanoen.2014.03.013
the systematic understanding of this CIUC phenomenon inLi-rich cathode materials is still not available. The keyquestions of why the Li2MnO3 is activated continuously in afew cycles rather than fully in the first cycle only and whatis the main factor that can affect the rate of activation arestill not well-answered.
In this study, we report a detailed study on the under-standing of CIUC behavior based on a series of low-Cocontaining Li-rich cathode materials with a modifiedlayered-spinel structure. By a simple co-precipitation andsolid-state reaction, we were able to alter the chemicalcomposition of xLi2[Mn0.857Co0.143]O3–(1�x)Li[Mn1.714Co0.286]O4 (x=0.95, 0.85, 0.75, and 0.65) to introduce a slightlyvariable amount of spinel phase into the layered structure.A very prominent CIUC behavior up to several dozens ofcharge–discharge cycles in these materials was observed byapplying a potential window of 2–4.8 V. Interestingly, suchphenomenon can be effectively suppressed when the uppercut-off potential was reduced to 4.6 V. Detailed electroche-mical and structural characterizations reveal that the incre-ment in specific capacity is attributable to the gradualactivation of the surface Li-rich layered phase. In addition,further computational study along with experimental resultsindicates that Co-doping plays a significant role in promotingthe activation process of the Li-rich layered phase byenergetically facilitating the diffusion of transition metalsand the formation of oxygen vacancies (OVs), both of whichare directly involved in the activation of Li-rich phase. As aresult, we can rationally control the reversible capacity in abroad range from around 30 to 240 mA h g�1 by deliberatelyactivating the pristine materials at 2–4.8 V for certain cycles.The findings herein may shed light not only on the mechanismunderstanding of the CIUC behavior in Li-rich compounds butalso on the design of some “smart” capacity-controllablebattery systems which have been rarely reported before.
Experimental section
Materials synthesis
The xLi2[Mn0.857Co0.143]O3–(1�x)Li[Mn1.714Co0.286]O4 (x=0.95,0.85, 0.75, and 0.65) composites materials were synthesizedvia a high-temperature calcination process using LiOH �H2O andmanganese–cobalt carbonate as starting materials [14,21]. In atypical synthesis, a 0.2 M aqueous solution of MnSO4 � 5H2O andCoSO4 � 7H2O with the Mn/Co molar ratio of 6:1 was added to anequal volume of 0.2 M sodium carbonate aqueous solution,yielding a light pink precipitate. After being aged for 20 h undercontinuous stirring at room temperature, the obtained pre-cipitate was filtered, washed thoroughly with distilled water forthree times, dried at 100 1C and then heated at 500 1C in air for5 h. The resultant black powders were then mixed withLiOH �H2O with different Li:(Mn+Co) molar ratios of 1.85,1.61, 1.4, and 1.22, for the samples with x=0.95, 0.85, 0.75,and 0.65 respectively. A 3 wt% excess of LiOH �H2O was addedto the starting materials to compensate Li insufficiency due tothe Li volatilization at elevated temperature. The mixtureswere calcined at 900 1C in air for 12 h to produce the layered-spinel composites.
cathode materials for lithium-ion batteries, Nano Energy (2014),
1
3
5
7
9
11
13
15
17
19
21
23
25
27
29
31
33
35
37
39
41
43
45
47
49
51
53
55
57
59
61
63
65
67
69
71
73
75
77
3Capacity-controllable Li-rich cathode materials for lithium-ion batteries
Materials characterization
The Li, Mn and Co molar ratios in all the composites weremeasured by a Varian 725-ES Inductively Coupled PlasmaAtomic Emission Spectroscopy (ICP-AES). Crystalline struc-tures of powder samples, electrodes before and afterdifferent charge/discharge cycles were identified by X-raydiffraction (XRD) on a Bruker Advanced X-Ray Diffractometer(40 kV, 30 mA) with Cu Kα (λ=0.15406 nm) radiation at ascanning rate of 11min�1 from 151 to 751 (2θ). The morpho-logical characteristics of synthesized samples were investi-gated using a scanning electron microscope (SEM, JEOL7800). Scanning transmission electron microscopy (STEM)investigations were acquired on a JEM-ARM200F transmissionelectron microscope (TEM), operated at 200 kV with a highangle annular dark field (HAADF) detector.
79
81
83
85
87
89
91
93
95
97
99
101
Electrochemical test
To prepare the working electrodes, a mixed slurry contain-ing 70 wt% of the active materials, 20 wt% of acetyleneblack and 10 wt% of polyvinylidene fluoride (dissolved in N-methyl-2-pyrrolidone with a concentration of 5 wt%) wasspread onto aluminum foils (0.7 cm2) by a doctor bladeprocess and then dried in an oven under vacuum at 120 1Cfor 12 h. These working electrodes were then assembledwith lithium metal as the negative electrode and 1 M LiPF6in a mixture of ethylene carbonate (EC) and dimethylcarbonate (DMC) (1:1) as the electrolyte to fabricateCR2032-type coin cells in an argon-filled glove box. Thegalvanostatic charge/discharge test was conducted on amulti-channel battery tester (Land CT2001A) with thevoltage range of 2.0–4.6 V and 2.0–4.8 V at room tempera-ture. Cyclic voltammetry (CV) measurements of the cellswere performed by using a CHI660E Electrochemical Work-station with a scan rate of 0.2 mV s�1 in the same voltagewindows.
103
105
107
109
111
113
115
117
119
121
123
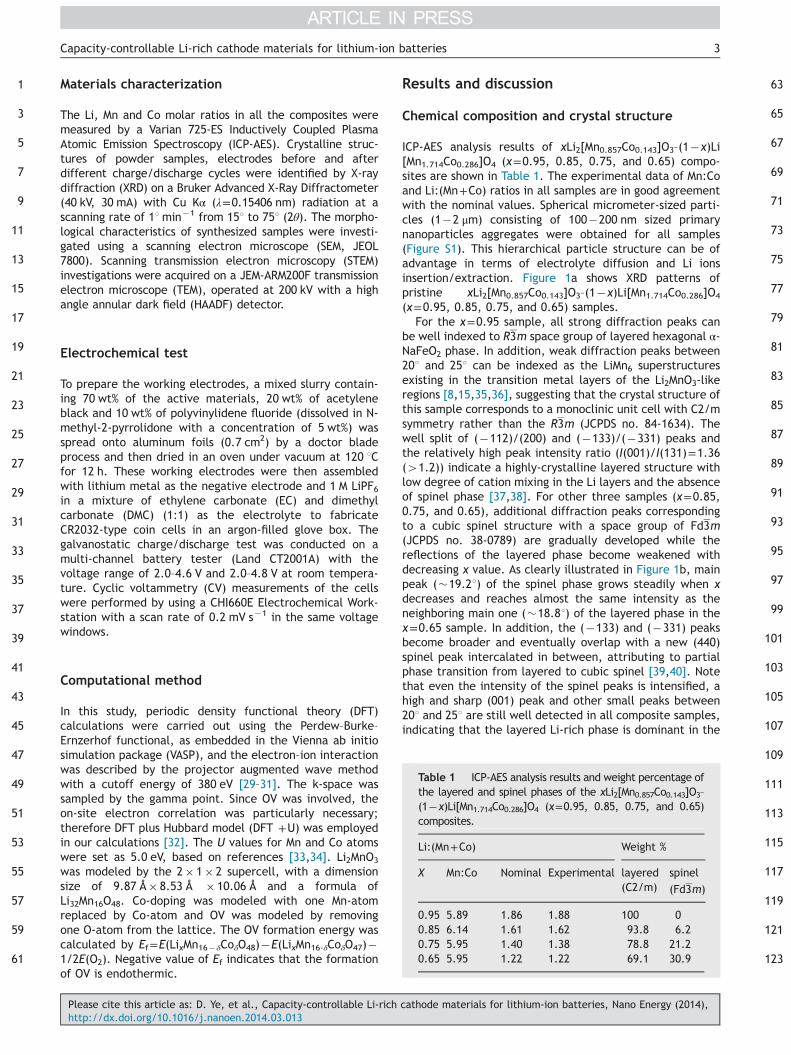
Table 1 ICP-AES analysis results and weight percentage ofthe layered and spinel phases of the xLi2[Mn0.857Co0.143]O3–
(1�x)Li[Mn1.714Co0.286]O4 (x=0.95, 0.85, 0.75, and 0.65)composites.
Li:(Mn+Co) Weight %
X Mn:Co Nominal Experimental layered(C2/m)
spinel
(Fd3m)
0.95 5.89 1.86 1.88 100 00.85 6.14 1.61 1.62 93.8 6.20.75 5.95 1.40 1.38 78.8 21.20.65 5.95 1.22 1.22 69.1 30.9
Computational method
In this study, periodic density functional theory (DFT)calculations were carried out using the Perdew–Burke–Ernzerhof functional, as embedded in the Vienna ab initiosimulation package (VASP), and the electron–ion interactionwas described by the projector augmented wave methodwith a cutoff energy of 380 eV [29–31]. The k-space wassampled by the gamma point. Since OV was involved, theon-site electron correlation was particularly necessary;therefore DFT plus Hubbard model (DFT +U) was employedin our calculations [32]. The U values for Mn and Co atomswere set as 5.0 eV, based on references [33,34]. Li2MnO3
was modeled by the 2� 1� 2 supercell, with a dimensionsize of 9.87 Å� 8.53 Å � 10.06 Å and a formula ofLi32Mn16O48. Co-doping was modeled with one Mn-atomreplaced by Co-atom and OV was modeled by removingone O-atom from the lattice. The OV formation energy wascalculated by Ef=E(LixMn16�δCoδO48)�E(LixMn16-δCoδO47)�1/2E(O2). Negative value of Ef indicates that the formationof OV is endothermic.
Please cite this article as: D. Ye, et al., Capacity-controllable Li-richhttp://dx.doi.org/10.1016/j.nanoen.2014.03.013
Results and discussion
Chemical composition and crystal structure
ICP-AES analysis results of xLi2[Mn0.857Co0.143]O3–(1�x)Li[Mn1.714Co0.286]O4 (x=0.95, 0.85, 0.75, and 0.65) compo-sites are shown in Table 1. The experimental data of Mn:Coand Li:(Mn+Co) ratios in all samples are in good agreementwith the nominal values. Spherical micrometer-sized parti-cles (1�2 μm) consisting of 100�200 nm sized primarynanoparticles aggregates were obtained for all samples(Figure S1). This hierarchical particle structure can be ofadvantage in terms of electrolyte diffusion and Li ionsinsertion/extraction. Figure 1a shows XRD patterns ofpristine xLi2[Mn0.857Co0.143]O3–(1�x)Li[Mn1.714Co0.286]O4
(x=0.95, 0.85, 0.75, and 0.65) samples.For the x=0.95 sample, all strong diffraction peaks can
be well indexed to R3m space group of layered hexagonal α-NaFeO2 phase. In addition, weak diffraction peaks between201 and 251 can be indexed as the LiMn6 superstructuresexisting in the transition metal layers of the Li2MnO3-likeregions [8,15,35,36], suggesting that the crystal structure ofthis sample corresponds to a monoclinic unit cell with C2/msymmetry rather than the R3m (JCPDS no. 84-1634). Thewell split of (�112)/(200) and (�133)/(�331) peaks andthe relatively high peak intensity ratio (I(001)/I(131)=1.36(41.2)) indicate a highly-crystalline layered structure withlow degree of cation mixing in the Li layers and the absenceof spinel phase [37,38]. For other three samples (x=0.85,0.75, and 0.65), additional diffraction peaks correspondingto a cubic spinel structure with a space group of Fd3m(JCPDS no. 38-0789) are gradually developed while thereflections of the layered phase become weakened withdecreasing x value. As clearly illustrated in Figure 1b, mainpeak (�19.21) of the spinel phase grows steadily when xdecreases and reaches almost the same intensity as theneighboring main one (�18.81) of the layered phase in thex=0.65 sample. In addition, the (�133) and (�331) peaksbecome broader and eventually overlap with a new (440)spinel peak intercalated in between, attributing to partialphase transition from layered to cubic spinel [39,40]. Notethat even the intensity of the spinel peaks is intensified, ahigh and sharp (001) peak and other small peaks between201 and 251 are still well detected in all composite samples,indicating that the layered Li-rich phase is dominant in the
cathode materials for lithium-ion batteries, Nano Energy (2014),
Q3
1
3
5
7
9
11
13
15
17
19
21
23
25
27
29
31
33
35
37
39
41
43
45
47
49
51
53
55
57
59
61
63
65
67
69
71
73
75
77
79
81
83
85
87
89
91
93
95
97
99
101
103
105
107
109
111
113
115
117
119
121
123
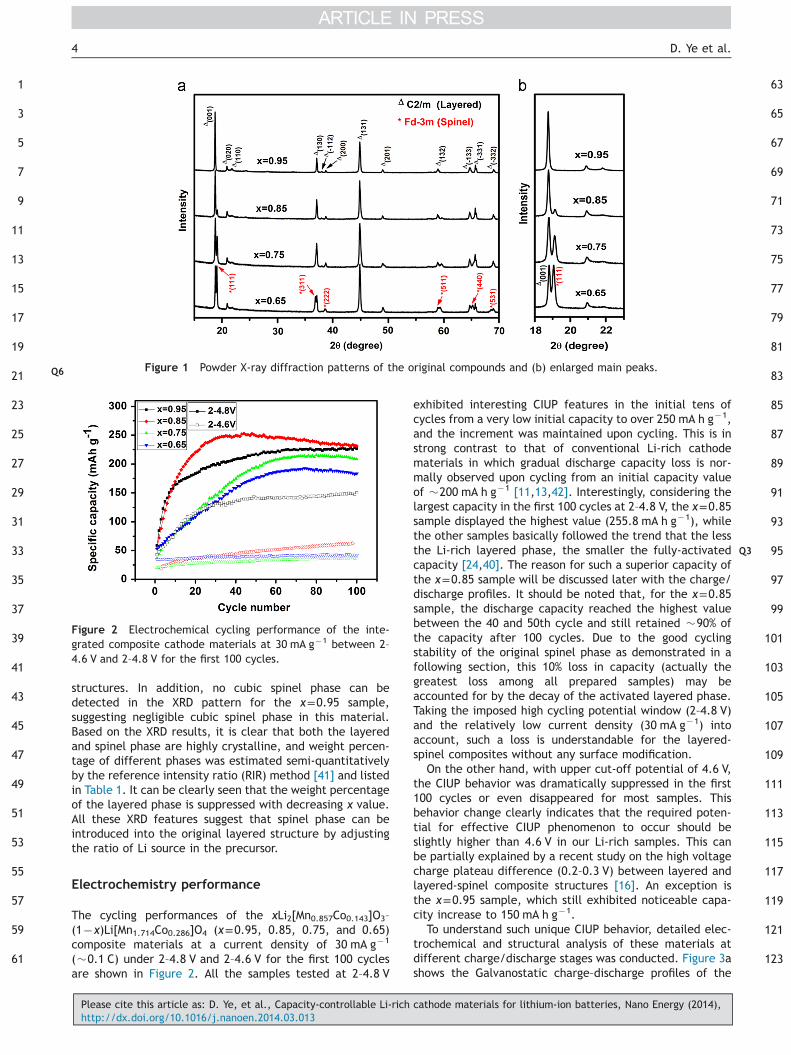
Figure 1 Powder X-ray diffraction patternsQ6 of the original compounds and (b) enlarged main peaks.
Figure 2 Electrochemical cycling performance of the inte-grated composite cathode materials at 30 mA g�1 between 2–4.6 V and 2–4.8 V for the first 100 cycles.
D. Ye et al.4
structures. In addition, no cubic spinel phase can bedetected in the XRD pattern for the x=0.95 sample,suggesting negligible cubic spinel phase in this material.Based on the XRD results, it is clear that both the layeredand spinel phase are highly crystalline, and weight percen-tage of different phases was estimated semi-quantitativelyby the reference intensity ratio (RIR) method [41] and listedin Table 1. It can be clearly seen that the weight percentageof the layered phase is suppressed with decreasing x value.All these XRD features suggest that spinel phase can beintroduced into the original layered structure by adjustingthe ratio of Li source in the precursor.
Electrochemistry performance
The cycling performances of the xLi2[Mn0.857Co0.143]O3–
(1�x)Li[Mn1.714Co0.286]O4 (x=0.95, 0.85, 0.75, and 0.65)composite materials at a current density of 30 mA g�1
(�0.1 C) under 2–4.8 V and 2–4.6 V for the first 100 cyclesare shown in Figure 2. All the samples tested at 2–4.8 V
Please cite this article as: D. Ye, et al., Capacity-controllable Li-richhttp://dx.doi.org/10.1016/j.nanoen.2014.03.013
exhibited interesting CIUP features in the initial tens ofcycles from a very low initial capacity to over 250 mA h g�1,and the increment was maintained upon cycling. This is instrong contrast to that of conventional Li-rich cathodematerials in which gradual discharge capacity loss is nor-mally observed upon cycling from an initial capacity valueof �200 mA h g�1 [11,13,42]. Interestingly, considering thelargest capacity in the first 100 cycles at 2–4.8 V, the x=0.85sample displayed the highest value (255.8 mA h g�1), whilethe other samples basically followed the trend that the lessthe Li-rich layered phase, the smaller the fully-activatedcapacity [24,40]. The reason for such a superior capacity ofthe x=0.85 sample will be discussed later with the charge/discharge profiles. It should be noted that, for the x=0.85sample, the discharge capacity reached the highest valuebetween the 40 and 50th cycle and still retained �90% ofthe capacity after 100 cycles. Due to the good cyclingstability of the original spinel phase as demonstrated in afollowing section, this 10% loss in capacity (actually thegreatest loss among all prepared samples) may beaccounted for by the decay of the activated layered phase.Taking the imposed high cycling potential window (2–4.8 V)and the relatively low current density (30 mA g�1) intoaccount, such a loss is understandable for the layered-spinel composites without any surface modification.
On the other hand, with upper cut-off potential of 4.6 V,the CIUP behavior was dramatically suppressed in the first100 cycles or even disappeared for most samples. Thisbehavior change clearly indicates that the required poten-tial for effective CIUP phenomenon to occur should beslightly higher than 4.6 V in our Li-rich samples. This canbe partially explained by a recent study on the high voltagecharge plateau difference (0.2–0.3 V) between layered andlayered-spinel composite structures [16]. An exception isthe x=0.95 sample, which still exhibited noticeable capa-city increase to 150 mA h g�1.
To understand such unique CIUP behavior, detailed elec-trochemical and structural analysis of these materials atdifferent charge/discharge stages was conducted. Figure 3ashows the Galvanostatic charge–discharge profiles of the
cathode materials for lithium-ion batteries, Nano Energy (2014),
1
3
5
7
9
11
13
15
17
19
21
23
25
27
29
31
33
35
37
39
41
43
45
47
49
51
53
55
57
59
61
63
65
67
69
71
73
75
77
79
81
83
85
87
89
91
93
95
97
99
101
103
105
107
109
111
113
115
117
119
121
123
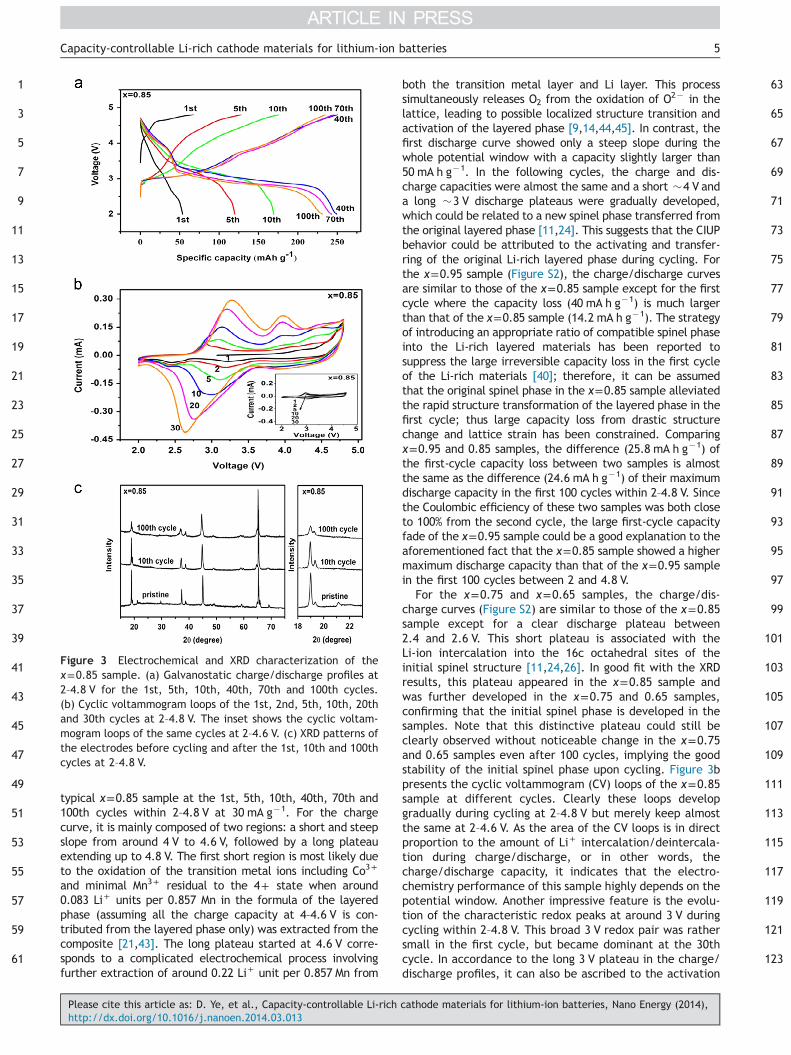
Figure 3 Electrochemical and XRD characterization of thex=0.85 sample. (a) Galvanostatic charge/discharge profiles at2–4.8 V for the 1st, 5th, 10th, 40th, 70th and 100th cycles.(b) Cyclic voltammogram loops of the 1st, 2nd, 5th, 10th, 20thand 30th cycles at 2–4.8 V. The inset shows the cyclic voltam-mogram loops of the same cycles at 2–4.6 V. (c) XRD patterns ofthe electrodes before cycling and after the 1st, 10th and 100thcycles at 2–4.8 V.
5Capacity-controllable Li-rich cathode materials for lithium-ion batteries
typical x=0.85 sample at the 1st, 5th, 10th, 40th, 70th and100th cycles within 2–4.8 V at 30 mA g�1. For the chargecurve, it is mainly composed of two regions: a short and steepslope from around 4 V to 4.6 V, followed by a long plateauextending up to 4.8 V. The first short region is most likely dueto the oxidation of the transition metal ions including Co3+
and minimal Mn3+ residual to the 4+ state when around0.083 Li+ units per 0.857 Mn in the formula of the layeredphase (assuming all the charge capacity at 4–4.6 V is con-tributed from the layered phase only) was extracted from thecomposite [21,43]. The long plateau started at 4.6 V corre-sponds to a complicated electrochemical process involvingfurther extraction of around 0.22 Li+ unit per 0.857 Mn from
Please cite this article as: D. Ye, et al., Capacity-controllable Li-richhttp://dx.doi.org/10.1016/j.nanoen.2014.03.013
both the transition metal layer and Li layer. This processsimultaneously releases O2 from the oxidation of O2� in thelattice, leading to possible localized structure transition andactivation of the layered phase [9,14,44,45]. In contrast, thefirst discharge curve showed only a steep slope during thewhole potential window with a capacity slightly larger than50 mA h g�1. In the following cycles, the charge and dis-charge capacities were almost the same and a short �4 V anda long �3 V discharge plateaus were gradually developed,which could be related to a new spinel phase transferred fromthe original layered phase [11,24]. This suggests that the CIUPbehavior could be attributed to the activating and transfer-ring of the original Li-rich layered phase during cycling. Forthe x=0.95 sample (Figure S2), the charge/discharge curvesare similar to those of the x=0.85 sample except for the firstcycle where the capacity loss (40 mA h g�1) is much largerthan that of the x=0.85 sample (14.2 mA h g�1). The strategyof introducing an appropriate ratio of compatible spinel phaseinto the Li-rich layered materials has been reported tosuppress the large irreversible capacity loss in the first cycleof the Li-rich materials [40]; therefore, it can be assumedthat the original spinel phase in the x=0.85 sample alleviatedthe rapid structure transformation of the layered phase in thefirst cycle; thus large capacity loss from drastic structurechange and lattice strain has been constrained. Comparingx=0.95 and 0.85 samples, the difference (25.8 mA h g�1) ofthe first-cycle capacity loss between two samples is almostthe same as the difference (24.6 mA h g�1) of their maximumdischarge capacity in the first 100 cycles within 2–4.8 V. Sincethe Coulombic efficiency of these two samples was both closeto 100% from the second cycle, the large first-cycle capacityfade of the x=0.95 sample could be a good explanation to theaforementioned fact that the x=0.85 sample showed a highermaximum discharge capacity than that of the x=0.95 samplein the first 100 cycles between 2 and 4.8 V.
For the x=0.75 and x=0.65 samples, the charge/dis-charge curves (Figure S2) are similar to those of the x=0.85sample except for a clear discharge plateau between2.4 and 2.6 V. This short plateau is associated with theLi-ion intercalation into the 16c octahedral sites of theinitial spinel structure [11,24,26]. In good fit with the XRDresults, this plateau appeared in the x=0.85 sample andwas further developed in the x=0.75 and 0.65 samples,confirming that the initial spinel phase is developed in thesamples. Note that this distinctive plateau could still beclearly observed without noticeable change in the x=0.75and 0.65 samples even after 100 cycles, implying the goodstability of the initial spinel phase upon cycling. Figure 3bpresents the cyclic voltammogram (CV) loops of the x=0.85sample at different cycles. Clearly these loops developgradually during cycling at 2–4.8 V but merely keep almostthe same at 2–4.6 V. As the area of the CV loops is in directproportion to the amount of Li+ intercalation/deintercala-tion during charge/discharge, or in other words, thecharge/discharge capacity, it indicates that the electro-chemistry performance of this sample highly depends on thepotential window. Another impressive feature is the evolu-tion of the characteristic redox peaks at around 3 V duringcycling within 2–4.8 V. This broad 3 V redox pair was rathersmall in the first cycle, but became dominant at the 30thcycle. In accordance to the long 3 V plateau in the charge/discharge profiles, it can also be ascribed to the activation
cathode materials for lithium-ion batteries, Nano Energy (2014),
1
3
5
7
9
11
13
15
17
19
21
23
25
27
29
31
33
35
37
39
41
43
45
47
49
51
53
55
57
59
61
63
65
67
69
71
73
75
77
79
81
83
85
87
D. Ye et al.6
process of the initial Li-rich layered phase [21,24,46,47]. Inaddition, a small reduction peak from the initial spinelphase can be observed at around 2.6 V in the x=0.85 samplewhich steadily grew in the x=0.75 and x=0.65 samples(Figure S3). Apparently, the size and shape of this peak inthe x=0.75 and x=0.65 samples were almost the sameduring the entire 30 cycles, further confirming the goodcycling stability of the initial spinel phase.
Figure 3c shows the ex-situ XRD patterns of the x=0.85composite electrodes before cycling and after 10 and 100cycles. A noticeable change is that the superlattice peaksbetween 201 and 251 became wider and weaker after 10cycles and totally disappeared after 100 cycles. Thisphenomenon suggests the atomic rearrangement and resul-tant loss of Li–Mn ordering in the transition metal layer ofthe Li-rich layered phase [14,24,25]. In addition, theintensity ratio of the main peaks at 18.751 and 19.21,denoting the layered Li-rich and the original spinel phases,respectively, decreased gradually during cycling. Consider-ing the relatively good stability of the initial spinel phase, ifthe content of this phase is set to be fixed, the weightpercentage of the layered phase after different cycles canbe roughly estimated by the RIR method. As shown in FigureS4 and Table S1 (the x=0.95 sample cannot be calculated bythis method due to the absence of the pristine spinel phasefor reference), the weight percentage of the layered phase
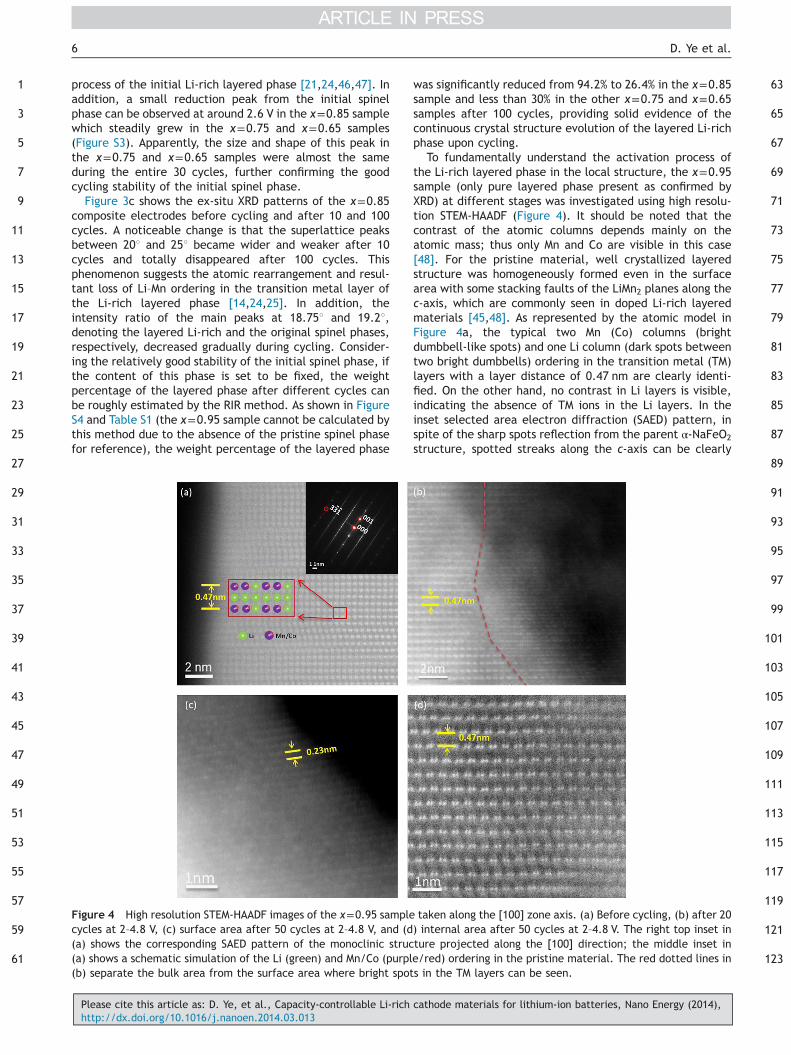
Figure 4 High resolution STEM-HAADF images of the x=0.95 samplecycles at 2–4.8 V, (c) surface area after 50 cycles at 2–4.8 V, and (d(a) shows the corresponding SAED pattern of the monoclinic struc(a) shows a schematic simulation of the Li (green) and Mn/Co (purpl(b) separate the bulk area from the surface area where bright spot
Please cite this article as: D. Ye, et al., Capacity-controllable Li-richhttp://dx.doi.org/10.1016/j.nanoen.2014.03.013
was significantly reduced from 94.2% to 26.4% in the x=0.85sample and less than 30% in the other x=0.75 and x=0.65samples after 100 cycles, providing solid evidence of thecontinuous crystal structure evolution of the layered Li-richphase upon cycling.
To fundamentally understand the activation process ofthe Li-rich layered phase in the local structure, the x=0.95sample (only pure layered phase present as confirmed byXRD) at different stages was investigated using high resolu-tion STEM-HAADF (Figure 4). It should be noted that thecontrast of the atomic columns depends mainly on theatomic mass; thus only Mn and Co are visible in this case[48]. For the pristine material, well crystallized layeredstructure was homogeneously formed even in the surfacearea with some stacking faults of the LiMn2 planes along thec-axis, which are commonly seen in doped Li-rich layeredmaterials [45,48]. As represented by the atomic model inFigure 4a, the typical two Mn (Co) columns (brightdumbbell-like spots) and one Li column (dark spots betweentwo bright dumbbells) ordering in the transition metal (TM)layers with a layer distance of 0.47 nm are clearly identi-fied. On the other hand, no contrast in Li layers is visible,indicating the absence of TM ions in the Li layers. In theinset selected area electron diffraction (SAED) pattern, inspite of the sharp spots reflection from the parent α-NaFeO2
structure, spotted streaks along the c-axis can be clearly
8991
93
95
97
99
101
103
105
107
109
111
113
115
117
119
121
123
taken along the [100] zone axis. (a) Before cycling, (b) after 20) internal area after 50 cycles at 2–4.8 V. The right top inset inture projected along the [100] direction; the middle inset ine/red) ordering in the pristine material. The red dotted lines ins in the TM layers can be seen.
cathode materials for lithium-ion batteries, Nano Energy (2014),
1
3
5
7
9
11
13
15
17
19
21
23
25
27
29
31
33
35
37
39
41
43
45
47
49
51
53
55
57
59
61
63
65
67
69
71
73
75
77
79
81
83
85
87
89
7Capacity-controllable Li-rich cathode materials for lithium-ion batteries
observed, which strongly indicate the LiMn6 ordering in theTM planes and the existence of thin platelets resulting fromthe stacking faults along the [100] orientation [48,49].However, after 20 cycles, the contrast of the Li layers atthe surface area (right side of the dotted red lines inFigure 4b) is changed and some bright columns can beeasily observed, although not as bright as those in theneighboring TM layers. This change suggests the transitionof the original layered structure to a defect spinel phasefacilitated by the migration of the TM ions from TM layers tothe Li layers [50–52]. After 50 cycles, although the STEMimages became a little blurry due to the decreased crystal-linity of the sample after long time contact with electro-lyte, it is still clear enough to see that all the layers in thesurface area, no matter TM layers or Li layers, have thesame contrast with the layer distance (0.23 nm) of only halfof the original one (0.47 nm). This means that more TM ionshad moved into the Li layers on the surface area after 50cycles, making the concentrations of the TM layers and Lilayers too close to be distinguished. Interestingly, in con-trast to the surface area, the structure in the internal areawas relatively stable. Consistent dark columns in the Lilayers with a layer distance of 0.47 nm were well main-tained even after 50 cycles. All these observations suggestthat the Li-rich layered phase was gradually activated andprobably converted into a new defect spinel structure in thesurface area during cycling at 2–4.8 V.
91
93
95
97
99
101
103
105
Mechanism of the CIUP behavior
Activation of the Li-rich phase may be affected by a fewfactors like the charge and discharge rates and the testingtemperature [13,53]. In our study, all the electrochemistrytests were conducted with a constant current density of30 mA g�1 (0.1 C) at room temperature. This testing condi-tion is commonly applied in Li-rich cathode materials with-out any CIUP behavior [42,54]. Therefore, this interestingphenomenon is considered to be caused by another issue.As mentioned before, much lower Co/Mn molar ratios wereused in our materials than those of the conventional Li-richcathode materials, which may play a vital role for theobserved new electrochemistry behaviors. To verify thisspeculation, it is important to first understand the role of Co
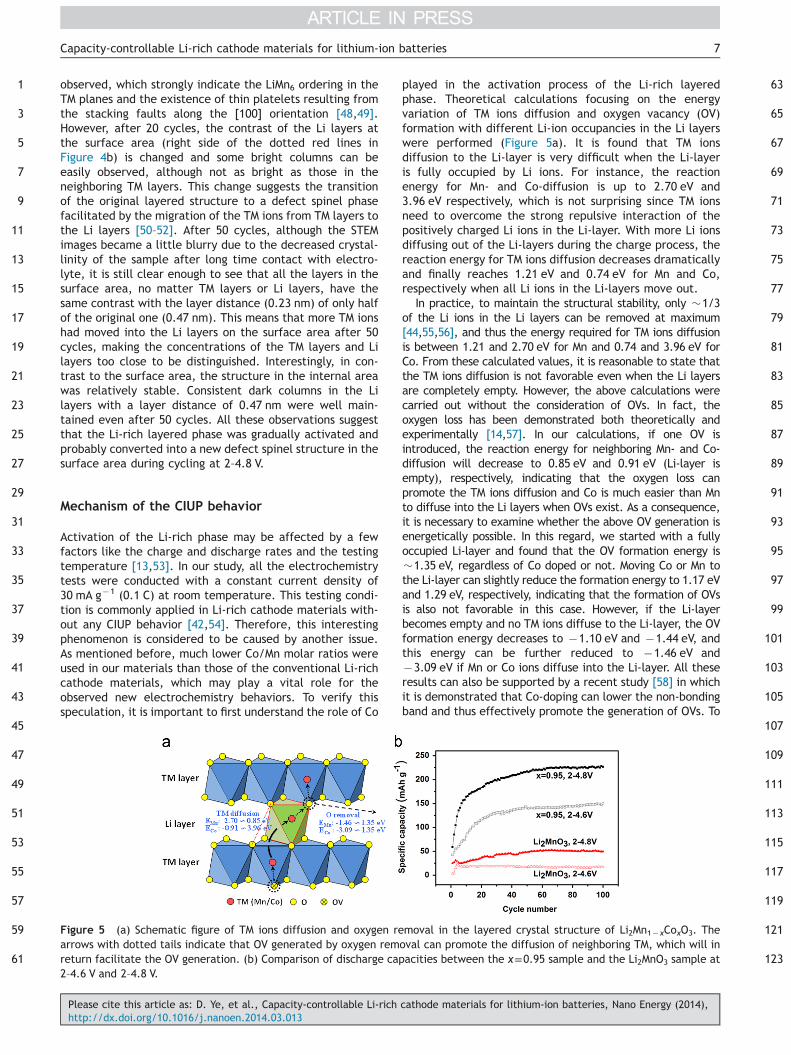
Figure 5 (a) Schematic figure of TM ions diffusion and oxygen rearrows with dotted tails indicate that OV generated by oxygen remreturn facilitate the OV generation. (b) Comparison of discharge cap2–4.6 V and 2–4.8 V.
Please cite this article as: D. Ye, et al., Capacity-controllable Li-richhttp://dx.doi.org/10.1016/j.nanoen.2014.03.013
played in the activation process of the Li-rich layeredphase. Theoretical calculations focusing on the energyvariation of TM ions diffusion and oxygen vacancy (OV)formation with different Li-ion occupancies in the Li layerswere performed (Figure 5a). It is found that TM ionsdiffusion to the Li-layer is very difficult when the Li-layeris fully occupied by Li ions. For instance, the reactionenergy for Mn- and Co-diffusion is up to 2.70 eV and3.96 eV respectively, which is not surprising since TM ionsneed to overcome the strong repulsive interaction of thepositively charged Li ions in the Li-layer. With more Li ionsdiffusing out of the Li-layers during the charge process, thereaction energy for TM ions diffusion decreases dramaticallyand finally reaches 1.21 eV and 0.74 eV for Mn and Co,respectively when all Li ions in the Li-layers move out.
In practice, to maintain the structural stability, only �1/3of the Li ions in the Li layers can be removed at maximum[44,55,56], and thus the energy required for TM ions diffusionis between 1.21 and 2.70 eV for Mn and 0.74 and 3.96 eV forCo. From these calculated values, it is reasonable to state thatthe TM ions diffusion is not favorable even when the Li layersare completely empty. However, the above calculations werecarried out without the consideration of OVs. In fact, theoxygen loss has been demonstrated both theoretically andexperimentally [14,57]. In our calculations, if one OV isintroduced, the reaction energy for neighboring Mn- and Co-diffusion will decrease to 0.85 eV and 0.91 eV (Li-layer isempty), respectively, indicating that the oxygen loss canpromote the TM ions diffusion and Co is much easier than Mnto diffuse into the Li layers when OVs exist. As a consequence,it is necessary to examine whether the above OV generation isenergetically possible. In this regard, we started with a fullyoccupied Li-layer and found that the OV formation energy is�1.35 eV, regardless of Co doped or not. Moving Co or Mn tothe Li-layer can slightly reduce the formation energy to 1.17 eVand 1.29 eV, respectively, indicating that the formation of OVsis also not favorable in this case. However, if the Li-layerbecomes empty and no TM ions diffuse to the Li-layer, the OVformation energy decreases to �1.10 eV and �1.44 eV, andthis energy can be further reduced to �1.46 eV and�3.09 eV if Mn or Co ions diffuse into the Li-layer. All theseresults can also be supported by a recent study [58] in whichit is demonstrated that Co-doping can lower the non-bondingband and thus effectively promote the generation of OVs. To
107
109
111
113
115
117
119
121
123
moval in the layered crystal structure of Li2Mn1�xCoxO3. Theoval can promote the diffusion of neighboring TM, which will inacities between the x=0.95 sample and the Li2MnO3 sample at
cathode materials for lithium-ion batteries, Nano Energy (2014),
Q4
1
3
5
7
9
11
13
15
17
19
21
23
25
27
29
31
33
35
37
39
41
43
45
47
49
51
53
55
57
59
61
63
65
67
69
71
73
75
77
79
81
83
85
87
89
91
93
95
97
99
101
103
105
107
109
111
113
115
117
119
121
123
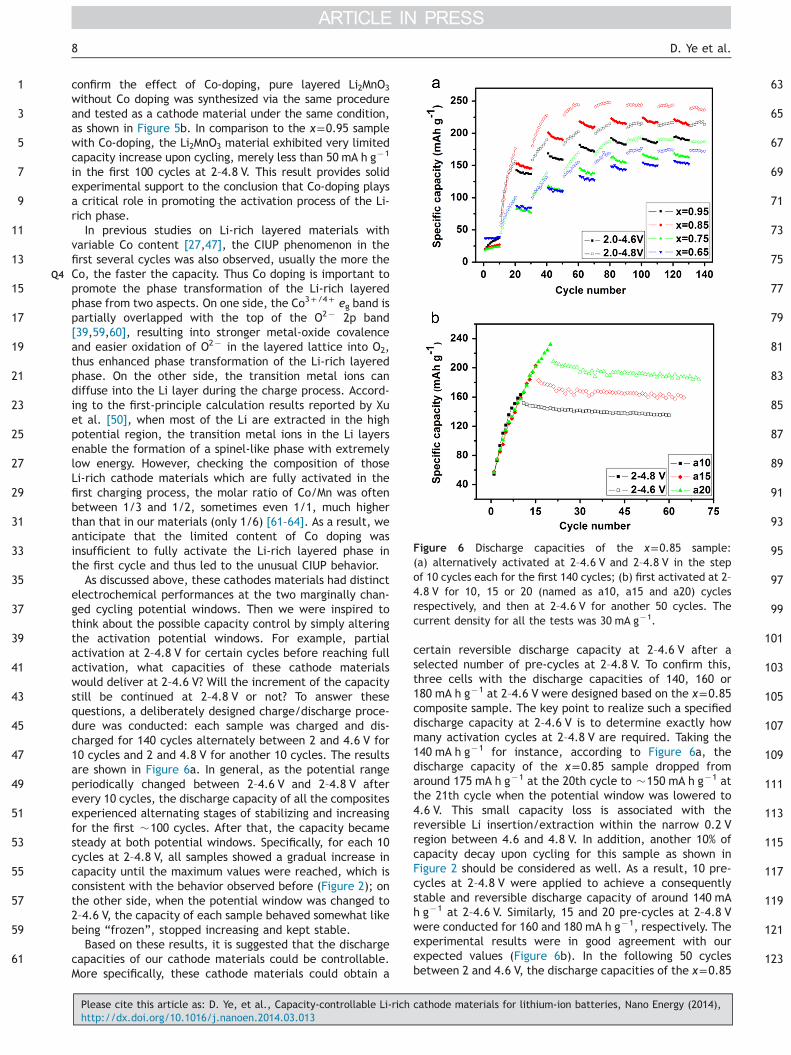
Figure 6 Discharge capacities of the x=0.85 sample:(a) alternatively activated at 2–4.6 V and 2–4.8 V in the stepof 10 cycles each for the first 140 cycles; (b) first activated at 2–4.8 V for 10, 15 or 20 (named as a10, a15 and a20) cyclesrespectively, and then at 2–4.6 V for another 50 cycles. Thecurrent density for all the tests was 30 mA g�1.
D. Ye et al.8
confirm the effect of Co-doping, pure layered Li2MnO3
without Co doping was synthesized via the same procedureand tested as a cathode material under the same condition,as shown in Figure 5b. In comparison to the x=0.95 samplewith Co-doping, the Li2MnO3 material exhibited very limitedcapacity increase upon cycling, merely less than 50 mA h g�1
in the first 100 cycles at 2–4.8 V. This result provides solidexperimental support to the conclusion that Co-doping playsa critical role in promoting the activation process of the Li-rich phase.
In previous studies on Li-rich layered materials withvariable Co content [27,47], the CIUP phenomenon in thefirst several cycles was also observed, usually the more theCo, the faster the capacity. Thus Co doping is important topromote the phase transformation of the Li-rich layeredphase from two aspects. On one side, the Co3+/4+ eg band ispartially overlapped with the top of the O2� 2p band[39,59,60], resulting into stronger metal-oxide covalenceand easier oxidation of O2� in the layered lattice into O2,thus enhanced phase transformation of the Li-rich layeredphase. On the other side, the transition metal ions candiffuse into the Li layer during the charge process. Accord-ing to the first-principle calculation results reported by Xuet al. [50], when most of the Li are extracted in the highpotential region, the transition metal ions in the Li layersenable the formation of a spinel-like phase with extremelylow energy. However, checking the composition of thoseLi-rich cathode materials which are fully activated in thefirst charging process, the molar ratio of Co/Mn was oftenbetween 1/3 and 1/2, sometimes even 1/1, much higherthan that in our materials (only 1/6) [61–64]. As a result, weanticipate that the limited content of Co doping wasinsufficient to fully activate the Li-rich layered phase inthe first cycle and thus led to the unusual CIUP behavior.
As discussed above, these cathodes materials had distinctelectrochemical performances at the two marginally chan-ged cycling potential windows. Then we were inspired tothink about the possible capacity control by simply alteringthe activation potential windows. For example, partialactivation at 2–4.8 V for certain cycles before reaching fullactivation, what capacities of these cathode materialswould deliver at 2–4.6 V? Will the increment of the capacitystill be continued at 2–4.8 V or not? To answer thesequestions, a deliberately designed charge/discharge proce-dure was conducted: each sample was charged and dis-charged for 140 cycles alternately between 2 and 4.6 V for10 cycles and 2 and 4.8 V for another 10 cycles. The resultsare shown in Figure 6a. In general, as the potential rangeperiodically changed between 2–4.6 V and 2–4.8 V afterevery 10 cycles, the discharge capacity of all the compositesexperienced alternating stages of stabilizing and increasingfor the first �100 cycles. After that, the capacity becamesteady at both potential windows. Specifically, for each 10cycles at 2–4.8 V, all samples showed a gradual increase incapacity until the maximum values were reached, which isconsistent with the behavior observed before (Figure 2); onthe other side, when the potential window was changed to2–4.6 V, the capacity of each sample behaved somewhat likebeing “frozen”, stopped increasing and kept stable.
Based on these results, it is suggested that the dischargecapacities of our cathode materials could be controllable.More specifically, these cathode materials could obtain a
Please cite this article as: D. Ye, et al., Capacity-controllable Li-richhttp://dx.doi.org/10.1016/j.nanoen.2014.03.013
certain reversible discharge capacity at 2–4.6 V after aselected number of pre-cycles at 2–4.8 V. To confirm this,three cells with the discharge capacities of 140, 160 or180 mA h g�1 at 2–4.6 V were designed based on the x=0.85composite sample. The key point to realize such a specifieddischarge capacity at 2–4.6 V is to determine exactly howmany activation cycles at 2–4.8 V are required. Taking the140 mA h g�1 for instance, according to Figure 6a, thedischarge capacity of the x=0.85 sample dropped fromaround 175 mA h g�1 at the 20th cycle to �150 mA h g�1 atthe 21th cycle when the potential window was lowered to4.6 V. This small capacity loss is associated with thereversible Li insertion/extraction within the narrow 0.2 Vregion between 4.6 and 4.8 V. In addition, another 10% ofcapacity decay upon cycling for this sample as shown inFigure 2 should be considered as well. As a result, 10 pre-cycles at 2–4.8 V were applied to achieve a consequentlystable and reversible discharge capacity of around 140 mAh g�1 at 2–4.6 V. Similarly, 15 and 20 pre-cycles at 2–4.8 Vwere conducted for 160 and 180 mA h g�1, respectively. Theexperimental results were in good agreement with ourexpected values (Figure 6b). In the following 50 cyclesbetween 2 and 4.6 V, the discharge capacities of the x=0.85
cathode materials for lithium-ion batteries, Nano Energy (2014),
Q5
1
3
5
7
9
11
13
15
17
19
21
23
25
27
29
31
33
35
37
39
41
43
45
47
49
51
53
55
57
59
61
63
65
67
69
71
73
75
77
79
81
83
85
87
89
91
93
95
97
99
101
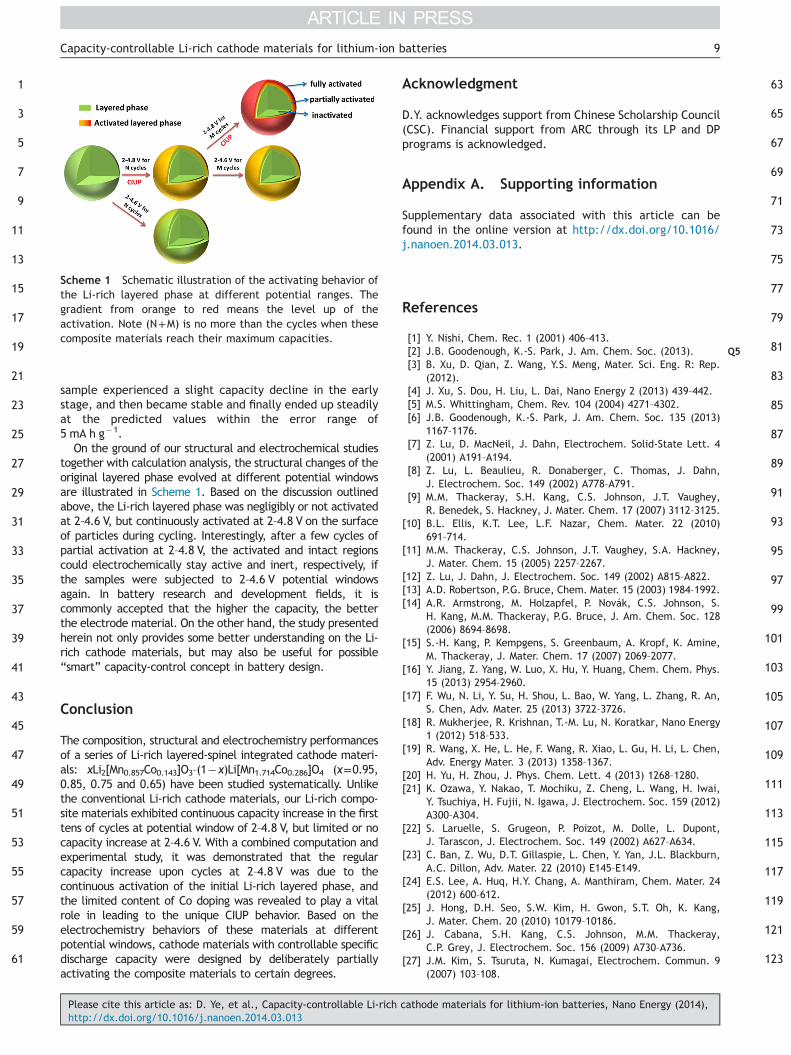
103
Scheme 1 Schematic illustration of the activating behavior ofthe Li-rich layered phase at different potential ranges. Thegradient from orange to red means the level up of theactivation. Note (N+M) is no more than the cycles when thesecomposite materials reach their maximum capacities.
9Capacity-controllable Li-rich cathode materials for lithium-ion batteries
sample experienced a slight capacity decline in the earlystage, and then became stable and finally ended up steadilyat the predicted values within the error range of5 mA h g�1.
On the ground of our structural and electrochemical studiestogether with calculation analysis, the structural changes of theoriginal layered phase evolved at different potential windowsare illustrated in Scheme 1. Based on the discussion outlinedabove, the Li-rich layered phase was negligibly or not activatedat 2–4.6 V, but continuously activated at 2–4.8 V on the surfaceof particles during cycling. Interestingly, after a few cycles ofpartial activation at 2–4.8 V, the activated and intact regionscould electrochemically stay active and inert, respectively, ifthe samples were subjected to 2–4.6 V potential windowsagain. In battery research and development fields, it iscommonly accepted that the higher the capacity, the betterthe electrode material. On the other hand, the study presentedherein not only provides some better understanding on the Li-rich cathode materials, but may also be useful for possible“smart” capacity-control concept in battery design.
105
107
109
111
113
115
117
119
121
123
Conclusion
The composition, structural and electrochemistry performancesof a series of Li-rich layered-spinel integrated cathode materi-als: xLi2[Mn0.857Co0.143]O3–(1�x)Li[Mn1.714Co0.286]O4 (x=0.95,0.85, 0.75 and 0.65) have been studied systematically. Unlikethe conventional Li-rich cathode materials, our Li-rich compo-site materials exhibited continuous capacity increase in the firsttens of cycles at potential window of 2–4.8 V, but limited or nocapacity increase at 2–4.6 V. With a combined computation andexperimental study, it was demonstrated that the regularcapacity increase upon cycles at 2–4.8 V was due to thecontinuous activation of the initial Li-rich layered phase, andthe limited content of Co doping was revealed to play a vitalrole in leading to the unique CIUP behavior. Based on theelectrochemistry behaviors of these materials at differentpotential windows, cathode materials with controllable specificdischarge capacity were designed by deliberately partiallyactivating the composite materials to certain degrees.
Please cite this article as: D. Ye, et al., Capacity-controllable Li-richhttp://dx.doi.org/10.1016/j.nanoen.2014.03.013
Acknowledgment
D.Y. acknowledges support from Chinese Scholarship Council(CSC). Financial support from ARC through its LP and DPprograms is acknowledged.
Appendix A. Supporting information
Supplementary data associated with this article can befound in the online version at http://dx.doi.org/10.1016/j.nanoen.2014.03.013.
References
[1] Y. Nishi, Chem. Rec. 1 (2001) 406–413.[2] J.B. Goodenough, K.-S. Park, J. Am. Chem. Soc. (2013).[3] B. Xu, D. Qian, Z. Wang, Y.S. Meng, Mater. Sci. Eng. R: Rep.
(2012).[4] J. Xu, S. Dou, H. Liu, L. Dai, Nano Energy 2 (2013) 439–442.[5] M.S. Whittingham, Chem. Rev. 104 (2004) 4271–4302.[6] J.B. Goodenough, K.-S. Park, J. Am. Chem. Soc. 135 (2013)
1167–1176.[7] Z. Lu, D. MacNeil, J. Dahn, Electrochem. Solid-State Lett. 4
(2001) A191–A194.[8] Z. Lu, L. Beaulieu, R. Donaberger, C. Thomas, J. Dahn,
J. Electrochem. Soc. 149 (2002) A778–A791.[9] M.M. Thackeray, S.H. Kang, C.S. Johnson, J.T. Vaughey,
R. Benedek, S. Hackney, J. Mater. Chem. 17 (2007) 3112–3125.[10] B.L. Ellis, K.T. Lee, L.F. Nazar, Chem. Mater. 22 (2010)
691–714.[11] M.M. Thackeray, C.S. Johnson, J.T. Vaughey, S.A. Hackney,
J. Mater. Chem. 15 (2005) 2257–2267.[12] Z. Lu, J. Dahn, J. Electrochem. Soc. 149 (2002) A815–A822.[13] A.D. Robertson, P.G. Bruce, Chem. Mater. 15 (2003) 1984–1992.[14] A.R. Armstrong, M. Holzapfel, P. Novák, C.S. Johnson, S.
H. Kang, M.M. Thackeray, P.G. Bruce, J. Am. Chem. Soc. 128(2006) 8694–8698.
[15] S.-H. Kang, P. Kempgens, S. Greenbaum, A. Kropf, K. Amine,M. Thackeray, J. Mater. Chem. 17 (2007) 2069–2077.
[16] Y. Jiang, Z. Yang, W. Luo, X. Hu, Y. Huang, Chem. Chem. Phys.15 (2013) 2954–2960.
[17] F. Wu, N. Li, Y. Su, H. Shou, L. Bao, W. Yang, L. Zhang, R. An,S. Chen, Adv. Mater. 25 (2013) 3722–3726.
[18] R. Mukherjee, R. Krishnan, T.-M. Lu, N. Koratkar, Nano Energy1 (2012) 518–533.
[19] R. Wang, X. He, L. He, F. Wang, R. Xiao, L. Gu, H. Li, L. Chen,Adv. Energy Mater. 3 (2013) 1358–1367.
[20] H. Yu, H. Zhou, J. Phys. Chem. Lett. 4 (2013) 1268–1280.[21] K. Ozawa, Y. Nakao, T. Mochiku, Z. Cheng, L. Wang, H. Iwai,
Y. Tsuchiya, H. Fujii, N. Igawa, J. Electrochem. Soc. 159 (2012)A300–A304.
[22] S. Laruelle, S. Grugeon, P. Poizot, M. Dolle, L. Dupont,J. Tarascon, J. Electrochem. Soc. 149 (2002) A627–A634.
[23] C. Ban, Z. Wu, D.T. Gillaspie, L. Chen, Y. Yan, J.L. Blackburn,A.C. Dillon, Adv. Mater. 22 (2010) E145–E149.
[24] E.S. Lee, A. Huq, H.Y. Chang, A. Manthiram, Chem. Mater. 24(2012) 600–612.
[25] J. Hong, D.H. Seo, S.W. Kim, H. Gwon, S.T. Oh, K. Kang,J. Mater. Chem. 20 (2010) 10179–10186.
[26] J. Cabana, S.H. Kang, C.S. Johnson, M.M. Thackeray,C.P. Grey, J. Electrochem. Soc. 156 (2009) A730–A736.
[27] J.M. Kim, S. Tsuruta, N. Kumagai, Electrochem. Commun. 9(2007) 103–108.
cathode materials for lithium-ion batteries, Nano Energy (2014),
1
3
5
7
9
11
13
15
17
19
21
23
25
27
29
31
33
35
37
39
41
43
45
47
49
51
53
55
57
59
61
63
65
67
D. Ye et al.10
[28] S.-H. Yu, T. Yoon, J. Mun, S. Park, Y.-S. Kang, J.-H. Park, S.M. Oh, Y.-E. Sung, J. Mater, Chemistry A 1 (2013) 2833–2839.
[29] J.P. Perdew, K. Burke, M. Ernzerhof, Phys. Rev. Lett. 77 (1996)3865–3868.
[30] P.E. Bloc̈hl, Phys. Rev. B 50 (1994) 17953.[31] G. Kresse, D. Joubert, Phys. Rev. B 59 (1999) 1758.[32] V.I. Anisimov, J. Zaanen, O.K. Andersen, Phys. Rev. B 44 (1991)
943.[33] V.L. Chevrier, S.P. Ong, R. Armiento, M.K. Chan, G. Ceder,
Phys. Rev. B 82 (2010) 075122.[34] Y. Hinuma, Y.S. Meng, K. Kang, G. Ceder, Chem. Mater. 19
(2007) 1790–1800.[35] J. Bréger, M. Jiang, N. Dupré, Y.S. Meng, Y. Shao-Horn,
G. Ceder, C.P. Grey, J. Solid State Chem. 178 (2005)2575–2585.
[36] K.A. Jarvis, Z. Deng, L.F. Allard, A. Manthiram, P.J. Ferreira,Chem. Mater. 23 (2011) 3614–3621.
[37] A.U.T Ohzuku, M. Nagayama, H. Yiwakos, H. Komori, Electro-chim. Acta 38 (1993) 1159–1167.
[38] Y. Li, Z. Zhou, M. Ren, X. Gao, J. Yan, Electrochim. Acta 51(2006) 6498–6502.
[39] Z. Deng, A. Manthiram, J. Phys. Chem. C 115 (2011)7097–7103.
[40] S.-H. Park, S.-H. Kang, C. Johnson, K. Amine, M. Thackeray,Electrochem. Commun. 9 (2007) 262–268.
[41] A.F. Gualtieri, J. Appl. Cryst. 33 (2000) 267–278.[42] S.K. Martha, J. Nanda, G.M. Veith, N.J. Dudney, J. Power
Sources 199 (2012) 220–226.[43] N. Yabuuchi, K. Yoshii, S.-T. Myung, I. Nakai, S. Komaba, J. Am.
Chem. Soc. 133 (2011) 4404–4419.[44] R. Xiao, H. Li, L. Chen, Chem. Mater. 24 (2012) 4242–4251.[45] M. Gu, I. Belharouak, J. Zheng, H. Wu, J. Xiao, A. Genc, K.
Amine, S. Thevuthasan, D.R. Baer, J.-G. Zhang, ACS Nano(2012).
[46] D. Kim, S.-H. Kang, M. Balasubramanian, C.S. Johnson, Elec-trochem. Commun. 12 (2010) 1618–1621.
Please cite this article as: D. Ye, et al., Capacity-controllable Li-richhttp://dx.doi.org/10.1016/j.nanoen.2014.03.013
[47] Y.J. Park, Y.-S. Hong, X. Wu, M.G. Kim, K.S. Ryu, S.H. Chang,J. Electrochem. Soc. 151 (2004) A720–A727.
[48] J. Bareno, C. Lei, J. Wen, S.H. Kang, I. Petrov, D. Abraham,Adv. Mater. 22 (2010) 1122–1127.
[49] H. Yu, R. Ishikawa, Y.G. So, N. Shibata, T. Kudo, H. Zhou, Y.Ikuhara, Angew. Chem. Int. Ed. (2013).
[50] B. Xu, C.R. Fell, M. Chi, Y.S. Meng, Energy Environ. Sci. 4(2011) 2223–2233.
[51] A. Boulineau, L. Simonin, J.-F. Colin, C. Bourbon, S. Patoux,Nano Lett. (2013).
[52] M. Gu, A. Genc, I. Belharouak, D. Wang, K. Amine, S.Thevuthasan, D.R. Baer, J.-G. Zhang, N.D. Browning, J. Liu,Chem. Mater. (2013).
[53] P. Lanz, C. Villevieille, P. Novák, Electrochim. Acta 109 (2013)426–432.
[54] N. Li, R. An, Y. Su, F. Wu, L. Bao, L. Chen, Y. Zheng, H. Shou,S. Chen, J. Mater. Chem. A 1 (2013) 9760–9767.
[55] Y. Denis, K. Yanagida, Y. Kato, H. Nakamura, J. Electrochem.Soc. 156 (2009) A417–A424.
[56] Y. Koyama, I. Tanaka, M. Nagao, R. Kanno, J. Power Sources189 (2009) 798–801.
[57] Y. Okamoto, J. Electrochem. Soc. 159 (2011) A152–A157.[58] P. Xiao, Z. Deng, A. Manthiram, G. Henkelman, J. Phys. Chem.
C 116 (2012) 23201–23204.[59] R. Chebiam, A. Kannan, F. Prado, A. Manthiram, Electrochem.
Commun. 3 (2001) 624–627.[60] S. Venkatraman, Y. Shin, A. Manthiram, Electrochem. Solid-
State Lett. 6 (2003) A9–A12.[61] N. Kumagai, J.-M. Kim, S. Tsuruta, Y. Kadoma, K. Ui, Electro-
chim. Acta 53 (2008) 5287–5293.[62] Y. Wei, K. Nikolowski, S. Zhan, H. Ehrenberg, S. Oswald,
G. Chen, C. Wang, H. Chen, Electrochem. Commun. 11(2009) 2008–2011.
[63] Y. Lee, M.G. Kim, J. Cho, Nano Lett. 8 (2008) 957–961.[64] Z. Li, Y. Wang, X. Bie, K. Zhu, C. Wang, G. Chen, Y. Wei,
Electrochem. Commun. 13 (2011) 1016–1019.
cathode materials for lithium-ion batteries, Nano Energy (2014),