Embed Size (px)
Citation preview

CAPACITY BUILDING FOR FISCAL REFORMS IN
SIKKIM
FINAL REPORT
National Institute of Public Finance and Policy New Delhi
December 02, 2005

Preface
The Asian Development Bank (ADB) funded Technical Assistance (TA) on Capacity
Building for Fiscal Reforms in Sikkim was implemented by the National Institute of
Public Finance and Policy from December 2004 to September 2005. The TA involved
reviewing the fiscal and statistical system in the State, preparing the State for calibrating
reforms in critical areas of fiscal policy, instituting systems and institutions and training of
personnel for both implementing reforms and collecting and compiling the information
system for carrying out reforms.
The TA was undertaken by a team of international and domestic experts. The experts
worked in close collaboration with senior State government officials in implementing the
TA. The execution of the TA required capacity building in the State while simultaneously
carrying out reforms like in the case of implementing the Value Added Tax. It also
envisaged setting up institutions and systems for medium and long term fiscal reforms.
We would like to place on record our appreciation to the State government officials with
whom we worked closely in executing the TA. In particular, we are grateful to Mr. T.T.
Dorji for sparing time to constantly interact with the team. The list of officials whom we
interacted is given in the Appendix. We would also like to record our gratitude to the ADB
and to Dr. Hiranya Mukhopadhyay in the ADB Resident Mission for providing the
opportunity and giving periodic comments and suggestions on various reports submitted.
We are also grateful to Mr. R. Parameswaran and Mr. N. Natarajan for constant help and
support in preparing the report.
Capacity building for fiscal reforms or for that matter any reform is a continuous process.
In the course of executing the TA, we have set up the base and provided the initial push
for building capacity in the State. It is hoped that the State government will carry the effort
forward to provide congenial environment, efficient and responsive institutions and
competent and committed set of officials for carrying out fiscal reforms.
Director
NIPFP

Study Team
Mr. A. Premchand
Dr. M. Govinda Rao
Dr. Pratap Ranjan Jena
Dr. N.J. Kurian
Mr. Ram Parkash Katyal
Mr. Salil Kumar Sanyal
Dr. R.K. Mishra
Assisted by:
Mr. B.R. Atre (Legal Expert)
Mr. Sukumar Mukhopadhyay (Administrative and Legal Expert)

ADB TA No. 4297-IND, Inception Report
Capacity Building For Fiscal Reforms in Sikkim
Contents
Executive Summary i-ix
Part I
Introduction
1. Introduction 1
1.1. Introduction 1
1.2. Scope and Structure of the Report 2
1.3. Issues in Fiscal Consolidation in Sikkim 3
Part II
State Finances of Sikkim: Reform Issues
2. Government Finances: An Overview 8
2.1. Trends in Government Finances 8
2.2. Employment and Salaries in Sikkim 10
2.3. Implications of Twelfth Finance Commission (TfFC)
Recommendations on Revenues of Sikkim 12
2.4 Alternate Scenarios 17
3. State Tax and Non-tax Revenues and Reform Issues 30
3.1 Profile of State Taxes: An Introduction 30
3.2 VAT in Sikkim: Introduction 32
3.3 Adoption of VAT in Sikkim: Critical Policy and Operational Issues 33
3.4 Administrative Restructuring Plan for Commercial Tax Department 40
3.5 Functional Reorganisation of Administration in the Sales Tax Department 44
3.6 Training and Public Awareness Programme for VAT in Sikkim 50
3.7 Taxes on Income Levied Under State Laws 51
3.8 State Excise Duty 55
3.9 Motor Vehicle Tax 57
3.10 Land Revenue, Stamps and Registration Fees 59
3.11 Non-tax Revenue: Sikkim 61
3.11.1 Social and Economic Services: Revenue Consideration 63
3.11.2 Interest Receipts and Dividends 64
3.11.3 Non-tax Revenue: Issues Pertaining to Provision of
Services and Cost Recovery 65
3.11.4 Cost Recovery in Social and Economic Services 66
4. Debt Restructuring and Contingent Liabilities 70
4.1 Debt Restructuring 70
4.2 Contingent Liabilities of the State Government 73
Part III
Expenditure Management Budget Making
Improving Economic Policy Making
5. Expenditure Management and Budget Making 77
5.1. Current Practice of Expenditure Management and Budget Making 77
5.2. Budgetary Process and Policy Planning: An Evaluation 78
5.3. Budget and Fiscal Policy Making: Emerging Issues 81
5.4. Expenditure Management and Budget Making Process: Proposed Reforms 83
5.4.1 Fiscal Responsibility Legislation 84
5.4.2 Preparation of Economic Outlook 85
5.4.3 Policy Indicators 85
5.4.4 Strengthening Annual Budget Making 86
5.4.5 Management of Central Transfers 90
5.5. Budget Implementation 94

ADB TA No. 4297-IND, Inception Report
Capacity Building For Fiscal Reforms in Sikkim
5.6. Practice of Expenditure Management: Four Areas 94
5.7. Procurement and Contracting Out 99
5.8. Payments and Accounting 99
5.9. Financial Management in Spending Departments 99
5.10 Transparency and Accountability 99
5.11 Staff Training 100
5.12 Expenditure Management in Lower Levels of Government 100
5.13 E-Governance 102
5.14 Implementation Issues 105
6. Design of Government 106
6.1 Reasons for Enquiry 106
6.2 Way Forward 107
6.3 Adjustment Process and Costs 108
6.4 Administrative Reorganization and Personnel Adjustment 109
7. Department of Finance: A Revised Structure 116
Part IV
Restructuring of Public Sector Enterprises in Sikkim
8. Restructuring of Public Sector Enterprises in Sikkim 118
8.1 Introduction 118
8.2 SLPEs in Sikkim: Classification and Structure 119
8.3 Investments and Financial Performance of SLPEs in Sikkim 121
8.4 Characteristics of SLPEs in the State of Sikkim 125
8.5 Restructuring SLPEs in Sikkim: Basic Approach 127
8.6 Policy of GoS on Disinvestment/Privatisation 128
8.7 Scope for Restructuring SLPEs 130
8.8 Identifying SLPEs for Restructuring 131
8.9 Modalities of Restructuring and Privatisation of SLPEs 134
8.10 Privatisation Method 137
8.11 Requirements for Restructuring 137
8.12 Restructuring Plan 137
Part V
Improving Statistical Infrastructure
Methodology for State Domestic Product and Survey Methodology
9. Improving Statistical Infrastructure 147
9.1 Statistical Infrastructure and Role of DESME 147
9.2 Household Consumer Expenditure Surveys (HCES) and Poverty Estimation 150
9.2.1 The NSSO Methodology for HCES 151
9.2.2 Steps for Improvement 152
9.2.3 Exercises on Poverty Estimation 153
9.2.4 HCES & Poverty Estimation 153
9.3 Problems and Issues relating to Poverty Estimation for Sikkim 154
9.4 Plan for Poverty Estimation 155
9.5 Derivation of Poverty Line 156
9.6 Report on ‘Training Program of Officials of The Sikkim Statistical Services’ 159
9.6.1 Curriculum for Survey Methodology 159
9.6.2 Curriculum for Poverty Estimation 161
9.7 State Income, Capital Formation and Saving 163
9.8 Terms of Reference 164
9.9 Revision of the Estimates of State Domestic Product 165
9.10 Revised Estimates of GSDP at Current Prices 168
9.11 Revised Estimates at Constant (1993-94) Prices 168
9.12 Suggestions/Recommendations 169
9.13 Methodology for Estimation of Capital Formation 174

ADB TA No. 4297-IND, Inception Report
Capacity Building For Fiscal Reforms in Sikkim
9.14 Preliminary Estimates of Gross Fixed Capital Formation 175
9.15 Suggestions/Recommendations 177
9.16 Methodology for Estimation of Saving for Sikkim 178
9.17 Suggestions/Recommendations 180
9.18 Training in State Income, Capital Formation and Saving 180
10. Poverty Estimation for Sikkim and Related Issues 182
10.1 Official Poverty Estimates and Alternate Estimates 183
10.2 Decline in Average Calorie Intake 184
10.3 Official Poverty Ratio for Sikkim – An Appraisal 185
10.4 Estimation by Proxy 186
10.5 D-G Estimates 187
10.6 Bias in D-G Estimates 189
10.7 The BPL Census 189
10.8 Why BPL Census Cannot Provide an Estimate of Poverty? 190
10.9 Poverty Ratio through Complete Enumeration (Economic Survey 1999) 191
10.10 Price Statistics 192
10.11 Point Estimation of Poverty Line 193
10.12 Methodology for Obtaining Average Calorie Intake and Data Sets 193
10.13 Results 194
10.14 Minimum Calorie Intake in Rural Sikkim 195
10.15 Search for a Poverty Line for Sikkim 196
10.16 Adequacy of Sample Size 197
10.17 Poverty Line based on Smoothed Distribution 200
10.18 Case for a Fresh Survey 201
10.19 Alternative Method 202
10.20 Capacity Building for Poverty Estimation 202
10.21 Summary 203
Annexures
1.1 The Implications of TfFC Report on State Finances of Sikkim 206
2.1 Important Indicators of Trends in State Finances 208
2.2 Pre-Devolution Non-Plan Revenue Surplus/Deficit(-) 208
2.3 Post Tax Devolution Non-Plan Revenue Surplus/Deficit(-) 209
2.4 Grant-in-aid for Non Plan Revenue Deficit (2005-10) 209
2.5 Projection of Baseline and Reform Scenarios 210
8.1 Profile of SLPEs in Sikkim in 2001-02 214
8.2 Profile of SLPEs in Sikkim in 2002-03 215
8.3 Profile of SLPEs in Sikkim in 2003-04 216
8.4 Resource Mobilization by SLPEs in 2003-04 217
8.5 Profit Performance of SLPEs in 2003-04 218
8.6 Characteristics of SLPEs in the State of Sikkim 219
8.7 Subsidies of SLPEs 240
8.8 Questionnaire: Financial and Other Related Information on SLPEs 242
8.9 Schedule on Internal Organisation and Structure 247
8.10 Valuation of SLPEs as on March 31, 2004 253
8.11 Restructuring cost as on March 31, 2004 254
8.12 Savings from Privatisation/Winding up of Nine SLPEs 255
8.13 Enterprise wise Restructuring Plan 256
9.1 Gross State Domestic Product at Factor Cost by Industry of Origin at Current Prices 288
9.2 Gross State Domestic Product at Factor Cost by Industry of Origin at Constant Prices 289
9.3 Net State Domestic Product at Factor Cost by Industry of Origin at Current Prices 290
9.4 Net State Domestic Product at Factor Cost by Industry of Origin at Constant Prices 291
9.5 Manual for Estimation of Capital Formation for Sikkim by R.P. Katyal 292

ADB TA No. 4297-IND, Inception Report
Capacity Building For Fiscal Reforms in Sikkim
Appendices
1.1 List of Meetings 299
3.1 Training Programme on Value Added Tax: Schedule of Lectures 302
3.2 Average Score assigned by the Participants 302
List of Tables
1. Important Indicators of Fiscal Performance as % of G.S.D.P. 8
2. Expenditure on Salaries Relative to Revenue Expenditures (excluding Interest
Payments and Pension) 14
3. State wise Number of Government Employees 14
4. Total Salary Per Employee in NEC States 14
5. SIKKIM: Employment and Salaries in 2004-05 15
6. What Sikkim Gets by way of Devolution and Grants-in-aid on the Basis of TfFC Report 15
7. Total Finance Commission Transfers to North Eastern States 16
8. Assessed Own Revenue Receipts and Non-Plan Revenue Expenditure of Sikkim 17
9. Baseline Scenario: Sikkim 19
10. Baseline Scenario: Sikkim (Ratio to GSDP) 20
11. Reform Scenario: Sikkim (Capital Outlay Growth: 12%) 24
12. Reform Scenario: Sikkim (Ratio to GSDP, Capital Outlay Growth 12%) 25
13. Reform Scenario: Sikkim (Ratio to GSDP, Capital Outlay Grwoth 10%) 26
14. Own Tax GSDP Ratio of Special Category States 30
15. Trends in Own Tax Revenue 32
16. Trends in Sales Tax Revenue 35
17. Composition of Sales Tax Revenue from Different Sources 2003-04 37
18. Turnover Range-wise Tax Payers and Tax Paid (2002-03) 42
19. Income Tax Realized from Different Sources 53
20. Non-tax Revenue in Sikkim 62
21. Non-Tax Revenue Percentage to Revenue Expenditures 64
22. Cost Recovery in Social Services 67
23. Cost Recovery in Economic Services 68
24. Composition of State Government Debt 74
25. Maturity Profile of Outstanding State Government Market Loans at End March 2004 75
26. Debt Indicators for Sikkim and other North East States 75
27. Calculation of Incentive for Debt Relief Based on Fiscal Performance in NEC States 76
28. Formulation of Revenue Estimates 87
29. Formulation of Expenditure Estimates 89
30. Sikkim: Monthly Flows of Receipts and Expenditures 95
31. Expenditure Control in Practice: Four Cases 96
32. Statement showing Total Regular, Work charged and M.R. Employees 110
33. Sikkim: State Government Employees and Salary Expenditure 111
34. Sikkim: Expenditure on Policy Formulation and Management 112
35. Manpower 121
36. Investment in SLPEs 122
37. Debt-Equity Ratio 123
38. Net Profit/Loss to Total Investment 124
39. Cost and Returns from Investments in SLPEs 127
40. Three Dimensional Matrix and SLPEs 132
41. Categorization of SLPEs as per Three Dimensional Matrix 135
42. Anticipated Benefits of Modalities 136
43. Suggested Status of SLPEs 139
44. Quality of Interface with the GoS 141
45. Composition of Boards of the SLPEs in Sikkim 143
46. Comparative Statement of Revised Pre-revised Estimates of GSDP of Sikkim 170
47. Comparative Statement of Revised and Pre-revised Estimates of NSDP of Sikkim 171

ADB TA No. 4297-IND, Inception Report
Capacity Building For Fiscal Reforms in Sikkim
48. Gross State Domestic Product at Factor Cost by Industry of Origin 172
49. Net State Domestic Product at Factor Cost by Industry of Origin 173
50. Gross Fixed Capital Formation of Sikkim in 1999-00 and 2000-01 177
51. Poverty Head Count Ratio: Alternative Estimates, 1999-00, Rural 184
52. Some Selected Estimates Relating to Calorie Intake and Poverty in Rural Sector: 1999-2000 185
53. Number and Percentage of Population Below Poverty Line in Sikkim From 1973 to 1999 186
54. Per Thousand Distribution of Persons by MPCE Class for Rural and Urban Sectors
of Assam, Sikkim and Manipur, 1999-2000 (55th
Round, NSS) 187
55. D-G Poverty Lines (Rs.) for rural and urban Sikkim 188
56. Head Count Ratio for Sikkim According to Dubey-Gangopadhyay (1998) 188
57. Average Calorie Requirement for Rural and Urban Population of Sikkim 195
58. Per Capita Per Diem Calorie-intake by MPCE Class, 55th
Round, 1999-00, Rural Sector 196
59. Per Capita Per Diem Calorie Intake by MPCE Classes, 50th
Round, 1993-94, Rural Sector 196
60. Calorie Intake in North eastern States 197
61. Per Capita per diem calorie-intake (K cal) by MPCE Classes 60th
round (2003):
Rural Sikkim 199
62. Actual and smoothed per capita per diem calorie-intake for rural Sikkim 200
63. Estimated Per Capita Per Diem Calorie Intake for 1999-2000 From 50th
Round and
60th
Round 201
List of Figures
1. Total Revenue Receipts Percentage to GSDP 27
2. Total Revenue Expenditure Percentage to GSDP 27
3. Revenue Surplus Percentage to GSDP 27
4. Fiscal Deficit % to GSDP (Reform 1: 12% & Reform 2: 10% capital outlay growth) 28
5. Outstanding Debt % to GSDP (Reform 1: 12% & Reform 2: 10% capital outlay growth) 28
6. Annual Growth Rate of Own Tax Revenue 31
7. Organisational Chart of Tax Department in Sikkim 43
8. Headquarters Organisation 48
9. Organisation of Regional Office 49
10. Income Taxes under State Laws Percentage to GSDP 51
11. State Excise Duty Percentage to GSDP 57
12. Sikkim: Budget Cycle 79
13. Central Transfers to States – Cycle of Operations 92
14. Central Transfers to Sikkim: Actual for 2003-04 (in Rs. Crore) 93
15. Sikkim: Revised Budgetary Process (to be operated on computerised basis) 98
16. Sikkim: Proposed Departmental Structure 113
17. Sikkim: Departments and Divisions 114
18. Sikkim: Departmental Structure – An Illustration 115
19. Proposed Reorganization of the Department of Finance and Planning 117
20. Market Structure 120
21. Three Dimensional Matrix 131
22. Two-by-Two Matrix 131
23. Two-by-Two Matrix and SLPEs 133
List of Boxes
Box I. Fiscal Reform Measures taken by Government of Sikkim 9
Box II. Institutional and Administrative Bottlenecks 10
Box III. FRBM Act for Sikkim – Some Considerations 29
Box IV. Sikkim State Taxes: Reform Agenda 60
Box V. Sikkim State Government’s Guarantee Policy 74
Box VI. Performance Oriented Budget: An Illustration 82
Box VII. Policy of Government of Sikkim on Disinvestment and Privatization 126
Box VIII. Recommendations regarding Individual SLPEs 146
Budget: An Illustration

Acronyms Used in the Report
ADB Asian Development Bank
AIDIS All India Debt & Investment Surveys
ASWPR Age-specific-worker-population
BEL Bharat Electronics Ltd.
BHEL Bharat Heavy Electrical Ltd.
BPL Below Poverty Line
BRO Border Road Organization
C&AG Comptroller and Auditor General of India
CBEC Central Board of Excise and Customs
CEOs Chief Executive Officers
CFC Consumption of fixed capital
CIC Community Information Centers
CPIAL Consumer Price Indices for Agricultural Labour
CPIIW Consumer Price Index for Industrial Workers
CPIMR Consumer Price Index for Middle Rural Population
CPIMU Consumer Price Index for Middle Urban Population
CPINM Consumer Price Index for Non-manual Urban Population
CPITR Consumer Price Index for Total Rural Population
CPITU Consumer Price Index for Total Urban Population
CPWD Central Public Works Department
CRF Calamity Relief Fund
CRM Customer Relationship Management
CSF Critical Successful Factors
CST Central Sales Tax
CTV Colour Television
DCU Departmental commercial undertakings
DESME Directorate of Economics & Statistics, Monitoring and Evaluation
DPD Data Processing Division
DPD Data Processing Division
EFC Eleventh Finance Commission
EMBO Employee and management buy out
EOI Expression of Interest
FCI Food Corporation of India
FOD Field Operations Division
Fsu First stage units
GFCF Gross Fixed Capital Formation
GFPF Government Fruit Preservation Factory
GIS Geographical Information System
GOI Government of India
GoS Government of Sikkim
GPF General Provident Fund
GSDP Gross State Domestic Product
HCES Household Consumer Expenditure Surveys
HCR Head Count Ratio
HDI Human Development Index
HDR Human Development Report
HMT Hindustan Machine Tools Ltd.
IAS Indian Administrative Service
ICMR Indian Council of Medical Research
IDBI Industrial Development Bank of India
IFIs International Financial Institutions
IMFL Indian Manufactured Foreign Liquor
IT Information Technology

Kcal Kilo calorie
Kmpl Kilometers per liter
LB Labour Bureau
LIC Life Insurance Corporation
MIS Management Information System
MLA Member of Legislative Assembly
MoU Memorandum of Understanding
MPCE Monthly per capita expenditure
MRP Mixed reference period
MTPA Medicine and Toilet Preparation Act
MV Motor vehicles
MW Mega Watts
NABARD National Bank for Rural Development
NAD National Accounts Division
NCDC National Co-operative Development Corporation
NDCUs Non-departmental commercial undertakings
NEC North Eastern Council
NFCF Net fixed capital formation
NH National Highway
NHPC National Hydro Power Corporation
NIPFP National Institute of Public Finance and Policy
NIC National Informatics Centre
NPAs Non-Performing Assets
NSSO National Sample Survey Organization
O&M Operation and maintenance
OBCs Other Backward Castes
OPTIMA Optimum Performance through Internal Management System
PC Planning Commission
PDS Public Distribution System
PEs Public Enterprises
PHC Primary Health Centre
PHE Public Health Engineering
PHSC Primary Health Sub-Centre
PPP public-private-partnership
PPS Probability Proportional to Size
PRI Panchayati Raj Institutions
PSUs Public Sector Undertakings
PWD Public Works Department
RAC Committee on Regional Accounts
R&D Research & Development
RBI Reserve Bank of India
RC Restructuring Cost
RE Revised Estimates
RTC Road Transport Corporation
SAIL Steel Authority of India Limited
SABCCO Scheduled Caste, Scheduled Tribe, Other Backward Class
Development Corporation Limited
SBS State Bank of Sikkim
SBU Strategic business units
SCs Scheduled Castes
SDP State Domestic Product
SDRD Survey Design & Research Division
SGSY Swaranjayanti Gram Swarozgar Yojana
SHL Sikkim Hatcheries Ltd.
SIDBI Small Industries Development Bank of India

SIDICO Sikkim Industrial Development and Investment Corporation Ltd.
SIMFED Sikkim State Co-operative Supply and Marketing Federation Ltd.
SISCO Sikkim State Co-operative Bank Ltd.
SITCO Sikkim Time Corporation Limited
SIU State Income Unit
SJL Sikkim Jewels Ltd.
SLPDC Sikkim Livestock Processing and Development Corporation
SLPEs State Level Public Enterprises
SMC Sikkim Mining Corporation
SNT Sikkim Nationalised Transport/State Nationalised Transport p.229
SPCIL Sikkim Precision Industries Limited
SPDC Sikkim Power Development Corporation
SPDCL Sikkim Poultry Development Corporation Ltd.
SPIL Sikkim Precision Industries Ltd.
SRSWR Simple random sampling with replacement
SRSWOR Simple random sampling without replacement
SRTU State Road Transport Undertaking
SS Stainless steel
SSNP Social safety net programme
Ssu’s second stage units
ST Sales Tax
STs Scheduled Tribes
STC State Trading Corporation
STCS State Trading Corporation of Sikkim
STDC Sikkim Tourism Development Corporation
SWOT Strengths, Weaknesses, Opportunities, and Threats
TA Technical Assistance
T&D Transmission and Distribution
TDS Tax Deducted at Source
TfFC Twelfth Finance Commission
TGR Trend growth rate
TOR Terms of Reference
TOT Turn over tax
TF Task Force
UPA United Progressive Alliance
URP Uniform reference period
USA United States of America
VAT Value Added Tax
VRS Voluntary Retirement Scheme
VSNL Videsh Sanchar Nigam Limited

i
Executive Summary
Capacity Building for Fiscal Reforms in Sikkim
A. Introduction:
Sikkim, a small principality nested in Himalayas acceded to the Indian Union in 1975. In the years
that followed, the state has made remarkable progress in establishing systems and institutions, and
in building administrative capacity. Despite this, the capacity of the state to design and implement
fiscal policies and to undertake prudent fiscal management is limited. Establishment of
institutions, creating enabling environment and building human capacity to implement policies in
the State’s domain are extremely important for accelerating growth and reducing poverty in the
state.
The need for strengthening the capacity for calibrating fiscal policies in the state arises for a
variety of reasons. First, developmental challenges in the state have become more complex over
the years and the state must acquire the basic capabilities for calibrating policies. Second,
implementation of fiscal restructuring programme recommended by the Twelfth Finance
Commission (TFC) involves substantial strengthening of the state administration to effectively
undertake fiscal management. Third, the decision to levy value added tax (VAT) by the state with
effect from April 1, 2005 has necessitated creating the entire institutional, legal and administrative
structure to implement this tax. Fourth, the existing government structure is top heavy and needs
to be geared to improve efficiency. Finally, the state suffers from virtually non-existent
information system, and where it exits, poor quality information and data hinder policy calibration.
B. Objectives of the TA:
The Technical Assistance (TA) on ‘Capacity Building for Fiscal Reforms in Sikkim’ sponsored by
the Asian Development Bank was initiated from December 2004 to undertake an in-depth review
of the existing systems and institutions and recommend policies and arrangements to enhance the
capacity of the State to prudently manage its public finances. Specifically, the TA was expected to
address the capacity development for calibrating the tax system, expenditure management and
functioning of Public Sector Undertakings. The TA was also required to build foundations for
creating the basic management information system for planning and its implementation. Besides,
it had to augment the capacity to conduct surveys to periodically bring out the poverty profile in
the State. Furthermore, it was expected that the officials of the state government should be
adequately trained in fiscal management.

ii
The report has dealt with both the immediate requirements of the state and medium and long term
requirements of capacity development. Preparing the state to replace the existing cascading type
sales tax with the VAT was an immediate requirement. Similarly, building capacity for
strengthening the data and information system by providing short term training to the officials of
the Directorate of Economics and Statistics in poverty estimation, and in the estimation of savings
and capital formation also had to be undertaken with urgency. The medium and long term
measures meant undertaking a more detailed survey of the needs for enhancing the capacity for
fiscal policy calibration and creation of a road map specifically tailored to the requirements of
Sikkim. Thus, the report is at once a statement of the progress made in selected areas, and is also
an action plan for addressing the broader institutional, systemic, and operational aspects of
formulation and implementation of fiscal policies.
C. Government Finances: An Overview
Government finances of Sikkim are heavily dependent on central transfers. Indeed, central
transfers account for more than a half of the state domestic product. Like in other states, the fiscal
health in Sikkim too deteriorated significantly during the concluding years of the last decade. The
principal reasons for this are, (i) adoption of central pay scales for the state government employees
irrespective of paying capacity, (ii) deceleration of own tax revenue growth on account of
industrial recession; (iii) shortfall in central transfers; and (iv) growing debt servicing burden.
The Government of Sikkim has taken several measures to deal with fiscal stress which include (i)
freezing of fresh recruitment; (ii) introduction of VRS on a selective basis; (iii) restructuring of
public enterprises; and (iv) improving tax and non-tax revenue efforts. These steps, however, had
only a limited impact on the overall finances of the state. If the present trend continues, the state
government will not be able to achieve the financial targets of the Tenth Plan.
The growth of salary expenditure in Sikkim was the highest among the states during the last
decade. In fact, the State had the dubious distinction of doubling the salary expenditure in 1998-99,
the year in which pay revision was carried out. While a state like Sikkim, which has limited
employment opportunities outside the Government will continue to have pressure on government
employment, the logic of high average salary expenditure is difficult to explain, much more
difficult to justify.
A comparative picture of TFC recommended transfers to Member States of the North Eastern
Council shows that Sikkim gets the lowest amount of non-plan revenue deficit grant of Rs. 188.67
crore for the five year period. This is due to some measures of overestimation in revenues and
underestimation in expenditures by the Finance Commission. The overestimation in own revenue

iii
projection arises from assuming that the high growth rates of the past five years will continue.
Similarly in the case of non-tax revenues, the high base of net receipts from lotteries in 2002-03
has contributed to overestimation. This is likely to add to the fiscal stress of the state.
Baseline Scenario
Under the baseline ‘business as usual’ (BAU) scenario, it will not be possible to create fiscal
parameters that will conform to any fiscal responsibility legislation. In this scenario, the State will
not maintain the revenue surplus of the base year in none of the subsequent years. Thus, to
maintain the past growth of capital outlay during the TFC award period, the state will have to
increase fiscal deficit significantly unless some appreciable reform measures are undertaken. This
underlines the importance of undertaking reforms in both revenue raising and expenditure
compression and reallocation.
Fiscal Reforms
The proposed fiscal reforms in Sikkim involve the following:
Introduction of value added tax (VAT) with effect from April 2005.
Reform of Sikkim Income Tax Act 1970.
Rationalisation of structure and operation of other important State taxes.
Improving non-tax revenues especially by reducing subsidies to power and transport sectors.
This has to be achieved mainly by improving the operational efficiency of these departments
and partly by raising user charges.
Restructuring and reforming State Enterprises. Closing down or privatising enterprises which
are loss making and not serving any significant social objectives.
Securing economies in government expenditure while improving the capacity of the
government for policy making and delivery of services.
Making adequate provision for non-wage O&M expenditures.
Discontinuing the past practice of regularising work-charge and muster roll workers.
Outsourcing feasible activities.
The overall revenue expenditure of the government should come down to about 50 percent of
the GSDP in the medium term as compared to 55 percent in the base year.

iv
Reform Scenario
Under the recommended reform scenario, the total revenue expenditure relative to GSDP will
come down from 55 percent in the base year to 51 percent in the terminal year of the forecast
period. The compression of revenue expenditure more or less balances the reduction in revenue
receipts due to lower non-plan grants. Consequently, revenue surplus will remain more or less
constant throughout the forecast period and the condition associated with the proposed fiscal
responsibility legislation - of maintaining the revenue surplus during the forecast period will be
satisfied. Outstanding debt-GSDP ratio will come down from 73 percent in the base year to 60 per
cent in the terminal year assuming that capital outlay will grow at 12 per cent.
D. Important Capacity Building Initiatives:
(i). Capacity building for Value Added Tax:
An important term of reference in the TA related to the (i) preparation of detailed VAT
implementation plan addressing the concerns of various sectors including retail businesses; (ii)
prepare the VAT law suiting to the conditions prevailing in Sikkim based on the model law
prepared by the central government; (iii) prepare the administrative restructuring plan
encompassing computerization of the department; and (iv) design and deliver the training program
for VAT collectors and identify appropriate short term training program for the training of
trainees.
The introduction of VAT reform coincided with the TA and, therefore, capacity building had to be
synchronized with the calibration of reforms. Thus, the most important aspect of the TA in regard
to VAT implementation was that there was no lead time whatsoever and the expert team had to
work closely with the tax department to implement the VAT by April 1, 2005.
The structure of VAT evolved though consensus in the Empowered Committee of State Finance
Ministers had to be adjusted to suit particular situation in Sikkim. A series of training programmes
for the officials of the department and in other departments related to the structure of VAT, its
administration and accounting aspects were conducted. The basic training programmes were
conducted before the VAT introduction and the training programmes relating to accounting,
auditing and risk assessment were undertaken immediately after the introduction. In this task, the
National Informatics Centre (NIC), which is entrusted with the task of computerization of tax
administration in Sikkim was also involved in the training. In addition to the training
programmes, a series of awareness programmes for the members of trade and industry, industry
associations, Ministers in State Cabinet, senior officials of the State government and prominent
citizens of the state were conducted in various parts of the state. This has helped to gain better

v
understanding of the operation of the tax. The TA also involved drawing up the organizational
restructuring plan on functional lines.
(ii). Reform of other state Taxes
There are a number of problems associated with the income tax in Sikkim. The structure is not
progressive and does not confirm to basic canons of the tax system. It has the potential to distort
economic decision making especially in production and trading activities. A major problem
relating to this tax is its presumptive nature and on businesses, the tax is nothing but a turn over
tax. Continuation of TOT when VAT is levied is an aberration. There are advantages in
implementing central income tax in Sikkim. The tax can be made more progressive, there would
be revenue gains in the long run, and low income Sikkimese will get significant relief. Even if the
State laws are to continue, immediate attention needs to be given to removal of TOT and make the
tax system more progressive.
The report has made detailed recommendations for the reform in the structure and operation of
other important state taxes such as excise duty on alcoholic products, motor vehicles tax and stamp
duties and registration fees. Implementation of these recommendations could improve the revenue
productivity of the tax system.
(iii). Reform of Non-tax Revenue
Non-tax revenue in States comprise of receipts such as interest receipts on loans given by the state
government, dividends on equity investments, user charges on services provided by the
governments that spans over social and economic sectors, royalty on mines and minerals, receipts
from forestry and wild life, lottery income and other miscellaneous receipts. In Sikkim, in addition
to these sources of non-tax revenue, receipts from power and transport sectors are also classified
under non-tax revenue as these are managed by government departments. Low user charges have
affected the cost recovery resulting in significant implicit subsidies. The proliferation of subsidies
in various sectors has adversely affected the quality of government services and the people who
solely depend upon it. One important feature of non-tax revenue in Sikkim is the significance of
income from lottery, which is not a stable source of revenue. Most PSUs in the state do not remit
any dividends. The average effective return from the government investments during the last four
years works out to a mere 0.89 percent. The TA has examined in detail the various reform options
for improving efficiency, enhancing user charges, closing down and privatizing identified
enterprises in the state.

vi
(iv). Expenditure Management and Budget Making:
Subnational public expenditure policy should conform to the objectives of macroeconomic
stability and ensure allocative and technical efficiency in spending. The TA has identified a
number of problem areas in Sikkim. In general, the prevailing system focuses on the application
of financial and legal controls in the collection and disbursement of monies. Not surprisingly, the
budget has become a weak link in policy planning and in the overall management of the economy.
The annual budget process is too traditional, inadequate for the purposes to be served, and is in
dire need of improvement. The major problems are: (i) The schism between Plan and non-Plan
approaches is deep rooted that it segments the budgets and prevents a holistic view; (ii) The
circulars are routine in nature and do not illumine the economic conditions forming the backdrop
for the annual budget, nor does it identify the areas where economies are to be procured or the
steps being taken or proposed to be taken leading to an improvement in the delivery of services;
(iii) The budget review is based on running outlays in terms of norms, and usually adjustments are
made at the margins; (iv) Guidelines for the formulation of project estimates are either
circumvented or are not adhered to, and contracted prices tend to be vastly different from the
estimates made in-house; and (v) Control of staff is partly centralized and partly decentralized.
A major choice in the improving the fiscal management capacity relates to the strengthening of the
administrative process and enactment of legislation. A complementary requirement is the
preparation of the improvement of budgetary process in terms of three stages– medium term
budgeting; formulation of estimates (revenue and expenditure), and the budgetary process itself.
The TA deals in considerable detail all the aspects of expenditure management and control systems
– both internal and external. The TA undertakes a detailed analysis of four areas, viz., policy,
personnel, poverty alleviation programmes and public works and makes detailed recommendations
for improving the design and implementation policies and strengthening the capacity of the
government to calibrate fiscal reforms.
(v). Responsive and accountable institutions
Revamping administrative machinery to make them responsive and accountable is an important
component of capacity building reform. In reorganizing the administrative structure, it is
important to keep in view the following: (i) with the full implementation of the 73rd
amendment of
the Constitution, albeit, in a phased way, more and more tasks will be devolved to the district level
of administration; (ii) The excessive fragmentation and layering should be avoided and levels of
processing of subjects should be reduced to the minimum; (iii) The establishment of Gangtok as a
Municipality would lead to the transfer of work to a lower level; and (iv) gradual introduction of e-

vii
governance in several fields and the administrative processes need to be abridged. Accordingly, a
new departmental structure has been formulated that envisages a consolidation of 42 departments
into 15 without any loss of efficiency. This should, however, be undertaken in a phased manner.
In doing so, computerization should be progressively introduced.
(vi). Restructuring Public Enterprises
The State Level Public Enterprises (SLPEs) are an important component of the economy of the
State of Sikkim. 22 SLPEs covered in this study had an investment of Rs 726.06 crore as on March
30, 2004. The financial performance of the SLPEs was discouraging in that in aggregate terms,
they registered accumulated losses to face capital erosion. Analysis of the management and
operations of the SLPEs reveals that: their social purpose is very low; departmental enterprises
dominate the investment scenario; the utility enterprises have a major chunk of investment; their
wage cost is very high; no R&D facilities exist in these enterprises; no financial and management
systems are in vogue; strengths are far less as compared to weaknesses and so is the case between
opportunities and threats; government - enterprise interface is very low; and most of the enterprises
have not formulated performance improvement plans.
Detailed analysis of 22 enterprises has helped to draw up a plan of restructuring. The enterprises
which are of promotional and welfare oriented could continue but their focus should be on
promotional and welfare activity. Enterprises which are best run by the private sector should be
privatized. Enterprises provided public utility services need to be corporatised. In cases the
recommendation is to continue, there is need to make these into professional organisations and not
employment creating agencies. The report makes specific recommendations on the reform of each
of the enterprises and also recommendations on enterprise specific micro restructuring plans.
(vii). Capacity building for Statistical System
The data base for economic policy making is the responsibility of the State Statistical Cadre of
about 140 officials. Except for a few, every department has a statistical cell. The Department of
Economics, Statistics, Monitoring and Evaluation (DESME) is vested with the responsibilities
inter alia of estimating state income, conduct of sample surveys and collecting data on prices. The
nature of work in other departments is by and large limited to compilation of data and cadre
officials are mostly engaged in activities such as correspondence, file dealings and progress
reports. Since long there are no direct recruits to the cadre and the posts are filled up through
promotion. There is an urgent need to review of the cadre and bring in qualified personnel to build
capacity.

viii
The role of DESME in this scenario is of utmost value in the sense of not only effective
coordination but to do justice to the three main activities mentioned. The report brings out several
serious shortcomings in the functioning of the department. At present, the capacity of the
Department to collect data on professional manner is limited and these not are effectively used to
generate the information needed for planning.
(viii). Estimating Poverty: Critical Issues
An important strategy adopted in building the capacity of the officials of the DESME was
to work with them in analysing the data from the state sample of NSS consumer expenditures to
estimate poverty in the state. The consultants worked closely with the officials to estimate poverty
in the state. It is strongly recommended that a select few qualified cadre officials should be sent to
the Labour Bureau for training in their methodology of estimating the cost of living.
An important component of the capacity building was the two training programmes
conducted for the benefit of the state officials. The first was designed to provide the basics of
sampling and household surveys with particular reference to HCES. The second was designed to
familiarize the trainees with the rudiments of concept of poverty and its measurement. The focus
was on the exposition of the official method adopted by the Planning Commission, followed by the
implications of proxy estimation and the reasons why Sikkim even after decades does not have a
poverty line. Looking at these specialized training courses it was felt that statistical officials,
assistant directors and senior officers should have basic training in statistics, NSS surveys,
sampling theory and applications, report writing and computer processing of data.
(ix). State Income, Capital Formation and Saving
The estimate of state domestic product (SDP) is the foundation for estimating saving and capital
formation. The available estimates of SDP at the beginning of the project showed abnormal growth
since 1993-94. Preliminary review indicated that the standard methodology recommended by the
Central Statistical Organization (CSO), was not being followed appropriately in some cases. As an
integral part of the effort devoted to the compilation of SDP data, estimates are also compiled for
capital formation and saving.
Under the TA, estimates of State Domestic Product of Sikkim at current and constant prices have
been thoroughly revised and the Manual on Estimation of Capital Formation has been prepared.
Preliminary estimates as per the concepts and the suggested methodology have been compiled by
the SIU for 1999-00 to 2000-01 separately for the public sector as well as for the whole economy.
The Methodology for the estimation of saving has been suggested though, so far, no state has been
making such estimates.

ix
E. In Conclusion
The TA has helped to strengthen the prevailing systems and institute new systems where none
existed for scientific fiscal management in the state. This has also provided the much needed
training programme and indicated where further efforts at building capacity need to be focused on.
It has not only helped the state to gear up to the challenges of undertaking short term reforms but
also has established a base for carrying out the capacity building initiative further. The TA was
implemented not merely with the objective of completing the tasks assigned but to walk with the
state government departments as partners in building systems, institutions and training the
personnel.
It must be mentioned that any capacity building TA can only establish the base and address the
immediate capacity requirements of the state government. Capacity building is a continuous
process and will have to be augmented to deal with changing situations and technology. It is in
this regard the recommendations made in the report for augmenting the capacity of various aspects
of administration are relevant. The consultants have helped to create a base and the report
provides a clear road map for future. We are sure that the well meaning and inherently competent
officials of the state with enlightened political leadership will take this reform forward.

ADB TA No. 4297-IND, Final Report
Capacity Building For Fiscal Reforms in Sikkim
1
1. Introduction
1.1 Introduction
The Technical Assistance (TA) funded by the Asian Development Bank, for „Capacity Building
for Fiscal Reforms in Sikkim‟ was implemented from December 2004. The Project‟s mandate was
to undertake an in-depth review and recommend policies and institutional arrangements relating to
the management of the public finances in the state and related supporting administrative structures.
More specifically, it was expected that the tax structure, expenditure management system,
functioning of the Public Sector Undertakings, as well as the statistical infrastructure relating to
the estimation of saving and capital formation in Sikkim, and consumption expenditure surveys for
the estimation of poverty profile in the State were required to be reviewed in detail. As a part of
the study, the issues, whether of a policy or systemic or operational nature were to be identified
and a road map containing the next steps was to be prepared; further, where necessary, immediate
assistance was to be extended to implement the reforms and to provide training to the operational
officials in selected areas.
In pursuance of the above objectives, a team was formed comprising the following members: A.
Premchand (Team Leader), Pratap Ranjan Jena (Deputy Team Leader), M. Govinda Rao1
(International Value Added Tax Expert), N.J. Kurian (International Public Finance Specialist),
R.K. Mishra (Public Enterprise Restructuring Specialist), S.K. Sanyal (Sample Survey Expert) and
R.P. Katyal (State Income Estimation Expert). The Team visited Gangtok in two stages. During
the first stage (December 2004-January 2005), the team held meetings with the concerned senior
officials to discuss various operational issues, collected a good deal of data, and agreed on a
program relating to the immediate steps to be taken for the introduction of Value Added Tax in
Sikkim, and for training officials of the Tax Department. In addition, it was also agreed that the
officials of the Directorate of Economics and Statistics should be given immediate training in the
organization of Sample Survey and in the estimation of saving and capital formation in Sikkim.
During discussions organized as a part of the first visit, it became clear to the team that there was
need for a two-pronged approach:- (a) immediate efforts should be made to the drafting of the
requisite legislation relating to the introduction of the Value Added Tax (which had deadlines), as
well as training of officials of the Tax Departments in the structure and operation of VAT, and
organizing short term courses for officials of the Directorate of Economics and Statistics in
Sampling Surveys and associated matters; and (b) a detailed survey of the policy, institutional and
systemic aspects of the management of Sikkim‟s public finances. The legal expert who
accompanied the team was asked to address the immediate task of drafting the VAT bill for
1 Assisted by B.R. Atre (Legal Expert)

ADB TA No. 4297-IND, Final Report
Capacity Building For Fiscal Reforms in Sikkim
2
approval by the State Legislative Assembly. He also set about drafting a VAT rules. As capacity
building in this area has to be done alongwith the introduction of the tax, the activity had to be
compressed and co-ordinated with the reform itself.
Following the first visit, an inception report was submitted to the State authorities as well as to the
Asian Development Bank. During the second visit assistance was provided in the processing of
the legislation relating to VAT (the legislation has became operational from April 1, 2005) and a
series of training programmes were conducted for the officials of Tax Department, including
awareness programmes and seminars for Ministers and senior officials as well as representatives of
the local trade and industry associations and general public. (The Seminars were organized by M.
Govinda Rao and he was assisted by a group of experts including Kavita Rao and Pinaki
Chakraborty). Courses were also conducted for the officials of the Directorate of Economics and
Statistics. Further, members of the Team were engaged, during the second visit, in the collection
of data and their analysis.
During all the phases of its work, the Team was accorded all facilities and was a number of
documents were furnished. Discussions during meetings were cordial, frank and insightful. In
some cases, particularly in calibrating VAT reform the officials collaborated actively with the
experts. The Team wishes to place on record its deep gratitude and appreciation of the assistance
extended by the Sikkimese authorities. A list of Meetings organised is provided in Appendix 1.1.
1.2 Scope and Structure of the Report
The report has two objectives (a) to describe the way in which attention was paid to the
immediate issues, viz., introduction of VAT in the State, and providing short term training to the
officials of the Directorate of Economics and Statistics in poverty estimation, and in the estimation
of savings and capital formation and how substantial progress was made in both areas through
assiduous efforts as a part of this project. Capacity building in VAT had to be coordinated and
compressed with the introduction of tax itself. In fact, the reform and capacity building in
administering VAT had to go hand in hand as there was hardly any lead time for this report; and
(b) to undertake a more detailed survey of the needs of fiscal capacity enhancement and the
formulation of a road map specifically tailored to the requirements of Sikkim. Thus, the report is
at once a statement of the significant progress made in selected areas, and is also a plan for
addressing the broader institutional, systemic, and operational aspects of formulation and
implementation of fiscal policies.
Accordingly, the report is devoted to a detailed discussion of the themes and issues relating to the
capacity to undertake relevant fiscal adjustments in Sikkim. As an integral part of this approach,
the policy, institutional, systemic and operational aspects of fiscal management are considered. In

ADB TA No. 4297-IND, Final Report
Capacity Building For Fiscal Reforms in Sikkim
3
each area, the effort is to identify the issues, and to delineate the need and rationale for change as
well as the content of adjustment. The coverage includes a detailed analysis of public finances
including the performance of public sector undertakings, as well as an examination of the human
resource constraints and a discussion of the ways in which these constraints may be addressed.
The report is divided into five parts. In the first part, the scope of capacity building in fiscal
management – its contents and problems and why and how they may be addressed – is discussed.
Part II is devoted to a discussion of the state of public finances, past experience and outlook are
considered. Part III deals with the expenditure management and supporting structures comprising
institutions, systems and operational processes. The Part IV deals with public sector enterprises in
Sikkim and various options of restructuring. The concluding part deals with the ways in which the
statistical skills of government employees may be enhanced. Each part and its contents, are so
arranged as to permit a detailed enquiry into each area as a self-contained subject in itself and in
relation to other areas. In each of these parts, the preparatory work undertaken to introduce VAT
and to provide training for tax officials and to organize related training programmes is described.
Similarly, the progress made in organizing training programmes for officials of the Directorate of
Statistics is indicated in some detail.
1.3 Issues in Fiscal Consolidation in Sikkim
In the overall management of Government, fiscal policy has a crucial role to play. Governments
are organized primarily for the purpose of providing services that are not otherwise available in the
market. They may also be engaged, depending on the political ideology of the party in power, in
providing services to the vulnerable sections of the community at below market prices even when
such services or goods are available in the market. Such provision involves incurring of
expenditure by governments. They also have a role in ensure a fair state of distribution of incomes
and wealth in society and eliminate poverty. This requires them to designing and implementing
appropriate tax and transfer policies. Given that all policies of government have some financial
implications, the financing of those expenditures and the determination of what to spend them on
and how and when to spend them become matters of considerable importance. The provision of
goods and services to the community implies that there are right policies, policy making processes
and supporting administrative structures comprising institutions, organizations, and operational
systems in place that facilitate both the formulation and implementation of policies. These aspects
refer to the broad phenomenon of capacity in the government, as well as outside so that
governments could use the external resources when needed. The capacity also assumes that the
appropriate personnel, in the form of well trained officials, are available to manage the overall
system.

ADB TA No. 4297-IND, Final Report
Capacity Building For Fiscal Reforms in Sikkim
4
Fiscal policies aim at achieving a balance in the allocation of resources between the government
and private sector, a balance in the allocation of resources between the various layers of
government and among the functions, programmes, and activities of government. In achieving this
balance, due attention is needed to be paid to considerations of equity and efficiency, while
facilitating the generation of adequate employment opportunities. The emphasis on quantitative
aspects is generally tempered by an explicit recognition of qualitative aspects too. Thus, the
provision of services has to be done in such a manner as to fulfill time, cost, and quality
considerations, and adequate attention is required to be paid to the full utilization of benefits
sought to be created through government policies and programmes.
Building capacity for fiscal reforms cannot be a static phenomenon; rather, it is always changing
and adjusting in response to the dynamics of needs, requirements and aspirations. These changing
requirements need to be identified in a timely fashion and appropriate policies formulated and
implemented. Often, there may not be any lead time to plan, strategise and implement building of
capacity. It may be necessary to undertake capacity building simultaneously as the reforms in the
policies are calibrated as it has happened in the case of introduction of VAT in Sikkim. In reality,
the responses may not always be timely and there may be long lags in the identification of
problems and in the implementation of policies. The lags, as well as the content of policies, not to
mention the abuse of discretionary decision making, may contribute to distortions and the benefits
proposed to be provided to the community may suffer adverse cost escalations and have
unintended consequences. Some of these distortions may be further exacerbated by two factors –
non-availability of well trained officials, and the absence of a well developed consultation process
and a communication system between the central and sub-national governments. In building
capacity, the government should consider that administering each department has to achieve a
certain degree of complexity. This is more in some and less in others. It is necessary to consider
that building fresh capacity is not easy and therefore frequent transfers from one department to
another should be avoided.
The general technological context within which governments work is frequently subjected to major
changes. Technological innovations offer immense benefits to governments and these often take
place without any effort on the part of the government. Being at the receiving end, governments
are obliged to take advantage of those innovations and improve their administrative capacities. In
all these phases, governments, as the biggest organizations, have to ensure that there is continuity,
but that there is also the required change and continuous adaptation to the changing requirements.
The price of non-adjustment is backwardness.
Calibrating fiscal policies in a country or a state has to stand on tripod of architecture, engineering
and management. Architecture deals with the design of policies and engineering its various

ADB TA No. 4297-IND, Final Report
Capacity Building For Fiscal Reforms in Sikkim
5
mechanics. Both these depend on the ability to manage or implement them. Fiscal policies,
however well designed cannot be implemented unless there is a good capacity to calibrate and
manage them. In fact building management capacity is critical to reform and even the design of the
reform should be drawn up depending on the ability to implement them.
The need for a review of the capacity building, and appropriate strengthening, arises for a variety
of factors in the case of Sikkim. While these factors vary, depending on the situation and the State
or country that is being examined, in Sikkim, the following four groups merit explicit recognition.
Inherent compulsions: During the last four decades, Sikkim has gone through a series of
major institutional changes – from a monarchy to a democratic government, from a
maintenance stance to a growing emphasis on economic development, from a relatively simple
administrative system to a complex one where the structures and number of administrative
agencies have grown and there has been expansion in the activities including commercial and
manufacturing areas. The process of expansion, however, was not based on any well
articulated design or programme (as will be discussed in some detail in later sections) and was,
in general, ad hoc, without taking into account the long term implications for the eventual form
of government. This factor has been explicitly recognised by the authorities and some
measures were taken to contain the size of the government. As an integral part of this effort,
recruitment of additional staff was stopped, and various schemes were introduced to facilitate
voluntary exit from government service. Their impact on the structure and systems of
government has not been a durable one.
It would also appear that while the general governmental structures received some attention,
capacity to calibrate fiscal reforms or those relating to the pursuit of fiscal policies have not
been given the attention due. As a result, there have emerged some distortions in the patterns
of resource mobilization and in their effective use. More specifically, the pattern of decision
making in a state that is significantly dependent on Central transfers has never been subjected
to any serious analysis in terms of its impact on the fiscal capacity.
Implications of the Twelfth Finance Commission’s recommendations: Apart from the
devolution of resources to the State government, the Twelfth Finance Commission (TfFC
hereafter) has also made a series of recommendations that have profound and enduring
implications for the fiscal administration at the sub-national level (see Annexure 1.1). The
Commission recommended that State governments be enabled to go to the market directly for
meeting their borrowing requirements. In due course, the market will bring to bear its
discipline on the status of public finances in the States, and on the supporting administrative
systems. As a natural extension of this process, the State governments would be obliged to
maintain prudent finances as failure to do so would entail higher borrowing costs. The
finances would be subjected to greater public scrutiny and in the not too distant future, would

ADB TA No. 4297-IND, Final Report
Capacity Building For Fiscal Reforms in Sikkim
6
be rated by credit agencies. At a systemic level, State governments may have to organize
systems for the maintenance of public debt registers that would also be audited. Also, the
Commission recommended that each state government should pass the Fiscal Responsibility
Act to avail the benefit of debt restructuring plan recommended by it.
The Commission also recommended that accrual accounting be introduced, in a gradual way,
in all governments and pending the full transformation from cash based system to a
commitment or accrual based, that several analytical statements be prepared and included in
the public financial documents. It also recommended that a uniform budget (and consequently
accounting) classification be introduced. The implementation of these recommendations in
turn involves substantial strengthening of the existing fiscal administration system in Sikkim.
Tax Administration for VAT: The decision to levy value added tax by the state with effect
from April 1, 2005 has necessitated building the entire legal, institutional and management
structure to implement this tax. Thus, the state government has to create a legal framework,
modern administrative set up equipped with an understanding of the mechanics of VAT, its
accounting system, administration information system and enforcement mechanism. The
critical issue in this is that the capacity building has to proceed as the introduction of VAT is
calibrated. There is no time for preparation, strategizing and very limited possibility of
sequencing the creation of legal and administration framework.
Public perception: While there are no systematic surveys of public opinion, discussions both
within and outside government circles point to the perception that government is top heavy,
that this top heaviness has not translated into improved efficiency and that the element of
waste is extensive in government programmes. Regardless of the validity of such perceptions,
they have an immense impact on the credibility of government. Meanwhile, government‟s
own efforts to shore up the system here and there, seem to be validating the general
perceptions, contributing in turn to a steady erosion in the credibility of governments.
Immediate steps are indicated to stem that erosion.
Approaches to IFIs: The full implementation of the recommendations of Tf.F.C. would
hereafter lead to direct transmission of funds from the International Financial Institutions
rather than being routed through the Central budget as was the case before. This procedure
could contribute to a greater direct involvement of the IFIs in terms of the scrutiny of public
finances, and monitoring the intra-year developments therein. Both the original conditionality
and the subsequent monitoring in the case of assistance from IFIs would involve, either as a
condition precedent or as an integral part of loans, substantial strengthening of the
governmental capacity in general, and fiscal capacity in particular. It is appropriate to
anticipate their approaches and take up house cleaning before it is insisted upon as a part of
conditionality.

ADB TA No. 4297-IND, Final Report
Capacity Building For Fiscal Reforms in Sikkim
7
In undertaking a review of the prevailing capacity to calibrate fiscal policy in the state and in
enhancing its level, the objectives of fiscal policy – equity, efficiency, reduction of distortions in
tranbsfering resources from the private to the public sector, ensuring its efficient use in terms of
economical and timely delivery of services and facilitating the full utilization of services are to be
constantly kept in view. In the following pages, the policy and systemic aspects (including human
resource development and application of computer technology) are reviewed, issues identified, and
recommendations are made. Some of them lend themselves to immediate implementation while
some can be implemented only over a period of time. Some areas may require additional medium
term support in the form of resident experts.
The strategy of approach specified in the report for the enhancement of the capacity to undertake
fiscal reforms in Sikkim is comprehensive. The implementation requires a good deal of
educational effort, sustained political leadership, and uninterrupted support from international
financial institutions. While these considerations are true in all cases of institutional development,
they have a particular relevance for Sikkim. The benefits that will accrue from the proposed
reforms may not always be evident to the vital segments of the community or even to some
sections of the vast range of government employees. This problem can only be addressed through
educational effort aimed at creating an awareness of the issues and the need for a quest for
alternatives. Indeed, it is as a part of the recognition of this aspect, that the team conducted,
among others, awareness seminars about the VAT to the public.
Reform of governmental institutions and related administrative process is, even at the best of
times, not an easy process. The comfort drawn from the status quo may, in some situations,
contribute to apathy on the part of the stakeholders and stockholders. In part, such apathy may
also have its origins in the series of failed efforts before, in the accumulation of unimplemented
reports prepared by commissions and consultants, and the absence of clearly identifiable benefits.
Even where reform is successfully undertaken, the public may not perceive the benefits, as they
may largely be internal to governments. For this reason, it is imperative that the benefits as well as
the costs of the approach recommended in the report are explicitly recognized. The groups that
may adversely be affected through administrative reorganization (including divestment) should be
recognized and a continuing dialogue between the Government and the affected sections is
undertaken so that the process of implementation is not adversely affected.
In the above phases, the international financial institutions should be willing to provide
uninterrupted support. Interruptions tend to create more distortions and the achievement of the
specified objectives may be rendered moot. The importance of continuous support cannot be
overstated. The areas where such support may be needed are indicated in the report.

ADB TA No. 4297-IND, Final Report
Capacity Building For Fiscal Reforms in Sikkim
8
2. Government Finances: An Overview
2.1 Trends in Government Finances
Sikkim is the smallest state of the Indian Union in terms of area and population with a
geographical area of 7112 sq. kms and population of 5.4 lakhs according to 2001 census.
The government finances of Sikkim are heavily dependent on federal transfers. Indeed, the central
transfers account for more than a half of the state domestic product (Table 1 and Annexure 2.1).
State finances underwent a significant deterioration in all the States during the concluding years of
the last decade and Sikkim was no exception to this. The principal reasons for this are four, viz.,
revision of pay scales for the state government employees following the Central pay revision
irrespective of paying capacity, (ii) deceleration of own tax revenue growth on account of
industrial recession; (iii) shortfall in central transfers; and (iv) growing debt servicing burden.
Table 1 Important Indicators of Fiscal Performance as % of G.S.D.P.
Item 1996-97
1997-98
1998-99
1999-00
2000-01
2001-02
2002-03
2003-04
2004-05 RE
Fiscal Deficit -10.12 -10.29 -18.78 -11.02 -5.17 -5.87 -0.79 -3.70 -3.91
Revenue Deficit 7.01 6.34 -7.03 0.22 10.17 12.55 15.82 11.80 12.26
Primary Deficit 4.15 4.01 12.07 2.93 -2.89 -1.52 -6.37 -3.11 3.91
Total Tax 18.68 17.88 17.77 17.69 14.09 14.50 14.60 16.22 15.52
Own Tax 5.41 5.61 5.98 5.84 6.70 7.06 8.43 7.95 8.28
Share in Central
Taxes
13.27 12.27 11.79 11.85 7.39 7.45 6.17 8.27 7.24
Own Non-Tax 7.12 6.61 5.49 7.71 6.72 6.24 11.46 7.00 7.16
Grants-in-Aid 40.71 38.90 35.91 38.15 44.65 45.10 46.51 42.97 44.34
Plan Grants 32.07 33.24 33.06 36.23 29.46 32.87 29.42 31.89 46.02
Non-plan Grants 8.64 5.66 2.85 1.92 15.20 12.23 17.09 11.08 10.58
Revenue
Receipts
66.52 63.38 59.18 63.55 65.47 65.84 72.56 66.19 67.01
Revenue
Expenditure
59.51 57.04 66.20 63.33 55.30 53.29 56.75 54.39 54.75
Capital Outlay 17.04 16.47 11.74 11.23 15.46 18.50 16.70 15.57 16.19
Total
Expenditure
76.55 73.51 77.94 74.56 70.76 71.79 73.45 69.96 70.94
Outstanding Debt 56.59 54.76 64.55 80.63 74.84 70.75 69.34 69.39 72.79
Source: Basic Data, Finance Account Relevant Issues, GOS
The Government of Sikkim took several measures to overcome the fiscal stress which include (I)
freezing of fresh recruitment, (ii) introduction of VRS on a selective basis, (iii) restructuring of
SPEs; and (iv) stepping up tax and non-tax revenue efforts (Box 1). These steps, however, had
only a limited impact on the overall finances of the state government as the dependence of the state
on central transfers, both plan and non-plan continues to be overwhelming.

ADB TA No. 4297-IND, Final Report
Capacity Building For Fiscal Reforms in Sikkim
9
Box 1 Fiscal Reform Measures taken by Government of Sikkim
The measures taken by the Sikkim state government to overcome fiscal stress may be divided into
three categories, viz., Fiscal Measures, Institutional Measures and Sectoral Measures.
Fiscal measures include:
measures for expenditure containment such as pruning inefficient sectors, right-sizing the
government machinery, and focussing on merit based subsidies;
measures to augment revenue, strengthening the tax base;
preparatory steps towards implementation of VAT;
Disinvestments of all non-performing assets with the public sector units is being considered;
Mechanism to monitoring Scheme based transfers to the State in various departments
Institutional measures include:
measures to strengthen the process of decentralisation
proposes to enforce measures to step up revenue collection efficiency from power sector;
budgetary support to power sector is proposed to be linked with actual outcomes in the sector;
Sectoral measures include:
focus on allocating adequate resources to the core areas such as agriculture, infrastructure and
social sectors;
project on `Agricultural Export Zone‟ to be concretised
proposal to constitute Agriculture Expert Committee with pre-determined annual export target
under each Zilla Parishad to co-ordinate the grass root activities.
The award of the Eleventh Finance Commission, however, turned out to be beneficial to Sikkim.
While the tax revenue devolution declined, it was more than compensated by the increased grants.
Similarly there was significant step up in plan grants also since the beginning of the new decade.
As a result, there has been appreciable improvement in state finances since 2000-01 (Table 1 and
Annexure 2.1)
There are, however, disquieting signs on the fiscal front as the implemention of recommendations of
the Twelfth Finance Commission is likely to substantially reduce the statutory transfers to the State.
This is likely to pose a serious challenge to the pursuit of stable and growth oriented fiscal policy in the
State. The other factors which can have significant impact on Sikkim state finances in the coming
years are (I) introduction of VAT with effect from April 2005 (dealt with in Chapter, 3), (ii)
restructuring of the government departments; and (iii) restructuring of state PSUs (Chapter, 8).
If the present trend continues the state government will not be able to attain its Tenth Plan targets
in fiscal and physical terms. Provision of essential basic services and building up of the requisite
social and economic infrastructure for sustained economic development to ensure full employment
is the principal goals of the government. Unless appropriate corrective measures are taken early,

ADB TA No. 4297-IND, Final Report
Capacity Building For Fiscal Reforms in Sikkim
10
the State government will not be able to fulfill these. These factors clearly underline the
imperative for reorganizing the state finances. This, inter alia, involve introduction of VAT,
restructuring of the state PSUs, reducing the public debt and securing economies in government
expenditure while improving the capacity of the government for policy making and delivery of
services. The opportunity should also be used to address several (institutional and
administrative bottlenecks that stood in the way of full utilization of public expenditure benefits.
Box II
Institutional and Administrative Bottlenecks
Two such cases where changes are needed are briefly described here:
The State is not governed by Indian Income Tax; but by the State of Sikkim Income Tax Act with
the following tax rates since 1970.
On the first Rs.2400 Nil
Next Rs.2400 2 Percent
Next Rs.3600 4 Percent
Next Rs.3600 6 Percent
Next Rs.6000 8 Percent
Above 10 Percent
No doubt, this highly regressive rate structure needs to be changed.
Gangtok, the capital of the state is a hill town with narrow roads and a fragile environment. The
town is chocked by fast growth of automobiles. This is on account of large number of government
vehicles given to the officials for their personal use and on account of indiscriminate issue of
permits for taxies. Some of the possible policy changes to decongest the state capital are:
(1) Phased withdrawal of personalised vehicles of the officials by offering them appropriate
transport allowance and simultaneously introducing mini bus services;
(2) Encouraging government vehicle drivers to own the vehicles and operate as taxi drivers; and
Banning entry of vehicles in crowded roads/market places and introduction of pedestrian only
zones
2.2 Employment and Salaries in Sikkim
Salary payments account for a major share of the committed expenditures in all the States. The
salary revisions undertaken by the State governments, in the wake of the Fifth Central Pay
Commission, resulted in substantial increases in the average salaries. Inspite of the increasing
convergence in the salary structure, there are considerable interstate variations in the average
salaries per employee.
Expenditure on salaries relative to revenue expenditures excluding interest payments and pension
in respect of 5 NEC States and a total of 21 States for which comparable data have been received
by the TfFC are presented in Table 2. Government expenditure on salaries includes basic salary,

ADB TA No. 4297-IND, Final Report
Capacity Building For Fiscal Reforms in Sikkim
11
dearness allowance, city compensatory allowance and other benefits including LTC and medical
benefits. The figures for Sikkim have been grossly underestimated on account of the fact that
revenue expenditure figures used as devisor was gross figures including expenditure on lotteries.
Corrected ratios are worked out and given in brackets after excluding lottery expenditure for the
period 1995-96 to 2003-04. The all States‟ average which was about 35% increased to over 41%
in the wake of salary revision in 1999-2000 but came down to about 37 per cent by 2001-02. All
the NEC States have significantly higher salary share as compared to the all States‟ average. The
TfFC stipulates that all the States including NEC States should strive to reduce the salary share to
about 35 per cent of revenue expenditure excluding interest payments and pensions.
The salary outlay depends on the number of employees and the average rate of emoluments. The
trend in the share of salary expenditure in revenue expenditure, therefore, is the combined effect of
the trend in total employment and average salary expenditure. Statewise number of regular
employees in the NEC States and all States are given in Table 3. It is important to note that while
there has been a declining trend in the total number of State government employees in the post pay
revision period, there was an upward trend in employment as far as the NEC States except Assam
are concerned. The highest growth rate of 18% between 1998-99 and 2002-03 was, indeed, in
Sikkim.
Table 4 presents the trend in per employee salary expenditure in NEC States along with that in all
States. It is clear that the salary expenditure growth in Sikkim was the highest during the last
decade, the average salary expenditure in Sikkim was just about the all States average in 1994-95.
But by 1998-99, Sikkim overtook all other States and retained that position since then. Also, the
State had the dubious distinction of doubling the salary expenditure in a single year in 1998-99, the
year in which pay revision was carried out in the State.
While in a State like Sikkim, which has limited employment opportunities outside the Government
will continue to have pressure on government employment, the logic of high average salary
expenditure is difficult to explain. The approach of the TfFC, which is spelt out in its report is that
a State which is under fiscal stress, has high rate of government employment and high salary
structure has to follow a strategy which involves: (i) reduction in employment, (ii) reduction in
salary expenditure per employee, or (iii) raise revenues without increasing revenue deficit. It is
time that Sikkim has a close look at this prescription.
Table 5 presents the latest position in terms of total employment and average salary expenditure in
Sikkim. The total employment including workcharge, muster roll and anganwadi workers was
close to 40000 by 2004-05 and the salary expenditure is almost Rs 400 crore. Since there is a huge
wage difference between muster roll workers and workcharge employees on the one hand and

ADB TA No. 4297-IND, Final Report
Capacity Building For Fiscal Reforms in Sikkim
12
workchange employees and the regular employees on the other, the pressures for upgradation will
continue. On the other hand, the TfFC has ordained a scheme which in effect is a move in the
opposite direction.
2.3 Implications of Twelfth Finance Commission (TfFC) Recommendations on
Revenues of Sikkim
In the Inception Report it was indicated that the outlook for State government finances depends
critically on the award of TfFC in respect of tax revenue devolution, grants and restructuring of
State debt. This section deals with the implications of TfFC recommendations relating to
devolution and grants on the revenues of the State.
As per the recommendations of the TfFC, the States‟ share has been fixed at 30.5 pert cent of the
net proceeds of sharable Central taxes during 2005-10. Out of this, the share assigned to Sikkim is
0.227 per cent. The amount projected for the State is Rs. 1392.94 crore for the five year period.
The yearly distribution is indicated in Table 6. As against Rs. 207.58 crore projected for 2005-06
by the TfFC, the amount indicated in the Union Budget 2005-06 for Sikkim is Rs. 215.71 crore.
What Sikkim gets by way of grants-in-aid over the next five year on the basis of TfFC
recommendations is also presented in Table 6. Except for grants-in-aid for education and health,
the State gets its share under all other items. The State specific grant of Rs. 100 crore is meant for
the airport. This amount, however, will be reimbursed to the State only on utilisation. It is
important to note that the Eleventh Finance Commission had provided Rs. 50 crore for the same
purpose, but the State could not utilise it.
A comparative picture of TfFC recommended transfers to member States of North Eastern Council
(NEC) including Sikkim is presented in Table 7. It is evident from the table that Sikkim gets the
lowest amount of non-plan revenue deficit grant of Rs. 188.67 crore for the five year period. In
per capita terms this works out to Rs. 3780 as compared to Rs. 33089 for Mizoram, Rs. 27685 for
Nagaland, Rs. 19096 for Manipur, Rs. 17169 for Tripura, Rs. 12345 for Arunachal Pradesh and
Rs. 7813 for Meghalaya.2
The low non-plan revenue gap grant for Sikkim is the combined effect of relatively high own
revenue receipts projected and relatively low growth in projected non-plan revenue expenditure.
The high level of own revenue projection is on account of high growth in own tax revenue of the
2 In this context it is important to note that among the NEC States Sikkim is the only State for which
the non-plan revenue grants recommended by the TfFC is lower than the corresponding grants
recommended by the Eleventh Finance Commission. The amount provided by the EFC for Sikkim
was as much as Rs. 840.58 crore for five year period as compared to just Rs. 188.67 crore by the
TfFC.

ADB TA No. 4297-IND, Final Report
Capacity Building For Fiscal Reforms in Sikkim
13
State in the past and on account of high base of non-tax revenues. The high growth of own tax
revenue in the past resulted in high trend growth rate (TGR) of 19.86 for the period 1993-94 to
2002-03 which was applied to reach the base year level of own tax revenue. A high base of non-
tax revenue is the result of a bumper net revenue of Rs. 84.14 crore in 2002-03 received from on-
line lottery of Sikkim which could not be sustained in the subsequent years. The total impact of
these two factors is likely to be an overestimation of the order of Rs/ 250 crore of the TfFC
assessed own revenue receipts of the State for the five year period.
The relatively low growth in the assessed non-plan expenditure of the State is principally on
account of two factors, viz., (i) total exclusion of the departmental expenditure on power and
transport and (ii) the lower growth in salary expenditure used for projection purpose as compared
to the past growth rate. The combined operation and maintenance (O&M) expenditure of the
power and transport departments was of the order of Rs. 50 crore in 2004-05. The basic approach
of TfFC that these O&M expenditure of power and transport departments should be met from user
charges implied that there will be no expenditure on account of this item for the projection period.
Sikkim has been experiencing the highest growth in per capita salary expenditure among all the
States during the last decade. Besides, the State has experienced a high growth of regular
employment during the last decade. As against a TGR of about 15 per cent in salary expenditure
experienced by the State in the past decade, the TfFC has assumed a growth rate of 5 per cent in
the salary expenditure of all States uniformly. The combined effect of these two factors is a
shortfall of about Rs. 500 crore in the projected non-plan revenue expenditure of the State as
compared to the projections made by the State government. The own revenue receipts and non-
plan revenue expenditure of Sikkim as assessed by the TfFC are presented in Table 8.
Three tables are given at annexure which present comparative assessment of revenue
surplus/deficit for NEC states including Sikkim. Annexure 2.2 gives pre-devolution non-plan
revenue deficits. All the NEC states have been assessed to have revenue deficit with Sikkim
having the lowest figure at Rs. 1580 crore for the five year period. Post-devolution non-plan
revenue surplus/deficit of the NEC states are presented in Annexure 2.3. Assam is the only NEC
State which is assessed to have a post-devolution non-plan revenue surplus. Among the remaining
7 NEC States, Sikkim has the lowest non-plan revenue deficit during the TfFC award period.
Annexure 2.4 gives the year wise details of grants-in-aid for non-plan revenue deficit for the NEC
States. While six States receive grants-in-aid during all the five years of the award period, Assam
received only for the first year and Sikkim for the first four years.

ADB TA No. 4297-IND, Final Report
Capacity Building For Fiscal Reforms in Sikkim
14
Table 2 Expenditure on Salaries Relative to Revenue Expenditures (excluding Interest
Payments and Pension) (per cent)
.State 1994-95
1995-96
1996-97
1997-98
1998-99
1999-00
2000-01
2001-02
2002-03
2003-04
Arunachal Pradesh
40.5
41.1
39.7
45.2
50.1
48.6
46.7
43.6
47.8
-
Assam
60.7 60.7 70.4 71.7 74.3 75.9
71.1 71.5 71.7 -
Meghalaya
48.6 45.8 51.7 55.0 52.3 52.7 50.1 54.3 57.5 -
Sikkim
16.8
11.6
(37.66)
10.6
(38.48)
11.1
(40.84)
17.9
(55.77)
18.3
(53.60)
37.6
(55.43)
17.1
(52.61)
16.5
(48.76)
(51.17)
Tripura
53.1 68.8 54.5 55.8 59.9 64.4 60.2 67.0 69.9 -
Total (21 states) Sta
35.2
36.2
34.8
37.0
39.7
41. 3
38. 3
36.8
37. 3
-
Source: Report of the Twelfth Finance Commission, Govt. of India, February, 2005
Table 3 State wise Number of Government Employees
State 1994-95 1995-96 1996-97 1997-98 1998-99 1999-00 2000-01 2001-02 2002-03
Arunachal Pradesh
33222
36325
37420
39222
39606
39445
40231
40322
41165
Assam 413464 422690 430357 441590 459701 453245 447424 441634
435534
Meghalaya 36194 38014 39613 42830 44928 46644 47427 48776
49813
Sikkim 19522 20158 21038 21701 20395 22728 22859 23426
23973
Tripura 90300 89242 96310 96725 96673 105038 103736 101604
98379
Total (21 States)
7947292 8056669 8075237 8129521 8140736 8035557 7942643 7863382 7824012
Source :Report of the Twelfth Finance Commission, Govt. of India , February,2005.
Table 4 Total Salary per Employee in NEC States (In Rupees)
State 1994-95 1995-96 1996-97 1997-98 1998-99 1999-00 2000-01 2001-02 2002-03
1 2 3 4 5 6 7 8 9 10
Arunachal
Pradesh
48040 51369 57119 67613 81229 88462 94136 93558 98221
Assam 36895 41616 45720 51198 57860 73070 77432 81745 83720
Meghalaya 53434 62001 70568 77378 82668 89471 96181 108088 113808
Sikkim 42665 49012 54430 62041 125552 114852 109617 113651 121684
Tripura 34891 50654 42277 49915 58755 70292 77736 89609 99631
Total (21
States) –
Weighted
average
41968 47398 53631 61377 75116 89600 92214 90353 94603

ADB TA No. 4297-IND, Final Report
Capacity Building For Fiscal Reforms in Sikkim
15
Table 5 Sikkim: Employment and Salaries in 2004-05
Type of Employees Number Expenditure
on Services
(Rs in crore)
Average Salary
Per Year
(In Rs)
Regular Employees 25349 345.57 136325
Workcharged Employees 1849 15.12 81795
Muster Roll Workers 10584 35.56 33600
Anganwadi Workers 1991 2.39 12000
Total 39773 398.64 -
Source: Government of Sikkim
Table 6 What Sikkim Gets by way of Devolution and Grants-in-aid on the Basis of TfFC
Report
(Rs. Crore) 2005-06 2006-07 2007-08 2008-09 2009-10 Total
1. Tax Revenue Devo-lution 207.58 237.65 272.80 313.59 361.42 1392.94
2. Grants-in-aid for non-plan
deficit
66.81 47.06 52.86 21.94 Nil 188.67
3. Grants-in-aid for edu-cation -- -- -- -- -- --
4. Grants-in-aid for Health -- -- -- -- -- --
5. Grants-in-aid for
Maintenance of
Roads and bridges
-- 4.66 4.66 4.66 4.66 18.64
6. Grants-in-aid for
Maintenance of
Public buildings
-- 8.04 8.03 8.04 8.04 32.15
7. Grants-in-aid for
Maintenance of Forests
1.60 1.60 1.60 1.60 1.60 8.00
8. Grants-in-aid for
Heritage conservation
-- 1.25 1.25 1.25 1.25 5.00
9. Grants-in-aid for state
specific needs
-- 25.00 25.00 25.00 25.00 100.00
10. Grants-in-aid for local
bodies
2.80 2.80 2.80 2.80 2.80 *14.00
11. Calamity relief funds 13.15 13.53 13.93 14.35 14.78 69.74
12. Total 291.94 341.59 382.93 393.23 419.55 1829.14
Of which, Rs. 13 crores is for rural local bodies and Rs. 1 crore for urban local bodies.
Source: Report of the Twelfth Finance Commission, Government of India, February 2005.
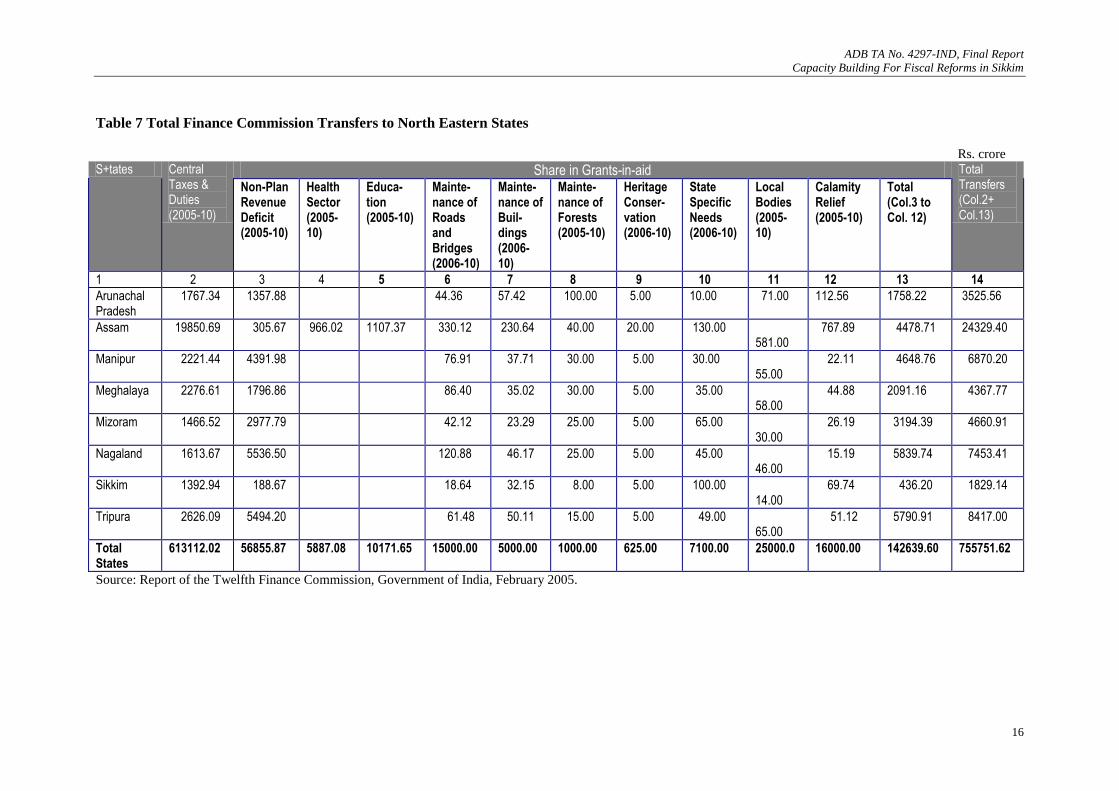
ADB TA No. 4297-IND, Final Report
Capacity Building For Fiscal Reforms in Sikkim
16
Table 7 Total Finance Commission Transfers to North Eastern States
Rs. crore
S+tates Central Taxes & Duties (2005-10)
Share in Grants-in-aid Total Transfers (Col.2+ Col.13)
Non-Plan Revenue Deficit (2005-10)
Health Sector (2005-10)
Educa-tion (2005-10)
Mainte-nance of Roads and Bridges (2006-10)
Mainte-nance of Buil-dings (2006-10)
Mainte-nance of Forests (2005-10)
Heritage Conser-vation (2006-10)
State Specific Needs (2006-10)
Local Bodies (2005-10)
Calamity Relief (2005-10)
Total (Col.3 to Col. 12)
1 2 3 4 5 6 7 8 9 10 11 12 13 14
Arunachal Pradesh
1767.34 1357.88 44.36 57.42 100.00 5.00 10.00 71.00 112.56 1758.22 3525.56
Assam 19850.69 305.67 966.02 1107.37 330.12 230.64 40.00 20.00 130.00 581.00
767.89 4478.71
24329.40
Manipur 2221.44 4391.98 76.91 37.71 30.00 5.00 30.00 55.00
22.11 4648.76
6870.20
Meghalaya 2276.61 1796.86 86.40 35.02 30.00 5.00 35.00 58.00
44.88 2091.16
4367.77
Mizoram 1466.52 2977.79 42.12 23.29 25.00 5.00 65.00 30.00
26.19 3194.39
4660.91
Nagaland 1613.67 5536.50 120.88 46.17 25.00 5.00 45.00 46.00
15.19 5839.74
7453.41
Sikkim 1392.94 188.67 18.64 32.15 8.00 5.00 100.00 14.00
69.74 436.20
1829.14
Tripura 2626.09 5494.20 61.48 50.11 15.00 5.00 49.00 65.00
51.12 5790.91
8417.00
Total States
613112.02 56855.87 5887.08 10171.65 15000.00 5000.00 1000.00 625.00 7100.00 25000.0 16000.00 142639.60 755751.62
Source: Report of the Twelfth Finance Commission, Government of India, February 2005.

ADB TA No. 4297-IND, Final Report
Capacity Building For Fiscal Reforms in Sikkim
17
Table 8 Assessed Own Revenue Receipts and Non-Plan Revenue Expenditure of Sikkim
(Rs. in crore) Item 2005-06 2006-07 2007-08 2008-09 2009-10 2005-10
A Revenue Receipts
1. Own Tax Revenue 119.75 136.99 156.72 179.29 205.11 797.86
2. Own Non-Tax Revenue 84.14 90.01 96.88 104.94 114.47 490.44
3. Total (1+2) 203.89 227.00 253.60 284.23 319.58 1288.30
B. Non-Plan Revenue Expenditure
1. General Services
i. Interest Payments 94.75 99.50 104.60 110.18 130.07 539.10
ii. Pension 34.60 38.05 41.86 46.05 50.65 211.21
iii. Other General Services (incl. Elections) 110.61 116.74 124.09 130.05 138.36 619.86
Total (i) to (iii) 239.96 254.29 270.55 286.28 319.08 1370.17
2. Social Services 171.64 187.31 204.48 223.27 243.85 1030.55
3. Economic Services 66.67 70.11 73.74 77.55 81.55 369.62
4. Compens.& assign. To Local Bodies
5. Committed liabilities 30.39 32.67 35.12 98.17
6. Total Non-Plan Revenue Exp.(1 to 5) 478.27 511.71 579.16 619.77 679.60 2868.51
C. Pre-Dev. Non-Plan Rev. Deficit/Surplus
-274.39 -284.71 -325.56 -335.53 -360.02 -1580.21
Source: Report of the Twelfth Finance Commission, Government of India, February 2005.
2.4 Alternate Scenarios
TfFC Recommendations impose severe strain on Sikkim State Finances on account of steep
decline in non-plan revenue deficit grant which is not compensated by increase in tax devolution.
As compared to a non-plan grant of Rs.176 crore in 2004-05 the State receives only 84 crore in
2004-05. Other components of grants which will become available from 2006-07 onwards subject
to specific conditionalities like grants-in-aid for the maintenance of roads and bridges, grants-in-
aid for maintenance of public buildings and grants-in-aid for new Airport will improve somewhat
the non-plan grant in the subsequent two years. The phasing out of revenue gap grant through the
last two years of the TfFC award period further puts strain on the revenue position which adversely
impact on the revenue surplus of the State. In this section the fiscal situation of the State in the
medium term under two alternate scenarios – a baseline scenario and a reform scenario – are
presented (Projection methodology detailed in Annexure 2.5).
Baseline Scenario
In the baseline scenario the State will not be able to maintain the revenue surplus of the base year
in none of the years of the TfFC award period. It may be noted that the base line scenario depicts
the continuation of the past trend in State‟s own revenue receipts and revenue expenditures. The
conditionality regarding revenue surplus imposed by TfFC for Sikkim requires maintaining of at
least Rs.168 crore for each of the five years. Indeed under the baseline scenario this is not possible
even for a single year. In case the State Govt. enacts fiscal responsibility legislation, with this
stipulation, the milestones regarding revenue receipts will be out of tune with reality.

ADB TA No. 4297-IND, Final Report
Capacity Building For Fiscal Reforms in Sikkim
18
The level of fiscal deficit will be essentially determined by the level of capital outlay given the
revenue surplus. If the State Govt. attempts to maintain the past tempo of growth of capital outlay
during the TfFC award period, the fiscal deficit is bound to increase from the base year level.
Even if the growth in capital outlay is contained to the nominal growth of GSDP, the upward trend
in GFD will continue unabated. This will have implications for Debt; GSDP ratio also which will
continue to show upward trend. In short the baseline scenario indicates an explosive fiscal
situation which will defy the fiscal rules associated with any fiscal responsibility legislation.
It may be mentioned in this context that the revenue projections under the baseline scenario have
been made more realistic than those given by TfFC by adjustment of estimates of revenue from
lottery as well as own tax revenues. Again, on the revenue expenditure side, assumptions
regarding containment of salary and expenditure growth have been made more realistic in the light
of past experience. Tax and non-tax revenues net of lotteries are expected to grow at 10 percent
per annum during the period. As for lottery revenue, the three year average net revenue for 2000-
01, 2001-02 and 2003-04 is taken as the base level i.e. excluding the figure for 2002-03 which was
exceptionally high. The base level figure is assumed to continue for the forecast period as
assumed by the TfFC. Share of central taxes and non-plan grants are assumed to be same as
recommended by the TfFC. In the case of plan grants it is assumed that they will grow at the same
rate as nominal GDP. As far as revenue expenditure is concerned interest and pension forecasts
are the same as those adopted by the TfFC. In the case of other revenue expenditure, the trend
growth rates experienced during 1993-94 to 2004-05 have been used for forecasting the figures for
the medium term. Department specific projections have been made for important departments of
education, health, police, power and transport. The rest of the departments have been clubbed
together for projection purpose.
The GSDP growth is assumed to be 12 percent in nominal terms during the forecast period which
is the same as in the case of TfFC. Total revenues of the State as a share of GSDP remains at
around 62 percent during the first three years of the forecast period and experiences significant
reductions during the last two years of the forecast period. This is mainly on account of the steep
decline in non-plan grants during that period. It is also worth noting that even in the case of
State‟s own tax revenues a modest decline is indicated. This is mainly on account of the fact that
the two principal State taxes viz. Sales tax and income tax experienced unprecedented growth
rates in the recent past which may not be sustained for long. Total revenue expenditure as a share
of GSDP, on the other hand is showing an upward trend over the forecast period. This is on
account of the higher trend growth used for projecting a few major sectors like education, police
and power. For example the revenue expenditure on education increases from 11.29 percent of
GSDP in 2004-05 to 13.87 in 2009-10.

ADB TA No. 4297-IND, Final Report
Capacity Building For Fiscal Reforms in Sikkim
19
The net result of a decelerating revenue receipt profile and accelerating revenue expenditure
profile is a fast declining revenue surplus profile over the forecast period. Indeed, the revenue
surplus as a percentage of GSDP declines from over 12 percent in 2004-05 to just about one per
cent in 2009-10. If the capital expenditure under the plan has to grow at the same rate as GSDP in
nominal terms, considerable increase in borrowing will become essential. The fiscal deficit has to
go up from about Rs.58 crore in 2004-05 to over Rs.391 crore in 2009-10. This will lead to an
unstainable debt profile for the State. The Debt : GSDP ratio will grow from about 73 percent in
the base year to about 87 percent in the terminal year of the forecast period.
The above scenario clearly brings out two festures. First, if the business as usual situation
continues in respect of State‟s revenue receipts and revenue expenditures there is no alternative
except steep cut in capital outlay on plan. This will have serious adverse implications for future
growth of the State economy and welfare of the people. The alternative course is to improve the
own revenue receipts and compress revenue expenditure to ensure fiscal sustainability even
without sacrificing in terms of growth and welfare.
Table 9 Baseline Scenario: Sikkim Rs. Lakh
2004-05 2005-06 2006-07 2007-08 2008-09 2009-10
1. Total Revenue 98782.5 102568 115533 128547 139463 153062
A. Own Tax 12206.0 13426.6 14769 16246 17871 19658
Income Tax 3375.0 3713 4084 4492 4941 5435
B. Own Non Tax (net of Lottery) 7662.0 8428 9271 10198 11218 12340
Net Lottery income 2886.0 2198 2198 2198 2198 2198
C. Share of Central Taxes 10670.0 16606.4 19012 21816 25087 28914
D. Grants 65358 61908 70283 78089 83089 89953
Plan Grants 47743.1 53472 59889 67076 75125 84140
Non-plan Grants 17615.4 8436 10394 11013 7964 5813
2. Total Revenue Expenditure
(net of lottery expenditure)
80708 89864 101763 115378 130960 150192
E. Interest 9475 9950 10460 11018 13007
F. Pension 3078.0 3205 3650 4165 4750 5425
G Education 16648.6 19428 22671 26455 30871 36025
H. Health 4369.0 4901 5497 6166 6916 7758
I. Police 5728.7 6646 7711 8946 10379 12041
J. Power 4122.7 4820 5635 6588 7702 9005
K. Transport 4453.7 4759 5086 5434 5807 6205
L. Other Revenue Expenditure 32281.2 36630 41564 47163 53516 60726
3. Capital Outlay 23868.26 26732 29940 33533 37557 42064
4. Net Lending -23.30 -26 -29 -33 -37 -41
5. Revenue Deficit -18075 -12704 -13770 -13169 -8502 -2870
6. Fiscal Deficit 5770.37 14002 16141 20331 29018 39153
7. End of the period Debt 107296.3 121298.5 137440 157771 186789 225942
GSDP 147413 165103 184915 207105 231957 259792
Note: Revenue deficit with – sign indicates revenue surplus

ADB TA No. 4297-IND, Final Report
Capacity Building For Fiscal Reforms in Sikkim
20
Table 10 Baseline Scenario: Sikkim (Ratio to GSDP)
Per cent
2004-05 2005-06 2006-07 2007-08 2008-09 2009-10
1. Total Revenue 67.01 62.12 62.48 62.07 60.12 58.92
A. Own Tax 8.28 8.13 7.99 7.84 7.70 7.57
A1. Income Tax 2.29 2.25 2.21 2.17 2.13 2.09
B. Own Non Tax Revenue 5.20 5.10 5.01 4.92 4.84 4.75
Net Lottery income 1.96 1.33 1.19 1.06 0.95 0.85
C. Share of Central Taxes 7.24 10.06 10.28 10.53 10.82 11.13
D. Grants 44.34 37.50 38.01 37.70 35.82 34.62
Plan Grants 32.39 32.39 32.39 32.39 32.39 32.39
Non-plan Grants 11.95 5.11 5.62 5.32 3.43 2.24
2. Total Revenue Expenditure
(net of lottery expenditure)
54.75 54.43 55.03 55.71 56.46 57.81
E. Interest 0.00 5.74 5.38 5.05 4.75 5.01
G. Pension 2.09 1.94 1.97 2.01 2.05 2.09
H Education 11.29 11.77 12.26 12.77 13.31 13.87
I. Health 2.96 2.97 2.97 2.98 2.98 2.99
J. Police 3.89 4.03 4.17 4.32 4.47 4.63
K. Power 2.80 2.92 3.05 3.18 3.32 3.47
L. Transport 3.02 2.88 2.75 2.62 2.50 2.39
J. Other Revenue Expenditure 21.90 22.19 22.48 22.77 23.07 23.37
3. Capital Outlay 16.19 16.19 16.19 16.19 16.19 16.19
4. loans and advances:
(disbursements-receipts)
-0.02 -0.02 -0.02 -0.02 -0.02 -0.02
5. Revenue Deficit -12.26 -7.69 -7.45 -6.36 -3.67 -1.10
6. Fiscal Deficit 3.91 8.48 8.73 9.82 12.51 15.07
7. End of the period Debt 72.79 73.47 74.33 76.18 80.53 86.97
Note: Revenue deficit with – sign indicates revenue surplus
Reform Scenario
As compared to the baseline scenario, the reform scenario has considerable scope for policy
interventions. Except for share of central taxes, non-plan grants, plan grants and pension
expenditure, all other fiscal variables are considered endogenous. As far as share in central taxes
is concerned, it is expected that TfFC projections will hold good. Since the State has been having
its own income tax, it foregoes the income tax share of the central government. While the
extension of Central Income Tax Act to Sikkim is an emotive issue in the state, it has to be
recognized that the State Income Tax Act 1970 which remains unamended needs to be reformed at
the earliest. First of all it has a highly regressive rate structure. (See Box II) As far as individual
rates are concerned it varies from 2 to 10 percent. A person with even as low an income as Rs.
2400 per annum comes under the tax net. At the same time the marginal tax rate is only 10
percent. Secondly, the rate applicable to business is a turnover tax as high as 3 percent which may
have serious adverse implications on industry and trade in the state. In case the State income tax is
to continue it needs to be thoroughly reformed which will also imply that there can be a significant

ADB TA No. 4297-IND, Final Report
Capacity Building For Fiscal Reforms in Sikkim
21
drop in tax revenue. The alternative is to accept the central income tax regime which will imply
much more tax revenue for the State with much less tax burden for most of the Sikimese.
An important component of tax reform is the introduction of VAT with effect from April 2005. In
the case of Sikkim, however, increase in the sales tax revenue buoyancy since 1999-2000 with the
introduction of floor rates and plucking of the loopholes has been significant. The prescriptive
growth rate is taken at 14.40 percent per annum comprising of revenue buoyancy of 1.20 percent
and nominal GSDP growth rate of 12 percent. Similarly applying plausible revenue buoyancies
for other major components of own tax revenues like state excise, land revenues, stamp duty and
registration, motor vehicle taxes and other taxes, own tax revenue forecasting for the period 2005-
06 to 2009-10 has been made. The state‟s own tax revenue net of income tax (IT), as a percentage
of GSDP has increased from 5.99 in the base year to 6.39 in the terminal year.
Non tax revenue is projected net of lottery income. The principal components are interest and
dividends, general services, social services and economic services. Except three items under
economic services viz. forestry, power and transport, all others are expected to growth at 12
percent, same as the nominal growth of GSDP. Considering the need for preserving the forests
and in view of the fragile nature of environment in the State, revenue from forestry is kept at the
base year level throughout the forecast period. Power and Transport being two economic services
which involve substantial subsidies, significant improvement in revenues from user charges is
expected. Revenue from power is expected to grow at 24 percent per annum and revenue from
transport is projected to grown at 18 percent per annum. Revenue growth from power need not
necessarily be from increased tariff. It could very well be achieved by improving the operations
of the power sector including reducing Transmission and Distribution (T&D) losses. Similarly in
the case of transport also increase in fare/fright charges need not be the source of revenue
improvements. Improvements in operational efficiency can bring in more revenues.
Net lottery incomes for the base period is taken as the three year average for 2001-02, 2003-04 and
2004-05 which worked out to 27.91 crore. The same level of net lottery income is expected for
each of the forecast years.
Under the reform scenario non tax revenue net of lottery income as a share of GSDP is expected to
increase from 5.20 percent in the base year to about 6 percent in the final year of the forecast
period. On the other hand net lottery income as a share of GSDP comes down from about 2
percent to one percent.

ADB TA No. 4297-IND, Final Report
Capacity Building For Fiscal Reforms in Sikkim
22
In the total revenue expenditure about 70 percent is accounted for by non-plan expenditure in the
base period. This includes interest liability as well as pension payments. While pension figures
are as projected by the TfFC, interest figures have been taken after adjustments for interest
reduction arising from rescheduling and rate reduction on outstanding debt to the Centre as
recommended by the TfFC. While projecting the revenue expenditure of various departments, a
clear distinction is made between plan and non-plan expenditure on the one hand and salary and
O&M expenditure on the other. Non-plan salary expenditure is expected to grow at a rate not
exceeding 5 percent. At the same time there is a genuine need to raise the operation and
maintenance (O&M) expenditure significantly to generate the intended outcomes of public
expenditure. It has to be noted that a substantial share of the plan revenue expenditure is also on
account of salary to employees who have been continuing from plan to plan. For all practical
purpose this is also in the nature of non-plan expenditure. Indeed, exceptions apart there is hardly
any need for fresh recruitment except in Education and Health during the medium term. The
salary expenditure even on the plan side should be growing at less than 10 percent per annum.
The average salary expenditure in Sikkim is highest among all the States, well beyond the state‟s
carrying capacity. In this fiscal environment, it is necessary to decelerate the growth in salary
expenditure. The State Govt. has got about 25000 regular employees and another 15000
workcharge, muster roll and Anganvadi workers together. The salary figures in the Govt. account
relate to only regular employees. The wages paid to other workers are accounted for in the O&M
expenditure. To restrain the escalation in salary expenditure two types of measures are required.
The past practice of regularising workcharge and muster roll workers should be strictly
discontinued. Policies should be geared to encourage private sector employment so that muster
roll workers get better opportunities in the private sector. Again, to encourage private sector
employment, it is important that regular Govt. employment should be made less attractive
monetarily than they are today. There are several cash benefits and perks like encashment of leave
which should be phased out.
The TfFC has recommended that the proportion of salary expenditure in total revenue expenditure
excluding pension and interest payments which was around 37 percent for all States should be
brought down to 35 percent by the year 2009-10. In the case of Sikkim this percentage is as high
as 51. The general prescription by the TfFC is that the States with higher than average salary share
should either reduce the salary burden or increase own revenues. A state like Sikkim with a
slender revenue base will have to adopt the first option.
Projection of revenue expenditure on power and transport need special mention. Since power and
transport in the state are departmentally operated and the net revenues of these departments are

ADB TA No. 4297-IND, Final Report
Capacity Building For Fiscal Reforms in Sikkim
23
significantly negative, the subsidy burden is directly borne by the state govt. Considering the
difficult terrain and the low levels of income of majority of the Sikimese it is unrealistic to expect
to run these facilities without subsidies. However, there is need for improving the operational
efficiencies of these departments, reducing the non-functional staff in these departments and
appropriately increasing the user charges. The combined effect of these measures is expected to
reduce the subsidies considerably.
The total revenue expenditure as a share of GSDP is expected to come down from 54.75 percent in
the base year to 50.94 percent in the terminal year of the forecast period. The decrease in revenue
expenditure more or less balances the reduction in revenue receipts mainly on account of reduction
in non-plan grants. As a result the revenue surplus as a share of GSDP remains more or less stable
throughout the forecast period. As a result revenue surplus in absolute terms steadily goes up from
Rs. 171 crore in 2005-06 to Rs. 287 crore in 2009-10. It implies that the conditionality associated
with the proposed fiscal responsibility legislation viz. revenue surplus should be maintained at a
minimum of Rs. 168 crore during the forecast period will be satisfied.
The fiscal deficit and the outstanding debt burden of the state will depend on the level of capital
outlay during the forecast period. If the capital outlay grows at the same rate as GSDP i.e. 12
percent per annum throughout the forecast period then the fiscal deficit will remain above 3
percent throughout the forecast period. If the capital outlay growth is reduced to 10 percent per
annum throughout the forecast period fiscal deficit will reduce below 3 percent in 2007-2008 but
will increase to levels above 3 percent in the subsequent two years. Outstanding debt of the state
as a ratio of GSDP will come down from 73 percent in the base year to 60 percent in the terminal
year in the former case and to 56 percent in the latter case. In order to maintain a level of fiscal
deficit below 3 percent during the last two years of the forecast period, either reduction of capital
outlay or a special dispensation from the Planning Commission will be required.

ADB TA No. 4297-IND, Final Report
Capacity Building For Fiscal Reforms in Sikkim
24
Table 11 Reform Scenario: Sikkim (Capital Outlay Growth: 12%) Rs. Lakh
2004-05 2005-06 2006-07 2007-08 2008-09 2009-10
1. Total Revenue 98782.5 103960 118014 132448 145160 161050
A Own Tax net of IT 8831.0 10017 11364 12894 14632 16606
A1. Sales Tax 4807.0 5499 6291 7197 8233 9419
A2. State Excise 3264.0 3656 4094 4586 5136 5752
A3. Land Revenue 43.0 46 48 51 54 58
A4. Stamp Duty & Reg. 141.0 158 177 198 222 248
A5. Motor Vehicle Tax 323.0 370 423 484 553 633
A6. Other Taxes 253.0 289 331 379 433 496
B. Own Non Tax (net of Lottery) 7662.0 8486 9811 11395 13289 15559
Net Lottery income 2886.0 2791 2791 2791 2791 2791
C. Share of Central Taxes 10670.0 20758 23765 27270 31359 36142
D. Grants 65358.5 61908 70283 78099 83089 89953
Plan Grants 47743.1 53472 59889 67076 75125 84140
Non-plan Grants 17615.4 8436 10394 11023 7964 5813
2. Total Revenue Expenditure
(net of lottery expenditure)
80708 86893 96117 106439 117999 132335
E. Interest 8693 9208 9769 10391 12453
F. Pension 3078.0 3205 3650 4165 4750 5425
G Education 16648.6 19146 22018 25320 29118 33486
H. Health 4369.0 5024 5778 6645 7641 8788
I. Police 5728.7 6104 6505 6931 7386 7870
J. Power 4122.7 4535 4988 5487 6036 6640
K. Transport 4453.7 4676 4910 5156 5414 5684
L. Other Revenue Expenditure 32281.2 35509 39060 42966 47263 51989
3. Capital Outlay 23868.26 26732 29940 33533 37557 42064
4. loans and advances:
(disbursements-receipts)
-23.30 -26 -29 -33 -37 -41
5. Revenue Deficit -18075 -17067 -21897 -26009 -27161 -28715
6. Fiscal Deficit 5770.34 9640 8014 7492 10360 13308
7. End of the period Debt 107296.3 116936.0 124950 132442 142802 156109
GSDP 147413 165103 184915 207105 231957 259792
Note: Revenue deficit with – sign indicates revenue surplus
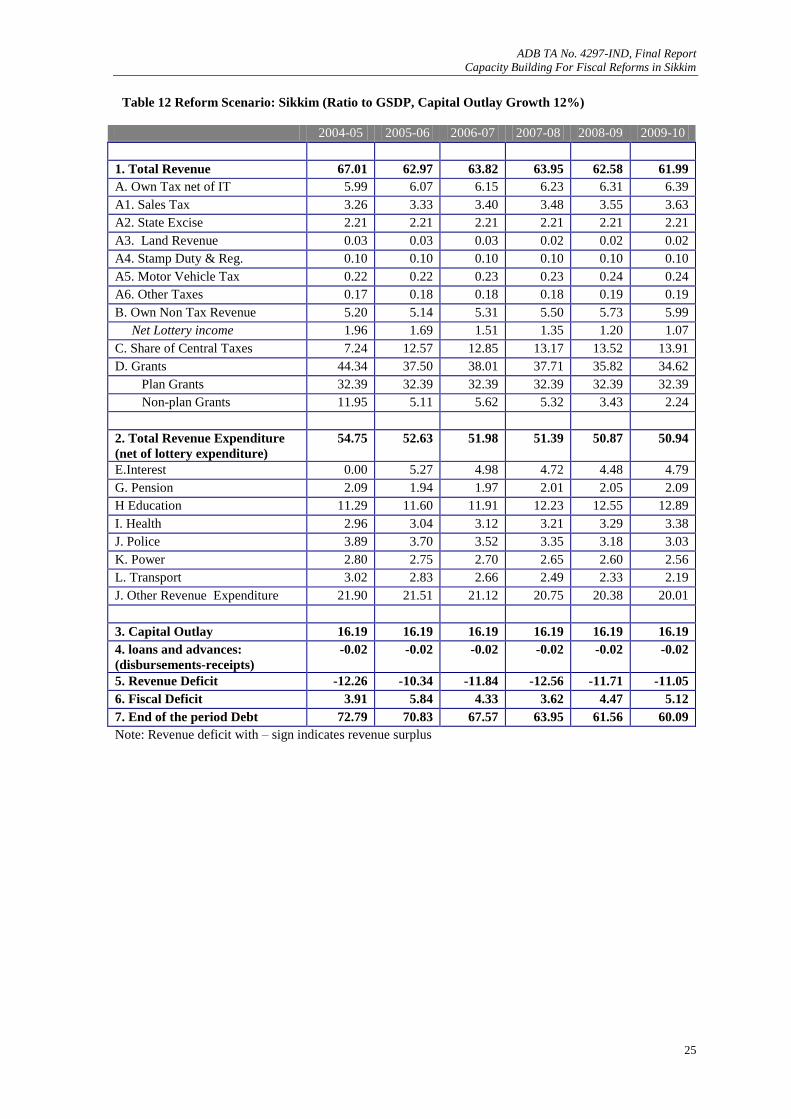
ADB TA No. 4297-IND, Final Report
Capacity Building For Fiscal Reforms in Sikkim
25
Table 12 Reform Scenario: Sikkim (Ratio to GSDP, Capital Outlay Growth 12%)
2004-05 2005-06 2006-07 2007-08 2008-09 2009-10
1. Total Revenue 67.01 62.97 63.82 63.95 62.58 61.99
A. Own Tax net of IT 5.99 6.07 6.15 6.23 6.31 6.39
A1. Sales Tax 3.26 3.33 3.40 3.48 3.55 3.63
A2. State Excise 2.21 2.21 2.21 2.21 2.21 2.21
A3. Land Revenue 0.03 0.03 0.03 0.02 0.02 0.02
A4. Stamp Duty & Reg. 0.10 0.10 0.10 0.10 0.10 0.10
A5. Motor Vehicle Tax 0.22 0.22 0.23 0.23 0.24 0.24
A6. Other Taxes 0.17 0.18 0.18 0.18 0.19 0.19
B. Own Non Tax Revenue 5.20 5.14 5.31 5.50 5.73 5.99
Net Lottery income 1.96 1.69 1.51 1.35 1.20 1.07
C. Share of Central Taxes 7.24 12.57 12.85 13.17 13.52 13.91
D. Grants 44.34 37.50 38.01 37.71 35.82 34.62
Plan Grants 32.39 32.39 32.39 32.39 32.39 32.39
Non-plan Grants 11.95 5.11 5.62 5.32 3.43 2.24
2. Total Revenue Expenditure
(net of lottery expenditure)
54.75 52.63 51.98 51.39 50.87 50.94
E.Interest 0.00 5.27 4.98 4.72 4.48 4.79
G. Pension 2.09 1.94 1.97 2.01 2.05 2.09
H Education 11.29 11.60 11.91 12.23 12.55 12.89
I. Health 2.96 3.04 3.12 3.21 3.29 3.38
J. Police 3.89 3.70 3.52 3.35 3.18 3.03
K. Power 2.80 2.75 2.70 2.65 2.60 2.56
L. Transport 3.02 2.83 2.66 2.49 2.33 2.19
J. Other Revenue Expenditure 21.90 21.51 21.12 20.75 20.38 20.01
3. Capital Outlay 16.19 16.19 16.19 16.19 16.19 16.19
4. loans and advances:
(disbursements-receipts)
-0.02 -0.02 -0.02 -0.02 -0.02 -0.02
5. Revenue Deficit -12.26 -10.34 -11.84 -12.56 -11.71 -11.05
6. Fiscal Deficit 3.91 5.84 4.33 3.62 4.47 5.12
7. End of the period Debt 72.79 70.83 67.57 63.95 61.56 60.09
Note: Revenue deficit with – sign indicates revenue surplus

ADB TA No. 4297-IND, Final Report
Capacity Building For Fiscal Reforms in Sikkim
26
Table 13 Reform Scenario: Sikkim (Ratio to GSDP, Capital Outlay Growth 10%)
2004-05 2005-06 2006-07 2007-08 2008-09 2009-10
1. Total Revenue 67.01 62.97 63.82 63.95 62.58 61.99
A. Own Tax net of IT 5.99 6.07 6.15 6.23 6.31 6.39
A1. Sales Tax 3.26 3.33 3.40 3.48 3.55 3.63
A2. State Excise 2.21 2.21 2.21 2.21 2.21 2.21
A3. Land Revenue 0.03 0.03 0.03 0.02 0.02 0.02
A4. Stamp Duty & Reg. 0.10 0.10 0.10 0.10 0.10 0.10
A5. Motor Vehicle Tax 0.22 0.22 0.23 0.23 0.24 0.24
A6. Other Taxes 0.17 0.18 0.18 0.18 0.19 0.19
B. Own Non Tax Revenue 5.20 5.14 5.31 5.50 5.73 5.99
Net Lottery income 1.96 1.69 1.51 1.35 1.20 1.07
C. Share of Central Taxes 7.24 12.57 12.85 13.17 13.52 13.91
D. Grants 44.34 37.50 38.01 37.71 35.82 34.62
Plan Grants 32.39 32.39 32.39 32.39 32.39 32.39
Non-plan Grants 11.95 5.11 5.62 5.32 3.43 2.24
2. Total Revenue Expenditure
(net of lottery expenditure)
54.75 52.63 51.98 51.39 50.87 50.94
E.Interest 0.00 5.27 4.98 4.72 4.48 4.79
G. Pension 2.09 1.94 1.97 2.01 2.05 2.09
H Education 11.29 11.60 11.91 12.23 12.55 12.89
I. Health 2.96 3.04 3.12 3.21 3.29 3.38
J. Police 3.89 3.70 3.52 3.35 3.18 3.03
K. Power 2.80 2.75 2.70 2.65 2.60 2.56
L. Transport 3.02 2.83 2.66 2.49 2.33 2.19
J. Other Revenue Expenditure 21.90 21.51 21.12 20.75 20.38 20.01
3. Capital Outlay 16.19 15.90 15.62 15.34 15.07 14.80
4. loans and advances:
(disbursements-receipts)
-0.02 -0.02 -0.02 -0.02 -0.02 -0.02
5. Revenue Deficit -12.26 -10.34 -11.84 -12.56 -11.71 -11.05
6. Fiscal Deficit 3.91 5.55 3.76 2.77 3.34 3.73
7. End of the period Debt 72.79 70.54 66.74 62.36 59.01 56.42
Note: Revenue deficit with – sign indicates revenue surplus
A few important fiscal indicators relative to GSDP for the forecast period under the two alternate
scenarios are presented in the following graphics. They include (i) total revenue receipts (ii) total
revenue expenditure (iii) revenue surplus (iv) fiscal deficit and (v) outstanding debt. The last two
under the reform scenario correspond to two alternative levels of capital outlay viz. 12 percent and
10 percent of GSDP. It is clear from the graphics that the reform scenario emphasizes more on
revenue expenditure than revenue receipts as compared to the baseline scenario.

ADB TA No. 4297-IND, Final Report
Capacity Building For Fiscal Reforms in Sikkim
27
Figure 1 Total Revenue Receipts percentage to GSDP
54.00
56.00
58.00
60.00
62.00
64.00
66.00
68.00
2004-05 2005-06 2006-07 2007-08 2008-09 2009-10
Baseline Reforms
Figure 2 Total Revenue Expenditure percentage to GSDP
46.00
48.00
50.00
52.00
54.00
56.00
58.00
60.00
2004-05 2005-06 2006-07 2007-08 2008-09 2009-10
Baseline Reforms
Figure 3 Revenue Surplus percentage to GSDP
0
2
4
6
8
10
12
14
2004-05 2005-06 2006-07 2007-08 2008-09 2009-10
Baseline Reforms

ADB TA No. 4297-IND, Final Report
Capacity Building For Fiscal Reforms in Sikkim
28
Figure 4 Fiscal Deficit percentage to GSDP (Reform 1: 12% & Reform 2: 10% capital outlay growth)
0.00
2.00
4.00
6.00
8.00
10.00
12.00
14.00
16.00
2004-05 2005-06 2006-07 2007-08 2008-09 2009-10
Baseline Reform 1 Reform 2
Figure 5 Outstanding Debt percentage to GSDP (Reform 1: 12% & Reform 2: 10% capital outlay growth)
0.00
10.00
20.00
30.00
40.00
50.00
60.00
70.00
80.00
90.00
100.00
2004-05 2005-06 2006-07 2007-08 2008-09 2009-10
Baseline Reform 1 Reform 2
The fiscal situation during forecast period which emerges from the baseline scenario is
unsustainable. In this, the revenue surplus steeply comes down and almost vanishes by the
terminal year. Almost the entire capital outlay will have to be financed by borrowing in the final
year of the forecast period. The explosive growth in fiscal deficit jacks up the Debt-GSDP ratio of
the State from 73 percent in the base year to as much as 87 percent in the final year. This scenario
also implies that the State will not be able to benefit from the debt write-off scheme by enacting
the fiscal responsibility legislation. The fiscal situation arising from the reform scenario is
consistent with the stipulation regarding the fiscal responsibility legislation as far as to revenue
surpluses are concerned.

ADB TA No. 4297-IND, Final Report
Capacity Building For Fiscal Reforms in Sikkim
29
Box III FRBM Act for Sikkim – Some Considerations
Sikkim‟s Debt: GSDP ratio is one of the highest among the States at about 73% in 2004-05. In contrast
Sikkim‟s interest payment burden as a percentage of revenue receipts is one of the lowest among the States
at about 10%. This is on account of the fact that revenue receipts constitute over 60% of GSDP in Sikkim.
This is also due to better cash management in the State.
Debt sustainability of a State can be assessed in terms of debt as a percentage of total revenue receipts.
Sikkim‟s debt including contingent liabilities works out to just about 100% of the total revenue receipts,
which is the lowest ratio among all the States. Therefore debt sustainability is not a serious problem for
Sikkim at this juncture.
For Sikkim to enjoy the full benefit of debt relief from consolidation, rescheduling and lowering of interest
rate to 7.5 percent as recommended by the TfFC, the State has to enact the FRBM legislation before the end
of FY 2005-06. FRBM Act should prescribe (a) specific annual targets for revenue surplus and fiscal
deficit; (b) ceiling along with a path for reduction of borrowings and guarantees.
To benefit from the Debt Write Off Scheme recommended by the TfFC, Sikkim has to maintain a revenue
surplus of at least Rs.168 crore (which was the average for 2001-02, 2002-03 and 2003-04) in each year
during the TfFC award period. Further, the fiscal deficit has to be contained at about 4 percent of the GSDP,
which was the actual level in 2004-05, during every year of the award period.
Under the Reform Scenario detailed in section 2.4, the State Govt. will be able to ensure a level of revenue
surplus well above Rs.168 crore during each year of the award period. Indeed, an increasing tempo of
revenue surplus is indicated over the years.
The level of fiscal deficit and the outstanding State debt will depend on the level of borrowing for capital
expenditure during the forecast period. Under the reform scenario two alternate adjustment paths have been
indicated. If the capital outlay grows at the same rate as GSDP i.e. 12% per annum throughout the forecast
period, fiscal deficit will remain above 4% of GSDP in every year except the third year of the forecast
period. If the growth of capital outlay is reduced to 10% per annum, the fiscal deficit will come down below
4% of GSDP every year except the first year of the forecast period. In the former scenario the outstanding
State debt will secularly come down from about 73% of GSDP in 2004-05 to about 60% in 2009-10. In the
latter scenario the corresponding reduction will be even faster to reach a level of 56..4 percent by the
terminal year.
The above picture emerges under the assumption that the entire capital expenditures in the State will be
financed from borrowed funds. This, however, may not be required. It is reported that Central Government
has agreed to finance the construction of State Airport and major State Highways through the Ministries of
Civil Aviation and Road Transport respectively. If this be the case the State Govt. borrowings can be
considerably lowered to ensure that the fiscal deficit remains within limits.

ADB TA No. 4297-IND, Final Report
Capacity Building For Fiscal Reforms in Sikkim
30
3. State Tax and Non-tax Revenues and Reform
Issues
3.1 Profile of State Taxes: An Introduction
In general the states‟ own revenues are lower than the central transfers in all special category states
and Sikkim is no exception to this. There have been efforts to improve the own tax base of the
state as a result of which growth in recent years has picked up. The tax collection in nominal
terms, which was Rs.15.9 crores in 1989-90, has increased to Rs.108 crores in 2003-04 with an
annual average growth rate 15.7 percent. Sikkim has the unique feature of collecting income tax
in the state due to the provision of protecting some prevalent laws at the time of its merger with the
country. Own tax revenue collected by Government of Sikkim accounted for 8 percent of total
revenue during 2003.04. Share of own tax revenue in total revenue of the State constituted around
12 percent during 1989-90, which declined sharply to about 3 percent during late nineties and after
2000-01 it had shown signs of improvement. However, the annual growth rates of own taxes has
fluctuated considerably over the years (Figure 6).
The Collection of state taxes in Sikkim compares favorably among the special category states
(Table 14). The collection of income tax under State laws in Sikkim is not included while
estimating the tax ratios. Own tax and GSDP ratio in Sikkim during the period 1993-94 to 2002-
03 remained higher than in many of the special category states barring Assam and Himachal
Pradesh, and Uttaranchal, for the last two years.
Table 14 Own Tax GSDP Ratio of Special Category States
Percentage
1993
-94
1994
-95
1995
-96
1996
-97
1997
-98
1998
-99
1999
-00
2000
-01
2001
-02
2002
-03 Arunachal Pradesh 0.41 0.59 0.66 0.73 0.74 0.74 0.85 1.15 1.57 1.68
Assam 3.97 3.53 3.56 3.66 3.90 3.81 4.17 4.17 4.51 5.07
Himachal Pradesh 5.07 4.67 4.86 4.66 4.59 4.89 4.71 4.80 5.52 4.91
J &K 2.94 3.16 3.22 2.93 3.11 2.84 3.25 4.22 4.26 5.03
Manipur 1.28 1.46 1.57 1.38 1.54 1.11 1.20 1.02 1.24 1.36
Megahalaya 2.85 3.08 3.13 3.47 2.62 3.05 3.16 3.33 3.26 3.18
Mizoram 0.62 0.56 0.57 0.55 0.69 0.67 0.68 0.73 0.96 1.24
Nagaland 1.24 1.04 1.26 1.56 1.24 1.06 1.22 1.09 1.20 1.26
Sikkim 3.46 2.94 3.91 3.61 4.01 3.28 3.42 4.02 4.50 5.23
Tripura 2.01 1.86 1.98 2.00 1.90 2.00 2.01 2.09 2.24 2.25
Uttaranchal 1.90 5.88 6.16
Total 3.39 3.21 3.29 3.27 3.34 3.28 3.48 3.40 4.24 4.50
Source: Finance Accounts of Respective States and TfFC Report for Comparable GSDP.

ADB TA No. 4297-IND, Final Report
Capacity Building For Fiscal Reforms in Sikkim
31
Figure 6 Annual Growth Rate of Own Tax Revenue
-20.00
-10.00
0.00
10.00
20.00
30.00
40.00
50.00
1990-9
1
1991-9
2
1992-9
3
1993-9
4
1994-9
5
1995-9
6
1996-9
7
1997-9
8
1998-9
9
1999-2
000
2000-0
1
2001-0
2
2002-0
3
2003-0
4
2004-0
5 R
E
The important sources of own revenue in Sikkim are, income tax levied under state laws (25
percent), sales tax (45 percent), excise duty (23 percent), and motor vehicle tax (3 percent) (Table
15). The composition of individual state taxes in own taxes reveal relative changes over the years.
Sales tax collections accounted for 17 percent of own tax revenue in 1989-90, which has increased
to 45 percent in 2003-04. During the same period, state excise duty has declined from 48 percent
to 23 percent. The income tax under state laws was around 25 percent of Own tax Revenue in
2003-04, which has actually declined from a high of 39 percent in 1998-99. Share of land revenue
and stamps and registration fees in own taxes has declined over the years.
The improvements in tax collection in the recent years is seen in terms of increase in the buoyancy
of the state‟s own taxes from 0.76 during 1995-96 to 2003-04 to 1.51 during 1985-86 to 1994-95.
The buoyancies of major taxes like sales tax, income tax and excise duty have improved in the
second period. However, the buoyancy of state excise duty despite improvement is continues to be
less than one. At the same time buoyancy of motor vehicle tax and land revenue have declined.
The improvements in the recent years depended more upon ad hoc increases in tax collections
from income tax derived from lottery income which has proved to be a very unstable source of
revenue and from higher collections of sales tax. The revised estimates for 2004-05 pitch for a
lower target of revenue collection even in nominal terms. The revised estimates of 2004-05 for
both sales tax and income tax are lower than the actual collections in the previous year.

ADB TA No. 4297-IND, Final Report
Capacity Building For Fiscal Reforms in Sikkim
32
Expansion of own tax revenue in the State requires improvement in both the tax structure and the
administration. The volatility witnessed in the growth of state taxes needs to be contained to make
it a predictable source of revenue. The tax base of the state has been affected by factors like small
size of the state, low density of population, and lack of manufacturing activities. At the same time
some distortions in the tax structure itself has impacted the business activity adversely. The State
has introduced value added tax (VAT) from 1st April 2005 replacing the sales tax along with other
States in the country. Adoption of VAT is a welcome step in the process of tax reforms and is
expected to pave the way for a modern tax administration in the State. The VAT and other
individual state taxes have been analyzed in this report and feasible measures to enhance the tax
revenue have been suggested.
Table 15: Trends in Own Tax Revenue
Share in Own Tax Share in GSDP Tax Buoyancy
1989
-90
1995-
96
2003-
04
1989-
90
1995-
96
2003-
04
1985-
1995 1996-
2003
Own Tax Revenue 7.79 5.67 8.52 0.76 1.51
Income Tax 26.28 24.02 24.64 2.05 1.36 2.10 0.82 1.60
Land revenue 0.47 0.54 0.17 0.04 0.03 0.01 0.77 0.42
Stamps & Reg Fee 1.25 1.23 1.05 0.10 0.07 0.09 0.70 1.78
State Excise Tax 47.64 39.01 23.25 3.71 2.21 1.98 0.56 0.92
Total Sales Tax 17.07 27.11 45.01 1.33 1.54 3.84 1.15 2.01
Tax on Vehicles 2.10 4.58 2.52 0.16 0.26 0.21 1.15 0.74
Other Taxes 5.19 3.51 3.36 0.40 0.20 0.29 0.32 1.25
Source: Finance Accounts, GoS, Central Statistical Organisation
3.2 VAT in Sikkim: Introduction
The shortcomings of the sales tax system in Sikkim and the need to transform it into a value added
tax as per the decision of the Empowered Committee of State Finance Ministers from April 1,
2005 was discussed in the incepyion as well as interim reports. The problems associated with the
origin based tax system in a predominantly consuming state like Sikkim, the narrow base, multiple
rates, complicated system and distortions associated with the tax is by now a common knowledge
and we do not need to go into these here. The sales tax sytem in operation prior to the reform
applied the tax on tax, mark up on tax and tax on mark ups on the one hand and provided
significant scope for evasion and avoidance on the other. The discretion involved in the tax
administration and constant interwzction between the tax payers and tax collectors implied
significant scope for rent seeking and inequity. In short, the tax involved high levels of all the
three types of costs associated with any tax system and these are, the collection cost, compliance

ADB TA No. 4297-IND, Final Report
Capacity Building For Fiscal Reforms in Sikkim
33
cost and resource cost to the economy. Our analyses also highlighted the need to initiate
preparatory steps including the passing of the law and rules for the administration of VAT,
building administrative capacity through training, creating general awareness programmes among
the people and members of trade and industry and various steps including the transitional measures
to be taken to achieve a smooth transition. In addition, the various preparatory steps to be taken
and the detailed work plan for the introduction of the tax were also specifically indicated in some
detail. The international consultant with his team of legal and administrative experts and trainers
has worked closely with the officials of the department in carrying out these tasks and
implementing the reform. While the state government had a clear vision and action plan, the entire
introduction of VAT in the state required the „handholding‟ and this was done by the International
VAT expert along with his team. As the TA was implemented by the National Institute of PUblc
Finance and Policy (NIPFP), a leading think tank on fiscal policy in the country, the entire task
was not taken as a mere consultancy work, but a genuine opportunity to work with the state in
building its capacity in VAT policy and administration.
This report details the progress made in initiating the preparatory steps thus far and implementing
them for a smooth transition to VAT. The report also deals with the further initiatives and reforms
needed in this area for building capacity for the introduction of VAT including the creation of
separate cadre of officials to build expertise in the tax department and administrative re-
organisation of the tax department on functional lines to develop the expertise needed, improve
accountability and efficiency and minimise the compliance cost..
3.3 Adoption of VAT in Sikkim: Critical Policy and Operational Issues
The previous reports analysed the trends in sales tax revenues and highlighted the salient features
of the sales tax in Sikkim. The important issues highlighted in the reports are:
(i) Sales tax is the only important and broad based tax handle with the state
government and therefore, any attempt to improve the resource position from own
sources of revenue and improve fiscal independence of the State will have to focus on
improving the revenue productivity of the sales tax. Moreover, as the potential economic
impact of sales tax in terms of creating distortions through cascading and altering relative
prices can be large, it is important to calibrate reforms so as to achieve efficiency and
equity in tax policy. It must also be noted that Sikkim is largely consuming state with a
small population and not very high purchasing power. Yet, it is possible to enhance the
volume of businesses as considerable number of people visits the state as tourists.
Improving the coverage of the tax and also administration and enforcement can help to

ADB TA No. 4297-IND, Final Report
Capacity Building For Fiscal Reforms in Sikkim
34
improve the revenue productivity. From this viewpoint, switchover to the destination
based VAT is welcome.
(ii) The last four years have witnessed phenomenal increase in sales tax revenue with
annual average growth rate registering a record 39.7 per cent growth. In fact, the refvenue
performance of the state in mobilising revenues from sales tax has been impressive as
compared to the performances in other north-eastern states. Much of this, however, has
come about due to the individual initiatives of the officials of the tax department,
expansion of the scope of tax deduction at source and the introduction of floor rates as
recommended by the Empowered Committee of State Finance Ministers. There is
considerable scope for enhancing revenues through systemic reforms in the tax system
involving both the introduction of VAT, administrative re-organisation and strengthening
and improving the information system and enforcement of the tax based thereon.. Not
surprisingly, despite the recent impressive performance, the tax-GSDP ratio in the state is
still low.
(iii) It was pointed out that the impressive growth performance of revenue in the recent
past will provide a significant cushion to the State in switching over to VAT. As the
Central government has decided to compensate for the loss of revenue based on the
average growth rate of the best three years during the lest five years applied to base year
collections in 2004-05, the high growth rate recorded in the recent past provides sufficient
insurance for undertaking the reforms. In fact, the average growth rate of the best three
years during the last five years works out to 46.9 per cent (Table 16). This provides the
cushion needed to facilitate the reforms in the short run. This, however, should not lead to
complacency on the part of the tax administration. Continued efforts are necessary to
improve tax administration in the state.
(iv) In the long run too, the prospect of improving the revenue productivity is
reasonably bright and if appropriate policy and administrative measures are undertaken,
the state can enhance its revenues significantly. The critical factor in this will be the
decision to phase out the central sales tax (CST) and make the VAT destination based.
The central government proposes to phase out the CST in course of time. When it is
finally phased out, the tax will become fully destination based and as the goods imported
into the state from the rest of the country will not bear the tax, the entire base will be
available to the state to tax. It is important to gear up the administrative machinery to deal
with that situation.
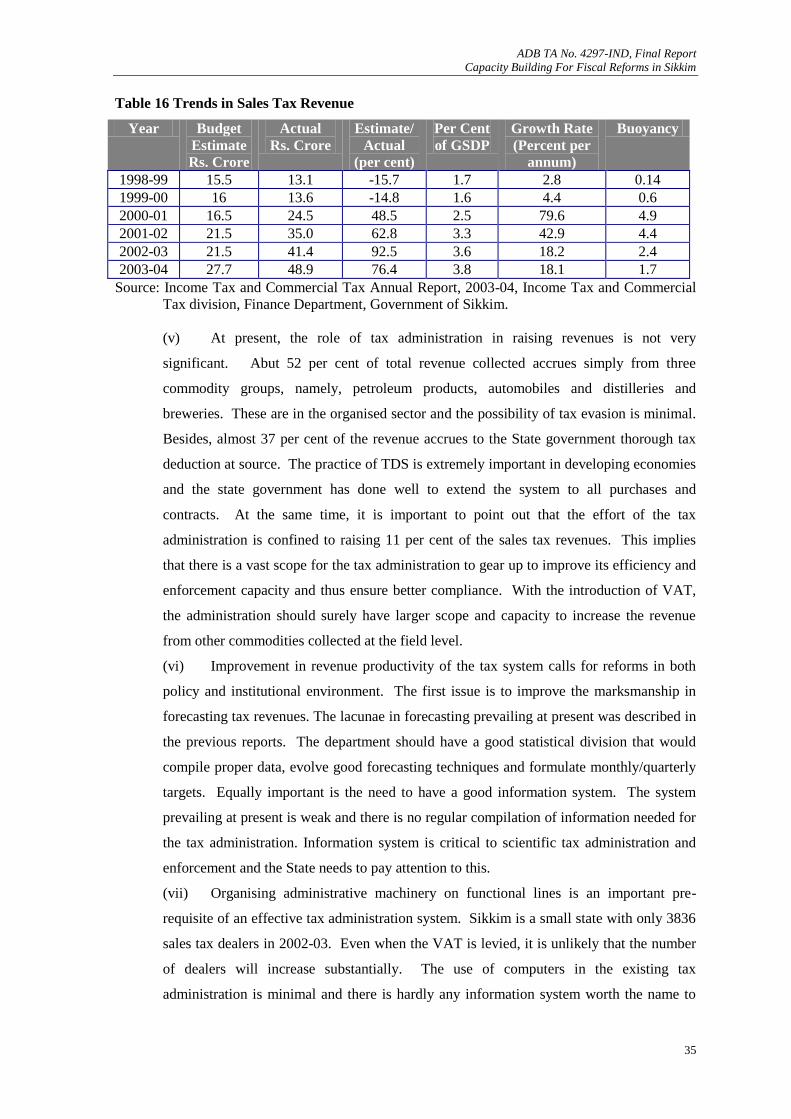
ADB TA No. 4297-IND, Final Report
Capacity Building For Fiscal Reforms in Sikkim
35
Table 16 Trends in Sales Tax Revenue
Year Budget
Estimate
Rs. Crore
Actual
Rs. Crore
Estimate/
Actual
(per cent)
Per Cent
of GSDP
Growth Rate
(Percent per
annum)
Buoyancy
1998-99 15.5 13.1 -15.7 1.7 2.8 0.14
1999-00 16 13.6 -14.8 1.6 4.4 0.6
2000-01 16.5 24.5 48.5 2.5 79.6 4.9
2001-02 21.5 35.0 62.8 3.3 42.9 4.4
2002-03 21.5 41.4 92.5 3.6 18.2 2.4
2003-04 27.7 48.9 76.4 3.8 18.1 1.7
Source: Income Tax and Commercial Tax Annual Report, 2003-04, Income Tax and Commercial
Tax division, Finance Department, Government of Sikkim.
(v) At present, the role of tax administration in raising revenues is not very
significant. Abut 52 per cent of total revenue collected accrues simply from three
commodity groups, namely, petroleum products, automobiles and distilleries and
breweries. These are in the organised sector and the possibility of tax evasion is minimal.
Besides, almost 37 per cent of the revenue accrues to the State government thorough tax
deduction at source. The practice of TDS is extremely important in developing economies
and the state government has done well to extend the system to all purchases and
contracts. At the same time, it is important to point out that the effort of the tax
administration is confined to raising 11 per cent of the sales tax revenues. This implies
that there is a vast scope for the tax administration to gear up to improve its efficiency and
enforcement capacity and thus ensure better compliance. With the introduction of VAT,
the administration should surely have larger scope and capacity to increase the revenue
from other commodities collected at the field level.
(vi) Improvement in revenue productivity of the tax system calls for reforms in both
policy and institutional environment. The first issue is to improve the marksmanship in
forecasting tax revenues. The lacunae in forecasting prevailing at present was described in
the previous reports. The department should have a good statistical division that would
compile proper data, evolve good forecasting techniques and formulate monthly/quarterly
targets. Equally important is the need to have a good information system. The system
prevailing at present is weak and there is no regular compilation of information needed for
the tax administration. Information system is critical to scientific tax administration and
enforcement and the State needs to pay attention to this.
(vii) Organising administrative machinery on functional lines is an important pre-
requisite of an effective tax administration system. Sikkim is a small state with only 3836
sales tax dealers in 2002-03. Even when the VAT is levied, it is unlikely that the number
of dealers will increase substantially. The use of computers in the existing tax
administration is minimal and there is hardly any information system worth the name to

ADB TA No. 4297-IND, Final Report
Capacity Building For Fiscal Reforms in Sikkim
36
assist in policy formulation, administration and enforcement of the tax. Naturally, poor
information system, lack of automation along with non-specialised administration does not
facilitate voluntary compliance. The tax administration to be evolved for administering
the VAT will require specialisation in terms of various functions to be performed,
increased use of computers and information system and will have to be reorganised on
functional lines. This issue is addressed later in the report.
(viii) There is an additional implementation problem of VAT in Sikkim and that has to
do with the existing income tax structure. Unlike other States in India, the agreement at
the time of accession is that Sikkim will continue to levy its own income tax as long as the
State does not decide to give up the right to the Central government to extend the income
tax system prevailing in the rest of the country to the State. The system of income tax
levied in the State, involves both inequity and distortions. Furthermore, the presumptive
income tax levied on traders on their turnover, is merely a duplication of the sales tax.
Thus, even when the introduction of VAT by the state minimizes cascading and relative
price distortions, the continuance of the turnover tax on traders as a presumptive income
tax will continue the distortions, besides making their businesses non-competitive. This
could force the trade and industry to work out methods to stay completely in the informal
sector and evade the tax. If that happens, it is harmful for the development of the state. It
is therefore important to have the tax system that is reasonable and just, and enforce it
properly. The improvement in the tax revenue should come from buoyant businness
environment and not by levying unreasonable and distorting taxes. From this viewpoint,
immediate rationalization of the income tax that is harmonious with the VAT system is
called for.
(ix) While in the short term, with the introduction of VAT, the state is not likely to
lose revenue, in the medium and long term there could be significant revenues gains. This
would come about due to better compliance of the tax due to its self policing nature and
minimization of distortions due to cascading. Greater gains to the economy and with that
to the VAT revenue will come about when the silk route is opened for businesses across
China. In fact, given the small population of the state, encouragement to tourism in the
state could also improve economic activity and revenue from the tax.
The inequity of the income tax system for the wage and salary earners has been discussed
separately in this report. The exemption limit is too low and does not take into account the basic
requirements for living. The schedule has a large number of rates and does not follow a
progressive pattern of burden distribution. It has disincentive for large buysinesses to locate inside
the state because, these businesses will have to pay the presumptive income tax in the state and

ADB TA No. 4297-IND, Final Report
Capacity Building For Fiscal Reforms in Sikkim
37
regular income tax to the Government of India. It is also in significant variance with the income
tax schedule for India and therefore, raises serious questions on horizontal equity with the rest of
the country. It is important to work out a harmonised system to ensure that the businesses located
in the state do not bear heavier burden of taxation than similar businesses located in other parts of
the country
The distortions from the tax arise mainly from the presumptive taxation levied on trade and
industry. The administrative difficulties have led to levying the presumptive tax which is three
percent of the sales turnover. In addition to the VAT, the trade and industry is supposed to pay
three per cent of the turnover as the presumptive income tax. Thus, whether the business makes
profits or losses, income tax is levied which is three per cent of the turnover over and above the
VAT. Therefore, businessmen argue that it would significantly reduce their profit margins. The
measure also discourages major inter-state businesses to locate in the state because, the profit
earned is subjected to tax again when the income tax levied by Indian Union is applied if the tax
payer is located outside the state and is required to pay tax on his global incomes. The fact that he
has already paid the income tax of the state does not give him exemption from the applicability of
Indian income tax. This is a confusing situation and needs to be remedied at the earliest. It is
important to reform the tax system and find ways to harmonise it to minimise the compliance cost
and to ensure that the business men are not discouraged from conducting businesses in Sikkim. In
the ultimate analysis, the tax system should not be a constraint in expanding business and trade in
the state.
Table 17 Composition of Sales Tax Revenue from Different Sources 2003-04
Sr. No Source of Revenue Amount
Rs. Crore
Per Cent of
Total
1 Distillery/Breweries 6.39 14.0
2. Petroleum Products 11.68 25.6
3 Automobile Dealers 5.64 12.4
4. CST from Cardamom /Ginger/Orange etc. 1.55 3.4
5. Retail Businesses 3.24 7.1
6 TDS from PSUs, NHPC, Pay & AO and Self
Drawing Departments
17.10 37.5
Total 45.61 100.0
Source: Income tax and Commercial Tax Division, Government of Sikkim.
As the TA itself commenced effectively from December 2004, the decision to implement VAT
with effect from on April 1, 2005 required the Team to assist the State government in bracing itself
for the task within a short time period. Thus, there was very little lead-time for the Team in
oreganising the efforts to prepare the state. Therefore, immediate technical assistance had to be
provided keeping in view the urgency in the implementation of the tax. As a part of this

ADB TA No. 4297-IND, Final Report
Capacity Building For Fiscal Reforms in Sikkim
38
assistance, draft law had to be prepared immediately and approval by the Legislature and
Presidential consent had to be obtained. The international consultant procured the services of a
legal expert to prepare the bill, which was passed by the Assembly. This enabled the State
government to implement the VAT from April 1, 2005. To facilitate the introduction of the tax,
the International expert with the help from the legal expert also drafted the VAT rules and after
approval by the Legislature, they too have come into force. In poreparing the VAT law and rules,
the assistance received by the Department, particularly Mr. K. N. Bhutia, the Additional Secretary,
Income tax and sales tax department was commendable. He actively collaborated with the legal
expert in finalising them.
Implementation of the VAT within a short period also required the International expert to
immediately build the capacity in the administration on the various conceptual, structural, legal
and administrative aspects of VAT. Thus, an important matter that was undertaken with urgency
was to impart basic training to the officials of the department on the VAT. Since the time period
available was short, capacity building had to be done with urgency. It had also to be sequenced
such that the issues requiring immediate attention such as structure, administration and accounting
had to be taken first and matters such as risk assessment and auditing was taken up later. This is
because, the latter issues would become relevant only after the first quarterly returns were filed and
there was some time available for it whereas, the former set of issues had to be immediately acted
upon. Two three day training programmes were undertaken for two batches of officials of the
department as well as those for the officials in related departments. The International VAT Expert
along with a group of other experts on VAT from NIPFP and outside conducted the training
programmes in Gangtok. The course outline is given in the Appendix 3.1 and 3.2. This enabled
the officials to acquire a basic understanding of VAT in the State including knowledge on
administration, accounting and computerisation.
The next stage of training dealt with with the issue of filing returns, accounting and auditing
issues, risk assessment for detailed audit, transitional issues, management information system and
issues relating to computerisation. As the payment of the tax was to commence at the end of the
first quarter in July 31, it was important to conduct training programs to build the state‟s
administrative capacity on these aspects prior to that. A team of experts led by the International
Expert organised the training programme in May 2005.
An equally important pre-requisite for the successful introduction of VAT is the publicity and
awareness programme for the trade and industry. Thanks to the initiative taken by the income tax
and sales tax department, awareness and general educational programme relating to VAT for the
benefit of the members of trade and industry was organised in Gangtok, Jorthang and Singtam. In
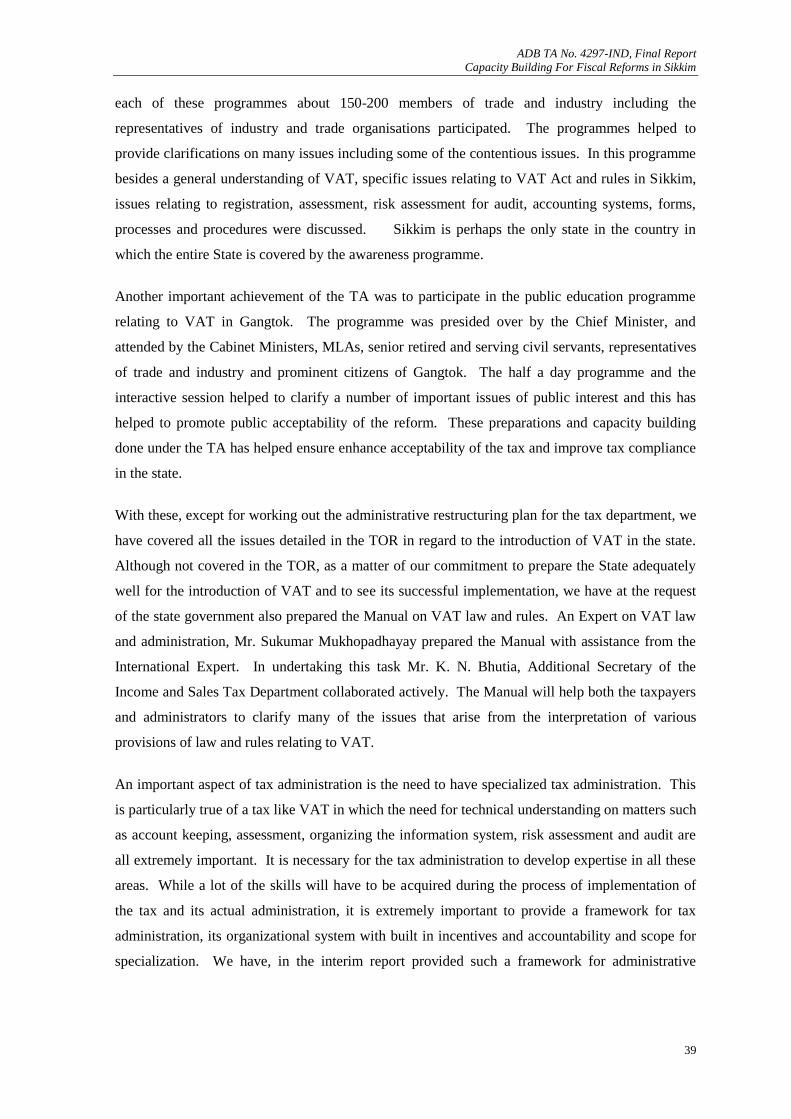
ADB TA No. 4297-IND, Final Report
Capacity Building For Fiscal Reforms in Sikkim
39
each of these programmes about 150-200 members of trade and industry including the
representatives of industry and trade organisations participated. The programmes helped to
provide clarifications on many issues including some of the contentious issues. In this programme
besides a general understanding of VAT, specific issues relating to VAT Act and rules in Sikkim,
issues relating to registration, assessment, risk assessment for audit, accounting systems, forms,
processes and procedures were discussed. Sikkim is perhaps the only state in the country in
which the entire State is covered by the awareness programme.
Another important achievement of the TA was to participate in the public education programme
relating to VAT in Gangtok. The programme was presided over by the Chief Minister, and
attended by the Cabinet Ministers, MLAs, senior retired and serving civil servants, representatives
of trade and industry and prominent citizens of Gangtok. The half a day programme and the
interactive session helped to clarify a number of important issues of public interest and this has
helped to promote public acceptability of the reform. These preparations and capacity building
done under the TA has helped ensure enhance acceptability of the tax and improve tax compliance
in the state.
With these, except for working out the administrative restructuring plan for the tax department, we
have covered all the issues detailed in the TOR in regard to the introduction of VAT in the state.
Although not covered in the TOR, as a matter of our commitment to prepare the State adequately
well for the introduction of VAT and to see its successful implementation, we have at the request
of the state government also prepared the Manual on VAT law and rules. An Expert on VAT law
and administration, Mr. Sukumar Mukhopadhayay prepared the Manual with assistance from the
International Expert. In undertaking this task Mr. K. N. Bhutia, Additional Secretary of the
Income and Sales Tax Department collaborated actively. The Manual will help both the taxpayers
and administrators to clarify many of the issues that arise from the interpretation of various
provisions of law and rules relating to VAT.
An important aspect of tax administration is the need to have specialized tax administration. This
is particularly true of a tax like VAT in which the need for technical understanding on matters such
as account keeping, assessment, organizing the information system, risk assessment and audit are
all extremely important. It is necessary for the tax administration to develop expertise in all these
areas. While a lot of the skills will have to be acquired during the process of implementation of
the tax and its actual administration, it is extremely important to provide a framework for tax
administration, its organizational system with built in incentives and accountability and scope for
specialization. We have, in the interim report provided such a framework for administrative

ADB TA No. 4297-IND, Final Report
Capacity Building For Fiscal Reforms in Sikkim
40
reorganization of the department. In what follows, these are detailed again with some
modifications and revisions to facilitate its implementation.
3.4 Administrative Restructuring Plan for Commercial Tax Department
Organising the tax administration for the effective implementation of VAT is, perhaps, the most
difficult and challenging task. This is because, tax administration should not merely be seen as the
department which merely collects the tax, but has the responsibility to promote voluntary
compliance. The department should help the taxpayers to comply with the tax. Furthermore, it is
important to evolve tax administration without interfacing the tax payers with administrators and
that requires development of the information and account based system of tax administration in the
state. Given that there is hardly any information system in place for determining either the tax
policy or to aid administration, the system of administration that would rely on computerized
information gathered from books of accounts rather than physical verification will have to be
developed from the scratch.
Tax compliance is the function of the rate of tax, probability of detection of non-compliance and
the penalty rate. In the prevailing situation, as mentioned above, the administrative organisation
and information systems are so weak that the probability of detecting non-compliance is virtually
zero. Further, even if detected, the delay in the judicial process ensures that the cases do not get
decided within a reasonable period and the conviction rate is small. Therefore, effectively, the
penalty rate is negligible. In the new system, it is important that both administrative and
legal/judicial reforms are important to enhance voluntary compliance of the tax.
While judicial reforms are outside the scope of our assistance, reorganisation of administration is a
critical component of improving its effectiveness. Administrative changes to promote voluntary
compliance of the tax requires that the administration should be geared to provide assistance to
taxpayers to comply with the tax, able to detect the stop-filers and non-compliers swiftly, extends
audit coverage such that each taxpayer is covered within a reasonable time period and the penalty
rate is deterrent enough to evoke better response. This implies that the tax department can not
continue as any other government department but should be a specialised agency capable of
dealing with influential and intelligent clientele that can hire the best of brains to evade and avoid
the taxes. Besides, the function of the Department is to earn revenue to the State government and
therefore, in order to improve revenue productivity, the government should be prepared to invest in
a specialised department. This implies that there should be a separate cadre of officials recruited
to the department with appropriate qualifications needed to understand economics and accounting
framework of VAT, book-keeping, computerised information and net-working and legal processes
and interpretations. The cadre should also be provided with proper training not only in the

ADB TA No. 4297-IND, Final Report
Capacity Building For Fiscal Reforms in Sikkim
41
beginning of their career, but also during their service period from time to time to keep up with
latest practices in accounting, information system, law and judicial interpretations.
The Department is seized of the importance of having a specialised revenue cadre and has initiated
steps to frame service and recruitment rules. It would be desirable to have separate recruitment,
promotion and service rules. It is also important to make the revenue department autonomous and
keep it away from pulls and pressures of political forces both in formulation of policy and in
implementation and enforcement aspects.
While an organised revenue cadre in the future is something that the State government should
consider with some measure of urgency, in the immediate context, the issue of remodelling the
existing tax department to administer the value added tax on scientific lines is germane. The
existing department is manned by a general cadre of State officials. They do not have any special
qualification nor are they given any specialised orientation or training to be able to undertake the
technical tasks associated with administration and enforcement of the tax. First of all, it is
presumed that the task of tax administration doe s not require any specialized skills. Secondly, the
transfers to and from the department are done in a routine manner and this has serious implications
for capacity development. We understand that a number of officials of the department, some of
them senior, were transferred after they have received training in VAT that we had imparted.
Figure 7 summarises the existing administrative organisation of the tax department in Sikkim.
The chart details the organisation of senior functionaries. Altogether, the sanctioned strength of
the department is 84. At present, there are 86 persons are working in the department. Of this,
eight are peons, six are drivers, six are assistant inspectors, one accounts clerk, 12 lower division
clerks, two stenographers and one upper division clerk. Besides, there are 18 checkers and 3 data
entry operators. Thus, almost 57 positions are the support staff and only 29 are involved in the
technical aspects of tax administration of both income and sales taxes in the State.
It is seen that the existing organisational structure is set up predominantly on geographical lines
and does not have any commitment to taxpayer services, computerisation of returns or generate a
proper information system. Policy, planning and operations are all mixed up. There is no
organisational structure to deal with large tax payers even though, it is clear that three commodity
groups pay the bulk of the tax as discussed earlier. The prevailing structure is clearly unsuited to
deal with information based and a scientific system of tax administration under VAT.
Ideally, the entire tax administration including the personnel to occupy various specialised
positions under VAT administration should be designed de novo. However, that is not a feasible
option and the existing administrative structure will have to be adjusted and modified to build the

ADB TA No. 4297-IND, Final Report
Capacity Building For Fiscal Reforms in Sikkim
42
VAT administration structure. In doing this, however, it is important to understand clearly the
ground realities and special features of the sales tax system prevailing in the State and design the
administrative structure to take into account the special features.
In designing the tax administration, it is important to note that Sikkim is a very small State and
there were only 3836 dealers in 2002-03. In fact, the number of active dealers has remained
virtually stagnant and since 2000-01, the increase was by just about 200 dealers. Even more
important feature is the skewed distribution of the dealers in terms of turnover range (Table 18). It
is seen that in 2002-03, there were only 49 dealers constituting 1.3 per cent of the total number
with more than Rs. One crore turnover and they contributed over 76 per cent of the tax (excluding
the tax deducted at source). Furthermore, the dealers with more than Rs. 50 lakh turnover
numbered just about 70 constituting less than two per cent of the total number of dealers and they
contributed to about 80 per cent of the tax paid. If dealers with more than Rs. 20 lakh turnover are
taken, there were only 570 dealers constituting less than 15 per cent and they contributed to over
92 per cent of the tax. Thus, 85 per cent of the dealers have less then Rs. 20 lakh turnover and
they contributed less than 8 per cent of the tax.
This important information provides very useful inputs for both tax policy and administration.
First, the State is not likely to lose much revenue by increasing the limit for registration to Rs. 5
lakh. This will reduce the administrative workload significantly as about 35 per cent of the dealers
will go out of the ambit of VAT and the revenue lost will be less than two per cent. Second, it
would also be useful to have a composition arrangement for dealers up to Rs. 20 lakh as the
administrative burden will come down drastically as almost 3266 dealers out of 3836 will go out of
the tax net. While this is a bit exaggerated as the importers, irrespective of the turnover limit will
have to register anyway, there is no doubt that increasing the threshold for registration as well as
for compounding, would considerably reduce the administrative workload without adversely
affecting the tax collections. In any case, there is a strong case for increasing the threshold to Rs. 5
lakhs and compounding facility to Rs. 10 lakhs.
Table 18 Turnover Range –Wise Tax Payers and Tax Paid (2002-03)
Turnover Range (Rs) No. Dealers Tax Paid
(Rs. Thousand)
Percentage of
total dealers
Percentage of
total tax paid
0-50000 243 450 6.33 0.17
50001-500000 1071 4544 27.92 1.71
500001-1000000 1358 7445 35.40 2.80
1000001-2000000 594 8755 15.48 3.29
2000001-5000000 500 34235 13.03 12.87
5000001-10000000 21 8194 0.55 3.08
Above 10000001 49 202448 1.28 76.09
Total 3836 266071 100.00 100.00
Source: Income Tax and Commercial Tax Division, Government of Sikkim.
ADB TA No. 4297-IND, Final Report
Capacity Building For Fiscal Reforms in Sikkim
43
Figure 7 Organisational Chart of Tax Department in Sikkim
Special Secretary
Joint Secretary –
Income tax
Additional
Commissioner-I
(S/W)
Additional
Commissioner- II
(N/E)
North and East Joint Commissioner-I (S/W) Deputy Secretary (ITO)
inspector/North and Gangtok
Income Tax Officer
(N/E)
Income Tax Officer (S/W)
Inspector
Inspector
Deputy Commissioner (S/W)
Assistant Commissioner
(S/W)
Inspectors -2
Joint Commissioner –II (N/E)
Deputy Commissioner I
North and Gangtok
Deputy Commissioner II
Rest of Sikkim
Assistant Cmmisioner
Inspector
Assistant commissioner
Assistant Commissioner
(Rangpo Checkpost
Inspector
Inspector

ADB TA No. 4297-IND, Final Report
Capacity Building For Fiscal Reforms in Sikkim
44
The second important policy implication that follows from the table is that there is certainly a need
to have a large taxpayer unit. To begin with the unit can service the tax payers with more than Rs.
1 crore turnovers. There are only 49 such dealers and they deserve to be serviced with personal
attention. This also implies that these dealers need to be audited systematically; the unit should
compile detailed information system of not only these dealers but all the dealers with more than
Rs. 50 lakh turnover. This is a feasible proposition as the total number of dealers thus included
will be just 70.
3.5 Functional Reorganisation of Administration in the Sales Tax Department
The most important aspect of the administration of VAT is to organise the various activities in
such a manner that it would facilitate tax collections and enhance tax compliance and provide the
necessary feedback for both policy and operation of the tax system. It must be mentioned that
Sikkim is a small state, the number of tax payers are small and it does not need to decentralise the
administrative organisation beyond a point. We have therefore, worked out the administrative
organisation which keeps both policy, process and operations control at the headquarters, but
actual operations are carried out at the regional offices.
In designing the tax administration, it is important to keep the major functions in mind and assign
them in such a manner that the comparative advantage of the headquarters and regional offices are
taken into account. Accordingly, the major functions of the headquarters organisation summarised
in Figure 8 are:
1. Policy aspects;
2. Issues related to law, rules and their applications.
3. Overall management of the tax administration involving recruitment, training and
staff development;
4. Overall budget control of the department; Computerisation including hardware and
software development, management information system, collation of information and
monitoring the check-posts, assistance to tax administration through risk assessment and
audit selection.
5. Co-ordination of the functions of the regional offices.
6. Taxpayer services including advisory functions, awareness programs taxpayer education
and publicity.
7. Management of large taxpayer unit which should provide a one-stop shop for the tax
payers. All functions relating to registration, return processing, payment processing,
assessment, auditing and appeals should be undertaken by the unit.

ADB TA No. 4297-IND, Final Report
Capacity Building For Fiscal Reforms in Sikkim
45
The regional offices, on the other hand will be involved in the actual operations and working out a
system for improving tax compliance besides providing the support services. The specific tasks
which the regional offices should focus are given in Figure 9 are summarised below:
1. Operation of the tax system includes:
(i) Registration;
(ii) Returns filing, returns processing and payment processing;
(iii) Taxpayer services including advisory functions, field visits for registration, providing
and accepting forms (registration, returns form 20 etc,), publicity, awareness and
education.
2. Facilitating compliance includes:
(i) Assessment (where required)
(ii) Auditing (assessment);
(iii) Arrears collection;
(iv) Inspection, fraud investigation and enforcement.
3. Providing Support services including:
(i) Management of check-posts
(ii) Support services to management information system.
An important aspect of administrative organisation while undertaking a major reform such as
introduction of VAT is to prioritise the operations. For the first year, there will be overlapping of
both the systems in some areas. Besides dealing with the stocks and transitional issues, the
assessment of the previous years will continue for some time and some staff will have to be
devoted for the purpose. One simple way to avoid bulk of the work load is to accept all returns
with less than Rs. 20 lakh turnover without detailed scrutiny as assessed unless there are specific
reasons for not doing so. This would reduce the work load considerably and would leave only
about 600 cases for detailed assessment. This would also avoid unnecessary harassment of small
taxpayers and remove uncertainty in their minds.
An important aspect of organising administration in the first year is prioritisation. The deployment
of staff will depend upon the urgency of the function to be performed. In the first few months, for
example, the taxpayer services will be of immense importance and priority. In the first six months
of introducing the tax, advisory function is an important function and this should be undertaken at
both central and regional levels. At the regional level, the taxpayers‟ services unit would have
expanded operations. Besides advisory functions, field visits may be needed to check the
authenticity of the dealers and providing forms for registration and accepting returns have to be
done. The returns filing will start only after the first quarter is over and scrutiny will start only

ADB TA No. 4297-IND, Final Report
Capacity Building For Fiscal Reforms in Sikkim
46
after that. However, in the initial months, the most important tax payer service involves providing
advisory services to the taxpayers and this is extremely important and adequately trained personnel
should be deployed both at the headquarters and in the regional offices.
While in the new system, self assessment reduces the need for deploying many persons for
undertaking assessments, detailed audit of large taxpayers and those selected for detailed audit of
those taxpayers chosen on random weighted with risk assessment basis will constitute an important
task. Typically, in any tax administration, almost one-third to one-half of the officials is involved
in audit cases. These should have the necessary background and training in accounts and audit and
investigations and should work closely with the computerisation unit. It would be preferable to
place the audit department in the headquarters with sufficient checks and balances to ensure better
compliance of the tax with minimum harassment and compliance cost to the taxpayers. Sikkim is
a small state and placing the audit in the headquarters under a senior functionary should help to
improve tax compliance while minimising rent seeking.
An important issue that requires the attention of administrative organisation is the need to have the
large taxpayer unit and taxpayers with more than Rs. One crore turnover should be included in this
unit. This unit should be sufficiently staffed with well trained personnel and should serve as a one
stop shop to these tax payers. The persons in this unit should have good training not only in
accounts but also be familiar with computer operations and should be able to access the
information. It should work closely with the computerisation unit. It should be managed by one
of the Deputy Chiefs and if necessary by the Chief Executive himself as the revenues involved are
large and hierarchical decision making is time consuming. The unit should be located in the
headquarters, but the personnel servicing the unit may be posted in the field to facilitate
compliance of the tax and to assist the large taxpayers. The location of the unit in the headquarters
does not mean that the large tax payers will have to travel all the way to Gangtok to comply with
the tax. The purpose of the unit should be to service them as they are valuable taxpayers.
The co-ordination of regional organisations should be done by one of the deputy chiefs who should
help to link them with the headquarters. Much of the day to day administration of the tax except
those relating to policies, law, keeping the management information system and those involving
the large taxpayers should be undertaken by the regional offices and a senior person, of the level of
deputy chief should be able to co-ordinate the work among the regional offices and with the
headquarters.
Another most important part of the tax administration is the management information system.
Computerisation of tax returns will help in building the information. In addition, the information
ADB TA No. 4297-IND, Final Report
Capacity Building For Fiscal Reforms in Sikkim
47
collected at the check-posts should be collated and matched with those of various taxpayers and
kept in their files which may be used at the time of assessment and audit. The matching of
purchases and sales of some dealers on a selective basis will help to strengthen the voluntary
compliance. The system should be geared to help in auditing and in the selection of audit cases
based on risk assessment. The information system generated by the unit would also help in
formulation of policies and strategies for evolving effective administration. In the initial stages, it
would be necessary to outsource the function to the agency providing computerised services, but
over time, it would be useful to have some people in the department trained in the system.
So far the issue of re-organising the administrative machinery to improve tax collections and
enhance voluntary compliance of the tax has been discussed. No indication has been given about
the number of officials to be deployed to carry out each of the functions. First, the overall strength
of the unit should be sufficient to manage the administration of the department. There is no need
for additional appointments in the department, but it would be useful to induct people, qualified in
accounts instead of generalists, through appropriate transfers. They should be given rigorous
training on issues relating accounting, audit and law. Assignment of the staff to various
departments should be dictated by the workload. As mentioned earlier, in the initial stages,
taxpayers services is an important function, but after three months more staff need to be deployed
to scrutinise the returns and later assessment and audit. The last function requires the bulk of the
staff and proper arrangement should be made to train them. It may be uneconomical to have a
separate training facility for the officials of Sikkim itself. It may be useful for the north-eastern
States together to create a common training facility.
The Chief Executive of the Tax Department, who at present is a Special Secretary is a critical
position and it is important to ensure that the person has specialised knowledge and has a
reasonable tenure of office. Considering the fact that VAT is a new initiative and requires
specialised technical knowledge, it would be useful to depute him to understand the VAT systems
prevailing in European Union at Brussels and in Canada. These are the two countries operating
the VAT within a decentralised framework in a federal economy and much will be gained by
analysing the administrative organisation, accounting systems, auditing and management
information system in these countries. This is extremely important for, the Chief Executive has to
trigger change management and this is possible only when he sees ideal operating systems. The
ADB could explore the possibility of providing the necessary funds for the purpose.

ADB TA No. 4297-IND, Final Report
Capacity Building For Fiscal Reforms in Sikkim
48
Figure 8 Headquarters Organisation
Chief
Executive
Dy. Chief
Policy and
Administration
Dy. Chief
Administration
Computerisation
Dy. Chief
Taxpayer services
and large unit
Policy Legal Taxpayer
Services
Management
Information
System
Risk assessment
and audit
selection
Monitoring the
check-posts
Systems
analysis;
hardware and
software
development.
Large taxpayer
Unit
Legislations
Appeals and
revisions
Inspectorate (Hq)
Advise to
regional
inspectorate.
Dy. Chief
Operations –
Regional Offices
Regional Office -
Gangtok
Regional Office-
South and West
Regional Office-
North and east Management
and Finance
Recruitment,
Personnel
management, and
training, staff
development
Prepare annual
report
Accounts and
budget allocation
Monitor
expenditure
Manag
Audit

ADB TA No. 4297-IND, Final Report
Capacity Building For Fiscal Reforms in Sikkim
49
Figure 9 Organisation of Regional Office
Regional Office Chief
Assistant Chief
(Operations)
Assistant Chief
(Compliance)
Assistant Chief
(Support Services)
Taxpayer Services Registration
Returns processing
Arrears Collection
Inspectorate
Fraud investigation Checkposts MIS Support

ADB TA No. 4297-IND, Final Report
Capacity Building For Fiscal Reforms in Sikkim
50
3.6. Training and Public Awareness Programme for VAT in Sikkim
As a part of the initiative to assist Sikkim in the transition into a VAT regime, the International
Expert in VAT with a team of experts from the National Institute of Public Finance and Policy
(NIPFP) organized training programmes for the officials of the Government of Sikkim. Given the
timing of the programmes and the impending introduction of VAT, it was felt that the programme
should be divided into two parts, an introductory programme and an advanced programme. The
former was designed to cover issues relating to the concept of VAT, the design of VAT and an
assessment of the proposed structure of VAT, issues relating to inter-state trade and an overview of
the issues relating to the administration of VAT, with specific focus on the pre-introduction issues
like registration. A brief discussion of transitional issues too was included. The schedule of
lectures is given in Appendix 3.1. A second programme was designed to elaborate on various
issues relating to the administration of the tax and was held during May, 2005. The second training
programme included five broad modules
Data analysis, MIS and Computerisation for VAT: Issues and options
Understanding and analyzing accounts
Risk assessment and audit
Checkposts, Inspections and Enforcement
Performance evaluation and performance monitoring
Since the State does not have a dedicated sales tax cadre or even a revenue cadre, the training
programmes covered officials from all relevant departments, i.e., officials who could get
potentially posted to the department. Further, so as to ensure smooth functioning of the
departments even while conducting the training programmes, two programmes for the introductory
programme and one programme in the advanced training were organized. The introductory and
conceptual programme for both the groups was completed during February 21-23, 2005 and March
2-4, 2005. The advanced training programmes were held on , 2005. Since Sikkim expects the first
set of returns to be coming in only by the middle of July, this timing was to ensure that the training
was completed before the major tasks within the new tax regime were initiated.
Each of the introductory programmes had 32 participants. The lectures were organized so as to
encourage active interaction with the participants. However, given the varied background of the
participants, the discussion had to be kept simple in regard to some points to ensure that the basic
message was clear to all the participants. In order to assess the effectiveness of the programme, a
feedback form was circulated among the participants, at the end of the third day. The participants
were asked to assess each lecture and in addition, provide overall comments on the programme.
The summary of the assessment of individual lectures is provided in Appendix 3.2. The feedback

ADB TA No. 4297-IND, Final Report
Capacity Building For Fiscal Reforms in Sikkim
51
received at the end of the programme elaborated the need to have longer programmes and more
frequent programmes, especially the first year of the introduction of the new tax. Further, there
was an expressed need for enhanced focus on the technical computation, so that the concepts
become completely clear.
3.7 Taxes on Income Levied Under State Laws
Income tax under state laws in Sikkim has been a unique feature of the State as it is not governed
by the Central income tax laws. At the time of its merger with the Indian Union, like many other
Laws, the prevailing income tax laws and the power to collect income tax remained with State.
The Central Income Tax was extended to Sikkim in as late as 1991, which was challenged by the
State in Court. Though the State has withdrawn the case in 2004, a practical solution has not been
reached and the State continues to collect the tax.
The State has collected around Rs.4 crores during 1990-91, which increased to about Rs.27 crores
during 2003-04. Share of State income tax in GSDP was 2 percent in 1989-90, which has declined
to 1.4 percent in 1997-98 after which it has shown some improvement and during 2003-04 it was
little more than 2 percent (Table 15, Figure 10). The annual growth of income tax in the state has
been widely fluctuating that contributes to the volatility of the own tax revenue. The improvement
of income tax collection during 1997-98 to 2002-03 heavily depended upon tax collections from
lottery income. The improvements in tax collection during late nineties and after that resulted in a
higher buoyancy of more than unity during 1996-97 to 2003-04 as compared to an earlier period of
1985-86 to 1994-95 (Table 15).
Figure 10 Income Taxes under State Laws Percentage to GSDP
0.00
0.50
1.00
1.50
2.00
2.50
3.00
1989-9
0
1990-9
1
1991-9
2
1992-9
3
1993-9
4
1994-9
5
1995-9
6
1996-9
7
1997-9
8
1998-9
9
1999-0
0
2000-0
1
2001-0
2
2002-0
3
2003-0
4
2004-0
5 B
E

ADB TA No. 4297-IND, Final Report
Capacity Building For Fiscal Reforms in Sikkim
52
The income tax in the State is basically collected from salary income, lottery income, business, and
contract works. The income tax from salary both in Government and private sector, all kinds of
supplies to the Government, and the tax from contractors are deducted from the source (TDS).
The receipt of income tax from various sources during the year 2003-04 is given in Table 19.
Salary: The rates of the income tax on salary income ranges from 2% above the income
Rs.2400 to the highest rate of 10% on the income above Rs.6000 per annum. There are 5 rates
of tax altogether in this category and the tax is deducted at source. A person getting a salary of
Rs.200 per month is liable to pay tax under the State laws. This tax structure is not
progressive as the highest tax rate is only 10%. Once again there are exemptions available in
the form of savings schemes to GPF and LIC up to the limit of the basic pay. Persons in the
higher income group can avail of the tax exemptions by saving in the instruments allowed and
pay a very little tax as the highest tax rate is low.
Lottery Income: Lottery income is subjected to a 10 % rate of income tax. This tax is levied
on the prize money and deducted at source. Non-Sikkimese persons winning the lottery pay
income tax under Central Income Tax Laws as well.
Supplies to Government and PSUs: Income tax at the rate of 3 % of the value of goods
supplied by a supplier to a Government department is deducted at source at the time of
payment made for such supplies. It is the responsibility of the departments receiving the
supplies to deduct the income tax from their bills.
Business: The income tax from the business is not based on the income but on the gross
turnover of the dealer thus making it a turn over tax (TOT) for all practical purposes. The tax
rate on business (gross turnover) is 3 percent and there is provision of exemption limit up to
Rs.10, 000. The turn over tax on business has the potential to distort the business activity and
acts as a disincentive for expansion of production and trading activities in Sikkim. The
implementation of Value Added Tax will face problems due to the existence of this TOT on
gross turnover.
Sikkim is a major producer of cardamom and ginger in the country. The same turnover tax at
the rate of 3 % is levied on it when it is exported out of the state. The tax on cardamom and
ginger is collected at the check posts situated in Rangpo and Melli.
Contractors: A tax at the rate of 3 % is imposed on contractors and deducted at source from
the bills submitted by the contractors to any Government departments.
Property Tax: The house property tax is levied on rent income. This accounts for a small
share of total income tax and yield from this source is not stable. Tax on rent income is only
collected in urban areas.

ADB TA No. 4297-IND, Final Report
Capacity Building For Fiscal Reforms in Sikkim
53
Table 19 Income Tax Realized from Different Sources
Rs. Lakh
1999-00 2000-01 2001-02 2002-03 2003-04
Lotteries 249.60 140.44 65.32 977.06 410.09
Breweries 19.39 24.11 28.93 30.95 30.00
House Property 4.53 3.20 1.58 5.24 1.59
Cardamom and Ginger 35.47 110.81 170.35 133.92 149.65
Contractors, ITCC Charges 0.88 1.60 4.33 3.69 5.85
Salaries-Pvt. Sector/PSUs 70.25 69.15 73.42 70.10 73.11
Supplies-Pvt. Sector/PSUs 16.24 141.73 182.49 92.00 141.01
Pvt. Schools- Salaries 9.07 21.11
Business and Hotels 34.00 76.49 85.42 84.41 270.97
Receipts through Monitoring 90.89
TDS by Pay & Accounts- Salaries &
Supplies
1065.41 916.77 995.42 1159.00 1045.84
Self Cheque Drawing Departments 288.62 443.91 595.63 645.02 605.43
Miscellaneous Receipts 58.69
Total 1784.38 1928.22 2202.90 3360.06 2754.65
Source: Income Tax and Commercial Tax Annual Reports, Government of Sikkim
The structure of income tax in Sikkim has been designed keeping administrative simplicity in
mind. More than 80% of income tax under state laws is collected at the source. However, this tax
structure does not confirm to basic canons of the tax system and has the potential to distort
economic decision making especially in production and trading activities. The major problem
relating to this tax is the turn over tax levied on the businesses. Companies or trading houses
having branches in Sikkim have to pay income tax under Central laws on their whole income.
This acts as a disincentive for expansion of business activity in the State. At the same time the
suppliers have the tendency to inflate their bills on sales to Government department to factor the
TOT in. The tax on salary income is not progressive and with the exemptions available on savings
schemes, the people in higher salary bracket hardly pay any tax as compared to their counter parts
else where in the Country. There have been problems in the collection of taxes due to claims of
many agencies having paid tax under central laws.
After the withdrawal of court cases by the State Government challenging the extension of Central
Income Tax Laws, the Central Government has constituted a committee with the members from
both central government and State government to resolve issues pertaining to Centre-State
coordination of income tax in Sikkim. The Committee has not reached in any conclusive decision

ADB TA No. 4297-IND, Final Report
Capacity Building For Fiscal Reforms in Sikkim
54
as yet. There has been a demand to provide preferential treatment to Sikkimese nationals in
payment of income tax as is the case in other North Eastern States.
The Government of Sikkim, in order to augment the collection from this source, has been trying to
improve its tax administration. The proposed Government initiatives to improve tax
administration in the State involve forming a revenue cadre, computerization of the department,
providing better check post facilities, restructuring of the administrative set up, training of the tax
officials, and settling tax disputes. Strengthening the tax administration in the State is a very
important and concrete step need to be taken in this direction.
Income tax collections in revised estimates for 2004-05 as compared to the previous year show
only a marginal increase from Rs.26.76 crores to Rs.27 crores. The increase could have been large
had there been no decline in tax collection from lotteries. The fluctuating growth of income tax
underlines the need for a serious look at the structure of the tax itself in addition to the proposed
strengthening of tax administration. Resolution of issues pertaining to extension of Central income
tax to the State will give a definite course to income tax in the State.
Implementing central income tax in Sikkim has got many advantages that the State should take
note of.
The first and foremost, under central income tax the provision of TOT will go and the
disadvantages that the Sikkimise traders face as against the neighbouring state – West
Bengal will be reduced.
The tax system will be progressive and people at the lower end will get reprieve. Given
the present central income tax structure with the provisions of threshold exemptions,
exemption in lieu of saving, special treatment to women and senior citizens, and tax rates,
adopting it will be attractive in general.
There may be revenue gains for the state. The notion of loss of revenue due to imposition
of Central income tax in the State may not hold good in the present scenario. The TfFC
has increased the share of States in sharable pool of Union tax from 29.5 percent
recommended by the EFC to 30.5 percent. Following the recommendations of TfFC the
Union Government has fixed the share of Sikkim an amount of Rs.42.11 crores in the
shareable income tax in the Budget for the year 2005-06 as against Rs.29 crores projected
by Government of Sikkim for the same year. The TfFC has assumed a growth rate of 12
percent for the GDP and a buoyancy of 1.4 for income tax while projecting the Union
Government‟s finances for the period 2005-06 to 2009-10. TfFC has also pointed out that

ADB TA No. 4297-IND, Final Report
Capacity Building For Fiscal Reforms in Sikkim
55
the projections carried out by them are modest as compared to the reform scenario of the
central government that was envisaged in the medium-term fiscal policy statement and is
more likely to be achieved.
The income tax collection expenditures of the state government will be saved.
The actual collection under central income tax from Sikkim will be less than what the state
will get under tax devolution formula. The disposable income of people will be more as
fewer people will be paying tax under central income tax.
Last but not the least, if the state government becomes successful in getting tax exemption
facility for the Sikkimise origin people in line with the tax exemption provisions granted in
other north eastern states, very few people will actually pay central income tax.
Even if the State laws are to continue, immediate attention needs to be given to the Turn over Tax
existing under state laws. After the implementation of VAT, it will be possible to ascertain the
profits margins of traders on the basis of which income tax can be levied. The rate of tax on salary
income needs to be revised to make it progressive, which is a major feature of a direct tax. The
threshold limit for levy of income tax could be fixed at the per capita income of the state and a
simplified rate structure is applied above that income. The demarcation of urban areas under the
ensuing Municipal Act also will be helpful in raising the tax from property sources.
3.8 State Excise Duty
The State excise duty is levied on the production and sale of alcohol in the form of IMFL, Beer,
country liquor and alcohol used to produce medicine and toiletries. The levy of duty on alcohol
used in production of medicine and toiletries is controlled under Central Medicine and Toilet
Preparation Act – 1955 (MTPA) wherein the duty is fixed by the Central Government and the
State collects the tax and keeps it. In addition to levying excise duty on alcohol, the State has the
responsibility of controlling the capacity of distilleries, breweries and blending units and licensing
the production and expansion of capacity. Sikkim produces both IMFL and beer, which are
exported to other states and abroad. The beer produced in Sikkim has niche markets in many
European countries and in USA. The State has one brewery, one distillery and two bottling plants.
The inputs for the production of IMFL and beer are mostly imported.
The collection from state excise in 2003-04 was Rs.25.25 crores and the revised figures for 2004-
05 were Rs.29.5 crores. The relative share of revenue collected from state excise in revenue raised
by the State has been declining over the years, having gone down from 48 percent to 23 percent
during 1989-90 and 2003-04. As percentage to GSDP it has declined from about 4 percent to 2

ADB TA No. 4297-IND, Final Report
Capacity Building For Fiscal Reforms in Sikkim
56
percent (Table 15, Figure 11). Given the small size of population in the State, where consumption
has saturated, its relative importance has dwindled as compared to other major taxes whose shares
have increased because of increasing economic activity. Like other state taxes, annual growth of
excise duty has also been erratic. Though its buoyancy relative to state income showed some
improvement, it still remains below one implying a less buoyant source of revenue.
The rate of excise duty on IMFL bottled by local companies is Rs.60 per LPL. The IMFL
imported from outside on an average attract little higher rate of Rs.75 per LPL. There are some
variations in the rate depending upon the brand of the liquor. Beer, whether manufactured in
Sikkim or imported is taxed at Rs.70 per LPL. The excise duty on consumption by defence
personnel is lower. The tax rates in Sikkim have been on a lower side and therefore, inter-state
smuggling has never been a problem.
The excise duty is collected in advance from the dealers in the case of imports. The dealers get an
import license in which the amount to be imported is registered and tax is paid in advance. The
local consumption of liquor is also taxed in advance when the liquor is lifted from the warehouses
where it is stored. In addition to excise duty, the dealers pay import license fee, license fee for
liquor shops, warehouse fees, brand registrations fees, and export pass fees. There are 1163 liquor
outlets in the state. The shops are not auctioned as the number of shops in any locality is not fixed.
The issuing of license for liquor shops is open in the State. However, recently the State
Government has enforced an undeclared ban on issuing new licenses for liquor outlets. The
license fee for liquor outlets has been revised upwards this year in which three rates – Rs. 7, 000,
Rs.5, 000, and Rs.2, 000 have been prescribed based on the locality where the outlets exist. A
higher rate of Rs.10, 000, Rs.7, 000, and Rs.5, 000 has been imposed on Bars existing in different
areas of the State. The export pass fee of Rs.2 per case has been levied only on beer and for
export of IMFL it is nil. Exempting IMFL from export pass fee is basically aimed at encouraging
exports and become competitive in price terms and thus gain advantage in outside markets.
However, import pass fee of Rs.10 per LPL is being levied for all kinds of imports of liquor.
The excise duty and other fees are low compared to some other states. The excise revenue
depends upon heavily the local consumption and export of some brands of Sikkimise liquor. The
defence consumption is another source of revenue for the state. Of late the defence establishment
in the State has stopped procuring liquor from the local market and instead has been importing
from outside. This implies the State gets import license fee from defence imports, but the local
sales have suffered to that extent. The strength of Sikkim lies in its export of IMFL and beer. As
against an import of 32, 00 cases of IMFL in 1993-94 the State has exported 2.96 lakh cases of

ADB TA No. 4297-IND, Final Report
Capacity Building For Fiscal Reforms in Sikkim
57
IMFL and 16 lakh cases of beer. Sikkim faces competition in neighboring states from the import
of cheap liquor from Bhutan
Figure 11 State Excise Duty Percentages to GSDP
0.00
0.50
1.00
1.50
2.00
2.50
3.00
3.50
4.00
1989-9
0
1990-9
1
1991-9
2
1992-9
3
1993-9
4
1994-9
5
1995-9
6
1996-9
7
1997-9
8
1998-9
9
1999-0
0
2000-0
1
2001-0
2
2002-0
3
2003-0
4
2004-0
5 R
E
Given the current level of sale of liquor in the local market, growth of revenue collection is not
expected to be faster and will depend basically upon the exports. Periodic revision of excise duty
rates, licence fees and other related fees should be undertaken. The export pass fee may be levied
on IMFL as well. Some kind of incentive schemes could be designed to encourage manufacturers
to start producing medicine and toiletries that use alcohol. As was indicated earlier, the tax rate on
the use of alcohol on preparation of medicines and toiletries is fixed by the Central Government
under the MTPA and the State Government may be well advised to take up the matter with the
Central Government.
3.9 Motor Vehicle Tax
Motor vehicle tax collection has risen in nominal terms from Rs.37 laks in 1990-91 to Rs.1.5
crores in 2000-01 and further to Rs.2.7 crores in 2003-04. Its share in own tax revenue was 2
percent during 1990-91 which has risen marginally to 2.5 percent during 2003-04. However, it has
not been a major source of revenue for the State and its share in GSDP is around 0.2 percent
(Table 15). The buoyancy of motor vehicle tax relative to GSDP has gone down during 1995-96
to 2003-04 as compared to the period 1989-90 to 1994-95.
The revenue from Motor Vehicles‟ Division mainly comes from registration fee, token taxes,
driving license fee, route permit fee, fitness of the vehicle certificate, and other miscellaneous

ADB TA No. 4297-IND, Final Report
Capacity Building For Fiscal Reforms in Sikkim
58
receipts. The registration fee is collected by the Head office in Gangtok and all other taxes are
collected both by the Head office and Regional Transport Offices.
The registration fees levied in the State is specific in nature. For registration fees purpose, the
vehicles have been categorized mainly into four types – two wheelers, four wheelers for personal
use, four wheelers for commercial purpose, and goods carriers. In the case of two wheelers,
registration fee is flat Rs.268 and for four wheelers for personal use there are two flat rates, Rs.860
on small vehicles and Rs.956 on bigger vehicles. Four wheelers used for commercial purpose
attract two tax rates – Rs.2232 and Rs.3105 differentiated on the basis of size. In the case of
goods carriers like trucks the registration fee is determined on the basis of unladen weight; the
rates varying from Rs.2335 to Rs.6401.
The tax on passengers and goods is known as „Token Tax‟ in the State and is collected on a yearly
basis. The token tax on vehicles not used for commercial purpose is levied at flat rates and there
are 10 rates of tax under this category ranging from Rs.108 to rs.897. The differentiation in tax
rates levied is on the basis of whether it is a two-wheeler or a four-wheeler and whether it belongs
to a private person or to a registered company. The tax rate is higher in the case of vehicles
belonging to registered companies. The token tax on vehicles carrying passengers is determined on
the basis of seating capacity and also on the kind of vehicles – omni bus, jeep, two-wheeler, and
other four-wheelers. Vehicles for transport of goods like trucks, trailers and tractors pay token tax
on the basis of registered laden weight.
Vehicles with national permit do not ply in Sikkim due to their higher unladen weight. So the
interstate vehicles that ply in Sikkim come from West Bengal. There is a reciprocal arrangement
between the Governments of Sikkim and West Bengal to allow interstate vehicles to ply in both
States in the ratio of 2:1. The number of vehicles to be allowed to ply both sides is determined
from time to time. There is no interstate payment of passenger and goods tax under this
arrangement. However, the Sikkim Nationalized Transport department, a division of transport
department, collects a supervision charge on vehicles carrying goods from Siliguri to Sikkim at
Rangpo Check post at the rate of 25 percent of hire charge of the vehicles.
Revenue collection from motor vehicle tax has not been buoyant as compared to the rise in State
income. Though it has increased in nominal terms over the years, the potential to collect more
revenue still exists. The specific nature of the tax structure in respect of registration fees and token
tax for vehicles not used for commercial purpose needs to be changed and the principle of ad

ADB TA No. 4297-IND, Final Report
Capacity Building For Fiscal Reforms in Sikkim
59
valorem tax structure should be adopted. There is no reason for the same flat tax rate to be levied
on high end luxury vehicles and on entry level small vehicles.
3.10 Land Revenue, Stamps and Registration Fees
Land revenue constituted only Rs.18 lakhs and the contribution from stamps and registration fees
was Rs.1.14 crores to the State exchequer in 2003-04. Both taken together form around 2 percent
of own tax revenue. Given the hilly terrain of Sikkim, the cultivable land areas are all terraced on
the slope. Nearly 85 percent of land area is forest area and out of rest 15 percent 11 percent is
cultivable land. The land area in the State leaving forest, are classified into three main classes – I,
II, and III and each of these are categorized into three grades, A, B, and C. The land classification
is carried out based on productivity, location, and road connectivity. The land situated at a lower
altitude has more productivity as compared to the lands at higher altitude. The class III land is
basically barren land. The land valuation was revised in 2004 in which the highest value of land in
the first category was fixed at Rs.7 lakhs and the value of land in the last grade (class III) was
fixed at Rs.1 lakh.
Land settlement operation in the state was carried out during early eighties. However, one major
achievement of the Government of Sikkim was the computerization of land records in the State.
Now in all the four districts land mutation certificates and other related documents are generated
by the computer. The process of computerized mutation is being extended to the sub-divisions.
Due to lack of internet connectivity the district centers and the computer center at capital could not
be connected. The computerization of land records has paved the way for upward revision of both
land rent and stamps and registration fees during 2004-05.
The rate of land revenue was revised upward in February 2005. There are now large numbers of
rates starting from Rs.30 per hectare for wet land in Grade-A variety to Rs.3 per hectare for barren
land. Many other fees for land related certificates, like mutation fee, khaitan fee, property
certificate are either introduced or increased. Revenue from this source has been fluctuating over
the years. One of the reasons for fluctuating revenue from land revenue stems from acquisition of
land by various Government departments time to time. At the time of acquisition of any land the
concerned department has to deposit 2.5 percent of land value and 40 years of land rent at the
existing rate in the exchequer.
Registration fee for transaction in land is levied at the rate 4 percent on the declared value of land
and stamp duty is levied at the rate of 1 percent. On the gift deed earlier no registration fee was
required. In the revision of tax rates in 2005 a 5 percent registration fee as per rate approved by

ADB TA No. 4297-IND, Final Report
Capacity Building For Fiscal Reforms in Sikkim
60
the Government for acquisition of land was levied on such deeds. The revenue from stamps and
registration fees depends upon the transactions in land. The stamps and registration fees in the
State though lower as compared to many other States looks reasonable and do not induce tax
evasion.
The problem with stamps and registration fees is the undervaluation of land. The valuation of land
fixed by the state was not scientifically done. The valuation of land is very significant that affects
the collection of registration fees at the time of sale of land.
Box IV
Sikkim State Taxes: Reform Agenda
Value Added Tax (VAT) As the VAT was to be implemented 1
st April 2005, the Technical Assistance (TA) team provided
inputs treating it as immediate priority
VAT implementation plan was prepared by sequencing the time table for implementation
VAT Law and Rules were prepared for approval of the state legislature
VAT manual was prepared to help the VAT administration on various legal provisions and
submitted to the State Government
State officials were trained on VAT structure, Administration and Accounting, Risk assessment,
auditing, MIS, and computerization
Public awareness programmes were conducted for dissemination of information
Administrative and functional reorganization plan for commercial tax department was prepared to
create a modern and efficient tax department in the state that will help implement VAT
successfully
Specialized „revenue cadre‟ to be recruited with appropriate qualifications on economics and
accounting framework of VAT, auditing, computers, and legal processes
Other State Taxes Income Tax
The State government may consider adopting central income tax. The advantages of adopting
central income tax are;
Turn over tax (TOT) will go along with the disadvantages faced by Sikkim traders vis-à-
vis neighbouring State of West Bengal. This will also be helpful in attracting business
and trading activity to the state
The tax system will be progressive
Revenue gain
Collection expenditure of state income tax will be saved
The disposable income of people will be more
Successful negotiation with Government of India to get tax exemption facility will further
reduce tax burden on the people of Sikkim.
If the state laws are to continue, then;
State tax structure should be rationalized
TOT to be removed
Tax rate needs to be revised to make it progressive
The threshold limit could be fixed at the per capita level
Simplification of tax structure is required
State income tax should be congruent with the Central income tax.
State Excise Duty
Periodic revision of excise duty, license fees and other related fees
Export pass fee may be levied on IMFL as well after calibrating its impact on exports
Incentive schemes could be designed to encourage manufacturers to start producing medicine and

ADB TA No. 4297-IND, Final Report
Capacity Building For Fiscal Reforms in Sikkim
61
Box IV
Sikkim State Taxes: Reform Agenda toiletries that use alcohol
Motor Vehicle Tax
The specific nature of the tax structure in respect of registration fees and token tax for vehicles not
used for commercial purpose needs to be changed and the principle of ad valorem tax structure
should adopted
A weighbridge should be constructed in Rangpo check post to detect the laden weight of trucks
carrying goods
Land Revenue, Stamps and Registration Fees
The valuation of land in different areas should be carried out in a scientific manner that reflects its
true market value
3.11 Non-tax Revenue: Sikkim
Non-tax revenue in States is generally characterized by a mix of assorted receipts like interest
receipts on loans given by the state government, dividends on equity investments, user fees and
tariffs on services provided by the governments that spans over social and economic sectors,
royalty on mines and minerals, receipts from forestry and wild life, lottery income and any other
miscellaneous receipts. In Sikkim in addition to these sources of non-tax revenue, receipts from
power and transport sectors are also classified under non-tax revenue as these are managed by
government departments. The state electricity boards and transport corporations in other states are
managed as separate corporations and their revenue and expenditures are not reflected in the state
budget directly. The non-tax revenues assume significance in finances of state governments as
these contribute to improvement of the quality of services provided y the government.
Non-tax revenue collected from various services provided by the government depends on the price
fixed by the government that has remained very low and the increasing cost of provision as well as
maintenance of such services is being met from the state budgets. The implicit subsidies arising
out of low cost recovery rates (user charges) have increased over the years contributed to the
deterioration of finances of state governments. Low user charges are widespread phenomenon not
restricted to Sikkim alone. Low user charges are justified on the ground that the Government has
the social responsibility for providing basic services like education, health drinking water and so
on and so forth and help under privileged sections of the society. However, the proliferation of
unjustified subsidies in various sectors and populist policies has adversely affected the quality of
government services and the people who solely depend upon it.
One important feature of non-tax revenue in Sikkim is the significance of income from lottery,
which has not proved to be a stable source of revenue. The receipt from lottery has been
fluctuating since 1999-00 due to competition from other states and ban on operation of lottery in

ADB TA No. 4297-IND, Final Report
Capacity Building For Fiscal Reforms in Sikkim
62
many states. The net receipts from lottery after declining from Rs.28.12 crores in 1999-00 to
Rs.17.31 crores in 2000-01, jumped to a high of Rs.84.24 crores in 2002-03 and then crashed to
Rs.31.41 crores in the next year. The fluctuating receipts from lottery not only imparted
unpredictability to own revenues of the state, it also contributed to over assessment of state
revenues by the TfFC that eventually reduced non-plan revenue deficit grant for the period 2005-
06 to 2009-10 (the TfFC transfers to Sikkim has been examined in a later chapter).
The receipts from the non-tax sources relating to recoveries from government services have been
very low as compared to the GSDP of the state (Table 20). Non-tax revenue as percentage of
GSDP of the State varies between 6 to 7 percents. However, if the receipts from lottery, power
and transport are removed, the share comes down to 2.5 percent. The income from lottery
(Classified under general services) and receipts from power and transport departments (classified
under economic services) constitutes bulk of non-tax revenue. Non-tax revenue (including net
lottery income) constitutes about 10 percent of total revenue of the State but for the years where
there is large lottery income. For instance in 1999-00 the lottery receipts constituted 43 percent of
total non-tax revenue and in 2002-03 this share was 59 percent.
Table 20 Non-tax Revenue in Sikkim
Per cent to GSDP
1994-95 1999-00 2000-01 2001-02 2002-03 2003-04
Non-tax Revenue
(including net lottery
income)
6.36 7.71 6.72 6.63 12.43 7.46
Interest Receipts, Dividends
& Profits
0.25 0.15 0.46 0.56 0.77 0.27
General services 2.05 1.03 1.12 1.03 0.97 0.93
Social services 0.08 0.10 0.16 0.17 0.20 0.21
Economic Services 3.98 3.44 3.37 3.59 3.59 3.36
Non-tax Rev. (net of Power,
Transport & Lottery )
1.79 1.96 2.71 2.46 2.51 2.56
Net Lottery income % of
Non-tax Revenue
25 43 26 24 59 33
Receipts from Power &
Transport % of Non-
taxRev.
47 31 33 39 21 33
Non-tax revenue % to
Total Revenue
10.69 12.13 10.27 9.48 15.79 10.57

ADB TA No. 4297-IND, Final Report
Capacity Building For Fiscal Reforms in Sikkim
63
3.11.1 Social and Economic Services: Revenue Consideration
Public provision of services in social and economic sectors such as education, health, water supply
and sanitation, agricultural services, roads and bridges assumes significance in a state like Sikkim.
Since its integration with the country in 1975, the state has been trying hard to improve the non-
existent public services. Given the hilly terrain of the state, scattered settlements, and other
physical and climatic constraints the cost of provision of services are higher.
In the case of providing education, the state has made progress since the time of merger with India.
The total literacy rate has shown remarkable improvement in the state from 17 percent in 1971 to
70 percent in 2001. Both the rural and female literacy have increased during this period. The state
government runs most of the educational institution with low private participation. In addition to
modern educational institutions, the government also promotes traditional educational institutions
like Sanskrit Pathasalas, Budhist monastic schools and madrasa. The state has made significant
improvements in primary education and reduced the gender gap. The dropout ratio in the state has
also been declining. The teacher pupil ratio in the state is one of the lowest; 17 at primary level,
19 at upper primary level, and 17 at secondary level as against the national average of 40, 30 and
29 respectively. The education provided by the government is almost free. Except a nominal
admission charge no other fee is charged in all levels of schooling. In the primary level, free text
books, uniforms are also provided. There is a provision to recover at least 50 percent of the cost of
text books that rarely is fulfilled.
The health care facilities in the state have also witnessed improvement since 1975. The over all
health indicators of the state compares favourably with the national average except that of the sex
ratio, which is 875 in Sikkim against 935 of national average in 2001. The crude birth rate, child
mortality, fertility rate and all other health indicators have improved in the state and are better than
national average. The health infrastructure in the state includes one state referral hospital, 4
community health centers, 24 PHCs, and 147 PHSCs. Once again there are very few charges in
the hospital. The cost of health care for the state increases due to patients being referred outside
for which the government bears the cost.
Other non-tax receipts in the areas of water supply, urban development, agricultural services, and
irrigation are minimal. Non-tax revenue as percentage of revenue expenditure is given in Table 21.
In this table both revenue and expenditures of two departments, namely, transport and power are
excluded to get a picture of general service provision by the government and the returns. The
transport and power are generally provided by corporation outside the state budget. However, in
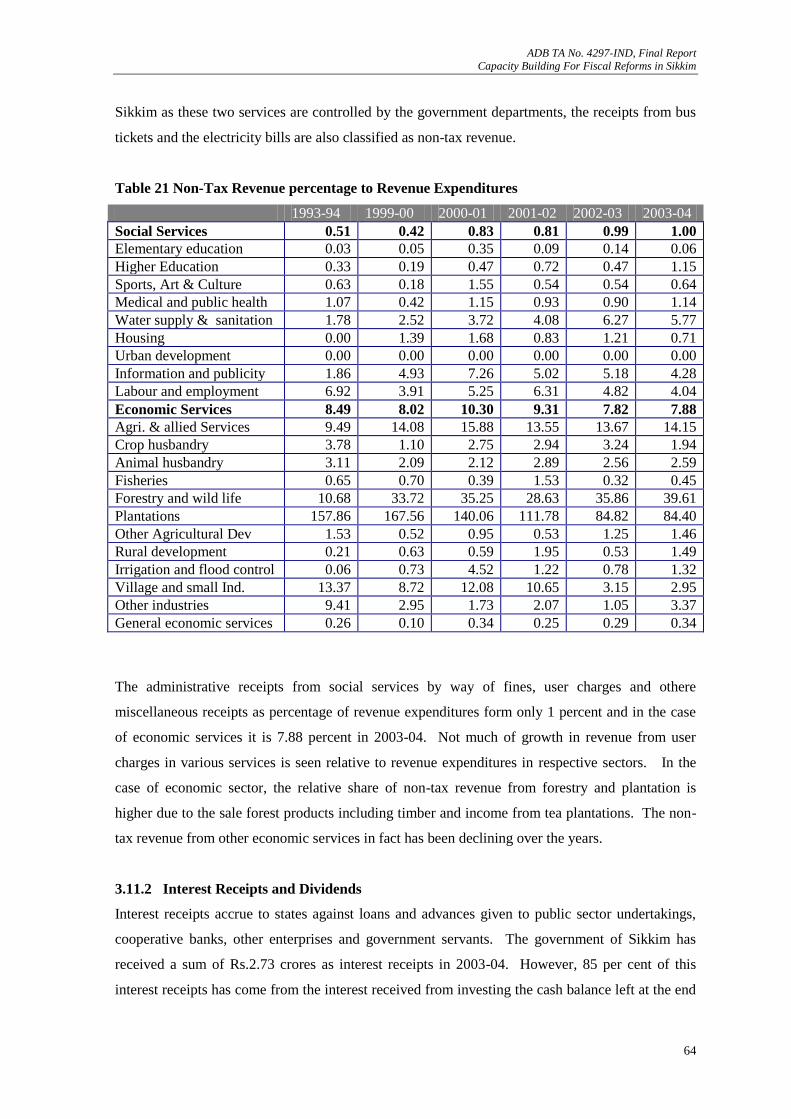
ADB TA No. 4297-IND, Final Report
Capacity Building For Fiscal Reforms in Sikkim
64
Sikkim as these two services are controlled by the government departments, the receipts from bus
tickets and the electricity bills are also classified as non-tax revenue.
Table 21 Non-Tax Revenue percentage to Revenue Expenditures
1993-94 1999-00 2000-01 2001-02 2002-03 2003-04
Social Services 0.51 0.42 0.83 0.81 0.99 1.00
Elementary education 0.03 0.05 0.35 0.09 0.14 0.06
Higher Education 0.33 0.19 0.47 0.72 0.47 1.15
Sports, Art & Culture 0.63 0.18 1.55 0.54 0.54 0.64
Medical and public health 1.07 0.42 1.15 0.93 0.90 1.14
Water supply & sanitation 1.78 2.52 3.72 4.08 6.27 5.77
Housing 0.00 1.39 1.68 0.83 1.21 0.71
Urban development 0.00 0.00 0.00 0.00 0.00 0.00
Information and publicity 1.86 4.93 7.26 5.02 5.18 4.28
Labour and employment 6.92 3.91 5.25 6.31 4.82 4.04
Economic Services 8.49 8.02 10.30 9.31 7.82 7.88
Agri. & allied Services 9.49 14.08 15.88 13.55 13.67 14.15
Crop husbandry 3.78 1.10 2.75 2.94 3.24 1.94
Animal husbandry 3.11 2.09 2.12 2.89 2.56 2.59
Fisheries 0.65 0.70 0.39 1.53 0.32 0.45
Forestry and wild life 10.68 33.72 35.25 28.63 35.86 39.61
Plantations 157.86 167.56 140.06 111.78 84.82 84.40
Other Agricultural Dev 1.53 0.52 0.95 0.53 1.25 1.46
Rural development 0.21 0.63 0.59 1.95 0.53 1.49
Irrigation and flood control 0.06 0.73 4.52 1.22 0.78 1.32
Village and small Ind. 13.37 8.72 12.08 10.65 3.15 2.95
Other industries 9.41 2.95 1.73 2.07 1.05 3.37
General economic services 0.26 0.10 0.34 0.25 0.29 0.34
The administrative receipts from social services by way of fines, user charges and othere
miscellaneous receipts as percentage of revenue expenditures form only 1 percent and in the case
of economic services it is 7.88 percent in 2003-04. Not much of growth in revenue from user
charges in various services is seen relative to revenue expenditures in respective sectors. In the
case of economic sector, the relative share of non-tax revenue from forestry and plantation is
higher due to the sale forest products including timber and income from tea plantations. The non-
tax revenue from other economic services in fact has been declining over the years.
3.11.2 Interest Receipts and Dividends
Interest receipts accrue to states against loans and advances given to public sector undertakings,
cooperative banks, other enterprises and government servants. The government of Sikkim has
received a sum of Rs.2.73 crores as interest receipts in 2003-04. However, 85 per cent of this
interest receipts has come from the interest received from investing the cash balance left at the end

ADB TA No. 4297-IND, Final Report
Capacity Building For Fiscal Reforms in Sikkim
65
of year. Removing the interest receipts from investing cash balance, the average rate of return on
the outstanding loans during 2000-01 to 2003-04 works out to 5 percent. The interest earning from
investing cash balance each year is unpredictable depending upon the fiscal situation and cash
management of the government. The interest receipt from other loans and advances is a small
amount that will have very little impact on the state revenue.
There have been no dividends earned from most of the PSUs in the state. The average effective
return from the government investments during the last four years works out to a mere 0.89
percent. The growth of dividends from the PSUs will significantly depend on the policy of the
government in restructuring them either by divestment and restructuring of some of the PSUs. .
3.11.3 Non-tax Revenue: Issues pertaining to Provision of Services and Cost Recovery
While classifying the government expenditure into general services, social services and economic
services, there are many services that are in the nature of pure public goods. In general services,
expenditure heads like organs of state, fiscal and administrative services are included that are in
the nature of pure public goods are provided by the government. Even if there are some services
under this category which are excludable and a price can be charged on individuals, it is generally
difficult to segregate public and private components and effect cost recovery. Governments also
provide a range of non-public goods under social and economic services where the users are
identifiable and user charges can be levied. Budgetary subsidies arise when the budgetary cost of
providing a good or a service exceeds the recovery made from the users of the good or service.
There are many government services which are considered merit goods and subsidization in
varying degrees is essential. Services like elementary education, primary health-care, social
welfare and nutrition, and environment are desirable from the society‟s point of view; government
subsidy to such services can not be faltered. At the same time services like secondary education,
family welfare, urban development, forestry, and agriculture also need some government
subsidies3. However, subsidy should be targeted and cost recovery to the extent possible is equally
important; especially in non-merit services.
3 The report on „Central Government Subsidies in India‟ prepared by NIPFP suggests a three-tier
hierarchy of Government social and economic services.
Merit I – Elementary education, primary health-care, prevention and control of diseases, social welfare and
nutrition, soil and water conservation, ecology, and environment.
Merit II – Education (other than elementary), sports and youth services, family welfare, urban development,
forestry, agricultural research and education, other agricultural programmes, special programmes for rural
development, land reforms, other rural development programmes, special programmes for north-eastern
areas, flood control and drainage, non-convention energy, village and small industries, ports and light
houses, roads and bridges, inland water transport, atomic energy research, space research, oceanographic
research, other scientific research, census surveys and statistics, and meteorology
Non-Merit- All others
ADB TA No. 4297-IND, Final Report
Capacity Building For Fiscal Reforms in Sikkim
66
3.11.4 Cost Recovery in Social and Economic Services
The subsidies given by the government on various services could be of two types – explicit and
implicit. The separate provision in the budgets to subsidise a particular service refers to explicit
subsidies and these are shown in the budgets. On the other hand, the short fall of cost recoveries
from the cost of providing social and economic services denote implicit subsidies invoved in the
provision of these services. In the budgetary classification of states very few explicit subsidies that
are in the nature of direct payments to account for difference in prices are shown. On the other
hand, most of the social and economic services are charged the average cost of providing them,
howsoever much this is unmerited.
The unrecovered costs can be measured as the excess of cost of providing the service over the cost
recovered.. The cost of providing public services include three elements: current costs, annualized
capital costs (opportunity costs of funds used for capital assets and imputed depreciation), and
opportunity cost of funds invested in the form of equity or loan for the service. Current costs are
revenue expenditures directly associated with provision of services. The currents costs do not
include transfers to funds and transfers to individuals and at the same time transfers from the funds
are included in the expenditures. Capital costs are related to the investments by government when
services are provided by departments, investments in the form of equity and loans to the public
sector undertakings. The annualized capital costs are obtained by applying the interest rate at
which the government borrows money and in the case of physical capital, depreciation cost is
calculated. So the total cost of provision of public services consists of revenue expenditures net of
transfer to funds and individuals, imputed interest and depreciation cost on capital stock, and
imputed interest cost on public sector investment and loans. On the other hand the receipts are
user charges and fees, interest receipts on loans and dividends obtained from the PSUs. The
excess of total cost over the revenue receipts is known as implicit subsidy and the cost recovery
can be estimated by taking ratio of receipts to cost under respective budgetary heads.
The cost recovery in social and economic sectors for the year 2003-04 is given in Tables 22 and
23. The cost recovery in social services in 2003-04 is merely 0.79 percent and economic services
it is 10.40 percent. Cost recovery in two major expenditure heads – education and health has been
0.57 percent and 1 percent respectively. In the case of water supply and sanitation the cost
recovery is equally low at 1.55 and 0.53 percent. The subsidy provided from budget in social
services works out to be Rs.306.44 crores that constitutes 23 percent of GSDP in 2003-04.

ADB TA No. 4297-IND, Final Report
Capacity Building For Fiscal Reforms in Sikkim
67
Table 22 Cost Recovery in Social Services
Rs. Lakh
Costs Receipts Subsidies Recovery
Rate (%)
Social Services 30887.06 243.34 30643.73 0.79
2,202 General Education 14839.33 84.23 14755.11 0.57
Elementary Education 7496.34 3.77 7492.57 0.05
Secondary Education 6397.76 79.66 6318.10 1.25
University Higher Education 524.30 0.80 523.50 0.15
Adult Education 1.00 0.00 1.00 0.00
Language Development 39.08 0.00 39.08 0.00
General 380.86 0.00 380.86 0.00
2,203 Technical Education 308.63 0.00 308.63 0.00
Sports & Youth Welfare, Art &
Culture
1049.48 3.83 1045.65 0.37
2,204 Sports & Youth Welfare 544.88 0.00 544.88 0.00
2,205 Art & Culture 504.60 3.83 500.77 0.76
2,210 Medical & Public Health 4448.12 44.31 4403.81 1.00
Urban health Services 2882.55 32.41 2850.13 1.12
Rural Health Services 1225.29 0.00 1225.29 0.00
Med. Edu. Trng. And Research 85.99 0.00 85.99 0.00
Public Health 253.40 11.90 241.50 4.69
2,211 Family Welfare 470.24 0.00 470.24 0.00
2,215 Water Supply & Sanitation 4788.69 74.35 4714.35 1.55
Water Supply 4533.98 56.96 4477.01 1.26
Sewerage & Sanitation 254.72 17.38 237.33 6.82
2,216 Housing 3320.02 17.60 3302.42 0.53
Government Residential Buildings 869.61 17.60 852.01 2.02
Urban Housing for urabn poor 4.08 0.00 4.08 0.00
Rural Housing 1236.48 0.00 1236.48 0.00
General 1209.86 0.00 1209.86 0.00
2,217 Urban Development 870.46 0.00 870.46 0.00
2,220 Information & Publicity 302.03 12.93 289.10 4.28
2,225 Welfare of SCs, STs and OBCs 159.78 0.00 159.78 0.00
2,230 Labour & Employment 108.79 4.40 104.39 4.04
2,235 Social Security & Welfare 28.81 0.00 28.81 0.00
2,250 other social services 192.68 1.69 190.98 0.88

ADB TA No. 4297-IND, Final Report
Capacity Building For Fiscal Reforms in Sikkim
68
Table 23 Cost Recovery in Economic Services
Rs. Lakh
Costs Receipts Subsidies Recovery Rate
(%)
Economic Services 43209.51 4493.61 38715.90 10.40
Agriculture and Allied Activities 7564.51 791.13 6773.37 10.46
2401 Crop Husbandry 1712.51 30.72 1681.79 1.79
2402 Soil and Water Conservation 350.61 0.00 350.61 0.00
2403 Animal Husbandry 977.09 22.63 954.46 2.32
2404 Dairy Development 93.38 0.00 93.38 0.00
2405 Fisheries 200.64 0.64 200.00 0.32
2406 Forestry & Wild Life 1924.34 723.67 1200.66 37.61
Forestry 1454.70 713.71 740.99 49.06
Environmental Forestry and Wild Life 397.90 9.96 387.94 2.50
2407 Plantations 227.20 191.76 35.44 84.40
2408 Food Storage & Warehousing 1096.12 13.38 1082.74 1.22
2415 Agr. Research & Education 86.68 0.00 86.68 0.00
2425 Co-operation 546.38 0.08 546.31 0.01
2435 Other Agricultural Programmes 576.74 0.00 576.74 0.00
Development Programmes 3172.98 51.11 3121.87 1.61
2501 Spl. Programmes for Rural Dev. 129.17 0.00 129.17 0.00
2506 Land Reforms 27.58 0.00 27.58 0.00
2515 Other Rural Dev. Programmes 2617.62 51.11 2566.51 1.95
2551 Hill Areas 398.61 0.00 398.61 0.00
Irrigation and Flood Control 1529.50 6.11 1523.39 0.40
2702 Minor Irrigation 630.02 6.11 623.90 0.97
2705 Command Area Development 4.99 0.00 4.99 0.00
2711 Flood Control 894.49 0.00 894.49 0.00
2801 Power 10912.03 1366.78 9545.24 12.53
Hydel Generation 4846.33 1366.78 3479.55 28.20
Diesel/Gas Power Generation 215.86 0.00 215.86 0.00
Transmission & Distribution 3515.31 0.00 3515.31 0.00
General Expenditure 2302.54 0.00 2302.54 0.00
2810 Non-conventional Energy Sources 50.00 0.00 50.00 0.00
Industries 3203.66 138.08 3065.58 4.31
2851 Village & Small Scale Industries 2008.63 57.75 1950.87 2.88
2852 Industries 531.77 76.16 455.61 14.32
2853 Non-ferrous Mining and Metall. Ind. 242.87 4.17 238.71 1.72
2875/85 Other Industries 420.39 0.00 420.39 0.00
Transport and Communication 10837.48 1732.80 9104.68 15.99
3053 Civil Aviation 205.16 0.00 205.16 0.00
3054 Roads & Bridges 7911.31 0.00 7911.31 0.00
3055 Road Transport Services 2720.86 1732.80 988.06 63.69
3075 Other Transport Services 0.15 0.00 0.15 0.00
Other Economic Services 1269.58 82.36 1187.22 6.49
3425 Other Scientific Research 74.79 0.00 74.79 0.00
3435 Ecology & Environment 31.55 0.00 31.55 0.00
3452 Tourism 879.28 79.01 800.27 8.99
3454 Census, Surveys & Statistics 141.25 0.00 141.25 0.00
3465 Gen. Fin. & Trading Institutions 43.87 0.00 43.87 0.00
3475 Other Gen. Eco. Services 98.85 3.35 95.50 3.39

ADB TA No. 4297-IND, Final Report
Capacity Building For Fiscal Reforms in Sikkim
69
The total subsidy in economic services constitutes 26.26 percent of GSDP in 2003-04. The cost
recovery in economic services has been influenced by cost recoveries in power, transport services
and forestry and plantation where sale of timber and income from tea plantations brings in some
revenue. The power sector cost recovery actually is very low at 12.53 percent signifying heavy
subsidization of the electricity in the state. The road transport gives a return of 63.69 percent once
again a sizable amount of subsidy is involved in providing transport facility in the state. The total
subsidy in economic sector in 2003-04 is estimated to be Rs.387.16 crores out of which the power
subsidy is Rs.95.45 crores and transport subsidy is Rs.91.04 crores. The subsidy in agricultural and
allied activities is Rs.67.73 crores.
Compared to an earlier study on state subsidies for the year 1998-99 (NIPFP, 2003), the recovery
rate in provision of government services has improved more in economic services than that of
social services. The recovery rate in social services, according to 1998-99 estimation was 0.43
percent and in economic services it was 6.21 percent. The improvement in social services is
marginal whereas there has been some improvement in economic services. The improvement in
recovery rate in economic services has been mainly due to higher recovery in power and transport
services. However, the subsidy amount in nominal terms has increased significantly from Rs.219
crores in 1998-99 to Rs.Rs.306 crores in 2003-04 in social services and from Rs.258 crores to
Rs.387 crores in economic services.
The improvement in cost recovery in economic services notwithstanding, the sector specific
recovery rates in individual sectors in Sikkim has been very low. Given the importance of public
provision of services in a state like Sikkim, the revenue augmentation measures should be
strengthened to maintain the existing infrastructure and improve the quality of services. The two
main candidates of reforms are power and transport sector (The restructuring of transport sector
has been dealt in Chapter). The user fees in social services, especially education and health needs
to be revised to garner some revenue to improve the education and health infrastructure. The
amenities like water supply and sanitation especially urban sector should also be restructured to
recover the cost. Increasing recovery rate in various services not only strengthen the existing
infrastructure to serve the citizens better, it will also instill a sense of participation of the people by
themselves and increase accountability on the part of the authorities. Almost free social services
will be difficult to sustain in the future not only due to financial constraint, but also due to lack of
responsibility, accountability and participation of the stakeholders.

ADB TA No. 4297-IND, Final Report
Capacity Building For Fiscal Reforms in Sikkim
70
4. Debt Restructuring and Contingent
Liabilities
4.1 Debt Restructuring
The composition of State government debt as on 31-3-2004 and projected composition as on 31-3-
2005 are presented in Table 24. Market loans followed by Central loans and Provident Fund and
Deposits are the principal liabilities of the State government. The maturity profile of outstanding
State government market loans at the end of March 2004 for the 8 NEC States and all States is
presented in Table 25. It is clear that the maturity profile of outstanding loans of Sikkim is
qualitatively different from those of the other NEC States and all States. More than 56 per cent of
all such outstanding market loans of Sikkim will mature in five years. In the case of all other NEC
States and all States, more than 60 per cent of such outstanding loans have a maturity period of
more than six years. Early maturity of a higher share of market loans has two implications for
Sikkim. First, the debt service liability during the coming five years will be rather heavy. Second,
the future liability will be rather light.
As far as the liability of Central loans is concerned, the TfFC has made recommendations on its
restructuring and writing off. It may be noted in this context that during the award period of EFC,
two schemes administered by the MoF were in operation which had a sobering effect on the debt
burden of the States. The first one was an incentive scheme known as Fiscal Reform Facility
under which a State which reduced its revenue deficit or increased its revenue surplus by a
minimum percentage in a year was entitled to receive a certain predetermined amount of grant
from the MoF. Since the amount of incentive was rather meagre and the fiscal stress on the States
was severe after the initial year of the EFC award period, majority of the States did not get/take
advantage of this scheme. The TfFC has, therefore, recommended that the scheme of Fiscal
Reform Facility be replaced by a scheme of Debt Relief over the period 2005-10. Another scheme
which was available to the States over the three year period 2002-05 was a Debt Swap Scheme
under which State governments were allowed to substitute high cost loan of the Central
government by fresh low cost loans from the market as well as the net proceedings from National
Small Savings scheme. Over the three year period, the States have been estimated to have
replaced about Rs. 100,000 crore of high cost loans of the past which attracted an interest rate of
13 per cent or more by low cost loans which on the average attracted an interest rate of about 9 per
cent. As a result, while the amount of indebtedness of the States remained unchanged, the debt
servicing burden came down by more than Rs 4000 crore per annum for all States taken together.
The Scheme of Debt Relief recommended by the TfFC envisages the following:

ADB TA No. 4297-IND, Final Report
Capacity Building For Fiscal Reforms in Sikkim
71
(a) Rescheduling of all Central loans contracted till 31-3-2004 and outstanding as on 31-3-
2005 into fresh loans for 20 years carrying 7.5 per cent interest with effect from the year a
State enacts the Fiscal Responsibility Legislation. For Sikkim the debt relief awarded by
the TfFC through consolidation is a total of Rs. 44.65 crore over the award period of 5
years comprising of relief of Rs. 10.69 crore repayment of the principal and Rs. 33.96
crore of interest liability. The Government has accepted this recommendation subject to
the condition laid down by the TfFC. It also expects that the State governments would
comply with the obligations regarding fiscal deficit and revenue deficit imposed by the
Fiscal Responsibility legislation. The Centre would request the next Finance Commission
to make appropriate adjustment in case the State availing of the debt relief is not able to
comply with the Fiscal Responsibility Legislation. Debt indicators for Sikkim and other
NEC States along with the debt relief awarded by the TfFC through consolidation are
given in Table 26.
(b) Debt Write-off: The TfFC has also recommended a debt write-off linked to reduction in
revenue deficit by a State. The quantum of write-off of repayment would be linked to the
absolute amount by which the revenue deficit is reduced in each successive year during the
award period. In accordance with the TfFC recommendations, the benefit of write-off
would be available only if the fiscal deficit of the State is contained to the level of 2004-
05. If, in any year, the fiscal deficit exceeds this level, the benefit of write-off, even if
eligible otherwise, would not be given.
In the case Sikkim along with Arunachal Pradesh, Meghalaya, Nagaland and Tripura,
since they are in revenue surplus the calculation of incentive criteria is different from that
for other States. These States have to maintain the average revenue surplus of the three-
year period 2001-04 in each year of the award period to be eligible for debt write-off. The
details are given in Table 27. It is evident that in the case of Sikkim it is a tough job to
maintain a revenue surplus of Rs. 168 crore in each year during the period 2005-10.
Besides this, the fiscal deficit should not exceed 3.91 (the level achieved in 2004-05) in
any year during 2005-10. If these twin conditions are satisfied the total repayment liability
of Rs.48.07 crore will be written off.
(c) Central Assistance: The TfFC has recommended that the Centre should release only the
grant component of Central assistance for State Plan and leave the States to raise loan
portion from other sources. For States unable to raise loans from the market, the Centre
may act as a financial intermediary but without any subsidisation of the cost. This
approach has been accepted in principle to be implemented in phases, in consultation with

ADB TA No. 4297-IND, Final Report
Capacity Building For Fiscal Reforms in Sikkim
72
the RBI. From 2005-06, the States would be allowed at their discretion, not to draw the
loan portion of the Central Assistance.
For Sikkim, the loan portion of the Central assistance as per the approved annual plan for
2005-06 is Rs. 43 crore. The State government has to take a considered view about
acceptance/non-acceptance of this loan, especially in view of the stringent requirement
regarding the revenue surplus.
(d) External Assistance: The TfFC has recommended that the Centre should pass on external
assistance on back-to-back basis to States and manage it through a separate Fund in the
Public Account. The Government has accepted this recommendation subject to the
condition that the service cost and exchange rate risk would be passed on to the States
under this arrangement. Though external assistance had not been an important source of
funding for Sikkim in the past, this could form an important source of funding in the
future. It is, therefore, important that the State government should endeavour to receive
external assistance by way of grants or at least soft loans.
With the acceptance of TfFC recommendation by GOI to do away with the loan component of
central assistance to States plan loans from the Centre will become a minor component of the loan
portfolio of the States. Indeed, often Centre was being criticised for lending to the States at rates
far higher than justified. There is merit in allowing the States to be on their own as far as
borrowings are concerned as it will subject them to the discipline of the market. A State whose
finances are well managed will be able to borrow from the market on better terms. This will be an
added incentive for the State to manage their finances efficiently. Sikkim under the reform
scenario will be in a much better position to raise adequate funds in the market at fairly reasonable
terms.
As regards the level of borrowings the considerations to be kept in view are the alternatives
available for investment in critical sectors like power, road, network, airport etc. The public-
private participation in the power sector which the State Govt. has initiated in respect of Teesta
stage II and III has the potential for replication in respect of other capital intensive projects like the
proposed airport and an alternate highway. The important aspect of the Teesta projects is that the
State Govt.‟s equity participation is to be financed by the private partner who will be repaid from
the revenue stream from the project after its completion. If the State Govt. can attract similar
private partnership for major capital intensive projects there is scope for limiting the capital outlay
under the plan to less than 10 percent of the GSDP. This will imply that fiscal deficit can be

ADB TA No. 4297-IND, Final Report
Capacity Building For Fiscal Reforms in Sikkim
73
gradually phased out and that the Debt : GSDP ratio will steadily come down to comfortable
levels.
4.2 Contingent Liabilities of the State Government:
The State government had a total Rs. 86.10 crore of outstanding Contingent Liabiliities as on 31st
March, 2005. These are all in the nature of guaranteed loans to State government enterprises
except one which is a guarantee to a joint enterprise. A statement showing maturity profile and
rate of interest on guaranteed loans is given below.
Statement Showing Maturity Profile and Rate of Interest on State Government
Guarantees (Rs. Lakh)
S.No. Name of Enterprise Amount
Guaranteed
Rate of
Interest
Remarks
1. Sikkim Mining Corporation 7.00 15% Guarantee to State
Bank of Sikkim
2. Sikkim Vanaspati Ltd. 803.00 Matter
subjudice
Guarantee to SBI, IFCI
& IDBI.
3. Sikkim State SC/ST/OBC
Development Corporation Ltd.
2500.00 4.5% National SC/ST/OBC
Development
Corporations,
respectively
4. Sikkim Power Development
Corporation Ltd.
5000.00 12.45% Bond raised from the
market.
5. Sikkim Time Corporation Ltd. 300.00 13% Guarantee to Central
Bank of India
Total 8610.00
Sikkim Mining Corporation is being closed. The small amount of guaranteed loan also is being
cleared. Sikkim Vanaspati Ltd. Guaranteed loan is a matter of subjudice. However, an out of
court settlement is being attempted. The unpaid principal and normal interest plus penal interest
add up to a staggering amount of about Rs. 31 crore. The negotiated settlement with SBI, IDBI
and IFCI is likely to be about Rs. 15 corre. This amount may have to be paid from the public
exchequer. The State SC/ST/OBC Development Corporation loans are being serviced by the
respective corporations and they are relatively inexpensive loans from the corresponding Central
financial institutions. The largest guarantee liability is in respect of Sikkim Power Development
Corporation. This comprises of three bond issues of Rs. 10 crore, Rs. 20 crore and Rs. 20 crore
which mature in June 2005, June 2006 and June 2007, respectively. The repayment liabilities are
likely to devolve on the State exchequer. Sikkim Time Corporation loan of Rs. 3 crore attracting
an interest rate of 13% is a loan in perpetuity. There is logic in renegotiating for a reduced rate of
interest failing which it is better to pay up.

ADB TA No. 4297-IND, Final Report
Capacity Building For Fiscal Reforms in Sikkim
74
The State Government‟s Guarantee policy is governed by the Sikkim Ceiling on Government
Guarantees Act 2000, the details of which are given in Box V. As per this, the outstanding
Guarantees at the beginning of the financial year shall not exceed thrice the State‟s tax revenue
receipts of the second preceding year. The present level is within this limit and it is likely to
improve somewhat in the coming years if the proposed SPU reforms are carried out.
Box V
Sikkim State Government’s Guarantee Policy
The State Government of Sikkim is governed by the Sikkim ceiling on Government Guarantees
Act, 2000 passed by the state Legislative Assembly on 13th December, 2000. The operative parts
of the Act are as follows:
The total outstanding Government Guarantees as on the first day of April of any year shall not
exceed thrice the state‟s tax revenue receipts of the second preceding year as in the books of the
Accountant General of Sikkim.
Notwithstanding any thing contained in any other law no Government guarantee shall be given in
respect of a loan of any private individual, institution or company.
The Government shall charge a minimum of one percent as guarantee commission which shall not
be waived under any circumstances.
The Government may, by notification in the official Gazette specifies Commission at an enhanced
rate depending on the default risk of the project.
Table 24 Composition of State Govt. Debt
(Rs. in crore)
As on 31/3/04 As on 31/3/05
Central Loans 278.48 276.18
National Small Savings
Fund Loans
- -
Market Loans 295.76 350.71
Loans from Banks etc. 106.37 111.22
W&M Advance from RBI - -
Provident Funds & Deposits 256.92 268.28
Reserve Funds & Deposits 38.90 38.20
Total Debt 976.43* 1044.59 Source: Report of the Twelfth Finance Commission, Govt. of India, February, 2005.
This differs from the State Government debt as reported in
the Inception Report at Rs,724 crores as on 31/3/04 on
account of two factors. The letter does not include
Provident Deposit Funds of Rs. 256.92 crores but includes
public deposits of Rs. 4.49 crores. Both these figures
exclude short term debt.

ADB TA No. 4297-IND, Final Report
Capacity Building For Fiscal Reforms in Sikkim
75
Table 25 Maturity Profile of Outstanding State Govt. Market Loans at End March 2004 (Rs. in crore)
State Percentage to total outstanding
0-5 Years 6-10 Years Above 10 years Total amount
outstanding
Arunachal
Pradesh
16.0 44.7 39.3 262
Assam 35.0 54.1 11.0 4496
Manipur 31.4 41.0 27.6 529
Megyalaya 39.3 44.6 16.1 700
Mizoram 29.6 53.8 16.6 422
Nagaland 36.6 49.4 14.0 1098
Sikkim 56.1 28.7 15.2 296
Tripura 34.8 46.1 19.2 792
All States 32.1 53.9 14.0 179465
Source: Report of the Twelfth Finance Commission, Govt. of India, February, 2005.
Table 26 Debt Indicators for Sikkim and other North East States Rs. Crore
.State
Debt GSDP Ratio
Interest payment as % of total revenue receipts Average for 2001-05
Total repayment due during 2005-10 to the Centre (Rs. crore)
Debt relief awarded by TfFC through consolidation. Repayment Interest Total
1 2 3 4 5 6 7 8
Arunachal Pradesh
31.80 55.45 11.30 117.37 19.98 71.73 91.71
Assam 27.26 33.91 16.88 1032.57 507.62 153.87 661.49
Manipur 34.03 43.08 18.43 480.68 292.14 27.26 319.40
Meghalaya 19.34 32.17 11.10 95.08 14.82 56.49 71.30
Mizoram 45.47 81.56 14.58 75.16 7.31 50.54 57.85
Nagaland 39.21 52.10 14.58 101.50 21.35 56.06 77.41
Sikkim 52.04 60.27 10.45 58.76 10.69 33.96 44.65
Tripura 36.94 37.78 14.06 142.29 24.77 123.97 148.73
Source: Report of the Twelfth Finance Commission, Govt. of India, February, 2005

ADB TA No. 4297-IND, Final Report
Capacity Building For Fiscal Reforms in Sikkim
76
Table 27 Calculation of Incentive for Debt Relief Based on Fiscal Performance in
NEC States
(Rs. Crore) State Revenue Deficit(-)/Surplus (+) Average
revenue
Deficit/
Surplus
2001-04
Repayment
due in 2005-
10 after
consolidation
and
rescheduling
20001-02
Actual
2002-03
Actual
2003-04
RE
1 2 3 4 5 6
1 Arunachal Pradesh 56 77 -39 31 97.39
2 Assam -881 -319 -1634 -945 524.95
3 Manipur -161 -87 -280 -176 188.54
4 Meghalaya -34 84 110 54 80.27
5 Mizoram -260 -109 -32 -134 67.85
6 Nagaland -103 -159 99 -54 80.15
7 Sikkim 143 198 163 168 48.07
8 Tripura 54 -81 93 22 117.53
Source: Report of the Twelfth Finance Commission, GoI, February 2005.

ADB TA No. 4297-IND, Final Report
Capacity Building For Fiscal Reforms in Sikkim
77
5. Expenditure Management and Budget Making
5.1 Current Practice of Expenditure Management and Budget Making
Expenditure management in governments has broadly the following objectives – (i) achievement
of macroeconomic stability. Although this objective has greater applicability to Central
governments, subnational governments have also a substantial role in that persistent deficits at
lower levels of government could contribute to several adverse pressures on the economy.
Consequently, this objective lays emphasis on the role of expenditure management in the
determination of aggregate expenditures and their distribution among various functions. In
addition this objective aims at achieving a greater congruence between intent and outcome or
estimates and the actual outturn at the end of the fiscal year. (ii) The second objective is to secure
economies of scale in expenditure both in planning and implementation stages. If the previous
objective reflects the major economic dimension of expenditure management, the second
dimension reflects the imperative need for prudence and rectitude in incurring expenditures. (iii)
The third objective is to ensure an improved delivery of services. As an integral part of this effort,
alternative ways of delivering services may also be explored. This objective reflects the
performance dimension of expenditure management, and (iv) the system also aims at ensuring a
full utilization of benefits conferred by government outlays. In a way, this is a logical extension of
the preceding objective. These objectives have to be concurrently achieved by the system.
Judged by the above criteria, the system of expenditure management in Sikkim has several
problem areas. In general, it is more concerned with the application of financial and legal controls
in the collection and disbursement of monies. The other areas receive scant or no attention at all.
To some extent this imbalanced approach may have its origins in the administrative process now in
place. Accordingly, the process aspects are considered here first, followed by a review of the
adequacy of expenditure management in selected areas, viz., policy controls, control of personnel,
control of public works, and control of poverty alleviation programs. Enhancing fiscal capacity in
Sikkim requires sustained, assiduous efforts in both these areas.
Diverse approaches are followed for plan and non-plan expenditures. In either case, the basis of
allocation is largely on the items of expenditures than on programs, or their benefits or the nexus
between the resources proposed to be allocated and the services to be delivered. As a result, the
budget has become a weak link in policy planning and in the overall management of the economy.
These issues need to be frontally addressed through an organized focus on programs, and the
delivery of services.

ADB TA No. 4297-IND, Final Report
Capacity Building For Fiscal Reforms in Sikkim
78
5.2 Budgetary Process and Policy Planning: An Evaluation
The existing budgetary process in Sikkim is illustrated in Figure 12. It shows that two different
approaches are followed for Plan and non-Plan outlays. In regard to the former, sectoral
expenditures are largely determined through the medium term and annual plans. As noted earlier,
a major part of the Plan outlay is funded through central assistance. In view of the origins of
funding, the local proposals also follows the Centre‟s guidelines. Indeed, it can be said that to a
very substantial extent, policy formulation in this regard takes place at the Centre. The local
contribution is, at best, marginal. The non-Plan exercises are undertaken separately and there is, as
yet, no planning for the future years. Even for the next year, the orientation is to restrict the
growth of these outlays through an embargo on the creation of posts and other approaches. The
focus of review and allocations is the object basis in isolation of the larger implications for the
programs as a whole. Often, in the process, the distinctive features and consequently requirements
may not be given the attention due. Expenditures, which by definition and in terms of their
implications for the society, have to be unequal, tend to be treated as equal. Moreover, efforts
need to be made to link the proposed outlays with the delivery of services. To some extent, the
absence of this focus may have its origins in the system of budget classification which is mostly
oriented to objects of expenditure.
Figure 12 shows the various steps involved in the preparation of the annual budget. The process is
too traditional, inadequate for the purposes to be served, and is in desperate need of improvement.
Steps proposed for improvement should, in the first instance, recognize the problems that are
experienced now. The problems are several but may be briefly stated as follows: (i) The schism
between Plan and non-Plan approaches is so deep rooted that for all intents and purposes, there is a
dividing wall between the two in all stages of budget preparation: Two separate budget circulars
are issued covering the respective areas. (ii) The circulars are routine in nature and do not illumine
the economic conditions forming the backdrop for the annual budget, nor does it identify the areas
where economies are to be procured or the steps being taken or proposed to be taken leading to an
improvement in the delivery of services. It is, as if, there is no specific agenda to be pursued. (iii)
The budget review is based on an analysis of running outlays in terms of norms, and usually
adjustments are made at the margins which anyway tend to be restored during the course of the
fiscal year through additional allocations. The final budget estimates therefore tend to be putative
and the end-of-the-year budgetary outcome may be very different. Revenue estimates are either
overestimated (e.g., transfers from the Centre) or underestimated (e.g. own resources).

ADB TA No. 4297-IND, Final Report
Capacity Building For Fiscal Reforms in Sikkim
79
Figure 12 Sikkim: Budget Cycle
Resource AllocationSeptember -
October
Annual Budget Circulars are
issued by Departments of
Finance and Planning on the
preparation of next year's
estimates
October -
November
Estimates furnished by the
administrative departments are
reviewed by Finance and
Planning Departments
October and
March
Supplementary estimates are
processed twice an year for
Legislative approval
Resource Utilization April- March Budgeted funds are available to
be spent by the agencies subject
to the financial powers delegated
November
Sectoral ceilings for plan are
finalized in consultation with the
Planning Commission and are
communicated to Finance for
inclusion in the draft budget
New estimates for revenues,
plan and non-plan expenditures
are finalized
December
February-
March
Budgets are consolidated and are
processed with the Legislature
for approval

ADB TA No. 4297-IND, Final Report
Capacity Building For Fiscal Reforms in Sikkim
80
Figure 12 SIKKIM: Budget Cycle (Contd.)
Resource Utilization
Accounting
Accounts
division in
agencies
All departments and agencies
have separate Accounts
Divisions that are manned by the
Department of Finance
Claims for
payments
All Claims for payment are
processed through the Pay and
Accounts Officers attached to
each district
Audit of final
Accounts
Final Accounts are audited by
the Accountant General and the
Audit Report submitted to the
Legislature
Forms of
payments and
banking
arrangements
Most payments including
salaries are made in cash.
Banking arrangements are made
with the Sate bank of Sikkim
Compilation
and
consolidation
of accounts
Initial accounts are compiled by
the pay and Accounts, and later
by the Accountant General
During the year, capital outlays are usually restrained in order to be within the stipulated fiscal
deficit levels. (iv) Although guidelines exist for the formulation of project estimates, they are
either circumvented or are not adhered to. Contracted prices tend to be different from the
estimates made in-house. (v) Control of staff is partly centralized and partly decentralized. The
Department of Personnel is responsible for the determination of posts in categories A and B, while
for others, the Heads of Departments are empowered to create posts within the budgetary
allocations.
Improvements in this area require changes in the systems as well as in operational techniques.
There is an obvious mismatch between the objectives of fiscal policy and the instruments of
expenditure management. Implementation of fiscal policies requires more than a year. It is

ADB TA No. 4297-IND, Final Report
Capacity Building For Fiscal Reforms in Sikkim
81
therefore appropriate that a medium term expenditure planning is undertaken. Furthermore, while
the distribution of plan and non-plan may be continued (to distinguish the sources of financing),
the basis of annual review and thus policy making, the budget review should be in terms of
programmes and their intended achievements, as well as, in some cases, outcomes. As an
extension, a performance oriented budget may be prepared. Box -VI illustrates how a performance
based budget may be prepared. As an integral part of this the budget classification may also be
changed to programmes while being within the overall guidelines issued by the Comptroller and
Auditor General. This will ensure the restoration of the much needed balance in review.
Moreover, as an extension of this approach, and following the new tradition of the Government of
India, efforts may also be made to prepare Gender based budgets.
These approaches need to be supplemented by organizational measures. It is suggested, in a
following section, that the two departments – Finance and Planning should be integrated. This
integration would facilitate the formulation and implementation of a more coherent approach to
budgetary planning. It should be explicitly noted that the economic context within which
expenditure management was working has changed. It should now be geared to reducing the rate
of growth of expenditure as well shifting outlays to more productive sectors.
5.3 Budget and Fiscal Policy Making: Emerging Issues
Although fiscal policy is formulated within the parameters of the economy, it also has the purpose
of influencing the direction of the economy either through direct participation or through direction
or through provision of inducements. In turn, the policy may be forward looking in that future
developments are anticipated and appropriate policies together with risk cushions are formulated
and are in place to meet contingencies. Alternatively, the policy, instead of being proactive, may
be reactive and governments may engage in a kind of fire brigade operations. In general, however,
the former approach is followed: accordingly, the annual budget is prepared reflecting the current
and future policies. The forecast of the budget may not always materialize in the anticipated
manner and frequent changes may be needed as the fiscal year progress. In this area, the annual
budget making process reveals several problem areas. These are indicated below.
Short-term orientation: The fiscal policy as announced in the budget is limited to one fiscal
year. Public investments may be spread over a number of years and related policies may be
indicated in the Five-year or Annual Plan documents. In reality, however, most policies
require more than an year to get completed and intended objectives achieved. There is,
therefore, a mismatch between the time taken to implement policies and the period covered by

ADB TA No. 4297-IND, Final Report
Capacity Building For Fiscal Reforms in Sikkim
82
the annual budget. Given that the constitutional compulsions have to be faithfully observed, it
is clear that other arrangements have to be made supplementing the annual budget. Indeed, a
medium term fiscal outlook would minimize uncertainty and enable various economic agents
to plan their own activities for the medium period.
Economic outlook: Fiscal policies have to anticipate the events and trends of the future. While
there is always an implicit scenario in the minds of the Finance officials, greater reliance is
placed on projecting the previous trends, and norms contributing to expenditure determination.
There are many activities, however, that are dependent on the economic climate and it is
essential that there are explicitly recognized and indicated to all participants in the budgetary
process including the public.
Preparation of annual estimates: The empirical basis of the revenue and expenditure
estimates leaves a good deal of desired. Even though the economy is estimated to grow during
the next year, some of the revenue estimates for the next year are pitched at a level lower than
the actual collections during the preceding years. As a result, the budget outcome at the end of
the year may be different from the estimates. Granted that the estimates tend to be putative,
they also form the basis for the fiscal policy to be pursued and it is of utmost importance that
the empirical underpinning of the estimates is enhanced.
Box VI Performance Oriented Budget: An Illustration
Case of Department of Healthcare, Human Services and Family Welfare
Step 1: It is important the objectives sought to be achieved through the proposed budget are stated
with utmost specificity so that the year end performance could be evaluated.
Step 2: This step comprises the preparation of a Financial Requirement Table. This Table is at the
heart of performance oriented budget as it links the outlays with the proposed objectives.
The Table seeks to present the programmes and activities of the department as well as the
objects on which it is spent. The existing minor and subheads, as well as the object Heads of
Accounts are shown below.
Minor Heads Object Heads
Maintenance and Repairs Salaries
Hospitals and Dispensaries Wages
Health sub-centres Travel Expenses
Primary Health Centre Office Expenses
Assistance to Panchayat Raj Institutions Supplies and Materials
Allopathy Other Charges
Prevention and Control of Diseases Motor Vehicles
Drug Control Repair and Maintenance
Public Health Education Purchase of Drugs
Training Publication
Rural Family Welfare Services Minor Works
Urban Family Welfare Services Purchase of Medical Equipment
Transport Grants-in-Aid
Compensation Scholarship and Stipend
General Pool Accommodation Advertising and Publicity

ADB TA No. 4297-IND, Final Report
Capacity Building For Fiscal Reforms in Sikkim
83
Box VI Performance Oriented Budget: An Illustration
Vital Statistics Information, Education and
Communication Furnishing and
Renovation Palliative Treatment
The minor Heads shown above are an amalgam of organizational and program aspects.
Revised some years ago to reflect the program concerns, it is still dominated by
organizational approach. In a performance based budget, the Financial Requirements Table
will illustrate both the Programmes (which reflect the objectives specified for the next year)
and objectwise Heads.
Financial Requirements Table
Department of Healthcare, Human Services and Family Welfare
I. Programmes and Activities Actuals R.E. B.E.
Preventive Care
Curative Care
Drug Control
Family Welfare Services
Public Health Education
Vital Statistics
Compensation (Incentives)
Policy Formulation
General Administrative Support
Total
II. Objectwise Expenditure
Salaries and Wages
Other Running Costs
Transport
Purchase of Materials & Equipment
Purchase of Drugs
Major and Minor Works
Grants-ion-Aid
Other Expenditure
Total
(Totals of I and II are the same)
Each progamme can be subdivided into several activities depending on the range covered. Essentially, the
Programme classification seeks to speak the language of a Manager in that it links the programmes to the
objectives, while also serving as a basis for allocation. It also permits an analysis of the programme as a
whole, rather than being viewed in a segmented way.
Step 3 Performance Goals and Indicators
Each of the above programmes are discussed in detail and the goals to be achieved as well as
the accomplishments are indicated. To permit an objective assessment, relevant objective
indicators are also formulated.
The above presentation shifts emphasis from the objects on which monies are spent to the
goals to be achieved. It seeks to make organizational responsibilities more coherent and
transparent. It also makes the organization responsible not merely for moneys spent but also
the work performed.
This type of budget can be appended to start with to the Departmental budgets.
5.4 Expenditure Management and Budget Making Process: Proposed Reforms
The above and related issues can be addressed through the adoption of a fivefold approach – (a)
enactment of fiscal responsibility legislation, (b) preparation of an economic outlook; (c) emphasis
on the formulation and application of policy indicators or anchors, (d) strengthening the annual
budget process and (e) management of Central transfers. These are discussed below:

ADB TA No. 4297-IND, Final Report
Capacity Building For Fiscal Reforms in Sikkim
84
5.4.1 Fiscal Responsibility Legislation
An important issue pertaining to improving capacity to design and implement fiscal policy relates
to the legal and administrative peocess. Sometimes, these two are posed as alternatives. It is often
argued that the strengthening administrative system is an internal process to the government and
the public may have very little opportunity to recognize the importance much less be aware of the
need for improving it. On the other hand, enacting appropriate legislations is a visible process
that involves deliberations by the representatives of the people and to that extent, there is an
explicit opportunity for the public to become aware of it. It is also suggested that a law has a
powerful restraint about it in that it specifies the limits and the outlying contours of policy. In
reality, however, these are complementary. The law, by itself may not be adequate and can not
replace a strong administrative process. The process too may stand to gain when it is reinforced by
the provisions of law. These aspects have, however, become academic in the light of the Tf.F.C.
recommendations. The Commission recommended that all States, regardless whether they have a
revenue surplus or deficit, but keen to have its outstanding debt to the Centre consolidated and
restructured, and obtain relief, should enact Fiscal Responsibility legislation. During a number of
States have passed legislation in this regard, and others are engaged in preparing and passing the
bill in their respective legislatures.
The main advantages of Fiscal Responsibility legislation is, apart from the debt relief provided by
the Centre – a major consideration in itself – that it not only spreads the general awareness of the
fiscal problems facing a state government and the need to imbibe fiscal discipline but also provides
a window of opportunity to provide a roadmap about the fiscal policy proposed to be followed by
the Government. The legislation also provides a stimulus to the policy makers to ensure that the
policies are in conformity with the spirit and word of the legislation. It also makes the policy
maker to look beyond the confines of the annuality of the budget to the medium term and to the
fulfillment of budgetary objectives over that period. Implicitly, it requires that fiscal policy
planning be organized on a medium term basis. In the light of the enunciation of these advantages,
it is appropriate that Government of Sikkim also takes steps to prepare and enact Fiscal
Responsibility legislation.
The content of the proposed legislation requires careful consideration. Since Sikkim is a State
which had a current account surplus during the period 1996-97 to 2005-06 (Budget Estimates).
(Parenthetically, it should be noted that the surplus during 1999-00 was negligible and was much
lower than the previous years or since that year) it is appropriate that one of the objectives of the
fiscal policy and therefore a monitorable goal, be the maintenance of the current account surplus
over the medium term, i.e. 2005-06 to 2007-08. Similarly, a gradual reduction in the fiscal deficit

ADB TA No. 4297-IND, Final Report
Capacity Building For Fiscal Reforms in Sikkim
85
(which was achieved during the period 1996-97 to 2003-04) may also be included as one of the
goals of legislation; other goals may deal with the efforts to be made to improve the resource
utilization patterns (e.g., reorganization of government departments; reduction of government
manpower), and the specification of monitorable performance indicators in the areas of education
and public health. In sum, the legislation should demonstrate the desire to maintain prudent public
finances while enhancing transparency and accountability.
Under this approach a medium term fiscal reform policy will be worked out for Sikkim that
provides a projected fiscal framework after taking into account the broad reform measures
suggested both on revenue and expenditure sides.
5.4.2 Preparation of Economic Outlook
It is necessary that supplementing the Fiscal Responsibility legislation, an annual forecast is made
of the likely trends in the economy during the next year, as well as for two years beyond (a total of
three years – or the duration of the medium term). Such a forecast should be made each year, so
that on a rolling basis, a continuing scenario is available. Such forecasts influence the shape and
content of the proposed budget. In some situations, they may indicate the need to augment outlays
to counteract recessionary tendencies or the need to provide greater support to some sections of the
community that are financially challenged. More important, it facilitates the identification and
measurement of the changes in revenue resources and in outlays. The economic outlook will also
be helpful in determining the ceilings on expenditures proposed to be allocated to departments and
agencies.
5.4.3 Policy Indicators
The enactment of Fiscal Responsibility legislation in turn requires the development and application
of indicators which are in conformity with the framework of objectives. Accordingly, it appears
prudent to apply the following indicators at every step of the annual budgetary process. These
may include the current account surplus, the overall fiscal deficit, and performance indicators or
targets that are sought to be achieved. The application of the current account surplus requires the
specification of the magnitude and the means proposed to be applied for achieving that goal. If
this involves mobilization of additional revenues, the measures to achieve that goal need to be
formulated. Each indicator is expected to serve as an anchor to achieve a specified goal. As for
performance, it is appropriate that suitable measures which also lend themselves to easy
measurement are evolved, more so in social areas those are deemed to be vital for the development
of the community.

ADB TA No. 4297-IND, Final Report
Capacity Building For Fiscal Reforms in Sikkim
86
5.4.4 Strengthening Annual Budget Making
Improving the budgetary process is envisaged in terms of three stages– medium term budgeting;
formulation of estimates (revenue and expenditure), and the budgetary process itself. As noted
earlier, the enactment of Fiscal Responsibility legislation could lead to a medium term budgetary
or fiscal planning. Medium term involves the preparation of revenue and expenditure estimates for
the next three years on a rolling basis, and on the assumption that existing policies continue over
the period without any major change. The forecast would keep in view any changes emanating
from the developments in the economy. Medium term forecasts, when prepared, would provide
the essential backdrop for the preparation of the annual budget. Essentially, the annual budget will
be a slice of the medium term plan except that it includes the changes needed reflecting the
developments in the economy, since the preparation of the forecast. Needless to add, the annual
budget is the only legal instrument; the medium term forecast is just what it claims to be – a
forecast. Although the budget is also a forecast, it is the basis for the grant of legislative approval.
The second step relates to the improvement of budget estimates for revenues and expenditures. In
both these cases, it is important to aim at the achievement of congruence between intent and
outcome of estimates and actuals. Such congruence requires that the estimates be formulated with
reference to empirical factors illustrated in Tables 28 and 29. They illustrate the underlying factors
as well as the relative ease with which the estimates can be formulated. Given that the bulk of
some types of revenue are collected from three industries and from governmental transactions, and
that more than half of expenditures is spent on wages and salaries, the maintenance of data, as well
as the formulation of estimates is rendered considerably easier. These data can be stored in a
computer and the expenditure profile of each agency and the revenue profile of each type of tax
can be compiled and utilized for purposes of estimates.
It should be noted, however, that when initial estimates are furnished, the revenue agencies tend to
underestimate revenue collections, while the spending departments tend to overstate their current
and capital requirements. These tendencies need to be verified with reference to the empirical data
indicated in the tables. Preparation of expenditure profiles assists in a better understanding of the
distinctive requirements of each agency and to that extent norms have to be varied. These aspects
have to be taken account by the Finance Department and the initial estimates submitted by the
agencies should be reviewed in detail.
The budget is now compiled largely through an aggregation process in that the draft estimates
submitted by the agencies are reviewed in the Finance and Planning Departments, reflecting the
respective spheres of responsibility, and are then consolidated. Once the medium term rolling

ADB TA No. 4297-IND, Final Report
Capacity Building For Fiscal Reforms in Sikkim
87
budgeting is introduced, however, the likely requirements of the agencies would be available
centrally with the Department of Finance and on that basis ceilings for non-plan and plan
expenditures may be formulated. These ceilings may be subjected to a sensitivity analysis against
the economic outlook and the ceilings firmed up. They may then be submitted to the cabinet and
its approval obtained. The ceilings so approved should be provided to the agencies and they be
instructed to formulate the detailed estimates within those ceilings, while also providing
information on expected performance. The allocations would be need and performance based.
The opportunity of the issue of the budget circular should be taken to identify the areas where
economies are to be procured, or where improved delivery of services is to be ensured. This
revised procedure will facilitate the achievement of greater congruence between intent and
outcome. An issue may be raised in this context whether the revised procedure would be within
the administrative reach of the Sikkimese authorities. Indeed, on that count, there may be a plea
for additional allocation of resources, equipment, etc. In the assessment of the team, no such
additional resources are necessary except in the form of a personal computer. Indeed, when the
budget process is computerised implying an electronic submission of estimates and their revenue,
there may be staff savings.
Some of these problems can be avoided by implementing the suggestions made earlier. In
addition, the following measures would be appropriate. (i) The annual budget circular should be
integrated into one and expenditure ceilings should be conveyed to the departments. The circular
should also indicate manpower ceilings for them. (ii) Budget Estimates should be formulated with
reference to the empirical factors illustrated in Part I. (iii) Guidelines on project formulation
should be adhered to. In addition, data should be maintained with reference to contract cost and
estimated completion cost; and (iv) the whole budgetary process should be computerised. The
submission of estimates by agencies, their review and consolidation can all be undertaken through
the computerised systems.
Table 28 Formulation of Revenue Estimates
Sl.
No. Type of
Revenue
Receipt
Economic Factors Technical Factors Others
A. Tax Revenues
1. State Income Tax Real growth of the
Economy; inflation rate
Rates of tax; number of
assesses; coverage
quality of tax
administration
Cost of non-
compliance
2. Land Revenue -- Land revenue rate;
exemptions, if any;
quality of tax
Cost of non-
compliance

ADB TA No. 4297-IND, Final Report
Capacity Building For Fiscal Reforms in Sikkim
88
Sl.
No. Type of
Revenue
Receipt
Economic Factors Technical Factors Others
administration
3. Stamp and
Registration
Real growth of the State
economy; inflation rate;
level of economic activity
Rates of stamp and
registration duties;
number of transactions
Cost of non-
compliance
4. State Excise Real growth of the State
economy; inflation rate;
quantum of remittances
Rate of excise on
different kinds of liquors,
number of outlets
Social
factors,
attitude
towards
drinking
5. Taxes on sales,
trade, etc.
Real growth of the State
economy, inflation rate,
remittances, propensity to
spend
Sales tax rates, quality of
tax administration
Cost of non-
compliance
6. Taxes on vehicles Real growth of the State
economy, inflation rate,
remittances, prices of
vehicles
Tax rate on vehicles,
number of vehicles
--
7. Other taxes on
commodities and
services
General level of
economic activity
Rates of tax on
entertainment, rate of
trade license fee, rate of
bazar contract fee, etc.
--
B. Non-tax Revenues
1. Interest receipts Outstanding loans, level
of non-performing assets
Rates of interest, book
adjustments of subsidies
to State PSUs
--
2. Dividends and
profits
Real growth, inflation and
level of economic activity
Profitability of State
investments, rates of
profits, book adjustments
with State PSUs
--
3. User charge for
general services
-- Rates of fee, charges,
fines, etc. charged for
various organs of the
State and the general
administration relating to
various services provided.
--
4. User charges for
social services
-- Rates of user charges for
services including
education, health,
medical, water supply and
sanitation, etc. and the
efficiency of
administration to realise
these user charges
5. User charges for
economic services
--- Rates of user charges,
economic services such as
agriculture, animal
husbandry, fisheries,
forestry, irrigation, power
industries, transport etc.
and the efficiency of
recovery.
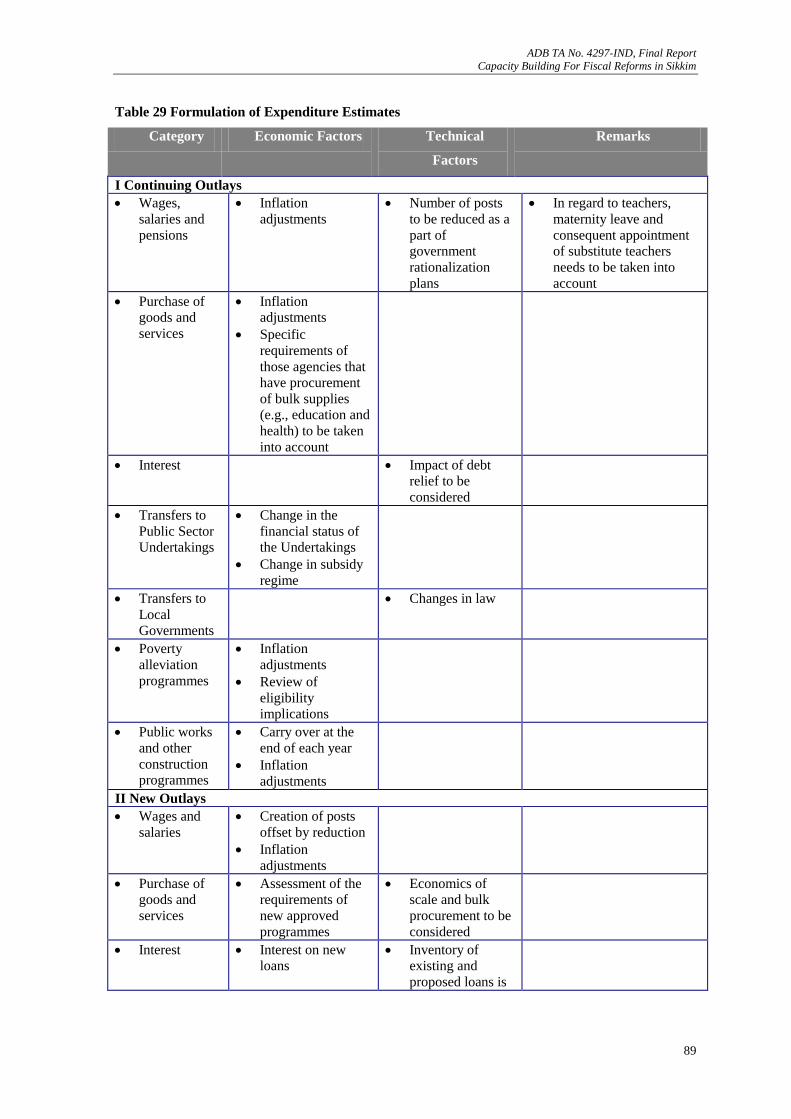
ADB TA No. 4297-IND, Final Report
Capacity Building For Fiscal Reforms in Sikkim
89
Table 29 Formulation of Expenditure Estimates
Category Economic Factors Technical
Factors
Remarks
I Continuing Outlays
Wages,
salaries and
pensions
Inflation
adjustments
Number of posts
to be reduced as a
part of
government
rationalization
plans
In regard to teachers,
maternity leave and
consequent appointment
of substitute teachers
needs to be taken into
account
Purchase of
goods and
services
Inflation
adjustments
Specific
requirements of
those agencies that
have procurement
of bulk supplies
(e.g., education and
health) to be taken
into account
Interest Impact of debt
relief to be
considered
Transfers to
Public Sector
Undertakings
Change in the
financial status of
the Undertakings
Change in subsidy
regime
Transfers to
Local
Governments
Changes in law
Poverty
alleviation
programmes
Inflation
adjustments
Review of
eligibility
implications
Public works
and other
construction
programmes
Carry over at the
end of each year
Inflation
adjustments
II New Outlays
Wages and
salaries
Creation of posts
offset by reduction
Inflation
adjustments
Purchase of
goods and
services
Assessment of the
requirements of
new approved
programmes
Economics of
scale and bulk
procurement to be
considered
Interest Interest on new
loans
Inventory of
existing and
proposed loans is

ADB TA No. 4297-IND, Final Report
Capacity Building For Fiscal Reforms in Sikkim
90
Category Economic Factors Technical
Factors
Remarks
essential
Transfers to
Public Sector
Undertakings
Assessment of
policy changes
Assessment of
internal resources
may be needed
Transfers to
Local
Governments
Implications of
new programmes to
assessed
Poverty
alleviation
programmes
Review of
eligibility
implications
Public works
and
construction
programmes
Estimation after
contracts are
awarded
Range of cost
escalation
Assessment of
technical capacity
to implement is
needed
This is an area where
slippages tend to be high.
III Unallocated Reserves
Unallocated
reserve It is important to
have a notional
reserve to meet
contingencies
IV Total expenditure
5.4.5 Management of Central Transfers
Fiscal management tends to acquire a different objective where the State is at the receiving end for
a bulk of the resources needed for the financing the annual budget. Sikkim is one of those States
that are heavily reliant on Central transfers including devolution of taxes and grants-in-aid. The
mechanisms of transfers together with amounts are shown in Figures 13 and 14.
This shows that the transfers received by the Government of Sikkim amount to nearly 80 per cent
of the net revenue of the State (i.e., after netting the transactions of Lottery, Power and Transport
Departments). The implications of this magnitude for the formulation of the annual budget are
several.
In terms of budget formulation, the receiving end needs to be assured on a firm basis of the
amounts that would become available to the State. The amount of grants-in-aid (Article 275) is
known in advance to Sikkimese authorities. There is, however, a change in the devolution of
resources as recommended by the Eleventh and Twelfth Finance Commission. Under the former,
the regime that was in force for the past years, grants-in-aid constituted the major part of the
received resources. Hereafter, however, the share of grants would be less during the next five year
period. Tax proceeds, unlike the grants, being based on percentages tend to vary with the actual
collection. In either event, however, the amounts likely to be available to Sikkim are converged,

ADB TA No. 4297-IND, Final Report
Capacity Building For Fiscal Reforms in Sikkim
91
barring some exceptional areas, by December of every year, so much so, that there is ample time
for the Government of Sikkim to internalize that resource level for determining their own
allocations. Resources that would become available as a part of the Plan are determined as a part
of the annual Plan discussion. In general, however, the States are assured that the amount of
assistance would not be less than the level of resources transferred during the preceding year. To
that extent, the level of resources transferred in the preceding year may be taken as a benchmark or
a threshold level and budgetary planning may be undertaken accordingly. It is appropriate for the
Government of Sikkim to plan expenditures in terms of the categories – (a) those that would be
covered under the threshold level; and (b) those that can be undertaken when more resources
become available. This would avoid the overestimation of the assistance in budget estimates. As
an extension, this would also reduce the gap between estimates and actuals.
During budget implementation stage, two issues are experienced by the State governments,
particularly in Sikkim. The submission of completion certificates that enable the State
Government to receive the assistance from the Centre may take some time, and in the meantime,
there may be additional strains on the cash resources of the Centre. Another issue relates to the
outlays on roads and bridges. The budget estimates are based on the technical and cost
calculations in house, while actual outlays are determined by the contract awarded. As a matter of
fact, the latter tends to be invariably higher than the former with the consequence that the
completed cost is vastly different from the original estimate. The gap is widened when the
implementation of the project is longer than initially estimated. A minor variation in the cost,
usually up to ten per cent, is accommodated by the Central Government but major variations have
to be borne by the State Government. Both these aspects need to be addressed. It is important
that a regular inventory of the receivables (there are off-the-shelf software available for the
purpose) is maintained in a personal computer and the process monitored regularly. As for the
second, an unallocated reserve should be maintained from which the excesses in public works over
the estimates could be met. The Reserve Fund should be considered a part of the overall budget,
and should be taken into account in the determination of the total expenditures.
It is clear from the preceding discussion that there are several areas that need to be strengthened
and when the steps are taken as proposed, then policy making would benefit substantially.

ADB TA No. 4297-IND, Final Report
Capacity Building For Fiscal Reforms in Sikkim
92
Figure 13 Central Transfers to States – Cycle of Operations
October
The budgeting/planning process at the Centre/States begins
with a letter from Planning Commission to the States to send
their resource projections. States are advised to keep Central
assistance and tax devolution at current year level while
making projections.
December
Normally, the Union Finance Ministry intimates the PC the
quantum of budget support and tax devolutions
January/
February
Using these figures along with the permissible borrowings, the
annual plans of the States are finalised between DCH of PC
and State Chief Ministers, well in time for the State budgets
February/
March
The State budgets which subsume the annual plans are usually
presented in the State legislature.
April-March
Central transfers relating to tax devolutions, non-plan grants
and State plan grants under Gadgil formula released to States
in equal monthly installments
To fixed
timings
Central transfers to the States in respect of the remaining
Planning Commission assistance, assistance for
Central/Centrally Sponsored Schemes from Central Ministries,
NEC and NLPF are governed by separate
guidelines/coordinationalities/considerations and their timings
can vary considerations.

ADB TA No. 4297-IND, Final Report
Capacity Building For Fiscal Reforms in Sikkim
93
Figure 14 Central Transfers to Sikkim: Actual for 2003-04 (in Rs. Crore)
690.7
(79.6% of Net Revenue
of 867.93)
Devolution
107.1
(15.5%)
Grants-in-Aid
583.56
(84.5%)
Non-Plan*
150.45
Plan
433.11
Non-Plan Revenue Deficit
Grant
141.47
Grants for Calamity Relief
8.86
Other Non-Plan Grants
0.12
Planning Commission
319.49
Central Ministries
53.28
North Eastern Council
8.05
Non-Lapsable Pool of
Funds
52.29
* Except for other non-plan grants of Rs.0.12 crores,
the rest is EFC grant

ADB TA No. 4297-IND, Final Report
Capacity Building For Fiscal Reforms in Sikkim
94
5.5 Budget Implementation
Three problems are experienced during this stage. First, since the original allocations in the annual
budget are not adequate, frequent resort is made to supplementary estimates during the year.
Second, there is no organized system of cash management. Third, as a result of the former,
expenditures during the last month of the fiscal year tend to be high.
It has been suggested earlier, that supplementary estimates may be processed only when resources,
either in the form of Central transfers or other resources, are assured. Similarly, it is important that
a system of cash management is installed. This approach while seeking to regulate the flows
(Table 30 shows the position of monthly receipts and expenditure for the past three years.)
throughout the fiscal year, also facilitates the issue and management of debt. The future passage of
the Fiscal Responsibility legislation would require a constant attention to the flows so that the
deficit could be contained within stipulated levels. Cash management implies that forecasts are
made (with each department submitting its plans to the Department of Finance) soon after the start
of the fiscal year after taking into account the seasonal factors affecting both receipts and
expenditures. This task will be considerably facilitated with the computerisation of the budgetary
process.
5.6 Practice of Expenditure Management: Four Areas
The system of expenditure management may appear, on surface that it is a mechanical and uniform
system. The application of the techniques of expenditure control may be different, al beit, in
degree, from one area to another. To identify these ramifications, a study has been made of four
areas, viz., policy, personnel, poverty alleviation programmes and public works. The results of
this study are discussed in Table 31 In each area, the issues and proposals for improvement are
indicated. They illustrate, in general, the pedestrian way in which the techniques are applied (or in
the case of poverty alleviation programmes where greater reliance is placed on public trust and
none at all on the techniques of expenditure management) and in the manner in which programmes
are designed. It is hardly necessary to emphasize that unless greater attention is paid to
expenditure management in the design stage, the utility of the system would be far less than
expected.

ADB TA No. 4297-IND, Final Report
Capacity Building For Fiscal Reforms in Sikkim
95
Table 30 Sikkim: Monthly Flows of Receipts and Expendtitures
Receipt & Expenditure form 1st April 2001 to 31st March 2002 as per Civil Accounts
April May June July August Sept. October Nov. Dec. Jan. Feb. March(p)
1 Revenue Receipts 10252.19 10252.19 10252.2 4870.05 6219.44 5606.53 7744.07 6077.75 5655.82 14517.82 4731.88 95184.91
2 Revenue Expenditure 8523 8523.02 8523.05 4049.7 5097.58 4470.4 7057.06 3978.44 3359.71 11174.47 4174.78 95365.61
3 Revenue Deficit (2-1) -1729.19 -1729.17 -1729.15 -820.35 -1121.86 -1136.13 -687.01 -2099.31 -2296.11 -3343.35 -557.1 180.7
4 Capital Outlay 502.45 503.23 503.24 620.58 1534.15 871.58 2468.28 909.86 893 1113.66 838.44 10209.65
5 Net Lending -7.59 -7.59 -7.58 -7.42 -8.05 -9.25 -8.56 -5.8 -5.25 -10.82 -8.87 -8.04
Fiscal Deficit (3+4+5) -1234.33 -1233.53 -1233.49 -207.19 404.24 -273.8 1772.71 -1195.25 -1408.36 -2240.51 272.47 10382.31
Net Public Debt 728.24 728.24 728.23 344.24 338.52 -27.66 798.29 1202.33 -642.92 733.24 488.46 268.26
Receipt & Expenditure form 1st April 2002 to 31st March 2003 as per Civil Accounts
April May June July August Sept. October Nov. Dec.r Jan. Feb. March(p)
1 Revenue Receipts 7374.85 7987.29 35444.47 7130.69 29496.86 11232.64 24500.73 8775.71 20787.78 7227.42 22319.81 25240.62
2 Revenue Expenditure 5302.37 5168.92 33584.69 8166.33 26235.59 7462.84 22071.65 5388.14 20250.04 6553.28 18504.2 29496.07
3 Revenue Deficit (2-1) -2072.48 -2818.37 -1859.78 1035.64 -3261.27 -3769.8 -2429.08 -3387.57 -537.74 -674.14 -3815.61 4255.45
4 Capital Outlay 78.7 363.51 1050.89 846.68 638.19 656.25 1877.52 509.63 1535.47 1571.52 2074.72 9594.87
5 Net Lending -11.37 -9.58 -17.03 -11.53 -11.36 -12.36 -8.84 -6.31 -7.98 -8.49 -13.72 -2.53
Fiscal Deficit (3+4+5) -2005.15 -2464.44 -825.92 1870.79 -2634.44 -3125.91 -560.4 -2884.25 989.75 888.89 -1754.61 13847.79
Net Public Debt 181.46 318.98 -120.81 164.7 998.61 255.22 430.94 -132.53 146.75 1244.53 -201.52 464.28
Receipt & Expenditure form 1st April 2003 to 31st March 2004 as per Civil Accounts
April May June July August Sept. October Nov. Dec. Jan. Feb. March(p)
1 Revenue Receipts 8272.56 6038.87 10003 10947.29 9927.62 4889.45 5892.53 7273.72 7550.14 9460.22 7430.29 46542.55
2 Revenue Expenditure 6036.09 5520.8 8534.84 9954.42 8728.68 7664.41 5400.72 7354.22 6310.79 3408.45 5019.1 44160.45
3 Revenue Deficit (2-1) -2236.47 -518.07 -1468.16 -992.87 -1198.94 2774.96 -491.81 80.5 -1239.35 -6051.77 -2411.19 -2382.1
4 Capital Outlay 7.28 716.06 1499.45 2298.77 407.4 2662.7 503.27 587.8 2842.12 681.99 814.69 8127.13
5 Net Lending -12.44 -14.79 -6.12 -9.72 -11.53 -10.57 -6.21 -5.42 -7.33 -5.08 -5.6 -3.4
Fiscal Deficit (3+4+5) -2241.63 183.2 25.17 1296.18 -803.07 5427.09 5.25 662.88 1595.44 -5374.86 -1602.1 5741.63
Net Public Debt 317.1 667 -451.45 346.09 49.48 241.68 1225.73 -534.49 954.43 575.67 1010.62 882.46

ADB TA No. 4297-IND, Final Report
Capacity Building For Fiscal Reforms in Sikkim
96
Table 31 Expenditure Control in Practice: Four Cases
Area Features Issues Proposals
I. Control of Policy Projects and
programs as well as now
policies are required to be
approved by Planning and
Finance Department. For
Plan projects, guidelines
and prescribed formats
are available.
New policies are
usually under
estimated. Plan
guidelines are ot
always complied with.
The emphasis is
only on new policies
and projects and not on
weeding out the
existing ineffective
programmes.
The orientation is
too short-term.
At this stage of
development and
reorganizing the role of
the State as a
facilitator, it is
necessary that a
fundamental review is
undertaken to reduce
the unproductive
expenditure.
As an integral part
of the above alternative
mechanisms, such as
public-private
partnerships, should be
explored.
A medium term
outlook needs to be
developed.
II. Control of
Personnel In general there is an
embargo on the creation
of posts. A scheme for
voluntary retirement is in
operation.
Creation of senior
posts requires the
approval of Personnel
Department. Lower level
posts can be created by
Heads of departments
where budget funds are
available.
The mechanisms in
place have not been
effective.
Department of
Personnel has no
monitoring
responsibility.
A proactive stance
needs to be taken
hereafter to reduce
personnel.
The requirements
of each agency need to
be reviewed as was
done in 2002, and
manpower ceilings
should be indicated.
Targets for
reduction should also
be included.
III. Poverty Allevia
tion Programme
Swarna Jayanti
Gram Swarojgar
Yojana
Sampoorna
Grameen Rozgar
Yojana
Rural water
Organizing self-help
groups to take up income
generating employment.
Targeted to rural poor
below the poverty line.
Divided into two
streams.
Payment of 5 kg. of
foodgrains as wages to
those rural poor who are
engaged in unskilled
labour at minimum wage.
Provision of safe
drinking water to rural
households.
Provision of
An amount of Rs.
46 crore has been spent
on these schemes.
The main issues
relate to the
determination of the
eligible poor and
needy. As in practice
now, they lend
themselves to systemic
abuse.
It is expected that
in small and compact
societies, any abuse of
the system would be
quickly identified in
the rural areas. It is
held that this approach
is far more effective
than piling up with
more conditions as part
of schemes.
It is necessary that
the schemes are
reviewed and audited,
from time to time,
whether the intended
benefits are being
determined by the
targeted groups.

ADB TA No. 4297-IND, Final Report
Capacity Building For Fiscal Reforms in Sikkim
97
Area Features Issues Proposals
supply
Rural sanitation
Modal village
Rural Housing
Scheme
household latrines.
Construction of
houses for the rural poor.
Financial assistance
and GoI sheets are
provided to the needy.
IV. Control of
Public Works There are several
components – roads,
bridges, rural roads and
others.
Most programmes are
taken up as a part of Plans
and most of them are
Centrally aided –
although the rate of
contribution varies from
one programme to
another.
Construction
estimates made by the
concerned departments
form the basis for budget
estimates.
The major issue
relates to cost
escalation. The budget
estimates are based on
initial estimates but the
contracted cost tends to
be very different.
Most of the
maintenance work
continues to be directly
done by the
departments
themselves.
A Reserve Fund
may be set up to cover
the excess over
estimates.
For internal
purpose maintenance
needs to be done with
reference to contracted
cost.
The anchor of
expenditure
management in this
area should be the
estimates based on
completed contract
cost.
The maintenance
work should be
considered for
contracting out and the
headquarters
establishment of
departments should be
considered for
reduction.

ADB TA No. 4297-IND, Final Report
Capacity Building For Fiscal Reforms in Sikkim
98
Figure 15 Sikkim: Revised Budgetary Process (to be operated on computerised basis)
Calendar Events
October-
November
Mid year review
Preparation of economic outlook
Preparation of draft ceilings for continuing and new
outlays (current and capital)
Processing of ceilings for Cabinet approval
Selection of critical areas
December-
January Issue of a single budget circular specifying the
expenditure ceilings and targets for reduction
Review of draft estimates submitted by agencies
Discussions with Planning Commission
February-
March Revisions in estimates
Consolidation of the draft Budget and processing with
the Legislature
April, July, October,
January
Implementation of the Budget
Receipt of quarterly requirements of cash from
agencies
Determination of quarterly ceilings
April to March Payments system to be reorganized as per suggestions
made in the report

ADB TA No. 4297-IND, Final Report
Capacity Building For Fiscal Reforms in Sikkim
99
5.7 Procurement and Contracting out:
Different procedures are in operation for procurement in that while departments of Education and
Health are allowed to secure their supplies through open tendering and contracting, other
departments have to get their supplies through specified public sector undertakings – a process that
tends to be costlier and somewhat lengthy and time consuming. This also adds to the cost of
providing services as the specified public sector undertakings are not necessarily the most
competitive in cost and quality terms. Moreover, most services are directly provided by
government departments.
It is important that the agencies are encouraged in all cases to promote open tendering and
contracting. On the other side, it is also necessary to contract out services, particularly in urban
management, and a network of contractors and non-governmental organizations are encouraged to
provide publicly funded services.
5.8 Payments and Accounting
Most payments are made in the form of cash – a process that is labour intensive and
expensive as well. The accounting system, while in conformity with the practices laid down by the
Indian Audit and Accounts Department, shows that there are minor deviations from the guidelines,
in so far as the operations of the local government are concerned. It is appropriate that a separate
office is set up to operate payrolls and pensions on a computerized basis. This approach is
economical and efficient too. As for the accounting system, it is important to review the actual
operations at the local level, to ensure whether they are meeting the administrative requirements of
those levels.
5.9 Financial Management in Spending Departments
It is a truism that rigorous application of the techniques of expenditure management by the
Department of Finance at the apex of the government is not effective, unless there is a financial
conscience in the spending departments. Such a conscientious approach would develop only when
there is a partnership between the Central agencies and the spending departments. In order to
permit such a partnership it is necessary that the system in the spending agencies is also
computerised so that an on-line dialogue may develop between the two sides. Furthermore, it has
to be recognized that with the gradual development of the infrastructure, the application of
computerized system is rendered easy.
5.10 Transparency and Accountability
The issues relating to the budget classification system have been noted earlier. In the day to day
working of this system, it is noted that several lumpsum provisions are made in the budget. These

ADB TA No. 4297-IND, Final Report
Capacity Building For Fiscal Reforms in Sikkim
100
provisions, by their very nature obscure the purposes and destination. It is important that these
approaches are avoided and greater detail provided.
Under the present system, the accountability is only in terms of the amounts spent. As a
consequence, the purposes of the outlays, or the performance expected are never clarified.
Accountability should include responsibility for results. Money spent reflects only one dimension.
It is important that efforts are made to expand the scope of accountability to be inclusive of the
performance aspects too. In this connection, the earlier discussion on the preparation of a
performance based budget is very pertinent.
5.11 Staff Training
The strengthening of the capacity for fiscal reforms also rests, in addition to the systemic aspects,
on the development of human skills. As it is, there is an inherent and a clear need for
development, through an intensive training programme for the local officials in expenditure
management. This need is doubly reinforced by the measures for the improvement of the system
suggested in this report. The training programme in this regard should adopt a two tier approach –
one for senior officials, and another for middle level and operational level officials. For the
former, it should be an orientation programme so that policy makers could have a detailed picture
of the existing system and the proposed system. Without their understanding and continuing
commitment, it would be difficult to sustain the reform. For the latter group, a more intensive
programme of training with longer duration should be considered. Moreover, Refresher
Programmes for both levels should be considered at periodic intervals.
Supplementing the above effort, it is necessary to prepare a Hand Book to serve the purposes as a
desk reference for officials. The preparation of such an Hand Book based on the existing practices
would have, however, very limited value. Rather, the Hand Book should take into account all the
proposals made for improvement. The implementation of the proposals would be feasible only in
the medium term. The proposals need to be considered by the Government of Sikkim and only
after a decision is made, in principle, to implement them that the preparation of a Hand Book can
be taken up. These aspects were discussed with the senior officials of the Department of Finance
and it was agreed that it would be more appropriate after a decision(s) is taken on the
recommendations of the team.
5.12 Expenditure Management in Lower Levels of Government
Although the 73rd
amendment to the Constitution was approved some time ago, in Sikkim, the
implementation of the decentralization programme was started only a couple of years ago. As an
integral part of this effort some subjects specified in the 11th Schedule have already been

ADB TA No. 4297-IND, Final Report
Capacity Building For Fiscal Reforms in Sikkim
101
transferred and more are expected to be transferred in due course. It is an evolving area where the
progress made at each stage is carefully evaluated before taking the next steps. Caution in this
regard is only appropriate as any major leakage or failure could cast serious doubts about the
whole programme of decentralization.
The task of designing the budgetary and accounting systems in Panchayat Raj Institutions (PRI)
was entrusted, on the basis of the recommendations of the Eleventh Finance Commission, to the
Comptroller and Auditor General of India (C&AG). Accordingly, the formats for budgets and
accounts were designed and instructions were issued to all State Governments to implement them.
The formats are fairly detailed, but they made no distinction, in terms of applicability, between the
three levels of PRI. The introduction of the system prescribed by the C&AG is based on the
assumption that there is adequate trained personnel at each level to operate the system. Indeed, in
some cases, it may even require the assistance of a professional Accountant.
In Sikkim, there are only two levels of PRI, and taking into account the incipient stage of the
administrative capacity both at the village and the District levels, the implementation of the system
is rendered difficult. The latter is far more advanced than the former primarily for the reason that
it is endowed with staff resources that are not available for village levels. Keeping these and
related factors in view, the Department of Rural Development in Sikkim, reduced the number of
formats to be maintained while keeping the essential structure in tact. As these formats were in not
full compliance with the system designed by the C&AG, the issue was raised whether more should
not be done in the PRI to ensure a better implementation of the system. Following this, the
number of formats has been increased and a new system, while still not being in compliance of the
full system designed by the C&AG has been agreed to between the Government of Sikkim and the
Accountant General (representing the C&AG). Meanwhile, each village Panchayat was given an
amount of Rs. 10 lakh, and Zilla Parishads Rs. 50 lakhs to implement the proposed budgetary and
accounting systems. In addition, the audit of PRI, was entrusted to the State Accountant General.
There can hardly be any debate on the desirability of a comprehensive and transparent budget and
accounting system in the PRI, particularly in a context, where, with the progress of time, more and
more tasks would be transferred to the PRI and corresponding arrangements made to provide
financing too. The proposed system can, however, prove to be both complex and formidable in
view of the fact that it envisages, among others, the maintenance of an inventory of assets, as well
as the computation of depreciation – twin aspects that were not hitherto a part of the Indian
government accounting tradition. Though the preparation of these records has been rendered
easier, thanks to the availability of off-the-shelf software, it has to be noted, that the use of
computers is very limited in Sikkim. In recognition of this, the Department of Rural Development

ADB TA No. 4297-IND, Final Report
Capacity Building For Fiscal Reforms in Sikkim
102
has conducted training programmes for the officials of PRI in Book keeping and other areas.
Notwithstanding these efforts at enhancing the capacity in PRI, the fact remains, as noted in the
reports of the Internal Auditor, that even the maintenance of Cash Register, a relatively easier task,
is in arrears. It is therefore prudent to keep the issue under constant review and devise additional
practical steps that make the installation of the budget and accounting system a reality.
5.13 E-Governance
Computerization of processes of various departments of the Government in administrative,
revenue collecting, and related spheres contributes to improved efficiency. Use of information
technology in government administration helps in streamlining various functions and through
updating of information collected decision making becomes more scientific and transparent.
Especially in revenue departments computerization facilitates collection of information and
enforcement of various regulatory requirements of the departments and ensures that permits,
licenses, and various kind of forms are issued without much of hassle. People also benefit due to
their access to various official procedures, information in a transparent manner thus reducing
harassment. The payment system becomes streamlined with the interface of official payment
authority and the banks that helps in better expenditure management.
The Department of Information and Technology in the Government of Sikkim facilitates
expansion of computerization in the functioning of departments. The department of IT has been
procuring computers, organizing training for government officials and trying to expand the IT
network in the state. Outside the government administrative departments, the IT department has
established 40 Community Information Centers (CIC) to provide computer facility to large number
of people in the state. National Informatics Centre (NIC) of Ministry of Information and
Technology, GOI has taken a lead in Sikkim in disseminating IT facility in various departments
and providing online data transfer facility. E-Governance in Sikkim however has a long way to go
forward. Though availability of computers is not a problem for the state administration, the
effective use of IT online has not taken off. The internet facility in the Government departments
has been provided by the NIC by putting radio frequency hubs in various places. The
Administration still uses traditional mode of large volume of paper work and manual data entry
and file maintenance. The effective use of IT in these cases has the potential to reduce large
manpower used for manual paper work and save time thus infusing greater efficiency in decision
making. Given the topography of the State e-governance can be a very good way of collecting
information, monitoring the progress of various projects and ascertain the requirements at line
departments at a lower cost.

ADB TA No. 4297-IND, Final Report
Capacity Building For Fiscal Reforms in Sikkim
103
There has been some progress in the E-Governance in Sikkim besides establishing CICs. Some of
the computerization programs in Government departments are described below:
The land records of the revenue department have been computerized with help of NIC and
now computerized certificates relating to land records are being issued. The
computerization of land records has been completed in the state and in four districts and in
revenue office in Gangtok land record centres were established. The computerized
mutation of land records was extended to three sub-divisions and work is in progress in
two more districts. However, the offices in districts and in capital function as standalone
hubs due to absence of proper online connectivity and the information base at main office
is updated after receiving the information on diskette from various districts.
The General Provident Fund records have been computerized. The information relating to
GPF is updated and certificates are generated.
The four Pay and Accounts office that function as Treasuries as well are all computerized.
The transaction from bill receipts to sending reports to AG‟s office and generating
payment cheques are carried out with the help of computers. However, there is no online
connection among the treasuries or with the main finance department.
Progress has been made in providing photo identity card through NIC and electoral
revisions are carried out.
The information on prices of agricultural products is provided through web. This project
is implemented for two major markets at Rangpo and Melli. The daily price list of
products is available in the portal. The CICs becomes handy for this information as the
CIC operators at various places make people available the price lists by downloading from
the web site.
Some computerization work has also been done in the Home department.
Sikkim Nationalised Transport Department started using computers to feed the data
relating to tax revenue and other incomes from its operation.
The power department sends computerized electricity bills in few urban areas
The Government of Sikkim has discontinued with its earlier practice of issuing petrol
coupons and started issuing Petro-cards to employees attached with Government vehicles.
Information relating to Sarva Siksha Abhiyan has been computerized. Once again this is
an stand alone information feeding in education department, which is not available to
public
The Value Added Tax (VAT) was introduced in the State from 1st April 2005 that replaced the
sales tax. The implementation of VAT in the state requires systematic effort to computerize the

ADB TA No. 4297-IND, Final Report
Capacity Building For Fiscal Reforms in Sikkim
104
functioning of the Commercial Tax Department. The successful implementation of VAT needs
computerization of commercial tax department starting from the check posts to the regional offices
and the main office in Gangtok and comprehensive training of tax officials to manage all the
operation of revenue collection. The department should also build an interface with general public
and traders who will be able to get the information on Tax Acts and procedures and be able to
download the required forms. The Government of Sikkim has entrusted the task of
computerization of functioning of commercial tax department to NIC who have the experience of
developing the software for tax departments for other states.
The process of moving towards a comprehensive E-Governance, which can improve the efficiency
and reduce cost of administration, has many stumbling blocks. One of the major problems of
computerization in the State is lack of basic internet connectivity that is the backbone for IT
infrastructure. The computerized hubs established in districts and in various offices could not be
connected online in turn impeding the transfer of information and data. Priority should now be
given to tackle this problem. In the context of computerizing commercial tax department, the flow
of information on traffic of goods imported and exported needs to be collated and online facilities
of issuing forms bills to be provided to traders for which faster connectivity is required.
The computerization of land records is a significant achievement. The next step should be to use
this information in the operation of transactions in lands. The stamps and registration fees
collection on transactions in land can be computerized that would simplify the process and reduce
much of the work load. It will have its impact on collection of revenue as well. The
computerization of property tax collection in urban areas after the urban local bodies come into
existence will be a logical next step. The collection of water charges and other fees can be a part
of integrated computerization of urban administration system. Presently the computer generated
electricity bills are given only in major urban areas. This process further needs to be extended to
rural areas as most of the electricity consumption has been metered. The Transport department
should prepare a comprehensive computerization plan encompassing the operation of registration,
annual fee collection and updating of vehicle population data in the state. The online information
of the Transport department will enhance the vigilance efficiency and impact upon the revenue
collection.
Another problem associated with E-Governance is the manual functioning of State Bank of
Sikkim. The State Bank of Sikkim handles all the financial transactions of the State Government.
It has no interface with the State Treasuries and the manual operation of the bank slows down the
financial operation of the Government. This needs to be rectified urgently to improve the cash
management of the Government.

ADB TA No. 4297-IND, Final Report
Capacity Building For Fiscal Reforms in Sikkim
105
The physical infrastructure created in the state in terms of roads, bridges, buildings, and water
supply system and their maintenance are all the responsibility of the Government. Various
departments like Urban Development, Rural Development and Management, PWD, and PHE
handle most of the operations relating to building infrastructure in the state. The management of
various projects, procurement of materials, monitoring the progress of projects to ensure timely
completion requires an efficient Management Information System. E-Governance in the
government should also give priority to these sectors that would reduce cost over run and improve
the quality.
E-Governance is a comprehensive process that not only improves the efficiency of the
Government; it also makes the system transparent and reduces scopes for corruption. It increases
the interface with the public and quality of services provided by the Government improves. The
information base of the Government department increases as it helps generating more revenue.
The success of computerization depends to a great extent on the participation of the departments
by providing timely information and updating their data base. The basic IT infrastructure in terms
of connectivity across various regions of the state needs to be improved. The Government
websites should be maintained properly with regular updating of information for the general
public.
5.14 Implementation Issues
Recommendations made in the preceding sections are farreaching in nature and have the aim of
transforming an outmoded model into an effective functional system that serves the changing
needs of the society. Given the complexity of the recommendations, the issue arises whether the
authorities have the requisite capacity, analytical and implementational, to bring about the
transformation inherent in the proposals. Preliminary indications are that such a capacity is not, as
yet, locally available. In such a situation, one approach traditionally followed is to organize
seminars and workshops. Experience, however, shows that the benefits of such an approach, while
laudable, are not generally adequate for the tasks at hand. A second approach followed in other
cases, is to place an Expert for a short duration, so that he/she could assist the local officials at
every step of the way. Such an approach while imparting the necessary on-the-job training would
facilitate the transformation process. The Expert could guide the local officials on the measures to
be taken and assist them in developing the supporting infrastructure. It is therefore suggested that
once decisions are taken on the next steps in implementation, the services of an Expert may be
made available, for three months, to the Government of Sikkim.

ADB TA No. 4297-IND, Final Report
Capacity Building For Fiscal Reforms in Sikkim
106
6. Design of Government
It is often remarked that the totality of government is more than the sum total of its parts. The
perceptions of the community which is at the receiving end of the services provided by
government, deal with the totality of government. This totality in turn comprises the number of
public institutions, structures of organizations, facilities available to the public to reach the
government, and management styles. These aspects have not been reviewed before in Sikkim.4
6.1 Reasons for Enquiry
There are now several factors which indicate the importance of a more detailed review. First, the
relationship between the size of the community and the size of government needs to be explored.
As an integral part of this effort, the cost of services also needs to be identified and where
appropriate efforts may be required to reduce it. Second, as noted above, these aspects have never
been addressed before. Initially when provincial governments were organized, they were designed
to be microcosms of the Central government. The same pattern continued even after the
Constitution came into effect. The State list of subjects left the matter, by implication than
specification, the design of the government at the State level to the States themselves. But the
territorial size, and the population levels at this time were sizeable, and in any event, no attempt
was made to examine the issue of the design of governments at the subnational level. Even the
States Reorganization Commission whose recommendations paved the way for the formation of
States on linguistic basis did not address the issue. The Planning Commission, whose Plan
documents devoted extensive space to the delineation of the tasks of administration and the
improvements needed, did not raise this issue. It was as if it was almost a non issue. This benign
neglect contributed to the continuation of State level administrations as a mirror image of Central
governments. Meanwhile, there has been a growth of several State governments that were small in
size territorially and population wise.
Third, there has been considerable growth in the number of departments both at the Centre, and in
the States including Sikkim. Most departments were established to implement various Central and
State schemes and as the economic activity in the State came to revolve around the government, its
size also grew rapidly. For example, when the implementation of the Prime Minister‟s rural roads
programme was announced, practically a new department was established to carry it out. The
4 The manpower status and the ways of reducing it were reviewed in detail in Sikkim: Man Power Review,
2002, by S.D. Tshering, Government of Sikkim, Gangtok. Some of the recommendations made in this
report have been accepted and implemented by the Government of Sikkim.

ADB TA No. 4297-IND, Final Report
Capacity Building For Fiscal Reforms in Sikkim
107
growth was ad hoc and at no stage was attention paid to the design of government that would be
appropriate for the size of the population of the State.
Fourth, as the size of government grew, the number of employees also grew and so were the
perquisites that were provided them. The total number of employees now stands at 39,773 (Table
32); the number of IAS officers in the State is 43, with a complement of 259 officers drawn from
Sikkim Civil Service, all to serve a population of a little more than a half million. The per
employee salary expenditure is high. In fact, the highest level of per employee expenditure,
among the North-Eastern States, according to the Tf.F.C. is found in Sikkim (at Rs. 121,684: Table
33 shows the comparison).
Fifth, it is also to be noted that the policy formulation expenditure for the State which was around
5.25 per cent of the total expenditure in 2004-05, has gone up, according to the Budget Estimates
for 2005-06, to a little more than 7 per cent. In reality, however, most policies implemented at the
State level are formulated at the Centre and very little adaptation takes place at the State level. In
this context, the question arises whether such a high share of expenditure should be incurred in
Sikkim for policy formulation. Table 34 provides data on policy formulation outlays.
Finally, the ad hoc growth in the size of government has also contributed to excessive
fragmentation and to additional layers in the hierarchical system.
To sum up, if sustainable public finances are to be achieved, it would be necessary to revamp the
administrative machinery so that it is in accord with the size of the population to be served by it.
6.2 Way Forward
In reorganizing the administrative structure, it is important to keep in view the following
considerations: (a) it is to be noted that with the full implementation of the 73rd
amendment of the
Constitution, al beit, in a phased way, more and more tasks will be devolved to the district level of
administration. When such devolution takes place, there would be a corresponding reduction in
the work to be transacted at the State Headquarters. In turn, this paves the way for restructuring of
the State administration. (b) The excessive fragmentation and layering should be avoided and
levels of processing of subjects should be reduced to the minimum. A measure of consolidation is
urgently needed. (c) The establishment of Gangtak as a Municipality would lead to the transfer of
work to a lower level; and (d) gradual introduction of e-governance in several fields and the
administrative processes need to be abridged.

ADB TA No. 4297-IND, Final Report
Capacity Building For Fiscal Reforms in Sikkim
108
Accordingly, a consolidation of departments has been formulated and illustrated in Figures 16, 17
and 18. Figure 16 shows the new structure of departments. This structure envisages a
consolidation of 42 departments into 15 without any loss of efficiency. Figure 17 shows the
departmental consolidation envisaged. Figure 18 Shows the proposed departmental structure
which is basically reduced to four levels – Section Staff, Section Head, Division Head and
Departmental Secretary. Each division would be headed by a senior official who would be
responsible for oversight and final decisions. The Secretary, while assisting the Minister would be
responsible for the overall performance of the department. Many policies would be formulated as
a part of the medium term rolling plan and most of the daily work would deal with the deviations
from accepted policies or removal of obstacles. He would also be responsible for the financial
management of the department.
6.3 Adjustment Process and Costs:
Admittedly, the proposal is far reaching in its implications and represents a point of major
departure from the traditions of administration in Sikkim. But departures are necessary if
administrative burden is not to endanger fiscal sustainability. The issue arises whether there are
other approaches, other than those indicated above, to address the situation in Sikkim. In this
context, it has to be recognized, that during the past decade, more so during the preceding five
years, the number of people working in Government was ratcheted up at frequent intervals through
the absorption of many temporary employees and converting them into regular categories. The
growth in personnel was later sought to be tampered through the introduction of voluntary
retirement schemes, introduction of programmes for the redeployment of personnel, and through
bans on the creation of new posts. None of these approaches yielded any enduring results
primarily for the reason that the Government was also pursuing, at regular intervals, a policy of
converting temporary positions into permanent ones. In the process, the Government has
admittedly become an employer of both the first and last resorts. The cumulative impact is the
creation of an overblown administrative state that is way beyond the needs associated with the
local population. A continuation of the existing policies can only lead greater administrative costs
that would be untenable from any point of view. A clear departure from the previous practices is
clearly indicated. The new approach should be different from the approaches followed during
preceding years. If social costs are to be minimized, the implementation process should take the
following path.
(i) The introduction of the plan should be undertaken in a phased manner. To start with,
the consolidation approach may be applied to a few departments and extended to other
departments at a later stage.
(ii) Simultaneously, an effort should be made to computerize many operations.

ADB TA No. 4297-IND, Final Report
Capacity Building For Fiscal Reforms in Sikkim
109
(iii) Since the result will be a reduction in the number of employees, immediate action
should be taken to stop recruitment at all levels including for All India Services. In
addition, all vacancies stemming from the normal attrition process (e.g., retirement,
death, etc.) should remain unfilled for the rest of the fiscal year, and abolished
thereafter.
(iv) Displaced persons should be given an additional weightage of say 5 years for the
determination of pension payable so as to make the severance package attractive.
(v) The surplus personnel should be provided cheap credit so that they could envisage
alternative employment opportunities. Various vocational training programmes
should also be organized.
(vi) In all these phases, care should be taken to ensure that there is no discrimination, and
that there is an adequate dialogue between government and staff representation. While
there would be short term higher costs, it has to be recognized that it is for the larger
good of the community.
(vii) The retirement benefits should be funded from a Special Fund that would entirely be
financed by new borrowing (issue of long term bonds).
6.4 Administrative Reorganization and Personnel Adjustment
The preceding discussion illustrates conclusively that in its present from the design of the
government machinery and its associated personnel management is untenable and there is an
imperative to launch measures aimed at rectifying the situation. Toward this end a two track
approach has been delineated in the above paragraphs: (a) administrative reorganization with focus
on compression and consolidation of agencies; and (b) formulation of a package of measures,
including incentives, to facilitate a gradual reduction in the Personnel levels. There is a need to
send the message to the future entrants into government service to be prepared for major
reductions and to have diminished expectations.
The implementation of the measures requires, as an essential condition precedent, the recognition
of the following: (i) the proposed reorganization is limited to the secretariat and does not extend to
the field agencies; (ii) the reorganization has to be introduced on a pilot basis; (iii) while the
reorganization is specific to the departments concerned, Personnel adjustment cannot, however, be
viewed in a segmented view as employees are members of either All India Services or State
Services, which brings in additional complexity. Abolition of posts in a department does not
render the holder of that post superfluous, as he/she is a member of a Service where the exit
procedures follow the seniority rules (iv) the essential message in regard to personnel adjustment,
is the adoption of attrition as a policy measure.

ADB TA No. 4297-IND, Final Report
Capacity Building For Fiscal Reforms in Sikkim
110
Retirement should follow the steps indicated here: (a) recruitment to all Services should be held in
abeyance for five years; (b) those holding temporary posts and are, therefore, not yet entitled to
pension benefits, should as a preliminary step be considered for retrenchment; those who are
within five years of retirement should be given that additional weightage of years foregone (5).
These measures contribute to a reduction both at the top and in terms of new entrants. These
measures would avoid the employees taking recourse to the judiciary on charges of discrimination;
(c) conversion of temporary posts into permanent ones should be held in abeyance until the
situation is reviewed some time in the future; and (d) the package should include the incentives
enumerated.
The design seeks congruence between post – person – power and tasks – and, accountability.
Table 32 Statement Showing Total Regular, Work Charged and M.R. Employees Sl. No.
Departments
Total No. of regular employees
Work charged employees
M.R. Employees Agan-wadi Workers
Total
Plan Non Plan Plan Non plan Plan Non plan
1. Animal Husbandry, Livestock, Fisheries and Veterinary Services
152 451 -- 1 431 26 -- 1061
2. Buildings 46 154 34 63 128 179 -- 604
3. Co-operation 19 143 -- -- -- 4 -- 166
4. Cultural Affairs and Heritages
58 49 -- -- 18 -- -- 125
5. Commerce and Industries
152 209 -- -- 26 438 -- 825
6. Planning, Economic Reforms and NEC
27 83 -- -- 10 2 -- 122
7. Ecclesiastical -- 76 -- -- -- 20 -- 96
8. Election -- 32 -- -- -- -- -- 32
9. Excise -- 121 -- -- -- 3 -- 124
10. Energy and Power 629 610 128 855 108 1597 -- 3927
11. Food Security, Agri. Department
36 414 -- -- 444 -- -- 894
12. Finance Department -- 466 -- -- -- 67 -- 533
13. Food, Civil Supplies and Consumers Affairs
18 172 -- -- -- 36 -- 226
14. Forest & Environment 202 754 13 3 771 98 -- 1841
15. Governor -- 74 -- -- -- 4 -- 78
16. Human Resource Dev. 2836 6359 -- 11 41 46 -- 9293
17. Health 844 1382 11 10 83 185 -- 2515
18. Home -- 401 -- -- -- 82 -- 483
19. Horticulture Dev. 34 278 -- -- 379 -- -- 691
20. Information and PR -- 97 -- -- -- 22 -- 119
21. Information Tech. -- -- -- -- 52 -- -- 52
22. Irrigation and Flood Control
85 33 6 90 146 -- -- 360
23. Judiciary -- 282 -- -- -- -- -- 282
24. Labour 4 24 -- -- 15 -- -- 43
25. Land Revenue Mag. 1 424 -- -- -- 47 -- 472

ADB TA No. 4297-IND, Final Report
Capacity Building For Fiscal Reforms in Sikkim
111
Sl. No.
Departments
Total No. of regular employees
Work charged employees
M.R. Employees Agan-wadi Workers
Total 26. Law -- 72 -- -- -- 8 -- 80
27. Legislature -- 162 -- -- -- 12 -- 174
28. Mines, Minerals 15 38 -- -- 17 -- -- 70
29. Motor vehicles -- 62 -- -- -- -- -- 62
30. Parliamentary Affairs -- 10 -- -- - 2 -- 12
31. Personnel -- 79 -- -- -- 3 -- 82
32. Police -- 3969 -- -- -- 458 -- 4427
33. Printing 37 112 -- -- -- 7 -- 156
34. Public Service Commission
-- 24 -- - -- -- -- 24
35. Roads and Bridges 84 310 -- 203 -- 3134 -- 3731
36. Rural Management and Development
337 105 197 -- 535 -- -- 1174
37. Science and Tech. 21 -- -- -- -- -- -- 21
38. Social Justice, and Welfare
150 75 -- -- 34 5 1991 2255
39. Sports and Youth Affair 30 46 -- -- 19 -- -- 95
40. Transport Department -- 830 -- 54 -- 105 -- 989
41. Tourism 32 70 -- -- 56 -- -- 158
42. Urban Development 60 186 29 -- 26 296 -- 597
43. Vigilance -- 81 -- -- -- 4 -- 85
44. Water Security & PHE 45 76 -- 141 37 318 -- 617
Total 5954 19395 418 1431 3376 7208 1991 39773
Table 33 Sikkim: State Government Employees and Salary Expenditure
States Per employee salary Number of employees
1994-95 1995-96 1997-00 2002-03 1994-95 2002-03
Arunachal Pradesh 48040 51369 79101 98221 33222 41165
Assam 36895 41616 60709 83720 413464 435534
Meghalaya 53434 62001 73934 113808 36194 49813
Sikkim 42665 49012 100815 121684 19522 23973
Tripura 34891 50654 59654 99631 90300 98379
Weighted average
for 21 States
41968 47398 75364 94603 7947292 7824012
Source: Report of the Twelfth Finance Commission, Government of India, February 2005.
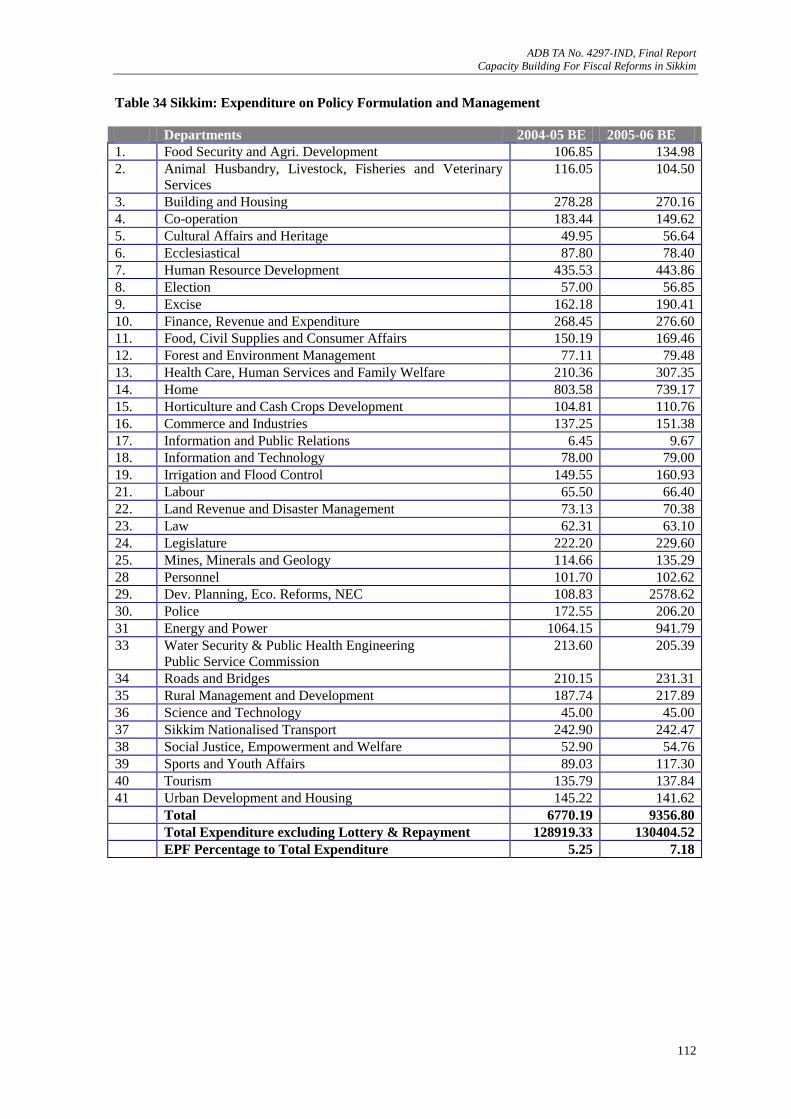
ADB TA No. 4297-IND, Final Report
Capacity Building For Fiscal Reforms in Sikkim
112
Table 34 Sikkim: Expenditure on Policy Formulation and Management
Departments 2004-05 BE 2005-06 BE
1. Food Security and Agri. Development 106.85 134.98
2. Animal Husbandry, Livestock, Fisheries and Veterinary
Services
116.05 104.50
3. Building and Housing 278.28 270.16
4. Co-operation 183.44 149.62
5. Cultural Affairs and Heritage 49.95 56.64
6. Ecclesiastical 87.80 78.40
7. Human Resource Development 435.53 443.86
8. Election 57.00 56.85
9. Excise 162.18 190.41
10. Finance, Revenue and Expenditure 268.45 276.60
11. Food, Civil Supplies and Consumer Affairs 150.19 169.46
12. Forest and Environment Management 77.11 79.48
13. Health Care, Human Services and Family Welfare 210.36 307.35
14. Home 803.58 739.17
15. Horticulture and Cash Crops Development 104.81 110.76
16. Commerce and Industries 137.25 151.38
17. Information and Public Relations 6.45 9.67
18. Information and Technology 78.00 79.00
19. Irrigation and Flood Control 149.55 160.93
21. Labour 65.50 66.40
22. Land Revenue and Disaster Management 73.13 70.38
23. Law 62.31 63.10
24. Legislature 222.20 229.60
25. Mines, Minerals and Geology 114.66 135.29
28 Personnel 101.70 102.62
29. Dev. Planning, Eco. Reforms, NEC 108.83 2578.62
30. Police 172.55 206.20
31 Energy and Power 1064.15 941.79
33 Water Security & Public Health Engineering
Public Service Commission
213.60 205.39
34 Roads and Bridges 210.15 231.31
35 Rural Management and Development 187.74 217.89
36 Science and Technology 45.00 45.00
37 Sikkim Nationalised Transport 242.90 242.47
38 Social Justice, Empowerment and Welfare 52.90 54.76
39 Sports and Youth Affairs 89.03 117.30
40 Tourism 135.79 137.84
41 Urban Development and Housing 145.22 141.62
Total 6770.19 9356.80
Total Expenditure excluding Lottery & Repayment 128919.33 130404.52
EPF Percentage to Total Expenditure 5.25 7.18

ADB TA No. 4297-IND, Final Report
Capacity Building For Fiscal Reforms in Sikkim
113
Figure 16 Sikkim: Proposed Departmental Structure
Governor
Chief Minister and Cabinet
Departments
Home and Food, Energy Finance, Law Human Health Construc- Rural and Trans- Mines Commerce Judiciary Labour Legisla-
related Agricul- Planning Resource Services tion ser- Urban port and Mine- and ture
services ture and and Develop- vices Develop- services rals Industries
services Development ment (Roads, ment
bridges,
Public
Works, etc.

ADB TA No. 4297-IND, Final Report
Capacity Building For Fiscal Reforms in Sikkim
114
Figure 17 Sikkim: Departments and Divisions
Home and other
administrative services
Food, Agriculture related
services
Energy Finance, Planning and
related services
Law Human Resource
Development
Department of
Personnel, Training,
etc.
Home
Land Revenue and
Disaster Management
Parliamentary Affairs
Printing and
Stationery
Police
Vigilance
Information and
Public Relations
Animal Husbandry,
Livestock, Fisheries,
Veterinary services
Cooperation
Food Security and
Agriculture
Forest, Environment
and Wild Life
Food, Civil Supplies
and Consumer Affairs
Horticulture and Cash
Crops
Energy and Power Development,
planning etc.
Excise
Revenue and
Expenditure
Law
Election
Cultural Affairs and
Heritage
Ecclesiastical
Human Resource and
Development
Sports and Youth
Affairs
Science and
Technology
Information and
Technology
Health Roads, Bridges and
Public Works and related
services
Rural and Urban
Development
Transport and related
services
Mines, Metals, etc. Commerce and
Industries
Health Care and
Family Welfare
Roads and Bridges Buildings and
Housing
Rural Management
Social justice,
Empowerment and
Welfare
Urban Development
and Housing
Water security and
Public Health
Engineering
Transport
Tourism
Motor vehicles
Sikkim Nationalized
Transport
Mines, Minerals and
Geology
Commerce and
Industries

ADB TA No. 4297-IND, Final Report
Capacity Building For Fiscal Reforms in Sikkim
115
Figure 18 Sikkim: Departmental Structure - An Illustration
Secretary
Division
Division
Division
Division
Division
Section
Section

ADB TA No. 4297-IND, Final Report
Capacity Building For Fiscal Reforms in Sikkim
116
7. Department of Finance: A Revised
Structure
Conceptually, the Department of Finance is at the heart of the Government in that all matters that
have financial implications and all issues involving resource mobilization and resource allocation
are expected to be considered by it and public policies formulated. It is responsible for the
specification of the medium and short term objectives of fiscal policy and for their translation into
day to day administrative actions. Financial planning in general and more specifically, in the case
of Sikkim, the management of Central transfers are also a part of the tasks of the Department of
Finance.
Undertaking varied tasks and their management requires the Department to be organized on a
functional basis. In organizing the Department, care has to be taken to ensure that it becomes an
exemple to the rest of the Government. Its use of manpower should be minimum and the
Department should demonstrate, to the rest of the Government, the uses of technology and related
benefits. Evaluating from these criteria, the organization of the Department leaves a good deal to
be desired. From time to time, some minor adjustments have been made in the Department but
without any major impact on the form, content of the Department and, therefore, on the issues
experienced. The problems with the present set up are five fold. First, Planning and Finance are
separated with the result that an avoidable dualism in approaches has emerged in the preparation of
the budget and in its implementation; second, the relations with the spending agencies have not
been streamlined with the consequence that some of their budgets are finalized without the active
involvement of the officers dealing with those agencies. The posts in question may be held by
officers drawn from the All India Services, Sikkim Civil Service and Sikkim Finance and
Accounts Service. Their attached functions seem to vary depending on the service of the
occupant. Moreover, many proposals would appear to be finalized without their participation.
Third, the Department, like many others is endowed with many officers and staff that are
admittedly under employed. In a way, this has prevented the Department from having the requisite
moral stature needed in advising the other departments to reduce their own staff. Fourth,
regardless of the subject matter, the units of the Department are organized on a hierarchical basis
and no alternative forms of organization are explored. Fifth, the use of computers is far from
extensive.
With a view to addressing the above, it is suggested that the Planning and Finance Departments be
merged. The new form of functional organization is illustrated in Figure 19. In addition to the
integration of Planning and Finance, it is also important that internal audit is placed on an
independent footing, with direct submission of findings to the Secretary (or Principal Secretary

ADB TA No. 4297-IND, Final Report
Capacity Building For Fiscal Reforms in Sikkim
117
depending on the holder of the post). The relations with the other departments would, for the most
part, conducted through the Policy Planning and Budget Management. In regard to the relations
with other administrative agencies, it must be indicated that proposals, even at an embryonic stage
are taken up with the Department of Finance.
Figure 19 Proposed Reorganization of the Department of Finance and Planning
Sec
reta
ry
Divisions Attached Offices
Policy Planning1
Resource mobilization District Planning
Resource allocation and medium term framework Economics and Statistics
Development Plans National Sample Survey
Implementation monitoring
Evaluation
Budget Management
Preparation of Annual Budget
Preparation of rolling Expenditure plans
Expenditure control of departments and PSUs
Guidance on contracts, etc.
Tax Policy and Revenue Management
Tax planning Income tax and VAT Directorate
Other sources: Policy expenses Land Revenue
Lottery Registration
Excises
Accounts, Cash and Debt Management2
Supervision of Pay and Accounts offices Pay & Accounts offices
Cash and Debt management
Preparation of financial reports
Internal Audit
Audit of Departments and Agencies
1. Border Area programmes need to be shifted to the concerned functional departments
2. It is proposed that a separate office be organized for Payrolls, Pensions and Public Debt
In regard to payments, it is suggested elsewhere that a separate office for Payrolls, Pensions and
Public Debt be organized to function on a computerized basis. Also, the staff of the Policy
Planning be organized as teams rather than on traditional hierarchical lines. Finally, the budgetary
process and an internal information system may be organized on a computerized system. This
effort may involve some additional outlays but are well worth the goal.

ADB TA No. 4297-IND, Final Report
Capacity Building For Fiscal Reforms in Sikkim
118
8. Restructuring of Public Enterprises in
Sikkim
8.1 Introduction
The State Level Public Enterprises (SLPEs) are an important component of the economy of the
State of Sikkim not only from the viewpoint of investments, incomes and employment they
generate, but also because they draw the fiscal resources of the state government. Any fiscal
restructuring plan for the state will have to consider the functioning of the state enterprise sector
carefully. For the same reason, any programme of capacity building for fiscal reforms in Sikkim
will have to consider the issue of public enterprise restructuring. Capacity building is necessary
both for running the potentially profit making enterprises efficiently and for retraining of the
displaced employees. In order to strengthen the finances of the statre government, the issue of
resource allocation and providing productive employment is clearly relevant and it is necessary to
implement these reforms with a human face. The social and economic consequences of the re-
engineering have to be kept in the backdrop while designing the strategies for this purpose and
implementation of such strategies.
The investments in the SLPEs in the State of Sikkim have been increasing over the years. The
performance, however, has not kept pace with the expectations. This divergence has adversely
affected the state finances. The prevailing system with heavy dependence oin the government and
public sector enterprises for promoting economic activity in the state is essentially unviable.
Besides unproductive employment it generates and a sense of perennial dependency it leads to, this
strategy essentially creates a hostile environment for the growth of the private sector5 activity. The
time is ripe for the policy makers to have a fresh look about the portfolio for retention of the
SLPEs.
This chapter deals with restructuring, divestment and privatisation of the SLPEs in the State of
Sikkim through the preparation of the feasibility studies for each enterprise by giving due regard to
the socio-economic consequences of such actions. Although, 11 SLPEs were identified for the
detailed review, the Government of Sikkim (GoS) added another 11 SLPEs to the list. The GoS
further included the Sikkim Nationalized Transport and the Sikkim State Energy and Power
Department to the list as these activites are meant to promote major commercial activities. In
terms of size they predominate and account for a significant proportion of investment, turnover,
financial losses incurred and manpower. The Government later decided to exclude the power
sector from the scope of the study. However, data on the broder dimensions of the power sector as
related to the Sikkim Energy and Power Department and the Sikkim Power Development

ADB TA No. 4297-IND, Final Report
Capacity Building For Fiscal Reforms in Sikkim
119
Corporation have been included to provide a macro view of the SLPEs. Sikkim Handloom and
Handicrafts Development Corporation, Sikkim Hatchery Ltd and Sikkim Poultry Development
Corporation Ltd participated in the final lap of the study. The information was collected through
the questionnaires on Financial and other related aspects concerning SLPEs (see Annexure 8.8),
Schedule on Internal Organisaiton and Structure of SLPEs (see Annexure 8.9), and continuous
interaction with the policy makers in the GoS and the top management of the SLPEs.
8.2 SLPEs in Sikkim: Classification and Structure
Sikkim state has used different organizational forms such as a departmental undertaking, public
corporation and co-operative enterprise to set up enterprises depending on the objectives. Most of
the enterprises have been set up after the integration of Sikkim in the Union of India. The
enterprises that existed in the state before integration were Sikkim Nationalized Transport, State
Energy and Power Department, State Bank of Sikkim, State Trading Corporation, Sikkim Fruit
Preservation Factory, Tea Board of Sikkim Ltd and the Denjong Agricultural Co-Operative
Society Ltd. The enterprises established after the integration of Sikkim with the country are
Sikkim Jewels, Sikkim Times Company (SITCO), Sikkim Industrial and Investment Development
Corporation Ltd (SIDICO), Sikkim Consumer Co-operative Society, Sikkim State Co-operative
Supply and Marketing Federation Ltd (SIMFED) and Sikkim Co-operative Milk Producers Union
Ltd (Sikkim Milk Union). The 1990s have seen a spurt of activity with regard to the setting up of
the SLPEs. In this decade the enterprises set up included Sikkim Tourism Development
Corporation Ltd, Sikkim Handloom and Handicrafts Development Corporation, Sikkim Poultry
Development Corporation Ltd., Sikkim Hatchery Ltd, Sikkim Precision Industries Ltd, Sikkim
Scheduled Castes, Tribes and Other Backward Classes Development Corporation Ltd (SABCCO),
Sikkim Power Development Corporation Ltd. and Sikkim State Consumer Co-operative Bank.
There are 11 SLPEs under the Government Company form. Notably, the State of Sikkim
continues to have its own Companies Act which was earlier promulgated by the Chogyal in 1961
titled as the Registration of Companies Act. Other forms of SLPEs include Public
Corporation/Boards – 4, Co-operative Society – 5, and Departmental Enterprise – 2 (Annexure
8.1). A peep into the objectives of the SLPEs points out that the major purposes of their creation
related to undertaking in the state sector manufacturing, trade and services, financial, promotional,
welfare and utility sector activities. The manufacturing enterprises dominated the overall number,
followed by trade and service, utility, welfare and promotional enterprises.
The SLPEs operated in markets varying from competitive to monopoly conditions. Some
enterprises enjoyed captive market conditions initially but due to the liberalization policies adopted
by the Government of India they are compelled to operate in competitive markets currently. Even
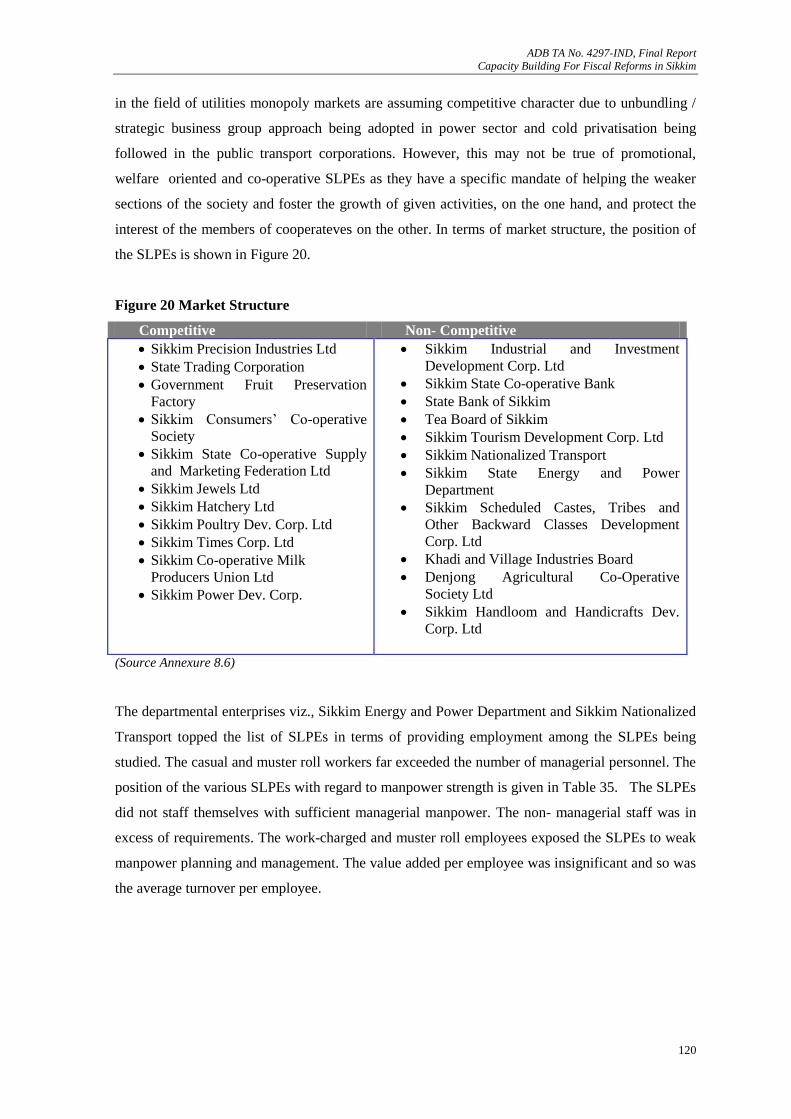
ADB TA No. 4297-IND, Final Report
Capacity Building For Fiscal Reforms in Sikkim
120
in the field of utilities monopoly markets are assuming competitive character due to unbundling /
strategic business group approach being adopted in power sector and cold privatisation being
followed in the public transport corporations. However, this may not be true of promotional,
welfare oriented and co-operative SLPEs as they have a specific mandate of helping the weaker
sections of the society and foster the growth of given activities, on the one hand, and protect the
interest of the members of cooperateves on the other. In terms of market structure, the position of
the SLPEs is shown in Figure 20.
Figure 20 Market Structure
Competitive Non- Competitive
Sikkim Precision Industries Ltd
State Trading Corporation
Government Fruit Preservation
Factory
Sikkim Consumers‟ Co-operative
Society
Sikkim State Co-operative Supply
and Marketing Federation Ltd
Sikkim Jewels Ltd
Sikkim Hatchery Ltd
Sikkim Poultry Dev. Corp. Ltd
Sikkim Times Corp. Ltd
Sikkim Co-operative Milk
Producers Union Ltd
Sikkim Power Dev. Corp.
Sikkim Industrial and Investment
Development Corp. Ltd
Sikkim State Co-operative Bank
State Bank of Sikkim
Tea Board of Sikkim
Sikkim Tourism Development Corp. Ltd
Sikkim Nationalized Transport
Sikkim State Energy and Power
Department
Sikkim Scheduled Castes, Tribes and
Other Backward Classes Development
Corp. Ltd
Khadi and Village Industries Board
Denjong Agricultural Co-Operative
Society Ltd
Sikkim Handloom and Handicrafts Dev.
Corp. Ltd
(Source Annexure 8.6)
The departmental enterprises viz., Sikkim Energy and Power Department and Sikkim Nationalized
Transport topped the list of SLPEs in terms of providing employment among the SLPEs being
studied. The casual and muster roll workers far exceeded the number of managerial personnel. The
position of the various SLPEs with regard to manpower strength is given in Table 35. The SLPEs
did not staff themselves with sufficient managerial manpower. The non- managerial staff was in
excess of requirements. The work-charged and muster roll employees exposed the SLPEs to weak
manpower planning and management. The value added per employee was insignificant and so was
the average turnover per employee.

ADB TA No. 4297-IND, Final Report
Capacity Building For Fiscal Reforms in Sikkim
121
Table 35 Manpower
Name of the enterprise Managerial Non
Managerial
Casual Others Total
Sikkim Industrial and Investment
Development Corporation Ltd
19 16 - - 34
State Bank of Sikkim 50 221 - - 271
Sikkim State Co-operative Bank 12 4 - - 16
Sikkim Jewels 20 105 - - 125
Sikkim Hatchery 1 2 13 - 15
Sikkim Poultry 1 0 5 - 6
Sikkim Precision Industries 4 50 6 - 60
Sikkim Time Company 22 87 37 - 146
Tea Board of Sikkim 5 444 - - 449
Govt. Fruit Preservation Factory 4 56 3 - 63
Sikkim Co-operative Milk Producers
Union Ltd
7 60 16 83
Sikkim Tourism 4 85 - - 89
Sikkim Handloom and Handicrafts
Development Corp. Ltd
01 12 - 13
Khadi and Village Industries Board 14 69 - - 83*
State Trading Corp. 11 70 27 - 108
Sikkim Consumer Co-operative Society 2 22 3 - 27
Sikkim State Co-operative Supply and
Marketing Federation Ltd
9 23 - 8 40
Denjong Agricultural Co-Operative
Society Ltd
2 60 40 - 112
Sikkim Nationalized Transport Corp. 57 767 91 42 824
State Energy and Department of Power 205 3228 - - 3443
Sikkim Power Dev. Corp. 7 14 - - 21
SABCCO 4 12 - - 16
Total 461 5407 241 50 6036
(Source: Annexure 8.9)
* This excludes 100 part-time workers
8.3 Investments and Financial Performance of SLPEs in Sikkim
Table 36 depicts the investments in the SLPEs in Sikkim. The analysis of investments in the
SLPEs points to the following:
The total investments in the SLPEs increased form Rs 663.24 crore in 2001-02 to Rs
726.06 crore in 2003-04
About 85 per cent of the total investments was made in the utility sector enterprises
The manufacturing enterprises followed by the financial enterprises come next in the
pecking order.
In terms of investments in the various forms of the SLPE, the departmental enterprises
shared about 81 per cent and the government companies had 11 per cent of the total
investment. The other forms of the SLPEs had only nine per cent of the total investment.

ADB TA No. 4297-IND, Final Report
Capacity Building For Fiscal Reforms in Sikkim
122
The promotional, welfare, and trade and service enterprises carry small investments.
The enterprises in all the sectors have conveniently ignored the principle of leverage
leading to an inadequate debt-equity mix.
Table 36 Investment in SLPEs
(Rs. in crore)
Name of the enterprise Classification 2001-02 2002-03 2003-04
SIDICO Financial 19.46 19.48 19.66
State Bank of Sikkim Financial 4.56 4.98 5.40
Sikkim State Co-operative Bank Financial 8.50 8.91 9.36
Total 32.52 33.37 34.42
Sikkim Jewels Manufacturing 7.10 7.82 7.04
Sikkim Hatchery Manufacturing 0.46 0.46 0.46
Sikkim Poultry Manufacturing 0.79 0.79 0.79
Sikkim Precision Industries Manufacturing 0.00 3.70 3.70
SITCO Manufacturing 11.96 12.03 11.74
Tea Board of Sikkim Manufacturing 19.52 20.44 22.71
Sikkim Milk Union Manufacturing 0.10 0.14 0.14
Govt. Fruit Preservation Factory Manufacturing 0.76 1.07 0.00
Total 40.69 45.20 41.63
Sikkim Tourism Promotional 4.79 4.79 6.06
Sikkim Handloom and Handicrafts Dev. Corp Promotional 0.00 0.00 0.80
Khadi and Village Industries Board Promotional 10.09 11.24 12.01
Total 14.88 16.03 18.87
State Trading Corp. Trade and Service 1.11 1.11 1.11
Sikkim Consumer Co-operative Society Trade and Service 0.17 0.17 0.17
SIMFED Trade and Service 1.05 1.01 1.02
Denjong Agricultural Co-Operative Society Ltd Trade and Service 0.20 0.20 0.20
Total 2.53 2.49 2.50
Sikkim Nationalized Transport Corp. Utility 33.08 34.49 34.39
State Energy and Department of Power Utility 470.92 470.92 514.79
Sikkim Power Dev. Corp. Utility 53.01 53.01 53.01
Total 557.01 558.42 602.19
SABCCO Welfare 15.61 20.10 21.50
Total 15.61 20.10 21.50
Grand Total 663.24 676.86 726.06
(Source: Annexure 8.1, 8.2 and 8.3)
Table 37 shows that a large number of enterprises did not have any debt and therefore ended up
with nil debt - equity ratio. The presence of low or no debt in some of the SLPEs, especially in the
utility and the co-operative sector enterprises, points to the total dependence of these enterprises on
the GoS and also lack of sensitization about the corporate financial management and linkages with
the financial and capital markets.

ADB TA No. 4297-IND, Final Report
Capacity Building For Fiscal Reforms in Sikkim
123
Table 37 Debt- Equity Ratio
Name of the enterprise 2001-02 2002-03 2003-04
SIDICO 0.21 0.18 0.15
State Bank of Sikkim 6.86 7.59 8.31
Sikkim State Co-operative Bank 0.00 0.00 0.00
Sikkim Jewels Ltd 0.29 0.31 0.08
Sikkim Hatchery Ltd 0.00 0.00 0.00
Sikkim Poultry Dev. Corp. Ltd 0.00 0.00 0.00
Sikkim Precision Industries 0.00 0.00 0.00
SITCO 0.09 0.07 0.05
Tea Board of Sikkim 0.00 0.00 0.00
Sikkim Milk Union 4.00 1.33 1.33
Govt. Fruit Preservation Factory 0.00 0.00 0.00
Sikkim Tourism Dev. Corp. Ltd 0.00 0.00 0.00
Sikkim Handloom and Handicrafts Dev. Corp.
Ltd
0.00 0.00 0.00
Khadi and Village Industries Board 0.00 0.00 0.00
State Trading Corp. Ltd 0.00 0.00 0.00
Sikkim Consumer Co-operative Society 0.00 0.00 0.00
SIMFED 0.19 0.20 0.00
Denjong Agricultural Co-Operative Society Ltd 0.00 0.00 0.00
Sikkim Nationalized Transport Corp. 0.00 0.00 0.00
State Energy and Department of Power 0.00 0.00 0.00
Sikkim Power Dev. Corp. 16.67 16.67 16.67
SABCCO 1.41 1.24 1.25
(Source Computed on the basis of information contained in Annexures 8.1, 8.2, 8.3)
Profit Earning and Profitability
The SLPEs have to discharge both the „public‟ and „enterprise‟ roles. The „enterprise‟ element
should overtake the „public‟ element with the accumulation of experience. The financial
performance of the SLPEs as shown in Annexures 8.1 through 8.3 is summarized as under:
The total accumulated losses wiped out 16.50 per cent of the total investments in the
SLPEs in 2003-04. The provisioning for NPAs (Non-Performing Assets) by State Bank of
Sikkim and the accumulated losses incurred by SIDICO were mainly responsible for this
phenomenon.
In 2003-04 the net profit earned by the profit making enterprises was Rs 2.10 crore against
the investment of Rs 124.01crore giving a yield of 1.69er cent. The losses incurred by the
loss making enterprises were Rs 34.84 crore on an investment of Rs 602.05 crore giving a
negative yield of 5.78 per cent. On the whole the SLPEs earned a net loss of Rs 32.74
crore on an investment of 726.06 crore resulting in a negative yield of 4.51 per cent.
The net worth of the enterprises was about 11 per cent of the money invested in 2003-04.
The capital employed also suffered substantial erosion and amounted to a paltry 11.78 per
cent of the total investment in 2003-04.

ADB TA No. 4297-IND, Final Report
Capacity Building For Fiscal Reforms in Sikkim
124
The profit earning record of the SLPEs show that the manufacturing, promotional, utility and
welfare sector enterprises, on the whole are in the red and the performance of financial enterprises
is mixed. The State Bank of Sikkim is deep in the red and in the case of the other financial
enterprise the stated profits can not be taken at the face value as they carry huge contingent
liabilities, sub-standard assets and doubtful debts. The trade and service enterprises excepting the
Denjong Agricultural Co-operative Society managed to keep their head above water all due to
protected market conditions. The poor financial health of the SLPEs is indicated by the fact that
aggregate net worth of for all enterprises taken together amounted to a mere Rs 63.48 crore in
2003-04 as against the total investment of Rs 726.06 crore.. The financial laxity was rampant as
seen by the relationship between the investment and capital employed. The total capital employed
was Rs. 85.62 crore in 2003-04 as against the total investment of Rs. 726.06 crore. This is a clear
case of heavy capital erosion.
Table 38 reveals net profit / loss to total investment ratio for the SLPEs. It is clear that the SLPEs
taken as a whole are in the red during all the three years of the study. However, the percentage of
net losses to total investments declined during the period under reference due to reduction in losses
incurred by State Bank of Sikkim and State Energy and Department of Power. The benchmark
profitability as suggested by the XII Finance Commission varies from two to five per cent on total
investment for different categories of the SLPEs indicating the fact that the net profit to total
investment ratio need immediate attention and policy palliatives.
Resource Use
The data given in Annexures 8.1, 8.2 and 8.3 shows the resource use scenario in the SLPEs of the
State of Sikkim. It is clear that the resource use is very low registering a declining trend in 2003-
04. It was 14.51 per cent, 14.54 per cent and 14.51 per cent in 2001-02, 2002-03 and 2003-04,
respectively. This is lower than the national average. The SLPEs pose a tremendous challenge for
unlocking the hidden value. The manufacturing enterprises are a case in point. Sikkim Jewels Ltd.,
SITCO and Sikkim Precision Industries Ltd have been hardly using the capacity created and
tapping the market for selling their goods. The power sector and transport sector enterprises are
also characterized by low resource use.
Table 38 Net Profit/Loss to Total Investments
Name of the enterprise 2001-02 2002-03 2003-04
SIDICO 0.77 12.89 2.34
State Bank of Sikkim -40.57 -433.13 -17.59
Sikkim State Co-operative Bank 12.82 2.58 7.37
Sikkim Jewels -0.85 0.64 -5.40
Sikkim Hatchery 0.00 0.00 0.00
Sikkim Poultry -2.53 -13.92 -10.13
Sikkim Precision Industries 0.00 3.24 1.08

ADB TA No. 4297-IND, Final Report
Capacity Building For Fiscal Reforms in Sikkim
125
SITCO -4.26 -22.28 -28.02
Tea Board of Sikkim 0.41 -1.08 0.13
Sikkim Milk Union -750.00 -507.14 -735.71
Govt. Fruit Preservation Factory 0.00 0.00 0.00
Sikkim Tourism 13.99 -20.04 -10.56
Sikkim Handloom and Handicrafts
Dev. Corp
0.00 0.00 0.00
Khadi and Village Board -2.08 -1.69 0.00
State Trading Corp. 67.57 0.00 59.46
Sikkim Consumer Co-operative
Society
5.29 58.82 4.71
SIMFED 30.48 14.85 18.63
Denjong -210.00 -170.00 -230.00
Sikkim Nationalized Transport Corp. -11.31 -14.15 -12.21
State Energy and Department of Power -13.98 -7.93 -4.41
Sikkim Power Dev. Corp. 0.00 0.00 0.00
SABCCO 2.24 1.99 0.60
Total -10.55 -9.54 -4.34
(Source: Computed from Annexures 8.1, 8.2 and 8.3)
8.4 Characteristics of SLPEs in the State of Sikkim
The characteristics of SLPEs relating to the activities, financial status, physical performance, total
employment, social purpose, financial system and management, interface with government,
performance improvement plan, SWOT analysis, problems encountered, and strategic initiatives
have all been summarized in Annexure 8.6. These are all also analyzed in the earlier sections.
Some of the useful points are culled out in the following paragraphs.
A majority of the enterprises have been incorporated in the company form. All the
manufacturing enterprises excepting Sikkim Co-operative Milk Union have been registered
as the Government Company. The social purpose of these enterprises (excepting Sikkim
Co-operative Milk Union) is very low. They qualify for full privatisation. The Sikkim
Power Development Corporation, although an enterprise in the utility category, has also a
low social purpose and qualifies for full privatisation. SABCCO and Sikkim Tourism
Development Corporation have a high social purpose. In their cases, privatisation could be
introduced through Optimum Performance Through Internal Management Action
(OPTIMA).
The utility enterprises are large sized. They operate as departmental enterprises. There is a
need to corporatise these enterprises, make them competitive, and commercially and
financially viable. Partial / full privitisation could follow thereafter.
Out of four public corporations, two corporations, viz., State Bank of Sikkim, Khadi and
Village Industries Board, and Tea Board of Sikkim have a high public purpose, and State
Trading Corporation has a low public purpose. Whereas, the first three need to be retained
ADB TA No. 4297-IND, Final Report
Capacity Building For Fiscal Reforms in Sikkim
126
in the public sector, the last one needs to be privatized. However, in both the cases, partial/
full privatisation could be considered as per the need of each case.
In the case of co-operative enterprises, public purpose being high, the retention is the only
option presently available with the government. However, in their case also, there is a
possibility of merger and OPTIMA
The size of the SLPEs in the State of Sikkim is small in terms of both the turnover and the
volume. This makes them amenable for restructuring and privatisation.
The financial position of the enterprises is very discouraging as most of the enterprises
completely depend for share capital on the government, have not garnered debt, are
characterized by receding or negative net worth due to accumulated losses, and are
incurring losses. Some of the enterprises have either low or negative working capital.
The wage costs are very high as the number of non - managerial personnel exceeds the
managerial staff by a considerable margin. Overstaffing has taken place through the muster
roll, work-charged and casual employment routes. Some enterprises have tried to go in for
labour adjustments through VRS but the success has been minimal and a lot more remains
to be done.
The revenues earned / turnover of the enterprises is very low and is about 15 per cent of the
total investment. The capacity utilisation in manufacturing enterprises ranges from 10 -30
per cent.
The enterprises have perennially continued with same activities without any R&D and
innovations.
The financial and management systems such as budgeting, costing, pricing, internal audit,
management information system (MIS), project appraisal, recruitment, manpower planning,
supply chain management, appointment of professional directors, excessive presence of
government directors on the board have encouraged non commercial culture and
bureaucratisation. The enterprises are not board-led ones.
The SWOT analysis points that strengths are far less as compared to weaknesses and so is
the case between opportunities and threats.
Most of the enterprise did not formulate performance improvement plans and are not
internally funded. Further, many enterprises lack the government support in that there
interaction with government is very low.
The problems faced by these enterprises are galore ranging from operations related, market
mix, location, over aging of plant and machinery to strategic issues such as settlement of
debts, diversification, finding new markets, innovating new sources of finance, increase in
employee productivity, unwarranted internal competition and neglect of technology, to
mention a few.

ADB TA No. 4297-IND, Final Report
Capacity Building For Fiscal Reforms in Sikkim
127
The SLPEs have shown a very poor appreciation for strategic initiatives including the
rationalization of manpower and modernization of plant and machinery. The issues in
organisaitonal, financial, human resource development and industrial relations, operational
and technological restructuring have not been attended to by them.
8.5 Restructuring SLPEs in Sikkim: Basic Approach
The SLPEs scenario in the State of Sikkim points to the need of a re-look at the SLPEs portfolio to
be retained by the Government and assess the scope for privatization and disinvestment in the case
of the enterprises required to be off loaded. The restructuring of SLPEs in Sikkim will involve
among other things, organizational restructuring, operational restructuring, human resource
management, and decisions regarding strategic re-orientation of enterprises. In ndertaking the
restructuring, it is necessary to take into account the rationale, objectives, benefits, criteria and
procedures concerning privatisation and disinvestment.
The investments in the SLPEs have become unproductive and cost the GoS Rs 190.52 crore in
2003-04. This is a huge sum. The returns were negative also in the years 2001-02 and 2002-03.
The GoS must unlock the value hidden in the SLPEs. The restructuring of loans obtained by
SABCCO, Sikkim Power Development Ltd, and Sikkim Time Corporation Ltd would improve the
profit and loss accounts and balance sheets of these enterprises and also reduce the risk for the
GoS. It is important to note in this context that the SLPEs have been set up as an instrument of
public policy by the GoS. Further, Sikkim is relatively a new State in the north-east. Therefore,
any move about restructuring / privatisation has to be considered in the backdrop of the fact that in
the present phase of economic development of the State, some SLPEs would continue to play an
important role. To add, these enterprises are the only source of organized employment in Sikkim
outside the government structure. The restructuring plans formulated are based on the financial
data pertaining to March 31, 2004.
Table 39 Cost and Returns from Investments in SLPEs
(Rs in crore)
Particulars 2001-02 2002-03 2003-04
1 Total Investment 663.34 676.86 726.06
2 Opportunity Cost
(@ 10 % on Total Investment )
66.33 67.68 72.61
3 Add Net loss 72.75 66.06 32.74
4 Add Subsidies* 0.86 3.81 0.84
5 Total (2+3+4 ) 139.94 137.55 106.19
6 Less Dividends 0.14 0 0.01
7 Gross Direct Cost (5-6) 139.80 137.55 106.18
8 Add Guarantees 95.89 86.19 84.34
9 Total Cost (7+8) 235.69 223.74 190.52
(*Source : Annexure 8.7)

ADB TA No. 4297-IND, Final Report
Capacity Building For Fiscal Reforms in Sikkim
128
8.6 Policy of GoS on Disinvestment/Privatisation
By beading together the various policy pronouncements, it is possible to glean the public policy on
the SLPEs in the State of Sikkim. The public sector has played a laudable role in creating
manufacturing presence in the state when none existed. However, the significantly changed
economic environment that now prevails makes it necessary for both the public and the private
sectors to become competitive. Learning from the State experience, especially over the last decade,
it is evident that disinvestment in public sector enterprises is no longer a matter of choice, but an
imperative. The prolonged fiscal hemorrhage from the majority of these enterprises cannot be
sustained any longer. The disinvestment would enable a more productive use of resources of the
state.
The public sector has played a vital role in the development of the economy of the State of Sikkim.
However, the nature of this role cannot remain frozen to what it was conceived years ago - a time
when the technological landscape, and the domestic and national economic environment were so
very different. The private sector in the State has come of age, contributing substantially to the
development programmes launched by the State. Therefore, both the public and the private sectors
need to be viewed as mutually complementary parts of the industrial sector. The private sector
must assume greater public responsibilities just as the public sector needs to focus more on
achieving results in a highly competitive market. Most of the SLPEs have accumulated huge
losses. With public finances under intense pressure, the State Government is just not able to
sustain them much longer. Accordingly, the State Government is compelled to embark on the
programme of disinvestment.
There are many SLPEs, which are sick and not amenable for revival. The only remaining option is
to close down these undertakings after providing an acceptable safety net for the employees and
workers. Consistent with the endeavor of the Central Government, downsizing of excess
manpower through suitable scheme like VRS (Voluntary Retirement Scheme) would be
implemented in the current Five Year Plan. The entire proceeds from disinvestment/ privatisation
would be deployed in social sectors and retirement of public debt. The public sector has
overgrown itself and their shortcomings have manifested in the shape of low capacity utilization
and low efficiency due to over manning and poor work ethics, over capitalisation due to substantial
time and cost overruns, inability to innovate, take quick and timely decisions, large interference in
decision making process etc.
By and large, the GoS proposes to privatise/ disinvest the SLPEs which are not strategic in nature.
It is expected that such disengagement would lead to the development of private sector and freeing
resources which are unwarrantedly locked up in the public sector. The GoS proposes to carryout
the entire restructuring exercise on case-to-case basis in a transparent manner without hurting the

ADB TA No. 4297-IND, Final Report
Capacity Building For Fiscal Reforms in Sikkim
129
interest of workers. The SLPEs are encouraged to formulate their VR schemes to minimize the
social consequences of labour adjustments. The GoS has also formulated some criteria for
disinvestment to avoid subjectivity in the selection of candidates for disinvestment and pre-empt
formation of monopolies. However, these criteria need an analytical formulation to identify the
candidates for privatisation, disinvestment and retention. This alone could indicate as to what
should be the SLPEs portfolio for retention by the GoS and as to which modality could be
followed for privatisation / disinvestment of the left over SLPEs. This forms the subject matter of
the next section. It is appropriate to mention here that such an analytical formulation would stand
out as a superior proposition to the criteria indicated by the GoS in that besides considering
profitability of the SLPEs, it gives due credit to their public purpose, resource mobilisation and
market structure, and also outlines modalities of restructuring and privatisation.
BOX VII Policy of Government of Sikkim on Disinvestment and Privatization
Rationale
The GoS accepts, by and large, the need for restructuring SLPEs in the era of economic
liberalization paving the growth of private sector.
The restructuring of the SLPEs would be decided on a case to case basis
The manpower in the SLPEs would be right sized through VRS.
The social consequences of restructuring the SLPEs would be given due consideration in deciding
about the portfolio of their retention with the GoS.
Objectives
Releasing large amount of public resources locked up in non-productive SLPEs, for redeployment
in areas that are much higher on the social priority, such as, basic health, family welfare, primary
education and social and essential infrastructure.
Stemming further outflow of scarce public resources for sustaining the unviable SLPEs.
Reducing the public debt that is threatening to assume unmanageable proportions.
Transferring the commercial risk, to which the taxpayers‟ money locked up in the public sector is
exposed, to the private sector wherever the private sector is willing and able to step in. The money
that is deployed in the SLPEs is really the public money and is exposed to an entirely avoidable and
needless risk, in most cases.
Releasing other tangible and intangible resources, such as, large manpower currently locked up in
managing the SLPEs, and their time and energy, for redeployment in high priority social sectors
that are short of such resources.
Incidental Benefits
Disinvestments would expose the privatised companies to market discipline, thereby forcing them
to become more efficient and survive or cease on their own financial and economic strength. They
would be able to respond to the market forces much faster and cater to their business needs in a
more professional manner. It would also facilitate in freeing such companies from the GoS control
and introduce corporate governance in the privatised companies.
Disinvestments should result in wider distribution of wealth through offering of shares of privatised
companies to small investors.
The restructuring would provide access to the existing SLPEs to appropriate private investment and
thereby increase economic activity and have an overall beneficial effect on the economy,
employment and tax revenues in the medium to long term.
The disinvestment would result in optimal use of resources and assets in the SLPEs by unleashing
their inherent productive potential
Preconditions and Criteria
The GoS proposes to ensure that disinvestment does not result in unwarranted alienation of state assets.
Further, it does not propose to take any action that may result in formation of private monopolies. The
criteria for disinvestment/ privatisation are as follows:
Government would disinvest/privatise public sector undertakings, which are making losses for the

ADB TA No. 4297-IND, Final Report
Capacity Building For Fiscal Reforms in Sikkim
130
last three years.
Government would disinvest/privatise public sector undertakings, which have not paid dividends to
the Government of Sikkim for the last three years.
Government would disinvest/Privatize public sector undertakings from which the return on
investments is less than the prime-lending rate of the Nationalized Banks.
Procedure
Proposals for disinvestment/privatization in any SLPE, based on the recommendations of the
Administrative Department would be placed for consideration of the GoS through the Minister in
charge of the concerned SLPE.
The GoS clears the disinvestment proposal, the valuation of the assets of the SLPE would be done
by the concerned technical departments of GoS Sikkim. The value of the current assets so
calculated would serve as the floor/ reserve price for the purpose of bidding.
Bidders would be invited through advertisement in newspapers/website to submit their Expression
of Interest (EOI) in the first stage. After receipt of the Expression of Interest (EOI), in pursuance of
Advertisement in newspapers / website, a list of bidders would be prepared.
The bidders would be undertaking due diligence of the SLPE and hold discussions with the
Administrative Department/ the representatives of the SLPE for any clarifications.
The bidders would be asked to submit their financial offers. Based on the highest offer received
from the prospective bidders, the Sale Agreement/Lease Agreement would be finalised by the
Administrative Department. After getting the Sale Agreement/Lease Agreement vetted by the
Department of Law, the Sale Agreement would be approved by the Government.
After the transaction is completed, copies of all papers and documents relating to the transaction
would be sent to Finance Department of the State for reference and record.
8.7 Scope for Restructuring SLPEs
The purpose of this section is to discuss the models for identifying the candidates for
disinvestment/ privatisation and list out the SLPEs for disinvestment / privatisation and retention.
We present below two conceptual models contained in Figures 21 and 22 that could suit our
requirement of identifying out the various SLPEs in the State of Sikkim for the purposes of
disinvestment, privatisation and retention. The first model is known as the Three Dimensional
Matrix and the second one is know as the Two –by - Two Matrix.
The Three Dimensional Matrix based on factors such as (1) public purpose, (2) mobilization of
resources from external sources, and (3) profitability could be applied to rank public enterprises as
high or low. The enterprises being high on all three dimensions merit retention in the public
enterprise portfolio. On the other hand, the enterprises being low on all three dimensions need to
be transferred to the private sector. The enterprises falling in intermediate categories need to
undergo restructuring.
The second model is based on financial performance and market structure. The SLPEs may have a
positive or negative financial performance. In terms of market structure, they may constitute a
single source of supply or constitute to multiple sources of supply. The enterprises registering
good financial performance and having multiple sources of supply emerge as clear candidates for
privatization. On the contrary, the enterprises characterized with good financial performance but

ADB TA No. 4297-IND, Final Report
Capacity Building For Fiscal Reforms in Sikkim
131
belonging to single source of supply need to be retained in the public enterprise portfolio. The
SLPEs in the other categories need to be restructured.
Figure 21 Three Dimensional Matrix
Factors High Low
1. Public Purpose H1 L1
2. Resource Mobilisation from Financial
Institutions
H2 L2
3. Profitability H3 H3
Figure 22 Two-by-Two Matrix
Mar
ket
Str
uct
ure
Financial Performance
Good Bad
Single Source A B
Non-Competitive
Successful PEs
Non-Competitive
Unsuccessful PEs
Multiple Source C D
Competitive
Successful PEs
Competitive
Unsuccessful
8.8 Identifying SLPEs for Restructuring
The data for the year 2003-04 pertaining to the SLPEs have been considered for the application of
the three dimensional matrix and the two – by – two matrix. Public purpose is considered high if
the enterprise is involved in core activities which can not be totally executed by the private sector.
Resource mobilisation is considered high if 20 per cent or more of the resources have been raised
externally. Profitability is considered high if the net profits earned are more than ten per cent of the
investment.
As per the Three Dimensional Matrix, there is no SLPE in Sikkim qualifying for straight retention.
However, there are nine SLPEs requiring privatisation / closure. These enterprises include Sikkim
Jewels Ltd, Sikkim Hatchery Ltd, Sikkim Poultry Dev. Corp. Ltd, Sikkim Precision Dev. Corp.
Ltd, Sikkim Time Corp., Sikkim Trading Corp., Sikkim State Consumer Co-operative Society,
Government Fruit Preservation Factory, and Sikkim Power Dev. Corp. Ltd. Though Sikkim
Consumer Co-operative Society and State Trading Corp. have been profit making ventures, their
privatisation / winding up has been suggested in view of the duplication of activities with SIMFED
and the Denjong Agricultural Co-operative Society as discussed later. The rest of the enterprise
(namely, SIDICO, State Bank of Sikkim, Sikkim State Consumer Co-operative Bank, Tea Board
of Sikkim, Sikkim Milk Producers Union, Sikkim Tourism Dev. Corp. Ltd, Sikkim Handloom and
Handicrafts Dev. Corp. Ltd, Khadi and Village Industries Board, SIMFED, Denjong Agricultural
Society, Sikkim Nationalized Transport, Sikkim Energy and Department of Power and SABCCO)
need to be restructured as per the suitably designed modalities.

ADB TA No. 4297-IND, Final Report
Capacity Building For Fiscal Reforms in Sikkim
132
Table 40 Three Dimensional Matrix and SLPEs
Name of the enterprise Public
Purpose
Resource
Mobilization*
Profitability**
SIDICO High High Low
State Bank of Sikkim High High Low
Sikkim State Co-operative Bank High Low Low
Sikkim Jewels Ltd Low Low Low
Sikkim Hatchery Ltd Low Low Low
Sikkim Poultry Low Low Low
Sikkim Precision Industries Low Low Low
SITCO Low Low Low
Tea Board of Sikkim High Low Low
Sikkim Milk Union High High Low
Govt. Fruit Preservation Factory Low Low Low
Sikkim Tourism High Low Low
Sikkim Handicrafts and Handlooms
Development Corporation
High Low Low
Khadi and Village Industries Board High Low Low
State Trading Corp. Low Low High
Sikkim Consumer Co-operative
society
Low Low Low
SIMFED High Low High
Denjong Agricultural Co-Operative
Society Ltd
High Low High
Sikkim National Transport Corp. High Low Low
State Energy and Department of
Power
High Low Low
Sikkim Power Dev. Corp. Low Low Low
SABCCO High High Low
* The resource mobilization scenario is given in Annexure 8.4
** The profit performance is given in Annexure 8.5
Figure 23 shows that three enterprise viz., Sikkim Precision Industries Ltd, State Trading
Corporation, Government Fruit Preservation Factory qualify for privatisation as they are profitable
and are also competitive. The figure shows that five enterprises, viz Sikkim Industrial and
Investment Development Corporation Ltd, Sikkim State Co-operative Bank, Tea Board of Sikkim,
Sikkim Consumers‟ Co-operative Society, and Sikkim State Co-operative Supply and Marketing
Federation Ltd are profitable but non- competitive. These enterprises need to be made competitive
and in course of time required to be shifted to the first Quadrant making them amenable, if
necessary, for privatisation. There is a need to introduce policy and managerial reforms to shift
these enterprises to the first quadrant. Quadrant three shows viz., Sikkim Jewels Ltd, Sikkim
Hatchery Ltd, Sikkim Poultry Dev. Corp. Ltd, Sikkim Times Corp. Ltd, Sikkim Co-operative Milk
Producers Union Ltd and Sikkim Power Dev. Corp.. There is a need to introduce policy and
managerial reforms to shift these enterprises to the first Quadrant. Quadrant four shows that eight
enterprises viz., State Bank of Sikkim, Sikkim Tourism Development Corporation Ltd, Sikkim
Nationalized Transport, Sikkim State Energy and Power Department, Sikkim Handloom and

ADB TA No. 4297-IND, Final Report
Capacity Building For Fiscal Reforms in Sikkim
133
Handicrafts Dev. Corp. Ltd, Khadi and Village Industries Board, Denjong Agricultural Co-
Operative Society Ltd, and Sikkim Scheduled Castes, Tribes and Other Backward Classes
Development Corporation Ltd are loss making and non – competitive. There is a need to make
these enterprises competitive and then introduce managerial reforms in order to shift them from
Quadrant four to Quadrant three and eventually to Quadrant one.
The application of the two models provides the same choice for the portfolio for retention of the
SLPEs in the State of Sikkim which facilitates our task of outlining the modalities for restructuring
and privatisation.
The application of the restructuring models clearly point out a vast scope for policy and
managerial reforms for the SLPEs that are required to be retained in the medium and long term by
the GoS and privatisation/ disinvestment of un-strategic SLPEs. The modalities with regard to the
privatisation of these enterprise and the restructuring packages for privatisation/ disinvestment and
managerial reforms are discussed through sections 8.9 to 8.11
Figure 23 Two –by – Two Matrix and SLPEs
Competitive Non- Competitive
Fin
anci
al P
erfo
rman
ce
Pro
fit
Mak
ing
1. Sikkim Precision Industries Ltd
2. State Trading Corporation
3. Government Fruit Preservation
Factory
First Quadrant
1. Sikkim Industrial and
Investment Development
Corporation Ltd
2. Sikkim State Co-operative Bank
3. Tea Board of Sikkim
4. Sikkim Consumers‟ Co-
operative Society
5. Sikkim State Co-operative
Supply and Marketing
Federation Ltd
Second Quadrant
Lo
ss m
akin
g
1. Sikkim Jewels Ltd
2. Sikkim Hatchery Ltd
3. Sikkim Poultry Dev. Corp. Ltd
4. Sikkim Times Corp. Ltd
5. Sikkim Co-operative Milk
Producers Union Ltd
6. Sikkim Power Dev. Corp.
Three Quadrant
1. State Bank of Sikkim
2. Sikkim Tourism Development
Corporation Ltd
3. Sikkim Nationalized Transport
4. Sikkim State Energy and Power
Department
5. Sikkim Handloom and
Handicrafts Dev. Corp. Ltd
6. Khadi and Village Industries
Board
7. Denjong Agricultural Co-
Operative Society Ltd
8. Sikkim Scheduled Castes,
Tribes and Other Backward
Classes Development
Corporation Ltd
Fourth Quadrant

ADB TA No. 4297-IND, Final Report
Capacity Building For Fiscal Reforms in Sikkim
134
8.9 Modalities of Restructuring and Privatisation of SLPEs
It is proposed here to discuss the modalities of restructuring and privatisation of SLPEs in the State
of Sikkim. We have ranked earlier the SLPEs as high or low on the various parameters of the three
dimensional matrix. By placing them on the three dimensional matrix, we obtained 2x2x2 i.e. 8
categories containing 22 enterprises. No enterprise was high on all the parameters. Eight
enterprises were low on all the parameters. 14 enterprises belonged to the other six categories.
State Trading Corporation has also been identified for privatisation / closure due to its presence in
non-strategic area of operation. Table 41 provides the details in terms three dimensional matrix of
category-wise listing of the SLPEs in the State of Sikkim.
The modalities for restructuring category-wise are discussed below:
Category 1:- High public purpose, resource mobilization and profitability: The SLPEs in this
category should be continued since they are good performers. They should be freed from
government control on operational issue matters. The Memorandum of Understanding (MoU)
should specify support to be extended and financial returns expected by the Government. The
Governing Boards of these enterprises should not have more than one government nominees. All
measures under cold privatisation could be adopted for enterprises in this category. The enterprises
in this category should be provided autonomy and become financially viable. The term cold
privatisation refers to optimum performance through internal management action which calls for
introduction and strengthening of financial and management systems such as budgeting, costing,
pricing, internal audit, manpower planning, recruitment, performance appraisal, training and
management development, supply chain management, technological up-gradation, computerisation
and restructuring of varied kinds, viz., organisational, financial, human resources, operations and
technological restructuring. No SLPE has been ranked as high - high – high.
Category 2:- Low public performance, resource mobilization and profitability: The enterprises in
this category are a fit case for liquidation or total divesture, if possible. This would lead to
avoidance of further investment thereby reducing the burden on the State exchequer. Sikkim
Jewels Ltd, Sikkim Hatchery Ltd, Sikkim Poultry Ltd, Sikkim Precision Industries, SITCO, Govt.
Fruit Preservation Factory, Sikkim Consumer Co-operative Society and Sikkim Power Dev. Corp.
come in this category of the three dimensional matrix.
Category 3:- High public purpose, low resource mobilization and low profitability: These
enterprises should be continued in the state sector. The accent on resource mobilization and
profitability should be increased and then partial / cold privatization could be attempted. Sikkim
State Co-operative Bank, Tea Board of Sikkim, Sikkim Tourism Dev. Corp. Ltd, Sikkim
Handicrafts and Handlooms Development Corp., Khadi and Village Industries Board, Sikkim
National Transport Corp., State Energy and Department of Power, form a part of this category.

ADB TA No. 4297-IND, Final Report
Capacity Building For Fiscal Reforms in Sikkim
135
Table 41 Categorization of SLPEs as per Three Dimensional Matrix
Category Name Name of the enterprise
Category 1 : Public purpose high, resource
mobilization high, profitability high
#
Category 2 : Public purpose low, resource
mobilization low, profitability low Sikkim Jewels Ltd
Sikkim Hatchery Ltd
Sikkim Poultry
Sikkim Precision Industries
SITCO
Govt. Fruit Preservation Factory
Sikkim Consumer Co-operative society
Sikkim Power Dev. Corp.
Category 3: Public purpose high, resource
mobilization low, and profitability low
Sikkim State Co-operative Bank
Tea Board of Sikkim
Sikkim Tourism
Sikkim Handicrafts and Handlooms
Development Corporation
Khadi and Village Industries Board
Sikkim National Transport Corp.
State Energy and Department of Power
Category 4: Public purpose high, resource
mobilization low, profitability high: SIMFED
Denjong Agricultural Co-Operative Society
Ltd
Category 5: Public purpose high, resource
mobilization high, profitability low SIDICO
State Bank of Sikkim
Sikkim Milk Union
SABCCO
Category 6: Public purpose low, resource
mobilization high, profitability low
#
Category 7: Public purpose low, resource
mobilization low, profitability high State Trading Corp.
Category 8: Public purpose low, resource
mobilization high, profitability high
#
# No enterprise classified in this category
Category 4:- Public purpose high, resource mobilization low, profitability high: The enterprises in
this category could be continued in the State sector. The accent should be on improving the
resource mobilization increased borrowings on commercial terms. The profitability improvement
measures could also be introduced to improve the market standing of the enterprises. The
enterprises in this category then be partially privatized. SIMFED and Denjong Agricultural Co-
Operative Society Ltd form a part of this category as enterprises.
Category 5:- Public purpose high, resource mobilization high, profitability low: While enterprises
in this category could be continued in the State sector, there should be total reorganization of
internal management and profitability elements concerning these enterprises. SIDICO, State
Bank of Sikkim, SABCCO and Sikkim Milk Union form a part of this category of enterprises.
Category 6:- Public purpose low, resource mobilization high, profitability low: Such cases should
go in for disinvestment. Total divestiture could also be attempted. Although, no enterprise falls in
this category, any enterprise established in future, qualifying for this category, should be taken up
for disinvestment or total divestiture.

ADB TA No. 4297-IND, Final Report
Capacity Building For Fiscal Reforms in Sikkim
136
Category 7:- Public purpose low, resource mobilization low, profitability high: In such cases the
government fund could be withdrawn by borrowing more from the market and institutions in view
of the good profitability. The enterprises in this category could be considered initially for partial
divestiture leading to full divestiture in the final course. State Trading Corporation is the cases in
point concerning this category.
Category 8:- Public purpose low, resource mobilization high, and profitability high: These form
appropriate cases for total disinvestment resulting in capital accretions for the State government.
No SLPE qualifies for inclusion in this category.
The anticipated benefits of the modalities suggested are given in Table 42
Table 42 Anticipated Benefits of Modalities
Categorization of SLPEs Names of SLPES and No.
of SLPEs
Suggested Action Anticipated
Results Public
Purpose
Resource
mobilization
Profit
Abilit
y
H1 H2 H3 # Continue in the
state sector with
greater autonomy
Better service to
consumers
L1 L2 L3 Sikkim Jewels Ltd.
Sikkim Hatchery Ltd
Sikkim Poultry Ltd
Sikkim Precisions
Industries Ltd
SITCO
Govt. Fruit Preservation
Factory
Sikkim Consumer Co-
operative Society and
Sikkim Power
Development Corp. Ltd
Closure or
Liquidation or
total divestiture
Saving of Govt.
Resources
H2 L2 L3 Sikkim State Co-
operative Bank
Tea Board of Sikkim
Sikkim Tourism Dev.
Corp. Ltd
Sikkim Handicrafts and
Handloom Dev. Corp. Ltd
Khadi and Village
Industries Board
Sikkim National
Transport and
State Energy and
Department of Power
Continue in the
state sector with
increased accent
on resource
mobilisation and
profitability
Improved
fulfillment of
public purpose
H1 L2 H3 SIMFED
Denjong Agricultural Co-
operative Society Ltd
Increased accent
on the resource
mobilisation /
partial
disinvestment
Better Revenues
or reduced
budget support
H1 H2 L3 SIDICO
State Bank of Sikkim
Disinvest Additional
resource to

ADB TA No. 4297-IND, Final Report
Capacity Building For Fiscal Reforms in Sikkim
137
Sikkim Milk Producers
Union
SABCCO
Govt.
L1 H2 L3 # Introduce
financial
adjustments and
then of in for
disinvestment
Long term
Improvement in
service to
consumers
L1 L2 H3 State Trading Corp. Ltd
Introduce
financial
adjustments and
then go in for
disinvestment
Long term
Investment in
service to
consumers
L1 H2 H3 # Disinvest Reduced Govt.
support
#No enterprise classified in this category
8.10 Privatisation Method
An enterprise could be privatised with or without divestiture. The divestiture could be full or
partial. The privatisation without divestiture could be positive or negative. The choice of methods
would be determined by the characteristics possessed by each enterprise in terms of being strategic
or non-strategic in nature. Both the strategic and non - strategic enterprises creating fiscal
pressures by continued loss making need to be removed from the portfolio for retention of the
SLPEs. However, between the strategic and non – strategic enterprises, it is easier to privatise the
non - strategic enterprises.
8.11 Requirements for Restructuring
In order to affect restructuring for privatisation, disinvestment and retention, some legal,
accounting and financial requirements need to be fulfilled besides pledging the political
commitment. The legal requirements include the settlement of claims of employees, fulfillment of
the provisions of the companies act and corporatisation of the departmental enterprises. The
accounting requirements comprise the updation of accounts, assessment of contingent liabilities
and settlement of claims. The financial requirements include the changes in the debt - equity ratio,
broadening of capital structure, introduction of financial systems and valuation of the enterprise.
The socio- political requirements include the creation of pro-restructuring / privatisation climate,
transparency in restructuring / privatisation, setting up independent machinery for the purpose and
strong political commitment ensuring the successful functioning of the post-privatised enterprises.
The setting up of regulatory bodies, wherever required, is also necessary for the success.
8.12 Restructuring Plan
In this section, an attempt has been made to provide the macro and the micro restructuring plans
related to the SLPEs.

ADB TA No. 4297-IND, Final Report
Capacity Building For Fiscal Reforms in Sikkim
138
Restructuring: Broad Categorization of SLPEs
There is a need to formulate some broad principles for restructuring which could be pursued by the
GoS to tackle issues relating to the SLPEs. These broad principles could be formulated on the
basis of an intensive study of the functioning and performance of these enterprises.
A study of the objectives and the profile of these enterprises very clearly reveal the duplication of
activities in the case of Sikkim Consumer Co-operative Society, the Denjong Agricultural Co-
operative Society, Sikkim State Co-operative Supply and Marketing Federation and State Trading
Corporation. All these enterprises are engaged in the activities of procurement of goods and supply
of services to the government departments. These enterprises operate on a margin which provides
them a spread adequate enough to cover the costs over a period of time. These enterprises solely
depend on procurements and have not been developing new business. The procurement costs of
these enterprises are increasing. On the part of these enterprises, the problem of delayed payment
or non-payment from the government departments is becoming more and more acute. Further, the
user enterprises and the government departments have been complaining about the delays in
supply and also excessive costs. It is suggested that State Trading Corp. Ltd and Sikkim Consumer
Co-operative Society be privatised / wound up as they are involved in non- core business activity.
The State should not set up any enterprise in future intended to take up a non- core activity. A non-
core activity is an activity that serves low social purpose which can be taken up by the private
sector on the grounds of its presence and suitability.
There are some enterprises serving high social purpose but involved in the conduct of partly non-
core activities. These enterprises comprise the Denjong Agricultural Co-operative Society, Sikkim
State Co-operative Supply and Marketing Federation and Sikkim Handloom and Handicrafts Dev.
Corp. Ltd. The Denjong Agricultural Co-operative Society and Sikkim State Co-operative Supply
and Marketing Federation work under the same government department, serve the same clientele
and duplicate some activities. The Denjong Agricultural Co-operative Society and Sikkim State
Co-operative Supply and Marketing Federation need to be merged to avoid the duplication. The
merged enterprise should refrain from undertaking the procurement business and concentrate on
the core activity of serving its shareholders. The Sikkim Handloom and Handicraft Dev. Corp. Ltd
should also concentrate on promotional activities and reduce its direct involvement in sale or
manufacturing of handloom and handicrafts items.
All the manufacturing enterprises (excepting Sikkim Co-operative Milk Producers Union and Tea
Board of Sikkim) have been found low on public purpose, resource mobilisation and profitability.
These consist of Sikkim Jewels Ltd, Sikkim Hatchery Ltd, Sikkim Poultry Dev. Corp. Ltd, Sikkim
Precision Industries, Govt. Fruit Preservation Factory and Sikkim Time Corporation. Sikkim
Power Dev. Corp., a utility sector enterprise, has also been found low on public purpose, resource

ADB TA No. 4297-IND, Final Report
Capacity Building For Fiscal Reforms in Sikkim
139
mobilisation and profitability. These enterprises are defunct for several years. These enterprises
operate in a highly competitive market. The private sector is emerging as a strong player in the
areas in which these enterprises operate. Not only that these enterprises have lost their market
penetration but they have also lost their marketing muscle in terms of advertising and publicity.
There is a need to privatise / wind up all these enterprises. The GoS should weigh the objectives of
setting up a proposed SLPE in terms of these indicators and if the answer is not in affirmative, the
GoS should not set up such an enterprise in the state sector.
The utility sector enterprises viz., Sikkim Nationalized Transport and Sikkim Energy and
Department of Power form the lifeline of the State and need therefore to be retained in the public
sector. However, their corporatisation is necessary. Once they are corporatised, OPTIMA could be
introduced in these enterprises.
The welfare and promotional enterprises have to be continued in the state sector as they deal with
the up-liftment of the down trodden classes of society and development of certain economic
activity. It is in this backdrop that SABCCO, Khadi and Village Industries Board and Sikkim
Tourism Dev. Corp. could be retained in the portfolio of public sector by the GoS.
The financial enterprises such as SIDICO, State Bank of Sikkim and Sikkim State Co-operative
Bank provide financial input for the economic development They have high social purpose.
However, their resource mobilisation and profitability are low. There internal management is very
poor. They suffer from asset –liability mismatch. They have also watered assets. All this suggests
that while they could continue in the public sector, they need to vigorously pursue OPTIMA and
also enhance the size and volume of their operations.
To summaries, in the light of the suggestions with regard to the restructuring of the SLPEs their
proposed status would be as followed
Table 43 Suggested Status of SLPEs
Name of the enterprises To be
Retained
To be
Merged
To be Privatised/
wound up
Sikkim Industrial and Investment
Development Corporation Ltd
*
State Bank of Sikkim *
Sikkim State Co-operative Bank *
Sikkim Jewels *
Sikkim Hatchery *
Sikkim Poultry *
Sikkim Precision Industries *
Sikkim Time Company *
Tea Board of Sikkim *
Govt. Fruit Preservation Factory *
Sikkim Co-operative Milk *

ADB TA No. 4297-IND, Final Report
Capacity Building For Fiscal Reforms in Sikkim
140
Name of the enterprises To be
Retained
To be
Merged
To be Privatised/
wound up
Producers Union Ltd
Sikkim Tourism *
Sikkim Handloom and
Handicrafts Development Corp.
Ltd
*
Khadi and Village Industries
Board
*
State Trading Corp. *
Sikkim Consumer Co-operative
Society
*
Sikkim State Co-operative
Supply and Marketing
Federation Ltd
*
Denjong Agricultural Co-
Operative Society Ltd
*
Sikkim Nationalized Transport
Corp.
*
State Energy and Department of
Power
*
Sikkim Power Dev. Corp. *
SABCCO *
Total 11 2 9
Restructuring: Management and Co-ordination at Government Level
The SLPEs in Sikkim are small sized entities in terms of investment, assets and turnover,
innovations. They are loss making. The financial and management systems are conspicuous by
their absences in these enterprises. The government control and direction relating to SLPEs in
Sikkim is lacking in several respects. Although an official of the level of the Director in the
Finance Department has been made responsible for coordinating the enterprise-government
interface, he is saddled with several responsibilities and finds no time to attend to the issues
relating to the SLPEs. In case finance department has surplus officials (or it could seek the services
of an official from other departments who have surplus officials), it is suggested to designate one
such official as the Director (SLPEs) charged with the responsibility of inter-departmental
coordination, preparation of an annual survey on the SLPEs, formulation of management
development and training plans, clearing the arrears of annual accounts and reports in the SLPEs
by extending support in terms of accounting personnel and providing guidelines on the wage and
performance evaluation matters. Such an official should also have some exposure on public
enterprise reforms carried out in some countries and states in India such as Andhra Pradesh,
Karnataka, Orissa and West Bengal.
The Director (SLPEs) should immediately look into the problems of manpower planning, wage
policies, internal audit and control systems in the SLPEs. Almost all the enterprises do not have
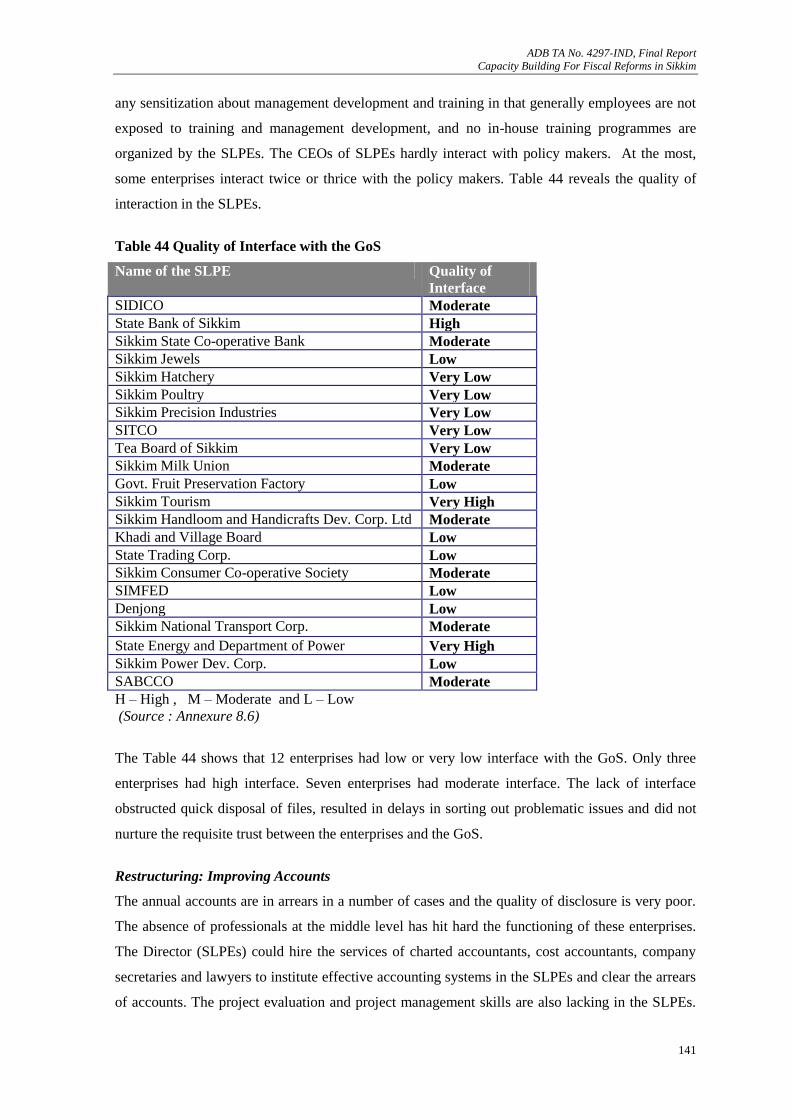
ADB TA No. 4297-IND, Final Report
Capacity Building For Fiscal Reforms in Sikkim
141
any sensitization about management development and training in that generally employees are not
exposed to training and management development, and no in-house training programmes are
organized by the SLPEs. The CEOs of SLPEs hardly interact with policy makers. At the most,
some enterprises interact twice or thrice with the policy makers. Table 44 reveals the quality of
interaction in the SLPEs.
Table 44 Quality of Interface with the GoS
Name of the SLPE Quality of
Interface
SIDICO Moderate
State Bank of Sikkim High
Sikkim State Co-operative Bank Moderate
Sikkim Jewels Low
Sikkim Hatchery Very Low
Sikkim Poultry Very Low
Sikkim Precision Industries Very Low
SITCO Very Low
Tea Board of Sikkim Very Low
Sikkim Milk Union Moderate
Govt. Fruit Preservation Factory Low
Sikkim Tourism Very High
Sikkim Handloom and Handicrafts Dev. Corp. Ltd Moderate
Khadi and Village Board Low
State Trading Corp. Low
Sikkim Consumer Co-operative Society Moderate
SIMFED Low
Denjong Low
Sikkim National Transport Corp. Moderate
State Energy and Department of Power Very High
Sikkim Power Dev. Corp. Low
SABCCO Moderate
H – High , M – Moderate and L – Low
(Source : Annexure 8.6)
The Table 44 shows that 12 enterprises had low or very low interface with the GoS. Only three
enterprises had high interface. Seven enterprises had moderate interface. The lack of interface
obstructed quick disposal of files, resulted in delays in sorting out problematic issues and did not
nurture the requisite trust between the enterprises and the GoS.
Restructuring: Improving Accounts
The annual accounts are in arrears in a number of cases and the quality of disclosure is very poor.
The absence of professionals at the middle level has hit hard the functioning of these enterprises.
The Director (SLPEs) could hire the services of charted accountants, cost accountants, company
secretaries and lawyers to institute effective accounting systems in the SLPEs and clear the arrears
of accounts. The project evaluation and project management skills are also lacking in the SLPEs.

ADB TA No. 4297-IND, Final Report
Capacity Building For Fiscal Reforms in Sikkim
142
The Director (SLPEs), could organize these services and extend them to these enterprises. It is
worth mentioning that some enterprises have undertaken large investments in plant and machinery
to manufacture new products without proper project evaluation and effective implementation. Such
projects have vitiated the entire project economics and pushed them into red. The Director
(SLPEs) should also look into the legal framework governing the SLPEs. For instance, the laws
governing the SLPEs should be integrated with the laws of the main land. In this connection, it is
appropriate to mention that the Registration of Companies Act of Sikkim and the Income Tax Act
of Sikkim should be immediately replaced by the Indian Companies Act and the Indian Income
Tax Act. This, among other things, will facilitate better corporate governance and access to export
incentives to the SLPEs in Sikkim. It is suggested that the Director (SLPEs) may formulate an
agenda for action for effective exercise of the government control, on the one hand, and provide
strategic assistance to the SLPEs, on the other. He should refrain from becoming the fifth wheel in
the coach.
Restructuring: Board Composition
The successful functioning of an enterprise depends on the composition of its board and the
autonomy provided to it by the government. It has been found that most of the boards of the
SLPEs are packed with the government nominees and that the board decisions get referred finally
to the government Table 45 shows the compositions of the boards of the SLPEs. It is suggested
that the board composition should be balanced with the representation of professional directors,
user interests, employee representatives, and the government nominees. The strength of the board
should be between seven and twelve depending on the size of the organisations. The government
nominees should not exceed a number of more than two at the maximum. The position of managing
director and chairman could be combined to cut the red tape, quicken the decision making and
curb infructuous expenses. It has been observed that the separation of the post of chairman – cum-
managing director has resulted in wasteful expenditure and unhealthy organisational culture.
The interface problem as well as the absence of a comprehensive frame-work for performance
evaluation has affected the functioning of the SLPEs adversely. An appropriate measure of reform
should be introduced to remedy this problem. The initiation of the Memorandum of Understanding
(MoU) system is suggested to strengthen the government – SLPEs interface and institute a
comprehensive performance evaluation framework.
Restructuring: Optimum Performance through Internal Management Action (OPTIMA)
The restructuring of the SLPEs would require internal reforms paving the way for OPTIMA. This
would require resources for extending voluntary retirement for surplus personnel, instituting
management systems (eg., costing, budgeting, pricing, auditing, MIS, manpower planning and
recruitment, training and management development, and performance evaluation). The renovation

ADB TA No. 4297-IND, Final Report
Capacity Building For Fiscal Reforms in Sikkim
143
of obsolete machinery is necessary. The computerisation and network support is also required in
this context. The enterprises that have been identified in this category comprise SIDICO, State
Bank of Sikkim, Sikkim State Co-operative Bank, Sikkim Tourism, Khadi and Village Industries
Board, Sikkim National Transport and State Energy and Department of Power and Tea Board of
Sikkim. It is suggested that the GoS may provide a one-time restructuring grant to the enterprises
which would continue to be in the state portfolio in the medium term(to be divested at appropriate
time after readying them for the purpose) or to be retained in the long run. This grant could be
disbursed over a period of three years in a ratio of 34:33:33 depending on the urgency, absorption
capacity of the enterprise and the availability of the resources with the government
Table 45 Composition of Boards of the SLPEs in Sikkim
Name of the
enterprise
Govt.
Nominees
(including
nominees of
financial
institutions)
Functional
Director
Independent
Directors
(Professionals)
Worker
Nominee
Share
holders
Other Total
SIDICO 7 7
State Bank of
Sikkim
6 6
Sikkim State Co-
operative Bank
6 6
Sikkim Jewels 6 6
Sikkim Poultry 1 1 6 8
SITCO 5 1 6
Tea Board of
Sikkim
Sikkim Milk
Producers Union
5 2 8 15
Govt. Fruit
Preservation Factory
Sikkim Tourism 8 2 10
Sikkim Handloom
and Handicrafts
Dev. Corp. Ltd
1 8
Khadi and Village
Board
11 11
State Trading Corp. 6 6
Sikkim Consumer
Co-operative
Soceity
5 4 9
SIMFED 5 4 1 10
Denjong
Agricultural Co-
operative Society
5 4 9
Sikkim Nationalized
Transport Corp.
Departmental Ent.
Energy and Dept. of
Power
Departmental Ent.
Power Dev. Corp. 6 1 7
(Source: See Annexure 8.9)

ADB TA No. 4297-IND, Final Report
Capacity Building For Fiscal Reforms in Sikkim
144
Restructuring: Corporatization
The form of organization plays a significant role in the efficient conduct of a business enterprise.
Generally, the government company or the public corporation form is preferred to set up and run
the state enterprises. On the contrary, the GoS manages its transport and power sector enterprises
in the departmental form. This has affected the performance of these enterprises adversely and
deprived them of the enterprise culture. The enterprises in the departmental form do not benefit
from the principles of financial management and are not able to interface well with market. As a
result, both the transport and power sector enterprises have become a serious drag on the GoS in
terms of both the losses making and substantial investments. The departmental enterprises have not
shown any will to grow and are found lacking on innovativeness. Although Sikkim is different
from many other states in terms of topography, the working of the power sector and transport
sector enterprises has been found wanting as compared to their counterparts in the other states of
the north-east. It is worth mentioning here that instead of putting in place proper mechanisms to
correct this situation, the GoS has taken over the control of some government companies only to
vest such control in some government departments. The case of Government Fruit Preservation
Factory, Tea Board of Sikkim, Sikkim Poultry Dev. Corp. Ltd, and Sikkim Hatchery Ltd could be
cited in this context. It is suggested that the government may corporatise the departmental
enterprises (viz., Sikkim Nationalized Transport and Sikkim Energy and Department of Power) as
early as possible and also establish regulatory authorities for their smooth functioning.
Restructuring: Setting up of a Restructuring Board
The modalities of privatisation / restructuring have been discussed in the macro approach at length
in an earlier section. Whereas enterprises found low on all the three dimensions viz., public
purpose, profitability and resource mobilization, have to be privatised / wound up through trade
sale, employee and management buy out (EMBO), and majority share ownership transfer, the
enterprises to be retained need to go in for cold privatisation, OPTIMA, and partial privatisation
through joint venture, minority transfer of share ownership, or strategic partnership. In each case
an appropriate decision need to be taken by the government. It is suggested that the government
may set up a restructuring board which may deal with such cases from time to time. The
Maharashtra Government, Karnataka Government, Punjab Government and the Government of
Andhra Pradesh have set up a similar board either through a separate act or executive machinery
under the charge of the Department of Finance. The Director (SLPEs) could act as the nodal
officer for such machinery.
Restructuring: Human Face
Restructuring has to have a human face. This is in line with the present policy on PEs of the UPA
government. Both in the cases of closure / privatisation and retention of the SLPEs, the

ADB TA No. 4297-IND, Final Report
Capacity Building For Fiscal Reforms in Sikkim
145
employment in the SLPEs get affected. These point to the need of social safety net in the SLPEs.
The social safety net has five elements: survey of surplus manpower, voluntary retirement,
counselling, re-training and re-deployment. The discussions with the SLPEs have revealed that the
manpower planning has not received any attention in these enterprises as a result of which they
became „employment boards‟ and dumping ground of un-required government personnel. In most
of the enterprises, the sanctioned strength is far lower than the existing number of personnel /
deputations. About 25 -30 per cent employees are in excess of the requirement. This affects the
work culture in the SLPEs and also adds to the cost of production making their goods and services
uncompetitive. It is suggested that the GoS may formulate a scheme of social safety net for the
SLPEs which may assess not only the surplus manpower but also work out the number of
employees who could be offered voluntary retirement and benefit from counseling, retraining and
redeployment to the maximum possible extent. The government may bear the entire burden of the
social safety net. The Director (SLPEs) may be entrusted with the responsibility of formulating and
implementing the social safety net programme (SSNP). A special fund of Rs 10 crore may be
created for this purpose and placed with Director (SLPEs) as a part of restructuring programme.
The Director (SLPEs) could use this fund for social safety net, training and management
development, clearing the arrears of accounts of the SLPEs and conducting internal audit, etc.
Restructuring: Cost Aspects
We may now compute the total cost of restructuring and propose the allocation of funds for this
purpose over a period of three years to make the whole exercise a part of medium-term fiscal
planning. This requires us to estimate the value of assets, on the one hand, and work out the
restructuring cost, on the other. Annexure 8.10 contains valuation of the SLPEs. As per the
Annexure 8.10 the assets owned by the various SLPEs were of the order of Rs 426.50 crore as on
March 31, 2004.
Annexure 8.11 contains the estimates of restructuring costs for the enterprises to be retained, on
the one hand, and the enterprises to be privatised / wound up, on the other. The restructuring costs
relate to voluntary retirement, training, renovation / expansion, write-offs, installation of IT
facilities, settlement of court cases, liquidation of bank overdraft, repayment of loans, settlement of
contingent liabilities, advertisement and publicity, operational deficit, government guarantees,
payment of dues from the government, and working capital assistance. As suggested earlier, a one
time assistance could be provided by the government to meet out these costs which could be
disbursed over a period of 3 years in a ratio of 34:33:33. The revenues from privatisation /
restructuring need to be used for providing social safety net and improvement of performance of
the enterprises to be retained.

ADB TA No. 4297-IND, Final Report
Capacity Building For Fiscal Reforms in Sikkim
146
As noted earlier, some enterprises have to be privatisated / wound up. The valuation of these
enterprises and their restructuring costs is contained in Annexure 8.10 and Annexure 8.11. The
general principle that needs to be followed in the case of such enterprises is that if their
restructuring costs exceed valuation, the gap has to be made good by the exchequer. However, if
the receipts from the sale of these enterprises / their assets, exceed their restructuring costs, the
excess of such funds should be utilized for providing social safety net. An analysis of Annexure
8.10 (Valuation of SLPEs) and Annexure 8.11 (Restructuring Cost of SLPEs) reveals that the
enterprises to be privatised / wound up were valued at Rs 74.85 crore as on March 31, 2004
whereas, the restructuring cost amounted to Rs 24.96 crore as on the same date. Even if there is a
decline in the market value of the assets to the tune of about 50 per cent in the case of the
enterprises proposed to be privatised /wound up, there are no funds needed for this purpose from
the GoS or any other external source. Annexure 8.11 estimates the gross restructuring cost at Rs
236.98 crore. Rs 24.96 crore has to be deducted from this towards the restructuring of enterprises
to be privatised / wound up as that is going to be a self liquidating exercise. However, Rs 10 crore
has to be added to the funds requirements on restructuring as this sum has to be kept at the disposal
of the proposed Director (SLPEs) to carry out macro re-engineering of the SLPEs. In sum, the total
funds requirement for the restructuring of the SLPEs would be Rs 222.02 crore (composed of Rs
236.98 crore of gross restructuring cost – Rs 24.96 crore of restructuring cost of enterprise to be
privatised / wound up + Rs 10 crore as the macro restructuring fund to be kept at the disposal of
the Director - SLPEs). This amount could be disbursed over a period of three years to the tune of
Rs 75.49 crore, Rs 73.27 crore, Rs 73.27 crore. The privatisation / winding up of the nine
enterprises as indicated in Annexure 8.12 is estimated to have saved Rs 35.69 crore in 2003-04.
The enterprise –wise detailed restructuring plan is presented in Annexure 8.13.
Box VIII Recommendations regarding Individual SLPEs
SLPEs to be privatized
State Trading Corp Ltd
Sikkim Consumer Co-operative Society
Sikkim Jewels Ltd
Sikkim Hatchery Ltd
Sikkim Poultry Dev. Corp. Ltd
Sikkim Precision Industries
Govt. Fruit Preservation Company
Sikkim Time Corporation
Sikkim Power Dev. Corp
SLPEs to be merged (Retained)
The Denjong Agricultural Co-operative Society
and Sikkim State Co-operative Supply and
Marketing Federation
SLPEs to concentrate on promotional
activities and refrain from production and
sale (retained)
Sikkim Handloom Croporation
Sikkim Handicraft Dev. Corp.
SLPEs to be retained
Sikkim Co-operative Milk Producers Union
Tea Board of Sikkim
Sikkim Nationalised Transport
Sikkim Energy and Department of Power
SABCCO
Sikkim Tourism Dev. Corp

ADB TA No. 4297-IND, Final Report
Capacity Building For Fiscal Reforms in Sikkim
147
9. Improving Statistical Infrastructure
Fiscal policy does not function in a vacuum and is always considered as a part of the broader
macroeconomic setting. The annual budget, an embodiment of government fiscal policies, is
formulated after taking into account the developments in the economy as a whole. In turn, the
budget also has a considerable impact on the economy. The relationship is reciprocal and changes
in each need to be taken into account in analysing data as a first step in the formulation of fiscal
policies. In addition, some specific components of the budget in general and public expenditures
in particular, need information at a more disaggregated level. More specifically, poverty
alleviation measures are dependent, to a very large extent, on the definition of poverty line and
identification of those below it.
Both the macro and micro aspects of the statistical infrastructure, a vital ingredient of economic
policy making have been reviewed in some detail by the team. The team aimed at a detailed
review of the components of the system, as well as the technical capacity of the operational
officials engaged in this work. The review revealed several problem areas in the design and day to
day management of the system, as well as in the technical adequacy of the operational officials.
With a view to addressing the second problem both as a preclude and as a concurrent activity, the
team organised, the training of officials. The training programmes conducted for Sikkimese
officials are detailed in this chapter. The design and systemic aspects are considered below.
9.1 Statistical Infrastructure and Role of DESME
The statistical system in Sikkim is operated by the State Statistical Cadre of about 180 officials.
The Department of Economics, Statistics and Monitoring & Evaluation (DESME), the most
important among other departments has about 40 officials. The remaining officials of the Cadre are
in statistical cells of various departments Forest, Animal Husbandry, Health, Education, and
Welfare and so on. The Departments of Agriculture, Rural Development, Police and Land
Revenue have no statistical cells. The ministries of Agriculture, Industry, Health and Education
collect, compile and release data concerning their subjects through their publications.
Role of DESME
The main activities of DESME are:
a. to conduct the State sample component of sample surveys organized by NSSO annually.
b. to collect prices from specified retail shops and compute Consumer Price Index for
Industrial Workers (CPIIW) for the urban sector and to release CPIIW and monthly price
bulletins.

ADB TA No. 4297-IND, Final Report
Capacity Building For Fiscal Reforms in Sikkim
148
c. to prepare estimates of State Domestic Product (SDP), commonly known as State income
and publish the same from time to time in the publication `State Domestic Product in
Sikkim‟.
Besides the above, it has the responsibility of ad hoc surveys and censuses for example, the
Economic Census or the Economic Survey. Since the upgradation of the erstwhile Directorate to a
Department, DESME has been supervising and handling the jobs of monitoring & evaluation work
of all government departments It has an implicit role of coordination with the statistical cells in
various departments and compilation of data for publication of reports like Statistical Profile of
Sikkim, arranging training programmes for the statistical cadre and responsibility of administering
District Statistical Offices for collection and compilation of data useful for DESME as well as
other departments, carrying out budget analysis and so on.
The DESME has as mentioned above, about 40 officials from the statistical cadre to do justice to
the responsibilities noted above. The UNDP has immediate plans to strengthen the overall
statistical system of Sikkim. Further, under the World Bank Project of `Modernization of
Statistical Systems‟ of all States, the Ministry of Statistics & Programme Implementation, GOI
have entrusted the study for Sikkim, Assam, Arunachal Pradesh and Meghalaya to JPS Associates,
the members of which were at DESME recently during 5-19 June. It is therefore, not the intention
of this team to go into the issue of strengthening of DESME. But a few suggestions in the light of
the lacunae observed in the statistical system and the working of DESME are noted below.
a. Need for a Review of the Cadre
Since long, no direct recruits have been inducted into the Sikkim State Statistical Cadre. The
officials promoted to the posts of Assistant Directors and Deputy Directors do not have the
requisite qualification in Statistics or Economics. The policy to cut down on the redundant staff is
justified but the introduction of the adjunct of Monitoring & Evaluation has come up with a
number of new posts that are filled up by promoting the officials and not recruiting duly qualified
candidates. The quality of the work in the long run will suffer. Moreover, lateral transfers while
continuing with the old functions of erstwhile divisions lead to inefficiency. The cadre officials in
statistical cells of departments other than DESME by and large, deal with non-statistical work like
correspondence, file dealings, progress reports; the statistical work stops with compilation. The
result is that they hardly have the feel of the data transmitted by them; the analysis of the data is
done by the heads of the departments. By and large, analytical faculty is not the forte of DESME
or perhaps other departments. As such it may be difficult to find a department that could take up
the poverty studies, one of the preoccupations of the Sikkim Government. The nature of work done
by the cadre officials needs to be reviewed and measures taken to enhance their knowledge of not

ADB TA No. 4297-IND, Final Report
Capacity Building For Fiscal Reforms in Sikkim
149
only basic statistics but also of applied statistical techniques. The scenario does emphasize
induction of direct recruits.
b. DESME- Evaluation and Suggestions
With the quantum of ancillary work perhaps exceeding the load of the units dealing with three
main activities mentioned above, there is the inevitable siphoning of the staff attached to these
units to the detriment of work either not done at all or not completed on time. In fact, the work of
units like National Sample Survey (NSS), State Income and Prices need to be monitored closely.
There should be Action Plans to be formulated at the beginning of each financial year; the Director
may convene meetings at regular intervals to monitor the progress and should ensure that each of
these units have a core strength of staff not to be disturbed for other work. No wonder the State
sample data never got processed, there being no accountability. If the staff are utilized for all and
sundry work, the focus gets lost. If the data collected are not processed, the morale of the field
staff is affected which in turn affects quality. A dynamic leadership is what is needed to motivate
the cadre officials. For example, the Director should take some time off from his administrative
responsibilities to provide technical input and look into the statistical work going on in the three
main sections. While planning all items of work with an eye on the available staff he should also
prod on the officers to take up analytical studies and for this purpose the library should also be
brought in shape from the present chaotic condition.
Immediate Steps
i) Following the example of manual tabulation of 6oth round Household Consumer
Expenditure Survey (HCES), set in the recently concluded training course on poverty
estimation, the multipliers calculated may be used to bring out all the tables from 60th
round HCES of State sample of NSS. The tabulation for other rounds may be taken up
in a well drawn up plan. These items of work may be monitored. Officers of DPD,
Kolkata may be invited for a thorough training in software package for HCES
tabulation.
ii) Efforts may be initiated to compute consumer price index for the total rural sector with
2000 as base year. Steps may be taken up to send capable officers to Labour Bureau,
Shimla for a thorough training in their methodology.
iii) The library is in shambles and needs to be set in order. A librarian may be appointed
to take care of documentation of the existing material.
iv) A plan may be drawn up to carry out the training programmes noted in the next
section . For this purpose, efforts may be made to find out the reputed institutes
imparting such training, in particular for officers.

ADB TA No. 4297-IND, Final Report
Capacity Building For Fiscal Reforms in Sikkim
150
c. Training should have a purpose
The purpose of a training programme is to benefit the department in areas it is deficient. It is
therefore, necessary that the list of trainees be drawn up with a foresight to include those who after
training would form the asset. The list of trainees for the course on poverty estimation was drawn
up with hardly any consideration to the qualifications, mental aptitude or their capability to handle
future poverty studies for which they were supposed to be trained. There was a wide gap between
the administrative, clerical or barely statistical work they were engaged and the core subject of
training. Even the qualified trainees had their faculties rusted, some with an attitude to view the
training period as duration off from their dull, stereotyped work. It‟s therefore, the system to be
blamed. How could the whole of DESME staff sent to collect data for Economic Census? A
planned approach would have been to recruit and train enumerators out of funds allocated for
Economic Census well in advance The DESME withdrew the staff listed for training in poverty
estimation either for work on State income or for evaluation or to the field for Economic Census,
thereby depriving the department to have the benefit of a specialized course. Instead of motivating
the staff, such a step is retrograde and the officials in future would not take seriously any training.
Training Measures
i) Training for primary staff:
This may include basic statistics like measures of central tendency and dispersion,
probability distributions, index numbers, NSS surveys, scrutiny of schedules,
preparation of factors of multipliers, primary checks during data processing and so on.
ii) Training for Statistical Officers and Assistant Directors:
This may include a snapshot view of topics in i) and basic knowledge of computers so
as to make them computer literate, as also well versed in validation of data and able to
write short programmes
iii) Orientation Course for Senior Officers
This may include a compressed course on official statistics, sampling theory and
applications, report writing and computer processing of data.
The above three courses may be parts of an in-service training programme to be monitored by the
Director of DESME so that through rotation all members of the statistical cadre are trained over a
stipulated period of time.
9.2 Household Consumer Expenditure Surveys (HCES) and Poverty Estimation5
5 Poverty estimation is done to ascertain the number and location of the poor for say, emergency food
supplies or wage employment programmes and identification of beneficiaries for implementation of anti-
poverty programmes. Poverty estimates help the State level administrations and planners to measure the

ADB TA No. 4297-IND, Final Report
Capacity Building For Fiscal Reforms in Sikkim
151
Household consumer expenditure surveys (HCES) form the most important constituent in the
multi-subject socio-economic enquiries taken up every round of survey since the inception of NSS.
Among other uses, the HCES provides the most crucial input for poverty estimation. To be more
specific, information on quantities of food items consumed and total consumer expenditure are
used to derive average per capita calorie consumption for different groups of pre-specified per
capita total consumer expenditure, the tabulation that ultimately leads to determining the poor
though it may be noted that the NSSO does not estimate the poverty ratio. It is the Planning
Commission (PC) that brings out the poverty ratio for different States. Sikkim does not have a
poverty line of its own. For reasons elaborated later, the PC uses the poverty ratio of Assam for
calculating the poverty estimate for Sikkim.
9.2.1 The NSSO Methodology for HCES
The Survey Design & Research Division (SDRD) of the NSSO lays down the sampling design for
a particular round of survey. The annual rounds of HCES are interspersed with quinquennial
rounds with larger sample size. In these quinquennial rounds, the employment-unemployment
schedule is also canvassed in the same set of sample villages or urban blocks where HCES is
conducted. A two stage sampling design is adopted with provision for sub-stratification at the
second stage. The sampling frames of villages and urban blocks are maintained and updated by
SDRD at Kolkata. The samples for the rural and urban sectors are selected by the SDRD for all the
States.
The sampling design is universal in its application whether the state is big or small. The total
sample is drawn in the form of two samples: Central and State. The Field Operations Division
(FOD) of NSSO collect the data in respect of the Central sample while the respective staff of the
States collect data for the State sample. Before a survey is launched a Central Training Conference
is organized by the NSSO in which there are participants from the States too. The States again,
participate in the Regional Training Conferences. During the conduct of the survey, the States are
required to send Monthly Progress Report to the Headquarters of NSSO, FOD.
impact of the development programmes undertaken and to monitor the performance and progress of specific
programmes launched to eradicate poverty.
In the absence of a reliable poverty ratio, it would be difficult for the State to mobilize the resources
avaibale from the Centre and its own for poverty alleviation. It would be difficult to identify the target
population that is, the villages, the communities and the households for designing appropriate strategies and
also to monitor and evaluate the progress.
One of the most important considerations of obtaining a reliable poverty estimate from the
viewpoint of the State Government is that the poverty ratio is applied in allocation of central assistance to
States not only under various anti-poverty programmes but also under several developmental or social
security programmes. A reduced number of poor means a lower allocation.

ADB TA No. 4297-IND, Final Report
Capacity Building For Fiscal Reforms in Sikkim
152
State Sample
Supervision of field- work is State‟s concern and obviously the quality of state sample data
depends upon the effectiveness of supervision. The SDRD forwards a Scrutiny Programme to the
States and a minimum quota of schedules is to be checked thoroughly by the District Field Office
of the States before forwarding the schedules to their Headquarters. It is only at the data entry
phase that the link between NSS authorities of the States and NSSO is again established when data
entry layouts are forwarded by the Data Processing Division (DPD) to the States for transcription
of data. A validation software package is also sent by the DPD so that error free data are sent for
tabulation by the DPD.
Some major States are presumably doing all these exercises by themselves. For Sikkim the
dependence on the DPD is total. Discussions with the officials of DESME reveal that even though
Sikkim is participating on a matching basis since 38th round (1983) not a single round data on
HCES has been processed to facilitate the preparation of a report. The reasons for such a
lackadaisical approach could be the lesser priority given to the NSS work in preference to ad hoc
surveys and /or work relating to state income and price statistics. Other reasons could be the poor
quality of data emanating from the field in absence of effective supervision and resultant lack of
motivation. There was hardly any awareness of the importance of the 61st round, being a
quinquennial one with a larger sample size. Many of the 55th round reports are not found in the
library. The issue is more of awareness of the mine of information left untouched than of
strengthening the data base. The former could perhaps take care of the latter.
9.2.2 Steps for Improvement
i) Immediate steps may be taken to enforce a three-tier scrutiny of the schedules,
namely, at the field level, district level and the DESME headquarters so that fewer
errors are found during data entry stage.
ii) Attempts to clear the backlog may start with the 55th round (1999-2000), a
quinquennial round. For this purpose, the DPD may be approached for guidance in
transcription, validation and tabulation. If required, specially qualified staff may
be deployed. This will lead to the strengthening of local capacity.
iii) Gradually capacity building may be extended to tabulation and multiplier
calculation. This would imply deployment of a system analyst cum programmer
who can write programmes and generate tables according to the
tabulation layout.
iv) Central sample results of HCES for all the quinquennial rounds for Sikkim be
compiled and analysed by senior officers of the statistical cadre to see the trends if
any, in consumption pattern over time and generate interest in analysis.

ADB TA No. 4297-IND, Final Report
Capacity Building For Fiscal Reforms in Sikkim
153
Till the time in-house capability of the computer cell is enhanced, efforts may be made to get the
State sample data processed and tabulated at the DPD, Kolkata and for this purpose the Chief
Executive Officer, NSSO may be approached. Alternatively, since the sample size in terms of
households is a little more than 1000, the data after scrutiny may be transcribed on Excel sheet
with sample households as rows and items as columns. Multipliers at the sample village x second
stage level may be calculated at DESME instead of looking forward to DPD. A beginning has been
made in the recently concluded training course on poverty estimation when the data of 60th round
were manually tabulated by the trainees and data entered on the computer and with the help of Sch
0.0, the multipliers were calculated.
9.2.3 Exercises on Poverty Estimation
Discussions with the Departments of Planning & Development, Rural Development and Food &
Supplies reveal that a multiplicity of exercises on poverty is in process, each exercise involving
house to house visit in an attempt to identify people Below Poverty Line (BPL). For example, the
Economic Survey, 1999-2000 was undertaken to identify people below poverty line to be
completed within 100 days, deploying 1000 enumerators and 300 supervisors, requisitioning the
services of all the ministerial staff and field staff in various departments. The study was however,
abandoned. The Rural Development Department in Sikkim uses the guidelines given by the
Ministry of Rural Development, Govt. of India for identifying the people below poverty line. The
Food & Civil Supplies Department have a set of criteria for selection of BPL beneficiaries for PDS
items through Panchayat Wards, convening the Gram Sabha, assigning a maximum limit of BPL
beneficiaries for Gram Panchayat Unit
9.2.4 HCES & Poverty Estimation
a) The T.O.R suggests training of concerned officials of the DESME for conducting HCES in
line with the NSSO methodology to get a reliable poverty profile. One of the important
considerations of obtaining a reliable poverty estimate, apart from monitoring the progress
due to anti-alleviation programmes, is that the poverty ratio is applied by PC to allocation
of central assistance to the States and hence the importance of the Official method of
poverty estimation. While the Official method comprises anchoring the absolute poverty
line in the normative minimum calorie-intake (TF methodology), any preliminary estimate
obtained should be compatible and within acceptable limits of the official estimates. The
TF methodology, in brief is first to determine calorie requirement norm taking into
account age, sex, occupational structure of the population based on the ICMR
recommendations for the base year and then the expenditure level of households required
to meet the normative calorie requirement that is, translating nutritional requirement into

ADB TA No. 4297-IND, Final Report
Capacity Building For Fiscal Reforms in Sikkim
154
its monetary equivalent to obtain the poverty line. The table providing information on
average quantities of food items consumed per capita as well as average total per capita
total consumer expenditure grouped by monthly per capita expenditure is pivotal for the
Official method of poverty estimation so far as HCES is concerned. The average per capita
quantities of food consumed within each MPCE group are converted into calories using
standard conversion factors.
If the State sample is processed and combined with the Central sample, there is no need to go for a
fresh survey on the lines of NSSO for poverty estimates. The combined sample would in all
likelihood give reliable estimates at the District level. On all counts, the year 1999-2000 that also
coincides with the 55th round would be suitable as the base year. Given the weighting diagram, the
ICMR norms may be considered to arrive at the overall average calorie requirement norm per day
for Sikkim. The results for Sikkim from the combined Central and State samples of HCES may be
used for determining the monetary equivalent of the average calorie requirement norm per day.
This would be the poverty line for Sikkim.
9.3 Problems and Issues relating to Poverty Estimation for Sikkim
Three issues among many stand apart:
1. Official documents present the number of poor in Sikkim using the Head Count Ratio of
Assam. Sikkim does not have a poverty line of its own.
2. The size distributions pertaining to HCES, crucial for poverty estimation based on the
Central sample are to be used while if it were possible to process the State sample in
tandem with the Central sample, the results based on the pooled sample would be far more
reliable. For instance, the 55th round Central sample results on average calorie intake does
not exhibit the monotonic increasing relationship with the monthly per capita consumer
expenditure. If it were possible to arrive at the minimum calorie norm for Sikkim, it is not
possible to determine the poverty line from the Central sample size distribution. The State
sample results if available would have enlightened this issue.
3. The rural sector accounts for 90% of the total population of Sikkim, yet there is no cost of
living index for the rural sector. The fact is that for price collection there are ten retail
shops in the rural sector and four in the urban. While the prices for four in the urban sector
are utilized along with the weighting diagram to compute Consumer Price Index number
for industrial workers, the rural retail prices are combined with urban prices to bring out
average commodity prices in the monthly price bulletins for Sikkim. If hypothetically,
poverty line for the rural sector is determined for any base year say, 1999-2000, the
poverty line cannot be forwarded and updated because of absence of deflators.
.
ADB TA No. 4297-IND, Final Report
Capacity Building For Fiscal Reforms in Sikkim
155
9.4 Plan for Poverty Estimation
The year 1999-2000, coinciding with the NSS quinquennial 55th round, based on a large sample
may be taken as the base year for estimating poverty line and poverty ratio for rural and urban
sectors of Sikkim. The following are the exercises to be done.
Derivation of Average Calorie-Intake for Sikkim
The Task Force methodology may be adopted. The sources of data to be culled and the method of
computation are given below:
a. Population Census, 2001, if population projections for age x sex distributions are not
available
b. Age-specific-worker-population (ASWPR) from 55th round Employment &
Unemployment Survey of NSS.
c. Percentage distribution of main workers (15 +) by industrial division from Population
Census 1991 (as the same for 2001 Census would not be available)
d. From a priori classification of industrial divisions according to heavy, moderate and
sedentary, obtain sex wise workers according to activity and sex wise non-workers so as to
conform to ICMR classification for calorie-norms
e. Obtain the percentage distribution separately for rural and urban sectors of the population
classified as above. These will be the weighting diagrams The weighted average that is,
multiplying the calorie norms with the corresponding weights and summing up and
dividing by 100, the respective average calorie-intakes for rural and urban will be
obtained.
It may be noted that the calorie norms obtained could be in the proximity of all India norms
prescribed by TF but the fact to taken into account is that over time there has been a decline in
average calorie-intake. This means that some adjustment would be needed for use in determining
poverty line from the NSS table discussed later.
Average per capita calorie intake by MPCE classes
a. Compile the Central Sample results, in particular the Sikkim size distributions of number
of persons and average per capita calorie-intake by MPCE classes from NSS reports for all
the quinquennial rounds and see whether there is an increasing trend of calorie-intake and
MPCE.
b. The latest quinquennial round is 61st (2004-05) for which the NSSO would take time to
process and publish the distribution mentioned above. Nevertheless, the job for State
sample may be taken up. Besides, the data of 55th round for the State sample should be
processed and the distributions of Central and State samples compared. The NSSO may be

ADB TA No. 4297-IND, Final Report
Capacity Building For Fiscal Reforms in Sikkim
156
approached for raw data of the Central sample so that the two samples may be pooled to
have double the sample size.
It may be noted that the above requirements are specific to poverty estimation and the various
other revealing socio-economic aspects are left out. While the former tabulation could be done on
Excel sheets, for the latter, the software package of DPD, Kolkata is to be used and for which
intensive training of the computer personnel would be needed.
9.5 Derivation of Poverty Line
The average calorie intakes corresponding to the poverty lines (furnished by Planning
Commission) for major States could be computed from the Report on Nutrition Intake, released by
NSSO for 55th round. The only state in the vicinity of Sikkim is Assam. If CA is the calorie intake
corresponding to the poverty line say, for rural Assam, the adjusted calorie norm for rural Sikkim
that is, CS may be calculated as
CS = (CA* CN /2400)
where CN is the average calorie norm arrived at by the exercise mentioned at (a) to (e) above. CS
may be used for determining the poverty line for Sikkim from the NSS size distribution, if CN is
significantly different from 2400, otherwise CA itself may be used.
Price Statistics
If the issue of pooling the Central and State samples is problematic, the issue of forwarding and
updating the poverty line obtained for base year requires systemic changes. As mentioned earlier,
rural price collection apparatus does exist since long but the data collected are used only for
bringing out price bulletins for combined rural and urban sectors. Neither there is consumer price
index numbers for any segment nor there is for the sector as a whole. It is a far cry from the
separate indices for four broad groups used by the Expert Group for updating the poverty line. The
following exercises are suggested:
1. Obtain the weighting diagrams for both rural and urban sectors from the 55th round HCES
if not for different commodities then for suitable groups of commodities. Since the State
sample data are not processed, the relevant NSS reports based on Central sample may be
consulted for use.
2. Retrieve the price data for different commodities collected from 10 rural retail shops for
the years 2000 onwards and obtain the price relatives taking January 2000 as base by
averaging the ten figures. The commodities may be divided into four groups a) food b)
fuel & light (c) clothing & footwear d) miscellaneous. Using the weights for the
commodities in these groups and the price relatives, obtain separate index for each group
with base year 2000 as 100

ADB TA No. 4297-IND, Final Report
Capacity Building For Fiscal Reforms in Sikkim
157
3. From the NSS size distribution of 55th round take a few size classes of MPCE around the
poverty line obtained earlier, a few below and a few above. Calculate the total expenditure
in each of these classes on seventeen groups of items say, cereals and products; pulses and
products; oils and fats; meat, fish and eggs; condiments and spices; fruits and vegetables;
other food; pan, supari, tobacco& intoxicants; fuel &light; housing; clothing, bedding &
footwear; medical care; education, recreation and amusement; transport & communication;
personal care and effects; other non-food. The groups are only illustrative and may be
changed suitably for rural and urban areas. Add up the total expenditure for the selected
classes to arrive at the total expenditure for each commodity group. Derive the percentage
distribution with total expenditure as 100. The weights for the four groups may be
obtained from this distribution.
4. The overall weighted consumer price index may be obtained by using the above weights
and separate group indices. These will be the consumer price indices for the middle
population of Sikkim that is, the CPIMR and the CPIMU respectively with base as 2000.
The poverty lines for rural and urban sectors as in the base year will be adjusted for prices
on the basis of CPIMR and CPIMU.
It is suggested that a select few officials of the statistical cadre may be sent to the Labour Bureau
(LB), Shimla for a thorough training in the LB methodology adopted for consumer price index
numbers. It may also be explored whether the LB network may be extended to Sikkim.
Alternative to HCES, NSS
In a situation where the present status relating to process the State sample of HCES of NSS shows
no sign of improvement, an expedient measure could be to launch an independent survey
purported to estimate poverty, given the threshold of minimum calorie-intake.
Sample Design
The sample survey may have a total sample size of the present Central and State samples in terms
of first stage units (fsu‟s). The design should be a stratified two stage one with the villages as usual
as fsu‟s and households as second stage units (ssu‟s). This means compared to 92 villages and 20
urban blocks surveyed for the State sample, the proposed survey would cover 184 villages and 40
urban blocks.
It‟s at the stage of selection of fsu‟s, we can think of a departure from the sample design of NSS.
The pps selection of fsu‟s results in selection of large villages which account for 45% of the total
sample. As a sequel, hamlet formation is needed in a big way sowing the seeds of non-sampling

ADB TA No. 4297-IND, Final Report
Capacity Building For Fiscal Reforms in Sikkim
158
errors by giving the latitude to investigators to select hamlets with low population content in a
situation where supervision is lax and the hilly terrain discourages both the investigator and the
supervisor to do justice to the job of hamlet formation. The pps sampling is no doubt efficient
compared to other methods of selection but the relative efficiency is accompanied by an unknown
component of non-sampling error. A systematic sample after arranging the villages in the frame
according to ascending order of the size of the village would be easy for the investigators and the
number of villages requiring hamlet formation would be less, though the design is less efficient.
The second departure from the NSS sample design pertains to the second stage stratification
purported to be simpler. Since it is a dichotomy aimed to divide the households in the sample
village into poor and non-poor, two-fold criteria of below cut-off MPCE of Rs.550 for rural and
Rs.650 for urban and possession of BPL card would qualify a household as poor. Ten households
to be sampled may be allocated as eight from the poor and two from the non-poor and may be
selected circular systematically from the two second- stage strata. As the design is not self-
weighting, no cumbrous procedure regarding allocating of shortfalls in sample size of the second
stage strata is suggested.
Schedule for canvassing
The schedule may be modeled on the basis of NSS Sch 1.0 but to be limited to the items needed
for poverty estimation or in other words, an abridged version of Sch 1.0 may be used. The listing
Schedule 0.0 (NSS) has to be suitably modified.
Survey Duration and Reference period
The survey should be completed within three months and it may preferably be undertaken during
September - November. The total sample is to be divided into two sub-samples. Both the sub-
samples are to be launched concurrently. A reference period of 30 days preceding the date of
survey may be adopted for food items and 365 days for consumer durables in line with NSSO
methodology. Two reference periods of 7 days and 30 days should not be used.
Training Manual & Training of Field Staff
Comprehensive instructions for filling up of schedule are to be given. The concepts and definitions
should be the same as that of the NSS. There should be an intensive training for the investigators
and supervisors before launching the proposed survey. The training should be conducted under
the supervision of senior officers technically well versed in survey methodology.

ADB TA No. 4297-IND, Final Report
Capacity Building For Fiscal Reforms in Sikkim
159
Thin sample for checks on Quantity Estimates
A thin sample from the 184 sample villages and 40 urban blocks, mentioned earlier may be
devoted to checks on quantity estimates of food items through diary method.
Workload & Investigator Requirements
The total sample of 224 sample villages and urban blocks would be distributed to districts in
proportion to population. It would be something like 20, 60, 60 and 84 for north, west, south and
east respectively. It is estimated that for completion of listing of households, selection of sample
households and collection of information from ten sample households of the sample village/ urban
block would require 6.5 days for an investigator. Taking into account the supervision and the work
relating to thin sample and the survey duration of three months, 22 investigators and eight
supervisors would be required. The break up would be like 2, 6, 6 and 8 investigators for north,
west, south and east districts respectively. The allocation of supervisors would be 1, 2, 2 and 3 for
the districts in the same order.
Cost of the Survey
The different stages of planning (collection of frame, selection of samples, questionnaire
designing, printing of schedules and recruitment of field staff, writing of instruction manual),
training of field staff, actual conduct of the survey, field checks and data entry, validation and
generation of final tables and analysis would entail a cost of about Rs.18 lakhs.
9.6 Report on ‘Training Program of Officials of the Sikkim Statistical Services’
I. Training on `The NSSO Methodology of Household Consumer Expenditure Survey
(HCES), Sampling Techniques and State Income & Related Aggregates’
As a part of capacity building in the Government of Sikkim, the first capsule of the training of
concerned officials of the Sikkim Statistical Service on „The NSSO methodology of household
consumer expenditure survey (HCES), sampling techniques and State Income & related
aggregates‟ was undertaken during 2-15 March, 2005. Ninety participants of the Statistical Cadre
working in the Department of Economics & Statistics and Monitoring & Evaluation (DESME)
and in the Departments of Human Resources & Development, Health Care, Human Services &
Family Welfare, Transport, Irrigation and Flood Control, Forest, Environment & Wildlife, Animal
Husbandry & Veterinary Services, Food & Civil Supplies, Social Welfare, Social Justice,
Empowerment & Welfare and Co-operatives attended the lectures under the Training Programme
which also included Practical Workshops intermittently
9.6.1 Curriculum for Survey Methodology:
Topic 1: HCES – a brief review

ADB TA No. 4297-IND, Final Report
Capacity Building For Fiscal Reforms in Sikkim
160
Background, the NSS consumer expenditure survey, scope and coverage,
participation of states, source concepts, usefulness of HCES data for poverty
studies
Topic 2: Survey Methodology – A general outline Planning of Survey – Formulation of
objectives, population to be studied, sampling frame, itemization of information
to be collected, concepts & definitions, methods of collecting information, survey
period and reference period, choice of sample design, questionnaire designing,
integrated household surveys, multi subject vs uni-subject surveys, errors in
surveys.
Topic 3: Introduction to Sampling - Need for information, sampling versus complete
enumeration, sampling and non-sampling errors subjective methods of sampling –
purposive, quota and haphazard methods.
Objective method - Probability sampling: basic concepts and definitions –
elementary unit, population, parameter, sampling unit, sampling frame, random
sample, „statistic‟, estimator, estimate, sampling distribution, standard error, bias,
sampling variance, mean square error, accuracy, precision reliability and validity,
confidence interval use of Random Sampling Numbers.
Topic 4: Basic Sampling Schemes - Simple random sampling with replacement and
without replacement, estimation of population parameters and variance. Relative
efficiency of SRSWR and SRSWOR, size of the sample
Systematic sampling – linear (lss) and circular (css), advantages of systematic
sampling, main disadvantages, estimation of population parameters
Probability Proportional to Size (PPS) selection procedure – cumulative method
and Lahiri‟s method.
PPS systematic sampling
Selection procedure. Advantage
Estimation of population parameters in pps
Topic 5: Some important techniques for drawing samples and Estimation -
Use of supplementary information, stratified sampling – situations that call for
stratification, allocation of sample to strata - proportional allocation and optimum
allocation, relative efficiency stratified srswr – estimation of population total and

ADB TA No. 4297-IND, Final Report
Capacity Building For Fiscal Reforms in Sikkim
161
population mean, cluster sampling - estimation of population parameters and the
variance.
Multi stage sampling – selection procedure, relative efficiency compared to cluster
sampling, the variance function and the cost function.
The above curriculam was designed to provide the basics of sampling and
household surveys with particular reference to HCES in view of the „reliable
poverty profile‟ sought by the Sikkim Government. At the expense of some
digression, the thrust of the first part of the training was to make the trainees
understand how the sampling process scores over the complete enumeration and
why a particular choice of sample design is adopted given the cost restraint and
how the errors are controlled. Reliability of results is not achieved if a particular
survey is planned in haste with deployment of raw investigators.
II. Training on `Concept & Measurement of Poverty and Issues relating to Poverty
Estimation for Sikkim’
The second part of the training programme on `Concept & Measurement of Poverty and Issues
relating to Poverty Estimation for Sikkim’ scheduled to be held in April 2005 was conducted
during 13- 24 June, 2005 because the trainees were busy with collection of data in respect of the
Economic Census. Twenty two participants out of the thirty earmarked for the training attended
the course. The representation from the different departments is as shown below:
Department No. of Trainees
1. Directorate of Economics & Statistics and 1
Monitoring & Evaluation
2. Forest, Environment & Wildlife Management 5
3. Health and Family Welfare 5
4. Irrigation 1
5. State Nationalised Transport 2
6. Women & Child Development 2
7. Human Resources Development 3
8. Cooperation 1
9. Social Justice, Empowerment & Welfare 1
10. Roads & Bridges 1
9.6.2 Curriculum for Poverty Estimation
Topic 1 : Need for estimating poverty
Topic 2 : Concept of Poverty

ADB TA No. 4297-IND, Final Report
Capacity Building For Fiscal Reforms in Sikkim
162
Necessities vs. Basic Human Needs, Conceptualisation of Basic Human Needs,
Absolute and Relative Poverty, Specification of norms
Topic 3 : The Operational Norm- the Indian Context
Two approaches i) Minimum Normative Food Basket ii) Minimum calorie- intake
as anchoring input for minimum living standard
Topic 4 : The Task Force Methodology
Derivation of the age x sex x activity weighting diagrams for rural and urban
sectors, average calorie-intake from weighting diagram and ICMR calorie
norms, use of HCES size distributions of per capita calorie intake by MPCE
classes for derivation of national poverty line;; inadequacies of TF methodology
Topic 5 : The Expert Group Method
Improvements over TF method, Acceptance of TF national poverty lines, use of
appropriate deflators; use of cost of living indices for forwarding the poverty line
separately for rural and urban sectors, introduction of cost of living indices for
people around poverty line; state-specific consumer price indices and inter-state
price differential for calculating state specific poverty lines. Poverty Ratio
Topic 6: Measurement of Poverty
Head Count Ratio and its limitations; Poverty Gap Index, its merit of assessing the
depth of poverty but the disadvantage of not measuring the inequality among the
poor; Sen‟s Measure, its ability to measure prevalence, depth of poverty and
inequality in income distribution of the poor and finally the generalized
decomposable FGT measure, similarity with Sen‟s measure.
Topic 7 : Problems & Issues of poverty estimation for Sikkim
Gaps in price statistics: consumer price indices for rural sector as a whole and for
different segments of population not available; NSS State sample of HCES not
processed and hence pooling with the Central sample not possible for getting
reliable relevant data for determining poverty line for Sikkim; Assam‟s poverty
ratio used for Sikkim for estimating poverty for the state; appraisal of official
poverty ratios and Dubey-Gangopadhyay estimates; implications of proxy
estimation, considering size distributions of Assam, Sikkim and Manipur. Trend in
official poverty ratio for major States and adjustments done by researchers; Trend
in average calorie-intake.
Topic 8 : Manual Tabulation of State Sample HCES data of 60th round (2003-04) &
Multiplier Calculation
Layout for copying relevant items of information from schedule 1.0 for obtaining
size distribution necessary for poverty estimation and factors of multiplier from

ADB TA No. 4297-IND, Final Report
Capacity Building For Fiscal Reforms in Sikkim
163
schedule 0.0. Data entry on Excel sheets district- wise; standard conversion factors
in terms of calorie for food items entered along side quantity estimates and
multipliers; illustration of estimation procedure.
The job was undertaken by the trainees and completed within 3-4 days, alongside theoretical
classes. A select few entered the data on computer.
The curriculum was designed to familiarize the trainees with the rudiments of concept and
measurement of poverty. The focus was on the exposition of the official method adopted by the
Planning Commission, followed by the implications of proxy estimation and the reasons why
Sikkim even after decades does not have a poverty line. One of the disheartening features is the
collect-but-don‟t-process syndrome affecting the State sample surveys carried out for years. The
purpose of getting 60th round data copied and entered on Excel sheets by the trainees and getting
the multipliers calculated was to demonstrate that the DESME need not look forward to the DPD,
Kolkata for a job that can be done in their office. The myth of multipliers is blown up. How can
the SDRD, Kolkata compute the multipliers when the listing schedules 0.0 providing the main
factors for multipliers are with DESME?
There was a disproportionately large representation from a few departments for the training while
all the DESME trainees were siphoned off (during mid-session, one was sent).
9.7 State Income, Capital Formation and Saving6
6 Annual estimates of State income or National income can be prepared by Production approach as a
difference of value of output less value of inputs or Income approach as a sum of compensation of
employees plus operating surplus or Expenditure Approach as a sum of –
(a) Private Final Consumption Expenditure
(b) Government Final Consumption Expenditure and
(c) Capital Expenditure on fixed assets plus increase in stock of goods and raw materials.
The capital expenditure incurred on fixed assets and increase in the value of stock of goods and raw
materials is termed as a capital formation. Thus capital formation during the year is that part of the State
income which is used for creation of physical assets in the form of buildings, roads and bridges, irrigation
dams, laying of pipeline for water, sanitation etc. and other construction works; machinery and equipment
including transport vehicles as well as breeding livestock, dairy cattle, drought animals used for production
of milk and meat and other products, ploughing of fields, transportation etc., and increase in the value of
stock of goods and raw materials not consumed or used in the creation of physical assets during the year.
The estimates of capital formation accumulated over the lifespan of the assets gives the capital
stock of State, i.e., the wealth of the State at a point of time say 1st April 2005 which is used for further
production of goods and services. Thus the estimates of capital formation at state level provide an indicator
of the magnitude and growth of productive potential of the State economy. The State income for a particular
year is directly proportional to the labour and capital used for production. Capital formation during the year
divided by the State income is a measure of the rate of capital formation. The rate of capital formation for a
particular State for a year or over the period of time can be compared with the rate similar rate of other states
as well as at the national level.
Saving represents the excess of current receipts over the current expenditure of the enterprises
engaged in the production of goods and services and for the households it is the excess of current income

ADB TA No. 4297-IND, Final Report
Capacity Building For Fiscal Reforms in Sikkim
164
State Domestic Product commonly known as State Income is an overall indicator of the State
economy. The estimates of SDP are prepared annually by the State Income Unit (SIU) of the
Department of Economics and Statistics, Monitoring and Evaluation (DESME), Government of
Sikkim. The estimates of SDP are prepared at the gross/net levels i.e. Gross Domestic Product/Net
Domestic Product both at current and constant prices from 1980-81 onwards. These estimates from
1980-81 to 1993-94 are available at current and constant (1980-81) prices as per the old series.
These estimates as per the new series with base 1993-94 are available from 1993-94 to 2003-04 at
current prices and from 1993-94 to 2001-02 at constant (1993-94) prices. Theses estimates are
published from time to time in the publication „State Domestic Product of Sikkim‟. The third issue
of this publication was brought out in 2001 at the time of finalization of the estimates as per new
series with base 1993-94. The publication contains the estimates as per new series from 1993-94 to
1999-2000 at current and constant (1993-94) prices. The publication also contains the estimates
from 1980-81 to 1992-93 as per old series at current and constant (1980-81) prices. These
estimates are made available to the Central Statistical Organization (CSO), Ministry of Statistics
and Programme Implementation, Government of India and other organization for their use.
The estimates of saving and capital formation are not being compiled by the SIU. Some of the
states are compiling the estimates of gross fixed capital formation by industry of use on an annual
basis. Realizing the importance of the estimates of saving and capital formation the present Project
in the Terms of Reference provides for preparation of the Manuals for estimating saving and
capital formation for Sikkim so that regular work in this regards may be initiated by the SIU.
The SIU is headed by a Deputy Director. Currently besides the Deputy Director the SIU has one
Assistant Director, two Statistical Officers and two statistical inspectors.
9.8 Terms of Reference
Initial Terms of Reference (TOR) of the Project for State Income was to „Prepare Manuals for
estimating saving and capital formation‟.
The estimates of State Income or the state domestic product (SDP) are the foundation for the
estimates of saving and capital formation. The available estimates of SDP at the beginning of the
project showed abnormal growth since 1993-94. Preliminary review indicated that the standard
over household final consumption expenditure during the year. Thus it is that part of the State income which
is not consumed by the households or the government during the year and is equal to the capital formation
during the year. Saving by type of institutions is public sector – Government administrative departments and
Public Sector enterprises, private Corporate Sector and the households indicates the share of each of the
institutions in the saving of the State. For giving fillip to the saving the government from time to time
announces incentives for saving.

ADB TA No. 4297-IND, Final Report
Capacity Building For Fiscal Reforms in Sikkim
165
methodology recommended by the Central Statistical Organization (CSO), Ministry of Statistics
and Progamme Implementation, Government of India was not being followed appropriately in
some cases. These estimates as such were likely to be revised downward after appropriate revision.
To make the Terms of Reference in respect of State Income more effective, without any additional
cost to the project, the TOR were accordingly revised by the Expert as follows:
1. Critical review of the estimates of SDP.
2. Suggest improvements and provide training and guide the revision of the SDP estimates
both at current and constant (1993-94) prices so that these estimates are more reliable.
3. Review available data sources for estimation of saving and capital formation for Sikkim
and suggest suitable methodology for compilation of the estimates of saving and capital
formation.
In view of the above, under the present Project, the issues in respect of State Income, Saving and
Capital Formation for Sikkim are:
1. Revision of the existing estimates of State Income.
2. Methodology for Estimation of Saving for Sikkim.
3. Methodology for Estimation of Capital Formation for Sikkim.
4. Training of the officers and staff of DESM&E and other departments in
Estimation of State Income, Capital Formation and Saving.
9.9 Revision of the Estimates of State Domestic Product
Accordingly the work on the Project relating to State Income was initiated by the Expert in
DESM&E on the basis of the revised TOR. On the basis of the critical review of SDP estimates by
the Expert the revision of the estimates of SDP at current and constant prices was taken up by the
State Income Unit (SIU) of the Department of Economics and Statistics, Monitoring and
Evaluation, Government of Sikkim. This exercise has been completed by the SIU. Significant
improvements/revisions made in the SDP estimates are detailed below. The revised estimates are
likely to be more stable and reliable.
1. Agriculture:
Cultivation of plucked tea leaves has been accounted. Data for the same has been
obtained from the Sikkim Tea Board.
Government irrigation has been taken as part of agriculture.
Fallen animals have now been accounted.
Results of latest livestock census have been used.

ADB TA No. 4297-IND, Final Report
Capacity Building For Fiscal Reforms in Sikkim
166
As a result the overall estimates have been revised downward for some of the years mainly
because of the lower livestock figures.
2. Mining and Quarrying:
Data on revised inputs have been used.
Output of sand and stone was not adequately accounted as the reported figures did not
account for the total production of sand and stone. The output of sand and stone has now
been accounted adequately in proportion to the construction activity. As a result the
estimates of mining sector have been revised upward.
3. Manufacturing Un-registered:
The use of latest all-India Index of Industrial Production (IIP) and Wholesale Price
Index (WPI) has resulted in a downward revision.
4. Construction:
State-wise data on expenditure on construction for the central government non-
departmental commercial undertakings (NDCUs), departmental commercial
undertakings (DCUs) and central government offices in states are not available as their
operations are spread over many states.
For central NDCUs the Bureau of Public Enterprises, central government collects
annual data on gross block of assets. Total expenditure at national level of central
NDCUs is allocated to the states by National Accounts Division (NAD) of the Central
Statistical Organization (CSO), Ministry of Statistics and Programme Implementation,
Government of India using these data. Earlier the national level expenditure on
construction was allocated in proportion to the state-wise gross block of assets. This
procedure has lately been changed and the allocation is done in proportion to the
increase/decrease of gross block of assets during the year. Using the latest procedure
the allocated figures for Sikkim for the years 1990 onwards made available by the
NAD are erratic or negative or abnormally high and are not usable as such. The
Figures for NDCUs can be only be positive as there is no transfer of assets from the
NDCUs to other sectors. National Hydro Power Corporation (NHPC) is the main
NDCU in Sikkim. Data for Sikkim have been obtained from their office in Singtam
from 1999-00 onwards and used. This has resulted in substantial downward revision in
the SDP.

ADB TA No. 4297-IND, Final Report
Capacity Building For Fiscal Reforms in Sikkim
167
For the central government administration and central DCUs the allocated figures are
erratic and abnormally high or low. These figures have been smoothened and used.
Data from state units need to be collected annually.
For state NDCU the SIU has now taken up the analysis of their accounts and the actual
figures are proposed to be used
The estimates of rural/urban dwellings are now based on the results of the AIDIS,
1991-92.
Figures supplied by NAD for residual household construction comprising religious
and other non-profit institutions, cooperatives and corporate enterprises are erratic and
abnormally high. In consultation with the building contractors this part has been
assumed to be 20% of the household construction.
5. Electricity, Gas and Water Supply:
The downward revision is due to the use of latest data.
6. Transport:
Passenger transport by bus is operated only by the state government enterprise „State
Nationalized Transport (SNT)‟. This part was also being covered in the private sector.
This duplication has been avoided. This has resulted in a downward revision in the
estimates.
7. Public Administration:
The estimates of net state domestic product were treated as gross state domestic
product. Consumption of fixed capital (CFC) was not accounted. This has now been
accounted and the estimates have been revised upward because of CFC.
8. Other Services:
The estimates have been revised upward due to revised and latest data.
Per Capita Income:
The estimated population for1993-94 to 1998-99 has been revised downwards as a result of the use
of latest population census of 2001. The revised estimates of SDP and per capita income both at
current and constant (1993-94) prices and their growth over the years are lower than the existing
estimates. Detailed revised estimates are given in Annex 6.1.

ADB TA No. 4297-IND, Final Report
Capacity Building For Fiscal Reforms in Sikkim
168
9.10 Revised Estimates of GSDP at Current Prices
As a consequence of these revisions the revised estimates GSDP from 1993-94 to 2004-05 along
with the previous estimates are given in Statements 6.1. For 1993-94 these have been revised
upward by Rs. 15 crores and the per capita GSDP by Rs. 615. For the year 2002-03 the GSDP has
been revised downward by 62 crores and the per capita income revised downwards by Rs. 945.
However for 2003-04 the estimates of GSDP at current prices have been revised downward
marginally by Rs. 11 crores and the per capita GSDP has been revised downward by Rs. 191. .The
per capita GSDP for 2003-04 is Rs. 23595 as compared to Rs. 23786 estimated earlier. The
average growth rate of GSDP during this period at current prices has fallen marginally from 13.77
percent to 13.15 percent. Accordingly the NSDP has also been revised.
At the industry level the comparative estimates of GSDP at current prices (revised and pre-revised)
are given in Statement 6.3 for 1993-94 and 2003-04. The overall estimates for 2003-04 have been
revised downward marginally by Rs. 11 crores. But the estimates for 2003-04 at industry level
have undergone substantial revisions. GSDP for construction has gone down by Rs. 40 crores,
electricity, gas and water supply by Rs. 23 crores and transport and communication by 8 crores
whereas the estimates of public administration and other services have been revised upward by Rs.
35 crores and Rs. 15 crores respectively. The estimates at NSDP also show similar revisions.
9.11 Revised Estimates at Constant (1993-94) Prices
The estimates of SDP and per capita SDP at constant (1993-94) prices and the corresponding
growth rates have also undergone downward revisions due to use of (a) revised data at current
prices and (b) appropriate deflators/physical indicators.
For example in public administration and other services the indicator was not used properly. The
constant price estimates were prepared at the previous year prices instead of at the base year prices
of 1993-94. For example the estimates at constant prices for the year 1998-99 were prepared at
1997-98 prices instead of at the base year prices of 1993-94.
This defect has now been rectified and the current price estimates for public administration and
educational and medical services within the other services have been deflated by the Consumer
Price Index of Sikkim. This has resulted in a downward revision of the estimates of public
administration and other services at constant prices. The estimates at constant prices earlier were
prepared only up to 2001-02. The estimates at constant prices have now been worked up-to 2004-
05 as in the case of estimates at current prices. Thus the lag between the current and constant
prices has been bridged.

ADB TA No. 4297-IND, Final Report
Capacity Building For Fiscal Reforms in Sikkim
169
As a consequence of these revisions the overall estimates GSDP at constant prices of 1993-94 for
2001-02 have been revised downward by Rs. 67 crores and the per capita GSDP has been revised
downward by Rs. 1210 refer to Statement 6.1. The per capita GSDP at constant prices for 2001-02
is Rs. 11405 as compared to Rs. 12615 estimated earlier. The revised average growth rate at
constant prices for period 1993-94 to 2001-02 is 6.11 percent as compared to 8.06 percent in the
earlier estimates. For the period 1993-94 to 2004-05 the revised average growth rate at constant
prices is 6.7 percent. The NSDP at constant prices for 2001-02 has also been revised accordingly.
At the industry level the comparative estimates of GSDP at constant (1993-94) prices (revised and
pre-revised) are given in Statement 6.4 for 1993-94 and 2001-02. The overall estimates of GSDP
for 2001-02 have been revised downward by Rs. 40 crores. The estimates for 2001-02 have gone
down in respect of agriculture by Rs. 21 crores, construction by Rs. 17 crores, trade, hotels and
restaurant by Rs. 17 crores and other services by 28 crores whereas the estimates of electricity, gas
and water supply have been revised upward by Rs. 9 crores. The estimates of NSDP also show
similar revisions.
9.12 Suggestions/Recommendations
The allocation procedure used by the NAD for expenditure on construction of the central NDCUs
and DCUs and central government offices in Sikkim during the year has been lately resulting in
erratic, negative and abnormally high figures of expenditure on construction for smaller states
including Sikkim. As a result the SDP estimates of Sikkim are unduly over estimated. Following
steps need to be taken:
The NAD may be approached by the State Government to suitably change the procedure and
make available revised figures of expenditure on construction for the central NDCUs, and
revise suitably the Comparable Estimates of SDP for Sikkim, currently under
finalization by the NAD.
For reliable estimates of construction it is suggested that actual data on expenditure on
construction incurred by the units of central/state undertakings, such as NHPC, Border Road
Organization (BRO), Central Public Works Department (CPWD), etc. operating in Sikkim may be
collected annually by the SIU from their units and used for estimation of SDP from construction.
For the central government administration and central departmental commercial undertakings
(DCUs) expenditure on construction, available with the state offices of the Central Public Works
Department and Border Road Organization located at Gangtok may be collected annually by the
SIU and used.

ADB TA No. 4297-IND, Final Report
Capacity Building For Fiscal Reforms in Sikkim
170
As per the practice followed by other state DES the annual estimates of SDP both at current and
constant prices may be published annually in the form of a Brochure on State Income of Sikkim.
Table 46 COMPARATIVE STATEMENT OF REVISED AND PRE-REVISED
ESTIMATES OF GSDP OF SIKKIM
Years GSDP
(Rs. Lakhs)
Growth (%) PCI (Rs.) Growth (%) Population
(Lakhs)
R PR GSDP
(R)
GSDP
(PR)
R PR PCI
(R)
PCI
(PR)
R PR
At Current Prices
1993-94 39282 37743 9072 8457 4.33 4.46
1994-95 42798 40277 8.95 6.71 9639 8714 6.25 3.04 4.44 4.62
1995-96 50622 48130 18.28 19.50 11101 10056 15.17 15.40 4.56 4.79
1996-97 57011 55262 12.62 14.82 12156 11141 9.50 10.70 4.69 4.96
1997-98 65264 65106 14.48 17.81 13512 12644 11.16 13.49 4.83 5.15
1998-99 76474 78184 17.18 20.09 15356 14652 13.65 15.88 4.98 5.34
1999-00 83051 84003 8.60 7.44 16158 16343 5.22 11.54 5.14 5.14
2000-01 94009 97634 13.19 16.23 17671 18352 9.36 12.29 5.32 5.32
2001-02 105778 113925 12.52 16.69 19163 20639 8.44 12.46 5.52 5.52
2002-03 119873 125135 13.32 9.84 21521 22466 12.31 8.85 5.57 5.57
2003-04* 134729 135818 12.39 8.54 23595 23786 9.64 5.88 5.71 5.71
2004-
05**
150633 11.80 25749 9.13 5.85 5.85
Average growth upto 2003-04 13.15 13.77 10.07 10.96
Total average growth 13.03 13.77 9.98 10.96
At Constant Prices
1993-94 39282 37743 9072 8457 4.33 4.46
1994-95 39392 37183 0.28 -1.48 8872 8045 -2.20 -4.87 4.44 4.62
1995-96 43039 41122 9.26 10.59 9438 8592 6.38 6.80 4.56 4.79
1996-97 45647 45630 6.06 10.96 9733 9200 3.12 7.07 4.69 4.96
1997-98 49087 52002 7054 13.96 10163 10099 4.42 9.78 4.83 5.15
1998-99 52822 57983 7.61 11.50 10607 10866 4.37 7.59 4.98 5.34
1999-00 54556 59583 3.28 2.76 10614 11592 0.07 6068 5.14 5.14
2000-01 58374 64213 7.00 7.77 10973 12070 3038 4.12 5.32 5.32
2001-02 62955 69635 7.85 8.44 11405 12615 3.94 4.51 5.52 5.52
2002-03 69431 10.29 12465 9.30 5.57 5.57
2003-04* 75031 8.07 13140 5.42 5.71 5.71
2004-
05**
80056 6.70 13685 4.14 5.85 5.85
Average growth upto 2001-02 6.11 8.06 2.93 5.21
Total average growth 6.72 8.06 3.85 5.21
Note: * PROVISIONAL ESTIMATES AND ** QUICK ESTIMATES
( R) - Revised Estimates, (PR ) - Pre Revised Estimates

ADB TA No. 4297-IND, Final Report
Capacity Building For Fiscal Reforms in Sikkim
171
Table 47 COMPARATIVE STATEMENT OF REVISED AND PRE-REVISED
ESTIMATES OF NSDP OF SIKKIM
years NSDP (Rs. Lakhs)
GROWTH (%) PCI (Rs.) GROWTH (%) POPULATION (Lakhs)
R PR NSDP (
R)
NSDP ( PR)
R PR PCI ( R)
PCI (PR)
R PR
AT CURRENT PRICES
1993-94 35456 33694 8188 7550 4.33 4.46
1994-95 38312 35570 8.06 5.57 8629 7696 5.38 1.94 4.44 4.62
1995-96 45394 42620 18.48 19.82 9955 8905 15.37 15.71 4.56 4.79
1996-97 51044 49111 12.44 15.23 10884 9901 9.33 11.19 4.69 4.96
1997-98 58567 58308 14.74 18.73 12126 11324 11.41 14.37 4.83 5.15
1998-99 68974 70209 17.77 20.41 13850 13158 14.22 16.19 4.98 5.34
1999-00 74456 75818 7.95 7.99 14486 14751 4.59 12.11 5.14 5.14
2000-01 84583 88623 13.60 16.89 15899 16658 9.76 12.93 5.32 5.32
2001-02 95057 103899
12.38 17.24 17220 18822 8.31 12.99 5.52 5.52
2002-03 107615
113941
13.21 9.67 19321 20456 12.20 8.68 5.57 5.57
2003-04* 121247
123258
12.67 8.18 21234 21586 9.90 5.52 5.71 5.71
2004-05**
135736
11.95 23203 9.27 5.85 5.85
AVERAGE GROWTH UPTO 2003-04
13.13 13.97 10.05 11.16
TOTAL AVERAGE GROWTH
13.02 13.97 9.98 11.16
AT CONSTANT PRICES
1993-94 35456 33694 8188 7550 4.33 4.46
1994-95 35279 32874 -0.50 -2.43 7946 7113 -2.96 -5.79 4.44 4.62
1995-96 38710 36533 9.72 11.13 8489 7633 6.84 7.32 4.56 4.79
1996-97 41068 40851 6.09 11.82 8756 8236 3.15 7.90 4.69 4.96
1997-98 44217 46984 7.67 15.01 9155 9125 4.55 10.79 4.83 5.15
1998-99 47683 51575 7.84 9.77 9575 9666 4.59 5.92 4.98 5.34
1999-00 48951 52683 2.66 2.15 9524 10250 -0.54 6.04 5.14 5.14
2000-01 52247 56941 6.73 8.08 9821 10703 3.12 4.43 5.32 5.32
2001-02 56251 62002 7.67 8.89 10190 11232 3.76 4.94 5.52 5.52
2002-03 61995 10.21 11130 9.22 5.57 5.57
2003-04* 67092 8.22 11750 5.57 5.71 5.71
2004-05**
71669 6.82 12251 4.27 5.85 5.85
AVERAGE GROWTH UPTO 2001-02
5.99 8.05 2.81 5.19
TOTAL AVERAGE GROWTH
6.65 8.05 3.78 5.19
* PROVISIONAL ESTIMATES AND ** QUICK ESTIMATES ( R) - Revised Estimates, (PR ) - Pre Revised Estimates

ADB TA No. 4297-IND, Final Report
Capacity Building For Fiscal Reforms in Sikkim
172
Tsble 48 GROSS STATE DOMESTIC PRODUCT AT FACTOR COST BY
INDUSTRY OF ORIGIN (Rs. Lakhs)
Industry of Origin
1993-94 R
1993-94 PR
DIFFE-
RENCE
2003-04 R
2003-04
PR
DIFFE-
RENCE
AT CURRENT PRICES
Agriculture & Allied 11992 12309 -317 25419 25094 325
Forestry & Logging 904 785 119 2173 2124 49
Fishing 30 49 -19 80 118 -38
Mining & Quarrying 93 94 -1 156 -6 162
TOTAL PRIMARY 13019 13237 -218 27828 27330 498
Manufacturing(REG) 931 760 171 1557 1398 159
Manufacturing(UN REG) 1274 1283 -9 2205 2485 -280
Construction 5052 4121 931 30650 34673 -4023
Electricity, Gas & WS 1015 1020 -5 5720 8026 -2306
TOTAL SECONDARY 8272 7171 1101 40132 46582 -6450
Transport & Communication 887 1102 -215 4323 5128 -805
Trade Hotels & Restaurants 2996 2996 0 6797 6530 267
Banking & Insurance 514 512 2 4121 4212 -91
Real Estate ,O.D &B.S. 3460 3461 -1 10177 9629 548
Public Administration 5646 4883 763 21045 17576 3469
Other Services 4488 4381 107 20306 18831 1475
TOTAL TERTIARY 17992 17335 657 66769 61906 4863
Total State Domestic Product 39282 37743 1539 134729 135818 -1089
Population (Number) 433000 446300 -13300 571000 571000 0
Per Capita Income(Rs.) 9072 8457 615 23595 23786 -191
AT CONSTANT PRICES
Agriculture & Allied 11992 12309 -317 11030 13156 -2126
Forestry & Logging 904 785 119 1381 1388 -7
Fishing 30 49 -19 43 67 -24
Mining & Quarrying 93 94 -1 90 24 66
TOTAL PRIMARY 13019 13237 -218 12543 14635 -2092
Manufacturing (REG) 931 760 171 994 846 148
Manufacturing (UN REG) 1274 1283 -9 1406 1417 -11
Construction 5052 4121 931 10075 11750 -1675
Electricity, Gas & WS 1015 1020 -5 4580 3651 929
TOTAL SECONDARY 8272 7171 1101 17055 17658 -603
Transport & Communication 887 1102 -215 2085 1433 652
Trade Hotels & Restaurants 2996 2996 0 3350 5074 -1724
Banking & Insurance 514 512 2 1832 1672 160
Real Estate ,O.D &B.S. 3460 3461 -1 4533 4386 147
Public Administration 5646 4883 763 11241 11618 -377
Other Services 4488 4381 107 10315 13159 -2844
TOTAL TERTIARY 17992 17335 657 33357 37342 -3985
Total State Domestic Product 39282 37743 1539 62955 69635 -6680
Population (Number) 433000 446300 -13300 552000 552000
Per Capita Income (Rs.) 9072 8457 615 11405 12615 -1210

ADB TA No. 4297-IND, Final Report
Capacity Building For Fiscal Reforms in Sikkim
173
Table 49 NET STATE DOMESTIC PRODUCT AT FACTOR COST BY INDUSTRY OF
ORIGIN
(Rs. Lakhs)
Industry of Origin 1993-94 R 1993-94
PR
DIFFE-
RENCE
2003-04 R 2003-04
PR
DIFFE-
RENCE
AT CURRENT PRICES
Agriculture & Allied 11900 12217 -317 25142 24861 281
Forestry & Logging 752 589 163 1628 1575 53
Fishing 23 44 -21 64 104 -40
Mining & Quarrying 61 76 -15 119 -28 147
TOTAL PRIMARY 12736 12926 -190 26953 26512 441
Manufacturing(REG) 831 681 150 1365 1355 10
Manufacturing(UN REG) 1235 1210 25 2075 2408 -333
Construction 4842 3918 924 29130 33339 -4209
Electricity, Gas & WS 94 108 -14 3134 5262 -2128
TOTAL SECONDARY 7102 5917 1185 35895 42364 -6469
Transport & Communication 448 538 -90 2098 3497 -1399
Trade Hotels & Restaurants 2746 2746 0 6099 5921 178
Banking & Insurance 485 510 -25 3973 4076 -103
Real Estate ,O.D &B.S. 3078 3079 -1 9040 8533 507
Public Administration 4842 4079 763 18539 15481 3058
Other Services 4019 3899 120 18650 16874 1776
TOTAL TERTIARY 15619 14851 768 58399 54382 4017
Total State Domestic Product 35456 33694 1762 121247 123258 -2011
Population (Number) 433000 446300 -13300 571000 571000 0
Per Capita Income(Rs.) 8188 8457 -269 21234 21586 -352
AT CONSTANT PRICES
Agriculture & Allied 11900 12217 -317 10902 13030 -2128
Forestry & Logging 752 589 163 1127 1083 44
Fishing 23 44 -21 35 60 -25
Mining & Quarrying 61 76 -15 61 20 41
TOTAL PRIMARY 12736 12926 -190 12125 14193 -2068
Manufacturing(REG) 831 681 150 865 758 107
Manufacturing(UN REG) 1235 1210 25 1335 1279 56
Construction 4842 3918 924 9384 11013 -1629
Electricity, Gas & WS 94 108 -14 3217 2216 1001
TOTAL SECONDARY 7102 5917 1185 14930 15266 -336
Transport & Communication 448 538 -90 1166 320 846
Trade Hotels & Restaurants 2746 2746 0 2921 4635 -1714
Banking & Insurance 485 510 -25 1767 1603 164
Real Estate ,O.D &B.S. 3078 3079 -1 3947 3826 121
Public Administration 4842 4079 763 9911 10030 -119
Other Services 4019 3899 120 9484 12129 -2645
TOTAL TERTIARY 15619 14851 768 29197 32543 -3346
Total State Domestic Product 35456 33694 1762 56251 62002 -5751
Population (Number) 433000 446300 -13300 552000 552000 0
Per Capita Income (Rs.) 8188 8457 -269 10190 11232 -1042

ADB TA No. 4297-IND, Final Report
Capacity Building For Fiscal Reforms in Sikkim
174
9.13 Methodology for Estimation of Capital Formation
Importance
Annual estimates of State income or National income can be prepared by Production approach as a
difference of value of output less value of inputs or Income approach as a sum of compensation of
employees plus operating surplus or Expenditure Approach as a sum of -
(a) Private Final Consumption Expenditure
(b) Government Final Consumption Expenditure,
(c) Capital Expenditure on fixed assets plus increase in stock of goods and raw materials, and
(d) Imports minus exports from other states and abroad.
The capital expenditure incurred on fixed assets and increase in the value of stock of goods and
raw materials is termed as capital formation. Thus capital formation during the year is that part of
the State income which is used for creation of physical assets in the form of buildings, roads and
bridges, irrigation dams, laying of pipeline for water, sanitation etc. and other construction works;
machinery and equipment including transport vehicles as well as breeding livestock, dairy cattle,
drought animals used for production of milk and meat and other products, ploughing of fields,
transportation etc, and increase in the value of stock of goods and raw materials not consumed or
used in the creation of physical assets during the year. Availability of capital formation estimates
at state level provides an indicator of the magnitudes and growth of productive potential of state
economy.
The estimates of capital formation over a long period are required for estimation of the capital
stock of a State i.e. the wealth of a State at a point of time say 1st April, 2001 or 1
st April, 2005
which is used for further production of goods and services. Thus the estimates of capital formation
at state level provide an indicator of the magnitude and growth of productive potential of the State
economy. The State income for a particular year is directly proportional to labour and capital used
for production. Capital formation during the year divided by the State income is a measure of the
rate of capital formation. The rate of capital formation for a particular State for a year or over the
period of time can be compared with the similar rate of other states as well as at the national level.
For estimation of net state domestic product the consumption of fixed capital (CFC) based on the
estimates of capital stock is required. Till such time the estimates of fixed capital formation for a
long period of time are available the estimates of CFC can not be prepared at the state level.
Presently in the absence of the estimates of fixed capital formation for Sikkim direct estimates of
CFC are not available. The National Accounts Division of the Central Statistical Organisation
(CSO) provides the indirect estimates of CFC to Sikkim and other states based on the allocation of

ADB TA No. 4297-IND, Final Report
Capacity Building For Fiscal Reforms in Sikkim
175
the All-India CFC prepared from the estimates of capital stock at the national level. Once the
estimates of fixed capital formation are prepared annually, the estimates of CFC based on the state
figures can be prepared and used for state income estimation.
As per the recommendations of the RAC the Methodology for Estimation of Gross Capital
Formation for Sikkim is given in the Manual (Annex 6.2)
9.14 Preliminary Estimates of Gross Fixed Capital Formation
Preliminary estimates of gross fixed capital formation (GFCF) have been prepared from 1999-00
and 2000-01 by the SIU as per the methodology and source material mentioned in the Manual on
Gross Capital Formation for Sikkim. The estimation procedure is as follows.
Public Sector: The estimates of fixed capital formation are available annually from the budget
documents and are given from 1999-00 to 2000-2001 separately for construction and machinery..
For the central NDCUs and DCUs the state-wise allocated figures of capital expenditure on
construction for Sikkim have been supplied by the NAD. Because of the allocation problem the
estimates are abnormally high, erratic and negative. The NAD has been requested by the SIU to
revise their figures and also make available the figures for capital expenditure for machinery and
equipment. Meanwhile data on fixed capital expenditure of NHPC has been collected from their
local office. For state DCUs analysis of their accounts has been undertaken by the SIU for the
years 1999-00 to 2002-03. Actual data of these NDCUs have been used.
Supra-regional sectors: The estimates of supra-regional sectors i.e. communication, banking and
insurance and central government administration supplied by the NAD relate to total fixed capital
formation without any breakup for construction and machinery. The NAD has been requested by
the SIU to make available the breakup of fixed assets
Households: The estimates of households in respect of the following industries have been
attempted:
Agriculture: The estimates of agriculture for 1991-92 are based on AIDIS, 1991-92 and
have been carried forward using the combined index of area under agriculture and index of
wages of rural unskilled workers.
Ownership of dwellings: The estimates of fixed capital expenditure of ownership of
dwellings, mainly on construction, available from ATDIS, 1991-92 have been carried
forward with the index of residential buildings in rural and urban areas separately to derive

ADB TA No. 4297-IND, Final Report
Capacity Building For Fiscal Reforms in Sikkim
176
the estimates at 1991-92 prices. The index of cost of construction has been superimposed
to derive the current price estimates.
Non-farm business: In case of non-farm business the estimates from AIDIS are
negligible. For Unorganized Manufacturing and Transport the estimates have been
prepared from alternate sources and for other industries, in view of the results of AIDIS,
1991-92 the estimates of GFCF are assumed to be negligible. The results of enterprise
surveys, as and when available, may be adopted.
Unorganized Manufacturing was covered in the enterprise survey of NSSO in 1994-95.
The results of this Survey available from NSS Reports 434 and 435 have been used to
prepare estimates for 1999-00 and 2000-01.
Transport is a growing sector in Sikkim and the transport operated by the households for
commercial purposes is likely to form a major part of non-farm business. Additions to the
number of commercial vehicles registered with Transport Authority in the private sector
are have been evaluated at average prices to estimate the fixed expenditure on vehicles
during each year.
Corporate enterprises, cooperatives and non-profit institutions serving households: For
Corporate enterprises, cooperatives and non-profit institutions no data are available. The estimates
of capital expenditure on residual construction relating to corporate enterprises, cooperatives and
non-profit institutions serving households are compiled annually for estimation of SDP from
construction activity. These estimates have been adopted as such. However, it is suggested that
data on cooperatives and non-profit institutions can be collected and analyzed by the SIU on a
regular basis.
The estimates of Gross Fixed Capital Formation of Sikkim for 1999-00 and 2000-01 are given in
an earlier section. For the year 1990-00 the estimated GFCF is 297 crores and for the year 2000-01
it is 356 crores. Of which construction assets account for Rs. 248 in 1999-00 and Rs.303 crores in
2000-01 respectively and machinery and equipment Rs. 49 in 1999-00 and Rs. 53 crores in 2000-
01 respectively. The Public Sector accounts for the bulk of the GFCF in Sikkim i.e. Rs. 255 crores
in1999-00 and Rs. 314 crores in 2000-01-.the construction assets account for 80% and machinery
and equipment 20% of GFCF of the public sector.

ADB TA No. 4297-IND, Final Report
Capacity Building For Fiscal Reforms in Sikkim
177
Table 50 Gross Fixed Capital Formation of Sikkim in 1999-00 and 2000-01
(Rs.Lakhs)
Industry of Use 1999-2000 2000-01
Construc-
Tion
Machi-
nery
GFCF Construc-
tion
Machi-
nery
GFCF
1. Agriculture 66 21 87 61 36 99
2. Forestry 236 0 236 612 0 612
3. Fishery 0 0 0 0 0 0
4. Mining and quarrying 0 25 25 2 37 39
5. Manufacturing –
registered
0 26 26 0 19 19
6. Manufacturing –
unregistered
4 0 4 5 0 5
7. Construction 1902 325 2227 1744 310 2054
8. Electricity, gas and
water
8317 3431 11748 8689 3567 12256
9. Trade, hotels and
restaurant
12 7 19 0 14 14
10. Transport and
communication
1653 286 1939 1291 395 1686
11. Banking and
insurance
128 166 294 228 249 476
12. Real estate, ownership
of dwellings and
business services
2265 0 2265 2486 0 2486
13. Public administration 9188 410 9598 12452 580 13032
14. Other services 1020 224 1244 2728 96 2924
Total 24790 4922 29712 30298 5305 35602
Public Sector 20597 4862 25460 26165 5224 31389
9.15 Suggestions/Recommendations
The estimation of fixed capital formation only, as recommended by the NAD and also
in line with similar estimates being prepared by other states, may be taken up by the
SIU of DESME, Government of Sikkim on an annual basis.
The estimation of fixed capital formation on an annual basis will significantly increase
the work load of the SIU. It is suggested that in view of the importance of the
estimates of SDP and fixed capital formation for planning and development, the SIU
may be paid special attention. The officers and staff of the SIU may be engaged
mainly for collection and compilation of data from various sources, analysis of budget
documents and reports of state undertaking, cooperatives etc. for
estimation/improvement of these aggregates.
The allocation procedure used by the NAD to distribute the national level estimates of
fixed capital formation of central NDCUs in proportion to increase/decrease in state-
wise gross block of assets during the year has been lately resulting in erratic, negative
and abnormally high figures of fixed expenditure for smaller states including Sikkim.
As a result the annual estimates of fixed capital formation are likely to be grossly over

ADB TA No. 4297-IND, Final Report
Capacity Building For Fiscal Reforms in Sikkim
178
estimated/under estimated. The NAD may be approached by the State Government to
suitably change the procedure and provide reliable figures.
For reliable estimates of fixed capital expenditure of NDCUs and avoid dependence
on the NAD it is suggested that actual data on expenditure on fixed assets incurred
within Sikkim by the units of central/state undertaking operating in Sikkim may be
collected by the SIU annually from their units and used for estimation of SDP from
construction.
For the central government administration and central DCUs expenditure on fixed
capital, available with the state offices of the Central Public Works Department and
Border Roads Organization located at Gangtok, may be collected by the SIU annually
and used.
For private sector enterprises whose operation are spread over many states, suitable
procedure to derive state-wise figures of fixed capital formation will have to be
devised by the NAD.
Till such time consolidated data on fixed capital expenditure from the Cooperative
Department, Sikkim become available, data on income and expenditure and on
additions to fixed assets during the year for individual cooperatives need to be
collected and analyzed annually on a sample basis to estimate the fixed capital
formation during the year
In order to build up the estimates of capital formation for household sector by industry
of use, it would be necessary to have an adequate sample of urban households in the
AIDIS.
Attempts need to be made to collect annual information on fixed capital formation in
respect of non-profit institutions engaged in various activities.
9.16 Methodology for Estimation of Saving for Sikkim
Importance
Saving represents the excess of current receipts over the current expenditure of the enterprises
engaged in the production of goods and services and for the households it is the excess of current
income over household final consumption expenditure during the year. Thus it is that part of the
State income which is not consumed by the households or the government during the year and is
equal to the capital formation during the year. Saving by type of institutions i.e. public sector –
government administrative departments and public sector enterprises, private corporate sector
enterprises and the households (including non-profit institutions serving households) indicates the
share of each of the institutions in the saving of the State. At the national level the saving of the
households constitutes 90% of the total saving. Saving of the Government is negative being (-) 6%
ADB TA No. 4297-IND, Final Report
Capacity Building For Fiscal Reforms in Sikkim
179
and that of the corporate sector 16% of the total saving. Thus the household sector is a major saver
and financer of the investment in the economy. For giving fillip and to maintain the tempo of
household saving, the central government from time to time announces incentives for saving by
the households.
Background
The RAC in its final report (1976) submitted to the Government of India, having recognized that
the state level estimates of saving are not conceptually viable or feasible because of the open
boundaries of the states did not recommend compilation of the estimates by state DESs. In view of
this the NAD, till date, has not suggested to the states to compile the estimates of saving at the
state level.
Methodology
The estimates of saving of state government/departmental commercial undertaking are available
annually from the analysis of budget document being undertaken by the SIU. This saving is
negative. Saving of the corporate sector at state level is not available for want of state-wise details
from RBI studies on corporate companies.
Direct estimates of household saving, constituting 90% of the total saving at the national level, are
not available at the national/state levels. The Household Income and Expenditure Surveys in the
past did not provide the direct estimates of saving at national/state level. For Sikkim no recent
income and expenditure survey has been conducted.
At the national level the estimates of saving are prepared indirectly as investment in physical
assets and financial assets. The estimates of household physical assets for Sikkim are not available
as the estimates of fixed capital formation are not prepared for Sikkim. In case of financial assets
data only for a few items such as bank deposits and Post Office saving and other deposits are only
available. Even the breakup of deposits with the banks and post office separately for the
households is not available. Moreover these deposits may not be entirely from the saving form
Sikkim because of the open boundaries of the states and free flow of money across the states.
.
For rest of the financial assets, i.e., Currency, Shares and debentures, Net claims on government ,
Life insurance funds, and Provident and pension funds no state level data are available. Hence for
want of requisite data even the indirect approach adopted at national level can not be
adopted at the state level.

ADB TA No. 4297-IND, Final Report
Capacity Building For Fiscal Reforms in Sikkim
180
9.17 Suggestions/Recommendations
In view of the above it is proposed that estimation of saving may not be taken up by the SIU of
DESM&E, Government of Sikkim till such time direct data on household saving from the
Household Income and Expenditure Survey or state-wise data on physical and financial assets
become available.
9.18 Training in State Income, Capital Formation and Saving
In order to train the officers of the Sikkim Statistical Service, and the officers and staff of the SIU
a Training Workshop on State Income and related Aggregates was organized at Janata Bhavan,
Gangtok from 2nd
March to 15th March 2005. Besides specialized training as well as on the job
training was also provided to the officers and staff of the SIU in respect of estimation of capital
formation and saving for Sikkim during the course of the Project. Details of the Training
Workshop are as under.
Training Workshop on State Income & Related Aggregates
The Workshop was organized at Janata Bhavan, Gangtok from 2nd
March to 15th March 2005.
Ninety participants from Sikkim Statistical Service working in specialized units (State Income,
Sample Surveys, Prices, Data Processing, Computer Centre) of the DESME as well as from other
government departments such as departments of Forestry, Fishery, Transport, Health,
Environment, Rural Development attended the Workshop.
Lectures on the concepts of national/state accounts in respect of State Domestic Product (SDP),
methods of estimation, forms of income/expenditure, capital formation in the form of fixed capital
(i.e. construction and machinery & equipment and increase in stocks), saving in physical assets
and financial instruments and estimation of State income for each of the sectors and sub-sectors
were delivered.
Estimation of SDP is undertaken for each sector/sub-sector of the state economy as given below:
1. Agriculture including Animal Husbandry.
2. Forestry.
3. Fishery.
4. Mining and Quarrying.
5. Manufacturing – registered
6. Manufacturing – unregistered.
7. Construction.
8. Electricity, Gas and Water Supply.
9. Trade, Hotels & Restaurant.

ADB TA No. 4297-IND, Final Report
Capacity Building For Fiscal Reforms in Sikkim
181
10. Transport & Communication.
11. Banking & Insurance.
12. Real Estate, Ownership of Dwellings & Business Services.
13. Public Administration.
14. Other Services – Education, Medical & Health, Legal Services etc.
Comprehensive and detailed lectures explaining the coverage, method of estimation and data
sources used were delivered. Practical illustrations were also demonstrated. Data sources, for
various sectors such as Administrative records; censuses of population, livestock, manufacturing,
agriculture; results of sample surveys of enterprises, livestock and livestock products, All India
Debt and Investment Surveys, Household Consumption Surveys, Crop Cutting Experiments and
other surveys, annual reports of public and private enterprises; budget documents etc., used in
various sectors were also discussed.
Specialized Training for Estimation of Saving and Capital Formation
During the last phase of the project specialized training on the concepts and. methodology of
estimation of SDP, saving and capital formation for systematic estimation and effecting
improvements from time to time has been provided to the officers and staff of the State Income
Unit. Practical on the job training has also been provided. Use of available sources of data from
various departments, National Sample Survey Organization and other organizations has been
demonstrated.

ADB TA No. 4297-IND, Final Report
Capacity Building For Fiscal Reforms in Sikkim
182
10. Poverty Estimation for Sikkim and Related
Issues
The approach of measuring the absolute poverty line in the normative minimum calorie-intake was
adopted by the Task Force on Projections of Minimum Needs and Effective Consumption
Demands, accepting the calorie intake norms for fourteen age-sex-activity categories
recommended by the Nutrition Expert Group (1968). The official measure of poverty in India is
the simplest of all the measures devised, that is, the Head Count Ratio (HCR), purporting to assess
the prevalence of poverty. The measure does not tell us about the depth or severity of poverty in
any region. Even so, there are several issues that torment researchers striving to estimate poverty
in Sikkim. Three of them stand out clearly.
a. More than 90 percent of the population resides in rural areas and in any exercise on
poverty it is the rural sector that assumes the preponderating role compared to its
counterpart, the urban sector. Yet for the former there is no cost of living index. Thus,
even if we arrive at poverty lines for the two sectors, it would not be possible to carry it
forward from the base year because the price deflators are not available for the rural
sector.
b. Household expenditure surveys, the results of which form a crucial input for poverty
estimation are carried out by the National Sample Survey Organisation (NSSO) in the
form of two samples, Central and State on an equal matching basis7. While the sample
design is formulated by the NSSO, the canvassing of the schedule in the field and the
processing of data relating to the State sample rest with the State Government. The latest
quinquennial round that is, the 55th (1999-00) for which results are available and this
pertains only to the Central sample with a sample size of 88 villages and 1056 households.
If the State sample was processed in tandem with the Central sample, not only the sample
size would have been twice the present by pooling the two thereby increasing the
reliability of survey estimates but one could see how well the two agree, adding
confidence in the results.
c. The official method of computing the consumption basket of minimum level of living for
demarcating the poor from the non-poor, taking into account food, clothing, shelter and other
non-food items or in other words, the poverty line is derived for all the States except a few for
which either the sample size is not adequate or there are prominent data gaps. Sikkim does not
7 Out of 453 villages, 92 sample villages are covered in the Central sample and an equal
number in the State sample in the current round (61st) that has been launched in July 2004 expected
to be over by June 2005. The urban areas being much less, 20 urban blocks are being surveyed
through the Central sample and an equal number through the State sample.

ADB TA No. 4297-IND, Final Report
Capacity Building For Fiscal Reforms in Sikkim
183
have a state-specific poverty line. Instead, as for other north-eastern States, the Assam poverty
ratio is used for estimating the number of poor.
For more than two decades, the legacy of the Assam poverty ratio handed over by the Planning
Commission persists, the magnanimity of the massive NSSO to sort out smaller states‟ problem of
the lack of capability to process the State sample data (far from attempting to re-orientate the
sample design to suit the needs of the hilly states), not much in evidence while the State
Government waits for things to happen.
This chapter attempts to estimate and analyse poverty based on whatever data are available within
the framework specified by the official methodology. The results for the 55th round, Central
sample are used. In order to understand the Sikkim data, to begin with the important results for
major States and the alternate estimates by researchers are discussed in brief to have an insight
with respect to the Central sample results of Sikkim. Secondly, the gap noticed in average calorie-
intake over the years since the anchoring all India calorific norms of 2400 Kcal and 2100 Kcal
were prescribed for rural and urban areas is discussed.
10.1 Official Poverty Estimates and Alternate Estimates
The general trend in poverty estimates based on NSS data since 1973-74 has shown a steady
decline at a rate of almost one percentage point every year. The rate of decline in the nineties
however, has been a matter of controversy with researchers coming out with their own
adjustments. The researchers move away from the published grouped data and resort to raw data as
the former assumes that households are uniformly distributed in each expenditure class which may
not be true. For some, the updating of the poverty line implies the use of weights that are fixed and
outdated and corrections on that account were made. The focus of controversy however, is the
latest year for which the Planning Commission brought out the poverty estimates that is, for the
55th round of NSS or 1999-2000 where for the food group two alternative recall periods of 30-days
and 7-days were used among the same set of households and recorded in blocks side by side.
But for items like clothing, footwear, durables etc., information was collected only on the basis of a
recall period of 365 days. Thus while 1999-00 poverty estimates are based on a mixed reference period
(MRP) of 30 and 365 days, in all earlier rounds, a uniform reference period (URP) of 30 days was used.
Adjustments using unit record data were made (Table 51). Except for a few States, D2 and ST (MRP)
give much higher poverty ratios or in other words the adjustment for recall period goes to increase the
poverty ratio in comparison to the official estimate.

ADB TA No. 4297-IND, Final Report
Capacity Building For Fiscal Reforms in Sikkim
184
Table 51: Poverty Head Count Ratio: Alternative Estimates, 1999-00, Rural
State Poverty Ratio
PL(Rs.) Official D&D D1 D2 ST(MRP)
Andhra Pradesh 262.94 11.03 26.2 10.5 14.9 22.01
Assam 365.43 40.04 35.5 40.3 44.1 53.41
Bihar 333.07 44.30 41.1 44.0 49.2 51.49
Gujarat 318.94 13.17 20.0 12.4 15.4 18.89
Haryana 362.81 8.27 5.7 7.4 12.7 7.83
Karnataka 309.59 17.38 30.7 19.8 25.7 24.09
Kerala 374.79 9.38 10.0 9.4 12.6 16.47
Madhya Pradesh 311.34 37.06 31.3 37.3 36.4 32.93
Maharashtra 318.63 23.72 31.9 23.2 29.2 37.65
Orissa 328.92 48.01 43.0 47.8 47.3 56.27
Punjab 362.68 6.35 2.4 6.0 5.9 8.73
Rajasthan 344.03 13.74 17.3 13.5 19.6 11.39
Tamil Nadu 307.64 20.55 24.3 20.0 19.9 27.69
Uttar Pradesh 336.88 31.22 21.5 31.1 33.7 25.5
West Bengal 350.17 31.85 21.9 31.7 37.1 44.18
All India 327.56 27.09 26.9 27.0 30.2 31.86
Source: Planning Commission (1997), Deaton & Dreze(2002), Deaton(2003) and Sundaram and
Tendulkar (2003).
Notes: D&D refers to estimate by revising the PL poverty line as well as adjusting for recall
periods; D1 refers to estimate by Deaton using the unit records; D2 refers to estimate by
Deaton adjusting for recall periods( 30 days instead of 7 days); ST(MRP) refers to
estimate by Sundaram and Tendulkar using mixed record period of 30 days and 365 days
using unit record data.
10.2 Decline in Average Calorie Intake
The Task Force methodology favoured the calorific norm in preference to the minimum normative
food basket for anchoring the absolute poverty line, the minimum requirements constructed for
people of different sexes, ages and activities followed by estimation of the consumption basket
used to attain these calorie intakes and their corresponding per capita total expenditure. The level
of average calorie intake of 2400 calories for the rural sector for example, is not however, assured
once the mechanism of updating and forwarding this poverty line (1973-74) on the basis of price
indices is adopted. In fact, in the 27th round (1972-73), the all India average calorie intake was
2266 Kcal much less than 2400. It declined progressively thereafter, taking values 2221, 2153 and
2149 during 38th
(1983), 50th (1993-93) and 55
th round (1999-2000) respectively.
Using the State-specific poverty lines (PL) for 1999-2000 and per capita intake of calorie by
MPCE classes (NSS Report No.471, 55th round), the upper limit of the calorie intake
corresponding to the PL for major States is given below (Table 52).

ADB TA No. 4297-IND, Final Report
Capacity Building For Fiscal Reforms in Sikkim
185
Table 52 Some Selected Estimates Relating to Calorie Intake and Poverty in
Rural Sector: 1999-2000
State PL (Rs.) Calorie intake
less than Head Count Ratio (%)
official consuming
2400 cal* Andhra Pradesh 262.94 1662 11.1 80.7
Assam 365.43 1767 40.0 96.5
Bihar 333.07 1977 44.0 74.9
Gujarat 318.94 1684 13.2 80.5
Haryana 362.81 1745 8.3 55.1
Karnataka 309.59 1646 17.4 78.9
Kerala 374.79 1389 9.4 81.2
Madhya Pradesh 311.34 1888 37.1 78.4
Maharashtra 318.63 1780 23.7 83.3
Orissa 328.92 2117 48.0 74.6
Punjab 362.68 1712 6.4 62.8
Rajasthan 344.03 2003 13.7 56.7
Tamil Nadu 307.64 1543 20.6 86.5
Uttar Pradesh 336.88 1990 31.2 64.5
West Bengal 350.17 1935 31.9 75.6
Source: NSS Report No.471 & Planning Commission
Note: * Source for this column except Assam : Meenakshi and Vishwanathan (2003)
The average calorie intake for the rural minimum consumption basket in 1999-2000 ranged from
58% in Kerala to 88% in Rajasthan taking 2400 as the norm. Whether this fall in the intake of
calories is for real or due to the particular method of price adjustment? In the former case, the
poverty line has to go up and for the latter, some explanation is warranted for the intrinsic factors
in the adjustment procedure that go to lower the per capita total expenditure taken as the adjusted
poverty line? Or over the three decades, have the average calorific needs come down? This indeed
warrants a fresh exercise from the ICMR in revising the old norms. In any case, the prominent
increase in the poverty ratio that is, the Head Count Ratio can be seen if we go by the average
calorific norm of 2400 calories as against the official poverty ratio. In justification of this huge
unbelievable divergence, the official explanation could be that the norm of 2400 calories was only
the anchoring input for nutrition to derive the minimum basket of consumption; in later years it is
the basket that undergoes change whatever be the calorie intake. The fact remains that calorie
intake has gone down and for the states not having their own official poverty line, some such
concept as minimum calorie norm may have to be evolved for estimating poverty. We shall come
to this topic in a later section.
10.3 Official Poverty Ratio for Sikkim - An Appraisal
Based on the Modified Expert Group recommendations, the Planning Commission brought out the
poverty ratio for all States excluding a few. For all the north-eastern States for reasons ranging

ADB TA No. 4297-IND, Final Report
Capacity Building For Fiscal Reforms in Sikkim
186
from data gaps to small sample size, the poverty ratio for Assam is used to calculate the number of
persons below poverty line.
Table 53 Number and Percentage of Population Below Poverty Line in Sikkim
From 1973 to 1999
Year Rural Urban Combined
No.of
persons
(million)
Per cent No. of
persons
(million)
Per cent No. of
persons
(million)
Per cent
1973-74 0.11 52.67 0.010 36.92 0.118 50.86
1977-78 0.14 59.82 0.013 32.71 0.154 55.69
1983 0.12 42.60 0.010 21.73 0.134 39.71
1987-88 0.13 39.35 0.004 9.94 0.135 36.00
1993-94 0.18 45.01 0.003 7.73 0.184 41.43
1999-00 0.20 40.04 0.004 7.47 0.205 36.55
Source: Planning Commission.
It is seen that for rural Sikkim, the poverty ratio increased initially but decreased thereafter to
record again, an increase in 1993-94 to come down to 40% in 1999-00. The number of poor over
the span increased from 0.11 million to 0.20 million. The rate of decrease in urban poverty both as
proportion and in absolute terms has slowed down. The application of Assam‟s poverty ratio has
disadvantaged the state. We propose to go into this issue based on the 55th round Central sample
results but the adjustments of the official estimate for Assam provided in Table 51 give us a range
35.5% to 53.4% of HCR for 1999-00.
10.4 Estimation by Proxy
The crucial input for arriving at the poverty line for any State is the NSS household consumer
expenditure survey results but for Sikkim the NSS data are not used as there is no state-specific
poverty line. Instead the poverty ratio for Assam is used without looking into the differences in the
distribution of number of persons by monthly per capita expenditure classes (MPCE) of the two
States.
As Table 54, given below based on the Central sample results of 55th round shows, there is a
relative shift in the distribution in Sikkim towards the higher MPCE classes as compared to
Assam. This implies that price level remaining the same, the level of consumer expenditure is
higher in Sikkim as compared to Assam. We proceed to examine the issue of using Assam poverty
ratio further from the Sikkim distribution using simple interpolation to calculate the poverty line
during 1999-2000 for Sikkim.

ADB TA No. 4297-IND, Final Report
Capacity Building For Fiscal Reforms in Sikkim
187
Table 54 Per Thousand Distribution of Persons by MPCE Class for Rural and
Urban Sectors of Assam, Sikkim and Manipur, 1999-2000 (55th
Round,NSS)
Rural Urban MPCE number per 1000 persons number per 1000 persons
Class (Rs.) Assam Sikkim Manipur Assam Sikkim Manipur
000-225 58 11 7 43 26 0
225-255 53 10 2 36 23 5
255-300 97 47 35 87 38 68
300-340 112 92 40 165 59 157
340-380 129 84 104 72 79 162
380-420 119 146 141 107 103 178
420-470 124 135 129 89 143 205
470-525 96 96 108 94 139 97
525-615 106 133 167 100 127 44
615-775 72 134 171 124 168 69
775-950 24 51 51 39 69 7
>950 11 60 46 43 26 8
All classes 1000 1000 1000 1000 1000 1000
Source: NSS Report No.457
Using the Assam poverty ratio of 40%, the poverty line for Sikkim comes to be Rs.425, the highest
among all States in India. Notwithstanding relative affluence in Sikkim, the poverty line vouches
for the highest cost of the minimum basket of consumption. This could be a matter of concern for
the Government but unfortunately, cannot be checked in absence of any comparable price statistics
for Sikkim.
The Assam poverty line for the base year gets updated to yield poverty ratios for later years for
Assam as well as Sikkim. The official poverty ratio for Sikkim therefore, cannot be deemed to
have an associated poverty line.
10.5 D-G Estimates
Dubey and Gangopadhyay have provided poverty estimates for all Indian States from raw data for
the 43rd
(1987-88) and 50th
(1993-94) rounds including Sikkim and Manipur(for which relevant
price data are available). It is not understood why the estimate for Manipur was not furnished by
the Expert Group; a possible reason could be the small sample size for the NSS consumer
expenditure surveys for Manipur. Whatever be the reason, D-G used the price level of rural
Manipur and urban Meghalaya to compute the HCR for Sikkim adopting six different approaches
and the limitation of small sample size still holds good. Nevertheless, D-G exercise is the only
instance where Sikkim is vested with a state-specific poverty line, albeit Manipur poverty line for

ADB TA No. 4297-IND, Final Report
Capacity Building For Fiscal Reforms in Sikkim
188
the rural and the Meghalaya for the urban computed from the raw data of NSS consumer
expenditure surveys of 43rd
and 50th rounds and they merit quoting.
Table 55 D-G Poverty Lines (Rs.) for rural and urban Sikkim
Approach Rural Urban
1987-88 1993-94 1987-88 1993-94 OPL 134.75 253.08 139.57 252.65
EOPL 127.44 239.35 140.45 254.24
APL 117.15 220.02 122.88 222.45
The results for three approaches are given below.
Table 56 Head Count Ratio for Sikkim According to Dubey-Gangopadhyay (1998)
Approach Rural Urban Combined
1987-88 1993-94 1987-88 1993-94 1987-88 1993-94 OPL 49.30 40.24
14.69 3.39
42.99 37.31
EOPL
41.00 33.58 14.69 3.39 36.21 31.12
APL 30.68 27.36 5.49 0.96 26.09 25.26
The OPL is the poverty line based on official norm and updated using disaggregated price
adjustment suggested by Minhas et al (1988). The EOPL too based on the official norm is updated
by price adjustment suggested by the Expert Group (1993). APL is based on the alternative norm
(Dandekar and Rath) but updated using adjustment suggested by Minhas et al. Three points to be
noted in respect of D-G estimates for Sikkim are therefore, (a) use of rural Manipur price level and
urban Meghalaya price level, (b) use of raw data of NSS rounds and not the classified published
data, and (c) use of census population as weights. D-G estimate of EOPL for 1987-88 is taken
from the official modified Expert Group while for 1993-94 is computed by assuming that the ratio
of EOPL to OPL in the two years remain unchanged that is, the EOPL for 1993-94 is the product
of OPL in 1993-94 and the ratio of EOPL to OPL in 1987-88.
It is seen that the different approaches provide different values of HCR, OPL showing the highest
value of 42.99 in 1987-88 declining to 37.31 in 1993-94 compared to the official estimates based
on Assam poverty ratio that is, 36.00 (1987-88) increasing to 41.43 (1993-94) given in Table 53.
Thus apart from the varying estimates, the trend gets reversed. The other approaches yield much
lower values compared to the official estimates except 1987-88 HCR under EOPL.
In Table 54 we now compare the size distributions of Sikkim and Manipur just as we did for
Assam. It is seen that contrary to what we observed for Assam, it is now the Manipur distribution

ADB TA No. 4297-IND, Final Report
Capacity Building For Fiscal Reforms in Sikkim
189
that shows a shift towards the higher MPCE classes compared to Sikkim; the use of Manipur
poverty line would therefore, overestimate Sikkim poverty ratio. D-G estimates are not available
for 1999-2000. Since the latest year for which both sets are available is 1993-94 we prefer to
compare the official estimate (based on Assam poverty ratio) for the year with D-G estimate as
given by OPL (Manipur/Meghalaya), as EOPL is the same as given by the Expert Group. It may
therefore, be mentioned that during 1993-94 the range of Sikkim poverty ratio could have been
between 37.31%(Manipur/ Meghalaya-based) and 41.43% (Assam-based), perhaps nearer to
the Manipur estimate (in fact for urban areas, D-G used Meghalaya prices but the rural weight is
preponderating) because of the relative nearness of Sikkim and Manipur size distributions than
Sikkim and Assam. For the rural areas, this range is seen to be roughly 40% to 45%.
Although the range of the poverty ratio as in 1993-94 is specified, the above analysis shows that
poverty estimation by proxy via Assam or Manipur/ Meghalaya is not convincing. At best we can
have a range within which the Sikkim poverty ratio probably lay during 1993-94. And the main
reason for not having any state-specific poverty line for Sikkim is the absence of relevant price
statistics in the State, missing out on the Labour Bureau network.
Further to the range of the rural Sikkim poverty ratio that is, 40% to 45% in 1993-94, if we take
Assam as proxy, given in Table 51 earlier suggests that the poverty ratio for Sikkim could be
between 35.5% and 53.4% in 1999-00 for rural areas.
10.6 Bias in D-G Estimates
D-G estimates of HCR are derived from the use of proxy-state poverty lines on the raw data on
consumer expenditure of Sikkim in contrast to the use of HCR as such of proxy state by Planning
Commission. This is an important point to be noted as there is no bias in official estimates while
D-G estimates have an upward bias. Looking at Sikkim and Manipur size distributions, it is clear
that the central tendency measures for the latter have higher values compared to the former. Even
the use of raw data cannot hide this feature. If z* is the poverty line for Sikkim (which has eluded
us so far) and z1 the poverty line for Manipur (proxy state), then
z1 z*
If P(z1, z*) = the population contained between z1 and z* and N, the total population, bias in HCR
is given by P(z1, z*) / N
10.7 The BPL Census
We have seen that Sikkim does not have an acceptable poverty ratio though it could have been
anywhere between 37% and 41% during 1993-94. The direction in which the ratio for the State
moved after 1993-94, is a matter for further investigation. Whether the declining trend between
1987-88 and 1993-94 as revealed by D-G estimates is carried forward can only be known by
ADB TA No. 4297-IND, Final Report
Capacity Building For Fiscal Reforms in Sikkim
190
obtaining the poverty line for 1999-2000 with the help of the 55th round data and the methodology
outlined by the Task Force (1979). While we would come to this topic in a later section, our aim is
to see and examine other exercises relating to poverty estimation. The poor should be identified
and whatever little can be done should be the aim of any welfare state. And for this purpose, the
Below Poverty Line Census in Sikkim is conducted by the Department of Rural Development in
the beginning of each Plan period on the lines of the countrywide census launched by the Central
Ministry of Rural Development. It has the objectives of identifying and targeting the BPL persons
under various programmes of the Ministry. The unit of enumeration is however, the household and
not the person.
Methodologically, the name BPL Census (2002) as it connotes the households below poverty line,
does not go by any poverty line and hence is a misnomer. Even the particulars of income collected
in 1992 or those of expenditure in 1997 were given up in the 2002. Since 1992 there have been
drastic changes in the methodology so far as the selective criteria are concerned and hence the lack
of comparability between one census aggregate and that of the succeeding one. The upper limit of
the poor for the State is fixed by the Planning Commission with the details of identifying villages,
communities, blocks for targeting so far as specific anti-poverty schemes are concerned left to the
State. The task is onerous but the use of the manifold criteria and the ranking of households based
on the combined score leaves many loopholes for a non-poor to get included among the poor
besides the absence of any sense of logic in the scoring pattern suggested. One should not
therefore, attempt to look at the number of poor as obtained from the BPL Census as a yardstick
for measuring poverty.
10.8 Why BPL Census Cannot Provide an Estimate of Poverty?
The revised methodology of BPL Census 2002 takes into account 13 attainable socio-economic
parameters, namely operational holding of land, housing, clothing, food security, sanitation,
ownership of consumer durables, literacy, labour force, means of livelihood, status of children,
type of indebtedness, migration and nature of assistance preferred for assessing the poverty level
of each rural household. A score from 0 to 4 is to be assigned to every household in respect of each
of the indicators. Aggregating the score for each household one would know the relative
positioning of the household in a village. As Sundaram (2003) observes ` many of the thirteen
indicators have no clear link with deprivations either in the capability space or in regard to
consumption of goods and services serving as proxies for such deprivations.‟ Secondly, `the
procedure of simple aggregation of scores establishes in effect, cardinal equivalence across what
are essentially ordinal rankings of alternative states of households in respect of individual
indicators.‟ `In fact in seeking to combine in a single measure several facets of deprivation, the
notion of a hierarchy of basic needs is abandoned. There could be the absurd situation of a score of

ADB TA No. 4297-IND, Final Report
Capacity Building For Fiscal Reforms in Sikkim
191
zero for non-ownership of any consumer durable seen as an extreme deprivation at par with
`having less than one square meal per day for major part of the year‟. A sharecropper was treated
on par with the actual owner; no distinction was made in regard to quality of land, an un-irrigated
plot in Rajasthan taken to be the same as one in the fertile land of Bihar.
Further, the ranking on the aggregate score of rural households is not called for programmes
addressing deprivations that are universal in scope like illiteracy, lack of sanitation, safe drinking
water. Equally irrelevant are these rankings for some key employment programmes like JGSY and
EAS that are focused on locations of need and not at individual households. The ranking of
households with respect to food security gets vitiated in the hotch-potch of ranking done on the
basis of 13 indicators and is utterly useless for programmes of Antyodaya and Annapoorna. The
major anti-poverty programme SGSY focused on alleviation of income-poverty cannot be
monitored or evaluated because of non-inclusion of per capita expenditure of households as one of
the indicators (Sundaram,2003).
The information from the question relating to `Preference of Assistance‟ cannot be used either for
the wage-employment programme or the targeted public distribution system as the two are clubbed
together. No wonder, the Food and Supplies Department of the Government of Sikkim has its own
set of criteria to identify the beneficiaries.
10.9 Poverty Ratio through Complete Enumeration (Economic Survey 1999)
We have seen that estimation by proxy does not lead us to have meaningful conclusions about the
poverty status in Sikkim. Also, the much- publicized BPL Census fails to give us an alternative
estimate about poverty. In a quick survey completed within 100 days (Economic Survey)
employing 1000 enumerators and 300 supervisors a door-to door enquiry was conducted
canvassing among other things, an abridged schedule purported to get details of consumer
expenditure of the households. While this turned out to be an aborted exercise, the lessons are
instructive. First, survey taking is never to be done in a hurry. Second, the investigators need
screening before training and asking them to go to the field. Third, the design of the questionnaire
should be done in such a way so as not to sow the seeds of non-sampling errors at the very outset.
Finally, one has to be less ambitious in increasing the number of items of information especially
when the survey organizers do not have very skilled personnel. Given the limited skill available in
respect of survey taking, the first question that arises is whether there is the need to take up a
complete enumeration when the filled –in schedules of the State sample of the NSS conducted year
after year go a begging. If the Central sample results are not to be trusted and the State sample data
are not processed due to limited data processing capability and utter dependence on the Data
Processing Division of the NSSO, whether we should go for a fresh sample survey, designed to

ADB TA No. 4297-IND, Final Report
Capacity Building For Fiscal Reforms in Sikkim
192
cater to the needs of the State. We shall come to these questions in a later section. Before that, the
immediate need is to arrive at a point estimate.
10.10 Price Statistics
Before we move over to the point estimation of poverty, it would be in the fitness of things
to outline the importance of price statistics for Sikkim.
For the new series of Consumer Price Indices of Agricultural Labour and Rural Labour with base
1986-87=100 for all the 20 states (Sikkim not there) and All India, Labour Bureau has derived the
weighting diagram from the consumer expenditure data based on the Central Samples collected by
NSSO during the 38th round conducted in 1983. It is important therefore, for price adjustments and
future updating that the cost of living studies be undertaken by the Government of Sikkim to arrive
at the Consumer Price Indices in the rural sector for the different segments of population and for
different regions. A suitable base year for cost of living may also be thought of. Similarly, though
for urban areas Sikkim has its own mechanism for getting the Consumer Price Index for Industrial
workers with 1982 as base, the family living survey based on a sample of 216 households
providing the weighting diagram, there is no center in the scheme of 70 centers selected for
construction of Consumer Price Indices for Industrial workers with base 1982=100 by the Labour
Bureau for which the weighting diagram is based on average consumption expenditure of the
working class family as revealed by the Family Income and Expenditure Survey conducted during
1981-82. The Labour Bureau may be requested to include Sikkim within the purview of its urban
network by providing a center or two.
The main deficiency of the price statistics even for major states is that the data- base of price
indices for a disaggregated study is not quite satisfactory. Those available relate to specific
segments of the population for example, for the rural sector Consumer Price Indices for
agricultural labour (CPIAL) at State level and CPIIW and CPINM respectively for industrial
workers and non-manual employees for the urban sector. Minhas et. al. (1988) constructed CPITR
and CPITU for the total rural and total urban population with two base years 1960-61 and 1970-71
for the first time. The computation of CPIMR and CPIMU for the middle range population that is
relating to the fractile groups around the poverty line for different States was an innovative idea for
appropriate price adjustment. Moreover, in order to use the quinquennial rounds of the NSS, the
same were developed for the years 1970-71, 1972-73, 1973-74, 1977-78, 1983 and 1987-88 also.
Further, for the years 1960-61, 1970-71 and 1983 they constructed the state-specific price indices
relative to all India for the middle range.

ADB TA No. 4297-IND, Final Report
Capacity Building For Fiscal Reforms in Sikkim
193
From the above facts, it can easily be seen that the data gaps in the field of price statistics are many
as the price indices constructed by Minhas et. al. and used by researchers are not available for
Sikkim. Unless the gaps are filled, it would be difficult to update and forward the poverty line of
the base year even if the same is arrived at for say, the year 1999-2000 using the 55th round data of
the Central sample and the methodology specified by the Task Force (1979). The poverty line once
arrived at has to be updated to find the real changes in the poverty ratio over time, to see whether
the efforts of the Government in pursuing the anti-poverty measures have borne some fruits or not.
A well-contemplated plan has to be drawn up for achieving the objective of creating the relevant
data base and concerted effort to fill up the gaps initially by concentrating on the rural sector as we
have to start from zero. The existing cost of living indices for the urban sector may increase the
coverage by including the non-manual employees.
10.11 Point Estimation of Poverty Line
We have seen that the main hindrance in formulating a poverty line for Sikkim is the absence of
required cost of living indices, even if we go for using any other State poverty line of 1973-74 as
proxy. The poverty line cannot be updated by using relevant price deflators weighted by
appropriate consumption basket, as is done by the Planning Commission to protect the `purchasing
power‟ with reference to the base year. We have also observed that estimation by proxy whether it
be Assam or Manipur/Meghalaya, the dissimilarities in the size distributions make the resulting
poverty ratio more of cosmetic value. The only other alternative is to obtain a poverty line by using
data from the consumer expenditure survey by adopting appropriate calorie norms.
The alternative lies in arriving at a point estimate for the year 1999-2000 or in other words we take
the base year as 1999-2000 and use the 55th round Central sample data and the Census data for
obtaining the poverty line a la Task Force methodology. The following describes the exercise done
to arrive at the average calorie norms for rural and urban sectors of Sikkim.
10.12 Methodology for Obtaining Average Calorie Intake and Data Sets
a. The detailed age-sex distributions for rural and urban parts of Sikkim as provided by
Census 2001 are used but for children, the age-groups used by the Task Force are not available.
Hence based on the grouped frequencies the percentage distributions for children are re-distributed
(and also corrected for rounding off errors) to have the same number of age-groups. The reason is
that the ICMR calorie norms are specified for the detailed age-groups for children.
b. The population for rural and urban sectors broken up by male and female for 2001 Census
is used to calculate backwards for January 2000, the mid-point of the year 1999-2000 (55th round)
based on the yearly growth rate computed from the decennial growth rate (1991-2001).

ADB TA No. 4297-IND, Final Report
Capacity Building For Fiscal Reforms in Sikkim
194
c. Using the Age-Specific-Worker-Population-Ratio obtained from the Employment &
Unemployment survey of the 55th round for the age groups starting from 15 years and the age-sex
distribution based on 1999-2000 aggregates, the number of workers are obtained and then the
groups are collapsed into 15 + group. The complement that is, the number of non-workers is also
derived.
d. Using the percentage of main workers for rural and urban sectors from Census 1991 by
industrial division (the same for main + subsidiary workers for rural and urban being not
available), workers by sex with the help of (c) for each industrial classification.
e. The numbers of workers as per (d) are categorized as heavy, moderate and sedentary on
the basis of:
i) Heavy - Cultivation. Agricultural Labour, Mining & Quarrying, Construction
ii) Moderate - Livestock, forestry, fishing, hunting and plantations, orchards and
allied activities, Manufacturing, processing, servicing and repairs in household
industry and non household industry
iii) Sedentary- Trade &Commerce, Transport, storage and communications, Other
services.
f. Based on the above, the weighting diagrams for rural and urban sectors are separately
obtained.
g. Using the calorie norms specified by ICMR for different age x sex x activity groups, the
average calorie norms are obtained for rural and urban sectors separately. The weighting diagrams
and the average calorie norms are shown in Table 57.
The above exercise is also done based on the Census 1991 data and two alternate average calorie
norms obtained.
10.13 Results
The average calorie norm for the year 1999-2000 for rural Sikkim comes out to be 2511 Kcal
from Census 2001 data and 2360 Kcal from Census 1991 data and for urban Sikkim 2141 Kcal and
2092 Kcal respectively, surprisingly in the proximity of the Task Force estimates (1979) for the
year 1973-74. The year 1999-2000 being nearer to the Census 2001, we opt for the average calorie
norm as 2511Kcal for the rural sector and 2141 Kcal for urban.
A little introspection may lead to the reasons why the average calorie norm for Sikkim (or for that
matter, any other State) following the TF method comes so near the all India norm specified in
seventies. The age-sex distribution does not undergo drastic changes over time and since old
ICMR norms are used in absence of any later studies, the average calorie norms would hover

ADB TA No. 4297-IND, Final Report
Capacity Building For Fiscal Reforms in Sikkim
195
around the old norms. For deriving the poverty estimate, these threshold norms are unrealistic as
the bulk of the population would be taken as poor.
Table 57 Average Calorie Requirement for Rural and Urban Population of Sikkim
Weighting Diagram Calorie Norm Rural Urban
2001 1991 2001 1991
Children
< 1 2 3.18 1.71 2.38 650
1 to 4 8 9.7 5.28 7.32 1200
4 to 7 6.40 7.24 447 6.60 1500
7 to 10 5.99 8.02 4.54 5.95 1800
10 to 13 8.30 7.5 7.42 6.81 2100
Adolescents (13 to 15)
Boys 2.80 2.5 2.29 2.10 2500
Girls 2.32 2.34 2.3 1.98 2200
15+
i) Male
Heavy 20.93 19.75 3.35 3.51 3900
Moderate 2.17 2.05 4.68 4.91 2800
Sedentary 5.14 4.85 20.33 21.34 2400
ii) Female
Heavy 10.46 9.03 0.77 0.62 3000
Moderate 0.44 0.38 1.35 1.09 2200
Sedentary 1.21 1.05 6.95 5.61 1900
Non-workers
Male 9.73 5.90 12.01 8.43 2400
Female 16.96 16.51 22.69 21.35 1900
Total population 100.00 100.00 100.00 99.99
Average calorie norm 2510.83 2360.02 2140.68 2092.03
10.14 Minimum Calorie Intake in Rural Sikkim
This brings us to the concept of minimum calorie intake as the threshold norm which corresponds
to the poverty line. The upper limits of the minimum calorie intake for major States are shown in
Table 52. The fact that for all the States, the average calorific consumption has come down reflects
on the changes in the consumption pattern and hence we cannot use the calorie norms of
2511(rural) and 2141 (urban) for the base year 1999-2000. We need to consider the minimum
calorie-intake for determining the poverty line; the only north-eastern State for which results are
available is Assam, the calorie intake corresponding to the poverty line for which is seen to be
1753 in 1999-2000 in rural and less than 1478 in urban sector. We may therefore, assume the
minimum calorie norm for the rural sector of Sikkim to be 1753 Kcal and for the urban sector 1475
Kcal for determining a preliminary estimate of poverty line.

ADB TA No. 4297-IND, Final Report
Capacity Building For Fiscal Reforms in Sikkim
196
Table 58 Per Capita Per Diem Calorie-intake by MPCE Class,
55th
round, 1999-00, Rural Sector
MPCE Class (Rs) Calorie-intake (Kcal)
Assam Sikkim Manipur
000-225 1265 * *
225-255 1376 * *
255-300 1563 1607 *
300-340 1734 2442 1956
340-380 1767 1801 2704
380-420 1904 1921 3156
420-470 2084 1817 10490
470-525 2109 1859 8963
525-615 2248 1990 12776
615-775 2424 2245 13759
775-950 2730 2139 10112
>950 2803 2786 2978
All classes 1915 2024 8349
No.of sample households 3462 1056 738
No.of sample persons 19272 5173 3997 Source: NSS Report No. 471
Table 59 Per Capita Per Diem Calorie Intake by MPCE Classes, 50th round, 1993-94, Rural
Sector
MPCE Class (Rs.) Calorie-intake (Kcal)
Assam Sikkim Manipur
0-120 1095 0 53
120-140 1418 1323 1103
140-165 1509 1412 1472
165-190 1654 1541 1648
190-210 1768 1605 1741
210-235 1903 1696 1667
235-265 2000 1820 2008
265-300 2165 1877 2067
300-355 2262 2072 2319
355-455 2429 2155 2604
455-560 2628 2501 2635
560& above 2777 2474 2455
All classes 1983 1892 2157
No.of sample households 3199 480 1000
No.of sample persons 16714 2064 5465 Source: NSS Report No 405
10.15 Search for a Poverty Line for Sikkim
Till such time the ICMR prescribes minimum calorie norms for Sikkim we can use the minimum
calorie norms for rural and urban sectors of Assam for determining the poverty lines. The 55th
round distributions giving per capita per diem intake of calorie by monthly per capita expenditure
(MPCE) classes are to be used. The distributions for the 55th and 50
th rounds are given in Tables 58
and 59.
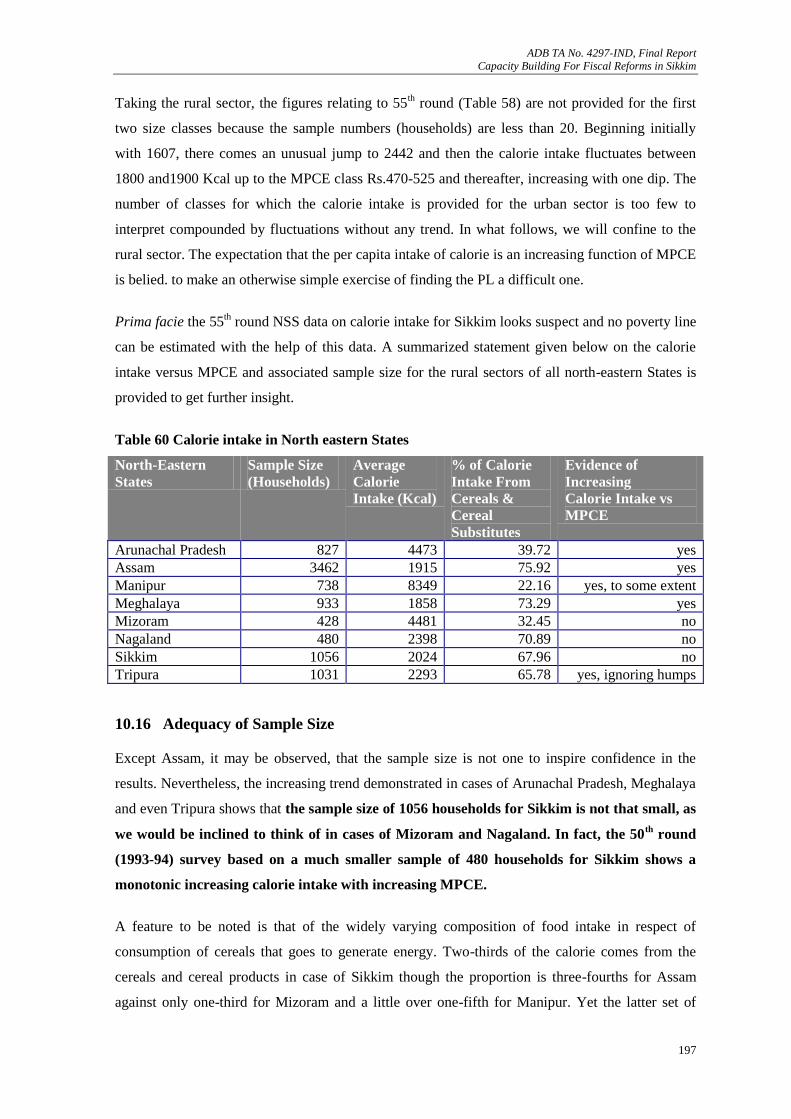
ADB TA No. 4297-IND, Final Report
Capacity Building For Fiscal Reforms in Sikkim
197
Taking the rural sector, the figures relating to 55th round (Table 58) are not provided for the first
two size classes because the sample numbers (households) are less than 20. Beginning initially
with 1607, there comes an unusual jump to 2442 and then the calorie intake fluctuates between
1800 and1900 Kcal up to the MPCE class Rs.470-525 and thereafter, increasing with one dip. The
number of classes for which the calorie intake is provided for the urban sector is too few to
interpret compounded by fluctuations without any trend. In what follows, we will confine to the
rural sector. The expectation that the per capita intake of calorie is an increasing function of MPCE
is belied. to make an otherwise simple exercise of finding the PL a difficult one.
Prima facie the 55th round NSS data on calorie intake for Sikkim looks suspect and no poverty line
can be estimated with the help of this data. A summarized statement given below on the calorie
intake versus MPCE and associated sample size for the rural sectors of all north-eastern States is
provided to get further insight.
Table 60 Calorie intake in North eastern States
North-Eastern
States
Sample Size
(Households)
Average
Calorie
Intake (Kcal)
% of Calorie
Intake From
Cereals &
Cereal
Substitutes
Evidence of
Increasing
Calorie Intake vs
MPCE
Arunachal Pradesh 827 4473 39.72 yes
Assam 3462 1915 75.92 yes
Manipur 738 8349 22.16 yes, to some extent
Meghalaya 933 1858 73.29 yes
Mizoram 428 4481 32.45 no
Nagaland 480 2398 70.89 no
Sikkim 1056 2024 67.96 no
Tripura 1031 2293 65.78 yes, ignoring humps
10.16 Adequacy of Sample Size
Except Assam, it may be observed, that the sample size is not one to inspire confidence in the
results. Nevertheless, the increasing trend demonstrated in cases of Arunachal Pradesh, Meghalaya
and even Tripura shows that the sample size of 1056 households for Sikkim is not that small, as
we would be inclined to think of in cases of Mizoram and Nagaland. In fact, the 50th
round
(1993-94) survey based on a much smaller sample of 480 households for Sikkim shows a
monotonic increasing calorie intake with increasing MPCE.
A feature to be noted is that of the widely varying composition of food intake in respect of
consumption of cereals that goes to generate energy. Two-thirds of the calorie comes from the
cereals and cereal products in case of Sikkim though the proportion is three-fourths for Assam
against only one-third for Mizoram and a little over one-fifth for Manipur. Yet the latter set of
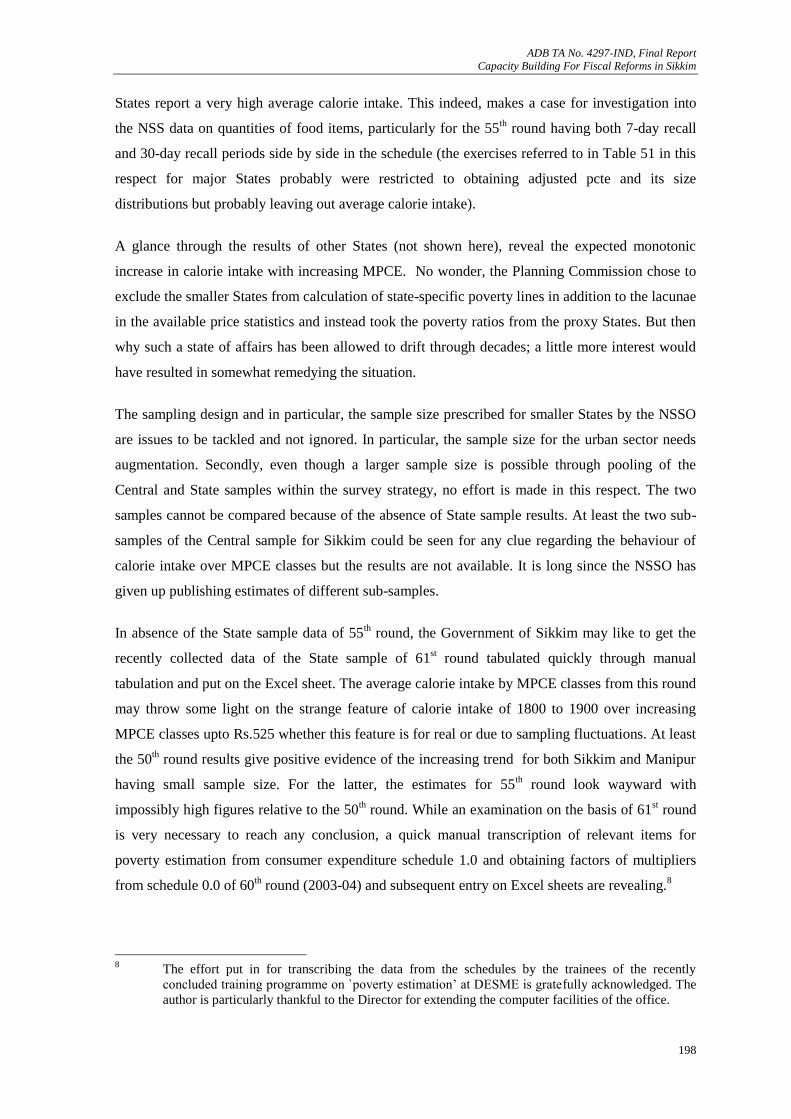
ADB TA No. 4297-IND, Final Report
Capacity Building For Fiscal Reforms in Sikkim
198
States report a very high average calorie intake. This indeed, makes a case for investigation into
the NSS data on quantities of food items, particularly for the 55th round having both 7-day recall
and 30-day recall periods side by side in the schedule (the exercises referred to in Table 51 in this
respect for major States probably were restricted to obtaining adjusted pcte and its size
distributions but probably leaving out average calorie intake).
A glance through the results of other States (not shown here), reveal the expected monotonic
increase in calorie intake with increasing MPCE. No wonder, the Planning Commission chose to
exclude the smaller States from calculation of state-specific poverty lines in addition to the lacunae
in the available price statistics and instead took the poverty ratios from the proxy States. But then
why such a state of affairs has been allowed to drift through decades; a little more interest would
have resulted in somewhat remedying the situation.
The sampling design and in particular, the sample size prescribed for smaller States by the NSSO
are issues to be tackled and not ignored. In particular, the sample size for the urban sector needs
augmentation. Secondly, even though a larger sample size is possible through pooling of the
Central and State samples within the survey strategy, no effort is made in this respect. The two
samples cannot be compared because of the absence of State sample results. At least the two sub-
samples of the Central sample for Sikkim could be seen for any clue regarding the behaviour of
calorie intake over MPCE classes but the results are not available. It is long since the NSSO has
given up publishing estimates of different sub-samples.
In absence of the State sample data of 55th round, the Government of Sikkim may like to get the
recently collected data of the State sample of 61st round tabulated quickly through manual
tabulation and put on the Excel sheet. The average calorie intake by MPCE classes from this round
may throw some light on the strange feature of calorie intake of 1800 to 1900 over increasing
MPCE classes upto Rs.525 whether this feature is for real or due to sampling fluctuations. At least
the 50th round results give positive evidence of the increasing trend for both Sikkim and Manipur
having small sample size. For the latter, the estimates for 55th round look wayward with
impossibly high figures relative to the 50th round. While an examination on the basis of 61
st round
is very necessary to reach any conclusion, a quick manual transcription of relevant items for
poverty estimation from consumer expenditure schedule 1.0 and obtaining factors of multipliers
from schedule 0.0 of 60th round (2003-04) and subsequent entry on Excel sheets are revealing.
8
8 The effort put in for transcribing the data from the schedules by the trainees of the recently
concluded training programme on `poverty estimation‟ at DESME is gratefully acknowledged. The
author is particularly thankful to the Director for extending the computer facilities of the office.

ADB TA No. 4297-IND, Final Report
Capacity Building For Fiscal Reforms in Sikkim
199
Preliminary Results of Quick Tabulation of 60th
Round (Jan-June 2003), State Sample
Table 61 shows the behaviour of calorie-intake with increasing MPCE. There is an increasing
trend initially followed by a few dips again to show the unmistakable upward movement. It is not a
monotonic increasing function, one would expect. The small sample size (of only 44 sample
villages and 176 sample households) for rural Sikkim notwithstanding, the results are encouraging.
Relatively, the quality of quantity figures is not affected as it was perhaps for the 55th round (via
the use of two recall periods side by side in the schedule).
In the 60th round, there were two types of schedules, one with 7 day recall and the other with 30
day; even in the former for cereals etc that provide the maximum proportion of energy, the recall
was 30 days. It is therefore, the questionnaire designing and the methodology of data collection
and not the sample size alone that are more important in such studies. It may be noted that the
MPCE classes need to take into account the effect due to inflation. The NSSO revises the class
limits from time to time; based on cumulative percentage of estimated number of persons, the cut-
off points or the upper limits are determined for 5%, 10%, 20%,-------------90%,95% and 100% of
the population. The same procedure is adopted for determining the upper limits of the new MPCE
classes. Thus the MPCE classes of 60th round are comparable to those of 55
th and 50
th rounds even
though the class limits are different.
Table 61 Per capita per diem calorie-intake (K Cal) by MPCE Classes 60th round (2003):
Rural Sikkim
MPCE
Class (Rs.)
Calorie-intake
(Kcal)
-300 990
300- 375 1492
375 - 430 1702
430 - 500 1289
500 - 590 1906
590 - 640 1627
640 - 710 1827
710 - 800 2033
800 - 900 2193
900 – 1060 2424
1060-1250 2906
> 1250 3598
no.of sample villages 44
no.of sample households 176

ADB TA No. 4297-IND, Final Report
Capacity Building For Fiscal Reforms in Sikkim
200
10.17 Poverty Line based on smoothed distribution
Exercise 1 We can use the overall growth rate of calorie-intake during the period from 1993-94 to 1999-00 to
correct the size distribution of 55th round by applying the same rate for all the classes with the
initial value same as in 55th round. Table 62 presents the results.
Table 62 Actual and smoothed per capita per diem
Calorie-intake for rural Sikkim
MPCE
Class (Rs.)
Per Capita Per Diem Calorie-
Intake (Kcal): 55th round, 1999-00
Actual Smoothed
000-225 * *
225-255 * *
255-300 1607 1607
300-340 2442 1649
340-380 1801 1717
380-420 1921 1814
420-470 1817 1947
470-525 1859 2008
525-615 1990 2217
615-775 2245 2305
775-950 2139 2675
>950 2786 2647
With the underlying assumptions, the use of 1753 Kcal as the norm of minimum calorie intake
leads us to the poverty line of Rs.394.84 for the rural sector. Applying this poverty line on the size
distribution, we get the HCR for rural Sikkim as 29.8%.
Exercise 2
We have seen that except for 50th round the average calorie intake is not strictly a monotonic
increasing function of MPCE. In order to bring in monotonicity necessary for determining poverty
line for 1999-00 we resort to the technique of moving average in Table 63. We discard the 55th
round distribution and use those of 50th and 60
th rounds but since the two rounds are not equally
placed around 55th round over time, we take a weighted average of the calorie- intake (C ) for
every MPCE, that is, 0.6 C60 + 0.4 C50, assigning higher weight to the 60th round, being nearer to
1999-00. It is seen from Table 62 that the resultant relationship is much smoother but it lacks
monotonicity. For this purpose, except for first and the last values, a three-point moving average is
obtained. The smoothed values, as expected, show the monotonic increase over MPCE classes.
Applying the minimum threshold calorie-intake of 1753 Kcal to the smoothed distribution we
get through simple interpolation the poverty line as Rs.419 which in turn, gives a Head
Count Ratio of 38.8 % for the rural sector of Sikkim.

ADB TA No. 4297-IND, Final Report
Capacity Building For Fiscal Reforms in Sikkim
201
Table 63 Estimated Per Capita Per Diem Calorie Intake for 1999-2000 From 50
th Round and 60
th Round
MPCE
(Rs.)
Per Capita Per Diem Calorie (Kcal)
Wtd. 50th & 60
th moving average
0 – 225 990
225-255 1424 1333
255- 300 1586 1467
300- 340 1390 1587
340- 380 1786 1610
380-420 1655 1755
420-470 1824 1816
470-525 1971 1980
525-615 2145 2144
615-775 2316 2402
775-950 2744 2736
950+ 3148
Out of the two estimates, one based on the smoothed distribution using 50th round and 55
th round
and the other based on 50th and 60
th rounds, the latter carries less assumptions and is in proximity
of the PC estimate of poverty ratio that is, 40% though the 55th round distribution is discarded. An
exercise based on all the three rounds resulted in abnormally high poverty line and it was thought
proper not to include the 55th round.
An important point to be noted in the context of the exercises referred above is that the poverty
line is very sensitive to changes in calorie-intake, in turn affecting the estimate of Head Count
Ratio drastically. It is therefore, important to have a reliable distribution of calorie-intake by
MPCE classes and that is possible only with reasonably large sample size. The Central sample
alone or the State sample will not yield reliable results. In this backdrop, the estimate of poverty
arrived above may be taken as preliminary and it needs to be confirmed by results of other rounds.
10.18 Case for a Fresh Survey
To sum up, the two crucial inputs for poverty estimation for Sikkim are (i) minimum threshold
calorie-intake and (ii) the distribution giving per capita per diem calorie-intake by MPCE classes.
On both counts, Sikkim does not have the requisite data. The former can only be determined by the
ICMR through a special study. For the latter, if the effort to pool the Central and State samples
fails, an independent survey with an appropriate sample design may be launched. By
appropriateness, it is meant that the design should preferably be self-weighting (this is necessary to
dispense with too many multipliers and avoiding complicated programme writing) and procedures
of hamlet formation and second stage stratification be simplified (to avoid sampling biases on this
count) and proper checks on quantity figures of food items be devised. The sample size should be
doubled in comparison to the present State sample (that is, equivalent to the sample size of Central
and State samples). Suitable device is to be thought of to have enough sample size of the non-

ADB TA No. 4297-IND, Final Report
Capacity Building For Fiscal Reforms in Sikkim
202
affluent households so that firm estimates of quantities of consumption be obtained for the middle
range of population.
10.19 Alternative Method
There is no NSSO methodology for arriving at the poverty profile for any State. The Planning
Commission is the nodal agency for estimating poverty and as such the NSSO does not furnish any
estimates of the poverty ratio. Besides furnishing the tabulation required by the Planning
Commission, the NSSO does provide estimates of nutrition intake in terms of calorie intake per
consumer unit per day (rate of equivalence of a normal person on the basis of age-sex composition
of a person). From the 26th round, the NSS has been using a level of 2700 kcal per consumer unit
per diem as a standard measure of actual intake. This level is referred to as the `norm‟ level of
calorie intake both for the rural and urban areas. Estimates of calorie intake per consumer unit per
day expressed as percentages of this norm presented in the report No.471 could be used for
arriving at alternative estimates of poverty in the sense of minimum nutritional intake for Sikkim.
If this method is to be adopted for getting the poverty profile for Sikkim, the levels of nutrition
intake as obtained via intake of three nutrients calorie, protein and fat could be used for assessing
the living standards of different sections or classes of population. More specifically, the
distributions of households and persons by calorie intake separately by monthly per capita
expenditure (MPCE) classes may be used. The results furnished in the Appendix of the report
however, do not lead us anywhere as in every MPCE class there is a substantial proportion of
households/persons whose calorie intake is less than the normal. It is not understood why such a
mass of data are published and who could be the possible user?
10.20 Capacity Building for Poverty Estimation
Immediate steps are suggested for enhancing the capability of the Directorate of Economics &
Statistics and Monitoring & Evaluation (DESME) to bring out poverty estimates not only for the
base year (1999-00) but also for later years.
a. Up-gradation of Library: The existing reports, documents and brochures may be properly
documented and kept methodically. The missing issues of Volumes 1 & 2 of Instructions to Field
Workers of NSS rounds may somehow be obtained and kept properly. Similarly, the NSS Reports
and volumes of Sarvekshana for past rounds, if not already there, be procured, failing which the
NSSO may be approached for soft copies available at price on discs. The Planning Commission
Reports coming out from time to time dealing with poverty may be procured. All journals dealing
with price statistics, for example, Indian Labour Journal, Indian Labour Statistics should be there
in the library. In fact, a list of all the journals dealing with basic statistics of the Indian Economy,
not in the library, be prepared for replenishing the library gradually.

ADB TA No. 4297-IND, Final Report
Capacity Building For Fiscal Reforms in Sikkim
203
b. Retrieval of data: The filled –in-schedules of the NSS State Sample for all the past rounds may
be traced and data entered (or micro-filmed). In particular, all the Household consumer
expenditure and employment-unemployment schedules of the quinquennial rounds that is, 38th,
43rd
, 50th and 55
th should be data entered along with multipliers. This should be followed by efforts
to rope in the Data Processing Division of the NSSO, to help the DESME to complete the lagging
data processing work. Special efforts be made to finish the processing of the latest quinquennial
round that is, the 61st round. The left out annual rounds could be then be taken up.
c. Quality of Field Data: One of the main reasons for the unprocessed State sample data
presumably is the not-so-good quality of filled –in schedules. The reason again, presumably is not-
up-to-the-mark supervision supposed to be three or even four-tiered. A Committee may go into the
matter first to investigate as to why despite the Central and Regional Training Conferences, held
by NSSO for every round, the basic quality of data is not acceptable and secondly, to see why the
supervision mechanism fails and lastly, whether the sample design is too complicated and
demanding to warrant a change.
d. Cost of Living Indices: For the weighting diagrams, the data from consumer expenditure
schedules of 50th or 55
th round or both for the total rural and total urban sectors may be first used.
The price collection from retail shops already identified for the urban sector industrial workers be
extended to the entire urban sector. For the rural sector, the job of identifying retail shops in each
of the district may be taken up with a view to obtain cost of living for different segments of the
rural population. For details, officers may be deputed to the Labour Bureau for the methodology.
Till the time the system gets going, rural prices could be obtained for170 items from the household
consumer expenditure surveys of the quinquennial rounds. A fractile classification of households
would enable one to arrive at the prices paid by population between 30th and 70
th fractiles that is,
the middle population. And we get a time series to obtain the cost of living indices for the middle
range of rural population, having taken the 38th round or 43
rd whichever is available as the base
year.
10.21 Summary
Sikkim does not have a poverty line of its own; the poverty ratio of Assam and its movement due
to price adjustment of its poverty line are deemed to hold good for Sikkim too. While this
estimation by proxy is not the least desirable, the size distribution (average per capita calorie-
intake by MPCE classes) of Sikkim which apparently till now has not been looked into, indicates
that the Assam HCR implies a poverty line of Rs.425, by far the highest in India. The only
estimate for Sikkim is by Dubey & Gangopadhay who too, use rural Manipur and urban
Meghalaya prices that is, here again, the estimation is by proxy. Moreover, these estimates have an
upward bias. Be that as it may, the evidences suggest that the HCR for Sikkim on the whole, could
be in the range of 37.4% to 41.3% during 1993-94.

ADB TA No. 4297-IND, Final Report
Capacity Building For Fiscal Reforms in Sikkim
204
The latest year for which official estimates are available pertains to 1999-00, that of the 55th round
of NSS. There is a general feeling among researchers that poverty is underestimated in this round
due to simultaneous use of 7-day and 30-day recall periods. This resulted in various adjustments.
In general, the adjusted poverty ratios were seen to be higher than the official estimates. If one
goes by Assam‟s HCR, taking into account the adjustments, the range for rural Sikkim is observed
to be 35.5% to 53.4% in 1999-00 whereas it was 40% to 45% in 1993-94. It can be concluded that
a drastic decline in HCR did not happen during 1993-94 to 1999-00. The main handicap for
Sikkim falling in line with major states with respect to poverty estimation is the absence of cost of
living indices in rural areas.
The results of successive rounds of NSS did reveal that the norms of 2400 Kcal for the rural and
2100 for the urban were never achieved by the price- adjusted poverty lines. There was a decline in
the average calorie-intake over the years.
In our search for a preliminary estimate of poverty for Sikkim therefore, the Task Force
methodology of obtaining average calorie intake was applied for the base year, taken as 1999-00,
using the relevant data from Population Censuses 1991 and 2001 and NSS data on employment
and unemployment from 55th round. The detailed exercise was carried out for 1999-00 using both
1991 and 2001 censuses yielding two sets of estimates. The norms based on 2001 census were
accepted being nearer to the base year. The norms of 2511 Kcal for rural and 2141 for the urban,
surprisingly were in the proximity of the official norms obtained for all India for 1973-74. If these
norms were used, the bulk of the population would be deemed to be poor. This necessitates the use
of the concept of minimum calorie-intake, arrived at by one corresponding to the poverty line.
Since the only north-eastern state that is, Assam is vested with an official poverty line, .the
minimum calorie intake corresponding to its poverty line that is,1753 Kcal for rural is taken as the
norm.
Having arrived at the calorific norms, the next step to use the size distributions of consumer
expenditure giving average calorie intake for each class for deriving the poverty line was throttled
because of the absence of any increasing trend of calorie-intake with increasing MPCE.
Apparently the NSS distribution for the 55th round looks suspect in the presence of a very positive
evidence of increase according to 50th round distribution.
On the assumption of the overall growth rate in calorie consumption during the period, the
observed values for each class except the initial one were corrected. The resulting distribution gave
a monotonic increase in consumption of calorie according to increasing MPCE. Using this
distribution and the calorie norm of 1753 Kcal for the rural sector, the poverty line for rural Sikkim
came to be Rs.395 which when applied to the distribution of persons by MPCE gave the HCR as

ADB TA No. 4297-IND, Final Report
Capacity Building For Fiscal Reforms in Sikkim
205
29.8%. The same for the urban sector was not attempted because of very few classes for which
results are given. This indicates that the sample size for the urban sector should be increased.
The results obtained through copying of relevant data of 60th round State sample and subsequently
working on Excel sheets yielded the distribution. A weighted average of the calorie intakes of 50th
and 60th rounds for every MPCE class gave the desired distribution but the technique of moving
average was applied to get the monotonic increasing relationship. This was used for getting the
poverty line (Rs.419) for rural sector. The HCR of 38.8% for 1999-00 obtained through this
exercise seems to be a better preliminary estimate.
Thus, with all the constraints of data and number of assumptions, it can be concluded that the Head
Count Ratio for rural Sikkim was perhaps in the range of 40 to 45% in 1993-94 and came down
probably to around 39% in 1999-00.
REFERENCES (Chapter 10)
Planning Commission (1979): The Report of the Task Force on Projection of Minimum Needs and
Effective Consumption Demand, Perspective Planning Division, GOI, New Delhi.
Planning Commission (1984): The Report of the Study Group on the Concept and Estimation of
Poverty Line, PPD, GOI, New Delhi.
Planning Commission (1993): The Report of the Expert Group on Estimation of Proportion and
Number of Poor, PPD, GOI, New Delhi.
Dandekar,V.M and Rath, N (1971: Poverty in India, Indian School of Political Economy, Pune.
Dubey, A and Gangopadhyay, S (1998): Counting the Poor, Sarvekshana, Analytical Report No.1,
Department of Statistics, GOI, New Delhi.
Minhas, B,S., Jain, L.R., Kansal, S.M.and Saluja, M.R (1988).: Measurement of General Cost of
Living for Urban India, all India and Different States, Sarvekshana, 12, 1-23.
Minhas, B.S. and Jain, L.R (1989): Incidence of Rural Poverty in Different States and all-India,
1970-71 to 1983 in `Agricultural Development Policy, Adjustment and Reorientation,
Oxford and IBH, New Delhi.
Minhas, B.S., Jain, L.R. and Tendulkar, S.D(1991): Rural and Urban Cost of Living: 1983 to
1987-88, State-wise and All India‟, Journal of Indian School of Political Economy, 3, 420-
442.
Sundaram, K (2003): Poverty Line in BPL Census 2002: Some Comments on Proposed
Methodology, Economic and Political Weekly, Vol 38, No.9, March 1.
Sundaram,K and Tendulkar, S (2003): Poverty in India in the 1990‟s: An Analysis of Changes in
15 Major States, Economic and Political Weekly, Vol 38, No.14, April 5.
Deaton, Angus and Dreze, Jean (2002): Poverty and Inequality in India: A Re-Examination,
Economic and Political Weekly, September7, pp 3729-3748.
Deaton, A (2003): Adjusted Poverty Estimates for 1999-2000, Economic and Political Weekly,
Vol38 (4), January 25.
Srivastava, D.K., Sanyal, S.K., Bhujanga Rao, C and Chakraborty, P: India: Fiscal Reforms for
Poverty Reduction, Paper1: Approach, Trends and Issues, National Institute of Public
Finance and Policy, March 2004.
National Sample Survey Organization: Report nos. 405, 457 and 471, Ministry of Statistics and
Programme Implementation, GOI, New Delhi
National Sample Survey Organisation: Level and Pattern of Consumer Expenditure: 1993-94,
Sarvekshana, Vol XIX, No.3, Jan-March 1996.
Meenakshi, J.V and Brinda Vishwanathan(2003): Calorie Deprivation in Rural India, Economic &
Political Weekly, Vol38, No.4, January 25.

ADB TA No. 4297-IND, Final Report
Capacity Building For Fiscal Reforms in Sikkim
206
Annexures
Annexure 1.1: The Implications of TfFC Report on State Finances of Sikkim
Tax Revenue Devolution:
As per the recommendations of the TfFC, the States share has been fixed at 30.5 per
cent of the net proceeds of sharable Central Taxes. Out of this, the share assigned to
Sikkim is 0.227 per cent. In the case of service tax, the share of Sikkim, however, is
0.230 per cent. The share of Central taxes and duties projected for Sikkim during the
award period of TfFC is Rs. 1392.94 crore.
Grants-in-aid:
What Sikkim gets by way of grants-in-aid on the basis of TfFC Report is given in Table
6, Chapter 2.
By far the single largest item under grants-in-aid is non-plan revenue gap grant which is
Rs. 188.67 crore for the five year period. This amount, however, is significantly lower
than what the State govt got from EFC for the period 2000-05 and what other small
States of North East are getting from TfFC. Apparently a large lottery revenue for
Sikkim in the base year led the TfFC to project a very rosy picture for the State during
2005-10 and that in turn resulted in a lower non-plan revenue gap grant for the State.
The TfFC has provided Rs 100 crore of grants-in-aid for specific needs of the State.
This is meant for an airport. But this amount will be re-imbursed to the State only on
utilization. It is important to note that the EFC had provided Rs 50 crore for the same
purpose, but the State could not utilize it.
The TfFC has imposed conditions on release of grants-in-aid for maintenance of roads
and bridges as well as for maintenance of public buildings. The TfFC has stipulated:
(i) These grants should be spent on non-salary maintenance of Roads & Bridges and
Buildings; (ii) The grants meant for buildings should be spent on public buildings other
than residential; (iii) These grants should be budgeted and spent for meeting the non-
plan revenue expenditure under the specific heads and sub-heads; (iv) The grants may
be released in two equal installments in a financial year. While there will be no pre-
conditions for release of the first installment in any year, the second installment will be
released on fulfillment of detailed year wise pre-conditions laid down in Annexure 10.4,
10.5 and 10.6 of TfFC Report.
The TfFC has recommended an amount of Rs.8.00 crore as grants-in-aid for
maintenance of forests and an amount of Rs 5.00 crore as grants-in-aid for heritage
conservation. These grants are additionalties, over and above the normal expenditure
incurred by the State Government and are available without any conditions.
The Government has accepted the recommendation of TfFC to provide grants-in-aid to
local bodies. The share of Sikkim is Rs. 13.00 crore for rural local bodies and Rs. 1.00
core for urban local bodies. The commission has emphasized that of the grants
allocated to Panchayats, priority should be given to expenditure on the O & M costs of
water supply and sanitation and that at least 50% of the grants provided to each State
for the urban local bodies should be earmarked for the scheme of solid waste
management. Besides expenditure on the O & M costs of water supply and sanitation in
rural areas and on the schemes of solid waste management in urban areas, panchayats
and urban local bodies should, out of the grants allocated, give high priority to
expenditure on creation of a data base and maintenance of accounts.
Calamity Relief Fund:
The TfFC has recommended the continuation of the scheme of Calamity Relief Fund
(CRF) in its present form with contributions from the Centre and the States in the ratio
of 75:25. The size of the CRF for the 5 year period 2005-10 for Sikkim is Rs. 92.97 crore of which 69.74 crore is the Central share.

ADB TA No. 4297-IND, Final Report
Capacity Building For Fiscal Reforms in Sikkim
207
Debt Relief to States:
The TfFC has recommended that the scheme of Fiscal reform Facility may be replaced
by a scheme of Debt Relief over the period 2005-10. The scheme of relief
recommended by the commission envisages:
(a) The rescheduling of all Central loans contracted till 31-3-2004 and
outstanding as on 31-3-2005 into fresh loans for 20 years carrying 7.5% interest with
effect from the year a State enacts the Fiscal responsibility Legislation.
For Sikkim debt relief awarded by TfFC through consolidation is a total of Rs.
44.65 crore over the award period of 5 years comprising of relief of Rs. 10.69 in
repayment of the principle and Rs. 33.96 crore of interest liability.
The Government has accepted these recommendations subject to the condition laid
down by the TfFC. It also expects that the states would comply with the obligations
regarding Fiscal deficit and Revenue Deficit imposed by the Fiscal Responsibility
Legislation. The Centre would request the next Finance Commission to make
appropriate adjustment incase the State availing of the debt relief is not able to comply
with the Fiscal Responsibility Legislation. It is important to note in this connection that
Sikkim along with a few other small special category states are in a special situation as
they are not in revenue deficit but are in surplus.
(b) The TfFC has also recommended a debt write-off linked to reduction in
revenue deficit by a State. The quantum of write-off of repayment would be linked to
the absolute amount by which the revenue deficit is reduced in each successive year
during the award period. In accordance with the recommendations of the TfFC, the
benefit of write-off would be available only if the fiscal deficit of the State is contained
to the level of 2004-05. If in any year, the fiscal deficit exceeds this level, the benefit of
write-off, even if eligible otherwise, would not be given. The Government has
accepted this recommendation.
In the case of Sikkim along with Arunachal Pradesh, Jammu & Kashmir, Meghalaya,
Nagaland and Tripura, since they are in revenue surplus the calculation of incentive
criteria is different from that for other States. The details are worked out by the TfFC
and given in Annexure 12.8 of the Report.
For Sikkim repayments due during 2005-10 after consolidation and reschedulment is
Rs. 48.07 crore with an annual repayment due of Rs. 9.61 crore. If the State
Government is able to maintain a revenue surplus of Rs. 168 crore (which is the average
for 3 years 2001-04) in each of the five years of the award period, no repayment is
required.
Central Assistance for State Plans:
The TfFC has recommended that the Centre should release only the grant portion of
Central Assistance for State Plan and leave the State to raise loan portion from other
sources. For States unable to raise loans from the market, the Centre may act as a
financial intermediary but without any subsidization of cost.
This approach has been accepted in principle to be implemented in phases, in
consultation with the RBI. From 2005-06, the States would be allowed at their
discretion, not to draw the loan portion of the Central Plan Assistance.
The State Government of Sikkim has to take a considered view about this.
External Assistance:
The TfFC has recommended that the Centre should pass on external assistance on
back-to-back basis to States and manage it through a separate Fund in the Public Account.

ADB TA No. 4297-IND, Final Report
Capacity Building For Fiscal Reforms in Sikkim
208
The Government has accepted this recommendation subject to the condition that the
service cost and exchange rate risk would be passed on to the States under this
arrangement.
Accounting Procedure:
The Commission has recommended a move by the Centre towards introduction of
accrual accounting and standardization of accounting classification down to the object
head for all States to improve fiscal management.
The Government has accepted this recommendation in principle. The Government
Accounting Standards Board in the office of the Comptroller and Auditor General of
India would be asked to draw a detailed road map and operational framework for its
implementation.
Annexure 2.1 Important Indicators of Trends in State Finances
Rs. Crore
Item 1996-97
1997- 98
1998-99 1999- 00
2000-01
2001- 02
2002- 03
2003-04 2004-05 (BE)
(1) (2) (3) (4) (5) (6) (7) (8) (9) (10)
State’s own tax revenue 29.91 36.50 46.76 49.07 65.39 80.38 105.53 108.01 93.58
Share of central loans 73.34 79.91 92.21 99.54 72.20 84.83 77.20 112.33 126.64
Net non-tax revenue 39.34 43.03 42.92 64.79 65.63 71.12 143.36 95.04 109.81
.Grants in aid 225.00 253.24 280.78 320.47 435.98 513.75 581.95 583.56 749.30
Capital receipts 22.29 33.58 62.39 132.64 37.60 58.12 39.40 53.83 97.69
Total receipts (1 to 5) 395.88 446.26 525.06 666.51 676.80 808.20 947.44 952.77 1177.0
Non-Plan expenditure 203.69 255.07 357.87 397.41 383.99 414.49 462.11 492.37 593.99
Interest payment 32.98 40.94 52.47 67.92 78.67 84.14 89.53 92.50 96.84
Plan expenditure 219.83 223.55 251.50 228.94 306.85 403.39 457.05 457.81 694.48
On revenue account 125.17 116.33 159.73 134.60 155.92 192.66 248.06 246.32 275.62
On capital account 94.16 107.22 91.77 94.34 150.93 210.73 208.98 211.49 418.86
Total expenditure 423.02 478.62 609.37 626.35 690.84 817.88 919.15 950.18 1288.5
Revenue exp. (7+11) 328.86 371.40 517.60 532.01 539.91 607.15 710.17 738.69 869.61
Capital exp.(9+12) 94.16 107.22 91.77 94.34 150.93 210.73 208.88 211.49 418.86
Revenue deficit (1+2+3+4-14)
-38.73 -41.28 54.93 -1.86 -99.29 -142.93 -197.9 -160.25 -209.72
Fiscal deficit 55.90 67.01 146.86 92.55 50.50 66.85 9.89 50.26 208.76
Primary deficit (17-8) 22.92 26.07 94.39 24.63 -28.17 -17.31 -79.64 -42.24 111.92
GSDP at current prices 553.00 651.00 782.00 840.00 976.00 1072.00 1153.0 1274.00 1408.0
Public debt 261.88 296.52 357.92 490.62 526.76 583.94 622.12 674.96 772.27
Source:
Annexure 2.2 Pre-Devolution Non-Plan Revenue Surplus/Deficit(-)
Rs. Crore
State 2005-06 2006-07 2007-08 2008-09 2009—10 2005-10
1 2 3 4 5 6 7
Arunachal Pradesh -535.21 -564.47 -639.05 -671.81 -714.68 -3125.22
Assam -3263.86 -3356.94 -3730.26 -3794.54 -3838.37 -17983.970
Manipur -1139.43 -1220.17 -1323.99 -1418.62 -1511.21 -6613.42
Meghalaya -715.93 -747.43 -838.93 -868.32 -902.86 -4073.47
Mizoram -755.73 -806.72 -892.27 -964.16 -1025.43 -4444.31
Nagaland -1234.13 -1312.98 - 1440.34 -1531.46 -1631.26 -7150.17
Sikkim -274.39 -284.71 -325.56 -335.53 -360.02 -1580.21
Tripura -1433.25 -1512.35 -1637.01 -1723.12 -1814.56 - 8120.29
Source: Report of the Twelfth Commission, Govt. of India, February, 2005.

ADB TA No. 4297-IND, Final Report
Capacity Building For Fiscal Reforms in Sikkim
209
Annexure 2.3 Post Tax Devolution Non-Plan Revenue Surplus/Deficit(-)
Rs. Crore
State 2005-06 2006-07 2007-08 2008-09 2009-10 2005-10
Arunachal Pradesh -271.84 -262.94 -293.07 -273.92 -256.11 -1357.88
Assam -305.67 29.83 155.86 674.49 1312.21 1866.72
Manipur -808.39 -841.17 -889.10 -918.50 -934.82 -4391.98
Meghalaya -376.67 -359.02 -393.24 -355.78 -312.15 -1796.86
Mizoram -537.19 -556.52 -605..17 -634.00 -644.91 -2977.79
Nagalalnd -993.65 -1037.66 -1124.44 -1168.17 -1212.58 -5536.50
Sikkim -66.81 -47.06 -52.86 -21.94 1.40 -187.27
Tripura -1041.91 -1064.30 -1122.91 -1131.90 -1133.18 -5494.20
Total States
(Deficit)
-15091.86 -11315.21 -10922.15 -9998.51 -9528.14 -56855.87
Source: Report of the Twelfth Finance Commission, Govt. of India, February, 2005.
Annexure 2.4 Grant-in-aid for Non-Plan Revenue Deficit (2005-10)
Rs. Crore
States 2005-06 2006-07 2007-08 2008-09 2009-10 2005-10
1 2 3 4 5 6 7
Arunachal
Predesh
271.84 262.94 293.07 273.92 256.11 1357.18
Assam 305.67 Nil Nil Nil Nil 305.67
Manipur 808.39 841.17 889.10 918.50 934.82 4391.98
Meghalaya 376.67 359.02 393.24 355.78 312.15 1796.86
Mizoram 537.18 556.52 605.17 634.00 644.91 2977.79
Nagaland 993.65 1037.66 1124.44 1168.17 1212.58 5536.50
Sikkim 66.81 47.06 52.86 21.94 Nil 188.67
Tripura 1041.91 1064.30 1122.91 1131.90 1133.18 5494.20
Total States 15091.86 11315.21 10922.15 9998.51 9528.14 56855.87
Source: Report of the Twelfth Finance Commission, Govt. of India, February, 2005.

ADB TA No. 4297-IND, Final Report
Capacity Building For Fiscal Reforms in Sikkim
210
Annexure 2.5 Projection of Baseline and Reform Scenarios
Baseline Scenario
Baseline scenario depicts the continuation of the past trend in State‟s own revenue receipts and
revenue expenditure. The figures given by the State Government for the year 2004-05 pre-actual
forms the base year in the projection exercise and the forecasting has been carried out for a
medium term during the period 2005-06 to 2009-10. Overall approach in the projection exercise
has been forecasting own tax, non-tax revenues on the basis of past trends and central transfers on
the basis of Twelfth Finance Commission‟s recommendations. The expenditures are categorized
under broad heads of interest, pensions, major departmental expenditures and other revenue
expenditures. Information regarding salary expenditures has been available only for regular
employees. Wage bill pertaining to work charge, muster roll and other temporary staffs has been
generally shown under departmental expenditures. Thus projection of major departmental
expenditures and other revenue expenditures includes expenses pertaining to wages and salaries.
Revenue Receipts
Revenue receipts consists of own tax revenue and own non-tax revenue generated by the State
government and Central transfers that include share in central taxes and grants under plan and non-
plan heads
1. Own Tax Revenue
Own tax revenue is projected to grow at the rate 10 per cent per annum during the period 2005-06
to 2009-10. Own tax revenue is bundled together as was done by the TfFC. It should be
mentioned that while projecting the own tax revenue of the state income tax collected under State
laws have been retained under state taxes as the scenario is created on the logic of „business as
usual‟ approach
2. Own Non-tax Revenue
Own non-tax revenue is expected to grow at 10 percent during the projection period. As for lottery
income, the three year average net revenue for 2000-01, 2001-02, and 2003-04 is taken as the base
level, i.e., excluding the figure for 2002-03 which was exceptionally high. The base level figure is
expected to continue for the forecast period as assumed by the TfFC.
3. Central Transfers
Share of central taxes and non-plan grants are assumed to be same as recommended by the TfFC.
In the case of plan grants it is assumed that they will grow at the same rate as nominal GDP.
Revenue Expenditure
As far as revenue expenditure is concerned interest and pension forecasts are the same as those
adopted by the TfFC. In the case of other revenue expenditure, the trend growth rates experienced
during 1993-94 to 2004-05 have been used for forecasting the figures for the medium term.

ADB TA No. 4297-IND, Final Report
Capacity Building For Fiscal Reforms in Sikkim
211
Department specific projections have been made for important departments of education, health,
police, power and transport. The rest of the departments have been clubbed together for projection
purpose.
Gross State Domestic Product (GSDP)
The GSDP growth is assumed to be 12 percent in nominal terms during the forecast period which
is the same as in the case of TfFC.
Capital Outlay
Capital outlay is projected to grow at the rate 12 percent, which was the trend over 1993-94 to
2003-04.
Reform Scenario
As compared to the baseline scenario, the reform scenario has considerable scope for policy
interventions. Except for share of central taxes, non-plan grants, plan grants and pension
expenditure, all other fiscal variables are considered endogenous.
1. Own Tax Revenue
Own tax revenue of the State has been projected taking into account the performance of individual
taxes in the recent past and the proposed reform measures. The individual taxes are projected by
applying a prescriptive growth rate that was estimated by multiplying expected buoyancy and
GSDP growth of 12 percent. The individual buoyancies are calibrated taking into account the
buoyancy estimated over 1993-94 to 200-03-04 and any improvement due to tax reforms. An
important component of tax reform is the introduction of VAT with effect from April 2005. In the
case of Sikkim, however, increase in the sales tax revenue buoyancy since 1999-2000 with the
introduction of floor rates and plucking of the loopholes has been significant. The prescriptive
growth rate is taken at 14.40 percent per annum comprising of revenue buoyancy of 1.2 percent
and nominal GSDP growth rate of 12 percent. Similarly applying plausible revenue buoyancies
for other major components of own tax revenues like state excise, land revenues, stamp duty and
registration, motor vehicle taxes and other taxes, own tax revenue forecasting for the period 2005-
06 to 2009-10 has been made.
Tax buoyancies used for projection:
Sales tax : 1.200
State Excise : 1.000
Land Revenue : 0.500
Stamps & Registration Duties : 1.000
Motor Vehicle Tax : 1.200
Other Taxes : 1.200

ADB TA No. 4297-IND, Final Report
Capacity Building For Fiscal Reforms in Sikkim
212
2. Non-tax Revenue
Non tax revenue is projected net of lottery income. The principal components are interest and
dividends, general services, social services and economic services. Except three items under
economic services viz. forestry, power and transport, all others are expected to growth at 12
percent, same as the nominal growth of GSDP. Considering the need for preserving the forests
and in view of the fragile nature of environment in the State, revenue from forestry is kept at the
base year level throughout the forecast period. Power and Transport being two economic services
which involve substantial subsidies, significant improvement in revenues from user charges is
expected. Revenue from power is expected to grow at 24 percent per annum and revenue from
transport is projected to grown at 18 percent per annum. Revenue growth from power need not
necessarily be from increased tariff. It could very well be achieved by improving the operations
of the power sector including reducing Transmission and Distribution (T&D) losses. Similarly in
the case of transport also increase in fare/fright charges need not be the source of revenue
improvements. Improvements in operational efficiency can bring in more revenues.
Net lottery incomes for the base period is taken as the three year average for 2001-02, 2003-04 and
2004-05 which worked out to 27.91 crore. The same level of net lottery income is expected for
each of the forecast years.
3. Central Transfers
Share of central taxes and non-plan grants are assumed to be same as recommended by the TfFC.
In the case of plan grants it is assumed that they will grow at the same rate as nominal GDP.
Revenue Expenditure
In the total revenue expenditure about 70 percent is accounted for by non-plan expenditure in the
base period. This includes interest liability as well as pension payments. While pension figures
are as projected by the TfFC, interest figures have been taken after adjustments for interest
reduction arising from rescheduling and rate reduction on outstanding debt to the Centre as
recommended by the TfFC. While projecting the revenue expenditure of various departments, a
clear distinction is made between plan and non-plan expenditure on the one hand and salary and
O&M expenditure on the other. Non-plan salary expenditure is expected to grow at a rate not
exceeding 5 percent. At the same time there is a genuine need to raise the operation and
maintenance (O&M) expenditure significantly to generate the intended outcomes of public
expenditure. It has to be noted that a substantial share of the plan revenue expenditure is also on
account of salary to employees who have been continuing from plan to plan. For all practical
purpose this is also in the nature of non-plan expenditure. Indeed, exceptions apart there is hardly
any need for fresh recruitment except in Education and Health during the medium term. The
salary expenditure even on the plan side should be growing at less than 10 percent per annum.

ADB TA No. 4297-IND, Final Report
Capacity Building For Fiscal Reforms in Sikkim
213
Projection of revenue expenditure on power and transport need special mention. Since power and
transport in the state are departmentally operated and the net revenues of these departments are
significantly negative, the subsidy burden is directly borne by the state govt. Considering the
difficult terrain and the low levels of income of majority of the Sikimese it is unrealistic to expect
to run these facilities without subsidies. However, there is need for improving the operational
efficiencies of these departments, reducing the non-functional staff in these departments and
appropriately increasing the user charges. The combined effect of these measures is expected to
reduce the subsidies considerably.
The growth rates used to project departmental expenditures are calibrated taking into account their
past trends and recommendations for reform measures.
Departmental growth Rates Used in the Projection
Education : 15
Health : 15
Police : 6.56
Power : 10
Transport : 5
Other Revenue Expenditure : 10
Capital Outlay
Two scenarios under reforms have been created by projecting capital outlay to grow at 12 and 10
percent respectively.

ADB TA No. 4297-IND, Final Report
Capacity Building For Fiscal Reforms in Sikkim
214
Annexure 8.1 Profile of SLPEs in Sikkim in 2001-02 (Rs in crore)
Name of the
enterprise
Establishment Typology Classification Equity Debt Investment Net
Profit /
losses
Reserves Accumulated
profit/loss
Turnover Net Worth Capital
Employed
Contri-
Bution
SIDICO 1977 Govt. Company Financial 16.04 3.42 19.46 0.15 2.14 -10.34 1.19 7.84 21.6 0.17
State Bank of
Sikkim
1968 Public Corporation Financial 0.58 3.98 4.56 -1.85 9.48 -23.26 9.54 0 10.06 2.38
Sikkim State Co-operative Bank
1998 Co-operative society Financial 8.5 0 8.50 1.09 0.6 1.1 1.76 0 22.36 0
Sikkim Jewels 1972 Govt. Company Manufacturing 5.49 1.61 7.10 -0.06 0.86 0.62 2.26 6.19 4.72 0.06
Sikkim Hatchery 1994 Govt. Company Manufacturing 0.46 0 0.46 0 0 0 1.2 0 0 0
Sikkim Poultry 1999 Govt. Company Manufacturing 0.79 0 0.79 -0.02 -0.11 -0.26 0 0.53 0.54 0
Sikkim Precision Industries
1999 Govt. Company Manufacturing 0 0 0.00 0 0 0 0 0 0 0
SITCO 1976 Govt. Company Manufacturing 10.97 0.99 11.96 -0.51 5.47 -5.11 4.86 12.27 11.31 1.53
Tea Board of Sikkim 1974 Public Corporation Manufacturing 19.52 0 19.52 0.08 0 8.04 2.01 7.91 8.54 0.16
Sikkim Milk Union 1980 Co-operative society Manufacturing 0.02 0.08 0.10 -0.75 2.67 -1.22 4.39 1.41 -0.4 -0.26
Govt. Fruit Preservation Factory
1964 Govt. Company Manufacturing 0 0 0.76 0.05 0 0.11 1.31 0.75 1.96 0
Sikkim Tourism 1998 Govt. Company Promotional 4.79 0 4.79 0.67 0 0 1.3 4.84 1.45 0.43
Sikkim Handloom and Handicrafts
Dev. Corp. Ltd
2003 Govt. Company Promotional 0 0 0 0 0 0 0 0 0
Khadi and Village
Board
1978 Public Corporation Promotional 0 0.34 10.09 -0.21 0 0 0.16 0 0 0
State Trading Corp. 1972 Public Corporation Trade and Service
1.11 0 1.11 0.75 4.21 4.21 12.93 4.8 5.32 0
Sikkim Consumer
Co-operative Soceity
1975 Co-operative society Trade and
Service
0.17 0 0.17 0.009 0.19 0.61 2.04 0.46 0 2.02
SIMFED 1982 Co-operative society Trade and
Service
0.88 0.17 1.05 0.32 1.28 -0.22 15.01 2.17 0 0.71
Denjong 1965 Co-operative society Trade and
Service
0.20 0 0.20 -0.42 0.19 -0.25 6.09 1.13 0.17 0.02
Sikkim National Transport Corp.
1944 Departmental Enterprise
Utility 33.08 0 33.08 -3.74 -6.4 0 15.41 0 0 0
State Energy and
Department of Power
1967 Departmental
Enterprise
Utility 470.92 0 470.92 -65.85 0 0 11.85 0 0 0
Sikkim Power Dev.
Corp.
1998 Govt. Company Utility 3 50.01 53.01 0 0 0 0 2.4 3.19 0
SABCCO 1996 Govt. Company Welfare 6.49 9.12 15.61 0.35 0 -0.16 0.69 6.14 0 -0.32
0- data not existing / available (Source : Annexure 8.9)

ADB TA No. 4297-IND, Final Report
Capacity Building For Fiscal Reforms in Sikkim
215
Annexure 8.2 Profile of SLPEs in Sikkim in 2002-03 (Rs in crore) )
Name of the enterprise Establi
shment
Typology Classifica-
tion
Equity Debt Investm
ent
Net
Profit
/
losses
Reserves Accumu
lated
loss/
profit
Turnove
r
Net
Worth
Capital
Employe
d
Con
trib
utio
n
SIDICO 1977 Government
Company
Financial 16.54 2.94 19.48 2.51 2.4 -7.83 3.45 11.11 21.88 2.53
State Bank of Sikkim 1968 Public
Corporation
Financial 0.58 4.4 4.98 -21.57 9.48 -44.84 12.08 0 10.06 5.15
Sikkim State Co-operative Bank
1998 Co-operative society
Financial 8.91 0 8.91 0.24 1.47 0.35 1.78 0 241.4 0
Sikkim Jewels 1972 Government
Company
Manufacturing 5.99 1.83 7.82 0.05 1.65 0.66 2.15 7.51 5.36 0.01
Sikkim Hatchery 1994 Government Company
Manufacturing 0 0 0.46 0 0 0 1.38 0 0 0
Sikkim Poultry 1999 Government
Company
Manufacturing 0 0 0.79 -0.11 -0.08 -0.34 0 0.45 0.45 0
Sikkim Precision Industries 1999 Government
Company
Manufacturing 3.7 0 3.70 0.12 0 0.12 0.4 3.82 0 0
SITCO 1976 Government
Company
Manufacturing 11.22 0.81 12.03 -2.68 2.63 2.26 2.96 9.7 8.07 -
0.52
Tea Board of Sikkim 1974 Public
Corporation
Manufacturing 20.44 0 20.44 -0.22 0 7.82 1.75 7.84 8.38 0.9
Sikkim Milk Union 1980 Co-operative society
Manufacturing 0.06 0.08 0.14 -0.71 3.42 -1.67 4.54 1.72 -0.63 -0.11
Govt. Fruit Preservation
Factory
1964 Government
Company
Manufacturing 0 0 1.07 -0.06 0.09 0.4 0.17 1.79 2.04 0
Sikkim Tourism 1998 Government Company
Promotional 4.79 0 4.79 -0.96 0 -0.6 0.92 4.13 -0.96 0.08
Sikkim Handloom and
Handicrafts Dev. Corp. Ltd
2003 Government
Comapy
Promotional 0 0 0 0 0 0 0 0 0
Khadi and Village Board 1978 Public
Corporation
Promotional 10.89 0.35 11.24 -0.19 0 0 0.2 0 0 0.01
State Trading Corp. 1972 Public
Corporation
Trade and Service 0 0 1.11 0.98 0 0 19.54 6.6 0 0
Sikkim Consumer Co-
operative Soceity
1975 Co-operative
society
Trade and Service 0.17 0 0.17 0.10 0.22 0.69 3.21 0.47 0 3.2
SIMFED 1982 Co-operative society
Trade and Service 0.84 0.17 1.01 0.15 1.37 -0.19 11.53 2.21 0 0.43
Denjong 1965 Co-operative
society
Trade and Service 0.2 0 0.20 -0.34 0.19 -0.36 0.59 1.02 0.18 0.02
Sikkim National Transport Corp.
1944 Departmental Enterprise
Utility 34.49 0 34.49 -4.88 -4.97 0 17.39 0 0 0
State Energy and Department
of Power
1967 Departmental
Enterprise
Utility 470.92 0 470.92 -37.36 0 0 13.31 0 0 0
Sikkim Power Dev. Corp. 1998 Government
Company
Utility 3 50.01 53.01 0 0 0 0 3 8.39 0
SABCCO 1996 Government
Company
Welfare 8.99 11.11 20.10 -1.12 0 -1.56 0.78 8.59 0 -
0.36
0- data not existing / available (Source : Annexure 8.9)

ADB TA No. 4297-IND, Final Report
Capacity Building For Fiscal Reforms in Sikkim
216
Annexure 8.3 Profile of SLPEs in Sikkim in 2003-04
(Rs in crore) Name of the enterprise Establish
ment
Typology Classification Equity Debt Investm
ent
Net
Profit /
loses
Rese
rves
Accumul
ated loss/
profit
Turno
ver
Net
Wo
rth
Capital
Employed
Contri
bution
SIDICO 1977 Government
Company
Financial 17.04 2.62 19.66 0.47 2.4 -7.36 1.73 12.0
8
22.06
State Bank of Sikkim 1968 Public Corporation Financial 0.58 4.82 5.4 -0.95 0.11 -36.42 14.8 0 10.06 2.79
Sikkim State Co-operative Bank 1998 Co-operative society Financial 9.36 0 9.36 0.69 0 1.05 2 0 27 0.7
Sikkim Jewels 1972 Government Company
Manufacturing 6.49 0.56 7.05 -0.38 1 0.28 2.05 7.65 4.82 2.21
Sikkim Hatchery 1994 Government
Company
Manufacturing 0 0 0.46 0 - 0 1.38 0 0 0
Sikkim Poultry 1999 Government Company
Manufacturing 0 0 0.79 -0.08 0 0 0 0 0
Sikkim Precision Industries 1999 Government
Company
Manufacturing 0 0 3.7 0.04 0.12 -0.02 0.33 3.87 0 0.4
SITCO 1976 Government
Company
Manufacturing 11.22 0.52 11.74 -3.29 -2.92 2.39 4.54 -0.20 -1.2
Tea Board of Sikkim 1974 Public Corporation Manufacturing 22.71 0 22.71 0.03 1.89 7.82 1.91 7.77 8.78 0.05
Sikkim Milk Producers Union 1980 Co-operative Society 0.06 0.08 0.14 -1.03 0 -2.54 4.22 0.85 -1.20
Govt. Fruit Preservation Factory 1964 Government
Company
Manufacturing 0 0 0 0.02 0.88 0.60 0.14 1.02 2.21 0.43
Sikkim Tourism 1998 Government
Company
Promotional 6.06 0 6.06 -0.65 1.53 -2.59 1.34 -
3.41
3.22 0.5
Sikkim Handloom and Handicrafts Dev. Corp. Ltd
2003 Government Company
Promotional 0.80 0 0.80 0 0.05 0.25 0.93 0
Khadi and Village Board 1978 Public Corporation Promotional 11.66 0.35 12.01 0 0 0.14 0 0
State Trading Corp. 1972 Public Corporation Trade and
Service
0 0 1.11 0.66 0.74 0 15.53 7.9 0 1.13
Sikkim Consumer Co-operative Society 1975 Co-operative society Trade and
Service
0.17 0 0.17 0.008 0.24 0.75 2.4 0.5 0 2.32
SIMFED 1982 Co-operative society Trade and Service
1.02 0 1.02 0.19 0 16.94 0 0
Denjong 1965 Co-operative society Trade and
Service
0.2 0 0.2 -0.46 0.19 -0.83 6.1 0.94 0.19 0
Sikkim National Transport Corp. 1944 Departmental Enterprise
Utility 34.49 0 34.49 -4.2 0 0 17.24 0 0 -3.44
State Energy and Department of Power 1967 Departmental
Enterprise
Utility 514.79 0 514.79 -22.69 0 0 13.57 0 0 0
Sikkim Power Dev. Corp. 1998 Government
Company
Utility 3 50.01 53.01 0 0 0 3 6.86
SABCCO 1996 Government
Company
Welfare 9.55 11.95 21.5 -1.12 -0.13 -1.69 0.93 9.42 0 -0.02
0- data not existing / available (Source: Annexure 8.9)

ADB TA No. 4297-IND, Final Report
Capacity Building For Fiscal Reforms in Sikkim
217
Annexure 8.4 Resource Mobilization by SLPEs in 2003-04
(Rs in crore)
Name of the enterprise State
Equity
Other
Equity
Total
Equity
State
Debt
Other
Debt
Total
Debt
Investment
SIDICO 10.70 6.36 17.04 2.03 0.59 2.62 19.66
State Bank of Sikkim 0.53 0.05 0.58 0 4.82 4.82 5.40
Sikkim State Co-operative Bank 9.49 0.51 10 0 0 0 9.36
Sikkim Jewels 5.62 0.78 6.40 0 0.56 0.56 7.05
Sikkim Hatchery 0.34 0.11 0.45 0 0 0 0.46
Sikkim Poultry 0 0 0 0 0 0 0
Sikkim Precision Industries 3.70 0 3.70 0 0 0 3.70
SITCO 11.20 0 11.22 0.52 0 0.52 11.74
Tea Board of Sikkim 22.71 0 22.71 0 0 0 22.71
Sikkim Milk Union 0.06 0 0.60 0.08 0 0.08 0.14
Govt. Fruit Preservation Factory 0 0 0 0 0 0 0
Sikkim Tourism 6.06 0 6.06 0 0 0 6.06
Sikkim Handloom and Handicrafts Dev. Corp. Ltd
0.80 0 0.80 0
0 0 0.80
Khadi and Village Board 0 0 0 0 0 0 12.01
State Trading Corp. 1.11 0 1.11 0 0 0 1.11
Sikkim Consumer Co-operative
Soceity 0.17 0 0.17 0 0 0 0.17
SIMFED 0.94 0.08 1.02 0 0 0 1.02
Denjong 0.20 0 0.20 0 0 0 0.20
Sikkim National Transport Corp. 33.08 0 33.08 2.51 0 2.51 34.39
State Energy and Department of
Power 514.79 0 514.79 0 0 0 514.79
Sikkim Power Dev. Corp. 53.01 0 53.01 0 0 0 53.01
SABCCO 8.04 1.51 9.55 8.21 3.74 11.95 21.50
0- No mobilization from the source (Source : Annexure 8.9)

ADB TA No. 4297-IND, Final Report
Capacity Building For Fiscal Reforms in Sikkim
218
Annexure 8.5 Profit Performance of SLPEs in 2003-04
Name of the enterprise Net
profit/Loss (Rs. in
crore)
Investment (Rs. in
crore)
Net profit
/Loss on
Total
Investment
(in %)
SIDICO 0.46 19.66 2.34
State Bank of Sikkim -0.95 5.4 -17.59
Sikkim State Co-operative Bank 0.69 9.36 7.37
Sikkim Jewels -0.38 7.04 -5.40
Sikkim Hatchery 0 0.46 0.00
Sikkim Poultry -0.08 0.79 -10.13
Sikkim Precision Industries 0.04 3.7 1.08
SITCO -3.29 11.74 -28.02
Tea Board of Sikkim 0.03 22.71 0.13
Sikkim Milk Union -1.03 0.14 -735.71
Govt. Fruit Preservation Factory 0.02 0 0.00
Sikkim Tourism -0.64 6.06 -10.56
Sikkim Handloom and Handicrafts
Dev. Corp. Ltd
0 0.8 0.00
Khadi and Village Board 0 12.01 0.00
State Trading Corp. 0.66 1.11 59.46
Sikkim Consumer Co-operative
Soceity
0.008 0.17 4.71
SIMFED 0.19 1.02 18.63
Denjong -0.46 0.2 -230.00
Sikkim Nationalised Transport Corp. -4.2 34.39 -12.21
State Energy and Department of
Power
-22.69 514.79 0.00
Sikkim Power Dev. Corp. 0 53.01 0.00
SABCCO -1.12 21.5 -5.21
Total -32.74 726.06 -4.51
0-not available (Source: Annexure 8.9)

ADB TA No. 4297-IND, Final Report
Capacity Building For Fiscal Reforms in Sikkim
219
Annexure 8.6 Characteristics of SLPEs in the State of Sikkim
Name of SLPE
and Year of
establishment
Form of
Organisation
Market
Structure (MS)
and Activities
(A)
Financial
Status and
Physical
performance Employees
Social
purpose
Financial System &
management and
interface with
Government
Performance
improvement plan SWOT Analysis
Problems
encountered
Strategic
inititatives
Sikkim Jewels
Ltd (SJL) (7/2/1972)
Govt.
Company
MS :
Competitive A : Watch
Jewels,
Industrial
Jewels Barings,
rotor magents,
and disposable syrenges
A company
incurring marginal losses
125
Mgl 20 Nmgl 105
Providing
employment to local
Budgeting and
internal audit exist in the company
Wage Bill
reduction from Rs. 10.5 lakhs per
month to Rs. 6.5
lakhs per month
S: Good past record,
new markets for health products and
micro precision
instruments
5% Export incentives
not given amounting Rs. 0.25 crore due to
non implementation
of Central ITAct
New
investments planned
Physical
performance:
Capacity utilisation is
100 percent
Government
directed pricing
Setting up
disposable syringes
and needles project to counter decline
in demand of
industrial jewels
W: declining
domestic demand,
Obsolete machinery,
GoS has to pay Rs.
0.40 crore towards
VRS
Diversification
of product line
No delegation and
decentralization
Enhancing capacity
to 10 millions
costing Rs 2.50 crore on import of
machinery
O : Excessive staff
Global
linkages for
marketing
Manpower planning and performance
appraisal systems
exists
To set up rotor magnets for quartz
watches for exports
worth Rs 7.00 crore
T : low priority assigned by the
government and
global competition
Performance
evaluation methods non existence
Proposes to spend
RS 0.50 crore on technical travel and
training
Government nominees dominate
the Board
Proposes to produce tiny jewels
in micron tolerance
Tenure of the Board
of Directors not
specified
Proposes to
produce high value
low volume defense products

ADB TA No. 4297-IND, Final Report
Capacity Building For Fiscal Reforms in Sikkim
220
No R&D Proposes to
modernize plant by inducting latest
state of art
technology costing Rs. 0.30 crore.
Interaction with
government : low
VRS given to 91
employees
Name of
the
enterprise
Form of
Organisation
Market
Structure
(MS) and
Activities (A)
Financial Status
and Physical
performance Employees
Social
purpose
Financial System &
management and
interface with
Government
Performance
improvement plan SWOT Analysis
Problems
encountered
Strategic
inititatives
Sikkim
Tourism Dev. Corp.
Ltd
(21/09/98)
Govt.
Company
MS:
Competitive A: Tourism
Services,
transport (helicopter
service) and
market consultancy
to tourism
department
Financial Status :
100 percent state government
equity, no long
term debt, loss making, erosion of
net worth,
accumulated losses, scanty
contribution,
negative operating profits,
advertisement
expenses is 1% of
total revenue
89
MGl 4 NM 85
Employment
to 85 persons, capacity
building for
tourism and village
tourism
No costing systems
and standard costing , management reporting
systems non existence,
Govt. nominees dominate the board,
partial delegation,
non pricing systems, no costing system, no
manpower planning,
and no R&D
Occupancy rate of
hotels is planned to be improved
S :Tourist traffic is
increasing, pro-government
policies for
tourism, properties require vast repairs
Non managerial
employees are too high in numbers,
Board meets
seldom, Helicopter service is affected
by non availability
of spare parts, Not connected by
internet, Untrained
middle and low management
Post of GM
abolished and organization is
being made lien
Physical
performance : Average
occupancy rate
The company has
vision to develop new tourist destination,
construct and manage
new hotels and provide facilities for
tourism and tourists
W : Low share
capital base, Transfer of
departmental
personnel has promoted
unhealthy culture
Some key
properties have been privatised
such as Hotel
Mayur, Singhik, Tsongo, and
Alpine Cafateria
Internal audit and
budgeting systems
partly exists
O: The state has
become a popular
tourist destination, Investors have
shown keen
interest in taking out properties of
the company
VRS to excess staff
is being considered

ADB TA No. 4297-IND, Final Report
Capacity Building For Fiscal Reforms in Sikkim
221
Interface with the
government : Very frequent interaction
with Minister and
political chairperson, The political
chairperson instructs
on pricing, investment, personnel
selection, purchase of
inputs and day-to-day decisions
T : Natural
disasters are a great threat, any
agitation in WB
could upset the apple cart
To bridge the
resource gap the corporation is
pressing upon the
government to handover Northhil
Hotel , which is
currently under the contoll of tourism
department
Manufacturing
Name of SLPE
and Year of
establishment
Form of
Organisation
Market
Structure (MS)
and
Activities(A)
Financial Status
and Physical
performance Employees
Social
purpose
Financial System
& management
and interface
with Government
Performance
improvement
plan SWOT Analysis
Problems
encountered
Strategic
initiatives
Tea Board of
Sikkim
(1/6/1974)
Departmental
Enterprise
MS :
Competitive A: Black Tea
(Orthodox)
Continious loss
making enterprise, Stagnant capital
employed,
receding net worth, scanty contribution
and negative
operating profit
455
Magl -10 NM 444
Use of local
resources and employment to
locals
Being a
departmental enterprise, no
corporate systems
exists
Non S : Temi Tea has
good demand and highly competitive
market
Excessive staff,
expansion not possible
Physical performance :
100% capacity
utilisation
Interaction with govt. : Very low
O : Brand building opportunities exits
Latest technology for
processing not
available

ADB TA No. 4297-IND, Final Report
Capacity Building For Fiscal Reforms in Sikkim
222
T : Receding
demand of tea
Expansion not
possible
Plantation is getting aged
Name of the enterprise
Form of Organisation
Market
Structure
(MS) and
Activities(A)
Financial
Status and
Physical
performance
Employees Social purpose
Financial System &
management and interface
with Government
Performance improvement plan
SWOT Analysis Problems encountered
Strategic inititatives
The Denjong
Agricultural
Co-operative
Society Ltd
(08/02/65)
Co-operative
society
MS:
Competitive
A: Supply of
fruits, vegetables
and meat
products
Continuously
profit making
company, Cent
percent government
equity, Debt free,
Positive working capital,
Increasing
networth, High turnover, High
contingent
liability and High unsettled
liabilities
112 Mgl 2
NM 60
Casual 40
Government officials
dominated Board,
Empowered board and chief
executive, Budgeting, internal audit and pricing
systems exist, MIS systems
non existence, R&D non existant, Manpower
planning doesnot exist,
Board meets four times a year, and Board and CEO
decide upon hiring and
retrenchment
Modernisation S: High turnover, Dependence on
army for
supplies on
negotiabted contract rates
Rationalisati
on of
manpower
under VRS
Interface with government :
Low
Rationalisation of
labour force
W : high overhead
expenses
Setting up of
markets in retails/
wholesale
chain outlets
O : Expansion and diversification of
business such as cold
storage, chain outlets, agro processing and
flour mills.
Increase in share capital
T: Competitive market
and over staffing
Modernisati
on of flour
mills

ADB TA No. 4297-IND, Final Report
Capacity Building For Fiscal Reforms in Sikkim
223
Name of
the enterprise
Form of
Organisation Market
Structure
(MS) and
Activities(A)
Financial Status and
Physical
performance
Ma
npower
Social
purpose Financial System
& management
and interface
with Government
Performa
nce improvem
ent plan
SWOT Analysis Problems
encountered
Strategic
initiatives
Restructuring
SABCCO
(1996)
MS :
Monopoly A: Financing
SC, ST and
OBCs through margin money
schemes ,
Mahila Samridhi
Yogana,
SLGs.
Continuously loss
making, Increase in net worth due to
equity infusion,
Excessive direct cost, Negative working
capital, High interest
burden, Revenue subsidy and
Guarantees from State
Govt.
16
Mgl. 4
NM
-12
Promote
activities related to
women
through specific
schemes
FS : Absence of
costing, R&D and pricing systems,
MIS systems non
existence, Govt. officials
dominated by the
board and Empowered
executives
Micro
Credit Finance to
be
introduced
S : Provides
financial assistance to the
weakest section of
the society and covers the entire
rural population of
the state
Recovery of
loans faces a major problem
as the target
group belongs to people
leaving below
poverty line
Loans on
cheaper interest rates
as compared
to Banks
Financial
restructuring: Timely release of share
capital, need for
grant in aid for meeting
administrative costs,
release of replacement of
repayment schedules
of old loans
Promoting SHGs
Interface with Government :
Adequate
Tourism related
schemes
W: Lack of professional
manpower, Lack
of proper recruitment
policies, Lack of
Govt. support for
share capital and
grant in aid,
Failure to recover 100 per cent dues
Delayed release of
share capital
Undertaking financial
restructuring
Manpower restructuring : free
and fare hand in
recruitment of professionals

ADB TA No. 4297-IND, Final Report
Capacity Building For Fiscal Reforms in Sikkim
224
Education
al loan schemes
O: Total financial
dependence on the state, Only
medium to further
GoS policies with regard to social
welfare
Grant in aid
towards meeting
administrative
costs not released
Proposes to
recruit professionals
Organisational
restructuring : induction of
professionals to boast
performance
T: discontinuation
of the Central and the State Govt.
support and tough
competitions from banks on account
of low interest
rate, easier availabilty of
loans, simplified
documentation process
Aged loans
and revenue subsidy of 0.16
crores
Recovery of
loans from deneficiaries
by holding
default recovery
camps, filling
cases under lok adalat and
SPDR Act.
The company proposes to
involve local MLA's and
Panchanyats
in the recovery of
debts
Inadequate
qualified
persons and lack of funds
for
management development
programmes
Seek help to :
liquidate and
writeoff bad and douobtful
debts, extend
VRS, develop a new loans
and train
officers and
staff

ADB TA No. 4297-IND, Final Report
Capacity Building For Fiscal Reforms in Sikkim
225
Name of
the enterprise
Form of
Organisation Market
Structure (MS)
and Activities(A)
Financial
Status and
Physical
performance
Manpower Social
purpose Financial
System &
management
and interface
with
Government
Performance
improvement plan
SWOT Analysis Problems
encountered
Strategic
initiatives
Sikkim
Precision
Industries
Ltd (1999)
Govt.
Company
MS : Completely
dependent on
Principal, Bharat Electronics Ltd
Competitive
A: Manufacturing semi conductor
devices
Profit making, 60 Mgl 4,
Nm50
casual 6
Employment
to 50 persons
including handicapped
Absence of
budget, internal
audit, costing, pricing and MIS
Exploring
international markets
S: Skilled manpower completly
dependent on BEL
Ltd
Restructuring
( product ,
market and technological)
is planned
costing Rs 90 lakhs
Physical performance :
50 percent
capacity utilized
Promote industry
culture
Interface with Government:
Very low
W: No labour unrest Low Capacity utilisation
40 employess will be
recruited due to
restructuring costing to Rs
1.2 Lakh per
month
O: Non-pollutant
enterprise, Good
scope for diversifying activities
Low innovation The company
proposes to set
up TO-92 assembly plant
within the same
premises will
will generate
employment for
40 persons
T: Fully dependent
on Bharat Electronics
Ltd, Logistics problems,
Competition from
chinese devices and Mother-child
relationship could
cause problems
Low turnover

ADB TA No. 4297-IND, Final Report
Capacity Building For Fiscal Reforms in Sikkim
226
Name of the
enterprise
Form of
Organisation Market
Structure (MS)
and
Activities(A)
Financial
Status and
Physical
performance
Manpower Social
purpose Financial System &
management and
interface with
Government
Performance
improvement plan
SWOT Analysis Problems
encountered
Strategic
inititatives
Sikkim
Handloom
and
Handicrafts
Development
Corporation
Ltd
(16-10-2001_
Sikkim
Handloom and
Handicrafts
Dev. Corp. Ltd
MS:
Competitive A: marketing of
handicrafts
items such as carpets, choktse
, Thanka,
Handloom and multicasts
Loss making
and Dependence
on external
institutes for working
capital
13 Mgl 1 .
Nmg 12
Uplift the
socio-economic
status
Non existence and
Very low degree of professionalism
Setting up a of pilot
project to establish nine handicraft societies
S: Favourable
government policy
High
dependence on the
department
setting up
of marketing
chain
through out Sikkim
Physical performance :
Low turnover
Interface with Govt.
Satisfactory
W: No grants in aid
Very short tenure for
chief
executives
Enhancing share
capital
O: Good market Inexperienced
personnel
Setting up a
desing centre with
modern
technology
T: Taxes
Name of the enterprise
Form of Organisation
Market
Structure
(MS) and
Activities(A)
Financial
Status and
Physical
performance
Physical per-
formance
Manpower Social purpose
Financial
System &
management
and interface
with
Government
Performance improvement
plan
SWOT Analysis
Problems encountered
Strategic inititatives
Sikkim
Poultry
Development
Corp Ltd
(1991)
Govt.
Company
MS :
Competitive A: Trading in
Poultry feed,
equipments and products
Contentiously
loss making, Unable to fund
working
capital and no money for
capital expenditure
6 Magl. 1
Casual 5
Increase
the income
of grass
root farmers
through poultry
farming
Budgeting,
internal audit, costing and
pricing
systems are extension of
the government
systems
S: A
government company
Managerially
very weak
A
consultant has been
appointed
to suggest a study
plan
Interface with
Government:
Very low
W: No
enterprise
element
Lacks
enterprise
orientation

ADB TA No. 4297-IND, Final Report
Capacity Building For Fiscal Reforms in Sikkim
227
O: Huge
demand
Finances are
in shambles
T: Competition
form private
sector poultries
Name of the
enterprise
Form of Organisation
Market
Structure (MS)
and Activities(A)
Financial
Status and
Physical
performance
Manpower Social purpose
Financial System &
management and
interface with
Government
Performance improvement plan
SWOT Analysis Problems encountered
Strategic inititatives
Sikkim
Hatchery
Ltd
(1994)
Government
Company with
private sector participation (Sri
Venkateshwara
Hatcheries
MS: Competitive
A: Poultry
breeders, Produces commercial
chicks,
Supply/marketing of chicks and
Supply of Poultry
feed
Loss making
, Dearth of
working capital, Net
worth
erosion, and Contingent
liabilities
15 Mg 1,
Nml 2,
Casual 15
To increase the
income of grass
root people / farmers through
poultry farming
Budgeting, internal
audit, costing and
pricing systems are extension of the
government systems
A consultant has
been appointed to
prepare a turnover project
S: A government company Working
capital is being
sought from financial
institution/
government
case by SBI
in debt recovery
tribunal of Rs
0.40 crore
Interface with
Government : Very
low
W: No enterprise element
O: Huge demand
T: Competition form
private sector poultries

ADB TA No. 4297-IND, Final Report
Capacity Building For Fiscal Reforms in Sikkim
228
Name of
the enterprise
Form of
Organisation Market
Structure
(MS) and
Activities(A)
Financial
Status and
Physical
performance
Manpower Social
purpose Financial System &
management and
interface with
Government
Performan
ce improvem
ent plan
SWOT Analysis Problems
encountered
Strategic inititatives
SITCO
(1976)
Govt. Company
MS: Competitive
A: Digital and
Analog Watches and
TV Speakers
Loss making company,
negative
contribution, high
administrative
and interest costs, decline
in capital
employed, and negative
reserves and
surpluses
146 Mag. 22 Nmgl
87 Casual
37
Employment generation :
has given
employment to 1000
people since
inception (90 per cent are
women)
Rudimentary budget, and internal audit,
Cost management is
non-existant , Satisfactory middle
management, Govt.
dominated Board and Part-time Directors
representing
professionals are nominal in numbers
115 employee
s have
availed of VRS
costing Rs
272 lakhs
S: 28 year old company having core competency in homology
and electronics field,
Association with industrial giants like HMT, BEL, BPL,
skilled manpower, good
industrial environment, one of the few watch companies
enlisted with the CSD of the
Defence Ministry for the supply of watches and Availability of
ample infrastructure, buildings,
space
Timely release of share capital from
Gos
Rs 2 crore spent on additional machinery
Physical
performance : 30 per cent
capacity
utilised
National
integration
Interface with
Government : Very low
Brand
promotion
W: Locational disadvantage,
Limited brand awareness of products and No R&D
Sundry Debtors of
2.5 crores to be writtenoff
Restructuing to add to
the wage bill to Rs 30 Lakhs per annum as 15
new jobs will be
created.
Promote
industrial culture
Channel
management
O: Workers require further
training and skill enhancement and Climatic conditions
suitable for electronics, IT,
watch and other precision industries
Shortage of
working capital to supply speaker to
BPL/ Onida and to
increase th production of
speakers
Increase in market
share through CSD and direct marketing
T: Competition from
organised, unorganies and overseas competition
VRS to about 40
employees estimated to cost Rs 1.50 crore
Activity restructuring:
launching of higher variants and models of
watches, time pieces
and clocks, enlargement of product profile
management system
Induction and training of required manpower
in design and
development area of speakers and watches

ADB TA No. 4297-IND, Final Report
Capacity Building For Fiscal Reforms in Sikkim
229
Manpower restructuring
: Training of manpower on shop floor , giving
VRS to around 40
excess employees
Technological
Restructuring: Setting
up of desing and development wing for
speakers and sourcing
of approproate required technology
Financial Restructuring:
Release of share capital
toward product / activity restructuring
and repayment of bank
loans and write-off bad debts
Name of the
enterprise
Form of
Organisation Market Structure
(MS) and
Activities(A)
Financial
Status and
Physical
performance
Manpower Social purpose Financial
System &
managemen
t and
interface
with
Government
Performance
improvement plan
SWOT
Analysis
Problems
encountered
Strategic inititatives
Government
Fruit
Preservation
Factory
(1965)
Govt.
Company
MS: Competitive
A: Produces
Squashes, Juices, Jams, Pickles,
Sauces and Tinned
Fruits
Decline in
working
capital, Profit earning
company, and
Instable sales
60 Mgr 3,
Nml
6,Casual 3
Distribution of Seeds and
seedlings to local farmer,
Providing training to locals to make pickels and jams
and to provide training to
farmers in farming baby corn, dallae chilles etc
Budgeting,
MIS and
pricing are non existant
The factory is
running on adhoc
basis
S : Brand
Sikkim
Supreme is the major
strength
Exemption from
sales tax and
income tax not given
GoS may either accept
turnover plan by GoI
or Privatise / going for closure
New products added includes
babycorn, sweet
corn, dallae chilly in veniger
Physical performance :
15 percent
capacity utilised and
Interface with
Government
: Poor
W: Lack of continuity of
policy
No purchase preference by the
government
O : Lower
customers
and market
penitration
Promised
budgetory support
not extended

ADB TA No. 4297-IND, Final Report
Capacity Building For Fiscal Reforms in Sikkim
230
T:
Competition and
inadequate
market development
and
promotion
Turnaround plan
approved by Govt. of India on
matching basis
not honoured by GoS
Name of the
enterprise
Form of
Organisation Market
Structure
(MS) and
Activities(A)
Financial
Status and
Physical
performance
Manpower Social
purpose Financial System &
management and
interface with
Government
Performance
improvement plan
SWOT Analysis Problems
encountered
Strategic
inititatives
SIDICO
(1977)
Govt.
Company
MS:
Monopoly
A: Financing small,
medium and
large units
Declining
accumulated
losses , Currently
profit making
and Declared dividends in
1996-97 and
2001-02
34 Mg 19,
Nml 15
Industrial
promotion and
employment generation
through assisted
units
Cost management non
existant , weak internal
audit, Poor monitoring of assisted units, Weak
project appraisal system,
decision making power vests with board , No
manpower planning and
no manpower training and development
Setting up guideline/
counseling cell
S: The only development
financial institution. No
default in repayment of re-finance. , Track record of
profit making from the last
five years, High rate of interest
Lack of viable
proposals
Debt Free
company
Interface with the
Government : Moderate
Improving recoveries W: Decline in equity support
from Govt,, high
administrative cost Investment in
assisted units of Rs 2.58
crore in equity
, Generation WEBCOM not
enerati any
returns
Promoting
new
Generation industries
such as
Software Park
O: Rapid, economic and industrial development of the
state
large number of sutis field
under SPDRA are pending
extending State
Financial Act s29,30
and 31
T: Competition with
commercial banks
High
administrative
costs
Extending
coverage to
ianncia, housing ,
poultry,
piggery and diary sectors

ADB TA No. 4297-IND, Final Report
Capacity Building For Fiscal Reforms in Sikkim
231
Discontinuatio
n of disbursement
of central
subsidies
Involvement
in infrastructur
e
development
Competition
from NEDFC and SABCCO
enhancing
HRD competencie
s
Name of the
enterprise
Form of Organisation
Market
Structure
(MS) and
Activities(A
Financial Status and Physical
performance
Manpower
Social purpose
Financial
System &
management
and interface
with
Government
Performance improvement plan
SWOT Analysis Problems encountered
Strategic initiatives
State
Bank of
Sikkim
(1968)
Public
Corporation
MS: Non-
competitive A:
Commercial
lending, investment
and treasury
functions
Currently profit making 271 MG
50, NML 221
Rs 6.81 crore
loans are being shown due in
the name of
deceased borrowers
27 employees availing
of VRS costing Rs 82 lakhs of which Rs 80
lakhs given by GoS
Own charter Bankers to
GoS
Tough
competition from
commercial
banks
Sound corporate
vision of striving and acheving premier
position as a superier
financial institution
Physical performance: High
advances, major part of equity
contribution from GoS, Good leverage, Huge losses on
account of Interest waver
scheme amounting to Rs. 25 crore , Increasing trend in
business , Positive contribution
and gross margin and low Capital adequacy
Outstanding of
loan of Rs 2.05
crore in the name of
officers and
staff of SBS. Rs. 36.03 lakhs
is outstanding
against 1expired
employees
Better understanding of
the local economy
High
administrative
costs
Concentration on
other income
Poor security
systems leading to non-recovery
of loans of Rs 4
crore under SPDRA
Lack of adequate equity Poor services
offered by non trained staff
New schemes such as
loans to Govt. employees without
any collateral upto Rs
10 lakhs

ADB TA No. 4297-IND, Final Report
Capacity Building For Fiscal Reforms in Sikkim
232
Only Rs 2 lakh
spent on advertisement
during 2003-04
Untrained manpower No networking Training the
employees strength. 70-80 persons could
be provided VRS
subject to appointment of 20
qualified persons.
Financial and administrative
powers
delegated upto the power of
GMs'
Non computerisation Very poor equity base of
Rs 0.58 lakhs
against the minimum
expected of Rs
30 crore
VRS cost Rs. 5 to 6 crore @ Rs 7 lakh
per employee
No budgeting ,
pricing and
training systems
Bubbling economy and
plentiful opportunities
No monitoring
Interface with
government :
good interaction
Competition from other
commercial banks
Name of
the
enterprise
Form of
Organisation Market
Structure
(MS) and
Activities(A
Financial
Status and
Physical
performance
Manpower Social
purpose Financial
System &
management
and interface
with
Government
Performance
improvement plan
SWOT
Analysis
Problems
encountered
Strategic
initiatives
State
Trading
Corp.
(1972)
Public
Corporation
MS:
Competitive
A: Supply of all types of
materials
required by Govt.
departments
Debt Free,
Sound
Reserves, Profit making,
accumulated
profits, and Positive
networth
108, ML8
NML 70
casual 27
Protocol
duties of
State Govt. at Kolkatta
, renders
assistance to
Sikkimies
patentis at Kolkata
Internal Audit,
Pricing and MIS
exists in rudimentary
form, MIS,
Budgeting does not exist,
Government
nominees dominate the
Board, Dividend
paying company
Improving
communication
with Govt. departments
S: Procurement
backup in terms
of public corporation
Competition
from private
suppliers
Closure of
Kolkata and
Slinguri branches
Interface with
government :
Low
Controlling
administrative
expenses to work within margins
offered by
suppliers
W: Non
cooperation of
Govt. departments
Govt.
departments
prefer to place direct orders
on suppliers
Encouraging
surplus
employees to take VRS
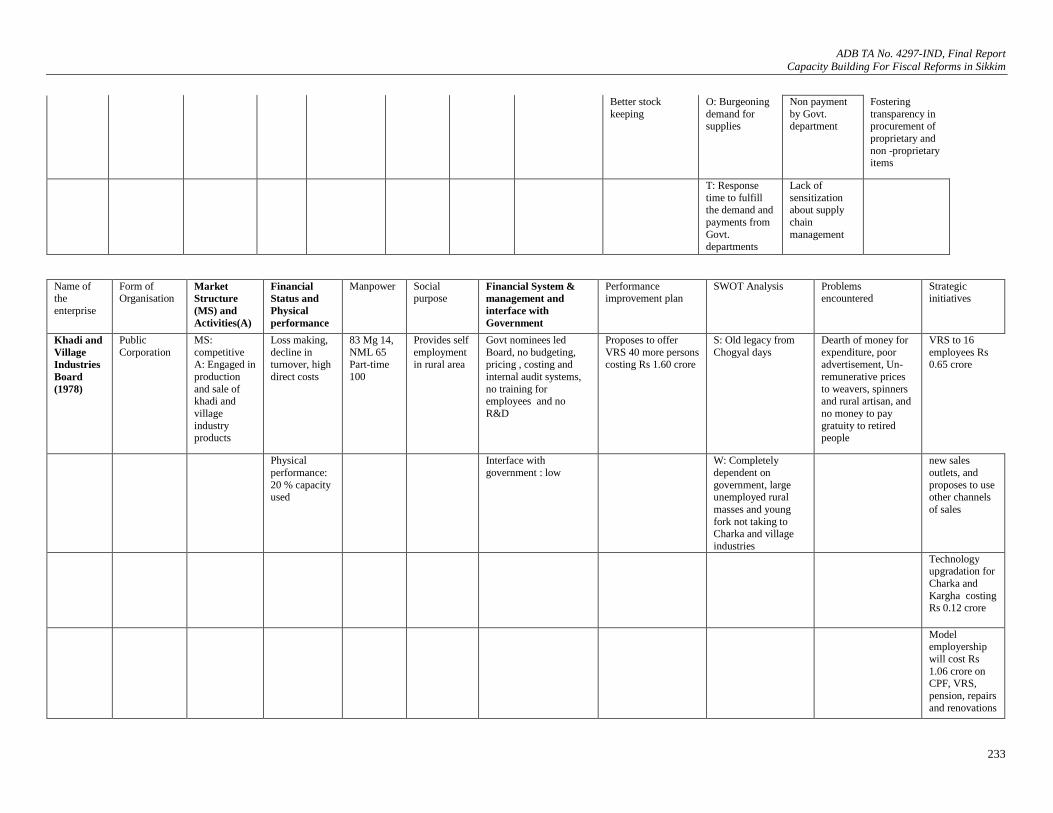
ADB TA No. 4297-IND, Final Report
Capacity Building For Fiscal Reforms in Sikkim
233
Better stock
keeping
O: Burgeoning
demand for supplies
Non payment
by Govt. department
Fostering
transparency in procurement of
proprietary and
non -proprietary items
T: Response
time to fulfill the demand and
payments from
Govt. departments
Lack of
sensitization about supply
chain
management
Name of the
enterprise
Form of Organisation
Market
Structure
(MS) and
Activities(A)
Financial
Status and
Physical
performance
Manpower Social purpose
Financial System &
management and
interface with
Government
Performance improvement plan
SWOT Analysis Problems encountered
Strategic initiatives
Khadi and
Village
Industries
Board
(1978)
Public
Corporation
MS:
competitive A: Engaged in
production
and sale of khadi and
village
industry products
Loss making,
decline in turnover, high
direct costs
83 Mg 14,
NML 65 Part-time
100
Provides self
employment in rural area
Govt nominees led
Board, no budgeting, pricing , costing and
internal audit systems,
no training for employees and no
R&D
Proposes to offer
VRS 40 more persons costing Rs 1.60 crore
S: Old legacy from
Chogyal days
Dearth of money for
expenditure, poor advertisement, Un-
remunerative prices
to weavers, spinners and rural artisan, and
no money to pay
gratuity to retired people
VRS to 16
employees Rs 0.65 crore
Physical
performance:
20 % capacity used
Interface with
government : low
W: Completely
dependent on
government, large unemployed rural
masses and young
fork not taking to Charka and village
industries
new sales
outlets, and
proposes to use other channels
of sales
Technology upgradation for
Charka and
Kargha costing Rs 0.12 crore
Model employership
will cost Rs
1.06 crore on CPF, VRS,
pension, repairs
and renovations

ADB TA No. 4297-IND, Final Report
Capacity Building For Fiscal Reforms in Sikkim
234
EDPs for
borrowers under margin
money scheme
from banks
Efforts for financial
assistance from KVIC for
borrowers
Name of the
enterprise
Form of
Organisation Market
Structure
(MS) and
Activities(A)
Financial
Status and
Physical
performance
Manpower Social
purpose Financial System &
management and
interface with
Government
Performance
improvement plan
SWOT
Analysis
Problems encountered Strategic initiatives
Sikkim
Consumer
Co-
operative
society
(1975)
Co-operative Society
MS:
Competitive A: supply of
stationeries,
cookeries and sundry items Profit making
27 Mg
2,Nml 22, Causal 3
To provide
right services at right time
A tentative budget is
prepared every year
and internal audit is prepared every year None
Purchase
preference for
consumer goods
Competition with STC,
SIMFED, Denjong Co-operative Society and
Trying to become whole
sale agent of several companies
To act as a
countervailing
force on price
fund
No costing and MIS
systems
Outstanding of
government
departments of
Rs 1.19 crore
Inadequate working
capital
Government
dominated Boards
Conversion into
a federation to act as a whole
sale agency f
controlled and non controlled
agencies
Requirement of office
premises
Interface with
government:
moderate
Dependence on
government for
sales

ADB TA No. 4297-IND, Final Report
Capacity Building For Fiscal Reforms in Sikkim
235
Name of the
enterprise
Form of
Organisation Market Structure
(MS) and
Activities(A)
Financial
Status and
Physical
performance
Manpower Social
purpose Financial System &
management and
interface with
Government
Performance
improvement plan
SWOT
Analysis
Problems
encountered
Strategic
initiatives
Sikkim Co-
operative
Bank
(1975)
Co-operative
Society
MS: Non-
Competitive A: Serve as an Apex
organization of co-
operative societies, raise deposits from
members and to do
business as per
Section 5 and 6(1)
of BRA 1949
Help the farmers
in agricultural operations
Internal audit, Budgeting
systems exits but in a rudimentory form, Pricing
and MIS systems do not
exists and Lack of computerisation
Greater
reliance on Crop
Insurance
Networking with
NABARD for disbursements
under non-firm
sector
Balance
agricultural development in the
four districts
Interface with government
: Satisfactory
Developing 10
MPCS under pilot project from
NABARD and MPCS
Good recovery system
Name of the
enterprise
Form of
Organisation Market Structure
(MS) and
Activities(A)
Financial
Status and
Physical
performance
Manpower Social
purpose Financial System &
management and
interface with
Government
Performance
improvement
plan
SWOT
Analysis
Problems
encountered
Strategic
initiatives
SIMFED Co-operative Society
MS: Competitive A:
Ensuring price support to cash
crop farmers
Budgeting, costing , pricing and internal audit
systems are ineffective
Deals with cash crops,
confined to
marketing of cash crops,
processing
units for cash crops, and
poor
infrastructure and systems
Poor working capital base,
Diversification through : Ginger
and cardimon
processing plants, corporative
tourism, co-
operative manufacturing
unit and
becoming C&F of agent for
manufacturers
Computerisation of accounts of purchase and
sales doe not exists
Inadequate infrastructure,
stock in trade
and marketing skills
Conducts open auctions for
cardimum
Interface with govt. : low Failure as
price leader
acutions in
different districts

ADB TA No. 4297-IND, Final Report
Capacity Building For Fiscal Reforms in Sikkim
236
Ban on usage
of chemical fertilizer
Marketing
intelligence for developing
comprehensive
plans
One time
government grant
of Rs 10 crore towards working
capital
Allotment of land
from government
towards
infrastructure
development
Computerisation
at the cost of Rs 2
crore to be granted by the
government
Name of the
enterprise
Form of
Organisation Market Structure (MS)
and Activities(A)
Financial
Status and
Physical
performance
Manpower Social
purpose Financial
System &
management
and interface
with
Government
Performance
improvement plan
SWOT Analysis Problems
encountered
Strategic initiatives
Sikkim
National
Transport
(1944)
Departmental
Enterprise
MS: competitive
A: Fulfill transportation
needs of all government departments , central
agencies , army and rural
and urban masses through the fleet of trucks and
buses
Continuously
loss making,
negative internal
resource
generation, negative plan
contributions,
and declining earning per
bus km
957 Mg57,
Nml 900
To fulfill the
transport
needs of army and
rural and
urban masses
Being an
extension of
govt. department, no
autonmous
financial and management
systems,
ineffective pricing systems,
and imbalance
fare structure,
Long experienced
department
Increase in bus
staff ratio of
1:9.2
GoS is
contemplating to
bring down the age of the fleet and also
enlarge it
Physical
performance :
45% occupancy
ratio
Customer
relationship
management non existant
Appendage of
GoS suffering
from Govt. systems and
procedures
Low staff
productivity of
16.26 km per day per worker
GoS is
contemplating to
introduce VRS to reduce unwarranted
staff

ADB TA No. 4297-IND, Final Report
Capacity Building For Fiscal Reforms in Sikkim
237
Interface with
government: moderate
Incapacity to serve
the increasing transportation
needs in a
customer friendly manner
Declining fuel
efficiency of 3.05 km per liter
Age profile of
buses and trucks is highly
unfavoruable as
106 buses out of 192 on march 31
, 2003 were 10 +
years old
Concessional/ free travel
facilities as
directed by GoS
Name of the
enterprise
Form of
Organisation
Market structure Financial Status
and Physical
performance
Manpower Social
purpose Financial
System &
management
and interface
with
Government
Performance
improvement plan
SWOT Analysis Problems
encountered
Strategic initiatives
State Energy
and
Department
of Power
(1967)
Departmental
Enterprise
MS: Noncompetitive
A: Provide power to domestic, commercial,
agricultural and
industrial sectors, Provide power to
public establishments
and facilities and promote rural
electrification
Continuously heavy
loss making, negative internal
resource
generation, declining earning
per bus km and
price-cost relationship
2717
Mg 100, Nml 2617
Power to
rural areas, agriculturists
and industrial
units
25 % capacity
utilisation and load factor 40 %
Focusing on project
management
Tremendous
potential of growth and
engine for
development
High T&D
losses and low tariff
Reduction of T& D
losses from 52 % to 38 % by 2006 -
07 , 15 % by 2011-
12
Interface with
government : very high
Highly
overstaffed on the
administrative
side but
understaffed on
the technical side
Increase in tariff to
cover costs
Conflict
between the role
of department and the State
Power Devel.
Corporation
Reorganisation
through SBIs for
generation, transmission and
distribution

ADB TA No. 4297-IND, Final Report
Capacity Building For Fiscal Reforms in Sikkim
238
corporatisation to
setup 3 companies
Promoting IPPs in
power generation
through BOAT / BOOT / DBOAT
Setting up of an
independent Tariff Regulatory
Authority
100 per cent
metering
T&D lines in the
state are being
modernaised and
aegumented
IPPs' participation
hydel power
generation about 25 mw through
joint ventures to
ensure 14 % return and 10-12 % free
power
Name of
the
enterprise
Form of
Organisation
Market Structure
(MS) and Activities(A)
Financial
Status and
Physical
performance
Physical
performance
Manpower Social
purpose
Financial
System &
management
and interface
with
Government
Performance
improvement plan
SWOT Analysis Problems
encountered
Strategic
inititatives
State
Power
Dev.
Corp.
(1998)
Government
Company
MS: Non Competitive
A: Exploit state hydro
power potential, undertake pre-
feasibility studies of
Hydro power Projects, Survey and
investigating work
relating to hydro power projects
Inadequate
equity support,
high salaries, dues on
purchase of
power of Rs 8.5 crore
Generating
power at
economical rates for the
consumption
of masses
Interface with
government:
low
VRS for excess
employees,
Capacity building process
S: promoting
hydro power
projects through public private
partnership,
Experienced Manpower
Lack of seed
money, non-
extensions of govt. guarantees
and retention of
micro, mini and small hydro
power projects
Financial
restructuring of
Energy and power department
Other activities;
Arranging finances for the power projects
through
(PFC,IRDA,NABARD, ADC) and Generation
of Hydro Power
Pending bills
of supplier/ contractor of
Rs 9.5 crore
W: Weak equity
base
Transfer of assets
, liabilities and personnel of
energy and power
department

ADB TA No. 4297-IND, Final Report
Capacity Building For Fiscal Reforms in Sikkim
239
O: Becoming a
hydro power consultancy and
power generation
To make the
corporation sustainable GoS
may pass on free
power from the existing and new
hydro power
project till it attains break -
even
T: Govt. policy to
promote IPPs and indessition on
retaining /
divesting power departments of
power project
Name of the
enterprise
Form of Organisation
Market Structure
(MS) and
Activities(A)
Financial
Status and
Physical
performance
Manpower Social purpose
Financial
System &
management
and interface
with
Government
Performance improvement
plan
SWOT Analysis Problems encountered
Strategic initiatives
Sikkim
Co-
operative
Milk
Union Ltd
(1980)
Co-operative Enterprise
MS: Competitive A: Milk
procurement, cattel
development, feed and fooder
distribution, milk
processing and milk market
Loss making company,
receding net
worth, negative
working
capital,
83 Mgl. 7 and Nmgl
60, Casual
16
uplift socio-economic
conditions of
the milk producers
Vision : Diary farmers'
prosperity
through consumer
satisfaction
and good and effective MIS
system
Perodic review of key
performance
indicators
S: Abundant live stock wealth, established milk producers co-
operative society, established
network of milk retail outlet and good networks of retail products
Inadequate advertising
expenses
Product portfolio restructuring by
adding new
products such as Panner, Chrpi,
Cream,
Physical performance:
60 % capacity
utilisation
Enhance the milk yeild of
the milch
animals
Right sizing implemented
by giving VRS
to 22 employees
costing 1.13
crore
W: High transportation and establishment costs; un trained
manpower
High establishment
cost
Market Restructuring :
market milk
distribution is been outsourced, milk
parlours in
Gangtok and other towns , better
packaging of milk
and milk products
Provide rural
employment
Competitive
prices,
O: Capability to produce milk and
milk products, boost to export
potential due to opening of Nathulla trade route, abundant fodder grass /
tree fodder
High
transportation
cost
Financial
Restructuring:
Internal audit systems to be
introduced

ADB TA No. 4297-IND, Final Report
Capacity Building For Fiscal Reforms in Sikkim
240
Capacity
building of farmers
Inadequate
costing and internal audit
system
T: Local milk vendors, inroads into
the local market by mega co-operatives and MNCs
Low per capita
milk production
Manpower
restructuring: VRS to surplus
employees and
appointment of qualified
manpower, more
vigourous capacity building
programmes
Interface with
the Government :
moderate
One-time
collection of milk
Technological
Restructuring : effective cold
chain maintenance,
automation of milk testing procedures,
computerisation of
all at work levels
closer of milk
societies in
monsoons
Entry of MNCs and
major co-
operatives
Poor and eritic power supply

ADB TA No. 4297-IND, Final Report
Capacity Building For Fiscal Reforms in Sikkim
241
Annexure 8.7 Subsidies of SLPEs
Name of the enterprise 2001-02 2002-03 2003-04
SIDICO 0 0 0
State Bank of Sikkim 0 0 0
Sikkim State Co-operative Bank 0 0 0
Sikkim Jewels 0.24 0.24 0.24
Sikkim Hatchery 0 0 0
Sikkim Poultry 0 0 0
Sikkim Precision Industries 0 0 0
SITCO 0 0 0
Tea Board of Sikkim 0 0 0
Sikkim Milk Union 0.62 0.25 0.34
Govt. Fruit Preservation Factory 0 0 0
Sikkim Tourism 0 0 0
Sikkim Handloom and
Handicrafts Dev. Corp. Ltd
0 0 0
Khadi and Village Board 0 0 0
State Trading Corp. 0 0 0
Sikkim Consumer Co-operative
Soceity
0 2.98
0
SIMFED 0 0 0
Denjong 0 0 0
Sikkim Nationalised Transport
Corp.
0 0 0
State Energy and Department of
Power
0 0 0
Sikkim Power Dev. Corp. 0 0 0
SABCCO 0 0.34 0.26
Total 0.86 3.81 0.84 0-not available (Source : Annexure 8.9)

ADB TA No. 4297-IND, Final Report
Capacity Building For Fiscal Reforms in Sikkim
242
Annexure 8.8 Questionnaire: Financial and other related Information on SLPEs
GENERAL INFORMATION 01a. Name of the enterprise:
(Please write in BLOCK LETTERS) 01b. Date of formation
01c. Name and Designation of the Chief Executive Officer:
02. Address:
_____________________________________________________________ Pin Code: ___________ Tel: ___________ Fax: ____________ Telex: ____________ E-mail: __________________ 03. Location of Registered Office:
04a. Major lines of activity (put √ mark against the activitiy)
Manufacturing, Trading & Services, Financial, Promotional Utility Welfare
[ ] [ ] [ ] [ ] [ ] [ ] 04b. Major reasons for establishment:
04c. Description of the Product
05a. Year of promotion: _____________ 05b. If there was a time lag, please give reasons:
06. Holding company: __________ Subsidiary company: _________ 07. Objectives: 08. Form of organisation (Please “tick”):
- Government company
- Public corporation
- Statutory Board

ADB TA No. 4297-IND, Final Report
Capacity Building For Fiscal Reforms in Sikkim
243
- Statutory or regulatory authority
- Departmental enterprise
- Cooperative society
- Registered society 09a. Give details of Market structure: Monopoly/Competitive
II GROWTH AND DEVELOPMENT 1. Periodisation (please describe in terms of specific landmark development) 2. Salient Features
III SOCIAL PURPOSE
1. Major line of social activities undertaken by the organisation 2. Details on outflow of funds for the social activities
S.N Details 2001-02 2002-03 2003-04 2004-05 Projected
IV FINANCIAL INFORMATION
(Rs. in lakhs)
S.N Details 2001-02 2002-03 2003-04 2004-05 Projected
1. Equity
2. Longterm debt
3. Total Investment
3. Reserves
4. Surplus/losses (-)
6 Current Assets
7 Current liabilities
8 Working capital
9 Capital employed (4+8) (This may be calculated on alternate basis from the liabilities route)
10 Net Sales / Turnover
11 Accumulated Losses
12 Net Worth
13 Other income
14 Total income
15 Direct Costs
16 Contribution (10-15)
17 Gross Margin
18 Cost of Sales
19 Operating Profit
20 Interest
21 Profit Before Tax
22 Tax
23 Net Profit
24 Subsidies 1. Capital 2. Revenue 3. Managerial 4. Hidden 5. Total
25. Guarantees
26. Contingent Liabilities
27. Liabilities to be settled

ADB TA No. 4297-IND, Final Report
Capacity Building For Fiscal Reforms in Sikkim
244
28. Valuation of Enterprise 1. Land 2. Plant Machinery 3. Stocks 4. Patents 5. Liabilities 6. Total
29. Court Cases
30. Contribution 1. Interest 2. Dividends 3. Excise 4. Surpluses 5. Exports 6. Sales Tax 7. Depreciation 8. Write-Off
V. PHYSICAL PERFORMANCE 1. Installed Capacity 2. Capacity Utilised 3. Manpower
Managerial Non-Managerial Casual 4. New Products/ Services Added 5. No. of employees availing VRS 6. Costs incurred on VRS 7. Costs reimbursed on VRS
VI ORGANISATIONAL STRUCTURE
1. Size of Board
a) Government nominee(s)
b) Nominee(s) of Financial Institutions
c) Nominee(s) of Workers / Managers
d) Nominee(s) of Foreign Collaborators
e) Functional directors
f) Professional part-time directors
g) CMD
h) Total
(Sanctioned strength of Directors)
i) Tenure of the Board of Directors
2. What is your Organisational Chart?
3. Extent of Delegation & Decentralisation
4. Do you practice Internal Audit
5. Do you have Budgeting Process
6. What are your Investment Policies
7. What Pricing methods are followed?
8. Do you have Man Power Planning & Performance Appraisal
9. Training Programmes
10. Status of R&D
11. What Performance Evaluation Methods are followed?

ADB TA No. 4297-IND, Final Report
Capacity Building For Fiscal Reforms in Sikkim
245
VII SWOT Analysis 1. Strengths 2. Weaknesses 3. Opportunities 4. Threats
VIII RESTRUCTURING Give details on the following aspects: 1. Product portfolio 2. Market Restructuring 3. Financial Restructuring 4. Manpower Restructuring 5. Organisational Restructuring 6. Technological Restructuring 1. What is the average tenure for the Board of Directors?
2. What is the existing Compensation Package offered to the CEO and Board of Directors ?
VI. STRATEGIC INFORMATION 1.Is your enterprise involved in:
(i) Restructuring (ii) Disinvestment (iii) Privatisation
2. Indicate the financial costs of (including VRS, Settlement of Liabilities, rate of sale of assets, etc)
(i) Restructuring (ii) Disinvestment (iii) Privatisation
3. Indicate the social costs of:
(i) Restructuring (ii) Disinvestment (iii) Privatisation
4. Provide the proposed steps for:
(i) Restructuring (ii) Disinvestment (iii) Privatisation
1. What is the market structure of the organisation?
2. Please provide the Company‟s Profile?
3. Give Details on Foreign Collaborations.
4. What is the present state of Technology?
5. What is the extent of spending on Advertising Expenses?
6. What is the share in Exports & Imports?

ADB TA No. 4297-IND, Final Report
Capacity Building For Fiscal Reforms in Sikkim
246
7. Please give Details on any Mergers & Acquisitions taken place?
8. What is your Corporate Vision?
Please provide exhaustive notes on:- 1. Valuation of assets. 2. Privatisation, closure and restructuring of activities, divisions, products / services, enterprise.
3. Problems faced by the enterprise.
4. How the enterprise proposes to meet the resource gap in the future due to the reduction in budgetary support by the
Government.
5. Details of VRS in existence at present, and details concerning the number of employees accepting VRS, total incidence of VRS
in monetary terms, and future plan of action.

ADB TA No. 4297-IND, Final Report
Capacity Building For Fiscal Reforms in Sikkim
247
Annexure 8.9 Schedule on Internal Organisaiton and Structure SECTION 1: BACK GROUND OF THE ENTERPRISE
Table:1 Back Ground
List of
Firms
Objective Legal
form
Uni-
Plant or
Multi-
Plant
Capacity Major
products/
Activities
Turnover : product
wise or Activity wise
Employ
ee
Strengt
h
Market Structure
Instal
led
Utilisa
tion %
Managerial Non-Managerial Total % of
Mgrl.to
Total
% of
Non-
Mgrl.
To
Total
SECTION 2: ORGANISATION STRUCTURE
Table 1: Number & Tenure of the Board
Lis
t
of
fir
ms
Number of Board of Directors Average Tenure of the Board
Initially 2003-04 Initially 2003-04
1 2 3 4 T 1 2 3 4 T 1 2 3 4 1 2 3 4
Note:1- Government Officials (Bureaucrats), 2- Politicians, 3- SLPE Personnel, 4- Labour representative
5- Total
Table –2 Changes in CEO and Functional Directors
List
of
Firm
s
Number of Changes in Chief Executive Officers(CEOs) & Functional Directors(FDs)
CEO FD CEO FD CEO FD CEO FD CEO FD
Table: 3 Frequency of Changes
List of
Firms
Chief Executive Officer Functional Director
Once in 3
yrs.
Once in 2
yrs.
Once in
1yr.
Twice or
more in
One Yr.
Once
in 3
yrs.
On
ce
in 2
yrs.
Once in
1 yr.
Twice or
More in
One Yr.
Table 4: BOD Meeting and % of Attendance
List
of
Fir
ms
92-93 93-94 94-95 95-96 96-97
1 2 3 4 1 2 3 4 1 2 3 4 1 2 3 4 1 2 3 4
Note: 1-Total Number of Directors, 2- Total BOD Meetings Held, 3- Number of Directors Attended, 4- % of Attendance - ( 3÷1 ) x
100

ADB TA No. 4297-IND, Final Report
Capacity Building For Fiscal Reforms in Sikkim
248
Table: 5 Decision Making Powers – Pricing
List of
Firms Govmnt. () BoD ( ) CEO () Others ()
1 2 3 1 2 3 1 2 3 1 2 3
Note: 1- At the Time of Inception, 2- Currently, 3- Year When Changed
Table: 6 Decision Making Powers – Investment
List of
Firms Govmnt. () BoD ( ) CEO () Others ()
1 2 3 1 2 3 1 2 3 1 2 3
Note: 1- 1-At the Time of Inception, 2-Currently, 3-Year When Changed
Table: 7 Decision Making Powers – Hiring of Labour/ Officials
List of
Firms Govmnt. () BoD ( ) CEO () Others ()
1 2 3 1 2 3 1 2 3 1 2 3
Note: 1-At the Time of Inception, 2-Currently, 3-Year When Changed
Table: 8 Decision Making Powers – Retrenchment/ Suspension of Labour /Officials
List of
Firms Govmnt. () BoD ( ) CEO () Others ()
1 2 3 1 2 3 1 2 3 1 2 3
Note: 1-At the Time of Inception, 2-Currently, 3-Year When Changed
Table: 9 Decision Making Powers – Collaboration with Foreign Firms
List of
Firms Govmnt. () BoD ( ) CEO () Others ()
1 2 3 1 2 3 1 2 3 1 2 3
Note: 1-At the Time of Inception, 2-Currently, 3-Year When Changed
Table:10 Decision Making Powers-Collaboration with Other Firms within Country
List of
Firms Govmnt. () BoD ( ) CEO () Others ()
1 2 3 1 2 3 1 2 3 1 2 3
Note: 1-At the Time of Inception, 2-Currently, 3-Year When Changed

ADB TA No. 4297-IND, Final Report
Capacity Building For Fiscal Reforms in Sikkim
249
SECTION 3: GOVERNMENT CONTROL
Table:1 Interaction of CEO/Senior Level Officers with Political Entities
Lis
t
of
Fir
ms
Ministers Ministers of State MLAs Chairperson (If
Political)
Others
La
st I
mn
th.
Last
6
mnt
hs.
Last
1 yr.
Last
I
mnth
.
Last
6
mnt
hs.
Last
1
yr.
Last
I
mnt
h.
Last 6
mnths.
L
as
t
1
yr
.
Last I
mnth.
Last
6
mnt
hs.
Last
1
yr.
Last
I
mnt
h.
Last
6
mnt
hs.
Last 1
yr.
Table:2 Instructions from Political Entities to CEOs/ Senior Officers(SOs)
List
of
Firm
s
Ministers Ministers from
State
MLAs Chairperson ( If
Political)
Others
Last
I
mnt
h.
La
st
6
mn
ths
.
L
as
t
1
yr
.
Last
I
mnt
h.
Last
6
mnt
hs.
Last
1 yr.
Last
I
mnt
h.
Last
6
mnt
hs.
Last
1 yr.
Last
I
mnt
h.
Last
6
mnt
hs.
Last
1 yr.
Last
I
mnt
h.
Last
6
mnt
hs.
La
st
1
yr.
Table:3 Frequency of Receiving Instructions (Past Six Months)
List
of
Fir
ms
Pricing Investment Personnel selection Purchase of
Inputs
Other daily
Decisions
1 2 3 4 5 1 2 3 4 5 1 2 3 4 5 1 2 3 4 5 1 2 3 4 5
Note: 1-Ministers, 2- Ministers of State, 3- MLAs, 4-Chairpersons (Political), 5- Others
Table:4 Interaction of Enterprise with Govt. Officers
Lis
t of
Fir
ms
Rank-1 Rank-2 Rank-3 Rank-4
Last 1
Mnth.
Last 6
Mnths
.
Last 1
year
Last 1
Mnth.
Last 6
Mnths
.
Last 1
year
Last 1
Mnth.
Last 6
Mnths
.
Last 1
year
Last 1
Mnth.
Last 6
Mnths
.
Las
t 1
yea
r
Table: 5 Receipt of Information from Government Officers
Lis
t of
Fir
ms
Rank-1 Rank-2 Rank-3 Rank-4
Last 1
Mnth.
Last 6
Mnths
.
Last 1
year
Last 1
Mnth.
Last 6
Mnths
.
Last 1
year
Last 1
Mnth.
Last 6
Mnths
.
Last 1
year
Last 1
Mnth.
Last 6
Mnths
.
Las
t 1
yea
r

ADB TA No. 4297-IND, Final Report
Capacity Building For Fiscal Reforms in Sikkim
250
Table: 6 Instructions Received from CEO from Government Officers Leading to Decision Making
List
of
Fir
ms
Pricing Investment Personnel
Selection
Purchase of Inputs Other Daily
Decisions
R
1
R
2
R
3
R
4
R
1
R
2
R
3
R
4
R
1
R
2
R
3
R
4
R
1
R
2
R
3
R
4
R
1
R
2
R
3
R
4
Note: R1, R2, R3 and R4 denote the different ranking Government Officers.
SECTION 4: FINANCIAL MANAGEMENT
Table: 1 Budgetary Support from Government & Others (Rs. in lakhs)
Lis
t
of
Fir
m
S
Initial 92-93 93-94 94-95 95-96 96-97
G O T G O T G O T G O T G O T G O T
TABLE: 2 Government Equity Extended to Debt Equity (Rs. in Lakhs)
Lis
t
of
Fir
ms
92-93 93-94 94-95 95-96 96-97
GE TE % GE TE % GE TE % GE TE % GE TE %
Source: GE- Government Equity, TE- Total Equity of share holders, % - (GE/TE) x 100
Table: 3 Long Term Debt as % to Total Debt List
of
Fir
ms
92-93 93-94 94-95 95-96 96-97
LD TD % LD TD % LD TD % LD TD % LD TD %
Debt: LD- Long Term Debt, TD- Total Debt, % - LD/TD x 100
Table: 4 Subsidy
List
of
Fir
ms
92-93 93-94 94-95 95-96 96-97
C R M H T C R M H T C R M H T C R M H T C R M H T

ADB TA No. 4297-IND, Final Report
Capacity Building For Fiscal Reforms in Sikkim
251
Subsidy: C- Capital , R- Revenue, M- Managerial, H- Hidden* , T- Total
* includes concessional interest rates charged by Govt., interest free loans extended by Govt., Dividends foregone by the Govt., plant
& land given by Govt. etc.
Table: 5 Cash Profit / Losses
List of Firms 92-93 93-94 94-95 95-96 96-97
Rs. Rs. Rs. Rs. Rs.
Table: 6 Gross Margin
Li
st
of
Fi
rm
s
92-93 93-94 94-95 95-96 96-97
G
M
%
G
M
%
O
M
S
A
T
y/
n
G
M
%
G
M
%
O
M
S
A
T
y/
n
G
M
%
G
M
%
O
M
S
A
T
y/
n
G
M
%
G
M
%
O
M
S
A
T
y/
n
G
M
%
G
M
%
O
M
S
A
T
y
/
n
GM – Gross Margin , % GM - % of Gross Margin, % OM – Optimal % of GM,
SAT- Satisfied with the % of GM, Yes or No?
Table: 7 Cost Management
List of
the
Firms
Are your Labour Costs:
Have You Introduced/ Undertaken the Following:
Yes(y) or No(n)
Hi
gh/
Lo
w
Comparabl
e to Similar
Enterprises
in Private
Sector
()
What is
the Ideal
% of
Spending
on
Labour?
Cost
Sheet
Stan
dard
ised
your
Cost
s
Var
ian
ce
An
alys
is
Cost
Contr
ol
Syste
m
Cost
Reduct
ion
Progra
mme
ABC EOQ VE
ABC – ABC analysis ( Inventory Control), EOQ – Economic Order Quantity (Inventory Control) , VE – Value Engineering
Table:8 Budgetary Support from Government, Banks and Financial Institutions (Rs. in Lakhs)
F
i
r
m
s
1992-93 1993-94 1994-95 1995-96 1996-97
G
E
B
/
F
I
O T
E
%
G
E
G
E
B
/
F
I
O T
E
%
G
E
G
E
B
/
F
I
O T
E
%
G
E
G
E
B
/
F
I
O T
E
%
G
E
G
E
B
/
F
I
O T
E
%
G
E
FINANCIAL
COMMERCIAL
PROMOTIONAL

ADB TA No. 4297-IND, Final Report
Capacity Building For Fiscal Reforms in Sikkim
252
GE: Government Equity, B/FI: Banks/ Financial Institutions, O: others, TE: Total Equity, % GE : % of GE to TE.
Table: 9 Hidden Subsidies (Rs. in Lakhs)
Firms 1992-93 1993-94 1994-95 1995-96 1996-97 Total
FINANCIAL
SUB
COMMERCIAL
SUB
PROMOTIONAL
SUB
TOT
Table: 10 Long Term Loans From Government, Banks/FIs (Rs. in lakhs)
F
I
R
M
S
1992-93 1993-94 1994-95 1995-96 1996-97
G B T % G B T % G B T % G B T % G B T %
FINANCIAL:
COMMERCIAL:
PROMOTIONAL:
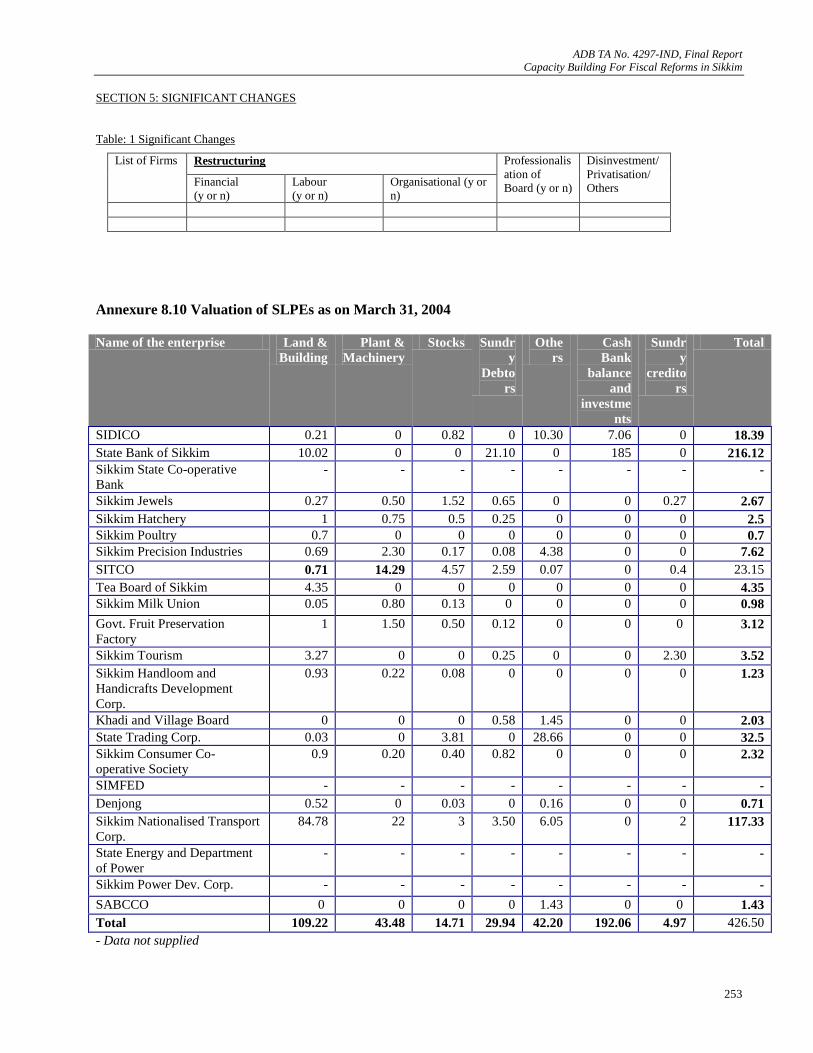
ADB TA No. 4297-IND, Final Report
Capacity Building For Fiscal Reforms in Sikkim
253
SECTION 5: SIGNIFICANT CHANGES
Table: 1 Significant Changes
List of Firms Restructuring Professionalis
ation of
Board (y or n)
Disinvestment/
Privatisation/
Others Financial
(y or n)
Labour
(y or n)
Organisational (y or
n)
Annexure 8.10 Valuation of SLPEs as on March 31, 2004
Name of the enterprise Land &
Building
Plant &
Machinery
Stocks Sundr
y
Debto
rs
Othe
rs
Cash
Bank
balance
and
investme
nts
Sundr
y
credito
rs
Total
SIDICO 0.21 0 0.82 0 10.30 7.06 0 18.39
State Bank of Sikkim 10.02 0 0 21.10 0 185 0 216.12
Sikkim State Co-operative
Bank
- - - - - - - -
Sikkim Jewels 0.27 0.50 1.52 0.65 0 0 0.27 2.67
Sikkim Hatchery 1 0.75 0.5 0.25 0 0 0 2.5
Sikkim Poultry 0.7 0 0 0 0 0 0 0.7
Sikkim Precision Industries 0.69 2.30 0.17 0.08 4.38 0 0 7.62
SITCO 0.71 14.29 4.57 2.59 0.07 0 0.4 23.15
Tea Board of Sikkim 4.35 0 0 0 0 0 0 4.35
Sikkim Milk Union 0.05 0.80 0.13 0 0 0 0 0.98
Govt. Fruit Preservation
Factory
1 1.50 0.50 0.12 0 0 0 3.12
Sikkim Tourism 3.27 0 0 0.25 0 0 2.30 3.52
Sikkim Handloom and
Handicrafts Development
Corp.
0.93 0.22 0.08 0 0 0 0 1.23
Khadi and Village Board 0 0 0 0.58 1.45 0 0 2.03
State Trading Corp. 0.03 0 3.81 0 28.66 0 0 32.5
Sikkim Consumer Co-
operative Society
0.9 0.20 0.40 0.82 0 0 0 2.32
SIMFED - - - - - - - -
Denjong 0.52 0 0.03 0 0.16 0 0 0.71
Sikkim Nationalised Transport
Corp.
84.78 22 3 3.50 6.05 0 2 117.33
State Energy and Department
of Power
- - - - - - - -
Sikkim Power Dev. Corp. - - - - - - - -
SABCCO 0 0 0 0 1.43 0 0 1.43
Total 109.22 43.48 14.71 29.94 42.20 192.06 4.97 426.50
- Data not supplied

ADB TA No. 4297-IND, Final Report
Capacity Building For Fiscal Reforms in Sikkim
254
Annexure 8.11 Restructuring Cost as on March 31, 2004 (Rs in crore) Name of the enterprise Severa
nce /
VR
Traini
ng
Renov
ation /
Expan
sion
Write
off
IT
require
ment
Court
cases
Bank
overdraft
Repa
yme
nt of
loans
Conting
ent
liabilitie
s
Operati
onal
deficit
Advertis
ement &
Promoti
onal
Sundry
credito
rs
Guar
antee
s
Other Dues
from
Govt.
Working
Capital
Assistan
ce
Business
Develop
ment
Total
SIDICO 0.90 0.15 20.00 13.84 0.10 0 0 0.37 0 0 0.30 0 0 0 0.09 0 0 35.75
State Bank of Sikkim 5.60 0 0 25.24 0 0 0 0 2.14 0 0 0 4.37 0 0 0 0 37.35
Sikkim State Co-operative Bank
- - - - - - - - - - - - - - - - - -
Sikkim Jewels 4.37 0.5 10.50 0 0.50 0 0 0 4.45 0 0 0.27 0 0.43 0.24 0 0 21.26
Sikkim Hatchery 0.15 0 3 0 0.50 0 0 0 0.45 0.1 0.1 0 0 0 0.50 0.40 0 5.20
Sikkim Poultry 0.06 0.15 1.50 0 0 0 0 0 0.1 0.1 0 0 0 0 0 0 0 1.91
Sikkim Precision
Industries 2.1 0.20 1.39 0.11 0 0 0 0.10 0 0 0.1 0 0 0 0 0 0 4.00
SITCO 2.19 0.35 2.85 1.5 0.3 0 5.77 0.51 0 2.54 1.8 0.4 5 0 0 0 0 23.21
Tea Board of Sikkim 0 0 0.72 0 0 0 0 0 0 0 0 0 0 0 0 0 0 0.72
Sikkim Milk Union 1.13 0 0.11 0 0.17 0 0 0.05 0.30 1.61 0 0 0 0 0 0 0 3.37
Govt. Fruit Preservation
Factory 0.63 0 0.99 0 0 0 0 0 0 0 0.15 0 0 0 0 0 0 1.77
Sikkim Tourism 0.33 0.35 2.50 0 1.25 0 0 0 1.05 0.65 0.4 2.3 0 0 0 0 0 8.83
Sikkim Handloom and
Handicrafts Development Corp. Ltd
0 0.5 0.07 0 0 0 0 0 0.01 0.05 0 0 0 0 0 0 0 0.63
Khadi and Village Board 0.65 0.1 0.23 0 0 0 0.34 0 0 0 0.02 0 0 0 0 0 0.25 1.59
State Trading Corp. 5.40 0.03 0 0 0.07 0 0 0 0 0 0.02 0 0 0 0 0 0 5.52
Sikkim Consumer Co-
operative Society 0.81 0.02 0 0.03 0.12 0 0 0 0 0 0.05 0 0 0 0.59 0 0 1.62
SIMFED 0.50 0 8.0 1 0.50 0 0 0 0 0 0 0 0 0 0 10 9.65 29.65
Denjong 0.40 0 3 1 0 0 0 0 0 1 0 0 0 0 0 3 0 8.40
Sikkim Nationalised
Transport Corp.
8.80 0.15 25.27 0 0.10 0.1 0 0 0.08 4 0.10 2 0 0 0 0 0 40.60
*State Energy and
Department of Power
- - - - - - - - - - - - - - - - - -
Sikkim Power Dev. Corp. 0.50 0 0 0 0 0 0 0 0 0 0 0 0 0 0 0 0 0.50
SABCCO 0.50 0.15 1 1.50 0.10 0 0 0 0 0 0.25 0 0 1.2 0 0 0.4 5.10
Total 35.02 2.65 81.13 44.22 3.71 0.10 6.11 1.03 8.58 10.05 3.29 4.97 9.37 1.63 1.42 13.40 10.30 236.98
* The department has been excluded from the scope of this study

ADB TA No. 4297-IND, Final Report
Capacity Building For Fiscal Reforms in Sikkim
255
Annexure 8.12 Savings from Privatisation / winding up of nine*SLPEs
Particulars 2003-04
1 Total Investment 78.19
2 Opportunity Cost
(@ 10 % on Total Investment ) 7.81
3
Less Net Profit 0.27
4 Add Subsidies 3.22
5 Total (2+3+4 ) 10.76
6 Less Dividends 0.11
7 Gross Direct Cost (5-6) 10.65
8 Add Guarantees 50.00
9 Total Cost (7+8) 60.65
10 Restructuring Cost 24.96
11 Annual Saving (9-10) 35.69
(*Sikkim Jewels Ltd, Sikkim Hatchery Ltd, Sikkim Poultry Dev. Corp. Ltd,
Sikkim Precision Industries, Govt. Fruit Preservation Company,
Sikkim Time Corporation, Sikkim Trading Corp. , Sikkim Consumer Co-operative Society
and Sikkim Power Dev. Corp.)

ADB TA No. 4297-IND, Final Report
Capacity Building For Fiscal Reforms in Sikkim
256
Annexure 8.13 Enterprise Wise Restructuring Plan
8.15 .1
Name of the SLPE : Sikkim Industrial Development and Investment
Corp. Ltd (SIDICO)
Date of incorporation : March, 1977
Classification : Financial Sector
Administrative Dep. : Finance Revenue and Expenditure Department,
GoS.
No of Employees : 34
Total Investment : Rs 19.66 crore
Accumulated Profit/
losses : Rs -7.36 crore
Dividends : Nil
Restructuring Path : Disinvest
Anticipated Benefits : Additional resources to the GoS
Valuation : Nil
Restructuring Cost : Rs 35.75 crore
Enterprise Profile
The authorized share capital of the company is Rs 20 crore of which the paid up capital is Rs 17.04 crore.
GoS has contributing Rs 10.67 crore to share capital whereas the Industrial Development Bank of India
contributed Rs 6.37 crore. The objectives are to: provide long term loans for setting up cottage, tiny, small
and medium industries; provide financial support for expansion, diversification and modernisation; extends
financial assistance for Hotel Industry, small Hospitals / Nursing homes; provide seed capital towards
participation towards promoter‟s contribution under the scheme of IDBI/ SIDBI; participate in share capital
for joint sector projects; disburse Central and State Government incentives; set up and develop industrial
areas and industrial estates; and achieve rapid industrial and economic development of the State. The
corporation has been appointed as a nodal agency for the preparation of the detailed project report for
widening of national highway 31 A and setting up the software technology park at Tadong. The major
concerns of the corporation include: lack of good and viable proposals for finance, high percentage of NPAs,
high administrative cost, decline in equity support from Government, discontinuation of disbursement of
central subsidies like central investment subsidies and central transport subsidies, and competition from
other financial institutions like commercial banks, North Easter Developmental Financial Institution,
SABCCO, etc.
Remarks
Various policy measures taken by the Central Government reforming financial sector and industrial sector
have led to the total transformation of the finance industry in India. A healthy competition has stirlled the
financial sector and the borrower has the choice to go in for a particular lender. There is a need to re-define
the role of SIDICO especially in the context of competition being offered by the sister SLPEs such as
SABCCO and regional developmental banks such as North Eastern Development Financial Institution. The
corporation has high NPAs and also a number of court cases.
Restructuring Costs
Resources Amt in crore
1. Voluntary Retirement Scheme to downsize 25 % of manpower 0.90
2. Training for skill upgradation of staff and for meeting the 0.09
growing need of business
3. Office modernisation, computerisation of financial loan
accounting and MIS system 00.10
4. Industrial Infrastructure and development of Industrial
Development center 20.00
5. Write off ( provision made against bad / loss assets as per
RBI guideline 12.06
6. Write off (Provision made for diminution in value of investment 01.78
as per RBI guidelines)

ADB TA No. 4297-IND, Final Report
Capacity Building For Fiscal Reforms in Sikkim
257
7. Promotional activities viz. Trade fair, publicity, advertisement, entrepreneur development
programmes
00.30
8. Repayment of refinance loan borrowed at higher rate of
Interest of 11 per cent 00.37
9. Dues from Govt. ( 2 per cent mortgage deed registration
Stamp duty incurred by SIDICO as an incentive of entrepreneurs
on behalf of State Govt.) 00.09
10. Fee for conducting a study on financial restructuring 00.06
Total fund requirement 35.75
Suggested Restructuring
The developmental role of the SIDICO has to be balanced with commercial role. The SIDICO should strike
a balance between the investment and lending function and their again between long term and short term
investments, and long term and short term lending‟s. The corporation requires capital restructuring to access
low cost funds in the market to capitalize on its strengths. SIDICO has to strengthen its industry related
systems for better credit appraisal. It is advised to convert a part of its equity, say a minimum of Rs 5
crore, into eight per cent long term loan as a first step in the reconstruction of the corporation. The
board has to be professionalised in order to tap capital markets. To start with, the GoS may disinvest up
to 15 per cent / 20 per cent of its share capital to central financial institutions / mutual funds by fixing bid
price through auctions.
Action Plan
Preparation of a Corporate plan
An MOU with Chief Executive to cover aspects such as future role of SIDICO (mix of its lending –
investment in shares, term loans, future profits, projected dividends)
Conversion of equity of Rs 5 crore into 8 per cent term loan
VRS to 15 employees, renovations, write off
Installation of computer network, hardware and software
Advertising and publicity
Strengthening industry-wise information databases
Designing suitable entrepreneurship training programmes
Subjecting all the employees to innovate training programmes in order to regularly update their
skills and knowledge base
Time frame
The total restructuring should be completed within 3 years
8.15.2
Name of the SLPE : State Bank of Sikkim
Date of incorporation : 24th
June 1968
Classification : Financial Sector
Administrative Dep. : Finance Revenue and Expenditure Department, GoS.
No of Employees : 271
Total Investment : Rs 5.40 crore
Accumulated Profit /
losses : Rs 36.42 crore
Dividends : -
Restructuring Path : Divest
Anticipated Benefits : Additional resource to Govt.
Valuation : Rs 216.12 crore
Restructuring Cost : Rs 37.35
Enterprise Profile
State Bank of Sikkim was founded under the Proclamation of Chogyal. It is a statutory body. The field of
operation of the bank is currently restricted to political boundaries of the State of Sikkim. The GoS is the
largest client of the bank. The bank also doubles up as the treasury to the State. Among the borrowers,
government, contractors, and employees constitute the largest group. There are individual borrowers with
large amount of loans and advances. The authorized capital of the bank is Rs 1crore against the paid up

ADB TA No. 4297-IND, Final Report
Capacity Building For Fiscal Reforms in Sikkim
258
capital of Rs 0.58 crore. The bank has 21 branches all over Sikkim. Although the bank is currently an
operational profit making organization, it has accumulated losses of very high magnitude. The bank staff is
not well versed in banking operations and is required to acquire relevant skills-set. The Non Performing
Assets (NPAs) of the bank are Rs 40 crore. The bank is looking forward to have a strategic partner for its
future growth. The major concerns of the bank are: threat posed by commercial banks, high administrative
cost, poor customer services, poor recoveries and inadequate system of monitoring and evaluation.
Remarks
The financial sector reforms are in full swing impacting tremendously the commercial banks. The banks
have to fall in line with the capital adequacy, income recognition, NPA reduction, employee
professionalisation and technology up-gradation norms. Although the RBI does not regulate State Bank of
Sikkim, there is an urgent need for the GoS to extend the linkage of the bank with the RBI regulation. To
improve its competitiveness and outreach just as the J&K Bank Ltd belonging to the State of Jammu and
Kashmir.
Valuation Details
(Rs. in crore )
Land &
Building
Plant and
Machinery
Stocks Bank OD Cash Su.
Debtors
Total
10.02 - - - 185.00 21.10 216.12
Restructuring Cost
(Rs. in crore)
VR Writeoff Rennovations Contingent
liability
Operational
deficit
Gurantee Write
off
Total
5.6 25.24 2.4 4.37 37.35
Suggested Restructuring
Asset - liability mismatch has to be removed. Technological up-gradation leading to setting up of its own
network and its interconnection with other networks has to be undertaken. Accumulated losses have to be
written-off. Employee training has to be introduced with a great rigour. Court Cases have to be settled.
Dependence on the GoS has to be considerably reduced for an organic growth of the bank. Loan evaluation
procedures have to be tightened.
Action Plan
Preparation of a corporate plan
Application of Indian Banking Companies Act
Grant of special fund by government to take care of the losses incurred on account of the loan
waiver scheme.
Settlement of court cases by especially designed institutional mechanism.
Rigorous training and management development
Introduction of loan evaluation procedures
VR to excess staff and access to social safety net.
Time frame
The total restructuring should be completed within 3 years
8.15.3
Name of the SLPE : Sikkim State Co-operative Bank Ltd (SISCO)
Date of incorporation : 12th
December, 1998
Classification : Financial Sector
Administrative Dep. : Department of Co-operation, GoS.
No of Employees : 16
Total Investment : Rs 9.36 crore
Accumulated Profit /Loss: Rs 1.05 crore
Dividends : 0.03
Restructuring Path : Continue in the state sector with increased
accent on resource mobilization and profitability
Anticipated Benefits : Improved fulfillment of public purpose
Valuation : -
Restructuring Cost : -

ADB TA No. 4297-IND, Final Report
Capacity Building For Fiscal Reforms in Sikkim
259
Enterprise Profile
SISCO became the Apex Co-operative Bank after obtaining licence from the Reserve Bank of India. It was
registered under the Sikkim Co-operative Societies Act, 1978. The main objectives of SISCO are to: serve as
a financing center for all co-operatives societies in the State, raise deposits and share capital for providing
loans to member co-operative societies and other individual members against viable schemes, and to do all
types of banking business as defined in Section 5 & 6(1) of the Banking Regulation Act, 1949. The
authorized capital of the bank is Rs 15 crore. The bank is involved in deposits, and loans and advances
operations. It has 3 branches located at Gangtok, Namchi and Gayzing. The bank has been continuously
earning profits and also declaring dividends. The credit-deposit (C-D) ratio of the bank is 71 per cent as
against the State average of 29 per cent for all the commercial banks. The bank is involved in developing a
pilot project in association with the state government, NABARD and 10 co-operative credit societies.
Remarks
The financial sector reforms have added a number of new dimensions for the successful functioning of the
banking industry. The co-operative banking sector has emerged as a weak link in the chain. Although,
SISCO has been doing well, it has tremendous scope to improve its efficiency. The bank has to improve the
volume of its operations and also its outreach. It may also add new businesses and strategise the growth of
high value products.
Suggested Restructuring
It is required to concentrate on new productline such as micro finance. It should internalize the use of
technology in its operations. It should set up more number of branches. The bank should promote
management development and training. It may consider appointing a consultant to formulate a business
growth plan.
Action Plan
Preparation of a corporate plan
Networking micro finance institutions
Settingup more branches
Technological Upgradation
Intensive training and management development
Intra-corporate planning with State Bank of Sikkim
Time frame
The total restructuring should be completed with in six months
8.15.4
Name of the SLPE : Sikkim Jewels Ltd (SJL)
Date of incorporation : 7th
December, 1972
Classification : Manufacturing Sector
Administrative Dep. : Department of Commerce and Industries, GoS.
No of Employees : 125
Total Investment : Rs 7.04 crore
Accumulated Profit /Loss: Rs 0.28 crore
Dividends : Nil
Restructuring Path : Closure or Liquidation or total divestiture
Anticipated Benefits : Saving of Govt. Resources
Valuation : Rs 2.67 crore
Restructuring Cost : Rs 21.26 crore
Enterprise Profile
The company is engaged in manufacturing watches, industrial jewels, rotor magnets, and disposable
syringes. It provides employment opportunities to unskilled people. The company declared dividends
between 1978-79 and 1981-82. However, currently, it is incurring losses due to un-precedented recession in
the horological industry. The company has made efforts to overcome the recession by making a dent in the
export market. The company has some pending issues for settlement with the government such as the
receiving the export incentives, lifting the moratorium on the payment of its deposits and reimbursement of
the VRS expenses incurred. The company can take up the manufacturing of any type of micro precession
instruments as its manpower trained to produce tiny jewels in micron tolerance.
Remarks
The company has done extremely well in the initial years. A continious decline of domestic demand and
fresh investments in new projects without scientific application of project management and evaluation
techniques has put company in a tight corner.

ADB TA No. 4297-IND, Final Report
Capacity Building For Fiscal Reforms in Sikkim
260
Valuation (Rs in crore)
Land &
Building
Plan &
Machinery
Stocks Sundry
Debtors
Others Gross
Estimated
Receipt
Total
Bank
Overdraft
Sundry
creditors
Total
0.27 0.5 1.52 0.65 2.94 0.27 2.67
Restructuring Cost: Since the enterprise is proposed to be privatised / wound up, the restructuring costs as
worked out by us are as follows:
The enterprise revealed the following as the restructuring costs on the presumption that it will continue to be
in the state portfolio after restructuring.
Modernisation :
1. SJL has a installed capacity of 36 lakhs meter jewels per year and is supplying to domestic markets.
As the consumption of water is growing, many state governments are introducing water maters in
house holds. This has increased the demand for quality water meters using jewels. SJL proposes to
modernize its exiting jewels plants by inducting latest machines form Switzerland and wants to
induct high productive diamond wheels. This needs and additional investment of 30 lakhs.
2. SJL is regularly supplying high quality jewels, used in watches, to Switzerland from since five
years. Swiss customers are insisting of better quality management. To meet international quality
standard, SJL needs modern testing equipments, like profile projectors and higher power
microscopes. This needs and additional investment of Rs 40 lakhs.
3. To cut down the rejection and increase productivity of Watch Jewels, SJL wants additional Rs 30
lakhs for importing the latest jewels manufacturing machines from Switzerland.
Diversification
1. Disposable syringe and needle manufacturing unit : SJL has set up a pilot project to manufacturing
Disposable syringes with a capacity of one millions syringes per year. Commercial production is
expected to commence from 3rd
week of April 2005. SJL plans to increase the capacity to 10
millions per year by inducting latest machines from Austria at a cost of Rs 250 lakhs.
2. Rotor magnets for quartz watches : SJL is manufacturing Rotor Magnets from rare earth material,
Samarium Cobalt, and has supplied to watch manufacturers in India. To export this product abroad,
as the clients wants complete stepper motor, SJL wants an additional investment of Rs 700 lakhs to
induct latest technology ie., sintering machine from Singapore. Detail project report can be
submitted.
3. Technical Training and Traveling: To be more competitive in international market SJL wants to
improve the technical skills of manpower by training them in Europe. To develop new markets
internationally, marketing persons have to travel frequently and freely. This needs additional fund
of Rs 50 lakhs.
4. Computerisation and Research and Development : To be more efficient computerisation and
interlinking of various departments to share information and data is must. Also to be more efficient
Research and Development activity should be taken up seriously for technology upgradation to look
for various options for diversification using similar technology. An additional fund of Rs 50 lakhs
is needed for the same.
5. Voluntary Retirement Scheme : To cut down the cost of production and to be more scheme and a
fund of Rs 49.32 lakhs was provided for the same.
6. Salary Revision : Salary of the employees was last revised in the year 1998 and needs revision now
which will need and additional fund of Rs 20 lakhs
7. Sundry Payable: Rs 27.03 lakhs
8. Contingent liabilities: SJL has given guarantee for the loan taken by ancillary units ; 5 units finance
by SIDICO – Rs 169 lakhs , 5 units financed by IDBI – Rs 276 lakhs
Suggested Restructuring
The organization is a clear case for privatisation. As an alternative, the organization could be merged in a
holding company and made one of its division. The holding company, in due course, decide about the
continuation of the division or its privatisation / closure.

ADB TA No. 4297-IND, Final Report
Capacity Building For Fiscal Reforms in Sikkim
261
Action Plan
Valuation of assets and liabilities
VR to excess employees
Access to social safety net
Training and management development on war footing in case of continuation of the company
Merger related activities if the company has to be made a division of the proposed holding company
Time frame
The total restructuring should be completed in six months.
8.15.5
Name of the SLPE : Sikkim Poultry Development Corp. Ltd
Date of incorporation : March 1991
Category : Manufacturing Sector
Administrative Dep. : Animal Husbandry LF&VS Department
No of Employees : 6
Total Investment : Rs 0.79 crore
Accumulated losses : - Dividends : Nil
Restructuring Path : Closure or Liquidation or total divestiture
Anticipated Benefits : Saving of Govt. Resources
Valuation : Rs 0.70 crore
Restructuring Cost : Rs 1.95 crore
Enterprise Profile
The corporation was established to promote, administer, own and run, improve, develop, finance directly or
indirectly, store and sale poultry and poultry products, poultry feed and equipment, and provide services for
the growth of poultry industry. The activities of the corporation include financial promotion and welfare of
the public and the poultry farmers, trading of the inputs, selling poultry and poultry products and operating
poultry processing plant and egg power processing plant. The enterprises functions in competitive market.
The finances of the enterprise are in a very unhealthy shape. Besides negative net profits, the same trend
persists with regard to net worth and working capital. The corporation is seeking a turnaround based on a
project report prepared by a consultant.
Remarks
The organization is defunct and is not adding any value to any stakeholder.
Valuation Amt Rs in crore
Land and Building 0.70 crore
Plant and Machinery Nil
Bank Overdraft Nil
Patients Nil
Su. Debtors Nil
Others Nil____
Total 0.70 crore
Restructuring Cost Rs in crore
VRS Nil
Training 0.15
Renovation and Expansion 1.50
Writeoff Nil
IT requirement Nil
Court Cases Nil
Bank OD Nil
Repayment of Loans Nil
Contingent liabilities 0.10
Operational Deficit 0.10
Advertisement and promotion 0.10
Su. Creditors Nil
Guarantees Nil
Others Nil
Dues from Government Nil _
Total 1.95_
ADB TA No. 4297-IND, Final Report
Capacity Building For Fiscal Reforms in Sikkim
262
Suggested Restructuring
The organization could be privatised through trade sale / employee and management buy out (EMBO)/ joint
venture
Action Plan
Valuation of assets and liabilities
VR to excess employees
Access to social safety net
Training and management development on war footing in case of continuation of the company
Merger related activities if the company has to be made a division of the proposed holding company
Time frame
The total restructuring should be completed in six months.
8.15.6
Name of the SLPE : Sikkim Hatchery Ltd
Date of incorporation : August 1994
Category : Manufacturing Sector
Administrative Dep. : Animal Husbandry LF&VS Department
No of Employees : 15
Total Investment : Rs 0.46 crore
Accumulated Profit /Loss: -
Dividends : Nil
Restructuring Path : Closure or Liquidation or total divestiture
Anticipated Benefits : Saving of Govt. Resources
Valuation : Rs 2.50 crore
Restructuring Cost : Rs 5.20 crore
Enterprise Profile
Sikkim Hatchery Ltd was set up as a joint sector company by GoS and Sri Venkateswara Hatcheries Ltd - a
private sector company. The organization was established to satisfy the demand for hatchery products within
the Sikkim and Bhutan. The company maintains poultry breeder stock, produces commercial chicks, markets
chicks to the poultry farmer, runs a feed mill and supplies brooding equipment to the poultry farms. The
company produces day old broiler chicks. The company is in manufacturing sector and operates in
competitive market. The company operates at 25 per cent of its capacity.
Remarks
The organization is defunct and is not adding any value to any stakeholder
Suggested Restructuring
The organization could be privatised through trade sale / employee and management buy out (EMBO) / joint
venture
Action Plan
Valuation of assets and liabilities
VR to excess employees
Access to social safety net
Training and management development on war footing in case of continuation of the company
Merger related activities if the company has to be made a division of the proposed holding company
Time frame
The total restructuring should be completed in six months.
8.15.7
Name of the SLPE : Sikkim Precision Industries Ltd (SPIL)
Date of incorporation : 15th
February 1999
Classification : Manufacturing Sector
Administrative Dep. : Department of Commerce and Industries, GoS.
No of Employees : 60
Total Investment : Rs 3.70 crore
Accumulated Profit /Loss: Rs -0.02 crore
Dividends : Nil
Restructuring Path : Closure or Liquidation or total divestiture
Anticipated Benefits : Saving of Govt. Resources
Valuation : Rs 7.62 crore
Restructuring Cost : Rs 4.00 crore

ADB TA No. 4297-IND, Final Report
Capacity Building For Fiscal Reforms in Sikkim
263
Enterprise Profile
The company is involved in manufacturing operations and produces T0-92 and T0-220 semi conductors. For
its order book, it is completely dependent on Bharat Electronics Ltd (BEL) which places job order on the
company and supplies relevant inputs. The company provides employment to 50 persons with primary and
secondary school education background. The company faces fierce competition from China which supplies
the semi conductors at much lower prices. The company is looking for new markets. It is approaching Bharat
Heavy Electrical‟s Ltd (BHEL) to supply capacitors, and replace some of its old machinery. The company is
planning to acquire some new machinery to boost its production. It is operating at a capacity of 40 per cent.
Remarks
SPIL is a high end technology oriented company operating in a completely protective environment. The
support from its mother organization – BEL, is not coming forward in as much as it is required. It is facing
threat from China. It has excess manpower. Its capacity utilisation is very low.
Suggested Restructuring
As per the company executives, SPIL should restructure its product line, markets and technology. The
excess manpower could be offered VR. The company may setup T0 – 92 assembly plant within the same
premises. The company may also take steps to increase its capacity utilisaiton.
However, in our opinion, the organization could be privatised through trade sale / employee and
management buy out (EMBO) / joint venture
Action Plan
Valuation of assets and liabilities
VR to excess employees
Access to social safety net
Training and management development on war footing in case of continuation of the company
Merger related activities if the company has to be made a division of the proposed holding company
Time frame
The total restructuring should be completed in six months.
8.15.8
Name of the SLPE : Sikkim Time Corporation Ltd (SITCO)
Date of incorporation : 1976
Classification : Manufacturing Sector
Administrative Dep. : Department of Industries, GoS.
No of Employees : 146
Total Investment : Rs 11.74 crore
Accumulated Profit/ Loss: Rs -2.92 crore
Dividends : Nil
Restructuring Path : Closure or Liquidation or total divestiture
Anticipated Benefits : Saving of Govt. Resources
Valuation : Rs 2.69 crore
Restructuring Cost : Rs 23.21 crore
Enterprise Profile
The company is the only watch manufacturer unit in Sikkim. It is the first company in Sikkim to have a
country-wide marketing network. The company started mechanical watch assembly unit in technical
collaboration with HMT Ltd. It established a watch crown manufacturing unit in collaboration with HMT
Ltd in 1984. In 1987, the company set up a semi – conductor unit in collaboration with Bharat Electronics
Ltd.. In 1992, the company established a digital watch manufacturing unit in collaboration with HMT Ltd..
In 2001, the company established a TV speaker manufacturing unit in collaboration with BPL Ltd. . The
collaborations have run into rough weather due to problems with the mother units. The company has
provided employment to over 1000 people mostly school dropouts from poor and rural backgrounds. 90 per
cent of the employees of the company are women folk. The company has contributed towards integration of
Sikkim with the rest of the country by promoting business association, transfer of technology and
collaborations with enterprises of repute such as the HMT Ltd, Bharat Electronics Ltd and BPL Ltd. . The
company fosters industrial culture in the State. Presently, the undertaking operates at a capacity of 20-30 per
cent

ADB TA No. 4297-IND, Final Report
Capacity Building For Fiscal Reforms in Sikkim
264
Remarks
The company is in a very bad shape as its order book is empty. It has a huge campus which is not being put
to any proper use. The employees sit idle without work. There is no money with the company to buy raw
materials and pay wages.
Valuation (Rs in crore)
Land &
Building
1
Plant &
Machinery
2
Stocks
3
Sundry
Debtors
4
Others
5
Bank
Overdraft
7
Sundry
creditors
8
7+8 Valuation
0.71 14.29 4.57 2.59 0.07 5.77 0.4 6.17 23.15
Restructuring Cost Amt Rs in crore
VRS 2.19
Training 0.35
Renovation and expansion 2.85
Writeoffs 1.50
IT requirement 0.30
Court cases Nil
Bank overdrafts 5.78
Contingent liabilities Nil
Operational Deficit 2.54
Advertisement and sales promotion 1.80
Su. Creditors 0.40
Repayment 0.51
Gurantees 5.00
Total 23.21
Suggested Restructuring
The organization could be privatised through trade sale / employee and management buy out (EMBO) / joint
venture
Action Plan
Valuation of assets and liabilities
VR to excess employees
Access to social safety net
Training and management development on war footing in case of continuation of the company
Merger related activities if the company has to be made a division of the proposed holding company
Time frame
The total restructuring should be completed in six months.
8.15.9
Name of the SLPE : Tea Board of Sikkim
Date of incorporation : 1st June 1974
Classification : Manufacturing Sector
Administrative Dep. : Department of Commerce and Industries, GoS
No of Employees : 449
Total Investment : Rs 22.71 crore
Accumulated Profit/loss: Rs 7.83 crore
Dividends : Nil
Restructuring Path : Continue in the state sector with increased
accent on resource mobilisation and profitability
Anticipated Benefits : Improved fulfillment of public purpose
Valuation : Rs 4.35 crore
Restructuring Cost : Rs 0.72crore
Enterprise Profile
It is a manufacturing enterprise presently being controlled by the Department of Industries and Commerce.
Tea Board of Sikkim produces tea from the Temi Tea gardens spread over in an area of 350 acres. It is a
profitable enterprise. However, due to global recession, its profits are declining. It provides employment to a
large number of local people. It has been able to build a brand for itself. The plant and machinery of the
corporation is becoming obsolete and outdated. Although, there is a board to manage the organisation, the
commercial outlook does not find favour with the organization place because of excessive control of the

ADB TA No. 4297-IND, Final Report
Capacity Building For Fiscal Reforms in Sikkim
265
administrative department. In the recent years, the production and productivity of the board had been
declining.
Remarks
Tea board continues to remain unprofessional. Its bushes are becoming old. It has not been able to increase
area of tea plantation. Its tea leaf withering plant and tea leaf drier machines are growing obsolete. Although,
it had a brand known as Temi Tea, it has not been able to popularize its tea on par with Darjiling Tea. The
wage costs of the company are increasing due to a substantial revision in the minimum wages.
Valuation
(Rs in crore)
Land &
Building
Plan &
Machinery
Stocks Sundry
Debtors
Others Cash Bank
balance and
investments
Total
4.35 - - - - - 4.35
Restructuring Cost (Rs in crore)
VR Training Renovation /
Expansion
Writeoff Total
- - 0.70 - 0.70
Suggested Restructuring
The board should be converted into a co-operative society which may obtain the near by lands for the tea
plantations. Old plants and machines should be replaced. The newly formed co-operative society may even
examine the option of taking the near by plots on lease. The productivity growth is the need of the hour.
Alternatively, the board could be merged in the newly proposed holding company for the manufacturing
sector and run as one of its division.
Action Plan
Preparation of a corporate plan
Conversion into a co-operative society or inclusion as a division of the holding company for
manufacturing sector.
Valuation of assets and liabilities
Professional marketing
Replacement of old plant and machinery.
OPTIMA
Acquisition of nearby plots
Time frame
The total restructuring should be completed in six months.
8.15.10
Name of the SLPE : Government Fruit Preservation Factory
Date of incorporation : 1964-65
Classification : Manufacturing Sector
Administrative Dep. : Department of Industries and Commerce
No of Employees : 63
Total Investment : Rs 1.07 crore
Accumulated Profit/loss: Rs 0.60 crore
Dividends : Nil
Restructuring Path : Introduce financial adjustments and then go
for disinvestment
Anticipated Benefits : Long term Investment in service to consumers
Valuation : Rs 3.12 crore
Restructuring Cost : Rs 1.78 crore
Enterprise Profile

ADB TA No. 4297-IND, Final Report
Capacity Building For Fiscal Reforms in Sikkim
266
Government Fruit Preservation Factory under takes the processing of fruits to produce fruit juices, jams,
jellies and sauces. Initially, the factory was producing only orange squash in season to encourage farmers to
grow orange plantation. Later on manufacturing of Jam, Jelly of other fruits like Pineapple, Plum Mango,
were also introduced, while establishing the factory. The Maharaja had an understanding with Government
of India to supply produce of the factory to the establishments of the Defence Ministry, Government of
India. The products were later supplied to Indian Airline, Air India, and British Airways, etc. These channels
of marketing continued to remain in vogue after the merger of Sikkim into India. The company was
marketing its products under the brand „Sikkim Supreme’. The firm was privatised and handed over to M/s
Sikkim Food and General Industries (P) Ltd. in 1987 – a firm owned by a local businessman. The firm could
not manage in the business world which adversely effected the goodwill of Sikkim Supreme Brand. The firm
was black listed by the Defence Department and subsequently handed over to the state government. The
factory remained closed for one year. 1995, the GoS handed over the factory to a Swiss firm M/s Red
Orchid Food Processing Ltd to run the company as a joint venture. However, the Swiss firm deserted the
company and consequently the GoS has to takeover the firm again. Now, GFPF is managed by the
Department of Industries and Commerce. Although, the firm is earning profits it faces a tough competition
from private sector. Its counter parts in Bhutan holds a major sway in the markets and is able to sell its
goods under the „Druk Brand‟. Kissan, another Indian firm, is also a formidable competitor. Many small
firms producing fruit juices , jelly‟s, and sauces in West Bengal have reduced the market share of the GFPF.
The moderinisation proposal granted by the Ministry of Food Processing, GoI, has not received support from
the GoS. The capacity utilized is very low and is in the range of 10- 20 per cent.
Remarks
The government is not sure about the future of the factory as it faces tremendous competition from private
sector especially from Kissan and Bhutan‟s Druk. The Factory‟s brand image has lost sheen. The Factory‟s
fortune has been fluctuating. This makes the company a very good case for total privatisation.
Valuation
(Rs in crore)
Land &
Building
Plan &
Machinery
Stocks Sundry
Debtors
Others Total
1 1.5 0.5 0.12 - 3.12
Restructuring Cost
A. Machinery and Equipments : Rs in crore
1. Automatic bottom machine 24-30 BPM EVATS 0.05
2. Pet blowing machine SSB05B (upto 2 Lts) 0.05
3. Water processing system 2000 LPM RO 0.05
4. SS Tank and Pipe lines 0.01
5. Packing set: Stripper, labeling machine (injection moulding)
0.08
6. Homogenous machine SS conveyer etc. 0.03
7. Bottle washing machine 0.01
8. M …. Crane of one ton 0.01
9. Shreading machine 0.005
10. Boiler 600 kg 0.05
11. Pouch packing machine 0.02
12 Electric lifting platform (4pes X 1.3 lakhs) 0.02
13 Retort (2 Nos.) 0.02
14. SS Kettle (4 pec X 1.00 each) 0.02
15 Smoke exhust system 0.02
16 Transport 709 model TATA truck 0.08
17 Office Vehicle 0.05
18 Food grade containers 1000 nos @ 300 pes 0.03
0.69
Installation Cost 5% _0.03__
0.72
Transportation 5% 0.03 _
0.75___
B. Civil Construction Works : Amt in Lakhs
1. Replacement of wooden trust by sheet tins inproduction hall 0.04

ADB TA No. 4297-IND, Final Report
Capacity Building For Fiscal Reforms in Sikkim
267
2. Flooring of production hall with Kota stone
150 X 30 & 50 X 50 @ 80 Sqft 0.06
3. Tiles upto 7 sft height in production hall 0.03
4. Renovation drainage system 0.02
5. Painting of factory roof and wall approach road 0.01
6 Office building repairing 0.01
7. Constuction of RCC 2 tier platform for stocking pupl (Raw
Material) in carboys 0.02
8. Renovation of electrification 0.03
9. Renovation of steam line 0.01
0.24___
C. Extension working – Marketing expenses 0.15
In metropolitans cities like Kolkata, New Delhi, Jaipur etc.
Restructuring Cost
VR Plant
&
Machi
nery
Training Renovation /
Expansion
Advertisement
& Promotional
Guarantees
Total
0.63 - - 0.99 0.15 -
1.78
Suggested Restructuring
The company could be privatised through trade sale or as a minority joint venture.
Action Plan
Valuation of assets and liabilities
VR to excess employees
Access to social safety net
Appointment of merchant banker for privatisation
Time frame
The total restructuring should be completed in six months.
8.15.11
Name of the SLPE : Sikkim Co-operative Milk Producers Union Ltd
Date of incorporation : July 1980
Classification : Manufacturing Sector
Administrative Dep. : Co-operation Department, GoS
No of Employees : 83
Total Investment : Rs 0.14 crore
Accumulated Profit/loss: Rs -2.54 crore
Dividends : Nil
Restructuring Path : Disinvest
Anticipated Benefits : Additional resource to Govt.
Valuation : Rs 0.98 crore
Restructuring Cost : Rs 3.37 crore
Enterprise Profile
It is an Apex body of the primary milk producer‟s co-operative societies at the village level and is a replica
of AMUL. It is a manufacturing enterprise hamstrung with the following problems: low productivity of cows
due to poor genetic potential, inadequacy of support services, inadequacy of fund, high cost of milk
procurement and marketing, lack of feeds and fodder resources, weak extension services, high cost of
maintenance of old plant and machinery, high establishment cost due to excess manpower, and weak
resources and infrastructure for quality control. The organization utilizes 70 per cent of its capacity. The
organization has ambitious plans for restructuring of diverse types and also meeting the challenges emerging
from competition. Currently, the enterprise is incurring losses and its net worth is receding.
Remarks
Sikkim Milk Union is engaged in the task of rural development through livestock growth and dairy sector
promotion. It faces competition from Anand and also from organized dairies and unorganized milk

ADB TA No. 4297-IND, Final Report
Capacity Building For Fiscal Reforms in Sikkim
268
producers. The organisation may make more milk producer‟s societies as its members and pay-off partly the
shareholdings of the GoS.
Valuation
(Rs in crore)
Land &
Building
Plan &
Machinery
Stocks Sundry
Debtors
Others Total
0.05 0.8 0.13 0.98
Restructuring Cost (Rs in
crore)
VR Training Renovation
/
Expansion
Writeoff IT
requirement
Court
cases
Bank
overdraft
Repayment
of loans
Contingent
labilities
Operational
deficit
Total
1.13 0.11 0.17 0.05 0.30 1.61 3.37
Suggested Restructuring
Sikkim Milk Producers Union requires to undertake market restructuring, financial restructuring, manpower
restructuring and technological restructuring. It also requires to initiate a cost restructuring drive. The market
restructuring requires contracting out of milk distribution, setting up milk parlors in Gangtok, producing
more value added items and better packaging. Manpower restructuring requires VR to excess work force,
capacity building and appointment of qualified manpower. Technological restructuring requires installation
of electric bulk milk coolers, automation of milk testing procedures, and computerisation Cost control
requires the setting up of standards and their vigorous implementation.
Action Plan
Preparation of a corporate plan
Asset - liability valuation
VR to excess employees
Joint ventures for marketing the products
Additions to product line
Technological upgradation
Outsourcing of milk distribution
Reduction in milk collection costs
Management development and training
Time frame
The total restructuring should be completed in six months.
8.15.12
Name of the SLPE : Sikkim Tourism Development Corp. Ltd
Date of incorporation : 21st September 1998
Classification : Promotional Sector
Administrative Dep. : Department of Tourism, GoS
No of Employees : 89
Total Investment : Rs 6.06 crore
Accumulated Profit/loss: Rs -2.59 crore
Dividends : Nil
Restructuring Path : Continue in the state sector with increased
accent on resource mobilisation and profitability
Anticipated Benefits : Improved fulfillment of public purpose
Valuation : Rs 3.52 crore
Restructuring Cost : Rs 8.83 crore
Enterprise Profile
The corporation deals with tourism services which includes tourist accommodation, tourist cafeteria, tourist
transport (helicopter service) and marketing, and consultancy to tourism department. The corporation also

ADB TA No. 4297-IND, Final Report
Capacity Building For Fiscal Reforms in Sikkim
269
organizes Teesta Tea Tourism festival. The corporation handles package tours and also conducts
management events. The corporation provides leadership to tourism industry in Sikkim in organising
capacity building programme and initiating development of tourism to various places in Sikkim. The
corporation operates at 50 per cent of the capacity in terms of occupancy rate of its hotels.
Remarks
Sikkim offers a great scope for tourism. The corporation has not been able to come up to the expectations. It
can enhance its productivity in relation to providing quality tourist services. It needs to introduce an effective
cost management. The mantra for the future growth of the corporation should be „public-private-partnership‟
(PPP). The GoS should handover the Nortel Hotel to the corporation purely from the point of view of
safeguarding its financial viability. The corporation should take steps to improve the occupancy of its hotel
accommodation. It should undertake aggressive marketing of its services. It should professionalise its staff.
The Department of Tourism, GoS should facilitate in the efficient functioning of the corporation.
Valuation
(Rs in crore)
Land
&Building
Plant &
Machinery
Stocks Bank
overdraft
Patents Sundry
Debtors
Others Total
3.27 NA NA Nil Nil 0.25 Nil 3.51
Restructuring Costs
(Rs in crore)
V
R
Tra
inin
g
Ren
ova
tion
Wri
te
off
IT
requir
ement
Court
cases
Bank
OD
Repaym
ent of
loans
Conting
ent
liability
Operati
onal
deficit
Adver
tisem
ent
Su.
Cr
Total
0.3
3
0.3
5
2.5
0
Nil 1.25 Nil Nil Nil 1.05 Nil 0.03 2.3
1
8.83
Suggested Restructuring
The corporation should concentrate on promotion of tourism in Sikkim and reduce its direct involvement in
providing services which it could better lease out, divest through trade sale or franchise to private sector.
Action Plan
Preparation of a corporate plan
Valuation of assets and liabilities
Installation of management and financial systems
Taking over of Nortel hotel
Concentrating on promotional role
Leasing out, franchising or divesting directly productive activities
Development of tourist cites on PPP basis
Development of tourist cites on PPP basis
Installation of website and ensuring its proper functioning
Professionalisation of staff
Management development and training for capacity building
VR to excess employees
Access to social safety net
Time frame
The total restructuring should be completed in six months.
8.15.13
Name of the SLPE : Sikkim Handloom and Handicrafts Dev.
Corp. Ltd
Date of incorporation : 1st December 2003
Classification : Promotional Sector
Administrative Dep. : Department of Commerce and Industries, GoS
No of Employees : 13
Total Investment : Rs 0.80 crore
Accumulated Profit/Loss: Rs 0.05 crore
Dividends : Nil
Restructuring Path : Continue in the state sector with increased
accent on resource mobilisation and profitability

ADB TA No. 4297-IND, Final Report
Capacity Building For Fiscal Reforms in Sikkim
270
Anticipated Benefits : Improved fulfillment of public purpose
Valuation : Rs 1.23 crore
Restructuring Cost : Rs 13.70 crore
Enterprise Profile
Sikkim Handloom and Handicrafts Dev. Corp. Ltd started operation effect from December 1, 2003. The
corporation has a share capital of Rs 5 crore. It is involved in the promotion of handloom and handicrafts
development activities. It organizes training programmes for artisans to upgrade their skills. It also provides
marketing support to craft persons, craft societies, co-operatives and non government organisations. Apart
from providing marketing outlets through the sales emporium at Gangtok and Delhi, the corporation also
encourages the participation of the craft persons in various exhibitions and fares within the State, as well as,
at the national level.
Remarks
The corporation is involved in the vital task of preserving and fostering the handicrafts wealth of Sikkim and
enhancing the competencies of artisans. Its effort to promote handicrafts through a pilot project by setting up
nine craft co-operatives at various places in the State is appreciable. The corporation‟s showroom at Gangtok
is functioning well. The corporation needs to step up its pace of work, professionalise its management, come
out of the shadow of the parent department, step up its effort in the realm of marketing and ensure a longer
tenure for the chief executive. The corporation needs revamp its managerial set up. It should promote
networking with the private sector institutions.
Valuation
(Rs in crore)
Land &
Building
Plan &
Machinery
Stocks Sundry
Debtors
Others Cash Bank
balance and
investments
Total
0.93 0.22 0.08 1.23
Restructuring Cost
(Rs in crore)
VR Training Renovations Contingent
liability
Operational
deficit
Advertisement Total
Nil 0.50 7.00 1.2 5.00 Nil 13.70
Suggested Restructuring
The corporation needs to develop its brand image. The corporation needs to enhance its commercial viability
and put premium on entrepreneurship. It should concentrate on developmental / promotional role. It should
open showrooms on franchise basis. It may lease out its existing showroom at zero point at Gangtok. A
lease agreement for a period of 3 to 5 years may be negotiated.
Action Plan
Preparation of Corporate Plan
Completion of the corporatision process
Professionalizing management through intensive training in the areas of functional management
Promoting management systems and their strict adherence
Enhancing the developmental role of the corporation and minimizing commercial role
Brand building
Extending the sales outlet networks through franchising
Leasing out the facility at zero point to private sector
Longer tenures to chief executives
Time frame
The total restructuring should be completed in six months.
8.15.14
Name of the SLPE : Khadi and Village Industries Board
Date of incorporation : 1975
Category : Promotional Sector
Administrative Dep. : Department of Commerce and Industries, GoS
No of Employees : 83
Total Investment : Rs 12.01 crore
Accumulated losses : -

ADB TA No. 4297-IND, Final Report
Capacity Building For Fiscal Reforms in Sikkim
271
Dividends : -
Restructuring Path : Continue in the state sector with increased
accent on resource mobilisation and profitability
Anticipated Benefits : Improved fulfillment of public purpose
Valuation : Rs 2.03 crore
Restructuring Cost : Rs 1.59 crore
Enterprise Profile
Prior to the merger of Sikkim in the Indian Union, the activities of the board were being managed with the
help of Bihar Khadi and Village Industries Board. Presently, the board is operating 13 production and
service centers, seven sales centers and four departmental units in different districts of Sikkim. The board
has been operating one rural engineering works and also a hand made paper industry unit. The board was set
up to patronise Khadi and Village industries in the State. The board produces cotton and woolen khadi, and
village industries Products. It is a promotional enterprise. It is incurring losses. The establishment costs of
the board are very high. The finances of the board are not in a good shape. The productivity is very low and
the market push for its products is non-existent.
Remarks
Khadi and Village Industries Board serves a high social purpose. However, its not being run professionally.
Its dependence on the government is very high. Its innovative capability is very low. Its establishment costs
are exorbitant. Its marketing capabilities are questionable. The functioning of the board has not much helped
the spinners and weavers in ameliorating their poverty.
Valuation
(Rs in crore)
Land &
Building
Plan &
Machinery
Stocks Sundry Debtors Others Total
- - - 0.58 1.45 2.03
Restructuring Cost Rs in crore
Payment of retirement benefits on VRS scheme 0.65
Overdraft 0.34
Purchase of new Charkha and Kharga 0.07
Setting up of a woken milling plant 0.15
Repairs and renewals 0.03
Stipend 0.10
Business development ` 0.25
Total 1.59
Suggested Restructuring
There is a need to amend the Khadi and Village Industries Board Act de-linking the board from the
government. The establishment costs have to be reduced drastically. The managerial capability of the
personnel is required to be enhanced through management development and training. The surplus employees
need to be covered by VRS. The repairs and renovations should be given top priority for a smooth
functioning of the board. The board should aggressively work towards increasing its turnover.
Action Plan
Preparation of a corporate plan
VRS to surplus employees
Access to safety net
Management development and training on war footing
Renovation and repairs of plant and machinery
Installation of financial and management systems
Sustain increase in turnover
Focusing on development of village industries products
Time frame
The total restructuring should be completed in six months.
8.15.15

ADB TA No. 4297-IND, Final Report
Capacity Building For Fiscal Reforms in Sikkim
272
Name of the SLPE : State Trading Corporation (STC)
Date of incorporation : 30th
March 1972
Classification : Trading and Service Enterprise
Administrative Dep. : Department of Commerce and Industries, GoS
No of Employees : 108
Total Investment : Rs 1.11 crore
Accumulated Profit /loss: -
Dividends : Rs 0.11 crore
Restructuring Path : Introduce financial adjustments and then go in
for disinvestment
Anticipated Benefits : Long term Investment in service to consumers
Valuation : Rs 32.50 crore
Restructuring Cost : Rs 5.52 crore
Enterprise Profile The corporation is engaged in procurement and supply of all types of materials required by the GoS. In
addition to attending the protocol duties of the GoS, the corporation also renders all types of assistance to the
patients sent to Kolkata for medical treatment. The corporation has an equity capital of Rs 1.11 crore. It has
no long term debt. It is a profit earning enterprise. The corporation proposes to close down the loss making
branches at Kolkata and Siliguri. It runs on a margin of three per cent between the procurement price and the
price at which goods are sold to the government departments. The wages and salaries constitute about seven
per cent of the total cost incurred by the corporation. The corporation is saddled with excess manpower. It
proposes to extend VRS to 25 employees. The corporation faces recovery problems from the government
departments. The corporation is awaiting a face lift from the opening up of the Nathulla –Pass linking India
to China. The corporation operates in a highly competitive market where private sector enterprises are
emerging as more important entities. The government departments are not satisfied with the functioning of
the corporation. The corporation, as an intermediate agency between the GoS and suppliers, only adds to the
procurement costs and delays.
Remarks
The management and financial systems of the corporation are very weak. The manpower is not trained. The
turnover is inadequate. Although, the corporation is a profit making organization, it has not nurtured the
climate of innovation. It is facing tough competition from private sector. Its recoveries are not satisfactory.
There is a need to privatise the corporation.
Suggested Restructuring
The GoS has to repeal the act which paved the way for the setting up of the corporation. The GoS may
privatise the corporation through trade sale / lease / employee and management buyout.
Action Plan
Updation of accounts
Repeal of the act under which the enterprise was set up
VRS to excess employees
Action plan for recoveries
Appointment of merchant bankers for privatisation
Preparation and implementation of action plan for recoveries
Time frame
The total restructuring should be completed in six months.
8.15.16
Name of the SLPE : The Denjong Agricultural Co-operative Society
Date of incorporation : 8th
February 1965
Classification : Trading and Service Enterprise
Administrative Dep. : Co-operation Department, GoS.
No of Employees : 112
Total Investment : Rs 0.2 crore
Accumulated Profit/loss: Rs -0.83 crore
Dividends : -
Restructuring Path : Increased accent on the resource mobilisation /
partial disinvestment
Anticipated Benefits : Better Revenues or reduced budget support

ADB TA No. 4297-IND, Final Report
Capacity Building For Fiscal Reforms in Sikkim
273
Valuation : Rs 0.71 crore
Restructuring Cost : Rs 8.40 crore
Enterprise Profile
This Apex co-operative society undertakes marketing of agricultural produce and supplies of consumables to
army. It is a trading and service enterprise. The organization is planning for expansion and diversification of
its activities. It proposes to initiate business development by setting up flour mill, cold storage, transport
fleet, meat procession units, marketing chain outlets and departmental store projects. It is expecting financial
support from National Co-operative Development Corporation (NCDC) and North East Council (NEC).
Remarks
The enterprise was set up to serve the interests of army in the region. It should diversify the business and
reduce the dependence on army. It could set up wholesale and retail outlets throughout the State. It is
duplicating some of the activities with Sikkim Consumer Co-operative Society, SIMFED, and STC.
Suggested Restructuring
The organisation should undertake marketing, financial, manpower and technological restructuring to curb
infructuous expenses, rationalize manpower, develop infrastructural activities, and modernise its associated
units. It should be a part of the proposed newly merged organisation integrating into itself SIMFED, STC
and Sikkim Consumer Co-operative Society.
Action Plan
Preparation of a corporate plan
Valuation of assets
Assessment of liabilities
Legal, accounting and financial preparation for merger into the proposed composite entity
Appointment of a consultant to effect merger
Time frame
The total restructuring should be completed in six months.
8.15.17
Name of the SLPE : Sikkim Consumers Co-operative Society
Date of incorporation : 23rd
July, 1975
Classification : Trading and Service Enterprise
Administrative Dep. : Co-operation Department, GoS.
No of Employees : 27
Total Investment : Rs 0.17 crore
Accumulated Profit/loss: Rs 0.75 crore
Dividends : -
Restructuring Path : Introduce financial adjustments and then go in
for disinvestment
Anticipated Benefits : Long term Investment in service to consumers
Valuation : Rs 2.32 crore
Restructuring Cost : Rs 1.62 crore
Enterprise Profile
The organisation caters to the needs of the general public by providing services at right price and acting as a
countervailing force to balance the prices offered by the private sector. It is a consumer co-operative society
dealing with the supply of stationeries, crockeries and other sundry items to the departments of the GoS and
the central government agencies. It has also some retail counters. Initially, the society was handling
consumer goods including the public distribution services items and the distribution of controlled cloths. The
society makes purchases of all the commodities directly through the manufacturer and the wholesale
agencies. The society proposes to open up departmental stores, install paper cutting units and set up sub-
divisional stores.
Remarks
The enterprise is operating in highly competitive market and is involved in non-core activities. Denjong,
SIMFED and STC are duplicating its activities. Some other SLPEs are also planning to take up the same
activities. Although, the enterprise is profit making, it does not have professional staff. Its accounts are in
arrears. It faces an acute problem of working capital. It does not have its own office premises. It is trying to
become a wholesale agent for several companies. Its turnover is inadequate. It does not have a strong middle
management. Its financial and managemental systems are weak.
Valuation
(Rs in crore)

ADB TA No. 4297-IND, Final Report
Capacity Building For Fiscal Reforms in Sikkim
274
Land
&Building
Plant &
Machinery
Stocks Patients Su. Debts Others Total
0.90 0.20 0.40 - 0.82 - 2.32
Restructuring Cost
(Rs in crore)
VR Training Renovation Writeoff IT
required
Advertisement Dues
from
Govt
Total
0.81 0.02 - 0.03 0.12 0.05 0.59 1.62
Suggested Restructuring
The organization should be merged into a broader entity combining SIMFED and Denjong Agricultural Co-
operative Society. It should clear the arrears of its accounts.
Action Plan
The arrears of accounts should be completed as early as possible
Preparation of a corporate plan
The VRS could be offered to surplus employees
The merger proceedings should be initiated
The liabilities should be settled and receivables may be obtained
Legal, accounting and financial preparation for merger into the proposed composite entity
Appointment of a consultant to effect merger
Time frame
The total restructuring should be completed in 1 year.
8.15.18
Name of the SLPE : Sikkim State Co-operative Supply and
Marketing Federation Ltd (SIMFED)
Date of incorporation : 1983
Classification : Trade and Service
Administrative Dep. : Co-operation Department, GoS.
No of Employees : 40
Total Investment : Rs 1.02 crore
Accumulated losses : -
Dividends : -
Restructuring Path : Increased accent on the resource mobilisation /
partial disinvestment.
Anticipated Benefits : Better Revenues or reduced budget support
Restructuring Cost : Rs 29.65 crore
Enterprise Profile
The authorized capital of the Federation is Rs 3 crore. This organisation is involved in the marketing of
agricultural produce viz. ginger, orange, cardamom. The organisation also undertakes the procurement of
supplies for the departments of the GoS. The organisation has broken even. SIMFED procures items such as
fertilizers, livestock feeds, seeds, pesticides, agricultural implements uniforms, cement, misc. items,
consumer goods and agricultural surplus marketing.
Remarks
The organization lacks continuity of purpose and management. The organization is characterised by lack of
managerial skills, infrastructure, working capital and adequate stock-in-trade. It has failed to act as a price
leader in regard to product in which it trades. The Federation duplicates its activities with STC, Denjong,
and Sikkim Consumer Co-operative Society.
Restructuring Cost
Low working capital base: Working capital base of SIMFED is very meager in comparison to its
proposed plans of business. Capital inducted by the government considering earlier shape of
business is not sufficient to carry its overall business. SIMFED is doing other business in order to
meet its operative expenses.
Lack of infrastructure: it may be mentioned here that SIMFED does not possess any building of its
own and it operates in rental premises in all part of the state. The rent paid for the premises is
inflating the total expenditure of the federation. Many of the expansion and diversification of

ADB TA No. 4297-IND, Final Report
Capacity Building For Fiscal Reforms in Sikkim
275
activities of SIMFED is hindered for want of adequate and suitable premises and corresponding rent
to be paid to the owner of house building. Recently, we are on the move to own a plot of land at
Tadong for construction of office cum central godown.
Upgradation of working standard : The activities of SIMFED are increasing day by day and the
modern facilities to undertake such activities are needed for the federation. These include
computerization of accounting system, purchases and sales system and other allied activities on par
with other institution. Computerization minimizes time taken for processing different proposal and
also for preparing the things in the systematic manner.
Poor status of affiliated member societies: SIMFED is supposed to carry out its marketing activities
with its affiliated member societies. They are the main link between SIMFED and farmers. Our link
with farmers located throughout the State is only through them. But in reality, most of these
societies are financially unsound and cash – trapped one. They are poor business planner for which
we need to support them with all kinds of infrastructural facilities. To make grassroots level
societies more effective, indirect financial packages has to be arranged which may also include
technical support like field level training to the Multipurpose Co-operative Societies (MPCS)
functionaries.
Diversification of activities: Though established with main objectives to take active part in
marketing of agricultural produce and other agro – processing activities and marketing of consumer
foods thereby involvement in manufacturing of consumer house hold goods, so far, we could not
initiate any positive effort in this line which may be due to so many associated factors such as
location, topography, availability of raw material, home market base etc.
Situation could temporarily evade with involvement I Departmental supply works with support of
Government to sustain affairs of SIMFED. Now time has come to start thinking towards the real
objectives for which SIMFED has been created. In this line the following tentative projects have
been selected for necessary implementation. They are
Establishment of collection cum marketing centers for surplus agricultural produces (SAP)
marketing
Established of three marketing outlet for wholesale consumer business
Manufacturing unit of Exercise note books
Marketing of cut flowers
Obtaining carrying and forwarding agency or sole distributorship for the entire state for any of the
product which could generate the profit for its own sustenance.
Particulars Amt (Rs in crore)
Working Capital assistance to diversify the business sector as per its Bye laws and
to enter into manufacturing activities
Rs10.00
Cost of construction of four nos. of collection centers cum godowns and its sales /
showrooms in different places of the States
Rs 5.00
Infrastructure developments for marketing of cut flower viz collection center and
refrigerated van
Rs 1.00
Civil cost of construction of SIMFED „s office cum central godown at 5th
mile
Tadong
Rs 1.00
Establishment cost of Ex-book manufacturing unit Rs 1.00
Writing off of bad debts and sundry debtors Rs 1.00
Support to ease burden of IT & TOT and other taxes Rs. 0.50
Support for VRS scheme Rs 0.50
Support to its affiliated member societies to give them indirect financial package
and to impart training to manage the societies for at least first five years @Rs 1.00
lakh for 166 mpcs and 25 ccs = 191 socities
Rs 9.55
Security deposits and other formalities while obtaining dealership cum
distributorship of various companies
Rs 0.10
Total 29.65
Suggested Restructuring

ADB TA No. 4297-IND, Final Report
Capacity Building For Fiscal Reforms in Sikkim
276
The corporation could be merged with STC. It could be allowed to renovate its plant and machinery. The
financial support for required IT hardware and software could be considered for the corporation. The
Federation could be merged into a broader entity combining SIMFED and Denjong Agricultural Co-
operative Society.
Action Plan
Valuation of Assets and Liabilities
Diversification of activities proposed by setting up Ginger processing plant,
cardimum processing plant, promoting corporative tourism, setting up of
corporate manufacturing unit and obtaining C&F of big manufacturers for the state
Conduct open auctions for cardimum
Preparation of a corporate plan
Complete merger activities into the proposed new entity combining Denjong and Sikkim Consumer
Co-operative Society.
Legal, accounting and financial preparation for merger into the proposed composite entity
Time frame
The total restructuring should be completed in 1 year .
8.15.19
Name of the SLPE : Sikkim Power Development Corporation (SPDC)
Date of incorporation : 15th
December 1978
Classification : Utility
Administrative Dep. : Department of Energy and Power, GoS.
No of Employees : 21
Total Investment : Rs 53.01 crore
Accumulated losses : -
Dividends : Nil
Restructuring Path : Closure or Liquidation or total divestiture
Anticipated Benefits : Saving of Govt. Resources
Enterprise Profile
It is involved in the preparation of pre-feasibility report and detailed project reports of hydro-electric
projects. It was also mandated to generate hydro energy. It has 21 employees on rolls of which 7 are
managerial personnel. It has an equity investment of Rs 3.80 crore and long term debt of Rs 50.01 crore. The
debt bears the gurantee of the GoS. The corporation has not taken up any hydro energy generation project.
The corporation lacks clarity about its vision and mission. SPDC has been toying with the idea of taking up
generation schemes of about 100 mw if the government provides it a share capital of Rs 150 crore over a
period of 4-5 years.
Remarks
The corporation has not taken off in terms of its work activities and the government is also not keen on its
continuation
Suggested Restructuring
The corporation should be privatised / wound up
Action Plan
The assets and liabilities of the corporation should be valued and surrendered to the Energy and
Power Department
VR to the existing employees be offered and those who are on deputation could be re-patriated to
their parent departments.
A consultant may be appointed to suggest the modalities of privatisation / closure
Time frame To be wound up in three months.
8.15.20
Name of the SLPE : Sikkim Nationalised Transport
Date of incorporation : 1944
Classification : Utility sector
Administrative Dep. : Department of Transport, GoS.
No of Employees : 824
Total Investment : Rs 34.39 crore
Accumulated losses : -
Dividends : Nil
Restructuring Path : Continue in the state sector with increased
accent on resource mobilisation and profitability

ADB TA No. 4297-IND, Final Report
Capacity Building For Fiscal Reforms in Sikkim
277
Anticipated Benefits : Improved fulfillment of public purpose
Valuation : Rs 1.19 crore
Restructuring Cost : Rs 40.60 crore
Enterprise Profile
There was no public transportation system in Sikkim till 1944 when a Truck Department was created which
was subsequently renamed Sikkim Nationalised Transport (SNT) in 1955. As most of the routes within the
State were nationalised prior to 1975, all passengers and goods were exclusively transported by SNT buses
and trucks or under its supervision. However, the system has been diluted after the extension of the Central
Motor Vehicle Act, 1988 to Sikkim. Nevertheless, the bulk of passengers and the goods traffic in the State
are still being carried by SNT (See: Govt. of Sikkim, Report of the Comptroller and Auditor General of
India, March 2003, p 24). SNT has 12 depots –cum-ticket booking officers for buses within the State one at
Siliguri (West Bengal). In addition, there are four ticket booking agents at other places within the State and
one at Kalimpong (West Bengal). SNT also operates three depots for trucks at Gangtok, Rangpo and
Jorethang. It has one Central Workshop at Jalipool for major repairs and workshops at Gangtok, Rangpo,
Jorethang and Rhenock for minor repairs. It has 100 buses, 54 trucks and 38 tankers. Its total fleet strength is
192.
Organisational Setup
The chart shows that the concept of line and staff is followed in the SNT. The concept has become outdated.
The transport sector enterprises follow the SBU approach in organising their activities. The functions such as
R&D, job evaluation, performance measurements, training and management development, resource raising
and bench marking find no place in the organisaitonal chart. (See Annexure 8.8)
Financial Position and the working results
Table 39 shows the SNT has been a loss making organization. However, the operating deficit has been
decline over the years in terms percentage to revenue earned. It is interesting to note that SNTs revenue from
hire charges have been more as compared to revenue from its trucks and tankers.
Financial Position and the working results: SNT
Particulars 1998-99 1999-00 2001-02 2002-03 2003-04
Operating Revenue 9.53 10.10 11.91 15.41 17.46
Passenger traffic 1.36 1.66 2.39 2.18 1.68
Goods traffic 4.50 4.76 4.65 8.13 10.42
Sale of POL 3.56 3.61 4.56 4.78 5.12
Miscellaneous 0.11 0.07 0.31 0.32 0.24
Operating Expenses 17.92 20.38 19.47 22.49 22.15
Passenger traffic 12.03 12.73 12.63 16.32 16.38
Goods traffic
Purchase of POL 5.43 6.99 6.24 5.40 5.07
Miscellaneous 0.46 0.66 0.60 0.77 0.70
Operating deficit -8.39 -10.28 -7.56 -7.08 -4.69
Percentage of deficit to
revenue 88 102 63 46 27
(Source: Information collected from SNT)
Fleet Strength
Table 40 gives the fleet strength of the SNT.
Fleet Strength: SNT
Year Bus Truck Tanker Total
2001-02 110 70 45 225
2002-03 106 63 43 212
2003-04 100 54 38 192
(Source: Information collected from SNT)
The fleet strength of the SNT is declining year after year. This is due to disposal of apart of the old fleet and
restricted purchases as their replacement and new additions. The fleet position of the SNT is given in Table
.
Acquisition of the Fleet
During the period 2001-02 to 2003-04, 64 vehicles were disposed off. Against these numbers of disposed
vehicles only 22 new vehicles were inducted in the fleet for the entire 3 years period. The ARSTU norms
state that atleast 60 per cent of the fleet strength should be comprised of vehicles not less than 4 years old.
The present percentage of such vehicles of SNT is a mere 19.68 per cent which is way below the prescribed
ARSTU norm. the vehicle to staff ratio of the Department is around 4, which is well above the national

ADB TA No. 4297-IND, Final Report
Capacity Building For Fiscal Reforms in Sikkim
278
average of 2.51 per cent. The department has to have the fleet augmented in order to break even generate
profits:
Trucks 20 X 8.00 lakhs 160.00
Tankers 5X 10.00 lakhs 50.00
Mini Buses 5X 5.00 lakhs 25.00
235.00_
Acquisition of Fleet: SNT
Financial Year No. of vehicles disposed
off
No. of vehicle inducted
in the fleet
Shortfall
2001-02 Buses -9
Trucks – 13
Total 22
Buses -5
Trucks –6
Total 11
Buses -4
Trucks –7
Total 11
2002-03 Buses -8
Trucks – 12
Tankers -2
Total 22
Buses -4
Trucks – 5
Total 9
Buses -4
Trucks –7
Total 2
2003-04 Buses -6
Tankers - 5
Trucks –9
Total 20
Buses -
Trucks – 2
Total 2
Buses -6
Tankers -5
Trucks –7
Total 18
(Source: Information collected from SNT)
Fleet Utilisation
Fleet Utilisation is the ratio of the vehicles on road to the average number of vehicles held. According to the
recommendation of the Association of State Road Transport Undertakings (ASRTU), 92 percent of the fleet
should be road worthy of which 90 percent shall kept in operation and 2 per cent as reserve. In respect of
buses, the fleet utilisation of SNT ranged between 75 to 85 per cent during 1998-99 to 2002-03, falling short
of the norm by 7 to 17 per cent. The fleet utilisaiton of trucks ranged between 70 to 95 per cent during 1998-
99 to 2002-03
Vehicle Productivity (VP)
The vehicle productivity indicates the average revenue earning kilometer covered by each vehicle per day,
for which SNT had not fixed any norm. The VP of SNT buses for the period 1998-99 to 2000-01 compared
with that of other hill State‟s Road Transport Corporation RTC are shown below:
Vehicle Productivity in Road Transport Corp in North East: SNT
State Road Transport
Corp.
1998-99 1999-00 2001-01
SNT 85.64 81.90 80.72
Himachal RTC 215.10 224.80 223.40
Meghalaya RTC 186.10 121.10 136.90
Nagaland RTC - 103.90 132.50
Mizoram RTC 118.40 119.60 118.80
All India Average 279.00 295.00 267.00
(Source: Govt. of Sikkim, Report of the Comptroller and Auditor General of India, March 03)
Operational Efficiency
According to the latest fare formula of SNT adopted with effect from Feb 2002, the expenditure per
kilometer per bus worked out to Rs 20.02 and RS 18.74. Out of 9,638 bus trips operated out of Gangtok
during 2002-03, in 2,923 and 6,715 long and short distance trips respectively the per kilometer earnings per
bus was less than the cost. The loss on this account worked out to Rs 1.17 crore during 2002-03 for Gangtok
depot alone.
It was also seen that SNT discontinued services, reasons for which were not record, from Gangtok, to Pelling
and District Courts from August 2000 and September 2002 even though these services recorded high
average earning of Rs 33.78 and Rs 27.99 per kilometer. The SNT resumed the Pelling service form October
2000 to November 2000 during which period the average earning came down to Rs 7.23 per kilometer.
Thereafter this service was discontinued.

ADB TA No. 4297-IND, Final Report
Capacity Building For Fiscal Reforms in Sikkim
279
Fuel efficiency
SNT had fixed efficiency of buses at three kilometers per liter of HSD. However, the actual
consumption was 1.82 kmpl, 2.19 kmpl, 1.88 kmpl, and 1.82 kmpl. The extra expenditure on HSD incurred
by SNT due to the lower fuel efficiency being 27 to 37 per cent less than the norm and the consequent
adverse impact on its profitability, SNT did not consider it necessary even once during the period under
review to ascertain the resons or take remedial measures. Further, the fuel efficiency of SNT buses for the
period 1998-02 was the lowest compared to the Road Transport Corp. of other states with topographies
similar to Sikkim, as evident from the table below :
Fuel Efficiency
State Road Transport
Corp.
1998-99 1999-00 2001-02 2002-03
SNT 1.82 2.41 2.19 1.88
Meghalaya RTC 3.19 3.11 3.17 NA
Nagaland RTC NA 3.5 3.5 3.5
Mizoram RTC 3.00 3.00 2.87 2.74
All India Average 3.68 3.67 3.53 4.59
(Source: Govt. of Sikkim, Report of the Comptroller and Auditor General of India, March 2003)
Strengths, Weaknesses, Opportunities and Threats (SWOT) Analysis
Strengths
The time proven strength of the department is that it has consistently achieved its revenue as well as social
obligations. In the last Financial Year 2004-05 alone, against the Government target of Rs. 21.50 crore the
department not only achieved the target but also exceeded it by almost 8 crore.
The existing law of land gives SNT the absolute transport market on all the domestic routes as well
as the NH 31 A as these are nationalized routes. In principle, what this means is that SNT is the
only recognized public transporter for the State. Here it may be noted that even the private trucks
carrying public commodities have to run under the supervision of SNT. It implies that legally SNT
has 100% control over the Transport business in the State of Sikkim.
SNT has a very efficient and experienced work force both in the Operation Section as well as the
mechanical section, which are the backbone of any transport organization. The department has also
very good infrastructural setup like depots, workshops, godowns etc. all over the state as well as in
the state of West Bengal.
The SNT has fully established its Brand name over the years. The number of accidents and fatalities
is almost nil in the case of SNT. SNT is the sole official carrier of both the passengers and goods of
important organizations and departments as such the Army, General Reserve Engineering Force
(GREF), all Oil Companies, FCI, all State government departments etc,
Weaknesses
The main weakness of the department is that it has not been able to restructure its activities
whereby the department has over the period of years lost the competitive edge to its competitors in
private sector. Although, the freight business is almost 100% with the department, it has lost
considerable grip over the passenger sector mainly because of its inability to modernise passenger
carrier sector.
Proper Manpower planning and optimum utilization of the workforce needs a serious review as the
financial burden of maintaining the excess manpower can not be continued for long.
The main weakness of the department is that it has not been able to hold an optimum number of
fleet. The department is totally dependent on the Government for the funds required for its
augmentation of fleet. Against the projected, optimum fleet of 400 - 500 vehicles the department
has only 192 vehicles at its disposal.
The present fleet of functional vehicles is over aged and consists of 66% of vehicles, which are over
10 to 14 years old. This factor adversely affects the important parameters such as vehicle
productivity, load factor, etc.
Opportunity
SNT has a grate scope to increase its market share. With the increase in the flow of tourists, its
market share is expected to increase further. The setting up of hydro electric projects, helipads,
airports and opening up of the Nathulla Pass is expected to brighten the scenario further.
Threats
The shrinking fleet is the biggest threat. The over manning is also causing a great stress. Too tight
a departmental control is obstructing innovativeness and depriving the SNT of a healthy corporate

ADB TA No. 4297-IND, Final Report
Capacity Building For Fiscal Reforms in Sikkim
280
culture. The corporation has become the dumping ground of un-required personnel who lack
professional knowledge. The department has no vision. It does not have a corporate plan.
The organisation caters to the transportation need of all government department, central agencies and general
public. The organization has been entrusted by the responsibility of handling freight for army. The
corporation provides bus services to every hamlets and towns of the state. The occupancy rate is very low,
the buss staff ratio is very high, the buses are out modeled, the fuel consumption is very high, the
corporation has been incurring losses year after year. The fleet strength is depleting, the age profile is highly
un-favorable. The organization faces a stiff competition from private bus operators. The services provided
need vast improvement. The investment from the government is not forthcoming. The departmental form of
running the organisation robs it of autonomy and puts a heavy burden of accountability. The fuel efficiency
of the SNT buses was lower compared to the Road Transport Corporations of other states with topographies
similar to Sikkim. The vehicle productivity followed the same trend. The organization was characterized by
access consumption of engine oil, wastage of burnt engine oil, loss due to sale of condemned vehicles with
out tender process and shortage of stock material.
Remarks
There is a need to operate SNT in future too. The transport needs of the State would continue to grow. The
private sector could co-exist. The social obligations in the transport sector could be fulfilled only by the
SNT. However, SNT has to restructure its functioning.
Valuation
LAND: The total valuation of land alone belonging to SNT is estimated at Rs. 69.42 Cores.
BUILDINGS: SNT has well established office buildings, truck parking yards, guesthouses all
over the state and at Siliguri, West Bengal. The net valuation of building alone is estimated at Rs,
15.36 crore.
STOCKS: The net fast moving consumable, like fuel, oil, spare parts in possession of the
department at any given time is estimated at Rs. 3 crore.
VEHICLES: The present market valuation of the vehicles is estimated at Rs. 22 crore
SUNDRY DEBTORS: The Sundry Debtors stand at Rs. 3.50 crore. This is the amount receivable
from Army and Oil Companies.
Miscellaneous: SNT has got substantial investment in plants and machinery in the various depots
and workshops. The department also has major equipments or units such as Weighbridges (3
nos.), tyre rethreading plant, petrol pumps. The net valuation of these plants and machinery along
with the total office equipments is estimated at Rs. 6.05 cores.
Valuation
(Rs in crore)
Name of
enterprise
Land Buildin
g
Stocks of
Machinery,
oil, fuel etc
Vehicles
(Functioning
and non-
functioning
Sundry
Debtors
Others Total
SNT
Transport
Department
Jorethan
g
12.00 01.40
Siliguri 20.00 05.00 Plant and
Machiner
y 03.00
Gangto
k
27.00 06.00 Office
Equp.
02.00
Tadong 03.40 00.05 Pump
00.60
Rangpo 02.00 00.50 W.Bridge
00.45
Namchi 00.13 00.02
Mangan 00.80 00.04
Gyalsin
g
00.60 00.20
Melli 00.90 00.05
Jalipool 03.00 02.00
Rhenoc 00.40 00.10
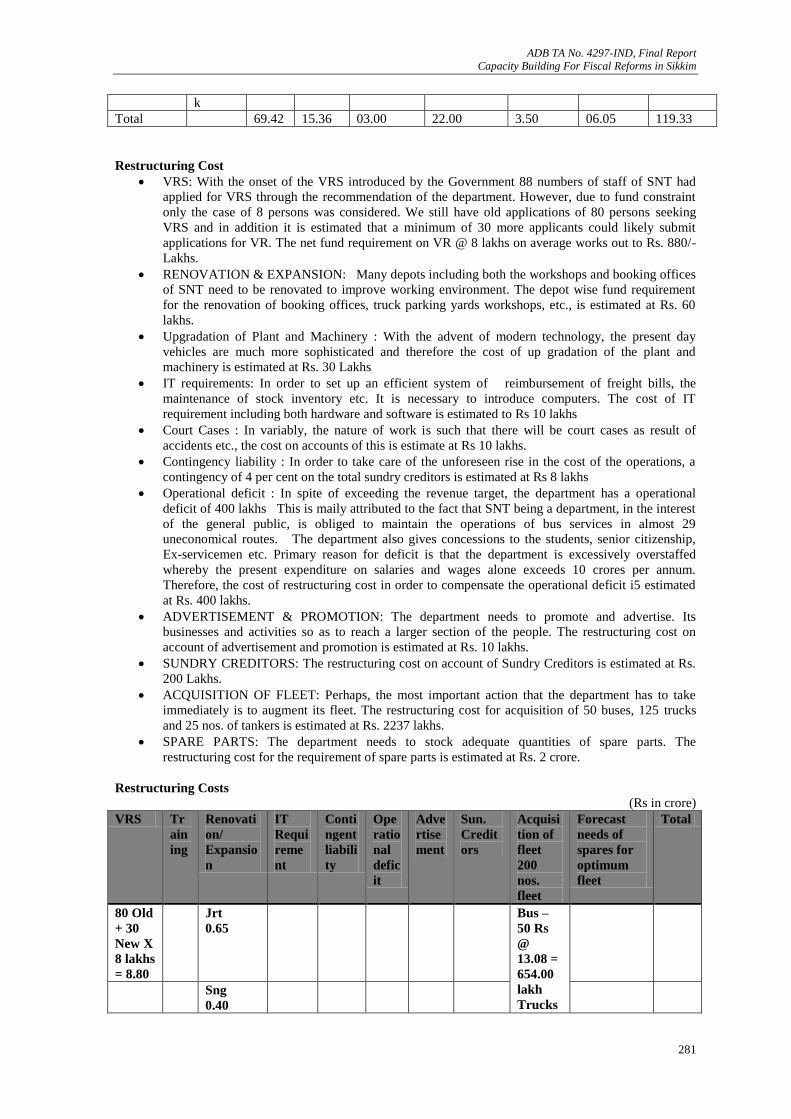
ADB TA No. 4297-IND, Final Report
Capacity Building For Fiscal Reforms in Sikkim
281
k
Total 69.42 15.36 03.00 22.00 3.50 06.05 119.33
Restructuring Cost
VRS: With the onset of the VRS introduced by the Government 88 numbers of staff of SNT had
applied for VRS through the recommendation of the department. However, due to fund constraint
only the case of 8 persons was considered. We still have old applications of 80 persons seeking
VRS and in addition it is estimated that a minimum of 30 more applicants could likely submit
applications for VR. The net fund requirement on VR @ 8 lakhs on average works out to Rs. 880/-
Lakhs.
RENOVATION & EXPANSION: Many depots including both the workshops and booking offices
of SNT need to be renovated to improve working environment. The depot wise fund requirement
for the renovation of booking offices, truck parking yards workshops, etc., is estimated at Rs. 60
lakhs.
Upgradation of Plant and Machinery : With the advent of modern technology, the present day
vehicles are much more sophisticated and therefore the cost of up gradation of the plant and
machinery is estimated at Rs. 30 Lakhs
IT requirements: In order to set up an efficient system of reimbursement of freight bills, the
maintenance of stock inventory etc. It is necessary to introduce computers. The cost of IT
requirement including both hardware and software is estimated to Rs 10 lakhs
Court Cases : In variably, the nature of work is such that there will be court cases as result of
accidents etc., the cost on accounts of this is estimate at Rs 10 lakhs.
Contingency liability : In order to take care of the unforeseen rise in the cost of the operations, a
contingency of 4 per cent on the total sundry creditors is estimated at Rs 8 lakhs
Operational deficit : In spite of exceeding the revenue target, the department has a operational
deficit of 400 lakhs This is maily attributed to the fact that SNT being a department, in the interest
of the general public, is obliged to maintain the operations of bus services in almost 29
uneconomical routes. The department also gives concessions to the students, senior citizenship,
Ex-servicemen etc. Primary reason for deficit is that the department is excessively overstaffed
whereby the present expenditure on salaries and wages alone exceeds 10 crores per annum.
Therefore, the cost of restructuring cost in order to compensate the operational deficit i5 estimated
at Rs. 400 lakhs.
ADVERTISEMENT & PROMOTION: The department needs to promote and advertise. Its
businesses and activities so as to reach a larger section of the people. The restructuring cost on
account of advertisement and promotion is estimated at Rs. 10 lakhs.
SUNDRY CREDITORS: The restructuring cost on account of Sundry Creditors is estimated at Rs.
200 Lakhs.
ACQUISITION OF FLEET: Perhaps, the most important action that the department has to take
immediately is to augment its fleet. The restructuring cost for acquisition of 50 buses, 125 trucks
and 25 nos. of tankers is estimated at Rs. 2237 lakhs.
SPARE PARTS: The department needs to stock adequate quantities of spare parts. The
restructuring cost for the requirement of spare parts is estimated at Rs. 2 crore.
Restructuring Costs
(Rs in crore)
VRS Tr
ain
ing
Renovati
on/
Expansio
n
IT
Requi
reme
nt
Conti
ngent
liabili
ty
Ope
ratio
nal
defic
it
Adve
rtise
ment
Sun.
Credit
ors
Acquisi
tion of
fleet
200
nos.
fleet
Forecast
needs of
spares for
optimum
fleet
Total
80 Old
+ 30
New X
8 lakhs
= 8.80
Jrt
0.65
Bus –
50 Rs
@
13.08 =
654.00
lakh
Trucks
Sng
0.40

ADB TA No. 4297-IND, Final Report
Capacity Building For Fiscal Reforms in Sikkim
282
Rpo
0.50
125 Rs
@
10.52 =
1315.00
lakh
Tanker
25 Rs
@10.72
=
268.00
lakh
Jpl
0.14
Gtk
0.20
Nam
0.10
8.80 0.1
5
0.90
(includes
upgradat
ions of
Rs 0.30
crore)
0.10 0.08 4.00 0.10 2.00 22.37 2.00 40. 60
Restructuring Process
Restructuring SNT involves marketing, human resource, finances, commercial, material, workshops, operations,
schedules and overall organisational change management. The restructured organisation has to cope with the
changing market needs, achieve the business goals and make the corporate vision a reality. Vision, mission and
passion to excel must become the watchwords of a new work culture. A strategic approach is suggested under
each of the important aspects of the restructuring plan.
Marketing Restructuring:
o Expand capacities to service all District Headquarters and neighboring State capital cities.
o Broaden service facilities by way of Ordinary, Fast Service, Express, Luxury, Hi-Tech buses with
different fare/stage structures to suit various needs and sections of the population.
o Strive for customer/passenger satisfaction by improving safety, regularity and punctuality of
services.
o Tie up with Tourism Corporation/other public undertakings and meet their transport needs.
o Introduce Booking Agencies at all important traffic points.
o Organise regular traffic/opinion surveys to identify profitable routes.
o Conduct regular opinion surveys to refine operations to secure better passenger
satisfaction.
o Introduction of marriage, personal, excursion tours to fill idle time of spare vehicles.
o Introduction of "Transport Cards".
Financial Restructuring:
o Identify low cost fund sources.
o Reduce interest liabilities.
o Conversion of State/Central Government loans as equity.
o Conversion of interest due to State and Central Government as equity.
o Clearance of loans/interests of Finance Institutions/Banks by obtaining low cost
funds.
o Rationalisation of MV tax system to improve operational viability.
o Waiver of MV taxes due to the State Government to set off the cost of services rendered by the
Corporation by way of travel concession.
o Depreciation Fund provision of Rs.20.00 lakhs may be waived.
o Rationalisation of internal accounts and audit system
o Obtain grants and budgeted subsidies from State Government towards bus pass
concessions.
Human Resource Restructuring:
o Lay down norms of staffing and reduce unproductive supporting staff.
o Improve the employee productivity by deploying required crew.

ADB TA No. 4297-IND, Final Report
Capacity Building For Fiscal Reforms in Sikkim
283
o Introduction of inter-functional transferability of supporting staff categories to
Drivers/Conductors.
o Payment of employees' terminal benefits.
o Introduction of suitable VRS and offer to all willing supporting staff.
o Introduction of structured managerial and supervisory development training programmes for
updating skills.
o Effective implementation of MOU system.
o Strengthening good employee-relation schemes.
o Introduction of suitable incentive schemes for all employees.
Commercial Restructuring:
o Leasing and renting of Corporation infrastructure.
o Introduction of advertisements on bus stations, buses, bus shelters, tickets, CTV ,advertisement,
etc.
o Introduction of parcel and courier services through Corporation buses.
o Maximise luggage revenues i.e. accompanied as well as unaccompanied luggage.
o Maximise the revenue on postal services.
o Maximise the revenue on paper parcel service.
Material Management Restructuring:
o Introduction of integrated material management systems.
o Stocking of Depot spares inventory at 4 Zonal Headquarters.
o Standardizing stocking of spare parts with rationalized minimum and maximum limits as per the
consumption pattern in order to reduce inventory carrying cost.
o Rationalisation of purchase policies to reduce inventory.
o Rationalisation of standardisation of disposal/auction activities of vehicles, scrap, tyres, batteries,
etc.
o Tie up with oil companies to secure petrol, oil and lubricants (POL) at reasonable rates.
Operational Restructuring:
o Scheduling of buses with minimum inputs of bus and crew for given traffic demand and design
cost-effective transport systems.
o Structuring of operations with optimum service mix to have better return.
o Rationalisation of ticket system as per the service mix.
o Standardizations of various types of services with different stage structures.
o Rationalisation of fare structure.
o Identification of threats from competitors on each route and formulate strategies for effective
encounter.
o Identification of opportunities in terms of change of timings, permit variations, etc.
o Strengthening of bus station management.
o Strengthening of quality of services by improving safety, regularity and punctual operations.
Creation of passenger relation cells.xi) Strengthening passenger information system.
o Introduction of privately hired buses to improve profitability.
o Augmentation of services on all high density routes.
o Rescheduling of low density and vehicle utilisation services.
o Introduction of services on all approved routes.
o Take advantage of route pattern as 71% routes have length of more than 100 km.
o Strengthening of all inter-state routes.
o Restructuring 20 approved routes which have overlaps ranging from 5 to 56 km.
o Introduction of Hi-Tech buses to all District Headquarters with modern facilities.
Organisational Restructuring:
o Smartsizing of Corporate Office with minimum staff. A lean Corporate Office is recommended.
o Closing of all Regional and Central Workshops to reduce cost of operation on
o Workshop repairs.
o Abolition of all Divisional and Sub-Depots to minimise the personnel cost on not very productive
offices and staff.

ADB TA No. 4297-IND, Final Report
Capacity Building For Fiscal Reforms in Sikkim
284
o Creation of 4 self-contained near autonomous operational zones with appropriate delegation of
powers.
o Establishing a strong one-tier system controlled by Zonal Office with supporting functions
governed by federal administration from Corporate Office.
o Grouping of homogeneous functions to bring about economy.
Management Information Systems Restructuring:
o Introduction of effective management information systems.
o Regular monitoring of Critical Successful Factors (CSF) to improve overall performance.
o Regular and timely exchange of information on few vital areas to focus managers' attention and
bring about competitive spirit.
o Introduction of performance appraisal and review system.
o Introduction of computers.
Vehicle Maintenance Restructuring:
o Introduction of preventive and breakdown maintenance systems.
o Enforcement of sound replacement policy.
o Strengthening of maintenance-operational systems and monitoring.
o Creation of Zonal Maintenance Engineers for this purpose.
o Introduction of technical, managerial and operational controls for fuel to improve use efficiency
and performance.
o Introduction of technical controls in the area of tyres, lubes, batteries, springs, etc., to reduce the
cost of operations.
o Scrapping of all vehicles over ten years age.
o Repairing of all vehicles which are less than ten years age.
o Auction of 6 Eicher vehicles.
o Rationalisation of fleet by making Bhopal, Indore as Leyland Comet bus and Jabalpur-
Raipur as Tata bus zones.
Restructuring of Workshops
o Abolition of all Regional Workshops and Central Workshops to reduce Workshop repair costs.
o Establishment of Body Building Unit at Gwalior along with Printing Press and Training College.
o Establishment of four Zonal Workshops Co-terminus with Zonal operational Units along with
Tyre Retreading Shop and Training Schools,.
o Control of Body Building Unit and Training College to be vested in Corporate Office.
o Modernisation of Zonal Workshop Body Building units with latest machinery.
Suggested Restructuring
There is a need to corporatise SNT on a top priority basis. The organisaiton should be restructured around
the SBU concept. Excess manpower should be given VR. New rules of human resource development,
financial management, marketing management should find place in the organisation. The operational
restructuring should be undertaken on war footing basis.
Action Plan
Preparation of a corporate plan
Operational restructuring – renewal of fleet, re-organization of workshops, rethinking about the
depots, acquisition of small sized buses to counter competition from private sector
Human resources restructuring – rightsizing the corporation, abolition of practices of appointing
handy boy, stopping the appointment of un-required personnel from government, management
development and training, higher personnel productivity, induction of professionals.
Financial restructuring – cost control and cost reduction, introduction of internal audit, low costs
funding, fare revision and better cash flow management,
Technological restructuring – computerisation and GIS,
Time frame
2-3 years for restructuring
8.15.21
Name of the SLPE : Sikkim Energy and Department of Power
Date of incorporation : 1967

ADB TA No. 4297-IND, Final Report
Capacity Building For Fiscal Reforms in Sikkim
285
Classification : Utility sector
Administrative Dep. : Department of Energy and Power, GoS
No of Employees : 3443
Total Investment : Rs 514.79
Accumulated losses : -
Dividends : Nil
Restructuring Path : Continue in the state sector with increased
accent on resource mobilisation and profitability
Anticipated Benefits : Improved fulfillment of public purpose
Enterprise Profile
The Sikkim Energy and Department of Power is involved in generating, transmitting, distributing and
regulating power in the State of Sikkim. The total generation of power in Sikkim during 2004-05 was 45.96
million units. The central and other utilities had the generating capacity of 51.00 million units. The total
capacity was 97 million units. It is expected that the total capacity will go up to 469 million units during
2011-12. The financial position of the power sector is extremely unhealthy due to high losses incurred, very
high T& D losses (of approximately 51 per cent), excessive manpower, and very high distribution costs. The
number of employees with the department per million kwh sold varied from 8.01 to 12.16 compared to the
all India average of 2.6 to 3.25. The number of employees per thousand consumers in the case of the
Department varied from 21.11 to 23.36 against the all India average between 7.78 and 9.89. The excess
staffing not only resulted in increasing the cost of power but also contributed to the operating losses incurred
by the Department year after year. The lack of clarity with regard to the policy for power sector is also acted
as a major deterrent to the growth of power sector. The State of Sikkim has to fall in line with the central
policy of power sector reforms. It has to unbundle the activities of the Energy and Department of Power and
constitute separate entities for generation, transmission, distribution and regulation.
Remarks
The development of energy and power sector is the top priority for the State of Sikkim which has
tremendous hydel resources. However, the sector can grow on the basis of vigorous participation of private
sector.
Suggested Restructuring
The sector needs to be corporatised and then subsequently privatise in line with the present policy of the
Government of India. There is a need to unbundel the power sector into generation, transmission,
distribution and regulatory entities. There is also a need to restructure the financial, commercial and human
resources elements. This has been discussed in the study on Power Sector in Sikkim undertaken by the
Administrative Staff College of India.
Action Plan
Preparation of a corporate plan
Unbundling the power sector into generation, transmission, distribution and regulatory entities.
VR to excess employees
Social Safety Net
Financial, commercial and human resources related re-engineering
Followup of 2003 Electricity Supply Act
All other suggestions made in the ASCI Study as accepted by the GoS
Time frame
As suggested in ASCI Study and accepted by the GoS
8.15.22
Name of the SLPE : Sikkim Scheduled Castes, Scheduled Tribes and
Other Backward Classes Development Corporation
(SABCCO)
Date of incorporation : 27th
February 1996
Classification :
Administrative Dep. : Welfare Department, GoS.
No of Employees : 16
Total Investment : Rs 21.50 crore
Accumulated losses : Rs -1.69 crore
Dividends : Nil
Restructuring Path : Disinvet
ADB TA No. 4297-IND, Final Report
Capacity Building For Fiscal Reforms in Sikkim
286
Anticipated Benefits : Additional resource to Govt.
Valuation : Rs 1.43 crore
Restructuring Cost : Rs 6.00 crore
Enterprise Profile
The organisation has an authorized share capital of Rs 10 crore. It is a State Chanalising Agency which
awaits financial assistance by way of loan from Apex Corporation‟s at the national level viz., National
Scheduled Tribes Finance Development Corporation and National Backward Classes Finance and
Development Corporation for financing income generation schemes for the STs, SCs, OBCs and
handicapped persons. The corporation was setup to : promote economic and development activities for the
benefit of SC, ST, Other BC and handicapped persons; assist individuals or groups of individuals belonging
to SC, ST, OBC and handicapped persons by way of loans and advances for income and employment
generating activities; extend loans to SC, ST, OBC and handicapped persons for pursuing general /
professional / technical education or training; help in furthering Government policies and programmes for
the development of SC, ST, OBC and handicapped persons; enter into any agreement with Central
Government / State Government or any State or Local authorities or otherwise for the purpose of carrying
out objects of the Company; and obtain from any such Government, State authorities or persons any
charters, subsidies, loans, grants, etc. The corporation provides term loan and micro credit to those involved
in agriculture and allied operations, artisans, traditional occupation, technical trades, small business and
hospitality industry.
Remarks
The enterprise is high on social purpose and resource mobilization. It incurs losses in the conduct of its
business. It deals with the up-liftment of STs, SCs, OBCs and handicapped persons. The organisation faces
the problems of recoveries, delayed release of share capital from the government, and age old loans. The
lack of an effective MIS is also impeding the functioning of the enterprise. It has very poor net working with
the all- India institutions dealing with STs, SCs, OBCs and handicapped persons. The managerial personnel
are untrained. The non-managerial personnel are not well versed with the functioning of welfare enterprises.
The middle management is conspicuous by its absence.
Restructuring Cost
Restructuring Cost Amt (Rs in crore)
1. Grant in Aid for meeting administrative expenses 1.20
2. Training for officers and staff – capacity building 0.10
3. Computerisation – development loan software packages networking facilities to be provided, setup
MIS cell 0.10
4. Settingup retail outlets in all four districts for displaying and selling items/products manufactured
by SABCCO beneficiaries 0.15
5. Write up provisions for bad and doubtful debts 1.50
6. Provide funds for meeting the 1 per cent commission fee paid to state government for providing
block government guarantee of Rs 25 core to Apex corporations National Schedule Caste Finance
Development Corporation (NSFDC) , National Schedule Tribes Finance Development Corporation
(NSTFDC), National Backward Class Finance Development Corporation (NBCFDC) 0.25
7. Funds for promotional activities such as organising EDPs, awareness camps, advertisement and
publicity. 0.25
8. Provision for downsizing the manpower requirement 0.50
9. Cost of conducting an evaluation study for a financial restructuring 0.50
10. Cost of constructing and independent office building 1.00
Total funds required as grant in aid 6.00
Suggested Restructuring
The enterprise should introduce OPTIMA and get networked with the national apex organisation. The
organisational, financial and manpower restructuring should be taken up in the case of the enterprise.
Action Plan
Preparation of a corporate plan
Preparation of a blue print for financial restructuring
Designing and implementing VRS scheme

ADB TA No. 4297-IND, Final Report
Capacity Building For Fiscal Reforms in Sikkim
287
Induction of qualified professional
Conduct of surveys of beneficiaries
Installation of an MIS system
Install adequate software and hardware
Develop relationships with the national organisations
Concentrate on micro finance
Networking with national organisations
Promoting schemes relating to micro-finance
Time frame
Total restructuring should be completed with in six months

ADB TA No. 4297-IND, Final Report
Capacity Building For Fiscal Reforms in Sikkim
288
Annexure 9.1 GROSS STATE DOMESTIC PRODUCT AT FACTOR COST BY INDUSTRY OF ORIGIN AT CURRENT PRICES (Rs. Lakhs)
Industry of Origin 1993-94
1994-95
1995-96
1996-97
1997-98
1998-99
1999-00
2000-01
2001-02
2002-03
2003-04*
2004-05**
Agriculture & Allied 11992 12520 14763 16040 17467 14543 16210 17631 18411 22996 25419 28334
Forestry & Logging 904 979 1062 1159 1264 1381 1511 1711 1883 2007 2173 2363
Fishing 30 32 50 52 55 61 63 67 70 78 80 82
Mining & Quarrying 93 93 97 98 97 97 105 117 127 145 156 169
TOTAL PRIMARY 13019 13624 15973 17349 18883 16081 17890 19527 20490 25225 27828 30948
Manufacturing(REG) 931 1000 1139 1206 1255 1327 1380 1427 1436 1477 1557 1648
Manufacturing(UN REG) 1274 1397 1606 1734 1778 1861 1890 1973 2031 2076 2205 2348
Construction 5052 5619 7460 9106 10597 11072 11628 13874 19401 24101 30650 36926
Electricity,Gas & WS 1015 1175 1402 1512 1636 2174 2928 6633 7617 5269 5720 6479
TOTAL SECONDARY 8272 9192 11607 13559 15266 16434 17826 23906 30484 32923 40132 47401
Transport & Communication
887 1144 1219 1556 1873 2277 2325 2626 3113 3945 4323 4721
Trade Hotels & Restaurants
2996 3092 3616 4267 4858 4268 4515 5160 5383 6186 6797 7499
Banking & Insurance 514 654 812 946 1167 1408 1840 2343 2849 3639 4121 4667
Real Estate ,O.D &B.S. 3460 3714 3931 4294 4792 5503 6889 7827 8668 9493 10177 10921
Public Administration 5646 6091 6885 7680 9718 15248 16215 16887 18031 20025 21045 22096
Other Services 4488 5289 6580 7360 8705 15255 15552 15733 16759 18438 20306 22380
TOTAL TERTIARY 17992 19982 23042 26103 31114 43959 47336 50575 54804 61725 66769 72284
Total State Domestic Product
39282 42798 50622 57011 65264 76474 83051 94009 105778 119873 134729 150633
Population (Number) 4.33 4.44 4.56 4.69 4.83 4.98 5.14 5.32 5.52 5.57 5.71 5.85
Per Capita Income(Rs.) 9072 9639 11101 12156 13512 15356 16158 17671 19163 21521 23595 25749

ADB TA No. 4297-IND, Final Report
Capacity Building For Fiscal Reforms in Sikkim
289
Annexure 9.2 GROSS STATE DOMESTIC PRODUCT AT FACTOR COST BY INDUSTRY OF ORIGIN AT CONSTANT PRICES
(Rs. Lakhs) Industry of Origin 1993-
94 1994-
95 1995-
96 1996-
97 1997-
98 1998-
99 1999-
00 2000-
01 2001-02 2002-
03 2003-04* 2004-05**
Agriculture & Allied 11992 11516 12517 12763 13035 9850 10378 10747 11030 13063 13977 15079
Forestry & Logging 904 939 977 1024 1073 1127 1186 1303 1381 1417 1476 1549
Fishing 30 30 43 43 43 43 43 43 43 46 46 46
Mining & Quarrying 93 82 92 98 94 78 83 85 90 93 99 104
TOTAL PRIMARY 13019 12567 13628 13927 14245 11098 11689 12178 12543 14620 15597 16777
Manufacturing(REG) 931 891 935 970 980 993 1005 1006 994 996 993 994
Manufacturing(UN REG) 1274 1244 1318 1394 1389 1392 1377 1391 1406 1400 1407 1417
Construction 5052 5159 6174 6737 6971 6613 6896 7533 10075 11978 14620 16479
Electricity,Gas & WS 1015 1041 1063 1180 1282 1497 1945 4347 4580 4310 4445 4572
TOTAL SECONDARY 8272 8336 9490 10281 10622 10495 11223 14277 17055 18685 21465 23462
Transport & Communication 887 1048 1056 1277 1451 1629 1710 1858 2085 2497 2658 2817
Trade Hotels & Restaurants 2996 2837 3079 3446 3713 3033 3040 3306 3350 3689 3917 4166
Banking & Insurance 514 569 630 769 1036 1108 1381 1582 1832 2279 2448 2630
Real Estate ,O.D &B.S. 3460 3556 3659 3755 3922 4056 4204 4371 4533 4696 4870 5053
Public Administration 5646 5586 5834 6135 7320 10604 10752 10790 11241 12016 12351 12639
Other Services 4488 4893 5663 6057 6778 10800 10557 10012 10315 10949 11725 12512
TOTAL TERTIARY 17992 18489 19921 21440 24220 31230 31644 31919 33357 36126 37968 39816
Total State Domestic Product 39282 39392 43039 45647 49087 52822 54556 58374 62955 69431 75031 80056
Population (Number) 4.33 4.44 4.56 4.69 4.83 4.98 5.14 5.32 5.52 5.57 5.71 5.85
Per Capita Income(Rs.) 9072 8872 9438 9733 10163 10607 10614 10973 11405 12465 13140 13685

ADB TA No. 4297-IND, Final Report
Capacity Building For Fiscal Reforms in Sikkim
290
Annexure 9.3 NET STATE DOMESTIC PRODUCT AT FACTOR COST BY INDUSTRY OF ORIGIN AT CURRENT PRICES (Rs. Lakhs)
Industry of Origin 1993-94
1994-95
1995-96
1996-97
1997-98
1998-99
1999-00
2000-01
2001-02 2002-03 2003-04*
2004-05**
Agriculture & Allied 11900 12416 14639 15902 17315 14383 16046 17448 18192 22745 25142 28025
Forestry & Logging 783 783 808 853 921 1007 1112 1295 1400 1494 1628 1785
Fishing 24 24 41 42 44 49 50 53 56 63 64 65
Mining & Quarrying 61 61 64 65 63 63 70 82 91 109 119 132
TOTAL PRIMARY 13284 13284 15553 16862 18343 15501 17279 18879 19738 24410 26953 30006
Manufacturing(REG) 880 880 1004 1054 1100 1163 1209 1251 1259 1294 1365 1444
Manufacturing(UN REG) 1349 1349 1543 1662 1698 1770 1795 1869 1919 1953 2075 2209
Construction 5389 5389 7172 8806 10191 10592 11113 13149 18446 22896 29130 35095
Electricity,Gas & WS 115 115 175 96 66 427 1027 4593 5384 2887 3134 3550
TOTAL SECONDARY 7854 7854 10029 11771 13210 14116 15315 21037 27184 29213 35895 42501
Transport & Communication 576 576 625 789 966 1205 1223 1338 1582 1927 2098 2280
Trade Hotels & Restaurants 2793 2793 3252 3865 4432 3792 4009 4603 4774 5551 6099 6730
Banking & Insurance 622 622 777 908 1126 1351 1765 2262 2757 3508 3973 4499
Real Estate ,O.D &B.S. 3291 3291 3411 3720 4164 4805 6114 6969 7685 8432 9040 9700
Public Administration 5156 5156 5800 6487 8405 13812 14134 14732 15868 17640 18539 19464
Other Services 4738 4738 5949 6642 7920 14393 14617 14763 15467 16935 18650 20556
TOTAL TERTIARY 17175 17175 19813 22411 27014 39358 41863 44667 48135 53992 58399 63229
Total State Domestic Product
38312 38312 45394 51044 58567 68974 74456 84583 95057 107615 121247 135736
Population (Number) 4.44 4.44 4.56 4.69 4.83 4.98 5.14 5.32 5.52 5.57 5.71 5.85
Per Capita Income(Rs.) 8629 8629 9955 10884 12126 13850 14486 15899 17220 19321 21234 23203

ADB TA No. 4297-IND, Final Report
Capacity Building For Fiscal Reforms in Sikkim
291
Annexure 9.4 NET STATE DOMESTIC PRODUCT AT FACTOR COST BY INDUSTRY OF ORIGIN AT CONSTANT PRICES
(Rs. Lakhs) Industry of Origin 1993-94 1994-95 1995-96 1996-97 1997-98 1998-99 1999-00 2000-01 2001-02 2002-03 2003-04* 2004-05**
Agriculture & Allied 11900 11422 12416 12661 12930 9745 10272 10634 10902 12920 13824 14914
Forestry & Logging 752 763 776 808 853 907 965 1075 1127 1156 1204 1264
Fishing 23 23 35 35 35 35 35 35 35 37 37 37
Mining & Quarrying 61 52 63 68 64 53 57 58 61 63 67 71
TOTAL PRIMARY 12736 12260 13289 13571 13882 10740 11328 11802 12125 14177 15132 16285
Manufacturing(REG) 831 773 812 843 853 864 875 876 865 867 865 865
Manufacturing(UN REG) 1235 1199 1265 1337 1327 1326 1310 1321 1335 1324 1331 1340
Construction 4842 4944 5921 6484 6636 6225 6486 6986 9384 11130 13585 15312
Electricity, Gas & WS 94 74 44 106 155 305 690 3036 3217 2894 2985 3070
TOTAL SECONDARY 7102 7109 8165 8897 9098 8849 9491 12349 14930 16345 18893 20717
Transport & Communication 448 530 554 671 789 919 1005 1053 1166 1322 1398 1476
Trade Hotels & Restaurants 2746 2557 2764 3113 3364 2658 2648 2896 2921 3247 3448 3667
Banking & Insurance 485 539 599 737 1003 1066 1324 1501 1767 2189 2351 2526
Real Estate ,O.D & B.S. 3078 3163 3252 3333 3480 3586 3700 3827 3947 4074 4225 4384
Public Administration 4842 4737 4951 5253 6418 9682 9552 9460 9911 10686 10984 11240
Other Services 4019 4384 5135 5493 6183 10183 9903 9359 9484 9955 10661 11376
TOTAL TERTIARY 15619 15910 17255 18600 21236 28094 28132 28096 29197 31472 33067 34668
Total State Domestic Product 35456 35279 38710 41068 44217 47683 48951 52247 56251 61995 67092 71669
Population (Number) 4.33 4.44 4.56 4.69 4.83 4.98 5.14 5.32 5.52 5.57 5.71 5.85
Per Capita Income(Rs.) 8188 7946 8489 8756 9155 9575 9524 9821 10190 11130 11750 12251

ADB TA No. 4297-IND, Final Report
Capacity Building For Fiscal Reforms in Sikkim
292
Annexure 9.5
MANUAL FOR ETIMASTION OF CAPITAL FORMATION
For SIKKIM
Background
The RAC in its final report (1976) submitted to the Government of India, besides suggesting a set of
accounts also elaborated the concepts, scope and coverage of Gross Fixed Capital Formation (GFCF) for
estimation at state level. The RAC having recognized that the state level estimates of change in inventories
are not conceptually viable or feasible because of the open boundaries of the states recommended only the
compilation of GFCF. CSO, later, constituted a Sub Groups on State Gross Domestic Product and
Expenditure Account in 1982. The report of the Sub-Group containing, inter-alia, methodological notes on
“Fixed Capital Formation at State level: Scope, Coverage and Method of Estimation” as approved by the
advisory Committee on National Accounts was forwarded to the State DESs in July 1986 for
implementation. The National Accounts Division (NAD), CSO has been pursuing the States to prepare
annually the estimates of fixed capital formation. The NAD organized Workshops in August 1977, July
1981, November 1990 and regional Workshop in March 1997 in this regard for the benefit of officers of the
Directorate of Economics and Statistics. As a result of these efforts DES of some of the states are compiling
annual estimates of State Gross Fixed Capital Formation by type of institution and by industry of use. A few
DES, however, compile these estimates only for the public sector.
In view of the above it is proposed that estimation of only fixed capital formation, as recommended
by the NAD and also in line with similar estimates being prepared by other states, may be taken up by the
SIU of DESM&E, Government of Sikkim on an annual basis as per the concepts and definitions and the
methodology given in subsequent paras.
Concepts & Definitions
Gross capital formation (GCF) refers to the aggregate of gross additions to fixed assets i.e., Gross
fixed capital formation (GFCF) and increase in stocks of inventories, hereinafter referred to as change, in
stocks during a period of account. Fixed assets comprise construction and machinery and equipment
(including transport equipment and breeding stock, draught animals, dairy cattle and the like). Construction
for military purposes (other than construction or alteration of family dwellings for military personnel),
defence equipment, durable goods in the hands of the households and increase in the stocks of defence
materials are excluded from the scope of capital formation. However, capital outlays of defence enterprises
on ordnance and clothing factories are included.
GFCF is measured by the total value of a producer‟s acquisition, less disposal, of fixed assets
during the accounting period plus certain additions to the value of non-produced assets realized by the
productive activity of institutional units. Fixed assets are tangible or intangible assets produced as outputs
from processes of production that are themselves used repeatedly or continuously in other processes of
production for more than one year.
Net fixed capital formation (NFCF) is distinguished from gross fixed capital formation in that it is
measured after allowances are made for consumption of fixed capital (CFC) that includes foreseen
obsolescence and accidental damage to the extent provided for by the enterprise.
Types of Gross Fixed Capital Formation
There is substantial diversity in the different types of gross fixed capital formation (GFCF) that may
take place. The following main types may be distinguished:
(a) Acquisitions, less disposals, of new or existing tangible fixed assets, subdivided by types of asset
into:

ADB TA No. 4297-IND, Final Report
Capacity Building For Fiscal Reforms in Sikkim
293
(i). Dwellings
(ii). Other buildings and structures
(iii). Machinery and equipment
(iv) Cultivated assets – trees and livestock – that are used repeatedly or continuously to
produce products such as fruit, rubber, milk etc.
(b) Acquisition, less disposals, of new and existing intangible fixed assets, subdivided by type of assets
into:
(i). Mineral exploration
(ii). Computer software
(iii). Entertainment, literary or artistic originals, other intangible fixed assets
(c) Major improvements to tangible non-produced assets, including land.
(d) Costs associated with transfers of ownership of non- produced assets.
The various components of acquisitions and disposals of fixed assets, as referred to in categories (a)
and (b) above, are listed below:
(a) Value of fixed assets purchased
(b) Value of fixed assets acquired through barter
(c) Value of fixed assets received as capital transfers in kind
(d) Value of fixed assets retained by their producers for their own use, including the value of any fixed
assets being produced on own account that are not yet completed or fully mature.
less
(e) Value of existing fixed assets sold
(f) Value of existing fixed assets surrendered in barter
(g) Value of existing fixed assets surrendered as capital transfers in kind.
Scope and Coverage
Acquisitions of new assets cover not only complete assets but also any renovations, reconstruction
or enlargements that significantly increase the productive capacity of extend the service life of an existing
asset. In recognition of the newly increased capacity or newly extended service life, these improvements as
part of acquisitions of new assets even through physically they function as part of existing assets. Items (e),
(f) and g) above include disposals of assets that may cease to be used as fixed assets by the new owners: for
example, vehicles sold by business to households for their personal use or assets that are scrapped or
demolished by their new owners. Capital work in progress, in whichever industry it takes place, forms part
of inventory and not fixed capital formation.
Thus GFCF consists of the outlay of industries and the producers of government services and of
private non-profit services to households on addition to their fixed assets, reduced by their net sales (sales
minus purchases) of similar second hand and scrapped goods. The commodities in question may be
purchased or produced on own account. They include:
(i) durable goods – the lifetime of which is one year or more-acquired by producers
(ii) improvements and alteration of the durable goods which significantly extend and
expected life-time or productivity of assets,
(iii) new construction and major improvements which extend its life period,
(iv) reclamation and improvement of land and the development and extension of timber
tracts, mineral exploration, orchards, plantations and similar other agricultural holdings
and
(v) breeding stocks, drought animals, dairy cattle and the like.
Dealers margins, service charges, taxes and other transfer costs in regard to transaction of such
assets form part of capital formation. Destructive weapons such as missile, rockets, bombs etc. are excluded.
However, military structures also used for civilian purpose are included. Outlays on newly constructed
dwellings (either by households or industries) and expenditure on major improvement and alterations of

ADB TA No. 4297-IND, Final Report
Capacity Building For Fiscal Reforms in Sikkim
294
residential building form part of fixed capital formation, while the purchase of durable goods by households
for its own consumption are not treated as capital formation. Research and development expenditure should
be considered as normal revenue expenditure and thus should not be capitalized.
Gross fixed capital formation, as mentioned above, includes expenditure on land clearance,
irrigation works, plantation and cultivation of new timber tracts, new fruits and sap bearing trees, vines etc.
which yield products after a number of years. After such plantations and cultivation become productive,
further outlays in respect of cultivation should be classified as intermediate consumption. Soil conservation,
clearance and aforestation of timber tracts and forests is classified under land improvement activity and
included in gross fixed capital formation
The items of fixed capital formation should in principle be valued at purchaser‟s prices. However,
in the case of fixed assets produced on own-account (particularly construction) it may be necessary to value
such own-account production at cost including any imputation which may be necessary in respect of own-
account labour employed for the purpose. Purchaser‟s values should cover all costs directly connected with
the acquisition and installation of the items of assets. However, indirect outlays for the purpose of
acquisition of such assets in the form of advertising etc. are excluded. The purchaser‟s value would thus
include the cost of purchase of fixed assets in the market (or cost of production in the case of own-account
construction and own-account production of machinery and equipment), customs duties (if relevant),
purchase and indirect taxes and fees paid for the purpose, transport, delivery and installation charges, direct
preliminary expenditure on site clearance, fees of architects, designers, engineers, etc. and other similar
costs.
Expenditure on current repairs and maintenance incurred for keeping the fixed assets in proper
working order is not classified as capital expenditure. Capital repairs consists of significant alterations and
additions to, or replacements of the parts of fixed assets which have an expected lifetime or use of one year
or more and involve substantial outlays and also extend the life of fixed assets or increase their productivity.
Such expenditure on capital repairs is to be included in GFCF.
Identification of fixed capital formation in the case of industries located within the state boundaries
does not create problems of measurement. However, in the case of organized enterprises both in the public
and private sectors which have activities spread over a number of states there will be problems of
identification and measurement in the context of state domestic fixed capital formation. State-wise figures of
fixed capital formation of these enterprises will be the responsibility of the NAD of CSO, Ministry of
Statistics and Programme Implementation, Government of India.
The transportable fixed capital assets operate in more than one state. In case Sikkim these are
mainly vehicles used for road transport. To the extent the transportable fixed assets are owned by state
enterprises these should form part of the capital formation of the state.
Methodology and Source Material for Fixed Capital Formation
At the state level and particularly for Sikkim the discussion will be focused only on the estimation
of fixed capital formation since the state level estimates of change in inventories are not conceptually viable
or feasible because of the open boundaries of the states.
At the national level the estimates of total gross/net fixed capital formation are prepared by
Commodity Flow Approach by Type of Assets and by Expenditure Approach for the public and private
corporate sector. The estimates of households including the non-profit institutions serving households are
derived as a residual by subtracting the estimates of public and private corporate sectors from the commodity
flow approach. The estimates fixed capital formation separately for construction and machinery are also
prepared by industry of use following the expenditure approach.
The Commodity Flow Approach adopted at the national level is not viable or feasible for Sikkim
because of the open boundaries of the state. For the measurement of GFCF for Sikkim only the expenditure
approach can be adopted. The estimates GFCF can be prepared by type of institution i.e. public sector,
private corporate sector and households including the non-profit institutions serving households. For each of
the institution the estimates may be prepared for each type of asset by industry of use along the same lines as
for estimates of SDP.

ADB TA No. 4297-IND, Final Report
Capacity Building For Fiscal Reforms in Sikkim
295
For each of the institution i.e. .public sector, private corporate sector and house-holds
including the non-profit institutions serving households the source material and the method of estimation of
fixed capital expenditure are described in the subsequent paras.
Public Sector
The estimates of fixed capital formation separately for construction and machinery for the public
sector by industry of use i.e. agriculture, forestry, fishing, mining, manufacturing, trade, transport, etc. for
the state government and departmental and non-departmental commercial undertakings (DCUs and NDCUs)
can be prepared by expenditure approach on the basis of analysis of budget documents and annual reports of
enterprises. The budget documents consisting of financial statement and demands for grants of all the
ministries/ departments of the central, state governments as well as local authorities form the major source of
data. The SIU is already engaged in the analysis of budget documents of state governments and the fixed
capital expenditure of administrative departments and DCUs by industry of use is available in the
worksheets of the SIU and can be compiled by industry of use.
For the state NDCUs the SIU has now taken up the analysis of their reports. The estimates of fixed
capital expenditure by industry of use and by type of assets separately for construction and machinery will
be available annually.
For the central government administration, departmental and non-departmental commercial
undertakings (DCUs and NDCUs) of the central government operating within Sikkim the estimated fixed
capital formation by allocation of national figures is being supplied by the NAD to the SIU of DESM&E,
Government of Sikkim.
State-wise data on expenditure on construction for the NDCU of the central government are not
available as their operations are spread over many states. The Bureau of Public Enterprises, central
government collects annual data on gross block of assets from these enterprises at state level. Total
expenditure on fixed assets at national level of these enterprises is allocated to the states by NAD using these
data. Earlier the national level expenditure on construction was allocated in proportion to the state-wise
gross block of assets. This procedure has lately been changed and the allocation is done in proportion to the
increase/decrease of gross block of assets during the year. Using the latest procedure the allocated figures
for Sikkim made available by NAD are erratic, negative and abnormally high and are not usable as such.
Private Sector
Private Corporate Sector including Cooperatives
At the national level the estimates of the private corporate sector by industry of use are prepared on
the basis of RBI sample studies of large, medium and small companies. No state-wise figures are available
from these studies. Like the supra-regional sectors the allocation of fixed capital formation to each of the
state has to be provided by the NAD for incorporation in state fixed capital formation. Alternately the
DESM&E will have to collect data on fixed capital expenditure from the units of the corporate companies
operating within Sikkim by industry of use.
In case of cooperatives state-wise data on fixed capital expenditure for each type of cooperative i.e.
agriculture, forestry, fishing, mining, , manufacturing, trade, transport banking, etc. operating within Sikkim
were expected to be available from the Cooperative Department of the State Government as well as in
NABARD‟s publication „Statistical Statements relating to Cooperative Movement in India‟. Unfortunately
consolidated data on income and expenditure as well as additions to fixed assets during the year are not
available from the Cooperative Department of the Govt. of Sikkim. NABARD‟s publication „Statistical
Statements relating to Cooperative Movement in India‟ as such does not contain any data on cooperatives
operating in Sikkim. Data on income and expenditure and on additions to fixed assets during the year for
individual cooperatives are available. Till such time consolidated data from the Cooperative Department
become available data on income and expenditure and on additions to fixed assets during the year for
individual cooperatives need to be collected and analysed annually on a sample basis to estimate the fixed
capital formation during the year.
Supra-Regional Sectors

ADB TA No. 4297-IND, Final Report
Capacity Building For Fiscal Reforms in Sikkim
296
As in the case of SDP the estimates of GFCF by type of assets in respect of the supra regional
sectors of Banking and Insurance, Air transport, communication and public administration of central
government are prepared by the NAD and supplied to the state DESs for incorporating the same in their
estimates. The Estimates of Supra-Regional Sectors are prepared by allocation of all-India estimates to the
states using appropriate indicators based on the available state-wise data collected from the respective
organizations. For example the main source of data for public administration of central govt. is the demands
for grants of various ministries contained in the annual central govt. budgets. Each item of capital
expenditure is first identified and then classified by type of assets and finally put under the state/U.T. where
this expenditure has been incurred. By such a detailed analysis bulk of the expenditure at state level is
captured and the rest is allocated on a prorata basis.
Supra-Regional Enterprises
In the case of organized enterprises both in the public and private sectors which have activities
spread over a number of states there will be problems of identification and measurement in the context of
state domestic fixed capital formation. For the public sector enterprises of the central government i.e. DCUs
and NDCUs state-wise figures of fixed capital formation are being worked out by the NAD of CSO,
Ministry of Statistics and Programme Implementation, Government of India. For similar enterprises in the
private sector suitable procedure to derive state-wise figures of fixed capital formation will have to be
devised the NAD.
Households
The main source of information for the households is All India Debt & Investment Surveys
(AIDIS). Results of the AIDIS, 991-92 are presently available form the NSSO Report No.437 on „Household
Capital Expenditure during 1-7-91 to 30-6-92 and the results of the latest AIDIS, 2002-03 are likely to be
available soon. The survey provides necessary data on GFCF for each state separately for rural and urban
household. The item-wise details are further available in respect of
(i) residential plots, houses or buildings,
(ii) farm business broken into various items of capital expenditure of construction and
machinery & equipment and
(iii) non-farm business broken into various items of capital expenditure of construction and
machinery & equipment. Industry-wise details are not available
Agriculture including livestock
Making use of AIDIS estimates in respect of farm business estimates for the benchmark year may
be compiled. AIDIS, 1991-92 gives estimated fixed capital expenditure for per household and number of
households for rural households of Sikkim in respect of
(a) Orchards & Plantations
(b) Agricultural Machinery and Equipment and
(c) Others including Office Equipment
For urban households nil figures are reported.
Estimates for other years may be obtained by carrying forward & backward the benchmark
estimates with the help of suitable quantum and price indicators. Expenditure on (c) above i.e. others
including office equipment is negligible and can be clubbed with (b) above. The physical indicators, which
can be used, are listed below:
Item Quantum Price Indicator
(a) Orchards & Plantation
.(b) Agricultural machinery &
transport equipment and (c) others
including office equipment
Additional area under
agriculture
Addition to the number of
agricultural implements and
machinery
CPI of agriculture –All-India
Wholesale price index of
Machinery & Transport
Equipment

ADB TA No. 4297-IND, Final Report
Capacity Building For Fiscal Reforms in Sikkim
297
The livestock component is treated separately. In connection with the compilation of SDP the
estimates of increase in breeding stock, draught animals, diary cattle and other animals raised for wool
clipping are prepared as output of livestock at current and constant prices. This output forms part of fixed
capital formation and may be added to fixed capital formation in agriculture based on AIDIS.
The estimates of GFCF of the public sector for agricultural activities such as improvement of land
and irrigation works, flood control projects, laying of new orchards & plantations, purchase of agricultural
machinery & implements can be culled out from the budget documents and annual accounts of non-
departmental enterprises located in the state. The estimates at constant prices may be prepared separately for
construction and machinery by deflating the corresponding estimates at current prices by indices of wages of
rural skilled workers and wholesale prices of machinery and equipment respectively.
Ownership of Dwellings
For the household sector the point estimates for 1991-92 both for rural and urban residential
building as obtained from AIDIS, 1991-92 may be carried forward and backward with he help of the indices
of annual additions in the number of residential buildings in rural and urban areas to derive the estimates at
constant prices. To arrive at the current price estimates the combined index of cost of housing based on price
of construction materials and wages of construction materials and wages of construction labour may be
super-imposed separately for rural and urban areas.
Fixed capital expenditure per household for Sikkim for 1991-92 4 is Rs. 66 in urban areas and Rs.
1229 for rural areas. The estimates of urban areas are grossly under reported due to inadequate small sample
size, and cannot be used. At the All-India level fixed expenditure per household on dwellings in urban areas
is two times that of the corresponding expenditure in rural areas. Fixed capital expenditure for urban areas in
1991-92 is assumed to be Rs. 1229*2=2458.
Non-Farm Business
The AIDIS, 1991-92 and 2002-03 provide direct information on fixed capital formation for rural
and urban areas in farm and non farm business as also for residential houses. For non-farm business separate
details by industry of use are not available. Fixed capital formation for Sikkim in non-farm business in rural
and urban areas for 1991-92 has been reported as Rs.13 lakhs and Rs. 8 lakhs respectively only for
machinery and equipment. These figures are negligible; a larger sample size is needed to bring out reliably
the contribution from non-farm sector.
Forestry and mining industries are mainly in the public sector and the household fixed capital
formation may be considered to be negligible. For fisheries also the fixed capital formation can be assumed
to be negligible for Sikkim. Data to estimate the household fixed capital formation for these industries for
Sikkim are not available.
Besides the AIDIS, follow – up surveys of the economic censuses conducted periodically by the
CSO and NSSO are expected to provide benchmark estimates of fixed capital formation for the unorganized
part of manufacturing, trade, transport, hotel & restaurants, storage & warehousing and other
services. The data are supposed to be available in the form of either fixed asset per enterprise/establishment
or closing or opening fixed assets or net addition to fixed assets by type of assets.
The enterprise surveys conducted in the recent past are as under:-
1. Unorganized Services, 2001-02
2. Unorganized Manufacturing, 2000-01
3. Informal Sector,1999-2000
4. Unorganized enterprises, 1998-99
5. Own account Trading and non-directory Trade establishments, 1996-97
6. Unorganized Manufacturing, 1994-95
7. Unorganized Trade 1990-91.
8. Hotels and Restaurants 1993-94
9. Unorganized Transport 1988-89
10. Storage 1992-93
11. Other Service 1991-92
ADB TA No. 4297-IND, Final Report
Capacity Building For Fiscal Reforms in Sikkim
298
Unfortunately the estimates of fixed capital formation for Sikkim from the published reports of
enterprise surveys of CSO or NSSO for non-farm business except unorganized manufacturing, 1994-95 are
not available. As and when the fixed capital expenditure for Sikkim, from the NSSO surveys for other
industries become available, the same can be used.
Transport is a growing sector in Sikkim and the transport operated by the households for
commercial purposes is likely to form a major part of non-farm business. Additions to the number of
commercial vehicles registered with Transport Authority in the private sector are available. These can be
evaluated at average prices to estimate the fixed expenditure on vehicles during the year.
Non-Profit Institutions Serving Households
The AIDIS does not take into consideration the capital formation of the non profit institutions
serving households. Data on these institutions except educational institutions are also not available at state or
national levels from any other source. For educational and medical institutions data on fixed capital
expenditure may be available from the Education and Medical Departments. These data may be collected
and used. For religious institution such as monasteries, temples, churches, etc data may be collected from
their management. The DESME is currently collecting data on the private schools in respect of income and
expenditure. etc. Majority of these may be non-profit institutions, but data on fixed capital expenditure is not
being collected. Attempts need to be made to collect information in respect of non-profit institutions
engaged in various activities.

ADB TA No. 4297-IND, Final Report
Capacity Building For Fiscal Reforms in Sikkim
299
Appendices
Appendix 1.1: List of Meetings
T. T. Dorji
Principal Secretary, Finance, Revenue and Expenditure Department
P. Wangdi
Controller of Accounts, Finance, Revenue and Expenditure Department
Nalini G. Pradhan
Special Secretary, Finance, Revenue and Expenditure Department
S. D. Pradhan
Joint Director, Finance, Revenue and Expenditure Department
Binod Silal
Deputy. Director, Budget, Finance, Revenue and Expenditure Department
G. K. Subba
Addl Chief Secy. Cum Development Commissioner, Planning Department
N. Yethenpa
Special Secretary, Planning Department
Jyotsna Subba
Deputy Director, Planning Department
M. Dakshinamoorthy
Accountant General, Sikkim
Jayashree Pradhan
Principal Secretary, Urban Development and Housing department
S. D. Tshering
Director, Directorate of Economics and Statistics, Monitoring and Evaluation
Mr. N.S. Alley
Deputy Director, Sample Survey, Directorate of Economics and Statistics, Monitoring and Evaluation
D.K. Chettri
Deputy Director, Directorate of Economics and Statistics, Monitoring and Evaluation
T R Dohal
Asstt Director, Directorate of Economics and Statistics, Monitoring and Evaluation
Mr. Nima Tainang
Asstt. Director , Directorate of Economics and Statistics, Monitoring and Evaluation
Mrs. S.K. Pradhan
Asstt. Director , Directorate of Economics and Statistics, Monitoring and Evaluation
Mr. Rikzing G. Lepeha
Stat. Inspector-in-Charge of Computer, DESME
Mr. R.R. Gupta, Dy. Director
District Statistical Officer, Namchi
C. L. Sharma
Additional Secretary, Department of Personnel
S. D. Basi
Secretary, Excise Department
M. Sharma
Commissioner, Excise department
M. K. Pradhan
Special Commissioner, Excise Department
I.K. Gautam
Deputy Commissioner, Excise Department
Dr. T. R. Gyatso
Secretary, Health Care, Human Services and Family Welfare Department
Dr. D. K. Subba
Principal Director, Health Care, Human Services and family welfare
C. L. Denzongpa
CCSE, Human Resource Development Department

ADB TA No. 4297-IND, Final Report
Capacity Building For Fiscal Reforms in Sikkim
300
Tshewang Gyachho
DDO, East District, Rural Management and Development Department
T. N. Dhakal
Additional Secretary, Land Revenue and Disaster Management Department
K. N. Bhutia
Special Secretary, Income and Sales Tax Department
D. Lepcha
Additional Secretary, Income and Sales Tax Department
U Gurung
Joint Secretary, Income and Sales Tax Department
S. T. Gyatso
Joint Secretary, Income and Sales Tax Department
Sarala Rai
Joint Commissioner, Income and Sales Tax Department
S.K.Sharma
Director (FC & PA), Finance, Revenue and Expenditure Department
M.G.Kiran
Managing Director, State Bank of Sikkim
Mr. P.Wangchen
MD, Sikkim Power Development Corp. Ltd.
Mr. P.B.Subba
GM, Sikkim Power Dev. Corp. Ltd
Mr. S.Topden
MD, SIDCO and SABBCO
Dr. Jai Ram Prasad
MD, Sikkim Poultry Development Corp. Ltd
Mr. B.P.Alley
MD, Sikkim Jewels Ltd
Mr. Y. Chakravarthy
Dy. Manager, Sikkim Jewels Ltd
Linus Rai
Sr. A.O, SKVIB
Mr. S.G.Bhutia
Village Industries
Mr. P.K.Dong
ED , Sikkim Tourism Dev. Corp.
Mr. Gyurme Yousal
GM, SITCO
Mr. Pwan Awasthy
GM, SITCO, representing MD , SPIL
Mr. Daden Bhutia
ED, SCCS
Mr. A.K.Adhikary
GM, SIMFED
Mr. L.P.Panday
MD, SIMFED
Mr. M.V.Vasu
MD, Sikkim State Co-op. Bank Ltd
Mr. T.Pradhan
MD, Denzong Agri. Corp. Society Ltd
Mr. Tempo Bhutia
MD, STCS
Mr. K.B. Gurung
MD, GFPF
Mr. D.Dadul
Pr. Secretary Transport

ADB TA No. 4297-IND, Final Report
Capacity Building For Fiscal Reforms in Sikkim
301
Pema Wangchen.
Chief Engineer, Energy and Power Department
M.V.Vasu
Managing Director, Sikkim State Co-operative Bank Ltd
C.T.Wangdi
Additional Secretary, Transport Department
Tseten Dorjee
Sr. AO, Commerce and Industries Department
H.K.Chettri
Under Secretary, Commerce and Industries Department
R. Ongma
Commissioner cum Secretary., Food and Civil Supplies
Mr. R P Chingappa,
Special Secretary, Food and Civil Supplies
Mr. Satyajit Paul
Deputy Director, N.S.S.O., F.O.D.
Mr. Banerjee
Census of India, Registrar General‟s Office
Mr. P.N. Tainang, Project Director
S.R.D.A., Min. of Rural Development
Mrs. R. Ongmu,
Commissioner-cum-Secretary, Min. of Food & Supplies (F&S)
Mr. R.P. Chingapa
Special Secretary (F&S)

ADB TA No. 4297-IND, Final Report
Capacity Building For Fiscal Reforms in Sikkim
302
Appendix 3.1 Training Programme on Value Added Tax - 1: Schedule of Lectures
Day 1 Day 2 Day 3
9:30 to 11:00 Inaugural session Design of VAT:
An assessment
Issues in
Administration of
VAT - II
11:00 to 11:30 Tea/Coffee
11:30 to 13:00
Critical Review of
the Existing sales
tax system
VAT Act: Issues
Specific to Sikkim Transitional issues
13:00 to 13:45 Lunch
13:45 to 15:15 Introduction to VAT
Treatment of Inter-state
Transactions: Issues and
Options
Computerisation for
VAT
15:15 to 15:45 Tea/Coffee
15:45 to 15:15 Computing VAT
and its implications
Issues in Administration
of
VAT - I
Valedictory Session
Appendix 3.2 Training Programme on Value Added Tax - 2: Schedule of Lectures
11 May 05 1 2 May 05 13 May 05
9:30 to 11:00 Inaugural session Role and Function of
MIS in VAT - I
Checkposts and
Information Flow
11:00 to 11:30 Tea/Coffee
11:30 to 13:00 Assessment in a
VAT Regime
Role and Function of
MIS in VAT - II Principles of Audit - II
13:00 to 13:45 Lunch
13:45 to 15:15 Account Keeping in
VAT - I
Risk Assessment for
Audit selection Audit – Case Studies
15:15 to 15:45 Tea/Coffee
15:45 to 15:15 Account Keeping in
VAT - II Principles of Audit - I Valedictory Session