Embed Size (px)
Citation preview
32nd
Australian Transport Research Forum 1 | P a g e
Capacity Analysis of Signalised Intersection using Micro-
simulation
Mohsin Shahzad Chaudhry, Prakash Ranjitkar
Department of Civil and Environmental Engineering, The University of Auckland, Private
Bag 92019, Auckland, New Zealand, E-mail: [email protected]
Abstract: Micro-simulation models are rapidly gaining acceptance as promising tools to
analyse and evaluate ITS and other traffic control and management measures. Capacity is a
primary concept in most of traffic engineering studies, however micro-simulation models
generally ignore this concept. There are significant numbers of studies on capacity analysis
based on analytical approaches including Highway Capacity Manual (HCM) and the
Australian Research Report (ARR 123). The analyses conducted using micro-simulation
reflected under representation of capacity however such studies are limited in numbers and
scope. This paper reports an investigation conducted using AIMSUN micro-simulation model
to analyse the capacity and queue discharge flow rate at a signalised intersection in Auckland.
The micro-simulation model was calibrated using realistic local parameters to represent the
real world situation. The results from this calibrated model were first verified against the data
collected from loop detectors and then compared with results from analytical approaches
including HCM and ARR 123. The comparative analysis showed that micro-simulation
presents reasonable representation of actual traffic conditions when flow volumes are high. In
the light of favourable research findings, it is concluded that AIMSUN is a viable tool for the
evaluation and capacity analysis of a signalised intersection.
1. INTRODUCTION
Microscopic simulation models are rapidly gaining acceptance as promising tools to analyse
and evaluate ITS and other traffic control and management measures by traffic engineers and
transportation professionals. Microscopic models describe the system entities and their
interactions at high level of details. Its applications in solving complex traffic engineering
problems have received popularity as well as criticism. The capability of its usefulness in
predicting various factors such as desired speed and gap acceptance, in addition to analyse
roadway traffic conditions showed a great potential to explore. These models track and record
the individual movements of vehicles which help and allow the analyst to test a wide range of
roadway configurations and operational conditions that far exceed the limits of typical
analytical tools. Additionally, present micro-simulation models include highly sophisticated
graphical user interfaces (GUI) that allow visual displays and demonstration of traffic
operations on a computer screen which was previously not possible in conventional
computational tools. This characteristic enhances its understanding within the transportation
professionals as well as others outside this profession to visualize the traffic operations and it
can be presented in public meetings. However, micro-simulation models are criticised for
their few limitations when compared to analytical tools due to its time consumption and
extensive resource utilization.
Prior to development of micro-simulation models, analytical methods were typically
employed in studies to plan and improve roadway facilities. These methods can estimate
capacity, delay, level of service and other parameters for a given set of roadway conditions.
Capacity is a primary concept in most of the traffic engineering studies, whereas micro-
32nd
Australian Transport Research Forum 2 | P a g e
simulation models generally ignore this concept as micro-simulation models are built on car
following and lane changing theories (as cited in Akçelik and Besley, 2001). Analytical
approaches including Highway Capacity Manual (HCM) and the Australian Research Report
(ARR 123) attracted many researchers to conduct studies on capacity analysis (McGhee and
Arnold, 1997; Akçelik, 2003; Buckholz, 2009); in contrast, only few researchers used micro-
simulation approach to study capacity analysis. The emphasis on these studies was mainly on
validation process of micro-simulation model (Bayarri, et al., 2004; Wan, et al., 2005;
Gagnon, et al., 2008). These studies on micro-simulation, though limited in scope and less in
number, have reported under representation of actual capacity by the model. In a recent work
conducted by Andjic and Matthew (2008), hypothetical data was utilized to investigate
capacity and queue discharge flow rates and the results are yet to be validated using field data
observations. While establishing correlation between modelled and theoretical values, these
researchers presented interpretation of micro-simulation outputs in traffic engineering terms.
Sometimes these interpretations are compromised with some unrealistic data inputs (like
reaction times) to make the outputs closer to real values (Andjic and Matthew, 2008;
Rajasakran, 2008).
This paper endeavours to test and apply compatibility techniques as presented by Akcelik and
Besley (2001) to investigate capacity and queue discharge flow rates at a signalised
intersection using AIMSUN micro-simulation software (version 6.0.1). The study is carried
out to assess the compatibility of car following model running in AIMSUN micro-simulation
model, to analytical approaches by employing the data directly taken from loop detectors. The
scope of this study is limited to isolated signalised intersection operations to make it
comparable with analytical approaches. The primary objective of this research is to review
and study the micro-simulation approach for the possible implementation as an alternative to
analytical method. More specifically, the objectives of this study are listed as follows:
1. To evaluate the implementation of micro-simulation on a signalised intersection and
compare its results with traditional analytical approaches.
2. To examine the ability of AIMSUN micro-simulation model to produce capacity and
delay estimates at signalised intersections that are reliable and valid with standard
traffic flow theory.
3. To study and evaluate the micro-simulation as an alternative approach for capacity
analysis for signalised intersections.
The remaining part of this paper is organised in five sections. In the next section, detailed
methodology is presented on framework of this study along with the test bed description,
measures of effectiveness adopted in the analysis, calibration and validation process of micro-
simulation model. The data used for this study is presented in the traffic count data section.
Data analysis is split into calibration process and validation process. Finally capacity analysis
is carried out in section 5 and findings of this study are discussed in discussions in section 6.
2. METHODOLOGY
Two analytical capacity estimation methods and a micro-simulation model were investigated
by identifying their assumptions, limitations and strengths. The micro-simulation model used
for this study was AIMSUN which was developed by a research group at the Laboratorio de
Investigación Operativa y Simulación in the Department of Statistics and Operations Research
of the Universit at Politècnica de Catalunya (Barcelo and Casas, 2002). Results of the micro-
simulation model were compared with the results of analytical models in order to demonstrate
32nd
Australian Transport Research Forum 3 | P a g e
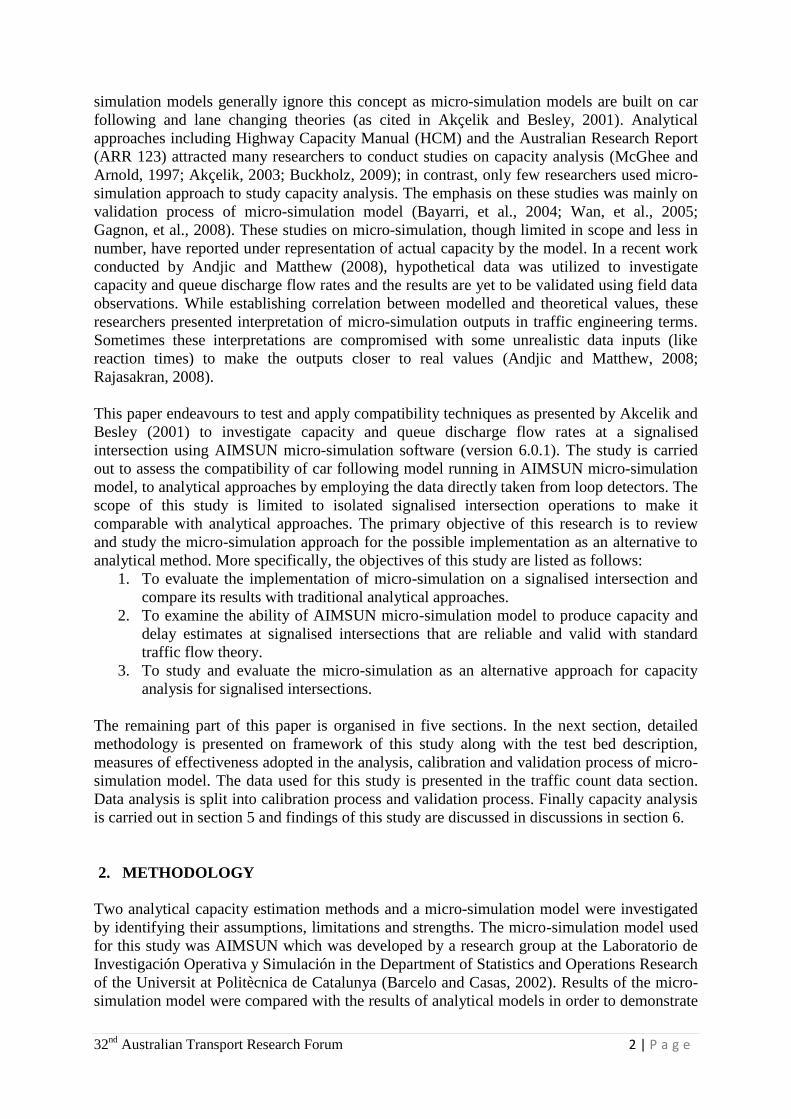
the consistency of the micro-simulation model with analytical solutions. The test bed used for
this study is an urban signalised intersection. A description of the micro-simulation and
analytical approaches used in the study is presented in a flow chart in Figure 1 and described
in subsequent sections. This flow chart presents the methodology used for this research.
Figure 1: Flow Chart for study
2.1 Test Bed and Test Scenario
An urban intersection has been selected for comparative performance study. The layout and
phasing information of this intersection is shown in Figure 2. For this study, the required data
was split into three sections; traffic volume data, signal data, and geometric data. Traffic
volume data and signal data was requested from the SCATS help desk for the mid November,
2008. The data from SCATS loop detectors was provided in the form of 15 minute traffic
counts along with phasing information. The obtained data was used for micro-simulation
model as a baseline data and subsequently it was further used in calibration process. The same
data was used as an input for analytical models.
For easy retrieval and analysis, data was imported into spreadsheets. As a first step, the
obtained data was filtered and segregated into morning peak times and evening peak times in
order to obtain the peak flow hours. Two peak hours were selected each one from morning
peak traffic flow and evening peak traffic flow. A neutral day Tuesday was selected for
comparative analysis. Based on initial data filtration, two peak traffic flow periods were
identified as 8AM to 9AM in the morning and 5PM to 6PM in the evening.
32nd
Australian Transport Research Forum 4 | P a g e
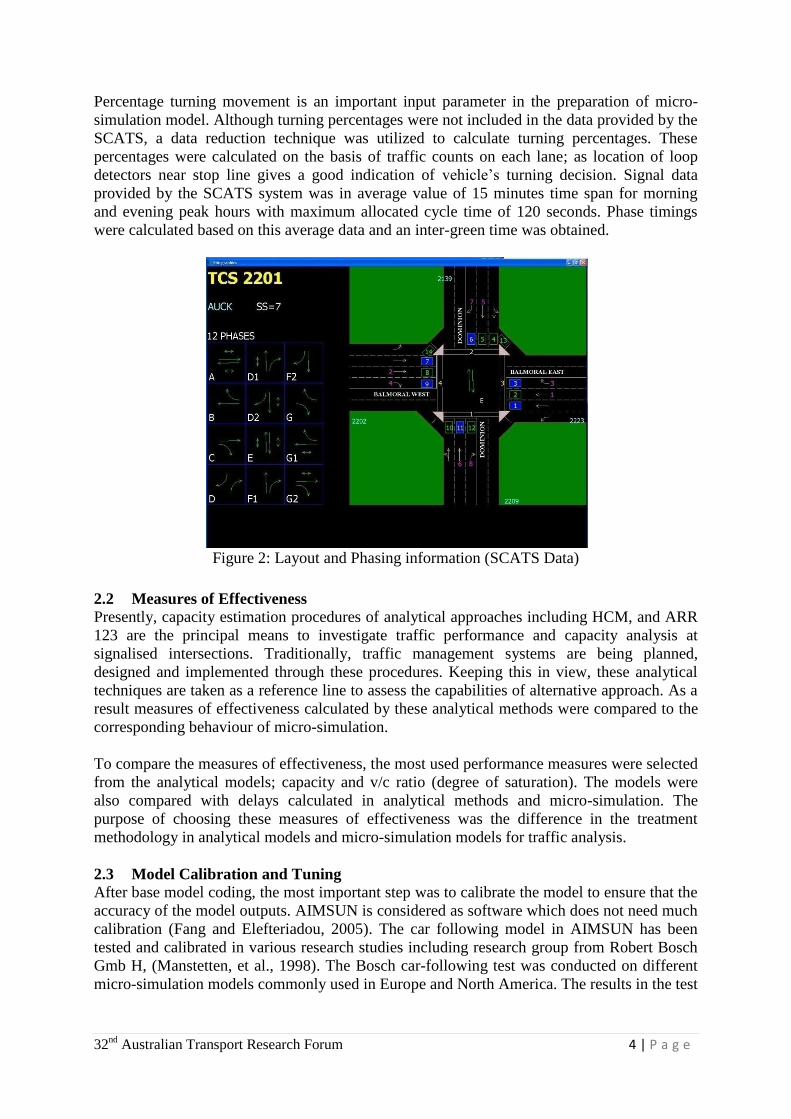
Percentage turning movement is an important input parameter in the preparation of micro-
simulation model. Although turning percentages were not included in the data provided by the
SCATS, a data reduction technique was utilized to calculate turning percentages. These
percentages were calculated on the basis of traffic counts on each lane; as location of loop
detectors near stop line gives a good indication of vehicle’s turning decision. Signal data
provided by the SCATS system was in average value of 15 minutes time span for morning
and evening peak hours with maximum allocated cycle time of 120 seconds. Phase timings
were calculated based on this average data and an inter-green time was obtained.
Figure 2: Layout and Phasing information (SCATS Data)
2.2 Measures of Effectiveness
Presently, capacity estimation procedures of analytical approaches including HCM, and ARR
123 are the principal means to investigate traffic performance and capacity analysis at
signalised intersections. Traditionally, traffic management systems are being planned,
designed and implemented through these procedures. Keeping this in view, these analytical
techniques are taken as a reference line to assess the capabilities of alternative approach. As a
result measures of effectiveness calculated by these analytical methods were compared to the
corresponding behaviour of micro-simulation.
To compare the measures of effectiveness, the most used performance measures were selected
from the analytical models; capacity and v/c ratio (degree of saturation). The models were
also compared with delays calculated in analytical methods and micro-simulation. The
purpose of choosing these measures of effectiveness was the difference in the treatment
methodology in analytical models and micro-simulation models for traffic analysis.
2.3 Model Calibration and Tuning
After base model coding, the most important step was to calibrate the model to ensure that the
accuracy of the model outputs. AIMSUN is considered as software which does not need much
calibration (Fang and Elefteriadou, 2005). The car following model in AIMSUN has been
tested and calibrated in various research studies including research group from Robert Bosch
Gmb H, (Manstetten, et al., 1998). The Bosch car-following test was conducted on different
micro-simulation models commonly used in Europe and North America. The results in the test
32nd
Australian Transport Research Forum 5 | P a g e
show that the AIMSUN car-following model was able to present fairly good replication of
observed values.
Economic Evaluation Manual (EEM-I) presents GEH statistics concept for transportation
model validation. GEH statistics is a chi-squared statistics that is designed to be tolerant of
larger errors in low flows. It can be calculated as:
(1)
Where qobs is observed hourly flow and qmodel is modelled hourly flow.
Economic evaluation manual recommended ranges of GEH statistics for model checks
(Economic Evaluation Manual, 2008):
At least 60% of individual link flows should have GEH less than 5.0
At least 95% of individual link flows should have GEH less than 10.0
All individual link flows should have GEH less than 12.0
Screenline flows should have GEH less than 4.0 in most cases
Another recommended criteria mentioned in EEM-I is percentage root-mean-square-error
(RMSE) which is calculated as;
(2)
According to EEM-I criteria, RMSE should be less than 30%.
The process of calibration was carried out by setting input values according to recommended
saturation flow values based on local conditions. The table below shows the calibrated
measures adopted in the model. The realistic values are selected for this study based on the
recommendations in literature (Ranjitkar, et al., 2005; Xin, et al., 2008).
Table 1: Input parameters after calibration
Simulation Date November 11, 2008
Detection Cycle 0.75 seconds
Car following model Deceleration estimation (avg. Of follower & leader)
Queuing up speed 1 m/sec
Queuing leaving speed 4 m /sec
Speed 50 km/h
Reaction time 0.75 seconds
Reaction time at stop 1.35 seconds
Arrival distribution Normal distribution
Acceleration rate
max 2 m/sec2
min 1.2 m/sec2
Normal deceleration rate
max 4.5 m/sec2
min 3.5 m/sec2
32nd
Australian Transport Research Forum 6 | P a g e
3. TRAFFIC COUNT DATA
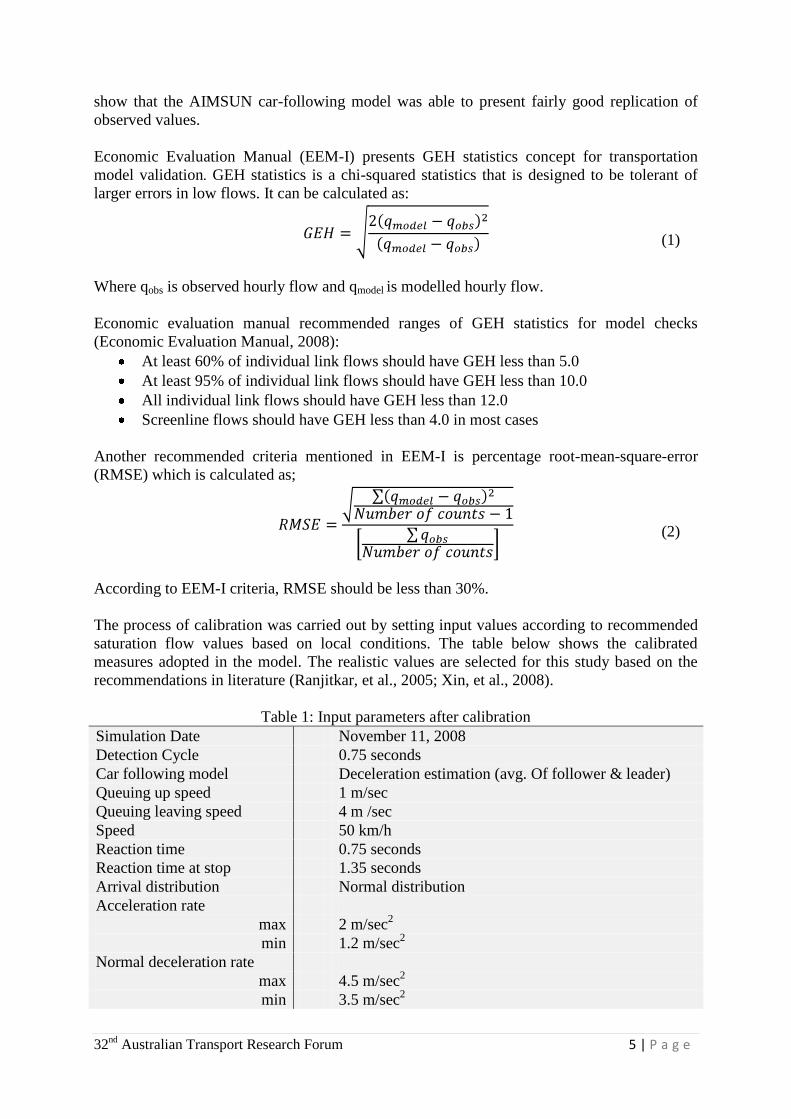
The New Zealand Transport Agency (NZTA) provided data for this study. Traffic count data
from SCATS system loop detectors representing the flow of vehicles in 15 minutes interval
was provided for this study. Figure 3 shows the 24 hours traffic flow pattern on all approaches
for Tuesday, 11 November 2008 traffic. From the Figure 3, it is evident that traffic volume
start to increase at 7 AM in the morning to 9AM and after 9AM traffic data remains flat at an
average flow rate till the evening peak hours starts. Evening peak time starts at 4PM till 6PM.
It is observed from the Figure 3, that approach 7 & 8 provides high traffic volumes in the
morning peak hours while approach 1 and 2 shows high flow rate during evening peak hours.
Figure 3: Traffic flow for 24 hours on Tuesday
The input data required for signalised intersection to define the traffic control parameters were
location of signals, the signal groups into which turning movements are grouped, the sequence
of phases for each one of the signal groups that have right of way, the offset for the junction
and the duration of each phase.
Most of the major urban intersections in Auckland region use Sydney Co-ordinated Adaptive
Traffic System (SCATS) loop detectors to record traffic volumes. SCATS is a traffic
management system that operates in real time, adjusting signal timings in response to
variations in traffic demand and system capacity as they occur. SCATS manages groups of
intersections through its unique control philosophy rather than treating intersections as an
isolated entity. At the subject intersection twelve loop detectors were in place at through and
right turn approaches to detect vehicular flow. The data provided by the SCATS help desk
included phasing information for the same period which is shown in Figure 2. It is evident
from the Figure that 12 phases are available to meet with varying traffic demands in this
intersection. However, at peak traffic times, the sequence of phasing is reduced to four phases
“A”, “D”, “E” and “G” to handle traffic at this intersection. For calculation of lane group
capacity, it was required to have the exact green time allocation data in a signal cycle. On
further request, signal phasing information for 15 minute time was provided in the form of
maximum and minimum values of phasing split information. From the signal phasing data,
maximum and minimum values are derived for each phase split which is shown in Table 2.
0
100
200
300
400
500
600
0:0
0
2:0
0
4:0
0
6:0
0
8:0
0
10
:00
12
:00
14
:00
16
:00
18
:00
20
:00
22
:00
Tra
ffic
Flo
w
Time
Approach 1
Approach 2
Approach 3
Approach 4
Approach 5
Approach 6
Approach 7
Approach 8
Approach 9
Approach 10
Approach 11
Approach 12
32nd
Australian Transport Research Forum 7 | P a g e
Table 2: Signal Timings at peak hours
Phase Phasing Time (Sec)
Minimum Maximum Extension
A 26 41 1
B - - -
C - - -
D 17 27 1
E 22 46 1
F - - -
G 12 25 1
4. DATA ANALYSIS
4.1 Calibration Process
In order to use these scenarios in a way that it produces the best possible simulation results, it
is important to validate these scenarios. The first step in any micro-simulation analysis is to
calibrate the input parameters according to local conditions. Vehicle type used in the study
included the category “Car”. The parameters used for this vehicle category were presented in
Table 1.
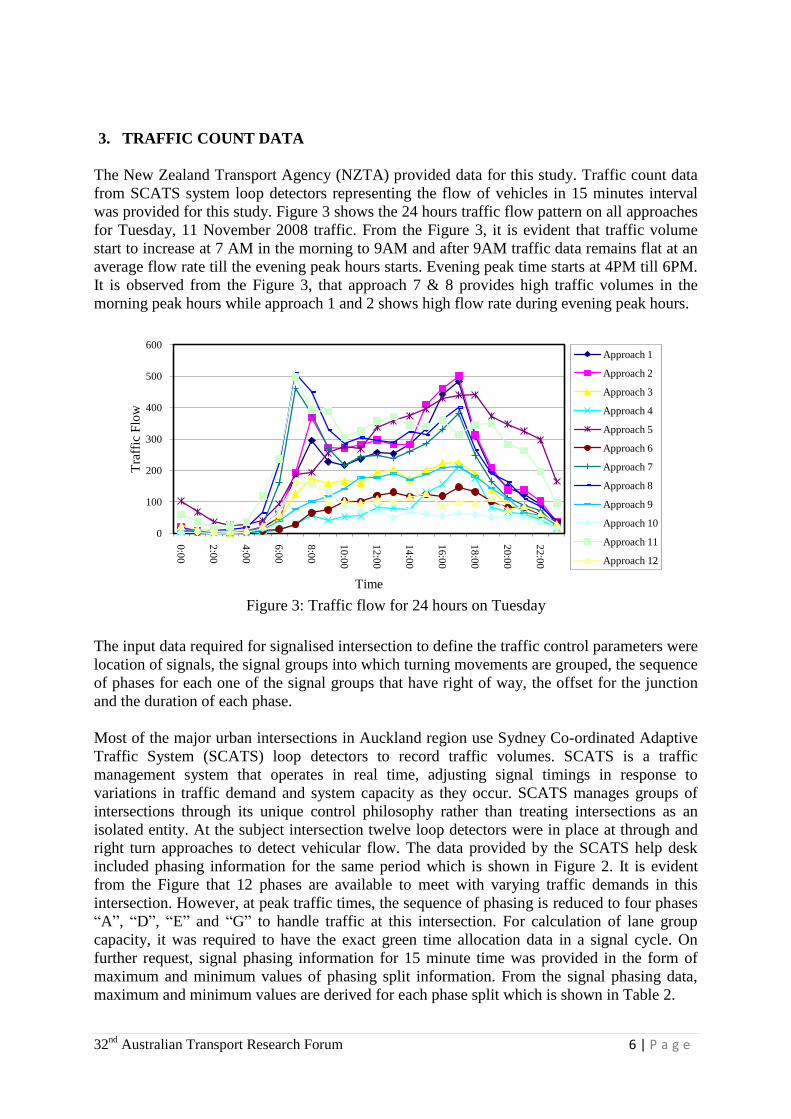
The sensitivity of the micro-simulation model was checked against reaction time and it was
found that at 0.75 seconds, micro-simulation produces results comparable to field
observations. Figure 4 shows the results of sensitivity analysis of micro-simulation model.
Micro simulation model was calibrated by adjusting saturation flow rate. Saturation flow rate
is an important characteristic in capacity calculations and it is adjusted for prevailing traffic
conditions such as lane width, percentage of heavy vehicles, grades, right turns, left turns,
parking arrangements, public transport blockage, and right turn blockage. ARR123 defines
saturation flow as the maximum steady flow rate from the queue during the green period of
the signal phase. Akcelik also mentioned the lost time concept in saturation flow which is an
integral part of the saturation flow concept (Akçelik, 1995).
Figure 4: Model sensitivity against reaction time
-40.00%
-30.00%
-20.00%
-10.00%
0.00%
10.00%
20.00%
0.5 0.75 1 1.25
Vari
ati
on
in
dis
charg
e fl
ow
rate
Reaction time (in seconds)
32nd
Australian Transport Research Forum 8 | P a g e
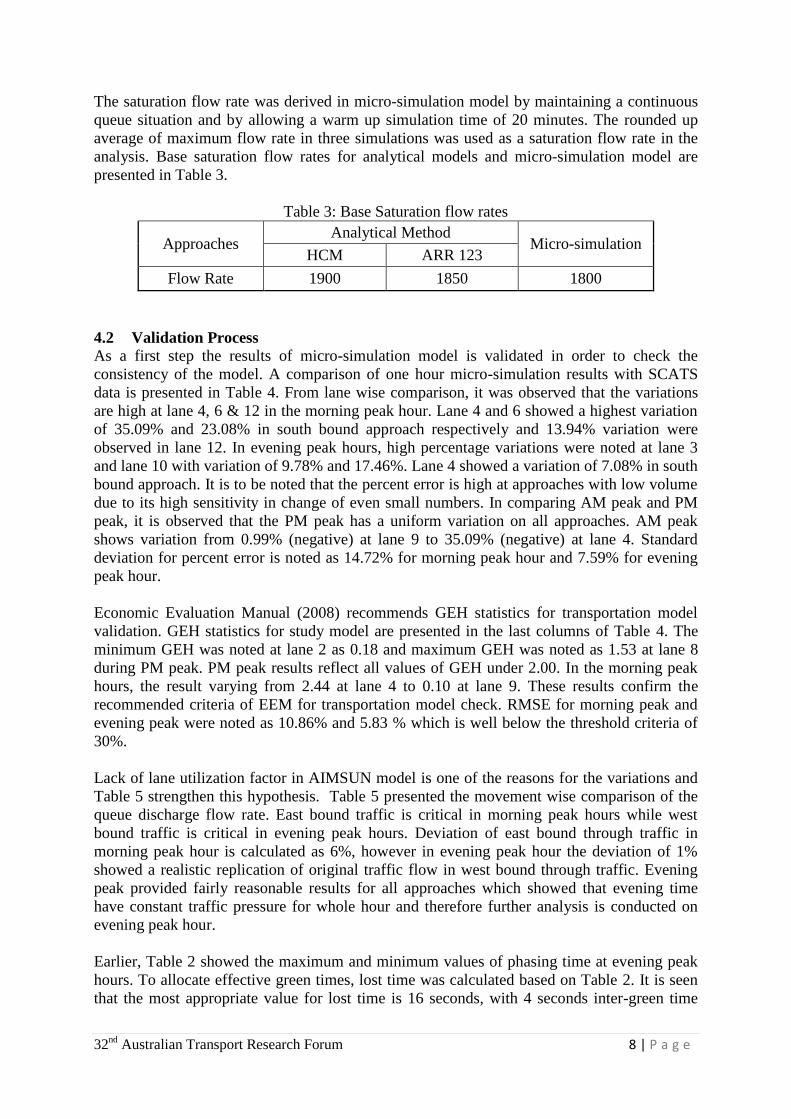
The saturation flow rate was derived in micro-simulation model by maintaining a continuous
queue situation and by allowing a warm up simulation time of 20 minutes. The rounded up
average of maximum flow rate in three simulations was used as a saturation flow rate in the
analysis. Base saturation flow rates for analytical models and micro-simulation model are
presented in Table 3.
Table 3: Base Saturation flow rates
Approaches Analytical Method
Micro-simulation HCM ARR 123
Flow Rate 1900 1850 1800
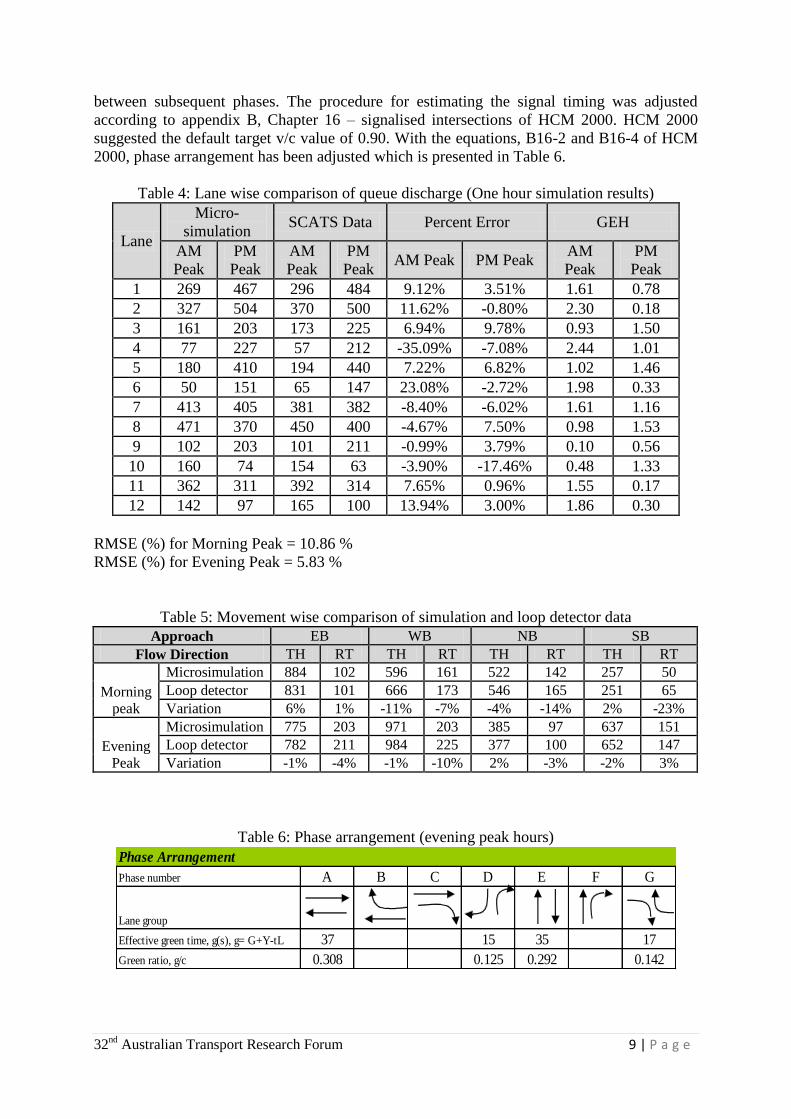
4.2 Validation Process
As a first step the results of micro-simulation model is validated in order to check the
consistency of the model. A comparison of one hour micro-simulation results with SCATS
data is presented in Table 4. From lane wise comparison, it was observed that the variations
are high at lane 4, 6 & 12 in the morning peak hour. Lane 4 and 6 showed a highest variation
of 35.09% and 23.08% in south bound approach respectively and 13.94% variation were
observed in lane 12. In evening peak hours, high percentage variations were noted at lane 3
and lane 10 with variation of 9.78% and 17.46%. Lane 4 showed a variation of 7.08% in south
bound approach. It is to be noted that the percent error is high at approaches with low volume
due to its high sensitivity in change of even small numbers. In comparing AM peak and PM
peak, it is observed that the PM peak has a uniform variation on all approaches. AM peak
shows variation from 0.99% (negative) at lane 9 to 35.09% (negative) at lane 4. Standard
deviation for percent error is noted as 14.72% for morning peak hour and 7.59% for evening
peak hour.
Economic Evaluation Manual (2008) recommends GEH statistics for transportation model
validation. GEH statistics for study model are presented in the last columns of Table 4. The
minimum GEH was noted at lane 2 as 0.18 and maximum GEH was noted as 1.53 at lane 8
during PM peak. PM peak results reflect all values of GEH under 2.00. In the morning peak
hours, the result varying from 2.44 at lane 4 to 0.10 at lane 9. These results confirm the
recommended criteria of EEM for transportation model check. RMSE for morning peak and
evening peak were noted as 10.86% and 5.83 % which is well below the threshold criteria of
30%.
Lack of lane utilization factor in AIMSUN model is one of the reasons for the variations and
Table 5 strengthen this hypothesis. Table 5 presented the movement wise comparison of the
queue discharge flow rate. East bound traffic is critical in morning peak hours while west
bound traffic is critical in evening peak hours. Deviation of east bound through traffic in
morning peak hour is calculated as 6%, however in evening peak hour the deviation of 1%
showed a realistic replication of original traffic flow in west bound through traffic. Evening
peak provided fairly reasonable results for all approaches which showed that evening time
have constant traffic pressure for whole hour and therefore further analysis is conducted on
evening peak hour.
Earlier, Table 2 showed the maximum and minimum values of phasing time at evening peak
hours. To allocate effective green times, lost time was calculated based on Table 2. It is seen
that the most appropriate value for lost time is 16 seconds, with 4 seconds inter-green time
32nd
Australian Transport Research Forum 9 | P a g e
between subsequent phases. The procedure for estimating the signal timing was adjusted
according to appendix B, Chapter 16 – signalised intersections of HCM 2000. HCM 2000
suggested the default target v/c value of 0.90. With the equations, B16-2 and B16-4 of HCM
2000, phase arrangement has been adjusted which is presented in Table 6.
Table 4: Lane wise comparison of queue discharge (One hour simulation results)
Lane
Micro-
simulation SCATS Data Percent Error GEH
AM
Peak
PM
Peak
AM
Peak
PM
Peak AM Peak PM Peak
AM
Peak
PM
Peak
1 269 467 296 484 9.12% 3.51% 1.61 0.78
2 327 504 370 500 11.62% -0.80% 2.30 0.18
3 161 203 173 225 6.94% 9.78% 0.93 1.50
4 77 227 57 212 -35.09% -7.08% 2.44 1.01
5 180 410 194 440 7.22% 6.82% 1.02 1.46
6 50 151 65 147 23.08% -2.72% 1.98 0.33
7 413 405 381 382 -8.40% -6.02% 1.61 1.16
8 471 370 450 400 -4.67% 7.50% 0.98 1.53
9 102 203 101 211 -0.99% 3.79% 0.10 0.56
10 160 74 154 63 -3.90% -17.46% 0.48 1.33
11 362 311 392 314 7.65% 0.96% 1.55 0.17
12 142 97 165 100 13.94% 3.00% 1.86 0.30
RMSE (%) for Morning Peak = 10.86 %
RMSE (%) for Evening Peak = 5.83 %
Table 5: Movement wise comparison of simulation and loop detector data
Approach EB WB NB SB
Flow Direction TH RT TH RT TH RT TH RT
Morning
peak
Microsimulation 884 102 596 161 522 142 257 50
Loop detector 831 101 666 173 546 165 251 65
Variation 6% 1% -11% -7% -4% -14% 2% -23%
Evening
Peak
Microsimulation 775 203 971 203 385 97 637 151
Loop detector 782 211 984 225 377 100 652 147
Variation -1% -4% -1% -10% 2% -3% -2% 3%
Table 6: Phase arrangement (evening peak hours)
Phase Arrangement
Phase number A B C D E F G
Lane group
Effective green time, g(s), g= G+Y-tL 37 15 35 17
Green ratio, g/c 0.308 0.125 0.292 0.142
32nd
Australian Transport Research Forum 10 | P a g e
5. CAPACITY ANALYSIS
Capacity analysis of the intersection was carried out under a set of conditions detailed as
under;
- Analysis is conducted in the PM peak time.
- Comparison of micro-simulation model is conducted with methodology described in
ARR 123 and HCM methods.
- The phase timings for this study is assumed as fixed to make comparison with
ARR 123 and HCM.
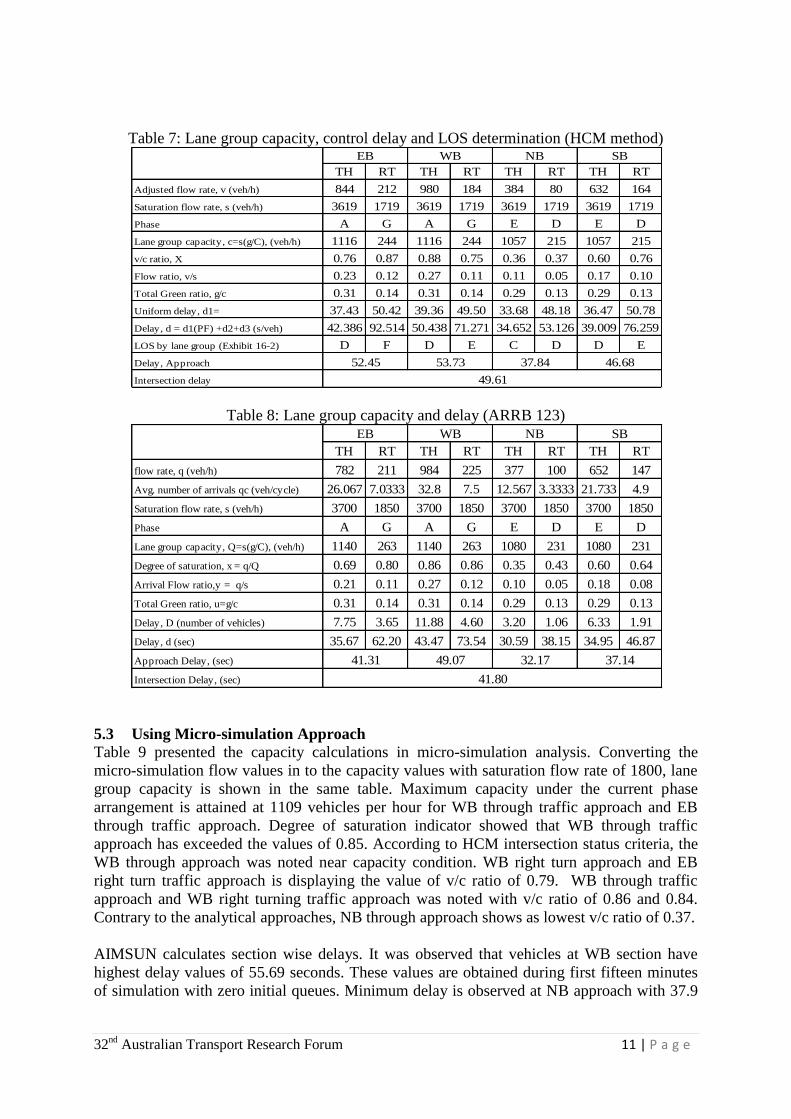
5.1 Using HCM
Table 7 presented the HCM 2000 calculations for capacity analysis. From this table, it can be
seen that the symmetry of intersection divided all the movements in two groups. This
symmetry of intersection is reflected in saturation flow rate which is presenting the two values
for through and right turning movements based on prevailing traffic conditions. Lane group
capacity of east bound and west bound traffic is same due to equal allocated green time in
phase A. Lane group capacity for EB and WB through traffic is 1116 vehicles against
maximum traffic flow of 980 vehicles at WB through approach. Volume to capacity ratio for
WB through approach is 0.88 which denotes that this approach is reaching at near capacity.
North bound approach gives the lowest v/c ratio of 0.36 for through traffic which is an
indication of low traffic volume towards CBD area in evening peak hour.
HCM reports capacity in terms of Level of Service (LOS). LOS value was calculated based on
the delay values at corresponding approach. LOS is a prompt indicator of functional
performance of a section. EB right turning approach was at LOS of “F” while north bound
through traffic was at LOS “C”. Both highest traffic carrying approaches, through WB and EB
lanes, were at a level of service “D”. WB right turning approach and SB right turning
approach was indicating a level of service “E” for the analysis period. Control delay value of
92.51 seconds showed the highest delay occurrence at right turning EB movement. SB right
turn movement also indicated delay value at 76.26 seconds which is closer to level of service
“F” threshold of 85 seconds. Minimum delay of 34.65 seconds is observed at NB through
traffic.
5.2 Using ARR 123
ARR 123 does not provide level of service (LOS) equivalent. The capacity is calculated based
on the saturation flow rate and allocated green time to the particular approach. Table 8
presented the calculations of lane group capacity and delay estimates based on ARR 123
methodology. Average number of vehicles arrival is noted at 32.8 vehicles per signal cycle in
west bound through traffic which is the highest arrival rate in the evening peak hour and
justify the maximum green time allocation. North bound right turning approach indicated a
lowest arrival rate of 3.33 vehicles per signal cycle. For lane group capacity, the intersection
can be split into two groups with through lane saturation flow rate of 3700 and right turning
saturation flow rate of 1850. This group indicated that EB and WB through traffic had equal
lane group capacity of 1140 vehicles per second. Degree of saturation for WB through
approach and WB right turning approach was noted as highest as 0.86. Degree of saturation
for NB through traffic was noted as 0.35 which is lowest value for all approaches. According
to ARR 123, as highest degree of saturation is within 0.8 and 0.9, the intersection is operating
under satisfactory functional conditions.
32nd
Australian Transport Research Forum 11 | P a g e
Table 7: Lane group capacity, control delay and LOS determination (HCM method)
Table 8: Lane group capacity and delay (ARRB 123)
5.3 Using Micro-simulation Approach
Table 9 presented the capacity calculations in micro-simulation analysis. Converting the
micro-simulation flow values in to the capacity values with saturation flow rate of 1800, lane
group capacity is shown in the same table. Maximum capacity under the current phase
arrangement is attained at 1109 vehicles per hour for WB through traffic approach and EB
through traffic approach. Degree of saturation indicator showed that WB through traffic
approach has exceeded the values of 0.85. According to HCM intersection status criteria, the
WB through approach was noted near capacity condition. WB right turn approach and EB
right turn traffic approach is displaying the value of v/c ratio of 0.79. WB through traffic
approach and WB right turning traffic approach was noted with v/c ratio of 0.86 and 0.84.
Contrary to the analytical approaches, NB through approach shows as lowest v/c ratio of 0.37.
AIMSUN calculates section wise delays. It was observed that vehicles at WB section have
highest delay values of 55.69 seconds. These values are obtained during first fifteen minutes
of simulation with zero initial queues. Minimum delay is observed at NB approach with 37.9
TH RT TH RT TH RT TH RT
Adjusted flow rate, v (veh/h) 844 212 980 184 384 80 632 164
Saturation flow rate, s (veh/h) 3619 1719 3619 1719 3619 1719 3619 1719
Phase A G A G E D E D
Lane group capacity, c=s(g/C), (veh/h) 1116 244 1116 244 1057 215 1057 215
v/c ratio, X 0.76 0.87 0.88 0.75 0.36 0.37 0.60 0.76
Flow ratio, v/s 0.23 0.12 0.27 0.11 0.11 0.05 0.17 0.10
Total Green ratio, g/c 0.31 0.14 0.31 0.14 0.29 0.13 0.29 0.13
Uniform delay, d1= 37.43 50.42 39.36 49.50 33.68 48.18 36.47 50.78
Delay, d = d1(PF) +d2+d3 (s/veh) 42.386 92.514 50.438 71.271 34.652 53.126 39.009 76.259
LOS by lane group (Exhibit 16-2) D F D E C D D E
Delay, Approach
Intersection delay 49.61
EB WB NB SB
52.45 53.73 37.84 46.68
TH RT TH RT TH RT TH RT
flow rate, q (veh/h) 782 211 984 225 377 100 652 147
Avg. number of arrivals qc (veh/cycle) 26.067 7.0333 32.8 7.5 12.567 3.3333 21.733 4.9
Saturation flow rate, s (veh/h) 3700 1850 3700 1850 3700 1850 3700 1850
Phase A G A G E D E D
Lane group capacity, Q=s(g/C), (veh/h) 1140 263 1140 263 1080 231 1080 231
Degree of saturation, x = q/Q 0.69 0.80 0.86 0.86 0.35 0.43 0.60 0.64
Arrival Flow ratio,y = q/s 0.21 0.11 0.27 0.12 0.10 0.05 0.18 0.08
Total Green ratio, u=g/c 0.31 0.14 0.31 0.14 0.29 0.13 0.29 0.13
Delay, D (number of vehicles) 7.75 3.65 11.88 4.60 3.20 1.06 6.33 1.91
Delay, d (sec) 35.67 62.20 43.47 73.54 30.59 38.15 34.95 46.87
Approach Delay, (sec)
Intersection Delay, (sec)
EB WB NB SB
41.31 49.07 32.17 37.14
41.80
32nd
Australian Transport Research Forum 12 | P a g e
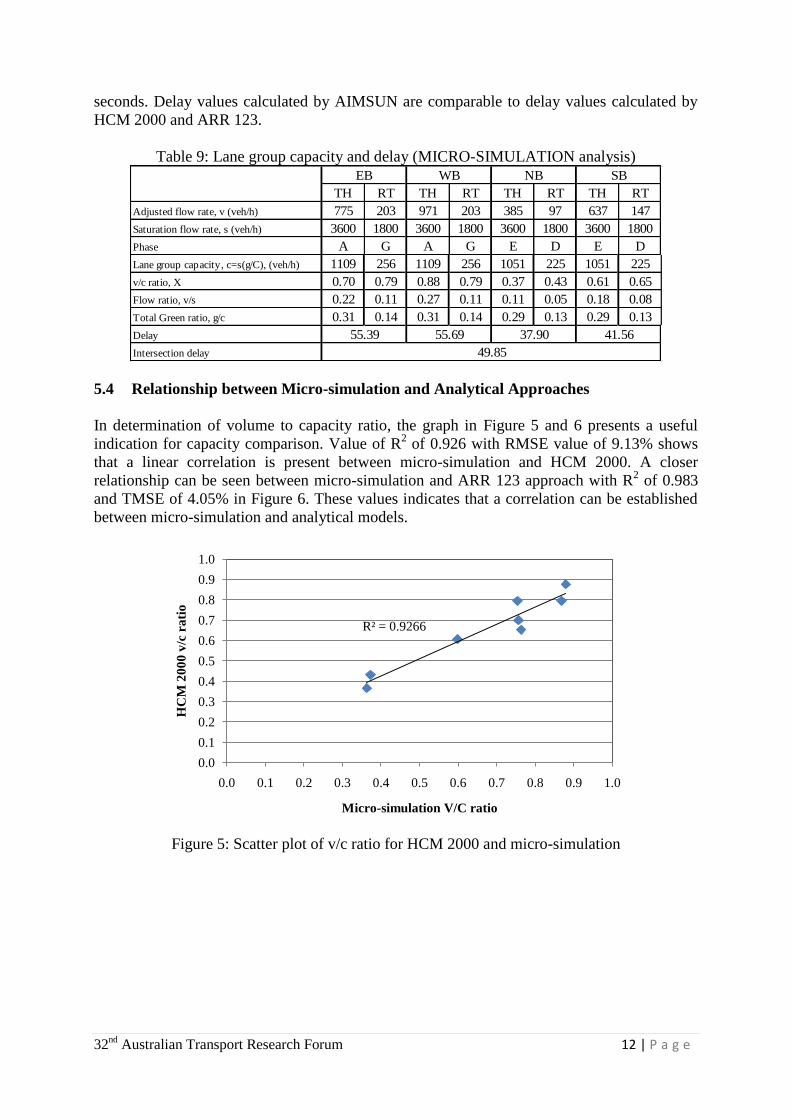
seconds. Delay values calculated by AIMSUN are comparable to delay values calculated by
HCM 2000 and ARR 123.
Table 9: Lane group capacity and delay (MICRO-SIMULATION analysis)
TH RT TH RT TH RT TH RT
Adjusted flow rate, v (veh/h) 775 203 971 203 385 97 637 147
Saturation flow rate, s (veh/h) 3600 1800 3600 1800 3600 1800 3600 1800
Phase A G A G E D E D
Lane group capacity, c=s(g/C), (veh/h) 1109 256 1109 256 1051 225 1051 225
v/c ratio, X 0.70 0.79 0.88 0.79 0.37 0.43 0.61 0.65
Flow ratio, v/s 0.22 0.11 0.27 0.11 0.11 0.05 0.18 0.08
Total Green ratio, g/c 0.31 0.14 0.31 0.14 0.29 0.13 0.29 0.13
Delay
Intersection delay 49.85
EB WB NB SB
55.39 55.69 37.90 41.56
5.4 Relationship between Micro-simulation and Analytical Approaches
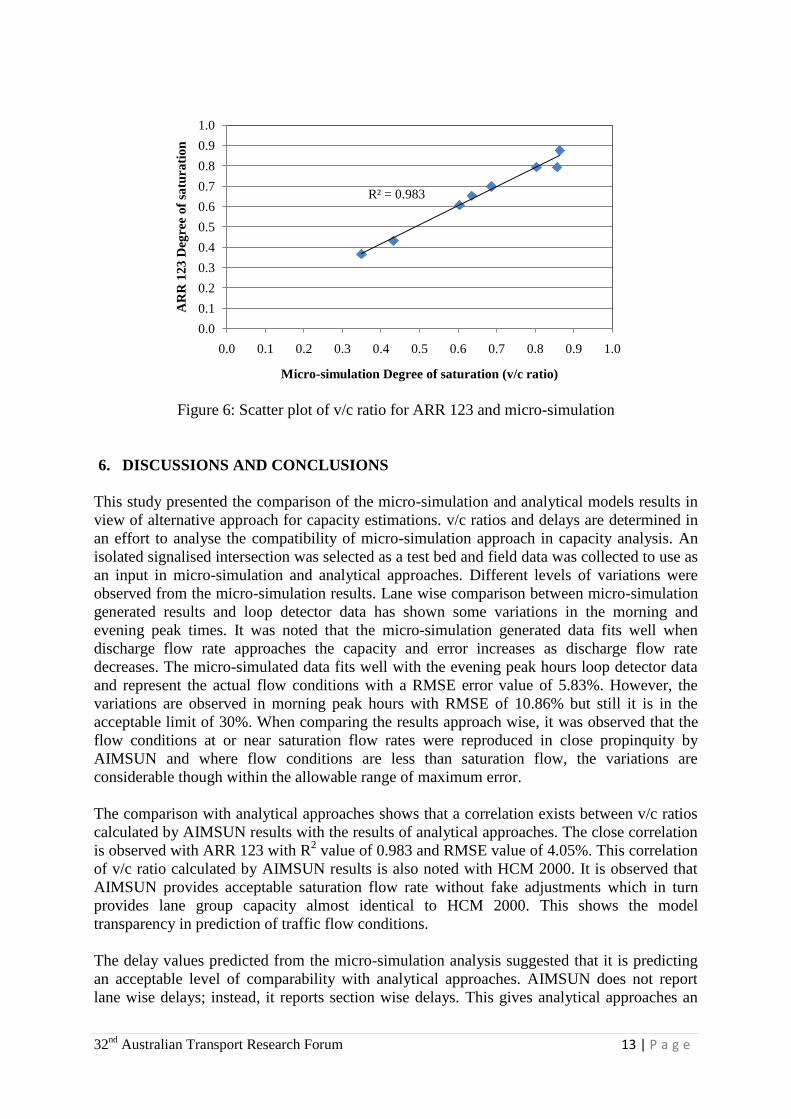
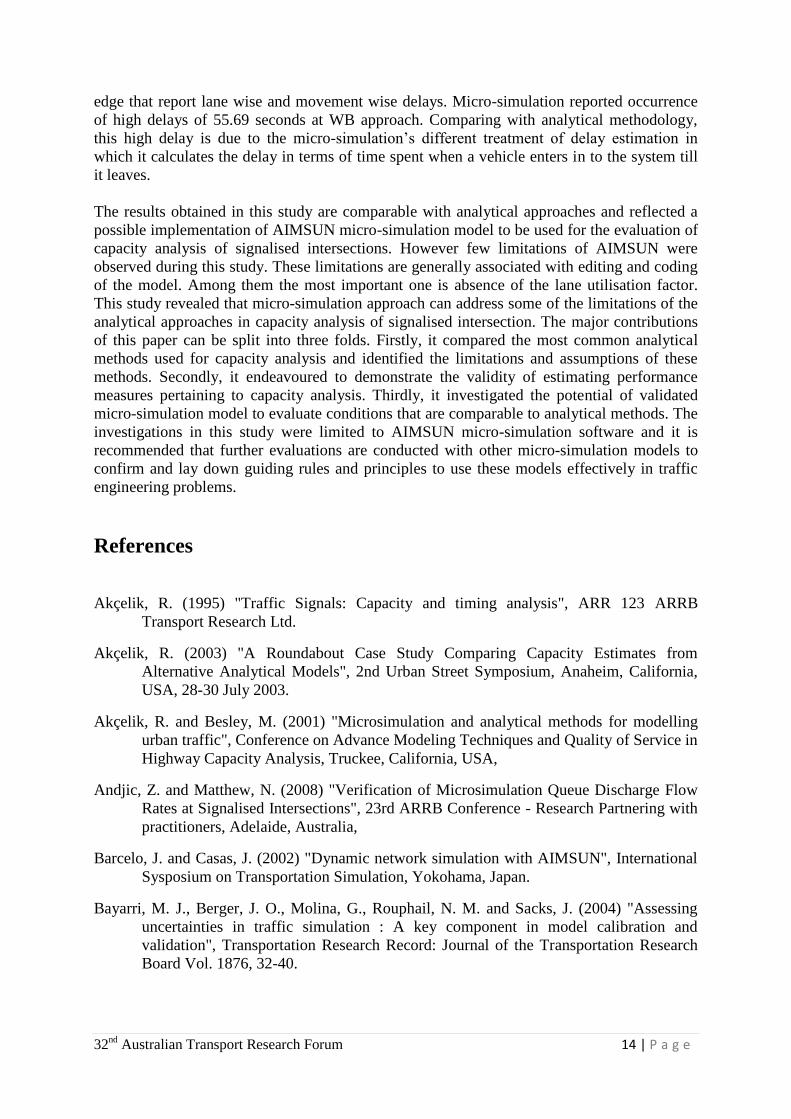
In determination of volume to capacity ratio, the graph in Figure 5 and 6 presents a useful
indication for capacity comparison. Value of R2 of 0.926 with RMSE value of 9.13% shows
that a linear correlation is present between micro-simulation and HCM 2000. A closer
relationship can be seen between micro-simulation and ARR 123 approach with R2 of 0.983
and TMSE of 4.05% in Figure 6. These values indicates that a correlation can be established
between micro-simulation and analytical models.
Figure 5: Scatter plot of v/c ratio for HCM 2000 and micro-simulation
R² = 0.9266
0.0
0.1
0.2
0.3
0.4
0.5
0.6
0.7
0.8
0.9
1.0
0.0 0.1 0.2 0.3 0.4 0.5 0.6 0.7 0.8 0.9 1.0
HC
M 2
00
0 v
/c r
ati
o
Micro-simulation V/C ratio
32nd
Australian Transport Research Forum 13 | P a g e
Figure 6: Scatter plot of v/c ratio for ARR 123 and micro-simulation
6. DISCUSSIONS AND CONCLUSIONS
This study presented the comparison of the micro-simulation and analytical models results in
view of alternative approach for capacity estimations. v/c ratios and delays are determined in
an effort to analyse the compatibility of micro-simulation approach in capacity analysis. An
isolated signalised intersection was selected as a test bed and field data was collected to use as
an input in micro-simulation and analytical approaches. Different levels of variations were
observed from the micro-simulation results. Lane wise comparison between micro-simulation
generated results and loop detector data has shown some variations in the morning and
evening peak times. It was noted that the micro-simulation generated data fits well when
discharge flow rate approaches the capacity and error increases as discharge flow rate
decreases. The micro-simulated data fits well with the evening peak hours loop detector data
and represent the actual flow conditions with a RMSE error value of 5.83%. However, the
variations are observed in morning peak hours with RMSE of 10.86% but still it is in the
acceptable limit of 30%. When comparing the results approach wise, it was observed that the
flow conditions at or near saturation flow rates were reproduced in close propinquity by
AIMSUN and where flow conditions are less than saturation flow, the variations are
considerable though within the allowable range of maximum error.
The comparison with analytical approaches shows that a correlation exists between v/c ratios
calculated by AIMSUN results with the results of analytical approaches. The close correlation
is observed with ARR 123 with R2 value of 0.983 and RMSE value of 4.05%. This correlation
of v/c ratio calculated by AIMSUN results is also noted with HCM 2000. It is observed that
AIMSUN provides acceptable saturation flow rate without fake adjustments which in turn
provides lane group capacity almost identical to HCM 2000. This shows the model
transparency in prediction of traffic flow conditions.
The delay values predicted from the micro-simulation analysis suggested that it is predicting
an acceptable level of comparability with analytical approaches. AIMSUN does not report
lane wise delays; instead, it reports section wise delays. This gives analytical approaches an
R² = 0.983
0.0
0.1
0.2
0.3
0.4
0.5
0.6
0.7
0.8
0.9
1.0
0.0 0.1 0.2 0.3 0.4 0.5 0.6 0.7 0.8 0.9 1.0
AR
R 1
23
Deg
ree
of
satu
rati
on
Micro-simulation Degree of saturation (v/c ratio)
32nd
Australian Transport Research Forum 14 | P a g e
edge that report lane wise and movement wise delays. Micro-simulation reported occurrence
of high delays of 55.69 seconds at WB approach. Comparing with analytical methodology,
this high delay is due to the micro-simulation’s different treatment of delay estimation in
which it calculates the delay in terms of time spent when a vehicle enters in to the system till
it leaves.
The results obtained in this study are comparable with analytical approaches and reflected a
possible implementation of AIMSUN micro-simulation model to be used for the evaluation of
capacity analysis of signalised intersections. However few limitations of AIMSUN were
observed during this study. These limitations are generally associated with editing and coding
of the model. Among them the most important one is absence of the lane utilisation factor.
This study revealed that micro-simulation approach can address some of the limitations of the
analytical approaches in capacity analysis of signalised intersection. The major contributions
of this paper can be split into three folds. Firstly, it compared the most common analytical
methods used for capacity analysis and identified the limitations and assumptions of these
methods. Secondly, it endeavoured to demonstrate the validity of estimating performance
measures pertaining to capacity analysis. Thirdly, it investigated the potential of validated
micro-simulation model to evaluate conditions that are comparable to analytical methods. The
investigations in this study were limited to AIMSUN micro-simulation software and it is
recommended that further evaluations are conducted with other micro-simulation models to
confirm and lay down guiding rules and principles to use these models effectively in traffic
engineering problems.
References
Akçelik, R. (1995) "Traffic Signals: Capacity and timing analysis", ARR 123 ARRB
Transport Research Ltd.
Akçelik, R. (2003) "A Roundabout Case Study Comparing Capacity Estimates from
Alternative Analytical Models", 2nd Urban Street Symposium, Anaheim, California,
USA, 28-30 July 2003.
Akçelik, R. and Besley, M. (2001) "Microsimulation and analytical methods for modelling
urban traffic", Conference on Advance Modeling Techniques and Quality of Service in
Highway Capacity Analysis, Truckee, California, USA,
Andjic, Z. and Matthew, N. (2008) "Verification of Microsimulation Queue Discharge Flow
Rates at Signalised Intersections", 23rd ARRB Conference - Research Partnering with
practitioners, Adelaide, Australia,
Barcelo, J. and Casas, J. (2002) "Dynamic network simulation with AIMSUN", International
Sysposium on Transportation Simulation, Yokohama, Japan.
Bayarri, M. J., Berger, J. O., Molina, G., Rouphail, N. M. and Sacks, J. (2004) "Assessing
uncertainties in traffic simulation : A key component in model calibration and
validation", Transportation Research Record: Journal of the Transportation Research
Board Vol. 1876, 32-40.
32nd
Australian Transport Research Forum 15 | P a g e
Buckholz, J. W. (2009) "Level of service for oversaturated conditions: A proposed solution
for signalized intersections", ITE Journal (Institute of Transportation Engineers) Vol.
79, 1, 48-53.
Economic Evaluation Manual (2008) New Zealand Transport Agency.
Fang, F. C. and Elefteriadou, L. (2005) "Some guidelines for selecting microsimulation
models for interchange traffic operational analysis", Journal of Transportation
Engineering Vol. 131, 7, 535-543.
Gagnon, C., Sadek, A. W., Touchette, A. and Smith, M. (2008) "Calibration potential of
common analytical and microsimulation roundabout models: New England case
study", Transportation Research Record: Journal of the Transportation Research Board
Vol. 2071, 77-86.
Highway Capacity Manual, Ed. (2000) Highway Capacity Manual. Washington D.C, National
Research Council
Manstetten, D., Krautter, W. and Schwab, T. (1998) "Traffic Simulation Supporting Urban
Control System Development", Proceedings of the 4th World conference on ITS,
Seoul.
McGhee, C. and Arnold, E. (1997) "Review and Evaluation of Methods for Analyzing
Capacity at Signalized Intersections", Transportation Research Record: Journal of the
Transportation Research Board Vol. 1572, 1, 160-166.
Rajasakran, R. A. (2008) "AIMSUN Micro-Simulation- A Practical Application: Micro-
Simulation of the N1 Freeway", 27th Southern African Transport Conference (SATC
2008), Pretoria, South Africa.
Ranjitkar, P., Nakatsuji, T. and Kawamua, A. (2005) "Car-following Models: An Experiment
Based Benchmarking", Journal of Eastern Asia Society for Transportation Studies Vol.
6, 1582-1596.
Wan, B., Rouphail, N. and Sacks, J. (2005) "Failure Detection and Diagnosis in Micro-
Simulation Traffic Models", 154 National Institute of Statistical Sciences.
Xin, W., Houdos, J., Michalopoulos, P. and Davis, G. (2008) "The Less-than-perfect Driver:
A Model of Collision-inclusive Car-following Behavior", Transportation Research
Record: Journal of the Transportation Research Board Vol. 2088, 1, 126-137.


![Signalised Intersections [170309]](https://img.pdfslide.us/doc/110x75/577cde291a28ab9e78ae8510/signalised-intersections-170309.jpg)