Embed Size (px)
Citation preview
www.DLG.org
DLG Expert report 9/2017
Capacitive design of aseptic filling and sealing machines
2
DLG Expert report 9/2017
Introduction
Aseptic methods are often considered to be the ultimate supreme discipline in the filling sector. Despite this, the design of such methods initially takes the same parameters into account as are used for standard filling systems. These include for instance the targeted performance rate, the nature of the packaging materials and the products. However, in most cases aseptic filling and sealing machines involve higher procurement costs. For an aseptic filling system to be used effectively and cost-efficiently over a long period as well, aspects such as the number of container formats, the number of product changes, product cycles and maintenance must be examined in greater detail. An aseptic system and the operator can only demonstrate that the requirements set are fulfilled over a relatively long operating period and if consideration is given to the framework conditions. Accordingly the questions arising are: when can an aseptic filling and sealing system be termed effective and efficient, and what must be taken into account in the capacitive design?
Capacity, effectiveness and efficiency
The terms capacity, effectiveness and efficiency are closely connected when designing aseptic filling and closing machines.
The first consideration in the design is the future capacity of a new system. This means that a certain number of staff, machines, materials to be filled, media and (storage) space are available for a defined period, thus initially creating the potential for production. The consideration of capacity alone is not, however, sufficient. The above upstream conditions must be put to effective and efficient use so that the desired capacity can in fact be achieved. Doing the right things can be described as effective, while doing the things correctly is described as efficient [1]. For example, just carrying out neces-sary maintenance is not sufficient. It must be carried out with consideration given to the manufacturer’s specifications.
3
Capacitive design of aseptic filling and sealing machines
This means selecting the right timing, the right materials, tools, and above all trained personnel. Another example would be carrying out a change of format. If this is not carried out correctly, it can lead to loss of time and hence to a drop in the machinery or production line efficiency.
Only if capacity, effectiveness and efficiency are all considered can high scores be achieved in performance tests in accordance with DIN 8728[2].
Effective running time of the filling and sealing machine
Once the capacitive framework parameters have been established, the matching filling and sealing machine has to be designed. The standard DIN 8782 can supply valuable support for selecting the right machine. Above all the available pro-duction time or the available working time is crucial. This working time is reduced to the effective running time by secondary (non-productive) times, external machine or plant malfunction times and machine-related or plant-related malfunction times. While malfunction times, based on test runs, are often allowed for on a percentage basis, secondary times have a direct influence on the daily, weekly or annual performance. The most important secondary times include changing format parts, changing products, starting-up, running-down and maintenance times. If enquiries are made of a manufacturer about a new filling and sealing machine, details of these times should also be requested. However, it should be noted that each secondary time component on its own can be wrongly interpreted. A short CIP/SIP time [3] initially sounds positive, but loses informative value if intermediate cleaning, sterilisation or flushing operations have to be carried out during production. Only the total time inputs for CIP/SIP and any intermediate cleaning operations etc. ensure comparability of the different filling and sealing machines. Another example is the production cycle – the time between two CIP/SIP operations. An apparently long production cycle loses value if this is interrupted to maintain the hygiene level.
Ideally an effectiveness calculation matching the filling system is supplied to the food and beverage producer. To produce an informative effectiveness calculation, the machine manufacturer and producer must cooperate closely with one another. For instance, the producer must supply data on the product, packaging materials and proposed working times, while the manufacturer must supply technical information on the machinery.
Effectiveness calculation – hourly performance rate or annual performance rate
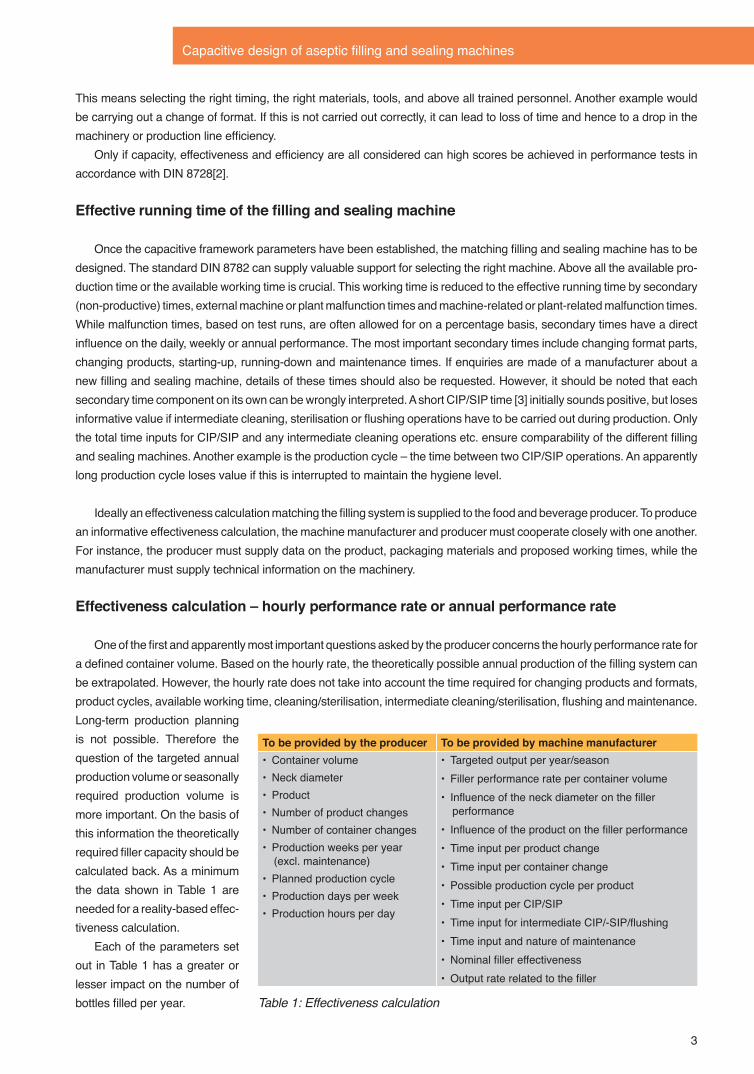
One of the first and apparently most important questions asked by the producer concerns the hourly performance rate for a defined container volume. Based on the hourly rate, the theoretically possible annual production of the filling system can be extrapolated. However, the hourly rate does not take into account the time required for changing products and formats, product cycles, available working time, cleaning/sterilisation, intermediate cleaning/sterilisation, flushing and maintenance. Long-term production planning is not possible. Therefore the question of the targeted annual production volume or seasonally required production volume is more important. On the basis of this information the theoretically required filler capacity should be calculated back. As a minimum the data shown in Table 1 are needed for a reality-based effec-tiveness calculation.
Each of the parameters set out in Table 1 has a greater or lesser impact on the number of bottles filled per year.
To be provided by the producer To be provided by machine manufacturer• Container volume• Neck diameter• Product• Number of product changes• Number of container changes• Production weeks per year
(excl. maintenance)• Planned production cycle• Production days per week • Production hours per day
• Targeted output per year/season• Filler performance rate per container volume• Influence of the neck diameter on the filler
performance• Influence of the product on the filler performance• Time input per product change• Time input per container change• Possible production cycle per product • Time input per CIP/SIP• Time input for intermediate CIP/-SIP/flushing• Time input and nature of maintenance• Nominal filler effectiveness• Output rate related to the filler
Table 1: Effectiveness calculation
4
DLG Expert report 9/2017
Influence on the performance – container volume and neck diameter
Generally fillers are used to fill a number of different container volumes. Even if a requested filling system has a capacity of for example 24,000 bot/h with 1,000 ml bottles, it may possibly also be able to fill 1,500 ml bottles, but at a lower hourly capacity. This case can also occur with different neck diameters. Depending on what container volume is to be filled, in future as well, lower performance rates must be taken into account. Table 2 shows an example.
Set values for the examples
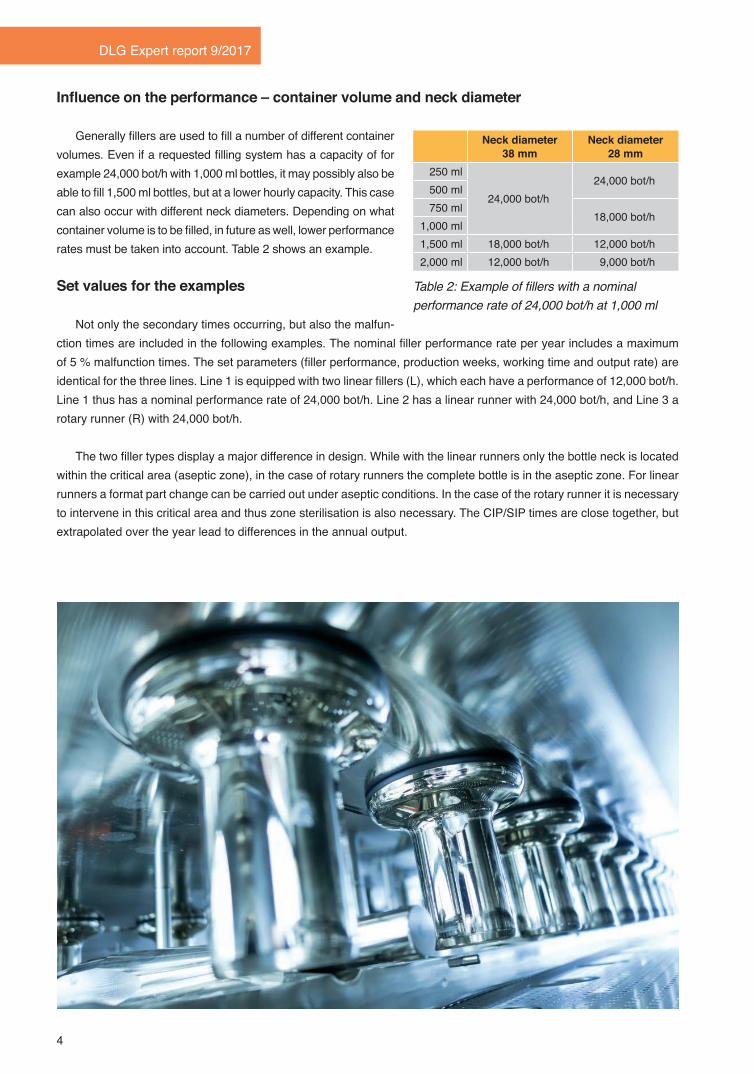
Not only the secondary times occurring, but also the malfun-ction times are included in the following examples. The nominal filler performance rate per year includes a maximum of 5 % malfunction times. The set parameters (filler performance, production weeks, working time and output rate) are identical for the three lines. Line 1 is equipped with two linear fillers (L), which each have a performance of 12,000 bot/h. Line 1 thus has a nominal performance rate of 24,000 bot/h. Line 2 has a linear runner with 24,000 bot/h, and Line 3 a rotary runner (R) with 24,000 bot/h.
The two filler types display a major difference in design. While with the linear runners only the bottle neck is located within the critical area (aseptic zone), in the case of rotary runners the complete bottle is in the aseptic zone. For linear runners a format part change can be carried out under aseptic conditions. In the case of the rotary runner it is necessary to intervene in this critical area and thus zone sterilisation is also necessary. The CIP/SIP times are close together, but extrapolated over the year lead to differences in the annual output.
Neck diameter 38 mm
Neck diameter 28 mm
250 ml
24,000 bot/h24,000 bot/h
500 ml750 ml
18,000 bot/h1,000 ml1,500 ml 18,000 bot/h 12,000 bot/h2,000 ml 12,000 bot/h 9,000 bot/h
Table 2: Example of fillers with a nominal performance rate of 24,000 bot/h at 1,000 ml
5
Capacitive design of aseptic fi lling and sealing machines
Basic performance rate
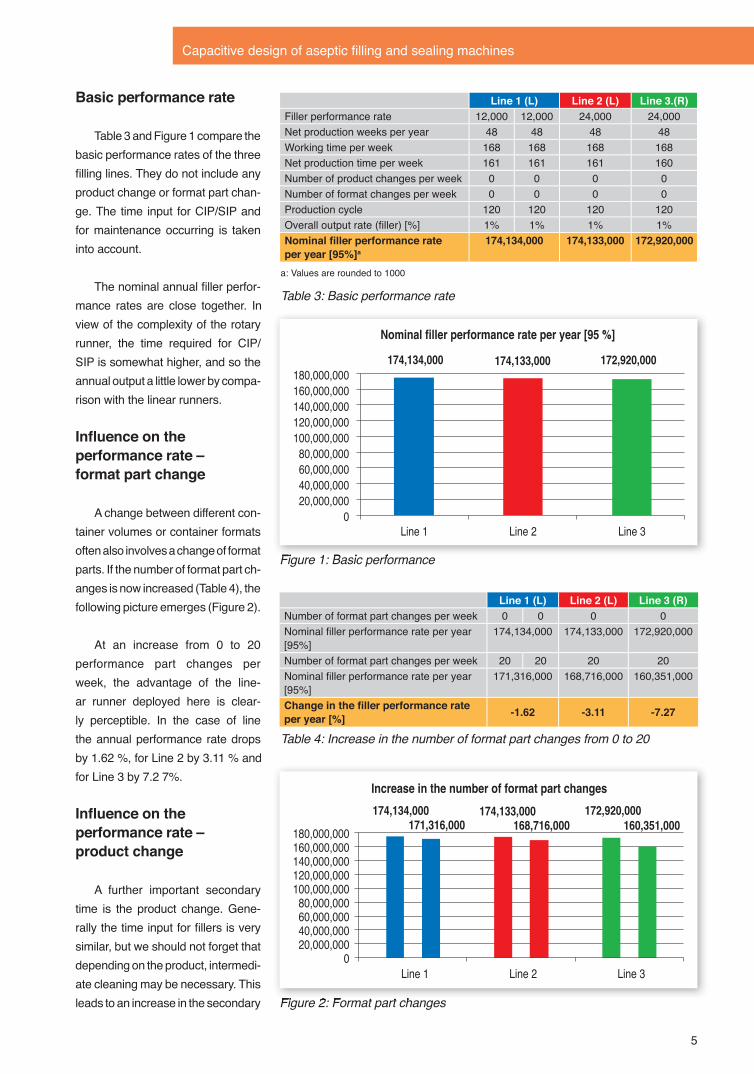
Table 3 and Figure 1 compare the basic performance rates of the three fi lling lines. They do not include any product change or format part chan-ge. The time input for CIP/SIP and for maintenance occurring is taken into account.
The nominal annual fi ller perfor-mance rates are close together. In view of the complexity of the rotary runner, the time required for CIP/SIP is somewhat higher, and so the annual output a little lower by compa-rison with the linear runners.
Infl uence on the performance rate – format part change
A change between different con-tainer volumes or container formats often also involves a change of format parts. If the number of format part ch-anges is now increased (Table 4), the following picture emerges (Figure 2).
At an increase from 0 to 20 performance part changes per week, the advantage of the line-ar runner deployed here is clear-ly perceptible. In the case of line 1 the annual performance rate drops by 1.62 %, for Line 2 by 3.11 % and for Line 3 by 7.2 7%.
Infl uence on the performance rate – product change
A further important secondary time is the product change. Gene-rally the time input for fi llers is very similar, but we should not forget that depending on the product, intermedi-ate cleaning may be necessary. This leads to an increase in the secondary
Line 1 (L) Line 2 (L) Line 3.(R)Filler performance rate 12,000 12,000 24,000 24,000Net production weeks per year 48 48 48 48Working time per week 168 168 168 168Net production time per week 161 161 161 160Number of product changes per week 0 0 0 0Number of format changes per week 0 0 0 0Production cycle 120 120 120 120Overall output rate (fi ller) [%] 1% 1% 1% 1%Nominal fi ller performance rate per year [95%]a
174,134,000 174,133,000 172,920,000
a: Values are rounded to 1000
Line 1 (L) Line 2 (L) Line 3 (R)Number of format part changes per week 0 0 0 0Nominal fi ller performance rate per year [95%]
174,134,000 174,133,000 172,920,000
Number of format part changes per week 20 20 20 20Nominal fi ller performance rate per year [95%]
171,316,000 168,716,000 160,351,000
Change in the fi ller performance rate per year [%] -1.62 -3.11 -7.27
Table 3: Basic performance rate
Table 4: Increase in the number of format part changes from 0 to 20
Figure 1: Basic performance
Figure 2: Format part changes
Figure 1: Basic performance
174,134,000 174,133,000 172,920,000
0 20,000,000 40,000,000 60,000,000 80,000,000
100,000,000 120,000,000 140,000,000 160,000,000 180,000,000
Line 1 Line 2 Line 3
Nominal filler performance rate per year [95 %]
174,134,000 174,133,000 172,920,000 171,316,000 168,716,000 160,351,000
0 20,000,000 40,000,000 60,000,000 80,000,000
100,000,000 120,000,000 140,000,000 160,000,000 180,000,000
Line 1 Line 2 Line 3
Increase in the number of format part changes
174,134,000 174,133,000 172,920,000 163,298,000 163,298,000 162,085,000
0 20,000,000 40,000,000 60,000,000 80,000,000
100,000,000 120,000,000 140,000,000 160,000,000 180,000,000
Line 1 Line 2 Line 3
Increase in the number of format changes
139,766,000
159,484,000 166,058,000 169,344,000 171,316,000
172,630,000
0.00% 14.11% 18.81%
21.16% 22.57% 23.51%
0%
10%
20%
30%
40%
50%
60%
70%
80%
90%
100%
0
20,000,000
40,000,000
60,000,000
80,000,000
100,000,000
120,000,000
140,000,000
160,000,000
180,000,000
24 48 72 96 120 144
Production cycle vs. annual output
Increase in annual output Percentage increase production cycle Expon. (risk)
14.11% 18.81% 21.16% 22.57% 23.51% 0%
100%
200%
300%
400%
500%
0%
100%
200%
300%
400%
500%
600%
24 48 72 96 120 144
Percentage Increase
Percentage increase in annual output Percentage increase in production cycle
Annu
al o
utpu
t (bo
t/a)
Figure 2: Format part changes
174,134,000 174,133,000 172,920,000
0 20,000,000 40,000,000 60,000,000 80,000,000
100,000,000 120,000,000 140,000,000 160,000,000 180,000,000
Line 1 Line 2 Line 3
Nominal filler performance rate per year [95 %]
174,134,000 174,133,000 172,920,000 171,316,000 168,716,000 160,351,000
0 20,000,000 40,000,000 60,000,000 80,000,000
100,000,000 120,000,000 140,000,000 160,000,000 180,000,000
Line 1 Line 2 Line 3
Increase in the number of format part changes
174,134,000 174,133,000 172,920,000 163,298,000 163,298,000 162,085,000
0 20,000,000 40,000,000 60,000,000 80,000,000
100,000,000 120,000,000 140,000,000 160,000,000 180,000,000
Line 1 Line 2 Line 3
Increase in the number of format changes
139,766,000
159,484,000 166,058,000 169,344,000 171,316,000
172,630,000
0.00% 14.11% 18.81%
21.16% 22.57% 23.51%
0%
10%
20%
30%
40%
50%
60%
70%
80%
90%
100%
0
20,000,000
40,000,000
60,000,000
80,000,000
100,000,000
120,000,000
140,000,000
160,000,000
180,000,000
24 48 72 96 120 144
Production cycle vs. annual output
Increase in annual output Percentage increase production cycle Expon. (risk)
14.11% 18.81% 21.16% 22.57% 23.51% 0%
100%
200%
300%
400%
500%
0%
100%
200%
300%
400%
500%
600%
24 48 72 96 120 144
Percentage Increase
Percentage increase in annual output Percentage increase in production cycle
Annu
al o
utpu
t (bo
t/a)
6
DLG Expert report 9/2017
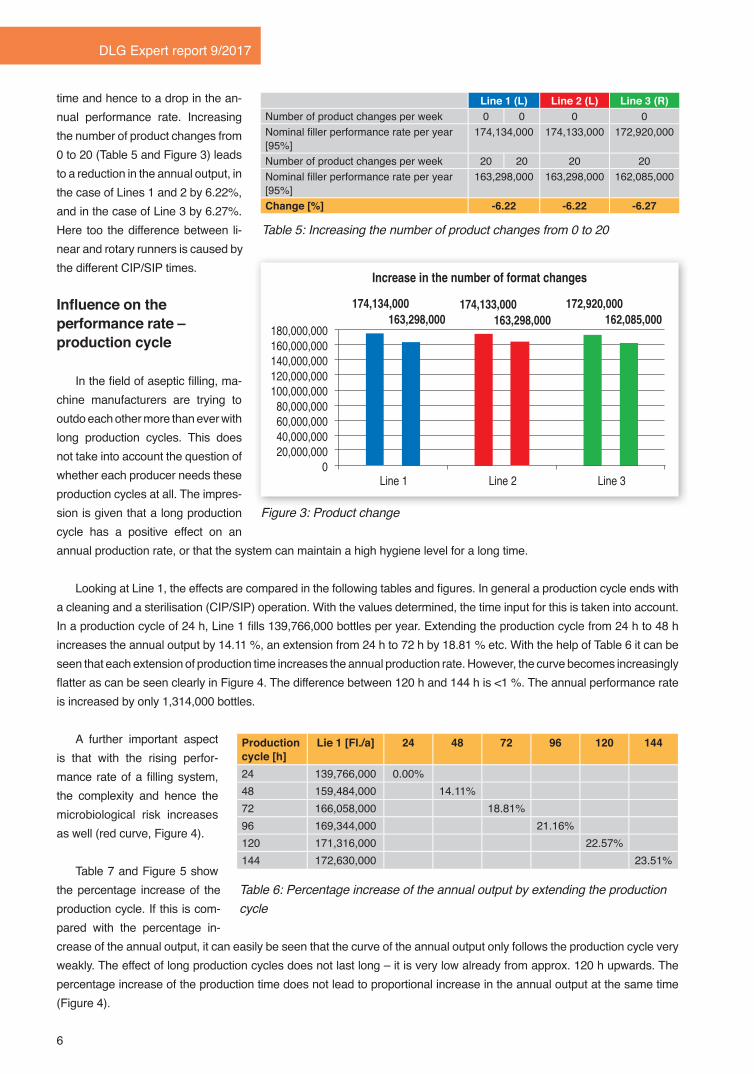
time and hence to a drop in the an-nual performance rate. Increasing the number of product changes from 0 to 20 (Table 5 and Figure 3) leads to a reduction in the annual output, in the case of Lines 1 and 2 by 6.22%, and in the case of Line 3 by 6.27%. Here too the difference between li-near and rotary runners is caused by the different CIP/SIP times.
Infl uence on the performance rate – production cycle
In the fi eld of aseptic fi lling, ma-chine manufacturers are trying to outdo each other more than ever with long production cycles. This does not take into account the question of whether each producer needs these production cycles at all. The impres-sion is given that a long production cycle has a positive effect on an annual production rate, or that the system can maintain a high hygiene level for a long time.
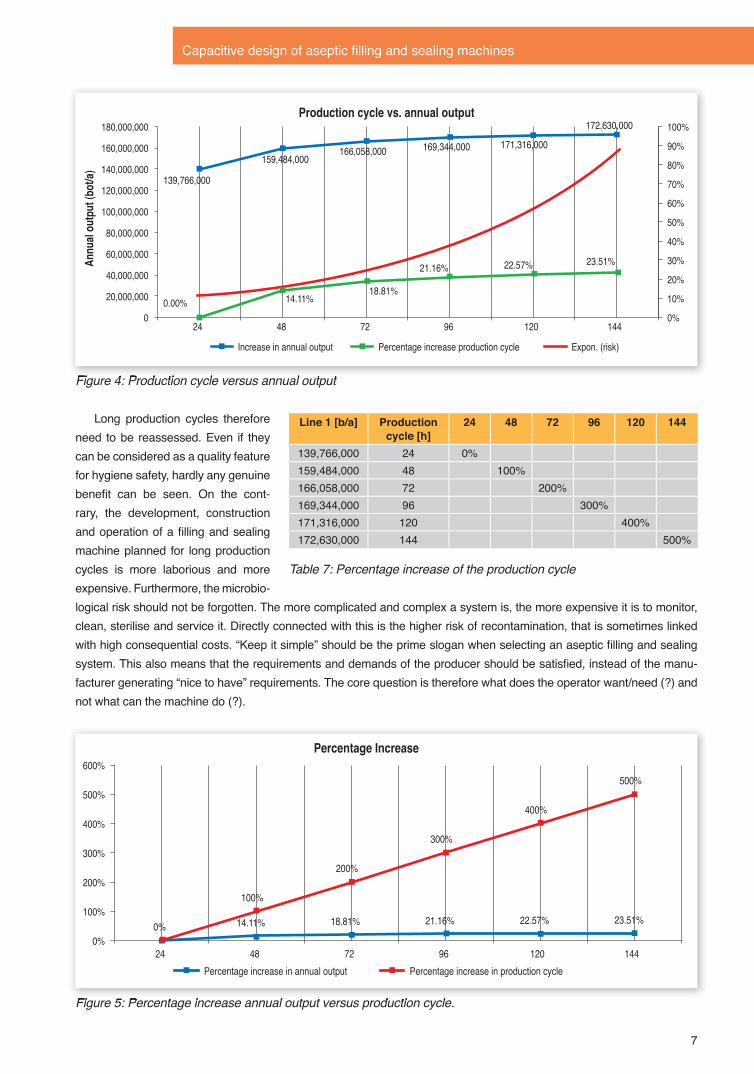
Looking at Line 1, the effects are compared in the following tables and fi gures. In general a production cycle ends with a cleaning and a sterilisation (CIP/SIP) operation. With the values determined, the time input for this is taken into account. In a production cycle of 24 h, Line 1 fi lls 139,766,000 bottles per year. Extending the production cycle from 24 h to 48 h increases the annual output by 14.11 %, an extension from 24 h to 72 h by 18.81 % etc. With the help of Table 6 it can be seen that each extension of production time increases the annual production rate. However, the curve becomes increasingly fl atter as can be seen clearly in Figure 4. The difference between 120 h and 144 h is <1 %. The annual performance rate is increased by only 1,314,000 bottles.
A further important aspect is that with the rising perfor-mance rate of a fi lling system, the complexity and hence the microbiological risk increases as well (red curve, Figure 4).
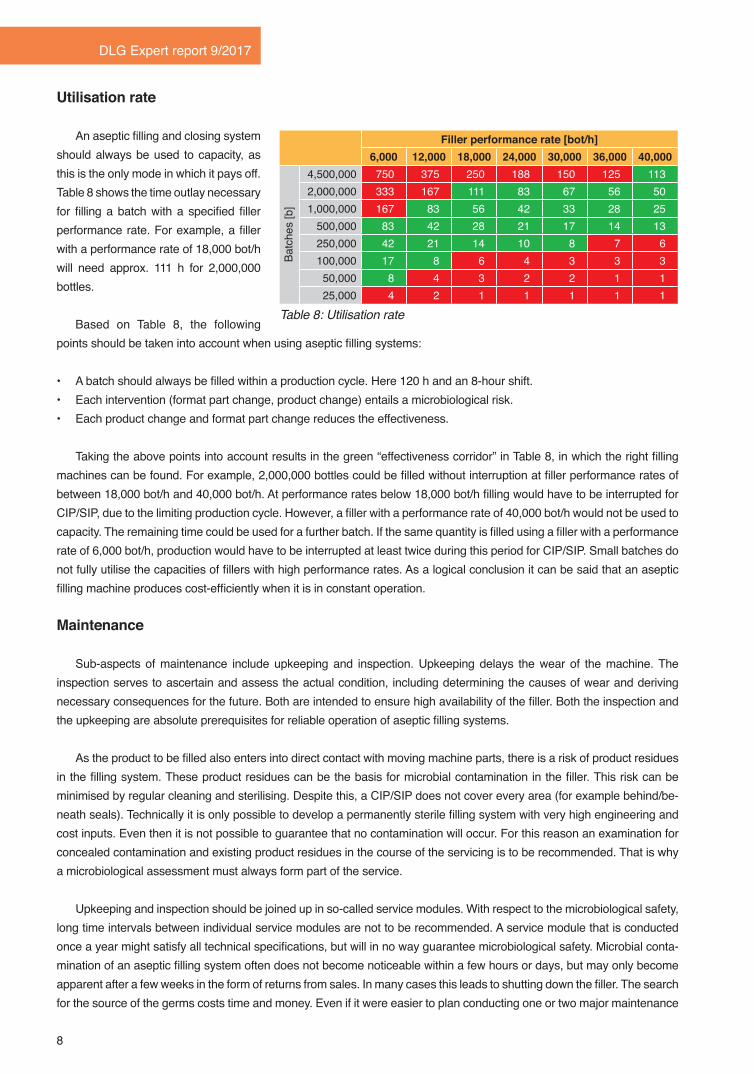
Table 7 and Figure 5 show the percentage increase of the production cycle. If this is com-pared with the percentage in-crease of the annual output, it can easily be seen that the curve of the annual output only follows the production cycle very weakly. The effect of long production cycles does not last long – it is very low already from approx. 120 h upwards. The percentage increase of the production time does not lead to proportional increase in the annual output at the same time (Figure 4).
Line 1 (L) Line 2 (L) Line 3 (R)Number of product changes per week 0 0 0 0Nominal fi ller performance rate per year [95%]
174,134,000 174,133,000 172,920,000
Number of product changes per week 20 20 20 20Nominal fi ller performance rate per year [95%]
163,298,000 163,298,000 162,085,000
Change [%] -6.22 -6.22 -6.27
Table 5: Increasing the number of product changes from 0 to 20
Figure 3: Product change
174,134,000 174,133,000 172,920,000
0 20,000,000 40,000,000 60,000,000 80,000,000
100,000,000 120,000,000 140,000,000 160,000,000 180,000,000
Line 1 Line 2 Line 3
Nominal filler performance rate per year [95 %]
174,134,000 174,133,000 172,920,000 171,316,000 168,716,000 160,351,000
0 20,000,000 40,000,000 60,000,000 80,000,000
100,000,000 120,000,000 140,000,000 160,000,000 180,000,000
Line 1 Line 2 Line 3
Increase in the number of format part changes
174,134,000 174,133,000 172,920,000 163,298,000 163,298,000 162,085,000
0 20,000,000 40,000,000 60,000,000 80,000,000
100,000,000 120,000,000 140,000,000 160,000,000 180,000,000
Line 1 Line 2 Line 3
Increase in the number of format changes
139,766,000
159,484,000 166,058,000 169,344,000 171,316,000
172,630,000
0.00% 14.11% 18.81%
21.16% 22.57% 23.51%
0%
10%
20%
30%
40%
50%
60%
70%
80%
90%
100%
0
20,000,000
40,000,000
60,000,000
80,000,000
100,000,000
120,000,000
140,000,000
160,000,000
180,000,000
24 48 72 96 120 144
Production cycle vs. annual output
Increase in annual output Percentage increase production cycle Expon. (risk)
14.11% 18.81% 21.16% 22.57% 23.51% 0%
100%
200%
300%
400%
500%
0%
100%
200%
300%
400%
500%
600%
24 48 72 96 120 144
Percentage Increase
Percentage increase in annual output Percentage increase in production cycle
Annu
al o
utpu
t (bo
t/a)
Table 6: Percentage increase of the annual output by extending the production cycle
Production cycle [h]
Lie 1 [Fl./a] 24 48 72 96 120 144
24 139,766,000 0.00% 48 159,484,000 14.11% 72 166,058,000 18.81% 96 169,344,000 21.16% 120 171,316,000 22.57% 144 172,630,000 23.51%
7
Capacitive design of aseptic fi lling and sealing machines
Long production cycles therefore need to be reassessed. Even if they can be considered as a quality feature for hygiene safety, hardly any genuine benefi t can be seen. On the cont-rary, the development, construction and operation of a fi lling and sealing machine planned for long production cycles is more laborious and more expensive. Furthermore, the microbio-logical risk should not be forgotten. The more complicated and complex a system is, the more expensive it is to monitor, clean, sterilise and service it. Directly connected with this is the higher risk of recontamination, that is sometimes linked with high consequential costs. “Keep it simple” should be the prime slogan when selecting an aseptic fi lling and sealing system. This also means that the requirements and demands of the producer should be satisfi ed, instead of the manu-facturer generating “nice to have” requirements. The core question is therefore what does the operator want/need (?) and not what can the machine do (?).
Figure 4: Production cycle versus annual output Figure 4: Production cycle versus annual output
174,134,000 174,133,000 172,920,000
0 20,000,000 40,000,000 60,000,000 80,000,000
100,000,000 120,000,000 140,000,000 160,000,000 180,000,000
Line 1 Line 2 Line 3
Nominal filler performance rate per year [95 %]
174,134,000 174,133,000 172,920,000 171,316,000 168,716,000 160,351,000
0 20,000,000 40,000,000 60,000,000 80,000,000
100,000,000 120,000,000 140,000,000 160,000,000 180,000,000
Line 1 Line 2 Line 3
Increase in the number of format part changes
174,134,000 174,133,000 172,920,000 163,298,000 163,298,000 162,085,000
0 20,000,000 40,000,000 60,000,000 80,000,000
100,000,000 120,000,000 140,000,000 160,000,000 180,000,000
Line 1 Line 2 Line 3
Increase in the number of format changes
139,766,000
159,484,000 166,058,000 169,344,000 171,316,000
172,630,000
0.00% 14.11% 18.81%
21.16% 22.57% 23.51%
0%
10%
20%
30%
40%
50%
60%
70%
80%
90%
100%
0
20,000,000
40,000,000
60,000,000
80,000,000
100,000,000
120,000,000
140,000,000
160,000,000
180,000,000
24 48 72 96 120 144
Production cycle vs. annual output
Increase in annual output Percentage increase production cycle Expon. (risk)
14.11% 18.81% 21.16% 22.57% 23.51% 0%
100%
200%
300%
400%
500%
0%
100%
200%
300%
400%
500%
600%
24 48 72 96 120 144
Percentage Increase
Percentage increase in annual output Percentage increase in production cycle
Annu
al o
utpu
t (bo
t/a)
Table 7: Percentage increase of the production cycle
Line 1 [b/a] Production cycle [h]
24 48 72 96 120 144
139,766,000 24 0%159,484,000 48 100%166,058,000 72 200%169,344,000 96 300%171,316,000 120 400%172,630,000 144 500%
Figure 5: Percentage increase annual output versus production cycle. Figure 5: Percentage increase annual output versus production cycle.
174,134,000 174,133,000 172,920,000
0 20,000,000 40,000,000 60,000,000 80,000,000
100,000,000 120,000,000 140,000,000 160,000,000 180,000,000
Line 1 Line 2 Line 3
Nominal filler performance rate per year [95 %]
174,134,000 174,133,000 172,920,000 171,316,000 168,716,000 160,351,000
0 20,000,000 40,000,000 60,000,000 80,000,000
100,000,000 120,000,000 140,000,000 160,000,000 180,000,000
Line 1 Line 2 Line 3
Increase in the number of format part changes
174,134,000 174,133,000 172,920,000 163,298,000 163,298,000 162,085,000
0 20,000,000 40,000,000 60,000,000 80,000,000
100,000,000 120,000,000 140,000,000 160,000,000 180,000,000
Line 1 Line 2 Line 3
Increase in the number of format changes
139,766,000
159,484,000 166,058,000 169,344,000 171,316,000
172,630,000
0.00% 14.11% 18.81%
21.16% 22.57% 23.51%
0%
10%
20%
30%
40%
50%
60%
70%
80%
90%
100%
0
20,000,000
40,000,000
60,000,000
80,000,000
100,000,000
120,000,000
140,000,000
160,000,000
180,000,000
24 48 72 96 120 144
Production cycle vs. annual output
Increase in annual output Percentage increase production cycle Expon. (risk)
14.11% 18.81% 21.16% 22.57% 23.51% 0%
100%
200%
300%
400%
500%
0%
100%
200%
300%
400%
500%
600%
24 48 72 96 120 144
Percentage Increase
Percentage increase in annual output Percentage increase in production cycle
Annu
al o
utpu
t (bo
t/a)
8
DLG Expert report 9/2017
Utilisation rate
An aseptic filling and closing system should always be used to capacity, as this is the only mode in which it pays off. Table 8 shows the time outlay necessary for filling a batch with a specified filler performance rate. For example, a filler with a performance rate of 18,000 bot/h will need approx. 111 h for 2,000,000 bottles.
Based on Table 8, the following points should be taken into account when using aseptic filling systems:
• A batch should always be filled within a production cycle. Here 120 h and an 8-hour shift.• Each intervention (format part change, product change) entails a microbiological risk.• Each product change and format part change reduces the effectiveness.
Taking the above points into account results in the green “effectiveness corridor” in Table 8, in which the right filling machines can be found. For example, 2,000,000 bottles could be filled without interruption at filler performance rates of between 18,000 bot/h and 40,000 bot/h. At performance rates below 18,000 bot/h filling would have to be interrupted for CIP/SIP, due to the limiting production cycle. However, a filler with a performance rate of 40,000 bot/h would not be used to capacity. The remaining time could be used for a further batch. If the same quantity is filled using a filler with a performance rate of 6,000 bot/h, production would have to be interrupted at least twice during this period for CIP/SIP. Small batches do not fully utilise the capacities of fillers with high performance rates. As a logical conclusion it can be said that an aseptic filling machine produces cost-efficiently when it is in constant operation.
Maintenance
Sub-aspects of maintenance include upkeeping and inspection. Upkeeping delays the wear of the machine. The inspection serves to ascertain and assess the actual condition, including determining the causes of wear and deriving necessary consequences for the future. Both are intended to ensure high availability of the filler. Both the inspection and the upkeeping are absolute prerequisites for reliable operation of aseptic filling systems.
As the product to be filled also enters into direct contact with moving machine parts, there is a risk of product residues in the filling system. These product residues can be the basis for microbial contamination in the filler. This risk can be minimised by regular cleaning and sterilising. Despite this, a CIP/SIP does not cover every area (for example behind/be-neath seals). Technically it is only possible to develop a permanently sterile filling system with very high engineering and cost inputs. Even then it is not possible to guarantee that no contamination will occur. For this reason an examination for concealed contamination and existing product residues in the course of the servicing is to be recommended. That is why a microbiological assessment must always form part of the service.
Upkeeping and inspection should be joined up in so-called service modules. With respect to the microbiological safety, long time intervals between individual service modules are not to be recommended. A service module that is conducted once a year might satisfy all technical specifications, but will in no way guarantee microbiological safety. Microbial conta-mination of an aseptic filling system often does not become noticeable within a few hours or days, but may only become apparent after a few weeks in the form of returns from sales. In many cases this leads to shutting down the filler. The search for the source of the germs costs time and money. Even if it were easier to plan conducting one or two major maintenance
Table 8: Utilisation rate
Filler performance rate [bot/h]6,000 12,000 18,000 24,000 30,000 36,000 40,000
Batc
hes
[b]
4,500,000 750 375 250 188 150 125 1132,000,000 333 167 111 83 67 56 501,000,000 167 83 56 42 33 28 25
500,000 83 42 28 21 17 14 13250,000 42 21 14 10 8 7 6100,000 17 8 6 4 3 3 350,000 8 4 3 2 2 1 125,000 4 2 1 1 1 1 1
9
Capacitive design of aseptic filling and sealing machines
operations a year, this would not take into account the microbiological risk. Small preventive service modules conducted at shorter intervals increase the microbiological safety. If the annual time input for one to two major service modules is compared with the time input for a number of small service modules, there is hardly any difference. Ultimately the risk does not lie with the machine manufacturer, but with the operator. The question therefore arises as to whether forcing long maintenance cycles actually represents technological progress.
Upkeeping and inspection are among the most important secondary times for a permanently functioning aseptic filling
system that need to be taken into account for designing the capacity. For organisational and economic reasons both should be carried out at the same time. Admittedly this makes production planning more costly, but unscheduled downtimes can be avoided in this way and scheduled downtimes shortened. Unscheduled downtimes cause costs and lead to loss of time and thus have a direct impact on the effectiveness of an aseptic filling system.
10
DLG Expert report 9/2017
Microbiological risk
The goal of the aseptic system is to enable filling of a beverage-sterile product under aseptic/sterile conditions free of recontamination. The number of product and format part changes, the production cycle, the utilisation rate and the main-tenance all have a direct influence on the capacitive design of aseptic filling and sealing systems. The design of the aseptic filler has an indirect influence on this. Here too the main objective is to minimise the microbiological risk. The critical areas entering into contact with the product should be designed as small and as simple as possible. The more complex a filling system is, the more complicated/costly it is to maintain the permanently aseptic availability. One example here is the “aseptic zone” – the zone in which the product is filled into the bottle. There are a number of different design philosophies on the market for maintaining the aseptic condition, beginning with clean rooms with corresponding classification and extending as far as systems with a positive displacement flow.
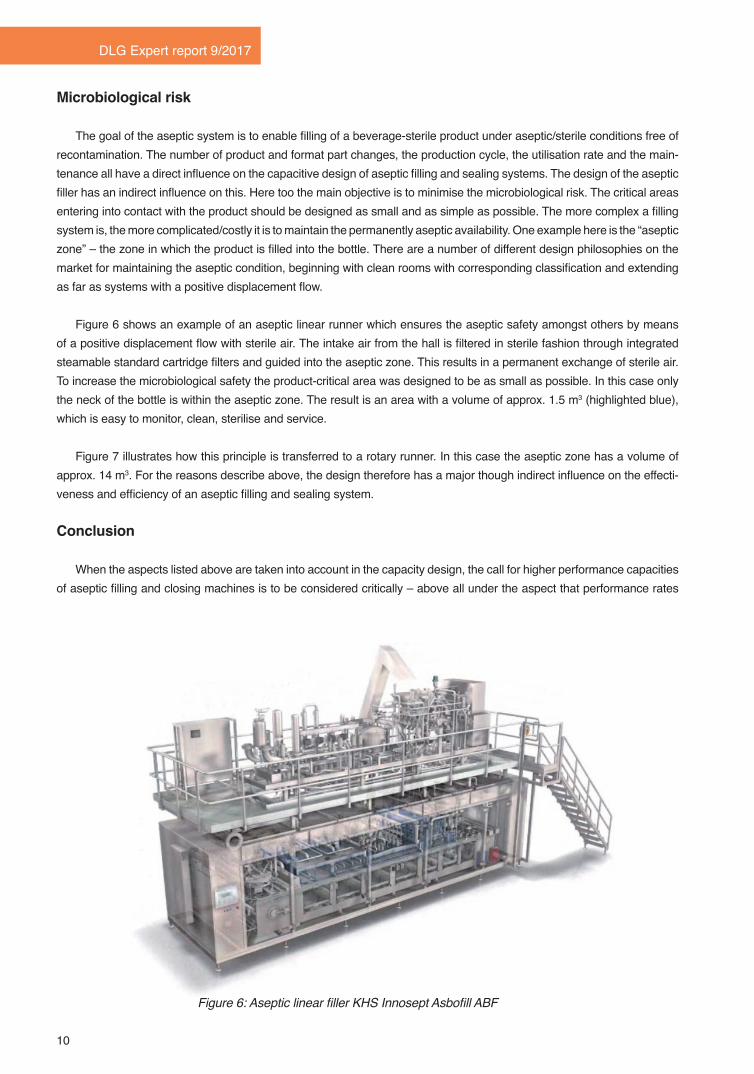
Figure 6 shows an example of an aseptic linear runner which ensures the aseptic safety amongst others by means of a positive displacement flow with sterile air. The intake air from the hall is filtered in sterile fashion through integrated steamable standard cartridge filters and guided into the aseptic zone. This results in a permanent exchange of sterile air. To increase the microbiological safety the product-critical area was designed to be as small as possible. In this case only the neck of the bottle is within the aseptic zone. The result is an area with a volume of approx. 1.5 m3 (highlighted blue), which is easy to monitor, clean, sterilise and service.
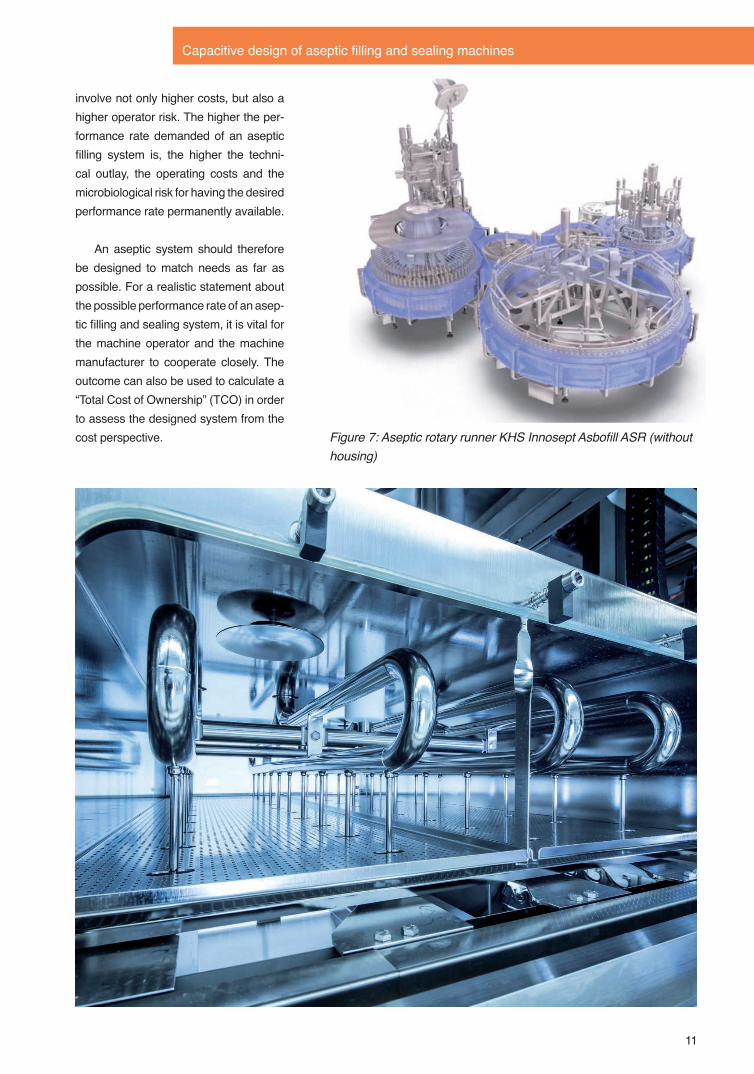
Figure 7 illustrates how this principle is transferred to a rotary runner. In this case the aseptic zone has a volume of approx. 14 m3. For the reasons describe above, the design therefore has a major though indirect influence on the effecti-veness and efficiency of an aseptic filling and sealing system.
Conclusion
When the aspects listed above are taken into account in the capacity design, the call for higher performance capacities of aseptic filling and closing machines is to be considered critically – above all under the aspect that performance rates
Figure 6: Aseptic linear filler KHS Innosept Asbofill ABF
11
Capacitive design of aseptic filling and sealing machines
involve not only higher costs, but also a higher operator risk. The higher the per-formance rate demanded of an aseptic filling system is, the higher the techni-cal outlay, the operating costs and the microbiological risk for having the desired performance rate permanently available.
An aseptic system should therefore be designed to match needs as far as possible. For a realistic statement about the possible performance rate of an asep-tic filling and sealing system, it is vital for the machine operator and the machine manufacturer to cooperate closely. The outcome can also be used to calculate a “Total Cost of Ownership” (TCO) in order to assess the designed system from the cost perspective. Figure 7: Aseptic rotary runner KHS Innosept Asbofill ASR (without
housing)
12
DLG Expert report 9/2017
DLG Expert report: concise information on topical issues in the food industry
Expertise, trends and strategies first-hand. The DLG produces numerous publi-cations informing readers about current issues and developments in the fields of food technology, quality management, sensory analysis and food quality.In the “DLG Expert report” series, experts tackle current issues and provide con-cise information and assistance.
Individual editions of DLG Expert report are available as downloads at www.dlg.org/competence_center_food.html.
Further information on DLG Expert report: DLG e.V., Marketing, Guido Oppenhäuser, email: [email protected]
Sources and abbreviations:1. Peter Ferdinand Drucker (* 19 November 1909 in Vienna; † 11 November 2005 in Claremont) was an Austrian-born
US-American management consultant. Source: Wikipedia2. DIN 8782 Terminology associated with filling plants and their constituent machines 3. CIP = Cleaning In Place; SIP = Sterilization In Place 4. DIN 31051 Fundamentals of maintenance
Author:
Dipl.-Ing. (FH) Thorsten Michaelis, Produktcenter Aseptische Fülltechnik, KHS GmbH, Bad Kreuznach
Contact:
Dr.-Ing. Annette Schmelzle, Fachzentrum Lebensmittel, DLG e.V., [email protected]
www.DLG.org
DLG Expert report 4/2016
Packaging material made from polyethylene terephthalate (PET)
2016_4_EW_PET_e.indd 1 17.08.17 16:54
www.DLG.org
DLG Expert report 10/2016Functional barriers against mineral oil from paper and cardboard packaging materials
2016_10_EW_Barrieren_e.indd 1 27.01.17 14:49
© 2017All information and references are provided without any guarantee or liability. Any reproduction and transmission of individual text sections,drawings or pictures – even for educational purposes – requires the prior consent of DLG e.V., Service Department Communication,Eschborner Landstrasse 122, 60489 Frankfurt am Main.
DLG e.V. Competence Center FoodEschborner Landstr. 122 · 60489 Frankfurt am Main · GermanyTel. +49 69 24788-311 · Fax +49 69 [email protected] · www.DLG.org