Embed Size (px)
Citation preview

HAZARDOUS TO YOUR WEALTH:SIX MISTAKES CANADIANS MAKE WITH THEIR FINANCES
Life Expectancy at Birth79.5
Age
1000 1200 1400 1600 1800 2000
80
70
60
50
40
30
20
10
0
1000 - 2000
Source: Census Bureau, 2000
Source: US Census 2000

If clients can’t imagine living past age 100, tell them more than 50,000 people across North America already have, says Dan Anders.
What’s more, the number of centenarians (people aged 100 and older) in Canada is rising. Statistics Canada says that cohort grew 25.7% between 2006 and 2011 (the number of people aged 60 to 64 grew 29.1%). It’s also been one of the fastest-growing segments for nearly 40 years
Centenarians
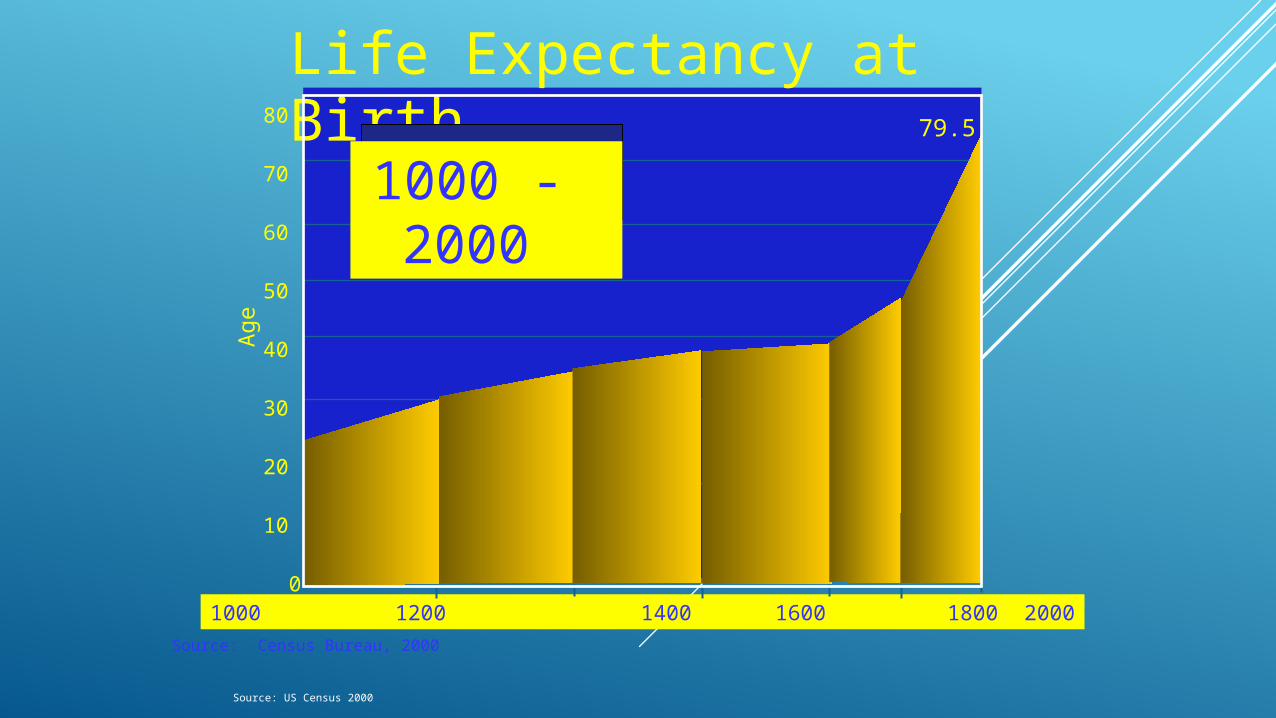
THE FOUR CORNERSTONE PHILOSOPHY
Short Term Reserve
Money or collateral for:
• Emergencies• Opportunities
Equity Investments
Provides:
• Better return through ownership
• Capital appreciation
Debt Management
Provides:
• Debt Restructuring• Wealth creation
Risk Management
For you and your dependents in case of:
• Premature death• Disability, critical illness• Need for long-term care
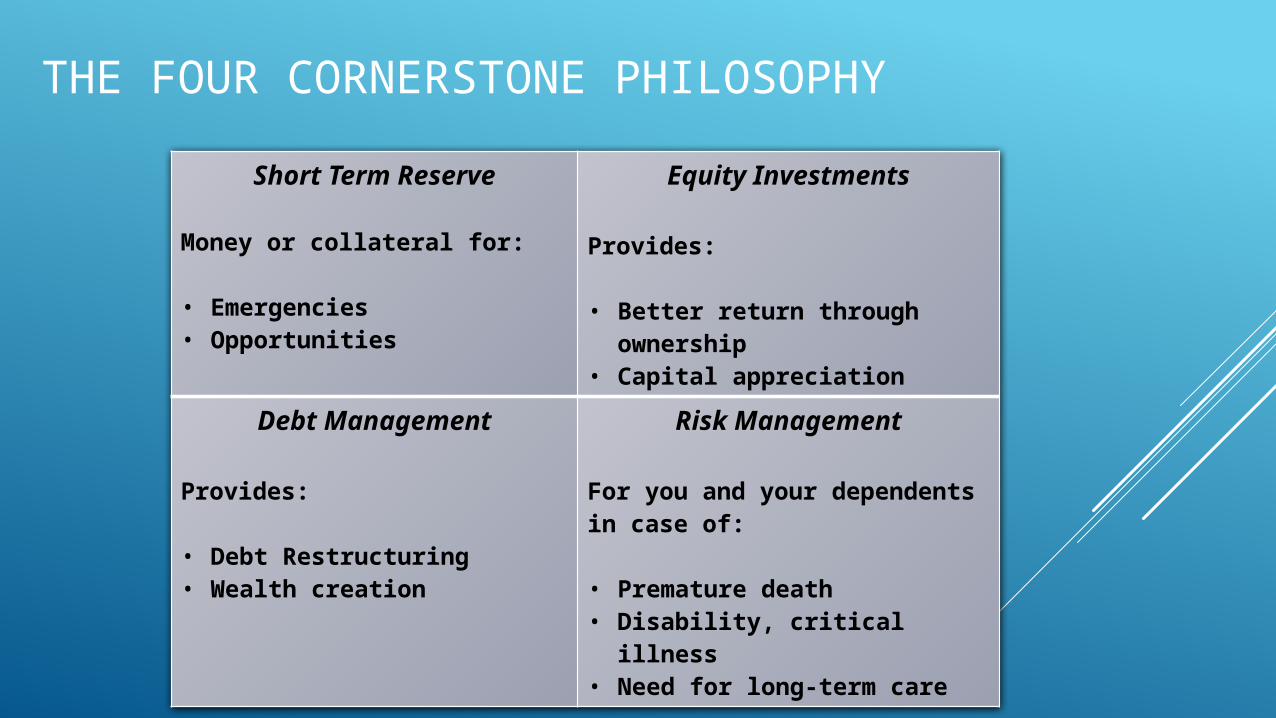
CASE STUDY
Here’s a regular Canadian Family:Viktor (50) – supervisor, annual income $60,000
Josephine (50) – HR manager, annual income $60,000
Barry (9) – son
Lidia (7) - daughter
William (6) – dog
Monthly Family income: $8,000
The family feels like they live paycheque to paycheque
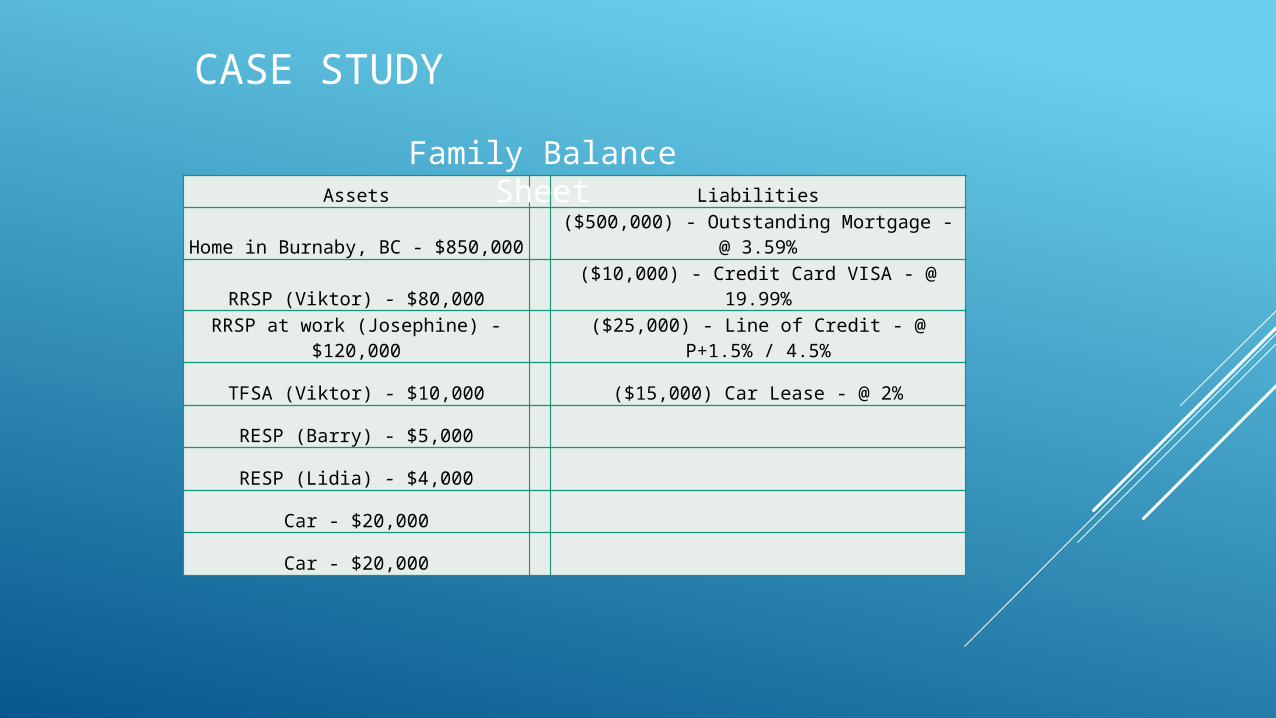
Assets Liabilities
Home in Burnaby, BC - $850,000($500,000) - Outstanding Mortgage - @
3.59%
RRSP (Viktor) - $80,000 ($10,000) - Credit Card VISA - @ 19.99%
RRSP at work (Josephine) - $120,000($25,000) - Line of Credit - @ P+1.5% /
4.5%
TFSA (Viktor) - $10,000 ($15,000) Car Lease - @ 2%
RESP (Barry) - $5,000
RESP (Lidia) - $4,000
Car - $20,000
Car - $20,000
CASE STUDY
Family Balance Sheet
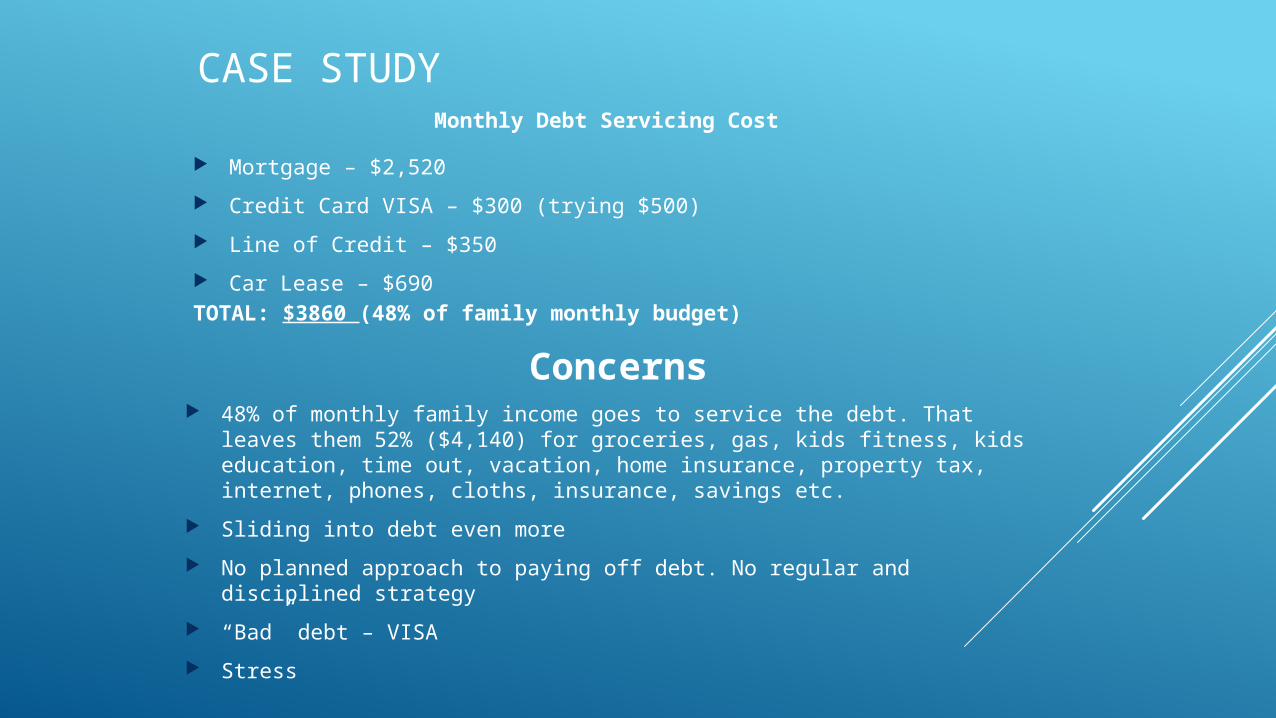
CASE STUDYMonthly Debt Servicing Cost
Mortgage – $2,520
Credit Card VISA – $300 (trying $500)
Line of Credit – $350
Car Lease – $690TOTAL: $3860 (48% of family monthly budget)
Concerns 48% of monthly family income goes to service the debt. That leaves them
52% ($4,140) for groceries, gas, kids fitness, kids education, time out, vacation, home insurance, property tax, internet, phones, cloths, insurance, savings etc.
Sliding into debt even more
No planned approach to paying off debt. No regular and disciplined strategy
“Bad” debt – VISA
Stress
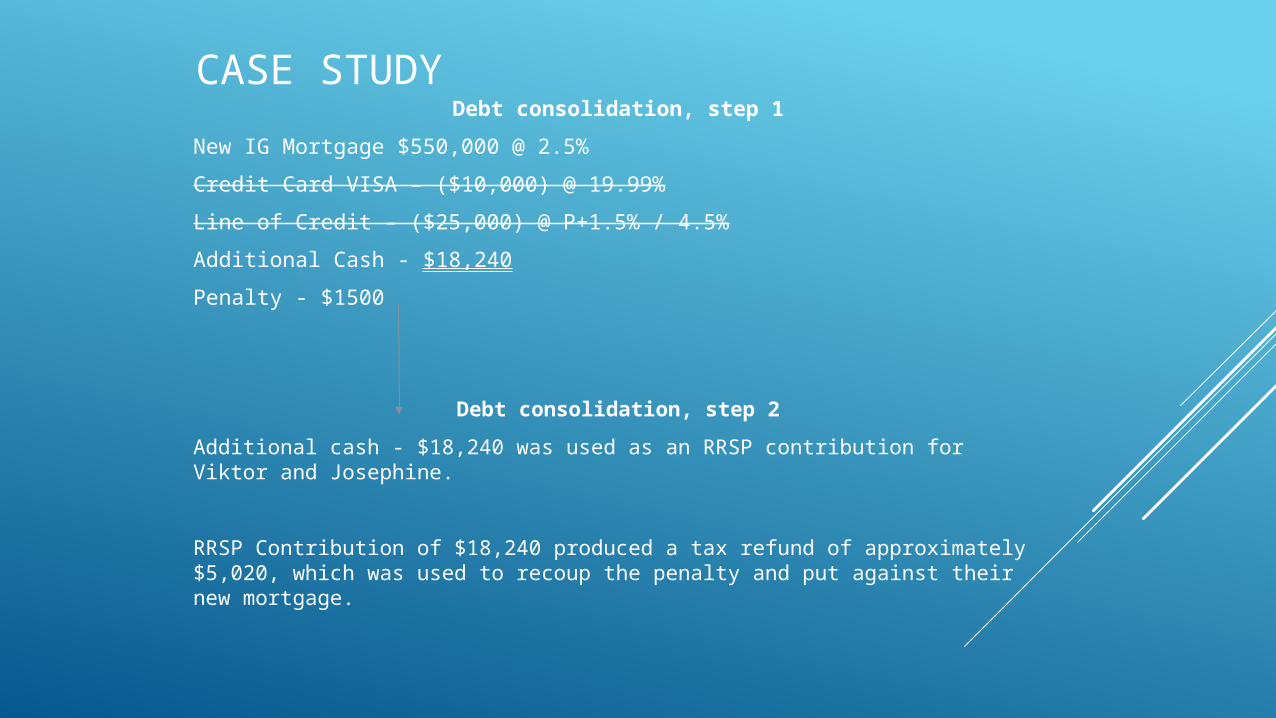
CASE STUDYDebt consolidation, step 1
New IG Mortgage $550,000 @ 2.5%
Credit Card VISA – ($10,000) @ 19.99%
Line of Credit – ($25,000) @ P+1.5% / 4.5%
Additional Cash - $18,240
Penalty - $1500
Debt consolidation, step 2
Additional cash - $18,240 was used as an RRSP contribution for Viktor and Josephine.
RRSP Contribution of $18,240 produced a tax refund of approximately $5,020, which was used to recoup the penalty and put against their new mortgage.
CASE STUDY
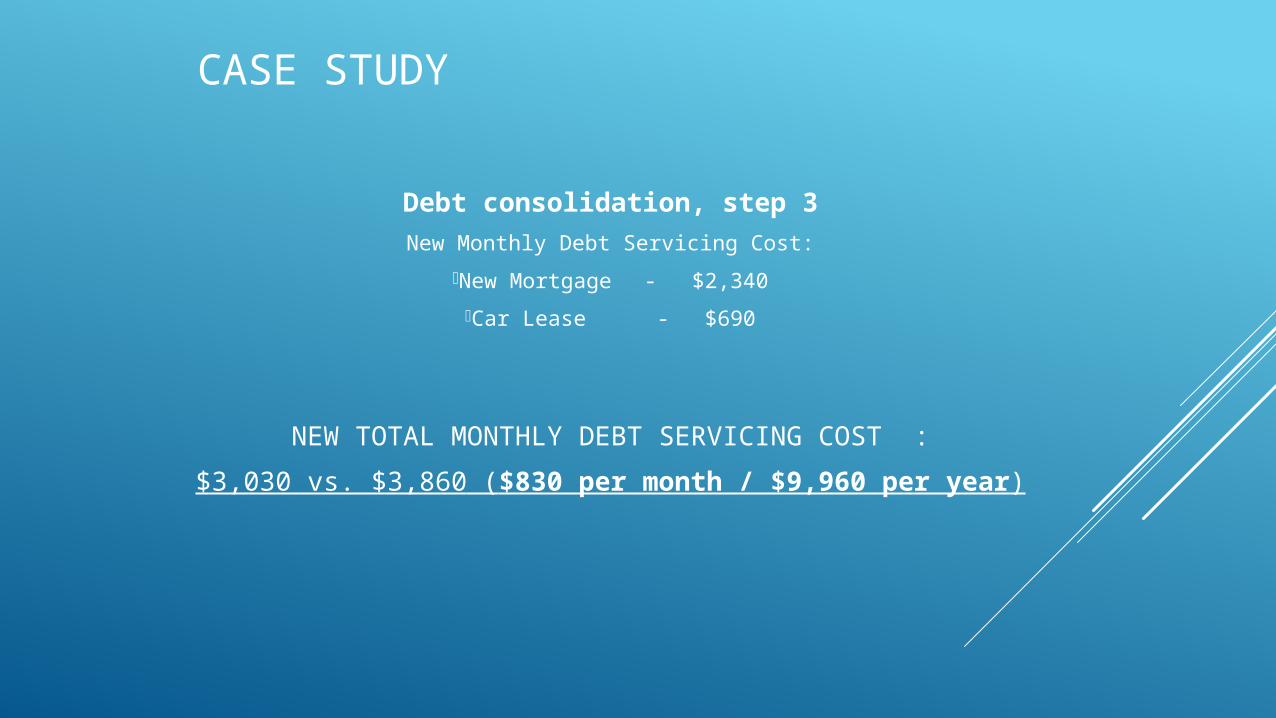
Debt consolidation, step 3
New Monthly Debt Servicing Cost:
New Mortgage - $2,340
Car Lease - $690
NEW TOTAL MONTHLY DEBT SERVICING COST :
$3,030 vs. $3,860 ($830 per month / $9,960 per year)
CASE STUDY
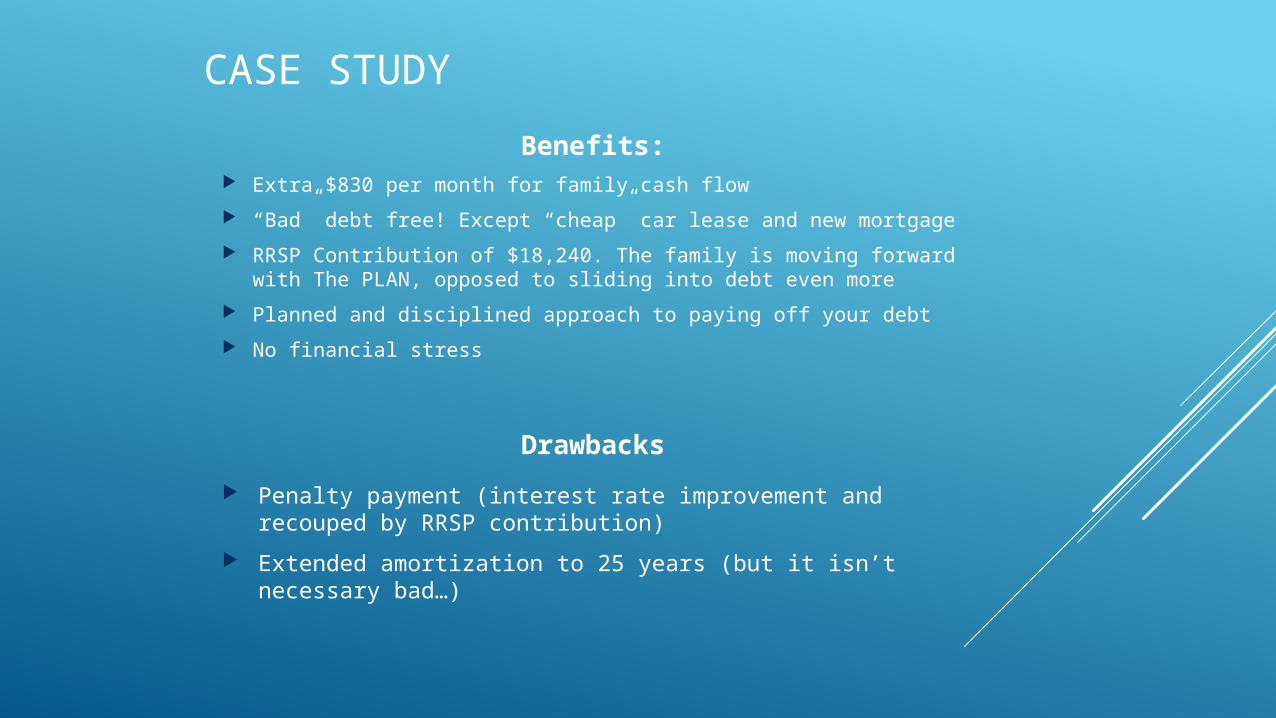
Drawbacks
Penalty payment (interest rate improvement and recouped by RRSP contribution)
Extended amortization to 25 years (but it isn’t necessary bad…)
Benefits: Extra $830 per month for family cash flow
“Bad” debt free! Except “cheap” car lease and new mortgage
RRSP Contribution of $18,240. The family is moving forward with The PLAN, opposed to sliding into debt even more
Planned and disciplined approach to paying off your debt
No financial stress

YOU NEED A PLAN
FINANCIAL ISSUES ARE COMPLEX
YOU NEED TO WORK WITH A PROFESSIONAL
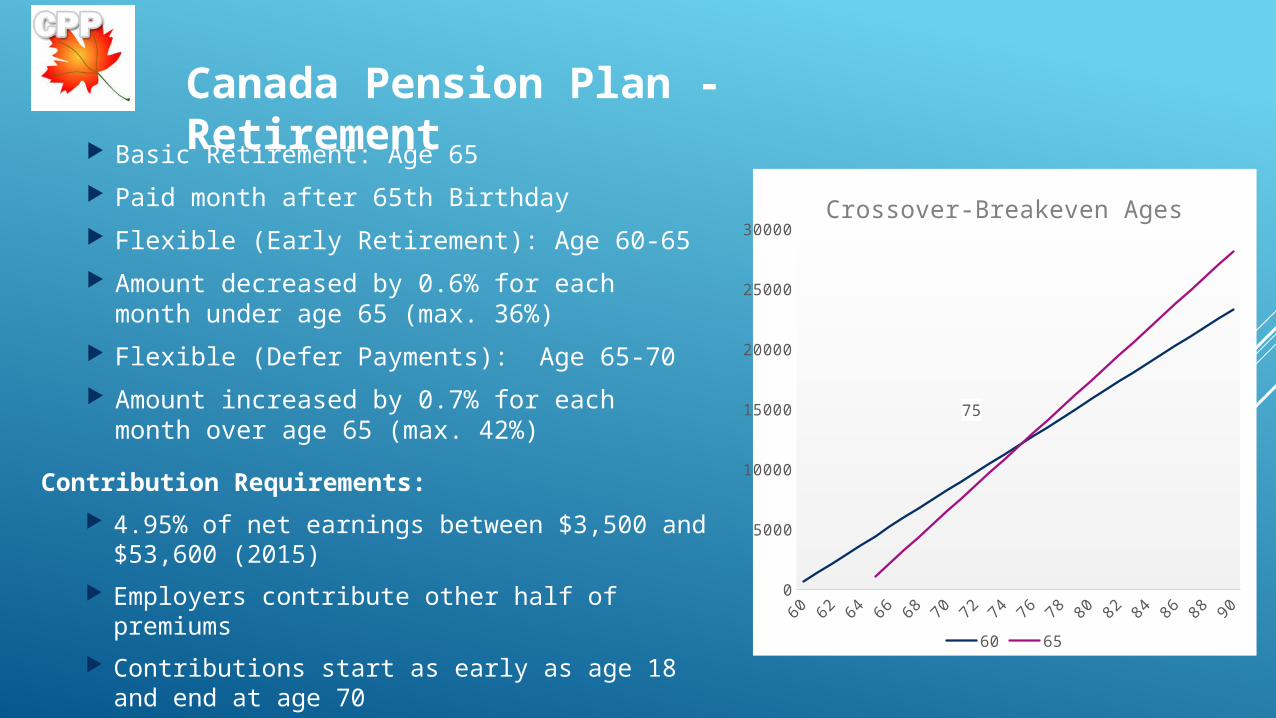
Basic Retirement: Age 65
Paid month after 65th Birthday
Flexible (Early Retirement): Age 60-65
Amount decreased by 0.6% for each month under age 65 (max. 36%)
Flexible (Defer Payments): Age 65-70
Amount increased by 0.7% for each month over age 65 (max. 42%)
Canada Pension Plan - Retirement
0
5000
10000
15000
20000
25000
30000
75
Crossover-Breakeven Ages
60 65
Contribution Requirements:
4.95% of net earnings between $3,500 and $53,600 (2015)
Employers contribute other half of premiums
Contributions start as early as age 18 and end at age 70
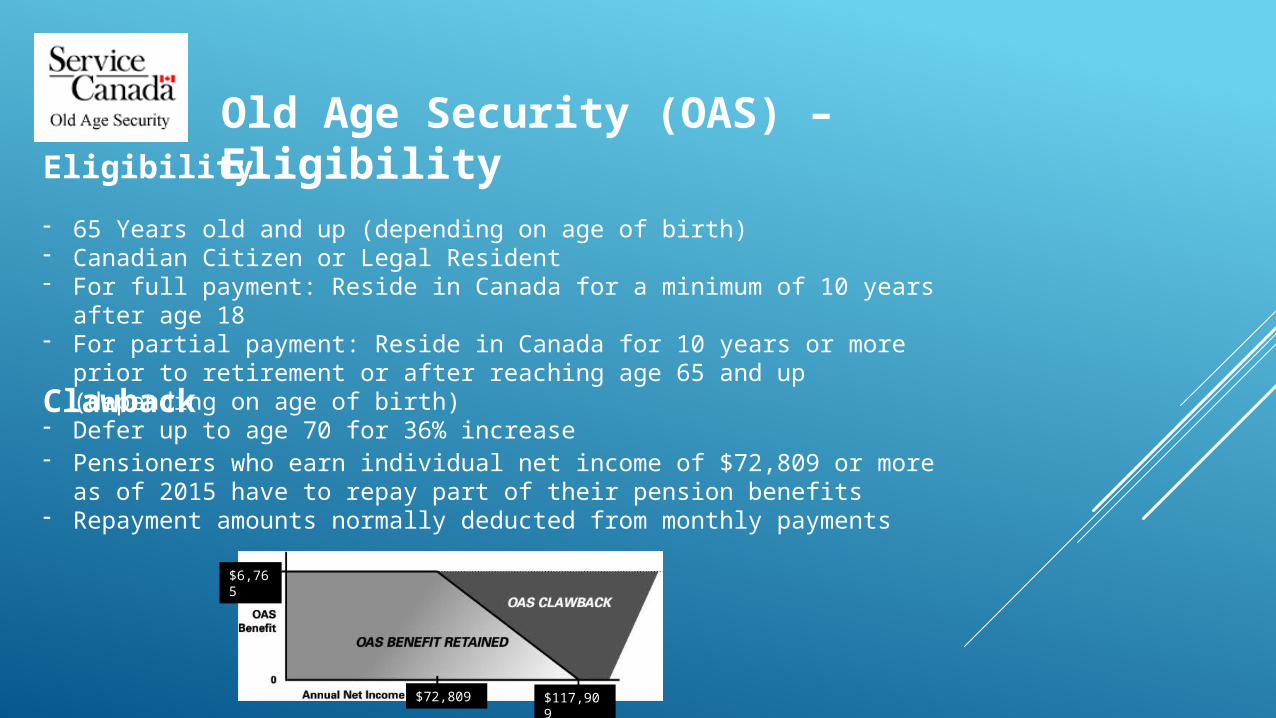
Old Age Security (OAS) – EligibilityEligibility
- 65 Years old and up (depending on age of birth) - Canadian Citizen or Legal Resident- For full payment: Reside in Canada for a minimum of 10 years after age
18- For partial payment: Reside in Canada for 10 years or more prior to
retirement or after reaching age 65 and up (depending on age of birth)- Defer up to age 70 for 36% increase Clawback
- Pensioners who earn individual net income of $72,809 or more as of 2015 have to repay part of their pension benefits
- Repayment amounts normally deducted from monthly payments
$72,809 $117,909
$6,765
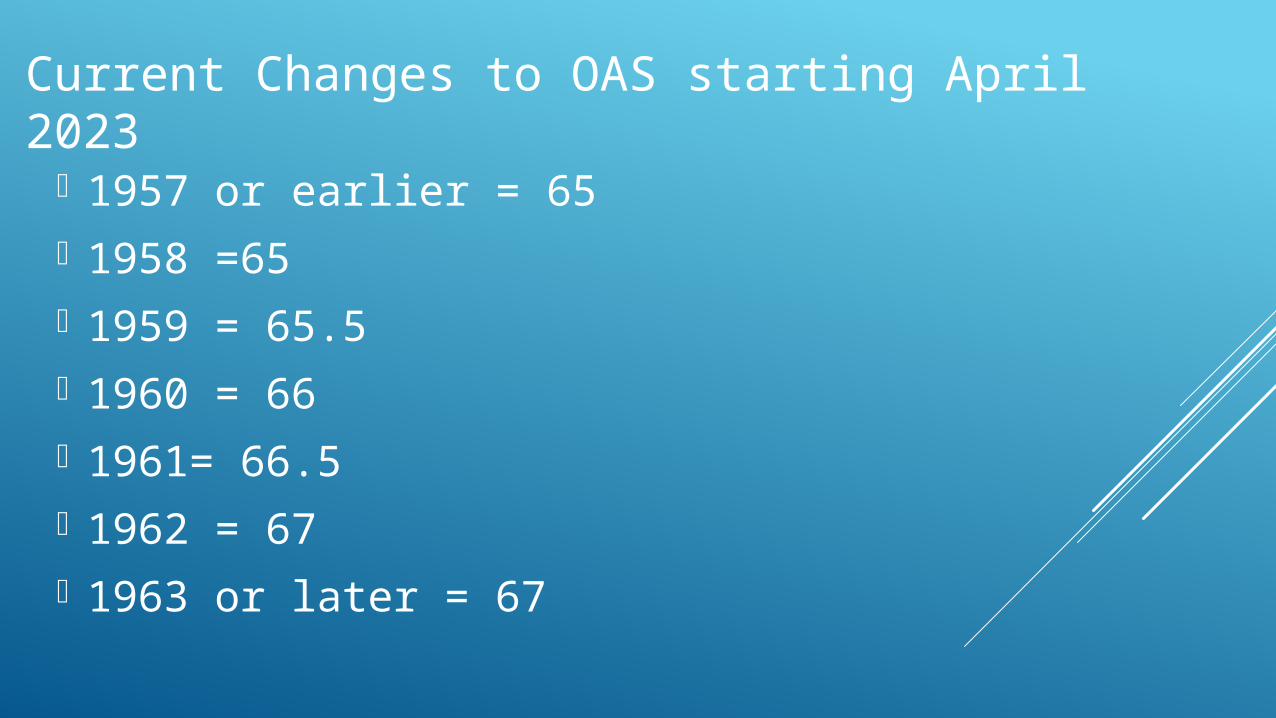
1957 or earlier = 65 1958 =65 1959 = 65.5 1960 = 66 1961= 66.5 1962 = 67 1963 or later = 67
Current Changes to OAS starting April 2023
Retirement Paycheque
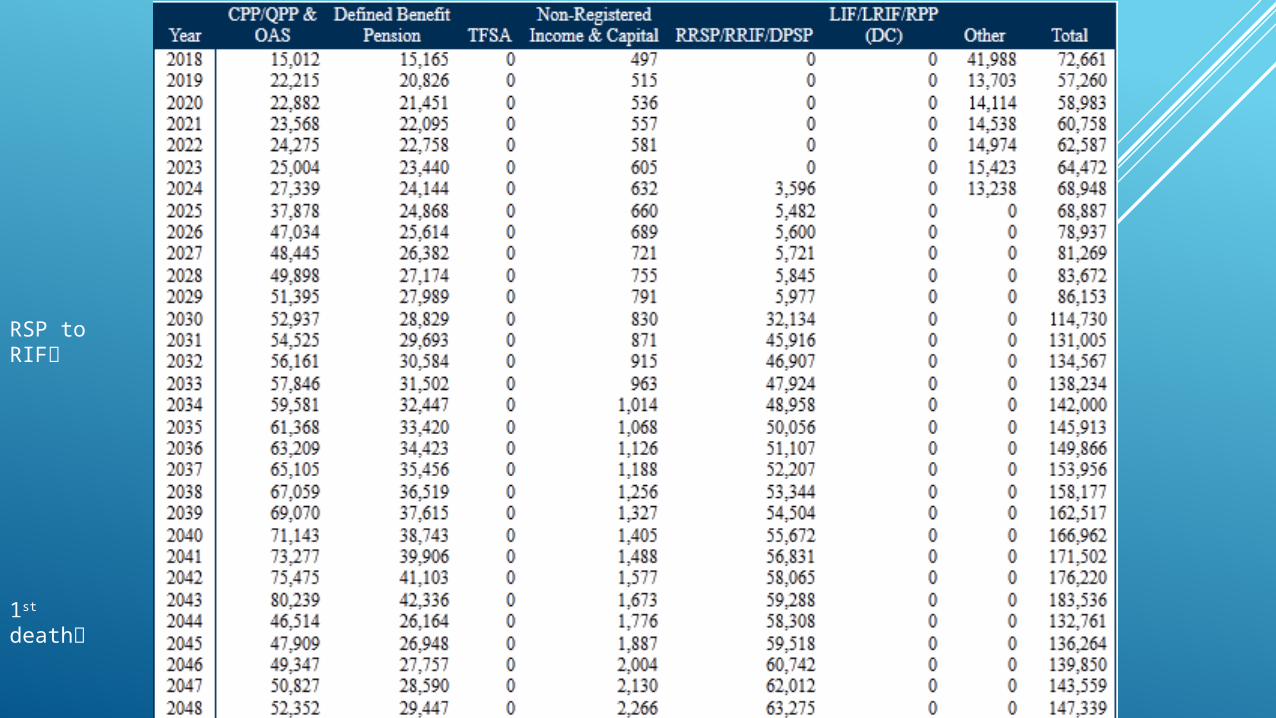
RSP to RIF
1st death
2nd death
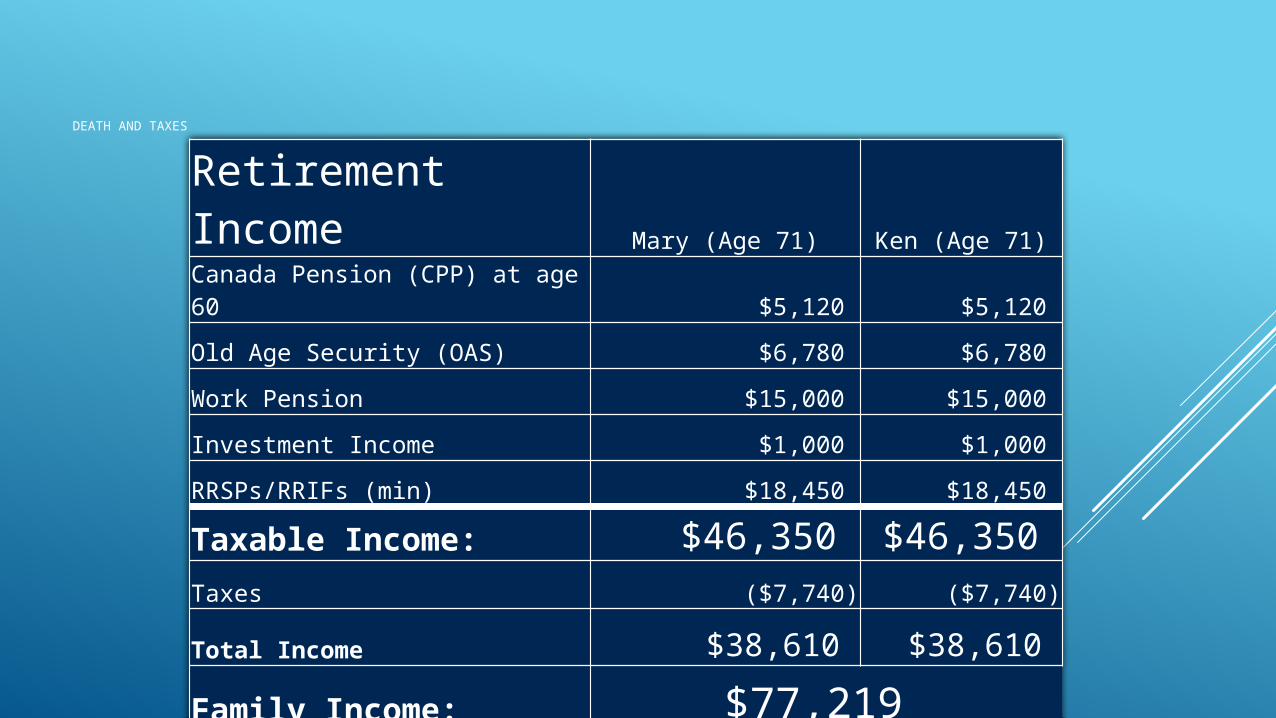
DEATH AND TAXES
Retirement Income Mary (Age 71) Ken (Age 71)
Canada Pension (CPP) at age 60 $5,120 $5,120
Old Age Security (OAS) $6,780 $6,780
Work Pension $15,000 $15,000
Investment Income $1,000 $1,000
RRSPs/RRIFs (min) $18,450 $18,450
Taxable Income: $46,350 $46,350 Taxes ($7,740) ($7,740)
Total Income $38,610 $38,610
Family Income: $77,219
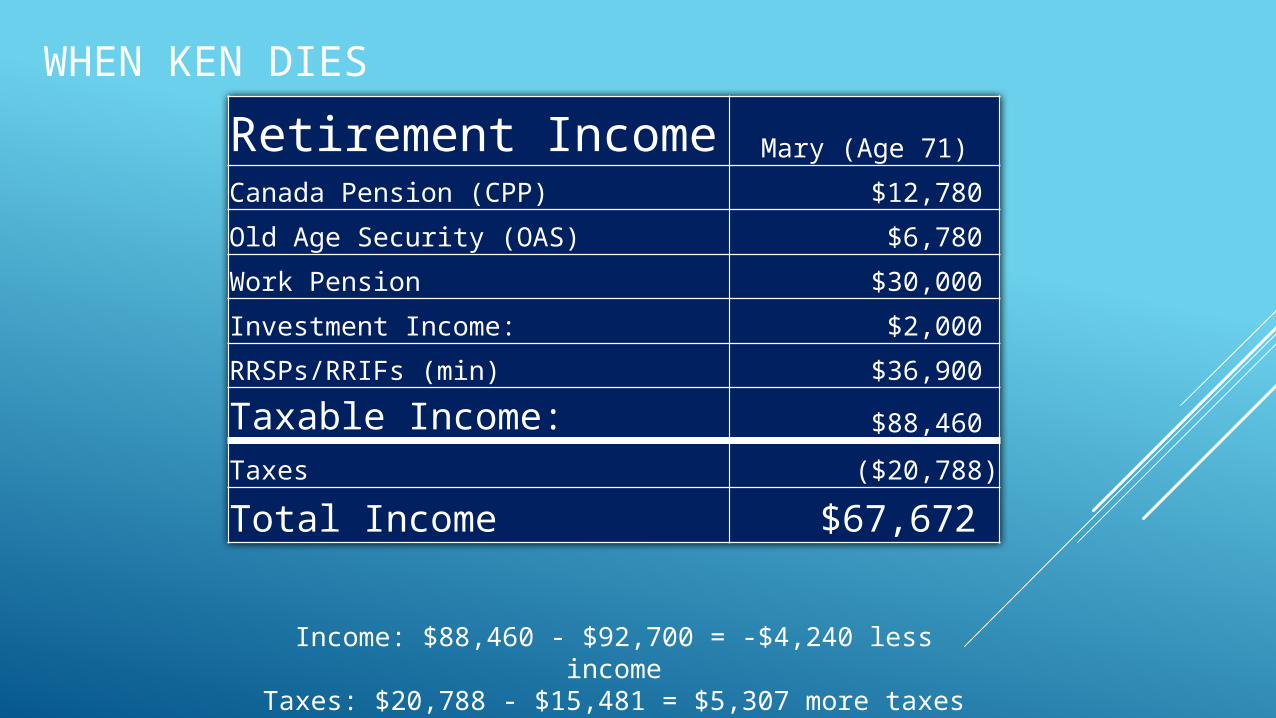
WHEN KEN DIES
Retirement Income Mary (Age 71)
Canada Pension (CPP) $12,780
Old Age Security (OAS) $6,780
Work Pension $30,000
Investment Income: $2,000
RRSPs/RRIFs (min) $36,900
Taxable Income: $88,460
Taxes ($20,788)
Total Income $67,672
Income: $88,460 - $92,700 = -$4,240 less incomeTaxes: $20,788 - $15,481 = $5,307 more taxes
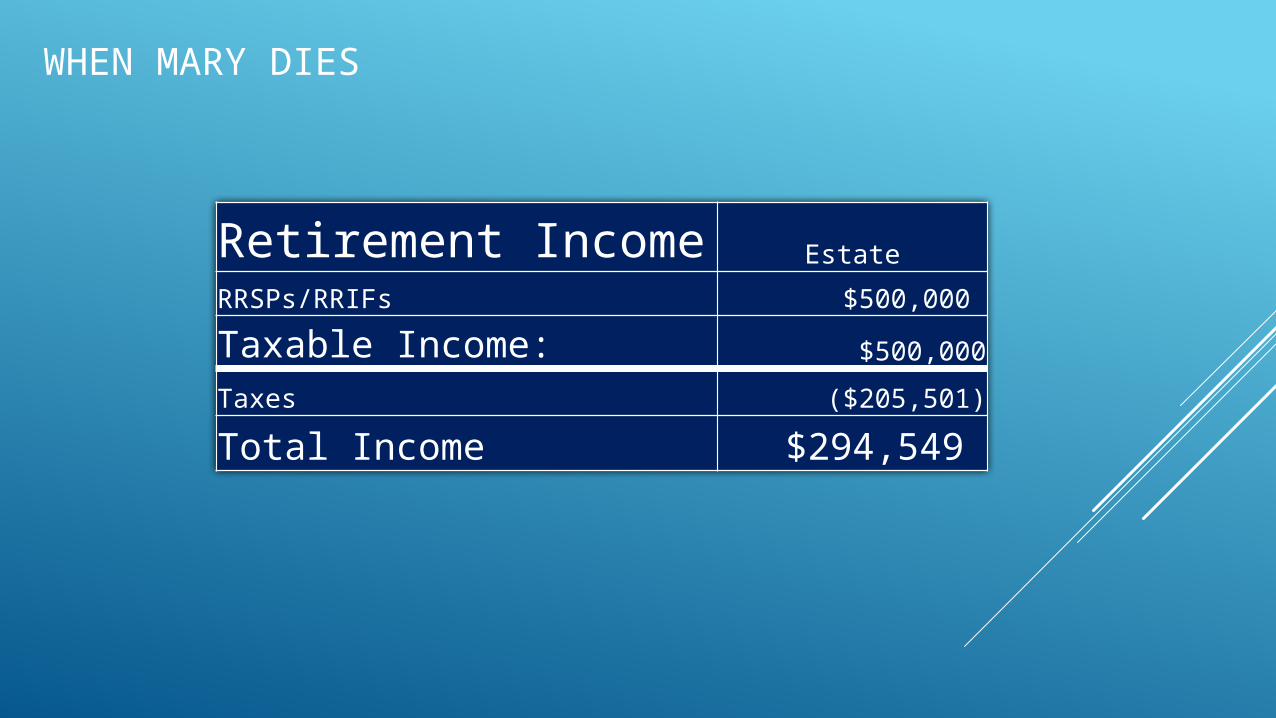
WHEN MARY DIES
Retirement Income Estate
RRSPs/RRIFs $500,000
Taxable Income: $500,000
Taxes ($205,501)
Total Income $294,549

YOU NEED A PLAN
FINANCIAL ISSUES ARE COMPLEX
YOU NEED TO WORK WITH A PROFESSIONAL
INVESTMENT MISTAKES
Wrong investments in the wrong accounts Unsuitable investments Don’t Understand Risk Questionable Source of Investment
Information
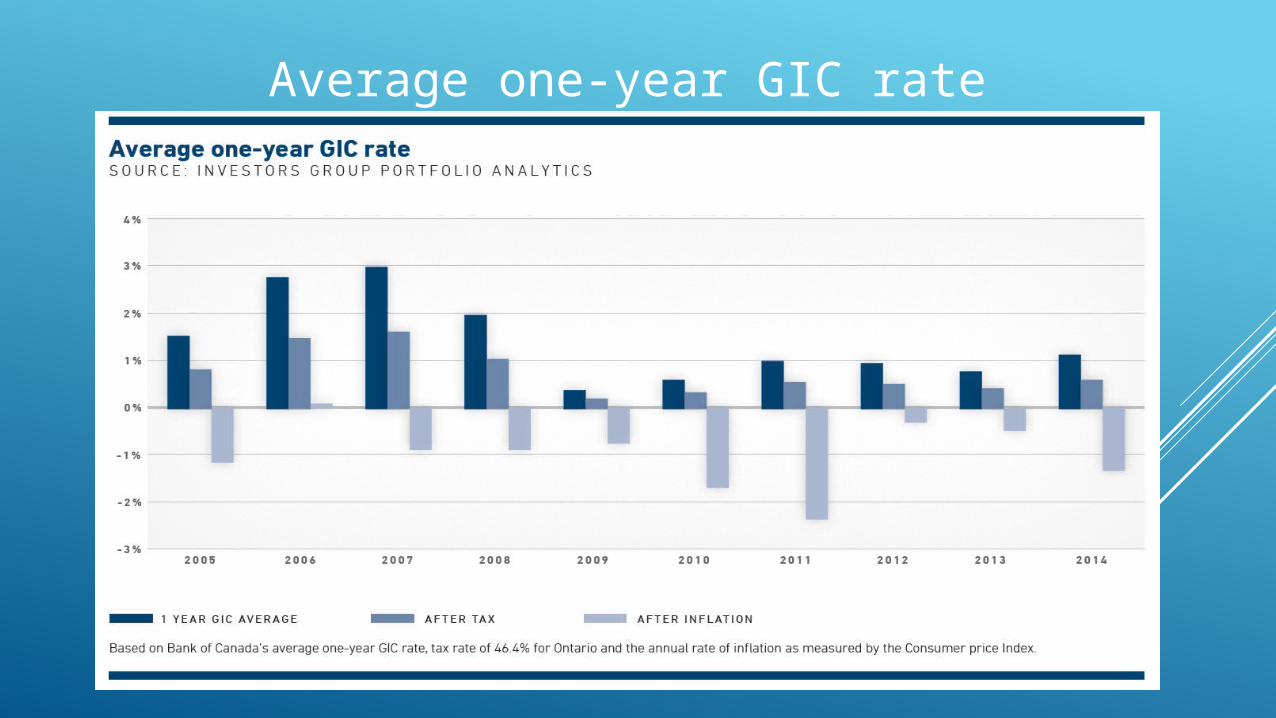
Average one-year GIC rate
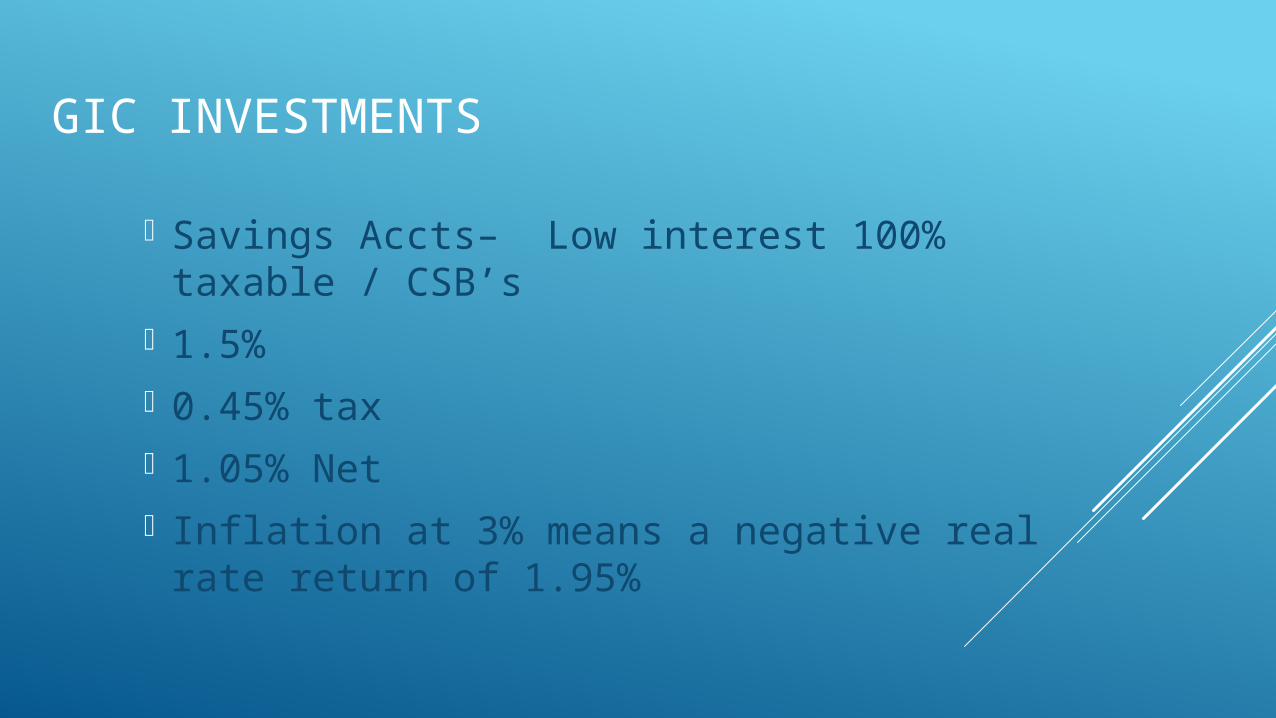
GIC INVESTMENTS
Savings Accts– Low interest 100% taxable / CSB’s
1.5% 0.45% tax 1.05% Net Inflation at 3% means a negative real rate
return of 1.95%
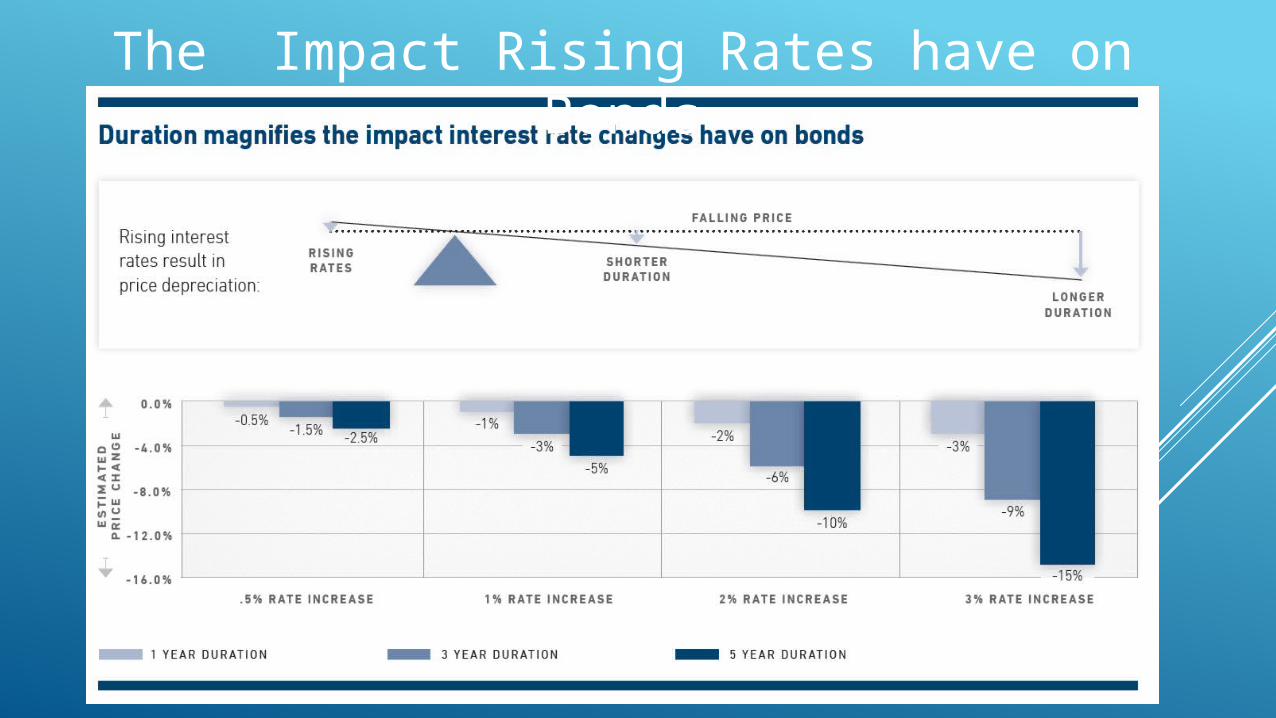
The Impact Rising Rates have on Bonds
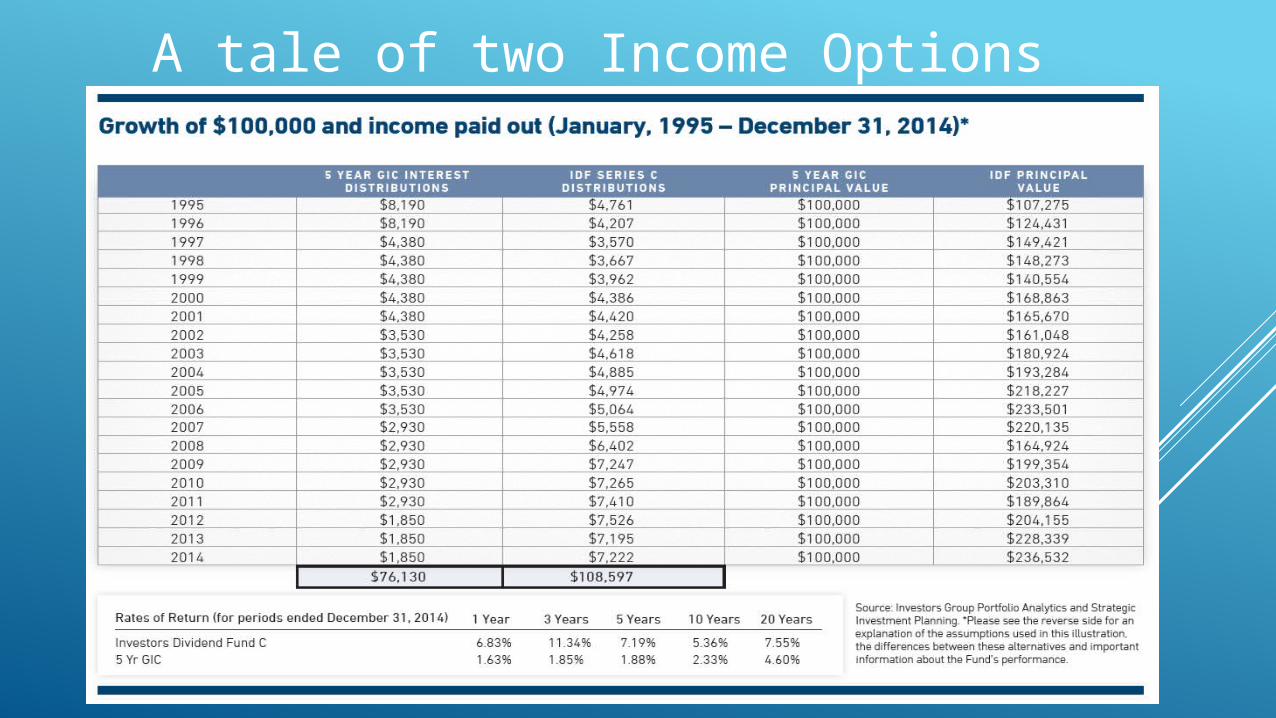
A tale of two Income Options
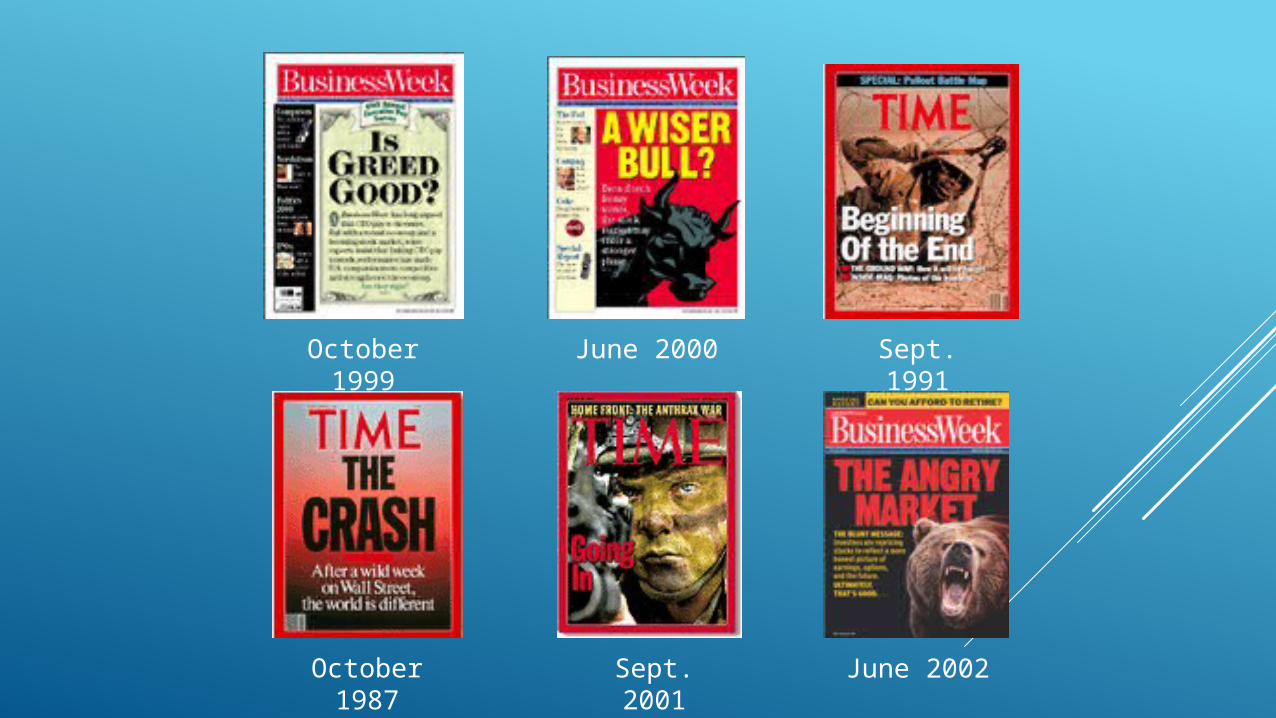
October 1999
June 2000 Sept. 1991
October 1987
Sept. 2001 June 2002
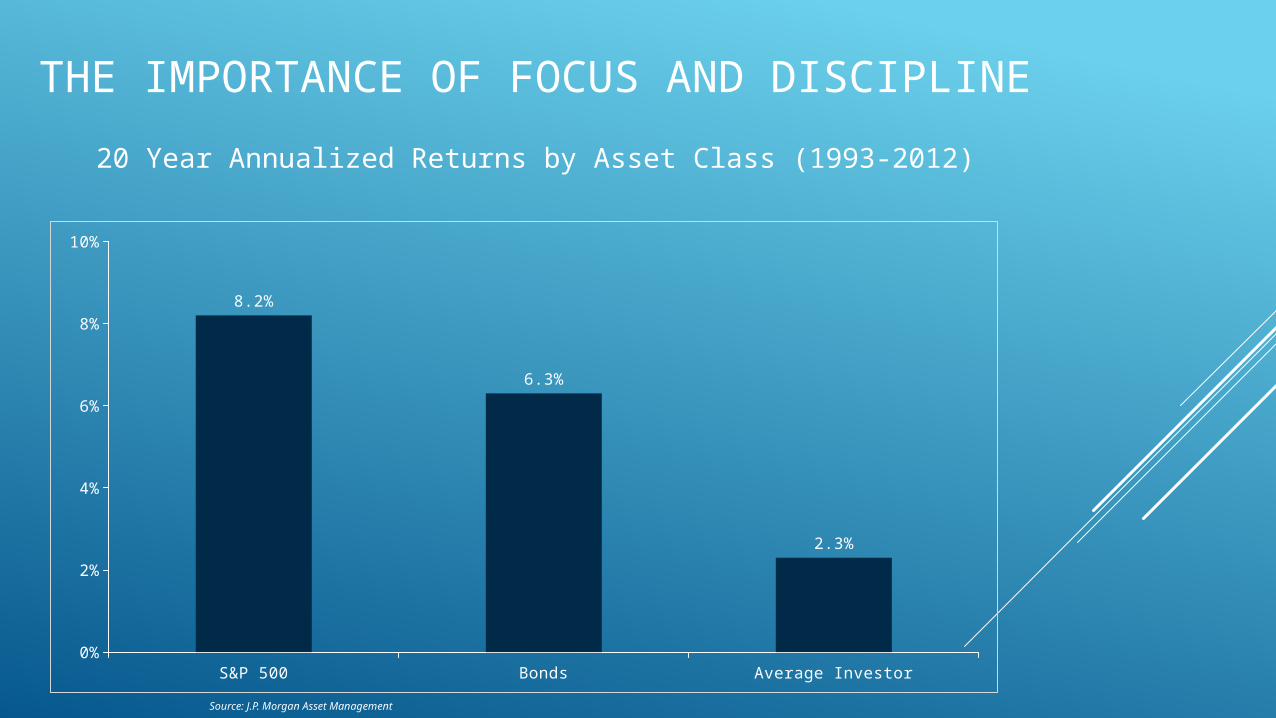
THE IMPORTANCE OF FOCUS AND DISCIPLINE
S&P 500 Bonds Average Investor0%
2%
4%
6%
8%
10%
8.2%
6.3%
2.3%
Source: J.P. Morgan Asset Management
20 Year Annualized Returns by Asset Class (1993-2012)
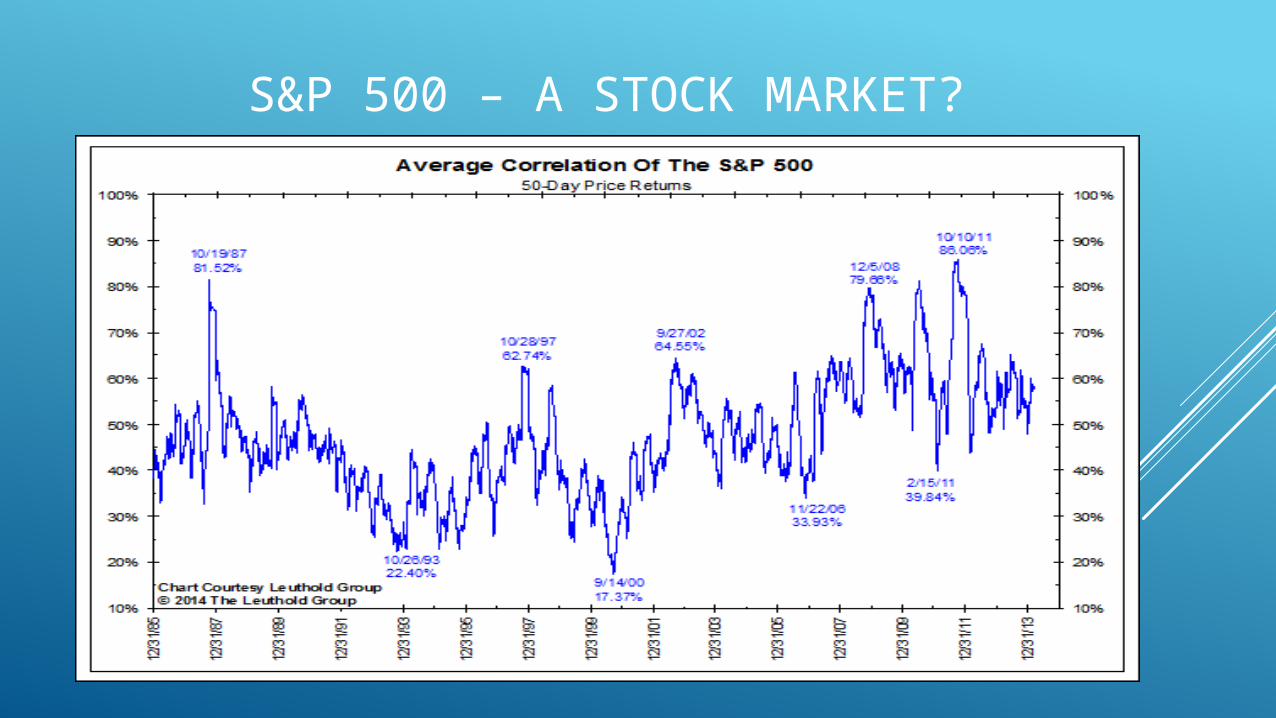
S&P 500 – A STOCK MARKET?
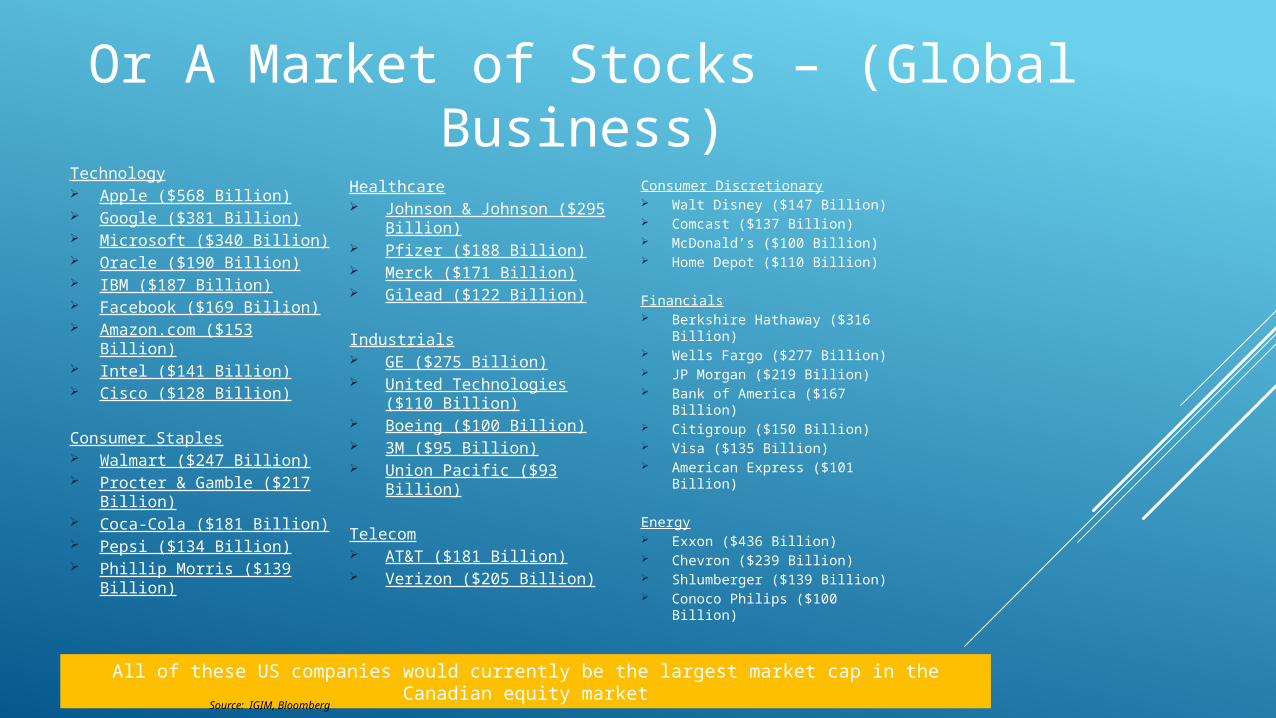
Technology Apple ($568 Billion) Google ($381 Billion) Microsoft ($340 Billion) Oracle ($190 Billion) IBM ($187 Billion) Facebook ($169 Billion) Amazon.com ($153 Billion) Intel ($141 Billion) Cisco ($128 Billion)
Consumer Staples Walmart ($247 Billion) Procter & Gamble ($217
Billion) Coca-Cola ($181 Billion) Pepsi ($134 Billion) Phillip Morris ($139 Billion)
Healthcare Johnson & Johnson ($295
Billion) Pfizer ($188 Billion) Merck ($171 Billion) Gilead ($122 Billion)
Industrials GE ($275 Billion) United Technologies ($110
Billion) Boeing ($100 Billion) 3M ($95 Billion) Union Pacific ($93 Billion)
Telecom AT&T ($181 Billion) Verizon ($205 Billion)
Consumer Discretionary Walt Disney ($147 Billion) Comcast ($137 Billion) McDonald’s ($100 Billion) Home Depot ($110 Billion)
Financials Berkshire Hathaway ($316
Billion) Wells Fargo ($277 Billion) JP Morgan ($219 Billion) Bank of America ($167 Billion) Citigroup ($150 Billion) Visa ($135 Billion) American Express ($101
Billion)
Energy Exxon ($436 Billion) Chevron ($239 Billion) Shlumberger ($139 Billion) Conoco Philips ($100 Billion)
All of these US companies would currently be the largest market cap in the Canadian equity market
Source: IGIM, Bloomberg
Or A Market of Stocks – (Global Business)
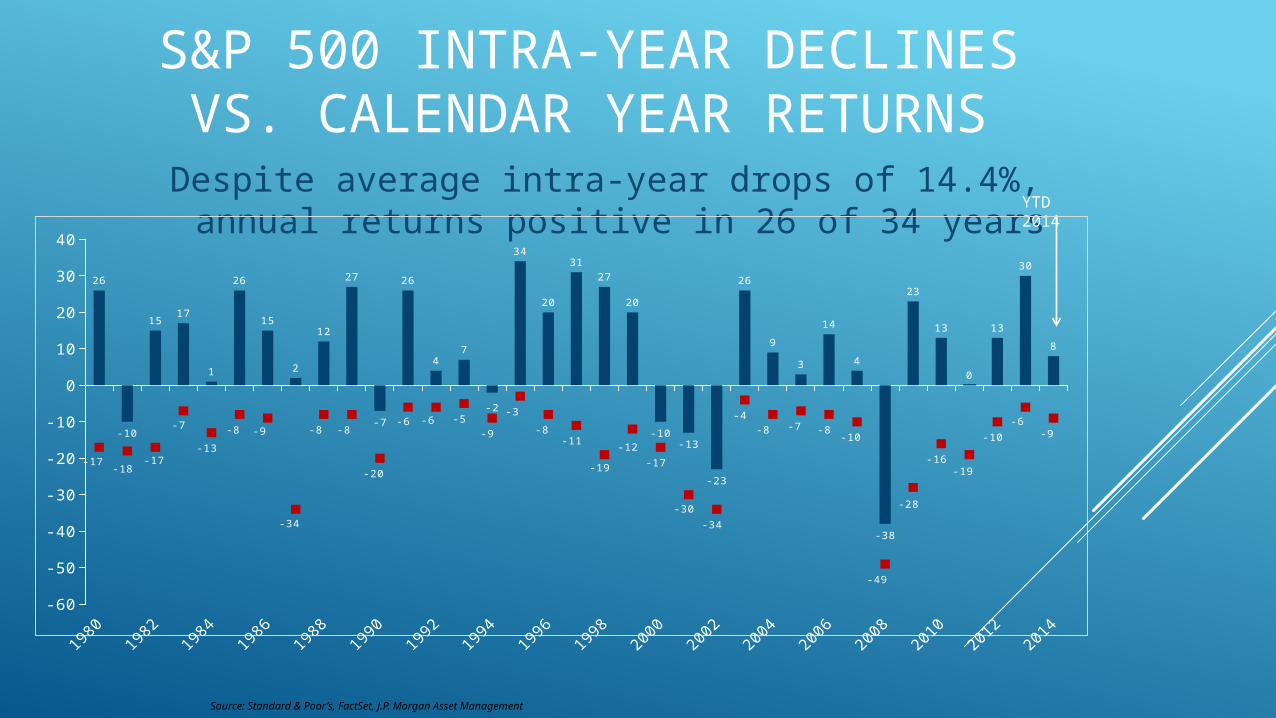
S&P 500 INTRA-YEAR DECLINES VS. CALENDAR YEAR RETURNS
Despite average intra-year drops of 14.4%, annual returns positive in 26 of 34 years
Source: Standard & Poor’s, FactSet, J.P. Morgan Asset Management
YTD 2014
-60
-50
-40
-30
-20
-10
0
10
20
30
40
26
-10
1517
1
26
15
2
12
27
-7
26
47
-2
34
20
3127
20
-10-13
-23
26
9
3
14
4
-38
23
13
0
13
30
8
-17-18
-17
-7
-13
-8 -9
-34
-8 -8
-20
-6 -6 -5-9
-3
-8-11
-19
-12
-17
-30
-34
-4-8 -7 -8
-10
-49
-28
-16-19
-10
-6-9
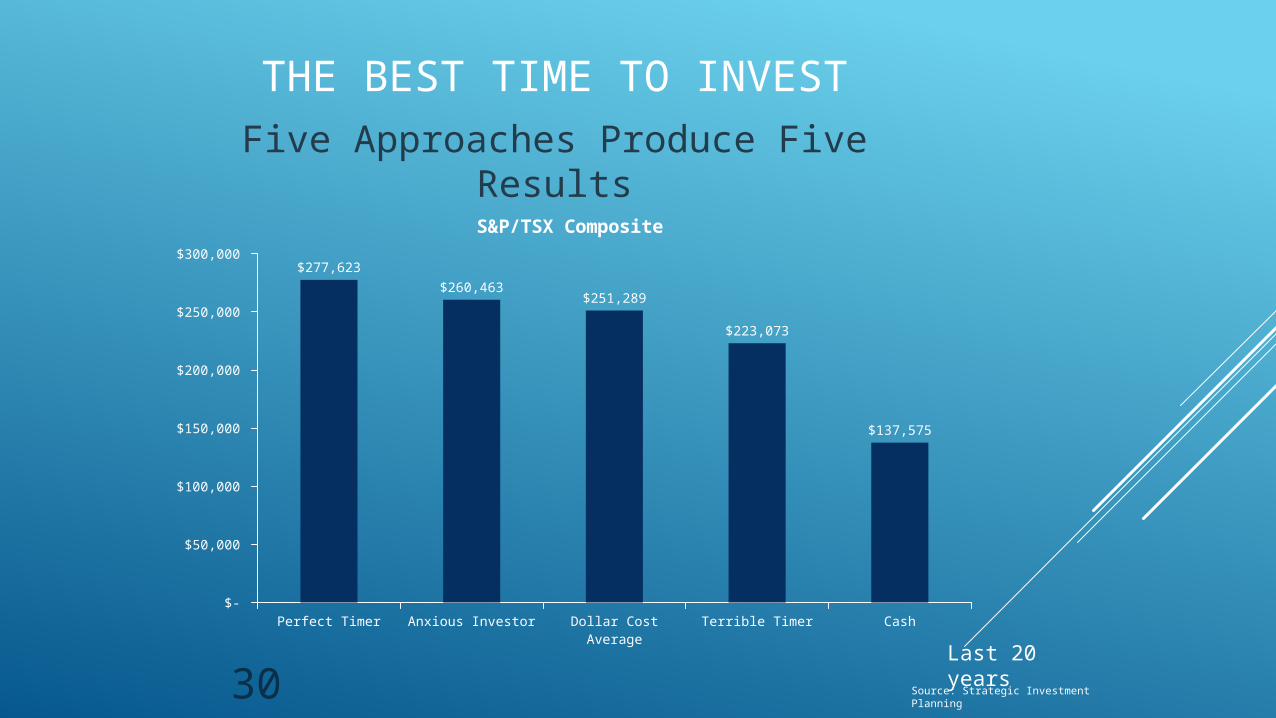
Five Approaches Produce Five Results
Source: Strategic Investment Planning
THE BEST TIME TO INVEST
30Perfect Timer Anxious Investor Dollar Cost Average Terrible Timer Cash
$-
$50,000
$100,000
$150,000
$200,000
$250,000
$300,000 $277,623
$260,463$251,289
$223,073
$137,575
S&P/TSX Composite
Last 20 years
WHAT TO HOLD WHERE
RRSP – interest bearing, dividends Non Registered accounts – Dividends
and Growth Equities TFSA – Dividends and Growth Equities

YOU NEED A PLAN
FINANCIAL ISSUES ARE COMPLEX
YOU NEED TO WORK WITH A PROFESSIONAL

Sudden Death of a Loved One

YOU NEED A PLAN
FINANCIAL ISSUES ARE COMPLEX
YOU NEED TO WORK WITH A PROFESSIONAL


THANK YOU
![Slide 1 [S2001, Cap. 19] [GMJ91, Cap. 6] [R85, Cap. 6] Articoli citati in queste diapositive, e appunti u Generalità; verification & validation u Algoritmi](https://img.pdfslide.us/doc/110x75/5542eb4a497959361e8b62c9/slide-1-s2001-cap-19-gmj91-cap-6-r85-cap-6-articoli-citati-in-queste-diapositive-e-appunti-u-generalita-verification-validation-u-algoritmi.jpg)