Embed Size (px)
Citation preview

CANTOGETHER
Crops and ANimals TOGETHER Grant agreement no. : FP7-289328
Collaborative project
Seventh framework programme
Towards land management of tomorrow - Innovative forms of mixed farming for optimized
use of energy and nutrients
Due date: M36
Actual submission date: Jan 2016
Project start date: January 1st, 2012 Duration: 48 months
Workpackage concerned: WP3
Concerned workpackage leader: H. Korevaar
Names of the responsible authors & organizations : M.C. Hanegraaf (NMI), R. Kaczynski
(IUNG), F. Vertès (INRA), G. Siebielec (IUNG), G.J. Doppenberg (NMI) and H. Korevaar (PRI).
Dissemination level: PU
Deliverable D3.5: Impact of MFS in
regional trends in soil organic matter
contents and nutrient losses

2
Contents
Inhoud Acknowledgments
Abstract ........................................................................................................................................................... 5
1. Introduction ................................................................................................................................................. 6
1.1 Land sharing as a feature of mixed farming systems ................................................................................ 6
1.2 Objectives .................................................................................................................................................. 8
2 Materials and methods ................................................................................................................................ 9
2.1 General approach ...................................................................................................................................... 9
2.2 Methodology ............................................................................................................................................. 9
2.3 Modelling ................................................................................................................................................. 10
3 Assessment of Dolnoslaskie (PL) ................................................................................................................ 14
3.1 The Challenge .......................................................................................................................................... 14
3.2 Description of the area ............................................................................................................................ 14
3.3 Methodology ........................................................................................................................................... 16
3.3.1 Outline .......................................................................................................................................... 16
3.3.2 Selection of baseline and time scenarios ..................................................................................... 16
3.3.3 Modelling ...................................................................................................................................... 17
3.3.4 Data collection .............................................................................................................................. 18
3.4 Results ..................................................................................................................................................... 19
3.4.1 Extrapolation over time ................................................................................................................ 20
3.4.2 Upscaling to the regional level ..................................................................................................... 22
3.5 Discussion ................................................................................................................................................ 25
3.6 Conclusions .............................................................................................................................................. 26
4. Assessment of Winterswijk (NL) ................................................................................................................ 27
4.1 The Challenge .......................................................................................................................................... 27
4.2 Description .............................................................................................................................................. 27
4.3 Methodology ........................................................................................................................................... 30
4.3.1 Outline .......................................................................................................................................... 30
4.3.2 Selection of baseline and innovations .......................................................................................... 30
4.3.3 Data collection .............................................................................................................................. 31
4.3.4 Modelling ...................................................................................................................................... 32
4.3.5 Scaling up results .......................................................................................................................... 34
4.4 Results ..................................................................................................................................................... 35
4.4.1 Modelling results of Roth-C at field level ..................................................................................... 35

3
4.4.2 Scenario analyses at farm level .................................................................................................... 37
4.4.3 Regional carbon balance .............................................................................................................. 38
4.5 Discussion ................................................................................................................................................ 39
4.6 Conclusions .............................................................................................................................................. 41
5. Assessment of Lieue de Greve (F) ............................................................................................................. 42
5.1 The Challenge .......................................................................................................................................... 42
5.2 Description of the area ............................................................................................................................ 42
5.3 Methodology ........................................................................................................................................... 44
5.3.1 Outline .......................................................................................................................................... 45
5.3.2 Selection of baseline and innovations .......................................................................................... 45
5.3.3 Data collection .............................................................................................................................. 46
5.3.4 Modelling ...................................................................................................................................... 48
5.3.5 Upscaling of results ...................................................................................................................... 49
5.4 Results ..................................................................................................................................................... 49
5.4.1 Pilot farms .................................................................................................................................... 49
5.4.2 Upscaling to catchment level ....................................................................................................... 52
5.5 Discussion ................................................................................................................................................ 53
5.6 Conclusions .............................................................................................................................................. 55
6. General discussion ..................................................................................................................................... 56
6.1 Effects of land sharing on SOC................................................................................................................. 56
6.2 Land sharing as part of mixed farming systems ...................................................................................... 56
6.3 Role of initial SOC-content ...................................................................................................................... 57
6.4 Role of grassland ..................................................................................................................................... 58
6.5 MFS and climate change ......................................................................................................................... 59
7. General conclusions .................................................................................................................................. 61
References ..................................................................................................................................................... 62
Appendices .................................................................................................................................................... 66
Appendix A: Dolnoslaskie .............................................................................................................................. 66
Appendix B: Winterswijk ............................................................................................................................... 67
Appendix C: Lieue de Greve .......................................................................................................................... 71

4
Acknowledgements
This work was carried out as part of the EU project CANTOGETHER (FP7-KBBE-20115, grant no. 289328).
For the Netherlands, co-funding was obtained from the District Water Board ‘Rijn en IJssel’.
The cooperation of farmers and other stakeholders in the three case study areas during the realisation of
this work is greatly appreciated.

5
Abstract
Over the past decade, Mixed Farming Systems (MFS) have gained renewed interest in the farming,
research and political community. The concept has been framed as a means for improving sustainability,
in terms of energy, nutrient efficiencies and ecosystem services. Within the EU, various policies call for
accelerated implementation of integral farming systems and related technologies. Research has shown
that opportunities exist for crop-animal systems in both low and high input systems. A major challenge is
to identify successful MFS and to assess the prerequisites for extrapolating these systems to areas with
different agro-ecological features. In the context of mixed farming systems within the EU-project
CANTOGETHER, land sharing refers to cooperation between productive and ecological areas, and/or
between livestock farms and arable farms.
Land sharing may have an impact on soil and water quality, landscape and biodiversity. Changes in soil
organic carbon (SOC) is a major indicator by which these impacts may be assessed. However, not much is
known about possible effects on SOC due to land sharing at the farm or regional level. Therefore, a
farming system approach was used to evaluate the impact of land sharing on SOC at mixed farms, as
compared to SOC at specialised arable or livestock farms. The three case studies included in the
assessment were: (1) Arable farms at mineral soils of low SOC, aiming at intensification (Dolnoslaskie
region, Poland); (2) Dairy farms at mineral soils with high SOC and high milk production, aiming to
increase biodiversity and to reduce mineral losses (Winterswijk region, Netherlands); (3) Dairy farms at
mineral soils with moderate milk production, aiming to reduce nitrogen losses (Lieue de Grève region,
France). For each region, specialised and mixed farming systems were defined using regional farm
typologies using data on crop rotation, use of dairy manure, nitrogen balance, and/or milk production.
Modelling of SOC was done using the Roth-C model for the Dolnoslaskie and Winterswijk regions, using
agronomic data from the national database and empirical farm data, respectively, and a time frame up to
the year 2050. For both case studies, the model was validated with regional SOC data. For the Lieue de
Grève region, changes in SOC were assessed from modelled nitrogen fluxes with CASIMOD’N, and use of
empirical farm data.
Results indicate that in intensive arable systems on soils low in SOC, the amount of C-input from crop
residues and/or manure is the driving force for increasing SOC rather than the specialist (cereal-based) or
mixed character of the farming system. However, the Roth-C model calculations also showed that this
contribution may be higher in mixed arable systems than in specialised arable systems. At soils high in
SOC, specialised (potato-based) arable systems lead to significant carbon loss over time. In contrast, the
specialised dairy farms as well as the mixed dairy farms increased SOC. Concerning the latter, mixed
systems with cereal cultivation to stimulate biodiversity provided more carbon than mixed systems with
measures to reduce mineral losses to ground- and surface waters. However, results of the calculations for
the Lieue de Grève farms show that highest gain in carbon was obtained by the specialist (grass-based)
dairy system at moderate production level. Thus in intensive dairy farming systems similar in SOC, C-input
was proportional to grassland age which, at the high production farms, was related to the grass-maize
rotation management strategies. Overall, the findings in the three case studies suggest that mixed
farming systems could make a modest contribution to the “4 ‰ initiative”. Major factors that determine
the outcome of land sharing on SOC-contents are 1) agro-ecological conditions; and 2) production goal.
For land sharing to have potential as a blueprint for sustainable intensification, specific regional incentives
may be needed to arrive at the optimal combination of these driving forces.

6
1. Introduction
1.1 Land sharing as a feature of mixed farming systems
Over the past decade, Mixed Farming Systems (MFS) have gained renewed interest in the farming,
research and political community. The concept has been framed as a means for improving sustainability,
in terms of energy and nutrient efficiencies while delivering ecosystem services. Recently, conservation of
landscape and soil quality at the regional level have been added to its virtues. Within the EU, policies such
as the CAP, Water Frame Directive and European Climate Change Programme call for accelerated
implementation of integral farming systems and related technologies. Previous world-wide research has
shown that opportunities exist for crop-animal systems in both low and high input systems (Van Keulen
and Schiere, 2004). A major challenge is to identify successful MFS and to assess the prerequisites for
extrapolating these systems to areas of different socio-economic and agro-ecological features.
Definitions of mixed farming systems may differ with respect to system boundaries, i.e. farm or regional
level. On-farm MFS are characterised by the presence of two (or more) agricultural sectors at a farm, e.g.
animal husbandry and arable farming. To count as MFS, the management of the productions should be
partially or fully integrated. Between-farm MFS concerns cooperation and/or shared land use by two or
more specialised farms. Each farm makes a sector-specific contribution. An example of cooperation is the
exchange of manure and straw. The distinction in on-farm and between-farm MFS offers the possibility to
assess the impact of the MFS on the regional environmental quality (Figure 1.1). Elements of such an
analysis could be the regional distribution of nutrients, availability of organic matter, or improvement of
water quality.
Figure 1.1. Land sharing as possible key feature of mixed farming systems (Donzallaz, 2012).
Between-farm mixing may include for instance the sharing of land between individual farmers and/or
third party land-owners. Examples are the exchange of manure from a dairy farm for maize from an
arable farmer, and the use of grassland in nature conservation areas by a dairy farmer. At field level, a
positive impact is known from the grassland – potato cooperation, as the potato benefits from the
nitrogen mineralisation after ploughing the grassland, thereby reducing nitrate leaching as compared to
other crops (e.g. new grassland, maize). However, not much is known about the impact of the sharing of
land on regional landscape and water quality as compared to specialised farming. It has been suggested
that the character of a cooperation between stakeholders may be regarded as the driving force for

7
reaching impact, which in the case of land sharing may be identified as ‘territorial synergy’ (Moraine,
2014).
Internationally, the debate on land sharing relates to quite a different goal, i.e. meeting demands for
world food production. The question of how to meet rising food demand at the least cost to biodiversity
requires the evaluation of two contrasting alternatives: land sharing, which integrates both objectives on
the same land; and land sparing, in which high-yield farming is combined with protecting natural habitats
from conversion to agriculture (Phalan et al., 2011). The complexity of the landscape is one of the key
factors in determining species richness. Thus Egan & Mortensen (2012) found that in more complex
landscapes land sharing would provide greater gains than land sparing. The explanation of this would be
that the majority of plant species in agroecosystems are found in small fragments of non-crop habitat so
that, in landscapes with little non-crop habitat, richness can be more readily conserved through land-
sparing approaches. Herzog & Schüepp (2013) pose the question whether the discussion on land sharing
versus land sparing is also relevant for Europe, where agriculture is withdrawing from marginal regions
whilst farming of fertile lands continues to be intensified. They argue that intensive agriculture and
biodiversity must and should be intertwined, e.g. on productive farmland, semi-natural habitats are
required to yield ecosystem services relevant for agriculture.
In the context of mixed farming systems within CANTOGETHER, land sharing refers to cooperation
between productive and ecological areas, and/or between livestock farms and arable farms (Description
of Work, 2011). In this study the focus is on the perspectives of land sharing, as part of MFS, to contribute
to the regional balance in soil organic matter. The evolution of SOC in both grasslands and arable fields
may be affected by management, e.g. tillage, fertilization and crop rotation (Figure 1.2). Low C-stock
and/or a negative C-balance are indicators for the risk of yield decline. As assessed by the EU-project
Smartsoil, at a European level major risks are found in the southern, Mediterranean part (Merante et al.,
2015). In addition to a potential yield decline, a low SOC is in general considered as negative for soil
biodiversity, also determining ecosystem functions such as nitrate leaching and carbon sequestration
(Rutgers et al., 2012). With the nutrients N and P of major importance for crop growth, as well as for
pollution of ground- and surface waters, the relationship between SOM and N needs special attention. A
decline in SOM may lead to an increase in nitrate losses and in particular leaching. Furthermore, a
reduction in SOM is all the more important since a reduction to the minimum contents for crop
production may be irreversible. It has not been studied, so far, to what extent land sharing and land use
change have an impact on regional soil and water quality. The working hypothesis of the present study is
that MFS, in particular involving land sharing are beneficial for regional ecological intensification. The
rational behind this is that when agriculture and nature share the environment, agriculture is the
responsible actor for maintaining/improving the environment, in terms of e.g. biodiversity and water
quality. The agricultural measures involved in the sharing of land are partly connected to conservation of
biodiversity, partly to improving water quality of ground- and surface waters.

8
Figure 1.2. Evolution of SOC as affected by land use and management (after Conijn et al. 2002, Arrouays
et al. 2002).
1.2 Objectives
With the above in mind, the EU-project CANTOGETHER (Crops and ANimal TOGETHER) aims to contribute
to the knowledge base for MFS in the EU, researching innovations in the sustainability of MFS at both the
farm and district level (www.CANTOGETHER.eu). The research includes a wide range of topics concerning,
e.g. socio-economy, energy production, GHG-emissions, and nutrient management. The present study is
directed at two agro-ecological aspects i.e. soil organic matter (SOM) and nutrients (N, P).
The objectives of the study were to analyse the impact of MFS on regional trends in soil organic matter
contents and (potential) nutrient losses in view of promoting land sharing for regional development.
Three mixed farming systems were assessed using empirical farm data from district level case studies in
the temperate climate zone in Europe. The strategies assessed were: (1) Reduction of N-leaching in dairy
farming; (2) Regional digesters of manure to provide organic matter in arable farming systems; (3) Land
sharing between dairy and arable farms, and between dairy farms and nature areas.
The divers character of the three case studies in terms of regional objectives, farming systems design,
stakeholder cooperation, and data heterogeneity do not allow the use of a complete harmonised
methodology. Instead, in each case study the best regional method was used to assess the impact of MFS
on regional trends in soil organic matter contents and nutrient losses. For each of the three case studies
the current situation (regional baseline) was examined and the impact of Innovations assessed. Selected
innovations offer perspective at the regional level and include some form of land sharing as discussed
above. This allows a synthesis and interpretation of the results in view of generalization of the research
findings for the EU.

9
2 Materials and methods
2.1 General approach
A farming systems approach was employed in the selected case study districts to compare specialised and
mixed farms. The specialised farms studied consisted of crop and livestock farms that employed one of
four district level crop-livestock integration strategies already defined within the project, i.e. (1) use of
animal manure/digestate in arable region; (2) implementation of ‘arable’ measures to reduce nitrate
losses in dairy region, (3) implementation of biodiversity measures to improve the landscape in dairy
region, (4) land sharing between dairy and arable farms. By describing and analysing the participating
farms and areas in terms of farm characteristics, soil quality, manure and nutrient management,
biodiversity practices, etc., we were able to characterise how the studied innovative crop-livestock
integration strategies work and are effective at district scale.
The general approach applied across the diverse case studies was to compare baseline(s) with
innovations. The baseline addressed specialised farms, the innovations considered the inclusion of arable
or biodiversity measures.
2.2 Methodology
This section describes the general methodology of the overall work in terms of selected indicators,
upscaling, and modelling. Details per case study are given in the respective chapters.
Soil organic carbon as indicator
The monitoring of soil organic matter is important from both agricultural and environmental viewpoints.
The early studies on environmental performance of farming systems did not include the C-status of the
soil. The development of climate smart agriculture changed that. At present, several indicators exist for
the monitoring of soil organic matter and nutrient losses, e.g. soil organic matter balance, soil organic C-
status (SOC), N-surplus, nitrate concentration in groundwater, etc. With regard to soil organic matter, it is
questionable whether the focus should be on the content or on the change in content. The term
‘indicator’ has been defined as: ‘a variable which supplies information on other variables which are
difficult to access and which can be used as benchmark to take a decision’ (Gras et al., 1989, in Van der
Werf and Petit, 2002). Indicators linked to environmental objectives with a local or regional geographical
target should be area-based, while indicators with a global focus should be product-based (Van der Werf
and Petit 2002; Halberg et al., 2005). Thus for C, the focus is on SOC when regional quality is concerned,
and on CO2/l milk when climate change is addressed. Also, indicators based on environmental effects of
farmer practices are preferable to indicators based on the practises themselves, as the link with the
objective is direct and the choice of means is left to the responsibility of the farmer.
Upscaling in time and space
Aim of this study was to assess the change in C-contents of soils over time for selected types of
agricultural land-use. Changes in SOC were assessed at field (crop) level as the net result of input and
mineralisation of organic matter per year. For this purpose, the carbon model Roth-C and the nitrogen
model CASIMOD’N are used (see next section). Validation was carried out, in so far as possible, with data
from monitoring SOC in the field, before upscaling results in time and space. Results were subsequently

10
extrapolated over time to the year 2050 (Dolnoslaskie and Winterswijk) and aggregated to the regional
level (Winterswijk and Lieue de Grève).
2.3 Modelling
2.3.1 Rothamsted Carbon Model (Roth-C)
The Rothamsted Carbon model (Roth-C) is a model that allows for modelling the effects of soil type, temperature, moisture content and plant cover on the turnover process (Coleman & Jenkinson, 1999). It is used in the case studies Dolnoslaskie and Winterswijk.
Roth-C was originally developed and parameterized to model the turnover of organic C in arable top soils from the Rothamsted Long Term Field Experiment. The model has performed well in predicting SOC changes by agricultural management in long-term experiments in neighboring countries using independent crop input data. In fact, it is a one of a very few models currently used world-wide to study global C dynamics and to report in national inventories of C stocks for the United Nations Framework Convention on Climate Change (Grace, 2005). Dynamics of the model has been extensively tested using long term SOC data from a wide range of soil types, land uses and environments and the model needs relatively few inputs (Skjemstad et al., 2004; Smith et al., 2005; Barancikova G., 2007).
In the model, soil organic carbon is split into four active compartments and a small amount of inert organic matter (IOM). The four active compartments are Decomposable Plant Material (DPM), Resistant Plant Material (RPM), Microbial Biomass (BIO) and Humified Organic Matter (HUM). Each compartment decomposes by a first-order process with its own characteristic rate. The IOM compartment is resistant to decomposition. The structure of the decomposition process as included in the model is shown in Figure 2.1 (Coleman & Jenkinson, 1999).
Figure 2.1. Schematic representation of the decomposition process in the Roth-C model. To run the model, first an initialization step is required. With this step the model is parameterized to local conditions by running it with local data until equilibrium in SOC- contents is reached. This may involve a period of 10.000 – 50.000 years. Subsequently, scenario analyses may be performed, using detailed monthly information on input of organic matter from crop and manure. As the model does not include a submodel for plant production, it needs few inputs, which are easily obtainable (Table 2.1).

11
Table 2.1. Input data for the Roth-C model.
Input category Data required
Weather Monthly rainfall (mm)
Monthly potential evapotranspiration (mm)
Average monthly mean air temperature (°C)
Soil Clay content of the soil (%)
Depth of soil layer sampled (cm)
Soil cover (yes / no)
Crop residues Monthly input of plant residues (C t .ha-1)
An estimate of the decomposability of the incoming plant material, the DPM/RPM ratio
Farmyard manure Monthly input of farmyard manure (FYM) (C t .ha-1)
It is necessary to indicate whether or not the soil is vegetated because decomposition has been found to
be faster in fallow soil than in cropped soil, even when the cropped soil is not allowed to dry out. The
plant residue input is the amount of C that is put into the soil per month (t C ha-1), including C released
from roots during crop growth. The amount of FYM (t C ha-1) put on the soil, if any, is inputted separately,
because FYM is treated slightly differently from inputs of fresh plant residues.
The decomposability of crop residues and input from farmyard manure is characterized by the DPM/RPM
ratio of the materials. In general, a value of 1.44 to the DPM/RPM ratio of crop residues may be used
(Coleman & Jenkinson, 1999). However, when it is necessary to distinguish between crop residues,
specific values are needed. These crop specific values may be obtained from a linear relationship
between the humification coefficient and the DPM/RPM-ratio (Anonymus, 2008):
DPM/RPM = -2,174 hc + 2,020 (for hc < 0,92; for hc > 0,92 DPM/RPM = 0)
2.3.2 The Casimod’N model
The integrative model CASIMOD’N (Catchment and Agricultural Systems Integrated MODel for Nitrogen)
assesses the effects of farming systems on nitrogen (N) dynamics at the catchment level (Moreau et al.,
2013). It was used in the case-study Lieue de Grève.
An important feature of the model is the consideration of the level of the farming system through
production strategies, farmer decisions and the expression of decisions as management practices, along
with the link between these farming systems, their practices and water pollution. CASIMOD’N integrates
farming systems at the farm level and N transfers and transformations at the field, farm and catchment
levels. It results from adapting and combining 3 models: the agro-hydrological model TNT2, which
simulates all N fluxes at the catchment scale (Beaujouan et al., 2002), and two decision-making models
that simulate farming system management at the farm scale, TOURNESOL (Garcia et al, 2005) and
FUMIGENE (Chardon et al., 2008). TNT2 is process-based and spatially distributed to account for potential
spatial interactions such as nitrate leached upslope and its effect on lowland uptake or bottomland
denitrification (Oehler et al., 2009). It represents crop growth and nitrogen transformation based on the
plant-soil model STICS. In TNT2, field management practices are input data.

12
TOURNESOL and FUMIGENE introduce the farming system level into CASIMOD’N. They have already been
applied independently to two farms with a detailed dataset (Chardon et al., 2008) and to one
experimental farm with a detailed dataset (Garcia et al, 2005), respectively. Both models are planning
models by optimisation and determine once a year, the management practices to apply to each field in
the coming year. TOURNESOL produces crop allocation plan and FUMIGENE a manure allocation plan to
fulfill the objectives of each farming system, given farmer constraints. The intrinsic logic behind farming
system design and function was represented by ensuring agreement between animal feeding and
manure-management strategies under specific farm constraints (land fragmentation, distance between
fields and farmyards) and agronomic rules. The model is thus able to simulate management practices
(crop, manure and mineral fertiliser allocation) and test the generated farming systems from scenarios
(Figure 2.2, (Moreau et al., 2013)).
Figure 2.2. Schematic representation of the CASIMOD’N model.
The model requires data as listed in Table 2.2.
farm
er
de
cisi
on
leve
lcr
op
an
d w
aste
allo
cati
on
leve
l
COUPLING DIAGRAM VLE IMPLEMENTATION
catc
he
me
nt
N f
luxe
s an
d
tran
form
atio
nle
vel
expression of
farmer strategy
agro-technical events :
management practices
year time step
daily time step
farm scale
grid / catchment scale
AM
based on STICS formalism
TFTF
Decision of pluriannual
crop and waste allocation
TF
agronomical model
TNT hydrological model
ITK Scheduler
infarmers strategies
agronomic rules
farm constraints
crop and
waste allocation
spatial catchment
description
climate
outlet fluxes
(discharge, nitrate)
N balances
out
in
out
vle information fluxes
data input and output

13
Table 2.2. Input data for the CASIMOD’N model.
Input category Data required
General strategy
type(s) of animal production (dairy, suckler, pig, poultry)
herd characteristics (size, breed, productivity, animals per age class)
animal requirements for silage maize animal requirements for silage and grazed grass animal requirements for straw cash crops (types, production)
Manure type (cattle manure, cattle slurry, pig slurry, poultry manure)
nitrogen content prohibition on spreading periods prohibition on spreading locations maximum number of applications per crop prioritisation of crop-manure pairs minimum and maximum manure rates by application
Crop crop type potential yield minimum and maximum durations in years for
perennial crops minimum return period
Field spatial distribution area farmstead location accessibility for dairy cows maximum distance for manure spreading soil agronomic potential
14
3 Assessment of Dolnoslaskie (PL)
3.1 The Challenge
In the Dolnoslaskie region, agriculture has become very intensive, characterized by a large use of inputs
and by a very low livestock density. Attempt was made to estimate the impact of present and future
specialized and mixed farming systems on SOC, using data from a long period (1960 – 2010). The process-
based SOC dynamic model Roth-C was applied to evaluate changes in SOC, using initial SOC content, data
of agricultural management and estimated carbon input from crops and manure as input data to the
model. The recorded changes of SOC contents in soil profiles were used for model validation. Finally,
comparison is made of the change in C-stock between specialized farms and MFS.
3.2 Description of the area
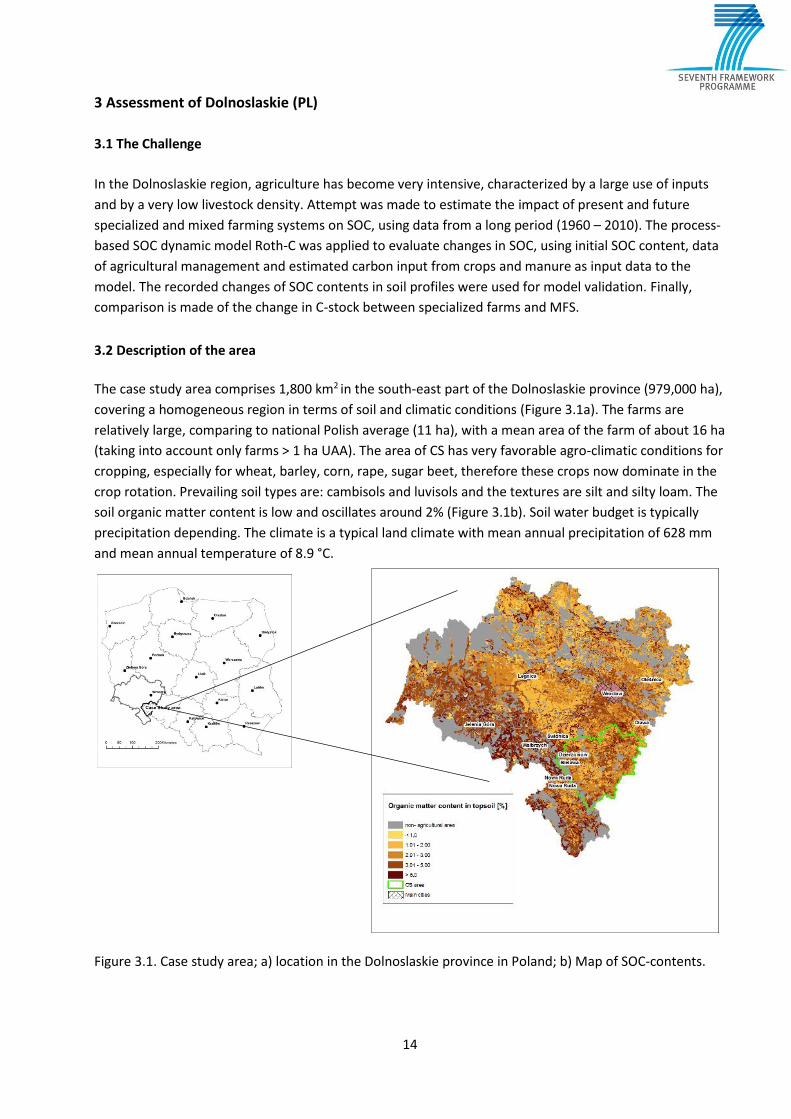
The case study area comprises 1,800 km2 in the south-east part of the Dolnoslaskie province (979,000 ha),
covering a homogeneous region in terms of soil and climatic conditions (Figure 3.1a). The farms are
relatively large, comparing to national Polish average (11 ha), with a mean area of the farm of about 16 ha
(taking into account only farms > 1 ha UAA). The area of CS has very favorable agro-climatic conditions for
cropping, especially for wheat, barley, corn, rape, sugar beet, therefore these crops now dominate in the
crop rotation. Prevailing soil types are: cambisols and luvisols and the textures are silt and silty loam. The
soil organic matter content is low and oscillates around 2% (Figure 3.1b). Soil water budget is typically
precipitation depending. The climate is a typical land climate with mean annual precipitation of 628 mm
and mean annual temperature of 8.9 °C.
Figure 3.1. Case study area; a) location in the Dolnoslaskie province in Poland; b) Map of SOC-contents.

15
Over the last 50 years, significant changes in agriculture have occurred, e.g. simplification of crop rotation,
decrease of forage crops area and livestock density. The production direction has changed considerably
over the period 1969 – 2010, from the mixed cropping-animal farming to highly specialized crop
production without livestock (Figure 3.2).
Figure 3.2. Crop structure of CS Dolnoslaskie in 1969 and 2010.
Also the acreage of the main crops, e.g. potatoes, cereals, grass, has changed considerably over time. In
1969, MFS were the predominant type of farming, with every farm having both livestock and arable crops.
Permanent grassland was c. 13% of total UAA (Table 3.1). Substantial doses of manure were applied to
the soil, following high livestock density (c. 80 LU / 100 ha UAA). In contrast, by 2010 most farms had
become highly specialized arable farms, without livestock (LU c. 14 / 100 ha UAA). At this time, most
agricultural land is occupied by arable land, i.e. the cropping area occupies 93% of UAA whereas
permanent grassland only 5,5%. Over time the areas in fodder and legumes/grasses diminished
accordingly.
Table 3.1. Changes of agricultural lands in the Dolnoslaskie region.
Year 1969 2010
Land Use Area size (ha)
Permanent grassland 216,539 144,955
Arable land
cereals 581,926 516,931
corn 7,039 71,042
oilseed 10,986 128,721
potatoe 130,163 23,410
sugarbeet 46,945 19,370
pulses 41,846 6,680
grassclover leys 54,479 9,451
Other 114,133 58,735
Total area 1,204,056 979,295
9,02,9
2,5
56,1
4,6
9,5
10,64,8
Share of crops in 1969
legume-grasspastures onarable land
oilseeds
corn
0,7
23
16
50,6
0,8 2,33,6
3
Share of crops in 2010
legume- grasspastures onarable landoilseeds
corn
cereals
16
Current options to improve SOC include a wider introduction of catch crops, introduction of straw as a
fertilizer (instead of use as a fuel in the boilers), and introduction of exogenous organic matter such as
digestates etc. as fertilizer. The role of biogas plant is visibly increasing in Dolnoslaskie region. In the area,
some groups of stakeholders are active to promote biogas production, e.g. arable farmers, companies for
manure digestion, and researchers. Efforts to improve the area are being carried out by the regional
government, who stimulates manure digestion as a means of higher input of organic matter to the
agricultural soils. Meanwhile, soil quality is being monitored on a systematic base. Other regional
programs in 2001-2010 decade involved co-financing of soil liming as a mean to sustain soil quality and
productivity potential.
3.3 Methodology
3.3.1 Outline
This case study aimed to evaluate changes in SOC stocks due to transformation from mixed farming
systems to specialized farming systems, in agricultural soils of the Dolnoslaskie province over the period
1960–2013, and, after validation, to give a forecast of the SOC responses to agricultural management in
2050. In addition, maps were drawn to indicate any regional variation in the modelled C-change.
3.3.2 Selection of baseline and time scenarios
The starting point for the scenario analysis was the situation in 1960 with mixed production system, low
intensity with animal production and diverse crop rotation (Table 3.2). The first baseline “as was” (S1)
reflects the low transition into specialized and more intensive production with simplification of crop
rotation and progressive decline in livestock density, as registered in the sensus data. In addition, a
second baseline (S2) constituted the (hypothetical) continuation of the sustainable starting situation. For
this scenario, constant areas of particular crops over the whole 1960-2010 period were assumed, but with
increase in yields, reflecting the statistics. Livestock density remained constant from the point when it
reached its maximum in 1988.
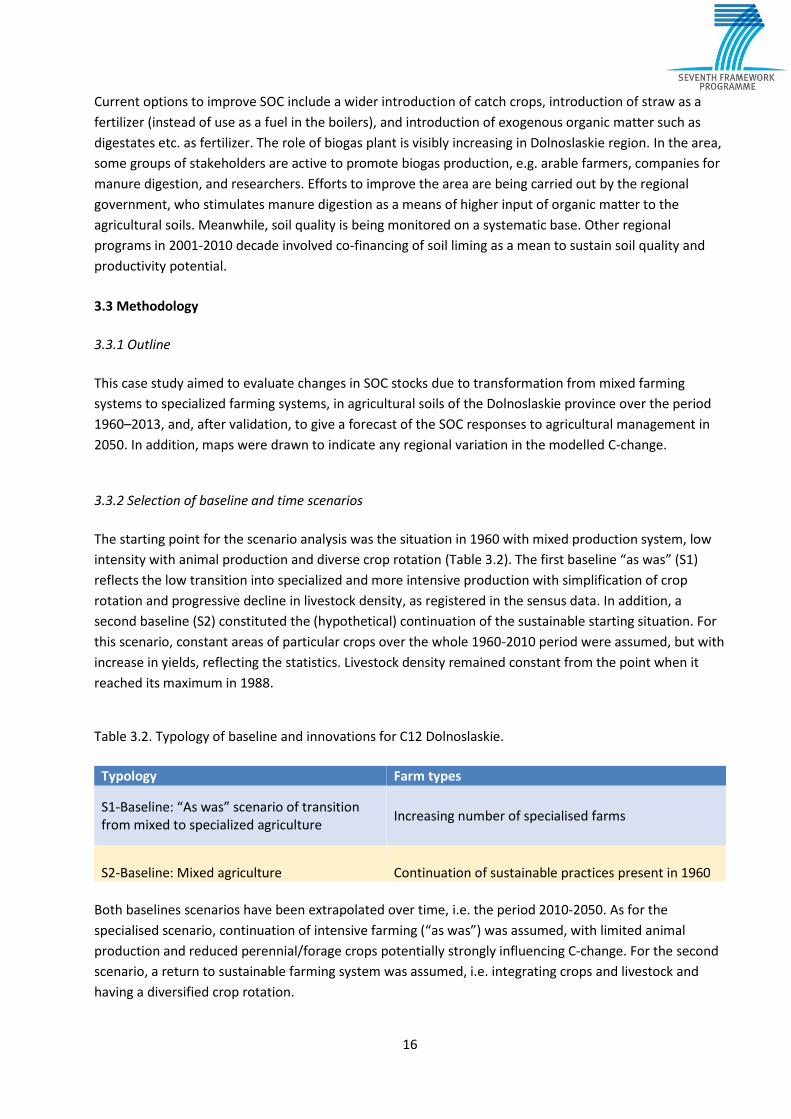
Table 3.2. Typology of baseline and innovations for C12 Dolnoslaskie.
Typology Farm types
S1-Baseline: “As was” scenario of transition from mixed to specialized agriculture
Increasing number of specialised farms
S2-Baseline: Mixed agriculture
Continuation of sustainable practices present in 1960
Both baselines scenarios have been extrapolated over time, i.e. the period 2010-2050. As for the
specialised scenario, continuation of intensive farming (“as was”) was assumed, with limited animal
production and reduced perennial/forage crops potentially strongly influencing C-change. For the second
scenario, a return to sustainable farming system was assumed, i.e. integrating crops and livestock and
having a diversified crop rotation.

17
3.3.3 Modelling
Roth-C was applied to evaluate changes in SOC, using initial SOC content, data of agricultural
management and estimated carbon input from crops and manure as input data to the model. The
recorded changes of SOC contents in soil profiles were used for model validation. The selection of the
Roth-C-26.3 model was based on its good performance in long-term experiments in neighbor countries
using independent crop input data (Ludwig et al., 2007; Barancikova et al., 2010a, b). Furthermore, the
input data required for running the Roth-C model correspond to what can be realistically collected at the
LAU-2 level in Poland for the period 1960 - 2014.
Initialisation First of all, the initial SOC content was used for running the Roth-C model to equilibrium under constant
environmental conditions. The constant climatic conditions were taken as the average of the climatic data
from 1960–1990. For each locality, firstly the model was run to equilibrium (10.000 years), iteratively
fitting carbon inputs to match the initial SOC stock and thus the distribution in fractions (DPM, RPM, BIO,
HUM) with different decomposition rates. The data of carbon and radiocarbon ages in all these
compartments received in equilibrium mode (initial soil state, initial radiocarbon ages) were used to run
the model in short term mode (for the modelling of SOC in the time period from 1960–2014).
Scenario analyses A step approach of cohorts of 10 years was applied for short term modelling (period 1960-2014),
corresponding to the availability of data from official agricultural statistics. The result of each step was
used as input data to the subsequent step. This method allows to illustrate trends in changes in organic
carbon content in relation to changing agronomic factors (and in consequence C-input from crop residues
and manure) and changes in soil organic carbon stock.
For the second analysis, i.e. the extrapolation of both scenarios over the time period 2010 - 2050, current
levels (2010) of carbon input from crops and livestock were taken into account.
Validation
The model outputs were validated using laboratory SOC measurements in soil samples collected in two
periods 1960-1970 and 2004-2013. For establishing initial SOC contents we used the database of
reference soil profiles, utilized in 1960-1970 in production of the analogue soil agricultural map of Poland.
The database contains approximately 10,000 georeferenced soil profiles across Poland, described and
analysed for basic soil parameters. In this database, 600 points represent the Dolnoslaskie region, and 94
profiles are located within the study area. A set of information describing the profiles contains: land use,
location of the profile within the landscape and slope, soil/land suitability class, soil type, texture, SOC
content, pH, available nutrients. The database was developed at IUNG, Pulawy. Roth-C modelling was
performed for each sampling location separately (94 soil profiles). A number of 94 separate forecasts was
obtained of SOC content (%) and SOC stock (t ha-1) for 2014 as response to SOC initial content, pedo-
climatic conditions and transformations in agriculture. A number of 34 out of the 94 soil profiles located in

18
the study area were re-sampled and analysed for SOC in 2010-2014 period. SOC levels measured in 2010-
2014 were then used for validation of the model projections.
3.3.4 Data collection
The following information fed the Roth-C-26.3 model used in the study:
Agronomic factors
Indicators potentially explaining impact of agricultural management on SOC content and trends were
extracted from National Agricultural Census of Poland (Central Statistical Office of Poland, 2015) for the
following years: 1960, 1969, 1979, 1988, 1996, 2002 and 2010 with relatively high spatial resolution (data
for LAU-2). The database contains information on area of individual crops, their yields, livestock density
and mineral or organic fertilizer rates. These data were used to estimate annual carbon input from crops
and manure. The average carbon input was calculated every 10 years (according to the times when
editions of the agricultural censuses were carried out) to be used in Roth-C (Table 3.3).
Table 3.3 Yield and C input changes within 1960-2010 period for CS Dolnoslaskie.
Year Yield cereal1 Plant input Manure input
FM t.ha-1 C t.ha-1
1960 2.154 0.71 0.34
1969 2.839 0.81 0.44
1979 4.031 0.81 0.55
1989 4.080 0.95 0.36
1996 3.966 1.28 0.19
2002 4.296 1.56 0.12
2010 5.155 1.78 0.07 1 average grain yield of wheat, rye, barley and oat
For croplands, the weighted carbon input from residues was calculated based on the area of the crop
reported in the agricultural census and the values for individual crops. The current crop C input values
were adjusted over time to represent the trends in crop yield during whole decades by means of
converting historic crop yield data into carbon input. A linear relationship between crop yield and carbon
input was used (Franko, 1997), with coefficients of C accumulation by Franko (1997) as a base. Two
alterations were deemed necessary. Firstly, original calculations (Franko, 1997) did not include the input
of root carbon. Therefore, the root C-input for non-cereal crops was obtained by multiplication of their
above-ground inputs by 1.15, and cereal and oilseeds above-ground inputs were multiplied by 1.25. Most
authors use multiplier 1.5 (Van Wesemael, 2010) for cereals, but that value led to considerable
overestimation of model results in our modelling process (rapid increase of accumulated C in all soils
within short time). Secondly, the relationship between crop residues and grain yield is not linear when
considerable changes occur in, e.g., selection and performance of crop cultivars, harvesting methods
and/or straw management strategies. These types of changes had been occurring in the period 1960-
2000. In order to better reflect the trend of these changes for cereals, oilseeds and maize, a direct
method was used for calculating the amount of crop residues and organic carbon, in accordance with the
methodology of Johnson et al. (2006).
19
The estimate of the decomposability of the plant material was set as default value in the model. The
information on the length of period when soil is covered by plants was equal to the length of vegetation
period in the area.
Carbon input from manure was derived from the livestock numbers in each category (livestock unit per 1
ha arable land) multiplied by their average manure production and the time spent in the stables. Based on
statistical data and literature we also took into account the method of holding animals (shallow or deep
litter), which affects the consumption of straw and manure production. Because no information is
available about the ratio manure /slurry (especially in the past), therefore, it was assumed that the whole
organic fertilizers was farm yard manure with 25% of dry matter and organic C content was 35% of the dry
matter.
Climatic data
Climatic data were obtained from the Model of Agroclimate of Poland (MAP) in the GRID format (Górski &
Zaliwski (2002). This model is based on the meteorological station network belonging to the Institute of
Meteorology and Water Management and some mathematical algorithms (taking into account e.g.
elevation). The mean annual precipitation in the study area is 643 mm and mean annual temperature is
8.9 °C. Potential evaporation was calculated from potential evapotranspiration (MAP) by dividing it by
0.75 as suggested by Coleman and Jenkinson (1999).
Soil data
The initial organic carbon stock in the IUNG database was calculated using bulk density assessed with a
pedotransfer function (PTF). Depth of top soil layer was calculated taking the changes of tillage depth
over time into account. The historical SOC data represent the 60’s and 70’s of the last century when the
depth of soil conversion was smaller than presently. Deeper tillage resulting from more intensive
mechanization and modern machinery had an effect in dilution of SOC in topsoil (Van Meirvenne et al.,
1996). The change concerned the 25-30 cm layer. It was assumed in our study, based on the databases of
historical soil profiles, that prior to mixing 0 – 25 cm and 25 – 30 cm layers, organic matter content in the
layer of 25-30 cm was half of its content in the soil top layer (Stuczynski et al., 2007). The initial SOC
content was corrected for change in ploughing depth (see Appendix A).
Roth-C modelling was performed for each sampling location separately (94 soil profiles). Therefore we
obtained 94 separate forecasts of SOC content (%) and SOC stock (t ha-1) for 2014 as response to SOC
initial content, pedo-climatic conditions and transformations in agriculture.
3.4 Results
3.4.1 Baseline modelling
The modelling processed for scenario S1 revealed that, on average, SOC stocks, after decreasing in 70’s
and 80’s, started to raise from the beginning of 21th century as response to intensification of crop
farming (Figure 4.4). This constant increase has been observed until final year of the forecast. It must be
noted that in 1960-2010 period rapid increase in yields was observed, resulting in higher amounts of plant
residues (Table 3.3). This effect was also related to progress in plant breeding effectiveness, affecting crop
yields, crop resistance to diseases and changing grain/straw ratio. The second baseline scenario assumed

20
that from the end of the 80’s, mixed farming system was kept (Figure 3.4, blue line). This scenario shows
an almost constant SOC, with minor changes only visible at narrow scale. Even so, the change starts as
sharply around 1999, as for the trend lines at medium and high SOC (orange and brown lines,
respectively). The trend line at low SOC (yellow line) shows a sharp change at around the year 1989.
These sharp changes cannot be fully explained by changes from the 10-year census.
3.4.3 Validation
The initial contents of SOC in sampling locations (n=34) included in the comparative soil analyses were in
the range 0.5 – 1.7 % with the highest concentration around 0.8 – 0.9 %. The SOC measurements
performed in the same profiles in 2010-2013 revealed SOC accumulation in most of sampling locations.
However, the relationship between SOC initial content and the size of SOC change was weak and
statistically insignificant.
Results of the repeated SOC measurements correspond to SOC increase observed in the modelling
process for the S1 “as was” scenario under which in most soil profiles the lower or greater increase in
SOM content was found after 40-50 years. The Roth-C model explained 56% of variability of the measured
SOC stock which can be treated rather as a good prediction, especially taking the resolution of the
agricultural data included in the model into account. Therefore, the use of the regressions derived with
the Roth-C model and the available census data were considered appropriate for extrapolation over the
longer time period up to 2050.
3.4.1 Extrapolation over time
The forecast of potential future SOC changes was performed for the S1-specialization and S2-Return to
MFS scenarios. As input data the results from the S1 Baseline modelling were used. For the S1-
specialisation scenario, currently 90% of the land use consists of cereals (mainly wheat and barley), rape
and corn. A first assumption was constant C input from crops and manure between 2015 and 2050.
Farming in this region is already highly specialized, and a further increase in specialization is not likely.
Also, implementation of new practices under the European “greening” policy will not affect C input in the
region. The obligation for farmers to maintain 5% of arable land as Ecological Focus Area will be likely
fulfilled by cover crops. This may include cultivation of green manures, but in a small amount that will not
significantly replace manure. A second assumption was that all straw from corn and rape remains on the
fields and is ploughed into the soil. Hence even in the S1-Specialisation scenario the Roth-C model
calculated an increase in C over time, i.e. from 49,500 kg.ha-1 in 2014 to 52,000 kg.ha-1 in 2050.

21
Figure 3.4 Average trend of modelled SOC stock changes in scenario S-1 and example trends for individual
soils with the highest, lowest and median initial SOC content. Bars mean average manure and plant inputs
of C in years of national agricultural census. Upper plot presents SOC stock changes in S-1 scenario in
narrow scale in order to better show SOC fluctuations with time.
22
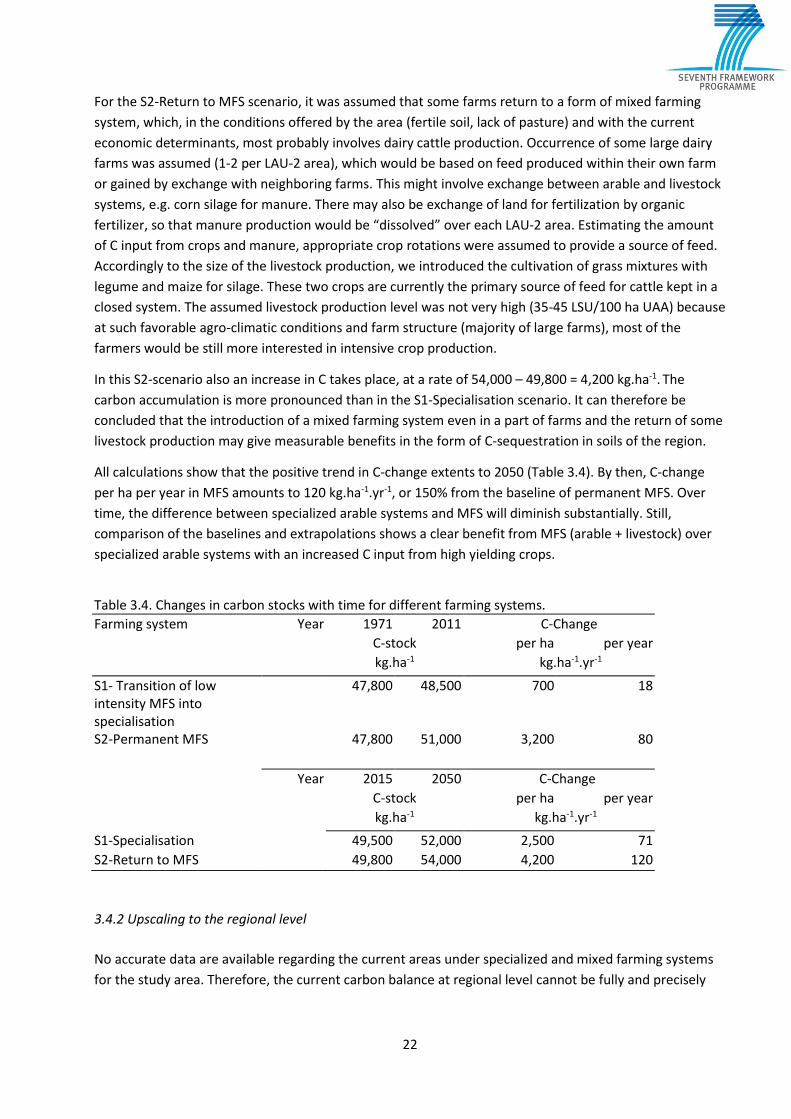
For the S2-Return to MFS scenario, it was assumed that some farms return to a form of mixed farming
system, which, in the conditions offered by the area (fertile soil, lack of pasture) and with the current
economic determinants, most probably involves dairy cattle production. Occurrence of some large dairy
farms was assumed (1-2 per LAU-2 area), which would be based on feed produced within their own farm
or gained by exchange with neighboring farms. This might involve exchange between arable and livestock
systems, e.g. corn silage for manure. There may also be exchange of land for fertilization by organic
fertilizer, so that manure production would be “dissolved” over each LAU-2 area. Estimating the amount
of C input from crops and manure, appropriate crop rotations were assumed to provide a source of feed.
Accordingly to the size of the livestock production, we introduced the cultivation of grass mixtures with
legume and maize for silage. These two crops are currently the primary source of feed for cattle kept in a
closed system. The assumed livestock production level was not very high (35-45 LSU/100 ha UAA) because
at such favorable agro-climatic conditions and farm structure (majority of large farms), most of the
farmers would be still more interested in intensive crop production.
In this S2-scenario also an increase in C takes place, at a rate of 54,000 – 49,800 = 4,200 kg.ha-1. The
carbon accumulation is more pronounced than in the S1-Specialisation scenario. It can therefore be
concluded that the introduction of a mixed farming system even in a part of farms and the return of some
livestock production may give measurable benefits in the form of C-sequestration in soils of the region.
All calculations show that the positive trend in C-change extents to 2050 (Table 3.4). By then, C-change
per ha per year in MFS amounts to 120 kg.ha-1.yr-1, or 150% from the baseline of permanent MFS. Over
time, the difference between specialized arable systems and MFS will diminish substantially. Still,
comparison of the baselines and extrapolations shows a clear benefit from MFS (arable + livestock) over
specialized arable systems with an increased C input from high yielding crops.
Table 3.4. Changes in carbon stocks with time for different farming systems.
Farming system Year 1971 2011 C-Change
C-stock per ha per year
kg.ha-1 kg.ha-1.yr-1
S1- Transition of low intensity MFS into specialisation
47,800 48,500 700 18
S2-Permanent MFS 47,800 51,000 3,200 80
Year 2015 2050 C-Change
C-stock per ha per year
kg.ha-1 kg.ha-1.yr-1
S1-Specialisation 49,500 52,000 2,500 71
S2-Return to MFS 49,800 54,000 4,200 120
3.4.2 Upscaling to the regional level
No accurate data are available regarding the current areas under specialized and mixed farming systems
for the study area. Therefore, the current carbon balance at regional level cannot be fully and precisely

23
assessed. This would also require estimating SOC change in land under permanent grassland. So far there
is no indication that the SOC change in permanent grasslands would be negative.
Geo-referencing all individual locations enabled spatial expression of modelled C stock changes. A C-stock
change map was produced in Arc-GIS 9.2 software based on the digital soil-agricultural map of Poland in
scale 1:25,000. The data of soil profiles for which the individual modelling was performed were linked to
the map polygons. The soil map polygons represent soil texture, soil type and soil/land suitability class.
The relationship between chemical characteristics of soil profiles and soil polygons enabled extrapolation
of such soil data as initial SOC stock and SOC stock change within 1971-2050 period.
The algorithm used for the extrapolation assumed assigning the map polygons to soil profile data based
on similarity of soil texture. In addition, the algorithm involved compatibility of soil/land suitability classes
and physiographic regions, according to Kondracki (2002). Another important condition for linking the
given polygon with the given soil profile of similar characteristics is the closest distance from the centroid
of polygons to the soil profile. The proximity of locations of soil profiles and polygons is very important
because the statistical data describing agronomic factors (crop structure, yield, fertilization, etc.) are
collected at LAU-2 administrative level, independent from the soil spatial diversity.
Figure 3.5 left shows the change in SOC for S1-Specialisation in 2050, with a large area having an
intermediate SOC (50-60 kt.ha-1). When this area would be converted to MFS, the resultant would be a
decline in SOC (Figure 3.5 right). This is supposedly due to the occurrence of cash cropping as part of the
MFS. However, in a larger part of the area the difference between S2-Return to MFS and S1-Specilisation
is positive (green). This is of particular importance given the low SOC prevailing in this area under the S1-
Specialisation system.

24
Figure 3.5. Upper: Forecast of SOC stock in arable land of CS Dolnoslaskie in 2050 in S1-Specialisation; Lower:
difference in C stock between S2-Return to MFS and S1-Specialisation.

25
3.5 Discussion
In this study both crop-specialized and MFS scenarios projected accumulation of SOC. Carbon
sequestration in the scenario representing transition from MFS to specialized crop production was
confirmed by SOC measurements in samples collected from the same soil profiles taken in 1960-1970 vs
2010-2014
The SOC contents in the Dolnoslaskie area are low comparing to European data, collected within LUCAS
project (Toth et al., 2013). Average SOC content in the climate zone containing Poland (sub-oceanic to
sub-continental) in LUCAS programme was 1.5%, whereas in Atlantic and Suboceanic zones they were 2.0
and 1.9%, respectively. Given the very low SOC contents the case study area, it is not surprising that any
input of crop residues would make a positive contribution to SOC.
SOC stock in agricultural land is ultimately determined by an equilibrium between the annual input of
crop residues and other organic inputs, and the annual rates of decomposition. This theory of the steady
SOC state is well supported by long term experiments (Sleuter et al., 2006). In addition, the equilibrium
has a strong pedo-climatic dependence, as both the parent material and temperature and moisture are
driving forces of mineralization process. The influence of agricultural management is by the addition of
organic matter (amount and quality), soil tillage, i.e. ploughing, and fertilization.
Numerous regional studies showed declining SOC stocks in intensively managed croplands in Europe
during last few decades (Sleutel et al., 2003; Belamy et al., 2005; Saby et al., 2008). In contrast, other
studies have reported increases in the topsoil SOC stock under intensive arable land use (Van Meirvenne
et al., 1996; Nieder and Richter, 2000, Barancikova et al. (2010)). In many of these latter cases, SOC gain
was accompanied by deepening ploughing depth and substantial surge of mineral or animal fertilizer rates
over a period of several decades (Sleuter et al., 2006). In Dolnoslaskie slow SOC decline between 70’ and
end of 90’s corresponded to livestock decline, accompanied with changes in crop structure, as in similar
situation described by Goidts and van Wesemael (2007). Such transitions in agriculture were associated
with higher yields due to cultivar breeding, but also higher harvest indexes, increased share of root crops
in the rotation and reduced area of legumes.
In the case of Dolnoslaskie the probable reason for the observed SOC accumulation is the high input of
plant residues, especially straw of cereals, rape and corn grown for grain. After the economic
transformation in Poland in 1990, most of arable land passed into private hands. These farms shifted
production into crop production, therefore corn and rape reached a large share in the crop structure.
Under favorable pedo-climatic conditions in this area they achieved high yields, therefore substantial
amounts of straw remained in the field and was ploughed. Moreover, with very low livestock density, the
straw is nowadays almost fully left in the field. Highly developed, intensive agriculture provides optimal
nitrogen fertilization, which enables high yields and have a positive effect on the process of plant residue
humification (Goidts et al., 2007).
The estimation of the SOC changes was very much dependent on the key figures for carbon input from
crop residues and manure. Over the study period, crop production has increased due to increased use of
fertilizers. This will have led to higher input from crop residues than in the early stages. The modelling
took this into account only by increasing C-input at decanal scale, no distinction was made in DPM/RPM
ratios of specific agricultural crops.

26
In considering implementation of MFS at a wider scale and/or extrapolating to other areas, two points of
special interest are the level of intensity (proportion of cereal and grass-clover leys vs. root crops) and the
availability of manure. Further model explorations may indicate to what extent the system may be further
optimised. However, it must be pointed out that one of reasons for the modelled and observed SOC
accumulation trends was the low initial SOC content in most of soils in the study area. Similar SOC
sequestration under crop specialization could not be expected for soils initially rich in organic matter.
3.6 Conclusions
The research proposed the approach for combining spatial soil and climatic data with statistical
information on agriculture and confirmed its utility for modelling SOC stock changes using Roth-C model.
The method has certain limitations and weaknesses, e.g. resolution of statistical data on agriculture,
however provides reliable projections of SOC stock trends, validated by comparative soil analysis in the
same georeferenced locations.
At the regional level it was assessed that both specialised and mixed farming systems may increase SOC
levels, with highest contribution offered by MFS including dairy farming. However, currently there are no
effective policy instruments and strategies stimulating development of animal production sector in the
region.
Scenario analysis revealed that potentially Dolnoslaskie has high capacity for increasing SOC levels in
agricultural soils by a return to mixed farming systems. Mean contribution by MFS was assessed at 120
kg.ha-1.yr-1 in the period until 2050, which may be considered significant in the framework of climate
change.

27
4. Assessment of Winterswijk (NL)
4.1 The Challenge
The region of Winterswijk is known for its small-scale ‘coulissen’ landscape with high nature and
landscape values. The larger part is used for agriculture and the remainder is forest and nature areas.
Land use is dominated by grassland (65%) and maize silage (24%). Mixed farms were dominant in the
landscape for centuries up to the midst of the 20th century. After the introduction of maize silage and the
EU-milk quota system, specialisation took place in dairy husbandry systems. A major environmental
concern in the area is the water quality, of which the nitrate and phosphorous content in major rivers are
too high. Though most farms are under pressure of high natural constrains, agriculture is considered the
base for landscape preservation. Farmers and other stakeholders in the region are involved in projects
testing innovative practises, e.g. to reduce mineral losses and increase biodiversity. So far, the impact of
such measures on soil organic carbon has not been taken into account. The present case study aims to
assess the effects of specialised and mixed farming systems on the regional soil carbon balance.
4.2 Description
Agricultural area
The municipality of Winterswijk is part of the Achterhoek district, a region of the province Gelderland,
located in the eastern part of the Netherlands along the border with Germany (Figure 4.1). The area (c.
20,000 ha) is known for its small-scale ‘coulissen’ landscape with high nature and landscape values,
consisting of a mosaic of grasslands, arable fields, hedgerows, woodlots and small brooks with high water
quality. The larger part is used for agriculture (c. 15,000 ha) and the remainder is forest and nature areas.
Land use in Winterswijk is dominated by grassland (65%) and maize silage (24%). Other crops are cereals
(4%) and potatoes (6%). Only 1% is used for horticulture, tree nurseries and fruit production.
Figure 4.1. Location of the CS Winterswijk region in the Netherlands.
Achterhoek
Winterswijk
The Netherlands
28
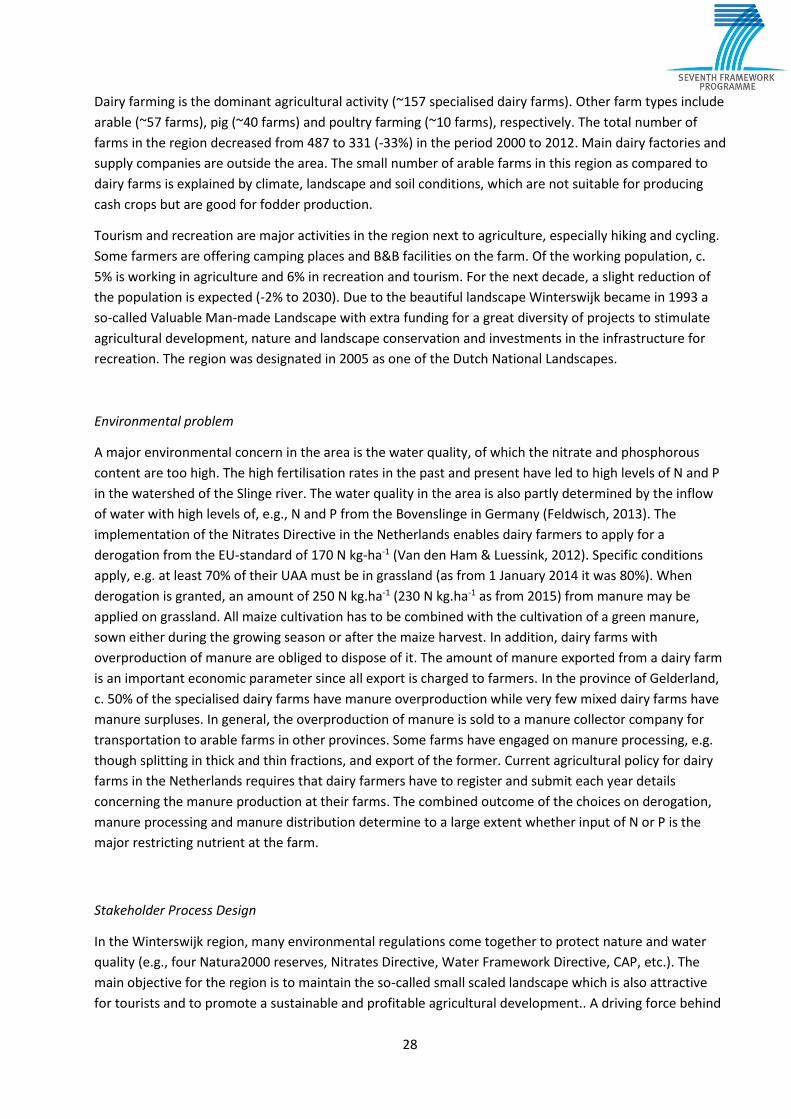
Dairy farming is the dominant agricultural activity (~157 specialised dairy farms). Other farm types include
arable (~57 farms), pig (~40 farms) and poultry farming (~10 farms), respectively. The total number of
farms in the region decreased from 487 to 331 (-33%) in the period 2000 to 2012. Main dairy factories and
supply companies are outside the area. The small number of arable farms in this region as compared to
dairy farms is explained by climate, landscape and soil conditions, which are not suitable for producing
cash crops but are good for fodder production.
Tourism and recreation are major activities in the region next to agriculture, especially hiking and cycling.
Some farmers are offering camping places and B&B facilities on the farm. Of the working population, c.
5% is working in agriculture and 6% in recreation and tourism. For the next decade, a slight reduction of
the population is expected (-2% to 2030). Due to the beautiful landscape Winterswijk became in 1993 a
so-called Valuable Man-made Landscape with extra funding for a great diversity of projects to stimulate
agricultural development, nature and landscape conservation and investments in the infrastructure for
recreation. The region was designated in 2005 as one of the Dutch National Landscapes.
Environmental problem
A major environmental concern in the area is the water quality, of which the nitrate and phosphorous
content are too high. The high fertilisation rates in the past and present have led to high levels of N and P
in the watershed of the Slinge river. The water quality in the area is also partly determined by the inflow
of water with high levels of, e.g., N and P from the Bovenslinge in Germany (Feldwisch, 2013). The
implementation of the Nitrates Directive in the Netherlands enables dairy farmers to apply for a
derogation from the EU-standard of 170 N kg-ha-1 (Van den Ham & Luessink, 2012). Specific conditions
apply, e.g. at least 70% of their UAA must be in grassland (as from 1 January 2014 it was 80%). When
derogation is granted, an amount of 250 N kg.ha-1 (230 N kg.ha-1 as from 2015) from manure may be
applied on grassland. All maize cultivation has to be combined with the cultivation of a green manure,
sown either during the growing season or after the maize harvest. In addition, dairy farms with
overproduction of manure are obliged to dispose of it. The amount of manure exported from a dairy farm
is an important economic parameter since all export is charged to farmers. In the province of Gelderland,
c. 50% of the specialised dairy farms have manure overproduction while very few mixed dairy farms have
manure surpluses. In general, the overproduction of manure is sold to a manure collector company for
transportation to arable farms in other provinces. Some farms have engaged on manure processing, e.g.
though splitting in thick and thin fractions, and export of the former. Current agricultural policy for dairy
farms in the Netherlands requires that dairy farmers have to register and submit each year details
concerning the manure production at their farms. The combined outcome of the choices on derogation,
manure processing and manure distribution determine to a large extent whether input of N or P is the
major restricting nutrient at the farm.
Stakeholder Process Design
In the Winterswijk region, many environmental regulations come together to protect nature and water
quality (e.g., four Natura2000 reserves, Nitrates Directive, Water Framework Directive, CAP, etc.). The
main objective for the region is to maintain the so-called small scaled landscape which is also attractive
for tourists and to promote a sustainable and profitable agricultural development.. A driving force behind

29
regional development in this area is the foundation ’Waardevol Cultuurlandschap Winterswijk’ (valuable
cultural landscape, WCL Winterswijk), a platform in which municipality, farmer’s organization, owners of
small estates, local nature and environmental groups, recreation and tourism sector, local industries and
citizens groups of the different villages cooperate. WCL Winterswijk (www.wclwinterswijk.nl) aims to
maintain the beautiful small scale landscape, develop the agricultural infrastructure and improve the
ecological values of the region. Since its foundation in 1994, WCL has been active in many projects in the
region, including the development of multifunctional and sustainable agriculture. Since farmers play an
important role in the maintenance of the landscape, continuation of farming is considered essential for
landscape conservation. Farmers from their part are willing to protect nature, landscape and environment
but need to be rewarded for their efforts. Facilitated by WCL, stakeholders in the region are working
together to sustainably strengthen the region (Figure 4.2).
Figure 4.2. Stakeholder model of the mixed farming systems in the CS Winterswijk. Within the framework of CANTOGETHER, the type of integration in CS Winterswijk was identified as
‘territorial synergy’ (Moraine et al., 2014). Important projects in the stakeholder process so far were the
development (and failure) of a rewarding scheme for farmers that deliver ecological services for society,
and the testing of innovative agricultural practices aimed at improving biodiversity and water quality. In
the coming decade, WCL will continue its work to maintain a viable and ecologically sound agriculture
(WCL Vision 2015-2025).
Mixed farming systems
In the region, mixed farms with combinations of arable, pig and dairy production were dominant in the
landscape for centuries up to the midst of the 20th century. After the introduction of maize silage in the
60’s, most arable fields have been turned into fields with silage maize, often in rotation with grassland.
After the arrival of the milk quotas in the 80’s, further specialisation took place in dairy husbandry

30
systems, which is the dominant agricultural activity up to this day (~157 specialised dairy farms). As from
this period, the milk production per cow increased substantially. Following the implementation of the
Nitrates Directive, most dairy farms have opted for derogation (which up to 2014 was based on 70% grass
and 30% maize per farm), that gives them higher manure-application limits.
Land sharing as part of a mixed farming system refers to the territorial synergy of the stakeholder process.
To a certain extent land sharing is linked to governance aspects, e.g. ownership of agricultural lands by
third parties and short-term lease to farmers. Examples of land sharing are the cultivation of crops
(cereals, potato) on grasslands in-between their renewal, various agricultural measures to improve water
quality and biodiversity, and the management of so-called natural grasslands. Farmers in the region have
been involved in projects testing innovative practises aiming at sustainable agriculture. This included
measures directed at diversification of crops to stimulate biodiversity (Korevaar and Geerts, 2012;
Korevaar et al, 2014) and reduction of N- and P-losses to ground and surface waters (Den Boer and De
Haas, 2013). The testing of the measures to reduce N- and P losses included both the effect on N and P as
well as on yield, costs and practical applicability. Measures to improve and stimulate biodiversity may be
applicable to agricultural fields (e.g. cultivation of cereals as dairy concentrates) and/or the natural
boundaries (i.e. hedgerows) surrounding them (Appendix B, Table B.1). Application of the measures to
reduce potential mineral losses (e.g. refrain from applying manure, raise pH) to all suitable fields in a
subregion of 5000 ha would lead to a reduction of 123 t N and 72 t P2O5, amounting to 8-9% of the N
applied in the area as manure and chemical fertilisers and 19-20% of the P2O5 applied.
4.3 Methodology
4.3.1 Outline
A scenario analysis was performed for a farm typology of baselines and innovations to assess change in SOC
from measures that had been selected for their capacity to improve biodiversity and/or reduce mineral
losses. The results were used for upscaling to the regional level. To this end, calculations were performed
at increasing level of spatial scale:
Step 1: at field level, per cultivation, using Roth-C;
Step 2: at farm level, per farm type, from a summation of the results per cultivation, of SOC-changes at field
level (times, area, size);
Step 3: at regional level, from a summation of the results per cultivation, of SOC-changes at field level
(times, area, size in the region).
The time-scale of the scenario analysis was twofold, i.e. a 20 year period was kept as a period over which
an individual farmer might influence SOC in his land, and a 35 year period was kept in order to assess SOC
changes in the year 2050.
4.3.2 Selection of baseline and innovations
Since dairy farming is the dominant farming system in the CS Winterswijk, the focus of this study was on
assessing SOC change for mixed dairy farming systems, in particular with respect to land sharing.
Innovations were selected from the earlier work from Korevaar & Geerts (2012) and Den Boer & De Haas
(2013), including those measures that may have an impact on soil organic matter (Appendix B, Tables B.1
and B.2). These innovative measures were grouped as follows:

31
Dairy farming with extra crop:
cereals for dairy concentrates;
potato cultivation; and
grass clover.
Dairy with ecosystem service:
no farm yard manure;
raise pH to 5.5; and
full catch crop in maize.
Thus two types of mixed dairy farming systems were considered. For the purpose of comparison,
specialised arable and specialised dairy farm were included as baselines (Table 4.1).
Table 4.1. Typology of baseline and innovations in CS Winterswijk.
Typology Farm types
S0-Baseline 1: Specialised arable farming Arable farms with potato / cereals / sugar beet rotation
S0-Baseline 2: Specialised dairy farming Dairy farms with grass/maize rotation, using their manure on their own land and buying concentrates
S1-Innovation: Mixed dairy farming with crops
Dairy farms that cultivate potato for cash income, or grow cereals and grass-clover leys as cattle feed.
S2-Innovation: Mixed dairy farmers with services
Dairy farms that take measures for biodiversity and/or improvement of water quality
The notation ‘specialised’ in this case study does not relate to intensity in terms of production per ha or
input per production-unit. It indicates only that a single agricultural sector is being practised at the farm.
A specialised dairy farm could be both an extensive dairy farm producing all grass and roughage, using all
produced manure, as well as an intensive farm that imports concentrates and exports manure. Thus the
specialised farms do not necessarily share a similar ‘environmental profile’ in terms of external inputs,
losses and/or footprint.
4.3.3 Data collection
Farm type
Farm data conforming the typology of baselines and innovations was collected via an inventory in the
region with respect to a single calendar year (2012) via farmer face-to-face interviews and follow-up
contact. Farmers were approached from the network of farmers that had resulted from previous projects.
In addition to general features, the interviews focussed on aspects relevant for nutrient management, e.g.
farm local context, integration practices, farming practices, input use, feeding strategies, fertilising
strategies, land use, nutrient recycling, and agronomic and economic performance. Afterwards, all farms
were assigned to one of the four distinguished typology groups (Table 4.2).

32
Table 4.2. Characteristics of typical farms groups in CS Winterswijk.
Parameter Specialised Arable Specialised Dairy Mixed Dairy (crops) Mixed Dairy (services)
Number of farms 4 2 4 3
Utilised agricultural area (ha) 169 ± 78 101 ± 3 55 ± 8 64 ± 6
Milk production (ton) not relevant 1187 ± 224 650 ± 97 641 ± 163
Permanent grassland (%) 0 69 ± 2 58 ± 13 70 ± 11
Temporary grassland (%) 11 ± 11 0 11 ± 10 4 ± 4
Grass-clover (perm. or temp.)
(%) 0 0 10 ± 6 33 ± 33
Silage Maize (%) 15 ± 7 31 ± 2 18 ± 5 14 ± 5
Potatoes (%) 56 ± 19 0 4 ± 4 0
Cereals (%) 15 ± 14 0 7 ± 5 12 ± 10
Stocking rate (LSU ha-1) not relevant 1.97 ± 0.23 1,83 ± 0,23 2.04 ± 0,37
NUE (%) 113 ± 19 25 ± 1 27 ± 2 39 ± 4
PUE (%) 142 ± 29 45 ± 3 57 ± 6 108 ± 4
N surplus (kg.ha-1)1 1 ± 16 216 ± 37 215 ± 29 93 ± 22
P surplus (kg.ha-1)1 4 ± -4 16 ± 1 12 ± 3 -1 ± 1
Other crops (%) 3 ± 3 0 1 ± 2 0 1 NP surplus is calculated on the bases of ha in use by the farmer, irrespective of ownership of the land.
Land use
Derogation requires a proportion of lands cropped with grass and maize/other crops (70-30%, as from
2014 80-20%). From a farming systems perspective, the area of a specific crop at a farm has more
informative value than the actual proportion since farm management of the fields is partly influenced by
the area a farmer has to manage. This may be even more so in a small-scale landscape with hedgerows
and with respect to extra crops and/or ecosystem services. Based on the empirical data from the
inventory, four standard configurations of farming systems were formulated, assigning key figures for the
area sizes per crop in AA (Table 4.3).
Table 4.3. Land use at model farm types in CS Winterswijk.
Farming system Grass* Potatoes Maize Cereals Total
ha
Arable, specialised 120 40 10 170
Dairy, specialised 70 30 100
Dairy, mixed with arable crops 30 5 10 5 50
Dairy, mixed with services 50 10 5 65 * mixed systems: grass-clover
4.3.4 Modelling
To assess the validity of the Roth-C model in the region of Winterswijk, the model was run with data from
two fields of the experimental farm ‘De Marke’ and validated by comparison with SOC-measurements. For
this purpose, data were used from Verloop (2013), concerning soil characteristics, C-input, and weather
(mean monthly temperature and rainfall over the period 1993-2005).

33
Initialisation of Roth-C
For the initialisation procedure, data were used for two sandy soils with a maize-grass rotation at De
Marke, differing in SOM content, i.e. 4.1 and 6.2%, corresponding to 2.4 and 3.6% C. The fraction IOM was
assessed using the formula of Falloon et al. (in Coleman & Jenkinson, 1999). Initial values of the fractions
DPM, RPM, BIO and HUM were assessed by running the model towards equilibrium for 10.000 years with
assumed constant climatic conditions of the region Winterswijk.
Scenario analyses
Following the initialisation of the Roth-C model, calculations were made for the change in SOC over a
period of 20 and 35 years. The modelling has been carried out using initialisation data from the De Marke
field with low SOC content as starting point, for which 5 scenarios (measures) were modelled (Figure 4.3).
Figure 4.3. Scenarios analysis with the Roth-C model.
Input data and coefficients
Standard data were used for the C-input and humification coefficients of the various crop residues
(Appendix B, Table B.3). For each of the cultivations, typical fertilizations with dairy manure in terms of
month of application and amount (Appendix B, Table B.4). C-content of the manure was assumed to be 33
kg per tonne. Since the analysis involves land use with a selection of crops, the standard DPM/RPM-ratio
for agricultural crops in Roth-C does not suffice and crop specific values for the DPM/RPM-ratio are
needed. For this purpose, the linear relationship between the humification coefficient (h.c.) and the
DPM/RPM-ratio was used (section 2.3.1). It was assumed that during the 20-year period, C-input from
crop residues and manure would not change. A catch crop was included in all scenarios with maize land,
as it is compulsory in the Netherlands from 2006.
1) Cultivation of cereals or potato as compared to maize.
2) Cultivation of grass-clover swards instead of grass; since data on the C-input for a grass clover
sward were not available, we used data for grass and clover cultivation, taking into account
an intercropping effect of 75%.
3) Cultivation of a successful catch crop in maize as compared to a poor catch crop; in many cases
the crop does not yield much in terms of dry matter production. Calculations were done for a
catch crop of winter rye, using high and low levels of C-input.
4) No manure when soil-P is high, in all cultivations.
5) Raise soil pH in maize land to current recommendation levels; the measure applies to all fields
with pH < 5.5. For our calculations, it was assumed that liming was done in January and thus
the pH-effect would be potentially effective all year.

34
Since the Roth-C model itself is not formally parameterised for pH, an appropriate coefficient was derived
from data found in the literature. Leifeld et al. (2008) adjusted the Roth-C model rate constant for plant
litter decomposition by pH response functions and obtained a good fit over the pH-range 2 - 8. Although
this results may need validation at a wider scale, we assumed it would be useful for our analysis to
indicate the perspectives of the agricultural practice.
4.3.5 Scaling up results
In the second step, results of SOC-change per cultivation at field level are used to assess SOC-change at
farm level, using the proportion of each cultivation within the standardised specialised and mixed farming
systems as defined for the model farms (Table 4.3).
Finally in the third step, calculation is made of the change in SOC at the regional level. For this purpose,
data on the potential areas for each of the proposed measures in the region of Winterswijk are used, as
provided by Korevaar and Geerts (2012) and Den Boer and De Haas (2013). Given the different
geographical boundaries of their particular studies, the areas are neither similar nor additive. Based on
the relative percentages of the various land-uses, an assessment was made of the potential of these land-
uses for the entire agricultural area of Winterswijk (c. 15,000 ha). According to Den Boer & de Haas
(2013), and Korevaar & Geerts (2012) the applicability of the measures may be assessed as follows:
- Introduction of cereals or potatoes: the total area researched by Korevaar & Geerts (2012) was 945 ha;
cereals were introduced at c. 31,4% of the land, which amounts to 359 ha. Den Boer & de Haas
(2013) used a different approach and calculated the availability of land for an extra crop, within the
existent specialised dairy systems at two levels of self-sufficiency in roughage. Extrapolating their
results to the greater Winterswijk area shows that 399 ha would be available for cultivation of
cereals and/or potato.
- Introduction of grass-clover; the total area researched by Korevaar & Geerts (2012) was 945 ha; grass-
clover was introduced at c. 36,4% of the land. We assume that grass-clover may be introduced in all
dairy based mixed farming systems.
- Cultivation of a successful catch crop; since 2006 it is compulsory, in the Netherlands, to have a catch
crop during or after maize. In many cases the crop does not yield much in terms of dry matter
production. However, by choosing a cereal crop with relative high dry matter production, and
improved cultivation techniques, the measure offers potential for all maize fields.
- No manure when P is high; the area within 10 m from surface waters was established, per crop, from
land-use maps. The area with fields having a P-PAE ≤ 7 was also assessed per crop, from the BLGG
database of routine soil samples. The majority of grasslands is outside this area while halve of the
maize, potatoe and beet fields are within this area. Thus 15% of the grasslands and 50% of other
fields fall within this category.
- Raise pH to 5.5; the respective areas (<4.5, 4.5 – 5.0, and 5.0 – 5.5) have been assessed from the BLGG
database of routine soil samples. It was found that 87% of all maize fields fall within this category.

35
4.4 Results
4.4.1 Modelling results of Roth-C at field level
For the two maize fields of the De Marke, it was calculated that, after 20 years, initial SOC contents of
64.7 and 97.6 t C.ha-1 would have reduced to 64.7 and 87.4 t C.ha-1, thus a change of 0 and -10.2 t C.ha-1
respectively. For comparison with measured SOM data, model results have been converted to SOM
assuming C% of 58% (Figure 4.4). For the time points in 2006 and 2008 the measured values appear to
have gone down and up, which is not reflected in the modelled results. The measured values are probably
due to sampling and/or measurement errors. Overall, the declined SOC from modelling matches the
measured amounts of SOC reasonable well at both the lower and higher SOC contents. Therefore, the use
of the Roth-C model, calibrated for “De Marke” was considered appropriate for the scenario analyses of
baseline and innovations.
Figure 4.4. Validation Roth-C with measured data from experimental farm De Marke.
With the low SOC maize field of De Marke as starting point, the changes in SOC-content were assessed for
each of the innovations (Figure 4.5). Innovation-1 concerns the cultivation of the arable crops cereals or
potato at a dairy farm, instead of maize, and the cultivation of grass-clover instead of grass. After 20
years, SOC change in cereal fields is positive (+18.2 t C.ha-1) and negative in potato fields (-2. t C.ha-1) as
compared to maize. Thus the cultivation of a cereal crop instead of maize would turn out positively in
terms of SOC. For the interpretation of the change in the cultivation of potato, it has to be taken into
account that potatoes are grown in rotation, e.g. 1:4 years. Therefore, the calculated losses over 20 years
do not reflect the actual situation. They do show, however, that cultivation of potato instead of maize is
worse in terms of C-loss. Comparing the cultivation of grass-clover with pure grassland shows that grass-
clover leads to a decrease (-2.7 t C.ha-1) in SOC-contents. The difference is due to the lower input of fresh
organic matter by clover than by grass, and the lower additions of manure.
3,0
3,5
4,0
4,5
5,0
5,5
6,0
6,5
7,0
1992 1997 2002 2007
SOM
(%
), 0
-20
cm
Year SOM-HI model-HI SOM-LO model-LO

36
Innovation-2 concerns the inclusion, within the dairy farming system, of services that improve the quality
of ground- and surface waters in terms of N and P. These are the inclusion of a full grown catch crop in
maize, withholding manure where soil-P is high, and raising pH to recommendation levels. The inclusion
of a full grown catch crop in maize would add more carbon to the soil as compared to the current practice
of poor-to-moderate catch crops. Over 20 years, an extra SOC-content of 1.6 t C.ha-1 may be achieved.
The practice of withholding manure would increase carbon losses. In maize land this would be -4.6 t C.ha-
1; for grassland -8.9 t C.ha-1. Finally, the effect of liming of maize soils from pH 4.5 to 5.5 was assessed by
calculating the difference in SOC contents in soils with pH 4.5 and 5.5, respectively. As acid conditions
reduce mineralisation, SOC content was calculated to be higher than when liming was applied. The total
change by liming amounts to -9.7 C.ha-1.
Figure 4.5. Modeled effects of agricultural measures on SOC content at field level (legend reads from left
to right).
Not surprisingly, Figure 4.5 shows as best options for maintaining SOC level, the cultivation of cereals and
permanent grassland including grass-clover. Maize fields with too low pH also maintain carbon; liming to
reduce mineral losses in margins close to surface water increases C-loss. In general the arable crops maize
and potato show loss of C, only marginally affected by the measure ‘no FYM’. It should be kept in mind
that the measures had been selected because no empirical evidence was found of negative agronomic
effects.
0,0
10,0
20,0
30,0
40,0
50,0
60,0
70,0
80,0
SOC
(t
C.h
a-1)
baseline maize and grass maizemaize good catch crop maize no FYMmaize, liming cerealcereal no FYM potatopotato no FYM grass

37
Most measures with a capacity to reduce N- and P- losses to surface waters, showed to be also beneficial
in terms of conservation of soil carbon. With one exception, i.e. the raising of soil pH within close distance
to surface water.
4.4.2 Scenario analyses at farm level
Using the results of the individual measures on SOC, the scenario analyses have been performed for the
standardised specialised and mixed farming systems with cropping areas representative for the area of
Winterswijk (Table 4.4). Regarding the services ‘No manure where P is high’ and ‘Raise pH to 5.5’, it was
assumed that their applicability at farm level was proportional to the area sizes found at regional level in
the BLGG database.
Table 4.4. Change in SOC (0-20 cm) following scenario analyses in CS Winterswijk.
Farming system Farm size
Farm C-stock
(original)
Change in farm C-
stock
Change 20 yrs Change per ha per yr
ha t C t C % t C .ha-1 kg C .ha-1 .yr-1
Specialised
arable 170 10,999 -1,611 -15 -9 -474
dairy 100 6,470 371 6 4 186
Mixed
Dairy mixed with crops
dairy + potato 50 3,235 73 2 1 73
dairy + cereal 50 3,235 282 9 6 282
dairy + grass-clover 50 3,235 94 3 2 94
Dairy mixed with environmental services
dairy + 'no FYM' (GC/M/C)* 65
4,206 186 4 3 143
dairy + 'pH to 5,5' (M)* 65
4,206 296 7 5 228
dairy + 'catch crops' (M) 65 4,206 294 7 5 226
The calculation procedure allowed to assess the impact of the farming system on soil carbon stock
irrespective of the actual rotation at arable or dairy farms. However, sometimes a rotation is
supplemented by extra additions of organic matter, e.g. compost. Such additions are not included in the
above calculations. Furthermore, in practice multiple measures may be implemented simultaneously at
farm level, even within a particular cultivation, e.g. maize cultivation without FYM and with a successful
catch crop.

38
4.4.3 Regional carbon balance
Assuming all measures would be implemented in all the fields where applicable reveals the gain or loss in
carbon at the regional level (Table 4.5). With business as usual, C-change over 20 years amounts to -42 t
C. Mixed farming measures add an extra 36 t C to this, so that total C-loss would be 78 kt C for the greater
area of Winterwijk (20,817 ha). The extra loss (85%) takes places on approx. 50% of the agricultural fields,
i.e. 10,000 ha.
The loss is largely due to the per hectare losses of the measure ‘raise pH to 5.5 along water borders’.
Other large losses may be mostly attributed to the measure ‘no manure where P is high,’ in various crops.
The extra loss occurs despite some accumulation of C from permanent grasslands, the cultivation of a
successful catch crop and the cultivation of cereals.
Grassland may be affected by two, and maize land by three measures. However, it was not possible to
calculate the total area affected by individual measures. In addition, they may be intertwined. For
instance, for the implementation of the measure ‘successful catch crop’, it may be needed to first raise
the pH by liming.
Table 4.5. Effect of MFS on the regional carbon balance in CS Winterswijk.
Land-use Total Total New practise Total improved area
% ha t C ha t C
Grassland 52.1 10,802 98,866 Introduction of cereals 200 1,932
Cultivation of potato 200 -2,236
No manure where P is high 1,479 -1,492
Introduction of grass-clover 416 2,648
grassland BAU 8,507 77,856
Maizeland 14.7 3,048 -27,771 No manure where P is high 1,629 -22,616
Improved catch crop 3,048 -22,736
Raise pH to 5.5 2,579 -22,028
maizeland BAU 0 0
Cereals 2.6 539 5,208 No manure where P is high 250 1,225
cereals BAU 289 2,789
Potato 2 415 -4,637 No manure where P is high 193 -2,993
potato BAU 222 -2,483
Sugarbeet 0.4 83 -927 No manure where P is high 39 -599
sugarbeet BAU 44 -497
Total area (ha) 14,887
Total C (t C) 963,190 70,739 8,771 Total C-change (%) 7.3 0.91

39
4.5 Discussion
1. Comparing measures
Agriculture in the region of Winterswijk has gone through a process in which dairy mixed farming systems
have become specialised in the ‘80s, and is now making another transition in which some aspects of
mixed farming come back. Land sharing, seen as a specific feature of mixed farming, is involved in efforts
to improve biodiversity, e.g. the cultivation of crops (cereals, potato) on grasslands in-between their
renewal, and various agricultural measures to improve water quality.
Introduction of cereals or potatoes
The inclusion of an extra crop in the common dairy grass-maize rotation in the region shows the two
extremes to which this may lead. The cultivation of cereals as dairy concentrates showed the highest
increase in SOC, whereas the cultivation of potato (no FYM) showed the largest loss of SOC. Cereals in the
rotation would deliver several benefits, e.g. for biodiversity (birds, landscape), the nitrogen balance (less
input from concentrates), and built-up of soil organic matter. However, the economics of cereal
cultivation in the region are less favourable, all the more so when compared to, e.g. the cultivation of
potato. Over the past years, dairy farmers have experimented with the cultivation of cereals to technically
increase crop yield and as a part of a paid ecosystem service scheme. These activities took place within
the framework of an EU CAP-pilot and showed promising results (Korevaar et al., 2014). However, cereal
cultivation has not become part of the measures stimulated by greening the CAP. In addition, new
derogation requirements include 80% grassland, reducing the maximum maize acreage to 20%, which on
many dairy farms is minimally needed to maintain production. It is expected that, despite the afore
mentioned benefits, the cultivation of cereals in the region will be discontinued due the implementation
of new EU-regulations.
Introduction of grass-clover
Evaluation of the measure ‘introduction of grass-clover’ involves not only the comparison with grass, but
also its function within the rotation of the farming system. In terms of net gain in carbon, it was shown
that grass-clover contributes less carbon to the soil than grass. Knowing that grass-clover contributes
more nitrogen than grass, the question than arises if the carbon loss would negatively affect soil quality.
In permanent grasslands, the overall effect of grass-clover on soil quality would probably be a loss in SOC
and a gain in N content until a new equilibrium will have set in. In a grass – maize rotation, the
substitution of grass-clover for grass may improve the soil in terms of both C and N.
The modelling of such measures as part of specialised and mixed farms has shown a positive change in
SOC (in descending order):
Cereal > Grass > Grassclover > Cereal no FYM
A negative change in SOC was calculated for the other measures (in increasing order):
Grass no FYM > Grassclover no FYM > Maize good catch crop > Liming acid maize soils > Potato >
Maize no FYM > Potato no FYM
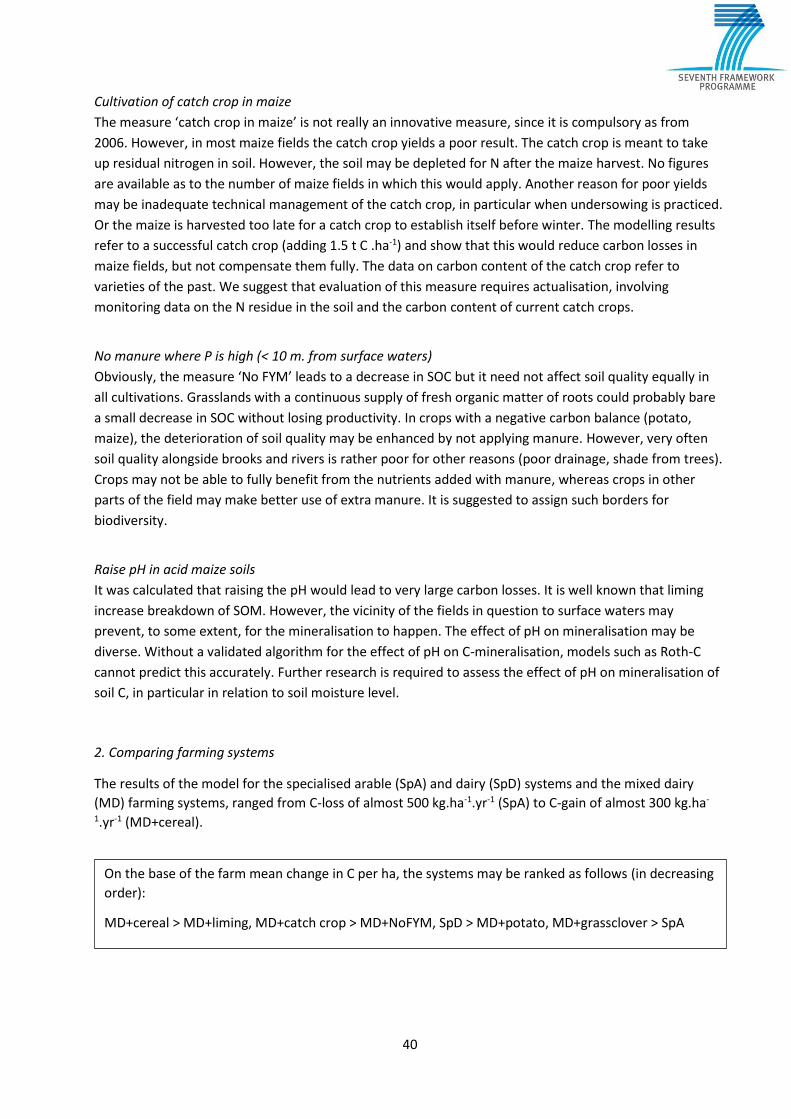
40
Cultivation of catch crop in maize
The measure ‘catch crop in maize’ is not really an innovative measure, since it is compulsory as from
2006. However, in most maize fields the catch crop yields a poor result. The catch crop is meant to take
up residual nitrogen in soil. However, the soil may be depleted for N after the maize harvest. No figures
are available as to the number of maize fields in which this would apply. Another reason for poor yields
may be inadequate technical management of the catch crop, in particular when undersowing is practiced.
Or the maize is harvested too late for a catch crop to establish itself before winter. The modelling results
refer to a successful catch crop (adding 1.5 t C .ha-1) and show that this would reduce carbon losses in
maize fields, but not compensate them fully. The data on carbon content of the catch crop refer to
varieties of the past. We suggest that evaluation of this measure requires actualisation, involving
monitoring data on the N residue in the soil and the carbon content of current catch crops.
No manure where P is high (< 10 m. from surface waters)
Obviously, the measure ‘No FYM’ leads to a decrease in SOC but it need not affect soil quality equally in
all cultivations. Grasslands with a continuous supply of fresh organic matter of roots could probably bare
a small decrease in SOC without losing productivity. In crops with a negative carbon balance (potato,
maize), the deterioration of soil quality may be enhanced by not applying manure. However, very often
soil quality alongside brooks and rivers is rather poor for other reasons (poor drainage, shade from trees).
Crops may not be able to fully benefit from the nutrients added with manure, whereas crops in other
parts of the field may make better use of extra manure. It is suggested to assign such borders for
biodiversity.
Raise pH in acid maize soils
It was calculated that raising the pH would lead to very large carbon losses. It is well known that liming
increase breakdown of SOM. However, the vicinity of the fields in question to surface waters may
prevent, to some extent, for the mineralisation to happen. The effect of pH on mineralisation may be
diverse. Without a validated algorithm for the effect of pH on C-mineralisation, models such as Roth-C
cannot predict this accurately. Further research is required to assess the effect of pH on mineralisation of
soil C, in particular in relation to soil moisture level.
2. Comparing farming systems
The results of the model for the specialised arable (SpA) and dairy (SpD) systems and the mixed dairy
(MD) farming systems, ranged from C-loss of almost 500 kg.ha-1.yr-1 (SpA) to C-gain of almost 300 kg.ha-
1.yr-1 (MD+cereal).
On the base of the farm mean change in C per ha, the systems may be ranked as follows (in decreasing
order):
MD+cereal > MD+liming, MD+catch crop > MD+NoFYM, SpD > MD+potato, MD+grassclover > SpA

41
Dairy farms mixed with cereal and/or ecosystem services maintain more C per ha at farm level than the
specialised dairy and arable system. In general, calculated differences between mixed dairy systems are
moderate, indicating flexibility for selecting measures that fit best considering other farm features.
Contrary to expectations, the inclusion of grass-clover in the rotation does lead to similar results as the
introduction of potato at the level of farm mean C per ha. Obviously, in terms of nutrient use efficiency,
results will be different with grass-clover leading to low surplus at the nitrogen balance and potato to a
high N-surplus. In combination, this suggests that expressing change in C as a mean per ha at farm level,
may not always be the best way to differentiate between farming systems.
SOC at specialised arable farms is seriously at risk both from the ‘stock’ as from the ‘change’ point of view.
However, potato cultivation is dominant in making farm decisions because potato cultivation is the
economically preferred crop in the rotation. The inclusion of crops that do contribute to SOC, e.g. cereals
and catch crops, are less attractive due to low revenues and/or difficulties in the cultivation.
3. Regional carbon balance
In the Winterswijk area, implementation of the measures where applicable would improve, in terms of
biodiversity and reduction in N- and P-losses, about 40% of all agricultural land in the region. The net soil
carbon balance in the area would be almost zero. Measures may be grouped into packages to realise
specific goals in terms of C, N, and P. Some distinct differences are shown with respect to carbon gain or
loss. Three observations are made:
Cultivation of cereals contributes to C-storage, whereas cultivation of potato reduces it. This is
relevant for dairy farms at sandy soils low in C (soil type ‘veldpodzol’). In addition, biodiversity
(birds) is stimulated by the cultivation of cereals. However, new legislation (CAP, derogation) may
diminish the cultivation of cereals at dairy farms. It may be worthwhile for the region to
experiment further with the cultivation of cereals as a greening measure within the CAP.
From an agricultural point of view, the small reduction in C of grass-clover as compared to grass is
considered less important than the accompanying increase in N, whereas the small increase in C
by the catch crop in maize may be more important than the N it catches. With respect to the
quality of surface waters, both systems may require more intensive monitoring as to nitrate levels
in soil and leaching patterns.
Ecosystem services (‘liming’, ‘no FYM’) alongside brooks and surface waters may have effects on
biodiversity and/or production at field level which remain to be quantified. It may be
recommendable to assign specific values to the preservation of such borders in the small-scale
landscape of Winterswijk. In this respect the measure ‘no FYM’ is to be preferred to ‘liming acid
maize soils’.
4.6 Conclusions
Land sharing may be seen as a specific feature of mixed farming, directed at efforts to improve
biodiversity and/or improve water quality. Current specialised dairy systems in the region of Winterswijk
have developed from mixed farming systems. Adjusting the management of these specialised intensive
dairy farms to maintain nature values and abiotic ecosystem boundaries of the regional landscape
resulted in a wide range of practices. Since not all of these practices are economically viable, payments for
specific ecosystem services could stimulate farmers to implement these practices. For further
development of the mixed farming systems involved, ecological intensification applied at the regional
level is advocated. For this, networks for knowledge exchange and collective design and trials of
innovative practices should be organized to move towards more integrated systems.

42
5. Assessment of Lieue de Grève (F)
5.1 The Challenge
The Lieue de Grève catchment, 65% of which is AA, comprises 170 farmers, mostly dairy and/or beef
producers (some specialized) who aim to reduce nitrate leaching drastically by implementing at the
regional and, as far as possible, farm level, a set of co-built systemic indicators of N inputs and stocking
rates per ha of grassland. The aim is to guide production systems towards better agro-ecological
performance. A working group of stakeholders (i) worked with eight pilot dairy farms that modified their
practices or production systems to implement the indicators, and (ii) extrapolated the changes to all
farms in the catchment with the CASIMOD’N model, which included farmers’ main decision rules
concerning land use and manure management (Moreau et al., 2013). Results are used to infer possible
impact on soil organic matter.
5.2 Description of the area
Agriculture
The Lieue de Grève (Lieue de Grève) catchment is located in northern Brittany, France. The climate is
humid temperate with a mean annual temperature of 11.7 ◦C and a mean annual rainfall of 950 mm. It
covers 12 000 ha, of which approximately 67% is usable agricultural area (UAA), 24% is woodlands, and
8% is urban (Figure 5.1, France (from Avadi et al., submitted). Agricultural soil type is Cambisol of silty
loam texture (USDA). Organic matter contents range from 3.0 – 6.5% (0-30 depth). The Lieue de Grève
catchment is divided into five sub-catchments, all flowing into the same bay (Gascuel et al., 2015).
Figure 5.1. Location of the Lieue de Grève catchment.

43
The main economic activity of the Lieue de Grève catchment is farming, with 162 conventional and 8
organic farms. Agricultural production includes production of cow milk (39.7 million t/year, using up to
85% of the UAA), suckler-beef cattle, combined milk and suckler-beef cattle, and swine. Most farms grow
forage and cash crops, the former generally for self-consumption. Nearly all cattle farms, most of which
are dairy farms, have a fodder system based on grassland and maize silage. There are a few dairy farms
with confined animal production such as swine or poultry (<5% by number), as well as a few beef-swine
farms (<1%), crop-only farms (<3%), and sheep farms (<2%) (Table 5.1). The small number of crop-only
farms in this region is explained by climate and soil conditions, which are not suitable for producing cash
crops but are good for fodder production, and by the generally moderate size of farms (mean = 72 ha).
Grass yields are high, thus supporting over nine months of cattle grazing per year. According to survey
data, Lieue de Grève cattle production (12 500 heads) accounts for 3% of milk and 8% of beef production
of the surrounding Côtes-d'Armor department annually, which contains roughly 182 500 head of cattle
(AGRESTE, 2011).
On average, about 50% of cattle-farm UAA is devoted to grasslands, either grazed by cattle or cut for hay,
haylage or silage, while 20% is used for maize silage. Livestock feed is based mainly on grazing/grass silage
and maize silage, supplemented by regionally produced or imported concentrated feed. Farmers include
maize silage in dairy cattle feed, however, because it (1) has higher and more consistent yields than
grasslands and (2) is easier to manage than grasslands. Produced manure/slurry is use to fertilise their
crops, some farmer import pig slurry or poultry manure from neighbours. Some dairy farmers import
fodder and straw as well from other farms in the region with a surplus (e.g. crop and swine farms, or
cattle farms with higher grassland productivity, better management, or lower stocking rates), during
difficult years in most cases but systematically for some farms. In terms of N, most cattle farms import 50-
100 kg N/ha UAA in concentrated feed and mineral fertilisers, while 8% of them import >100 kg N/ha
UAA.
Table 5.1. Total land use by farm type in the Lieue de Grève district (Corson et al., 2015).
Farm or animal product type Regional land use or output
ha
Weighted mean, all farms 8,400
Dairy farms 4,504
Dairy + beef farms 2,293
Beef farms 972
Swine farms 380
Other farms 251
Water quality
Despite current moderate nitrate (NO3) fluxes and a mean nitrate concentration in rivers at the outflow of
30 mg/l (well below the European Union threshold of 50 mg/l), this catchment has experienced algal
blooms along the coast since the 1970s. As usual in French coastal water, nitrate was identified as the key
element that controls algal blooms, because phosphorus is already largely available in sediments and thus
cannot be controlled. In the Lieue de Grève catchment, the Yar sub-catchment alone contributes up to
59% of the nitrate emitted into the bay and modelling effort was focused on the Yar sub-catchment, but
all the area was concerned by diagnosis and remediation steps. Since the death in 2009 of an horse on the

44
beach due to toxic gazes emissions (H2S) from algae decomposition, an “algae reduction plan” was
elaborated in 2010 to dramatically reduce nitrate emissions below 10 mg NO3/l (Perrot et al., 2014). The
LdeG catchment has been a pilot region, as a transdisciplinary working group gathering local stakeholders
had already proposed guidelines to help improvement of farm production systems including possible re-
design and better management of buffer areas (Moreau et al., 2012 ; Gascuel et al., 2015).
Stakeholder Process Design
In a previous research-action program (ANR-08-STRA-01 Gascuel et al., 2015), this problem was addressed
by combining agro-hydrological modelling and participatory research to accompany changes in
agricultural activities, to achieve sustainable production systems with low N emissions (especially NO3).
Agro-hydrological modelling (Beaujouan et al., 2002; Moreau et al., 2013) of reactive N emissions and
fluxes in the catchment including buffer zones (e.g. hedgerows around fields, wetlands) predicted that the
latter could not absorb all excess nitrate produced by agricultural activities. The main way to decrease N
emissions is thus to focus on these agricultural activities and decreasing environmental impacts due to
agriculture is a main concern of local stakeholders and inhabitants of this region (Levain et al., 2015). The
farmers aim to reduce nitrate leaching drastically by implementing at the regional and, as far as possible,
at farm level, a set of co-built systemic indicators concerning N inputs, e.g. stocking rates per ha of
grassland, avoiding bare soils in winter and limiting grassland renovation rates (Vertès et al., 2011). The
aim was to guide production systems towards better agro-ecological performance. A working group of
stakeholders (i) worked with 8 pilot dairy farms that modified their practices or production systems to
implement the indicators, and (ii) extrapolated the changes to all farms in the catchment with the
CASIMOD’N model, which included farmers’ main decision rules concerning land use and manure
management (Moreau et al., 2013). The complexity of the cooperation between stakeholders in the
region, visualised in Figure 5.2, was identified as ‘territorial synergy’ (Moraine et al., 2014).
Figure 5.2. Stakeholder model of the mixed farming systems in CS Lieue de Grève (C=Crops, G=Grass,
A=animal)
Grassland and forages
Cash and forage crops
Manure
Fields exchange

45
5.3 Methodology
5.3.1 Outline
This study makes an analysis of the nitrogen management by a group of pilot farms, after which the
results are upscaled to the regional level. The impact of farm management on the soil N status is assessed
with the CASIMOD’N model. From the modelling results an assessment is made of the changes in SOC.
5.3.2 Selection of baseline and innovations
For this study, the baseline scenario “Business as usual” was identified as the farms as they existed when
data were collected in 2007 (Table 5.2). A first innovation (S1) consists of the mitigation options identified
by stakeholders, i.e. reduction of N inputs, improvement of N recycling and suppression of risky practices.
As the result of the co-creative process, a scenario was proposed to drive changes by selected indicators
that are easy to understand, compute and control. This scenario was implemented at farm and watershed
scales, with a strict respect of thresholds at district scale (in particular the stocking rate par ha grasslands)
more or less attained at farm scale. Total milk production was maintained, although milk per cow decreased
to reinforce the link between crop-grassland and animal production (link to soil). This led to increase the
number of dairy cows by 15% (more meat produced) and to increase the part of grassland in AA, while cash
crops area decreased. The few other farm types (specialized in crops, pig + crops or poultry) were
unchanged.
The co-build innovative scenario proposed to drive changes by 5 indicators that are easy to understand, to
compute and to control:
stocking density to 1.4 livestock units (LSU)/ha of grassland;
Σ N inputs < 100 kg/ha (N inputs = Nfert + N food * .65(pigs) or .75 (cows) + net Nmanure);
100% efficient cover crops in winter;
grassland destruction (renovation) rate < 5%; and
no “parking” grasslands for cows (homefield muddy patches).
Table 5.2. Typology of baselines and innovation.
Typology Farm types
S0-Baseline 1: Business as
usual
Farms as they existed when data were collected (2007), 85%
cattle farms, about 50% AA as grassland, 23% maize, 27% crops
S1-Innovation: Improved N-
management
Limit stocking density to 1.4 livestock units (LSU)/ha of grassland
Limit net input of N (fertilizer, feed) to 100 kg N/ha UAA, while
keeping mean milk production/ha constant (decrease of cash
crop area, increase of number of dairy cows
This scenario was implemented at farm and watershed scales, with a respect of thresholds at district scale
(i.e. stocking rate per ha grassland) attained at farm scale. Total milk production was maintained,
although milk per cow decreased to reinforce the link between crop-grassland and animal production (link
to soil). This led to increase the number of dairy cows by 15% (more meat produced) and to an increase in
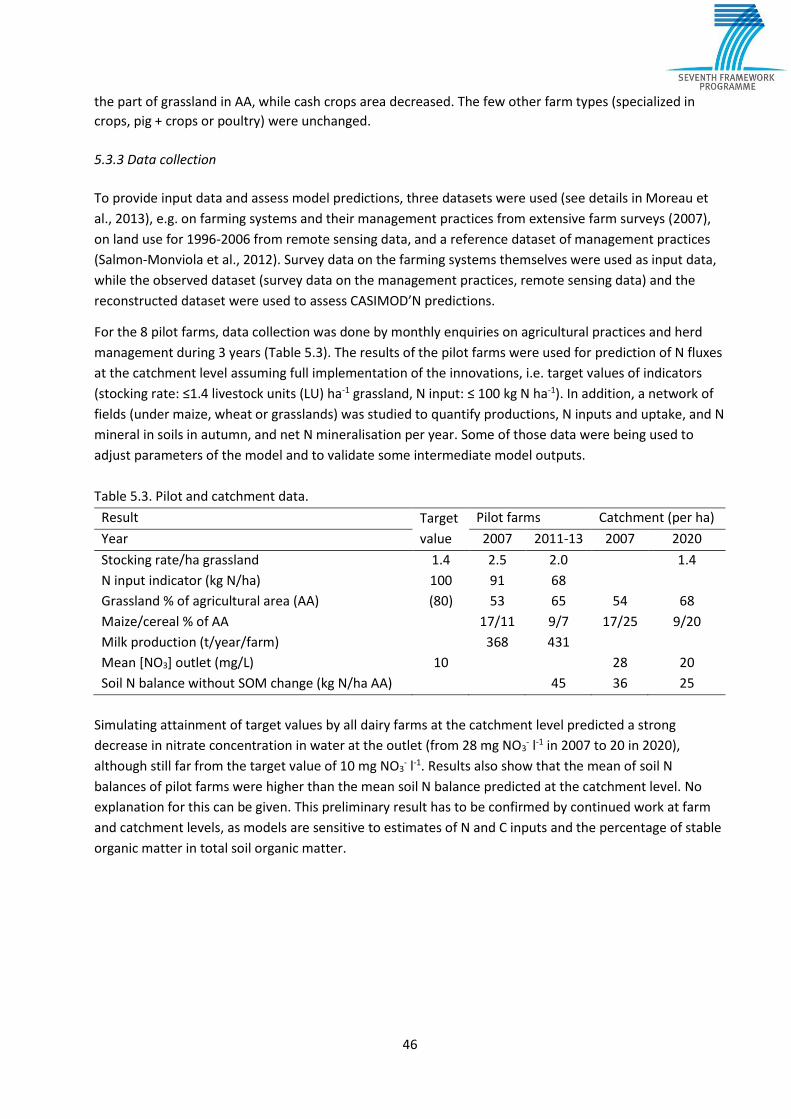
46
the part of grassland in AA, while cash crops area decreased. The few other farm types (specialized in
crops, pig + crops or poultry) were unchanged.
5.3.3 Data collection
To provide input data and assess model predictions, three datasets were used (see details in Moreau et
al., 2013), e.g. on farming systems and their management practices from extensive farm surveys (2007),
on land use for 1996-2006 from remote sensing data, and a reference dataset of management practices
(Salmon-Monviola et al., 2012). Survey data on the farming systems themselves were used as input data,
while the observed dataset (survey data on the management practices, remote sensing data) and the
reconstructed dataset were used to assess CASIMOD’N predictions.
For the 8 pilot farms, data collection was done by monthly enquiries on agricultural practices and herd
management during 3 years (Table 5.3). The results of the pilot farms were used for prediction of N fluxes
at the catchment level assuming full implementation of the innovations, i.e. target values of indicators
(stocking rate: ≤1.4 livestock units (LU) ha-1 grassland, N input: ≤ 100 kg N ha-1). In addition, a network of
fields (under maize, wheat or grasslands) was studied to quantify productions, N inputs and uptake, and N
mineral in soils in autumn, and net N mineralisation per year. Some of those data were being used to
adjust parameters of the model and to validate some intermediate model outputs.
Table 5.3. Pilot and catchment data.
Result Target
value
Pilot farms Catchment (per ha)
Year 2007 2011-13 2007 2020
Stocking rate/ha grassland 1.4 2.5 2.0 1.4
N input indicator (kg N/ha) 100 91 68
Grassland % of agricultural area (AA) (80) 53 65 54 68
Maize/cereal % of AA 17/11 9/7 17/25 9/20
Milk production (t/year/farm) 368 431
Mean [NO3] outlet (mg/L) 10 28 20
Soil N balance without SOM change (kg N/ha AA) 45 36 25
Simulating attainment of target values by all dairy farms at the catchment level predicted a strong
decrease in nitrate concentration in water at the outlet (from 28 mg NO3- l-1 in 2007 to 20 in 2020),
although still far from the target value of 10 mg NO3- l-1. Results also show that the mean of soil N
balances of pilot farms were higher than the mean soil N balance predicted at the catchment level. No
explanation for this can be given. This preliminary result has to be confirmed by continued work at farm
and catchment levels, as models are sensitive to estimates of N and C inputs and the percentage of stable
organic matter in total soil organic matter.

47
Figure 5.3. PLS Farm typology of dairy production systems in CS Lieue de Grève (Green algae plan survey, 2011) including the 8 pilot farms.
For upscaling of results, a dataset was constructed consisting of 59 farms producing milk, specialised or
not, and using a typology that distinguishes between specialised and mixed farming systems.
The dataset was analysed with PCA regarding farm characteristics and the ways to implement changes
that would improve the value of indicators (Figure 5.3). Four main types are identified combining 2 main
factors that discriminate the part of grass in AA (1st axis) and the second main production (meat vs crops
for axis 2). The 8 pilot farms were spread in all types, and could be expected to represent the diversity of
structure and functioning.
Some characteristics of the four types are given in Table 5.4.
(1) low intensive /ha, /animal,
low inputs or organic,
grass based (1 PF)
(3) High stocking rate per ha,
Maize (+ grass)
high N inputs (Fert., Feed) (1 FP)(2) Mean intensive/animal,
Maize + grazed grass
N inputs as fert., (3 FP)
(4) Intensive par animal,
maize + grassland, cereals
low inputs (3 PF)
Steers
cereals

48
Table 5.4. Characteristics of the 4 groups of farms obtained in the PCA analysis (Full details in Appendix C).
Features Specialised Dairy Mixed dairy
1. Grass based
(nobs=9)
2. Grass + maize
(nobs=13)
3. Milk + Meat (maize+grass) (nobs=13)
4. Milk + cash crops +(grass
+ maize) (nobs=21)
Area
AA (ha) 76.6 72.2 96.3 81.7
Grassland % AA 75.3a 58.7b 48.4c 45.9c
Maize % AA 11.4c 27.3bc 32.0a 24.8b
Maize %fodder area 12.7c 31.1b 39.6a 34.5ab
Fodder area % AA 89.6a 88.1a 81.1a 72.9b
Cash crops % AA 9.1b 10.4b 16.5b 26.4a
Indicators
N concentrates per ha 16c 45b 65a 38b
N mineral per ha 12.1 7.4 12.9 8.9
Net organic N per ha 22c 60ab 77a 51b
Indicator LSU per ha grassland
46b 101b 139a 93b
Indicator “N inputs” per ha AA
1.5c 2.3b 3.0a 2.3b
Letters a, b, and c indicate similarities or differences for each variable between the 4 types of farms.
The inventory shows that grass-based systems offer the best results in terms of both the indicators N
inputs and LSU/ha grass. At considerable distant the mixed farming system with grass, maize and cereals
is second best as far as input of N is concerned. The mixed milk+meat farming system performs lowest for
both indicators.
5.3.4 Modelling
The Casimod’N model does not simulate changes in organic N in soils, mean local references values
for mineralisation rates being an input to the model (Beaujouan et al., 2002; Moreau et al., 2013). As
it was not possible to use Roth-C on this case study, a simple approach was used to infer changes in SOC
from the results of the 8 pilot farms regarding N fluxes characteristics and land use (crop vs grass). These
calculations were made by assuming, in a first step, various figures for loss or gain of N and C in soils and
assess N-leaching. In a second step, the calculated results were compared to measured values and the
best fitting input data on C loss or gain taken for further elaboration. The following values for soil N (or C)
changes were used:
crop land: 0, -35 or -70 kg N per ha per year (-350 or -700 kg C)
grassland area were 0, +25 or + 50 kg N per ha per year (+ 250 or + 500 kg C)
High values for C changes correspond to Roth-C simulation in a neighbouring situation (Viaud et al 2014)
and other literature and/or local experimental data (Vertès and Mary, 2014) and were consistent with
those proposed by Vleeshouver and Verhagen (2002). The calculations were made by Doussal (2014) to

49
refine the estimation of N leaching risk calculated as proposed by the Dairyman project adapted to local
situation.
5.3.5 Upscaling of results
The results in C-stock change are aggregated to the catchment level by multiplication, per farm type, of
the respective C-stock change and the total number farms of that type in the catchment. As changes in
production system and land use implemented in the farms are only a part on the way to reach the
reference values of indicators, calculation will give an intermediate point. Moreover N fluxes modelling
concerns the whole watershed, including forest and buffer areas, while extrapolation of farm results
concerns the agricultural area.
5.4 Results
5.4.1 Pilot farms
Over the experimental period, most dairy farms in the catchment chose to maintain or increase milk
production (from a mean of 370 to 430 t year-1 farm-1 for the eight pilot farms), became more grass-
based, and decreased bull fattening and maize or cereal area. Average fluxes are detailed in Figure 5.4,
with a mean leaching risk of 39 kg N-NO3 ha-1 year-1 . For an overview of all results of the Casimod’N
modelling, see Appendix C, Table C.1.
Figure 5.4. Calculation of main N fluxes, including N leaching risk. Data correspond to mean values of N
fluxes for the 8 farms dairy pilot farms.
Mean values of indicators moved toward target values, decreasing for the pilot farms from 2.5 to 2.0 LU
ha-1 grassland and from 91 to 68 N kg.ha-1 for the “N inputs” indicator. The percentage of grasslands
Herds BuildingsManureStorage
Grasslands CerealsMaize
Fields
Milk 26 Meat 7
60 58
from grazinganimals
Straw3
NH3, N2, NO2 9
Manure spread
NH3, N2, NO2 4
0 N manure
exported
7(Wheat)
Gaz emissionsfrom fields
15 NH3
27 N2,NO2
Variation N soil+ 4
Fertilizers
Manure
Symbioticfixation
Atm. deposition
39 N-NO3 leaching risk
forage
Cash crops
41 Concentrates/
Forage
34
0
39
15
108 155 54
Straw3
[27 to 58]
[-15 to +17]
InputsOutputsInternal fluxes
Ninputs [215-410] Ninputs [15-220] Ninputs [65-140]

50
increased with 11 ha (+23%), at the expense of a decline in cereals of 3.4 ha (34%) (Figure 5.5). Globally
grasslands occupied 65% AA for the pilot farms vs 53% AA for the baseline.
The modelled N-fluxes included an estimate of the soil N balance for each of the pilot farms (Doussal,
2014). Assuming a constant C/N-ratio of 10, these data were used to assess the change in C-stock per
hectare and per farm (Table 5.5). For this purpose, total farm size was based on the cultivated area,
excluding SAU. As indicated in Figure 3.4 the mean variation of N storage in soils was about 4 kg N ha-1
year-1 , that corresponds to about + 40 C kg.ha-1.year-1, varying between -70 to +230 C kg.ha-1.year-1 .
Figure 5.5. Increase in grassland area and decrease in cereal area in the pilot farms.
The BAU scenario corresponds to a weak decrease of C in most farms, and a weak storage in 3 farms with
the higher value for in the farm C (grass-based system, low intensive). Increasing the part of grass leads to
reduce C destorage or allow some C storage in all farms but one. On the whole area of the 8 farms, the
total C storage is about 32 t, and the improved scenario corresponds to a gain an increase of 57 C t.yr-1
compared to BAU, i.e. a mean additive storage of 75 C kg.ha-1yr-1 .
Mean C storage per type of farms are + 230 , +80, +10 and -65 C kg.ha-1.yr-1 for type 1, 2, 3 and 4
respectively . Though some types are represented by only one farm, the results are consistent with other
local references (Viaud et al.,2014, Godinot et al, 2014) and will be used in upscaling calculations.
From Table 5.4 it follows that the mean change in C-stock per ha is, in descending order:
Low intensive-1 (LU, input) > Moderate intensive-2 > Intensive-3 (input) > Intensive-4 (LU)
0
20
40
60
80
100
120
A B C D E F G H Mean
Are
a (h
a)
grassland initial
grassland 2013
cereals initial
cereals 2013

51
Table 5.5. Change in C-stock due to improved N-management for the 8 pilot farms.
Farm Farm type C-change (kg.ha-1.yr-1) Area C-stock (t.farm-1.yr-1)
BAU Innovation Change ha Final Change
A intensive LU, grass, maize, cereal (4) -148 -90 +58 76 -6.8 4.4
B intensive LU, grass, maize, cereal (4) -64 -40 +24 70 -2.8 1.7
C low intensive (1) 21 230 +209 127 +29.2 26.5
D high stocking rate (3) -96 10 +106 79 0.8 8.4
E intensive LU, grass, maize, cereal (4) -21 -70 -49 125 -8.8 -6.1
F moderate intensive (2) 12 30 +18 81 +2.4 1.5
G moderate intensive (2) 13 70 +57 66 +4.4 3.8
H moderate intensive (2) -33 140 +173 98 +13.7 17.0
Mean/total -40 35 +75 722 +32 +57

52
The part of grassland in farm AA decreases with the same order: 73% for type 1 > 65% (+-1.8) for type 2 >
59% (+-2) for types 3-4, increasing the part of grasslands in AA usually leading to decrease the livestock
density par ha grasslands. This result is in accordance with expectations, showing that loss of C increases
with level of intensity and part of crops (with low C residues as straw exported to buildings and maize
harvested as silage). The impact of high livestock densities is surpassed by that of high inputs.
Calculation on N fluxes, whose average data were shown in Figure 5.5, were achieved in each farm in the
initial (BAU) and final (on the way towards scenario “indicators”). Leaching risk were deduced from N
balance calculations at herds, buildings, manure storage and field scales successively, each step leading to
losses as proposed by Jarvis et al (2011). Remaining N at field level is potential leaching + N storage in
soils, so it varies with the 5 set of hypothesis on this process. Extreme and mean results are shown in
Figure 5.6, and leaching risks ranges from 10 to 80 kg.ha-1 yr-1. Mean value of the 8 farms is 42 kg N-NO3
ha-1yr-1 , comprised between 27 and 58 according to the set of hypothesis on SOM changes. On this set of
farms the mean of the usual 0/0 hypothesis (no change of SOM) predict the same average leaching than
the mean of the 5 set of hypothesis (similar results in farms D and E).
Figure 5.6. Leaching risk as assessed with different impact of SOC; legend data refer to input values for N-
change.
5.4.2 Upscaling to catchment level
Combination of the occurrence of farm types in the region of Lieue de Grève and the calculated change in
C-stocks shows the impact of innovative scenario on the regional C-balance over the time period 2007 –
2013 (Table 5.6). The change in C was estimated at +1.6 kt C relative to the total area of dairy and dairy +
beef farms. This corresponds to a weak gain of about 0.1 t C per ha.
0
10
20
30
40
50
60
70
80
90
100
A B C D E F G H mean
calc
ula
ted
leac
hin
g ri
sk
(kg
N-N
O3
per
ha
-35/50
0/0
-70/20
mean

53
The slightly positive result is due to the intensive farm type, which occupies the largest area (30.4% AA)
and also is responsible for the largest change in C-stock per ha (-0.065 t per ha). The results clearly
indicate that for the Lieue de Grève region, in terms of C-balance, specialised dairy farming systems with a
large part of grasslands in their AA are to be preferred to mixed farming systems. The same conclusion
was already found for N leaching losses at watershed level (Durand et al, 2015) for Lieue de Grève as well
as for another catchment in Brittany, more intensive, where the same scenarios were simulated.
5.5 Discussion
This study shows that the specialised grass-based system offers the best results in terms of N inputs,
LSU/ha grass as well as change in C-stock. In contrast, the milk+meat mixed farming systems performs
worst regarding all three aspects included. In terms of C-stock, the specialised grass-maize system is to be
preferred to the mixed grass, maize, cereal system, though the opposite is true regarding the N-input.
The estimation of SOC changes was based assuming a constant C/N-ratio. Thus in soils with C/N-ratio < 10
and a positive N balance, less C would be sequestered than assessed whereas in soil with C/N-ratio >
higher sequestration occurs. A major change in farm management is the increase in grass area at the
expense of arable crops. In general, C/N-ratio in grassland is lower than in arable land. It may be assumed,
therefore, that C/N-ratio be reduced and the calculated amount of C sequestered must be seen as
maximum for this case study.
In considering implementation of the innovation at a wider scale and/or extrapolating to other areas, the
ending of the EU milk quota system must be taken into account. Many dairy farmers consider increasing
milk production to increase revenues, either with more dairy cows or by feeding more maize silage and
concentrated feed to the same number of cows. These are obstacles to adopting the innovation scenario,
such as limits to increasing the sizes of herds, access to enough nearby pastures to meet cows’ grass
requirements, and the acceptability of grass-based dairy systems.
Collaboration among farms would help to address some of these issues, for example by exchanging
pastures or developing a contract-based “fodder bank”, but these have yet to emerge. These may lead to
alfalfa/high quality grass in cattle or crop farms, to be processed at a local drying unit (using heat from a
biogas unit). This may in turn stimulate the exchange of land between farms to improve farm structure
and grazing potential. Unfortunately, the government’s action plan to decrease algal blooms politicised
discussions between farmers and researchers in the Lieue de Grève, making some of the former less open
to adopting changes now seen as more prescriptive than co-constructed (Levain et al., 2015).
Nonetheless, other dairy farmers in Lieue de Grève and other parts of Brittany remain willing to render
their farms more grass-based, i.e. less mixed.

54
Table 5.6. Regional C-balance in region Lieue de Grève, on the 6800 ha AA occupied by the 4 types of dairy farms (81% of the whole AA of Lieue de Grève
watershed).
Farm type Description
Leaching risk Mean size (ha/farm)
Total AA %
Change C Change C
t. yr-1
∆ Regional C balance period 2007-2013
kg N-NO3 per ha (mean)
kg.ha-1. yr-
1 t C
1. Grass based, specialised (c) low intensive 21 76.6 13.1 230 253 1 772
2. Grass + maize, specialised (f,g,h) moderate 53 72.2 18.8 10 16 111
3. Maize + grass, mixed (d) intensive (input) 72 96.3 18.8 80 126 885
4. Milk + cash, mixed (a,b,e) intensive (LU) 28 81.7 30.4 -65 -166 -1 162
Total 81 229 + 1 606

55
5.6 Conclusions
At field and farm level, it was assessed that the success of the improved N management may lead to
loss of carbon, assuming C/N-ratios in soil are constant. However, the innovation is such that at farm
level, the proportion of grass increases. This may have a positive impact on soil organic matter since
grass roots contribute more fresh organic matter to soil as compared to arable crops such as maize.
For the Lieue de Grève region, the specialised grass-based dairy system is to be preferred to mixed
dairy system if ‘mixed’ refers to raising beef. The transition to a grass-based system may be offset by
current policies that indirectly lead to an increase in dairy herd and the proportion of maize in the
dairy diet. This shows the need for continuation of the improved N management programme.

56
6. General discussion
6.1 Effects of land sharing on regional soil organic carbon contents
In this study a quantitative assessment was made of the effect of ‘land sharing’ on soil organic carbon
stocks at regional scale in three case studies. Large difference were shown in absolute terms in
change in C-stock both within and between regions (Table 6.1), ranging from -474 kg.ha-1.yr-1 in the
specialised arable system in CS Winterswijk to 230 kg.ha-1.yr-1 in the specialised grass based dairy
systems in CS Lieu de Grève. Another occurrence of negative change in C-stock was found in the
mixed farming system with cash crops (-65 kg.ha-1.yr-1) in CS Lieue de Grève. In contrast, more C was
sequestered in the arable mixed farming system as compared to specialised arable system in CS
Dolnoslaskie, 120 and 18 kg.ha-1.yr-1, respectively. In CS Winterswijk, C-change in the specialised
arable system was negative whereas the specialised and mixed dairy system sequestered similar
amounts of C (mean 178 kg.ha-1.yr-1). These regional approaches clearly indicate difference between
region and cultivations. However, when looked upon from a European level, differences between the
regions may be unnoticed. According to the SMARTSOIL classification of SOC balances at the
European scale, the three regions have been grouped in the same, intermediate, class (Merante et
al., 2015). Such differences between the regional and the European scale demonstrate the need to
spatially zoom in and out when contemplating the relative importance of changes in SOC. Also, the
“4 ‰ initiative” as launched by the French government during COP21 stimulates local and regional
stakeholders to cooperate in increasing carbon sequestration and SOC-contents. The 4 ‰ annual
growth rate of the soil carbon stock would make it possible to stop the present increase
in atmospheric CO2. The bottom line in Table 6.1 shows that the results of the three regional case
studies indicate that several mixed farming systems could make a modest contribution to the “4 ‰
initiative”.
The base for evaluation of SOC at regional level is the involvement of SOC in soil ecosystem services
and the need for external sources of organic matter to replenish carbon loss. Concerning the latter,
regional inventories could made of potential sources of organic matter that may be used. For
instance, this would be useful for the Dolnoslaskie region, where due to a lack of livestock, current
availability of manure is too low for the development of mixed farming systems. As other sources of
organic matter may become available from regional or local industries, modelling may be used to
ascertain best options to increase production while maintaining regional soil and water quality.
6.2 Reduction of N- and P-losses
All farming systems that were evaluated for both C and mineral losses showed positive results for
both indicators. This finding shows that it is possible, at a regional scale, to reduce mineral losses
while maintaining or increasing carbon stocks. As the combined selection of measures determines
overall results, both farmers and other stakeholders need to be involved in the selection of practices.
It was also shown that the effects on mineral losses and carbon changes were not proportionally
throughout all farming systems. For CS Lieue de Grève, the order of the four farm typologies is the
same for both indicators with the specialised grass-based dairy farm performing best in terms of both

57
reducing N-leaching (20 kg .ha-1.yr-1) and C-sequestration 230 kg.ha-1.yr-1. In contrast, in CS
Winterswijk, the farming system with the best results in terms of reducing N- and P-losses (28 N kg
.ha-1.yr-1 and 70 P2O5 kg .ha-1.yr-1) scores lowest in C-sequestration (143 C kg .ha-1.yr-1 ; measure ‘no
FYM where P is high’). This results raise questions as to the suggestion that reducing N- and P-losses
is coupled to C-sequestration. It may very well depend on the type of measures applied. Considering
individual measures in CS Winterswijk, the best measure for both indicators is ‘cultivation of a good
catch crop in maize’. In order to evaluate the capacity of specific land uses including land sharing to
deliver soil ecosystem services, a further partitioning of (the significance of) SOC in terms of, e.g.
nutrient supply, moisture holding capacity, built up of soil structure, etc. may be required. In
addition, it may be useful to include representative SOC balances from typical farming systems in the
evaluation of nitrogen management.
The technical results of the case studies in Winterswijk and Lieue de Grève show that Intensive dairy
farms that undertake practices to maintain landscape quality and/or improve water quality can be
regarded as a specific type of MFS. Adjusting the management of intensive dairy farms to maintain
nature values and abiotic ecosystem boundaries of the regional landscape was achieved by applying
a wide range of practices. Some of these practices were economically viable, others were not.
Payments for specific ecosystem services could stimulate farmers to implement the latter practices
as well. For further development of the MFS studied, ecological intensification applied at the regional
level is advocated. For this, farm prototyping, networks for knowledge exchange and collective
design and trials of innovative practices could be organized to move towards more integrated
systems (Lantinga et al., 2013, Levain et al., 2015, Duru et al. 2015).
6.3 Crop rotations
The positive effect of the cultivation of cereals on C-stock in soil ranges from 9 kg.ha-1.yr-1 in CS
Winterswijk to 18 – 120 kg.ha-1.yr-1 in CS Dolnoslaskie. Total C-input for the cultivation of cereals is
larger in CS Winterswijk than in CS Dolnoslaskie, with 5 t C for residue and 0.99 t C from FYM in
Winterswijk and 1.78 t C and 0.34-0.07 t C from manure in Dolnoslaskie. Despite the lower C-input,
the largest change in C-stock was modelled for CS Dolnoslaskie. The main reason for the larger
sequestration is probably the lower C-stock at the beginning of the modelling period. In addition,
weather conditions in CS Winterswijk may favour mineralisation process as compared to those in CS
Dolnoslaskie.
However, the EU greening policy may have adverse effects on carbon building farming practices
within mixed farming systems. A first instant concerns the cultivation of cereals to stimulate
biodiversity in the CS Winterswijk and the implementation of the new CAP-measures which does not
include cereals, and the new derogation requirements of 80% grassland. It is expected that as a
result of these regulations, the cultivation of cereals in the region will be discontinued. A second
instant concerns the lay-arable rotation and, also, the new CAP. The obligation to have permanent
grassland instead of temporary grasslands diminishes the possibility for grass ley – arable rotation,
which may affect income and/or production negatively, e.g. in CS Lieue de Grève.

58
6.4 Role of grassland
Modelled C-change in the specialised and mixed dairy systems in CS Winterswijk range from 150 to
199 kg.ha-1.yr-1, lower than the maximum in CS Lieue de Grève, i.e. 230 kg.ha-1.yr-1 in the specialised
dairy system. This result is remarkable obtained given that the proportion of grasslands is similar, 73
% and 70% for CS Lieue de Grève and CS Winterswijk, respectively, and initial SOC is similar as well. A
first possible explanation for the modelled difference may be the age/duration of the temporary
grasslands. Annual carbon storage in temporary grasslands increases with age, and also depends on
the preceding crop, e.g. after conversion from crops to grassland more C is sequestered and for a
much longer period of time, than after grassland renewal. According to IPCC 2006 calculations
(revised by Dollé & Klumpp 2015), net storages begins when grassland age is > 3 years (Figure 6.1),
the effect being larger in soils with high C-stock. Since soils in both Lieue de Grève and Winterswijk
are relatively rich in C (rather 50 than 35 t C in the first 30 cm), differences in grassland duration
might partly explain the difference in change in C-stock. In Dutch dairy systems and in CS Winterswijk
in particular, mean duration of temporary grasslands is lower than in CS Lieue de Grève, with ca.45%
of the grasslands area is over 5 years of age. The assessment for CS Lieue de Grève was based on
calculations of the soil N balance in which grassland duration is taken into account. For CS
Winterswijk the assessment was based on calculations with standardised C-input of a 3-year old
grassland which is in accordance with regional agricultural practice.
Figure 6.1. Annual carbon stock change in contrasting temporary grasslands (Dollé & Klump, 2015).
A second possibility that might explain the observed differences is the grazing and mowing regime
applied at the grasslands. The amount of biomass (leaves, roots) returned to the soil is strongly
related to the level of defoliation. A third possibility explaining higher C-sequestration is the grass-
based specialised dairy system in CS Lieue de Grève is the proportion of other crops in the rotation.
In the specialised dairy system of CS Winterswijk, 30% of the UAA is cropped with maize, one of the
major crops accountable for C-losses. It is likely that the specialised system in Lieue de Grève
1 2 3 4 5 6 years
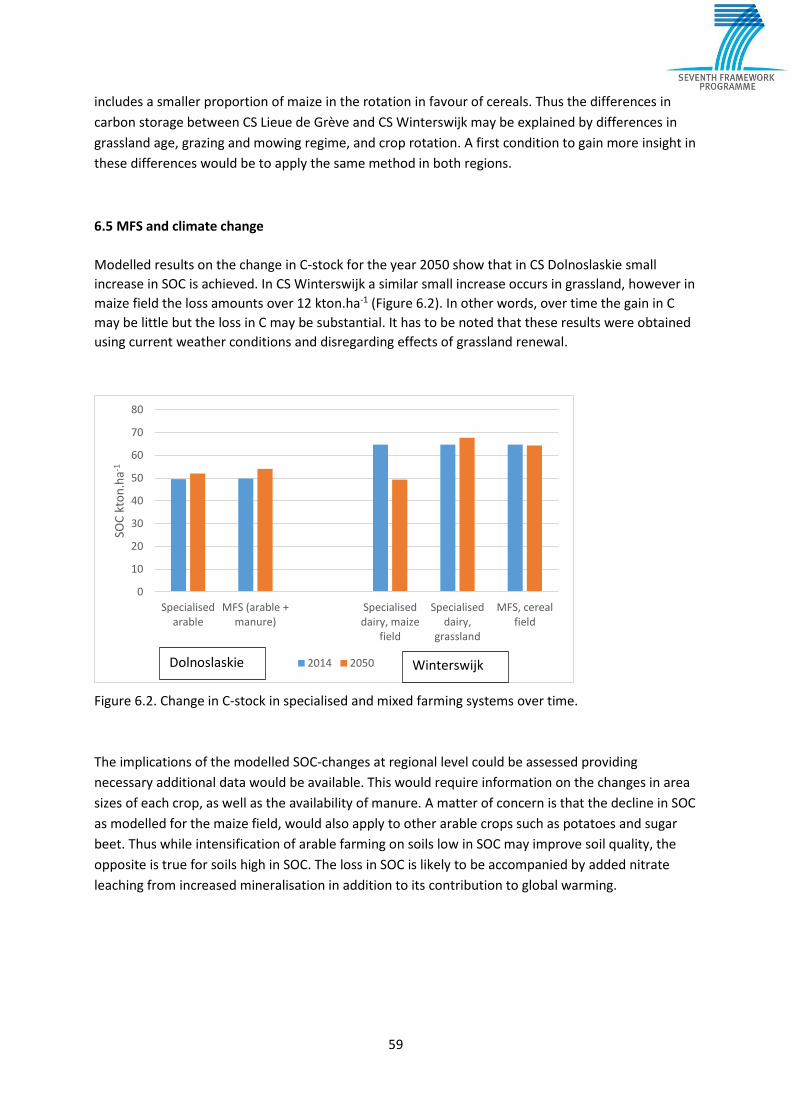
59
includes a smaller proportion of maize in the rotation in favour of cereals. Thus the differences in
carbon storage between CS Lieue de Grève and CS Winterswijk may be explained by differences in
grassland age, grazing and mowing regime, and crop rotation. A first condition to gain more insight in
these differences would be to apply the same method in both regions.
6.5 MFS and climate change
Modelled results on the change in C-stock for the year 2050 show that in CS Dolnoslaskie small
increase in SOC is achieved. In CS Winterswijk a similar small increase occurs in grassland, however in
maize field the loss amounts over 12 kton.ha-1 (Figure 6.2). In other words, over time the gain in C
may be little but the loss in C may be substantial. It has to be noted that these results were obtained
using current weather conditions and disregarding effects of grassland renewal.
Figure 6.2. Change in C-stock in specialised and mixed farming systems over time.
The implications of the modelled SOC-changes at regional level could be assessed providing
necessary additional data would be available. This would require information on the changes in area
sizes of each crop, as well as the availability of manure. A matter of concern is that the decline in SOC
as modelled for the maize field, would also apply to other arable crops such as potatoes and sugar
beet. Thus while intensification of arable farming on soils low in SOC may improve soil quality, the
opposite is true for soils high in SOC. The loss in SOC is likely to be accompanied by added nitrate
leaching from increased mineralisation in addition to its contribution to global warming.
0
10
20
30
40
50
60
70
80
Specialisedarable
MFS (arable +manure)
Specialiseddairy, maize
field
Specialiseddairy,
grassland
MFS, cerealfield
SOC
kto
n.h
a-1
2014 2050 WinterswijkDolnoslaskie

60
Table 6.1. Summary of mean annual C-change in specialised and mixed farming systems in the three case studies.
CS Dolnoslaskie CS Winterswijk CS Lieue de Grève
Farming System C change Farming System C change Farming System C change
kg.ha-1.yr-1 kg.ha-1.yr-1 kg.ha-1.yr-1
S01-"as was" transition 18 S01-BAU Specialised arable: potato -474 S01-Grass based (60%), specialised 230
S02-Mixed agriculture 80 S02-BAU Specialised dairy (grass 70%) 186 S02-Grass + maize, specialised 10
S1-Specialised arable: cereal 71 S1-Dairy mixed with crops (grass 70%) 150 S1-Maize + grass, mixed 80
S2-Return to MFS: manure 120 S2-Dairy mixed with services (grass 70%) 199 S2-Milk + cash, mixed -65
Soil depth (cm.) 28 Soil depth (cm.) 20 Soil depth (cm.) 30
Initial C-stock (t ha-1) 49 Initial C-stock (t ha-1) 65 Initial C-stock (t ha-1) 101
Max. change (‰) 2.5 Max. change (‰) 3.1 Max. change (‰) 2.3

61
7. General conclusions
This study focused on the effects of specialised and mixed farming systems with varying levels of
intensification. It provided evidence from model calculations that land sharing, as part of a mixed
farming system, at the regional level does not necessarily lead to higher SOC than specialised farming
systems, but it can contribute to SOC irrespective of its primary aim to increase crop production,
biodiversity and/or to reduce mineral losses. Results indicate that in intensive arable systems on soils
low in SOC, the amount of C-input from crop residues and/or manure is of more importance for
increasing SOC than the specialist (cereal-based) or mixed character of the farming system. However,
the Roth-C model calculations also showed that this contribution may be higher in mixed arable
systems than in specialised arable systems. At soils high in SOC, specialised (potato-based) arable
systems lead to significant carbon loss over time. In contrast, the specialised dairy farms as well as
the mixed dairy farms increased SOC. Concerning the latter, mixed systems with cereal cultivation to
stimulate biodiversity provided more carbon than mixed systems with measures to reduce mineral
losses to ground- and surface waters. However, results based on CASIMOD’N show that highest gain
in carbon was obtained by the specialist (grass-based) dairy system at moderate production level.
Thus in intensive dairy farming systems similar in SOC, C-input was proportional to grassland age
which, at the high production farms, was negatively related to the grass-maize rotation.
As a conclusion, the findings suggest that the contribution of land sharing to SOC at regional level
depends on 1) agro-ecological conditions; and 2) production goal. This paradigm of ecological
intensification may constitute a base for further elaboration of mixed farming systems. For land
sharing to have potential as a blueprint for ecological intensification, specific regional incentives may
be needed to arrive at the optimal combination of the driving forces, both economically and
ecologically.

62
References
Anonymus (2008) Ontwikkelen van een expertsysteem voor het adviseren van het koolstofbeheer in
de landbouwbodems (Development of an expertsystem for recommendations of carbon
management in agricultural soils). Bodemkundige Dienst van België / Universiteit Gent,
Vakgroep Bodembeheer en bodemhygiëne. Gent (BE).
AGRESTE (2011) Agreste Bretagne: Statistique Agricole Annuelle 2010. Rennes: Direction Régionale
de l’Alimentation de l’Agriculture et de la Forêt, Service Régional de l’Information Statistique et
Economique.
Aurousseau & Squividant (1996) Aurousseau, P., Squividant, H., 1996. Use of Tree Graph Structures
for Computation. Modeling of Derived Variables in Digital Elevation Model software.
<http://viviane.roazhon.inra.fr/spanum/publica/dem/dem2.ht m>.
Avadi A, Nitschelm L, Corson M & F. Vertès (2016) Data strategy for environmental assessment of
agricultural regions via LCA: case study of a French catchment. The International Journal of Life
Cycle Assessment, accepted jan. 2016.
Beaujouan V, Durand P & L Ruiz (2002) A hydrological model dedicated to topography-based
simulation of nitrogen transfer and transformation: Rationale and application to the
geomorphology-denitrification relationship. Hydrological Process 16:493–507.
BDAT, 2011. Base de DonnéesAnalyse des Terres. <http://www.gissol.fr/programme/bdat/bdat.php>
Bechini L, Castoldi N & A Stein (2011) Sensitivity to information upscaling of agro-ecological
assessments: Application to soil organic carbon management. Agricultural Systems 104:480-490.
Bellamy PH, Loveland PJ, Bradley RI, Lark RM & GJD Kirk (2005) Carbon losses from all soils across
England and Wales 1978-2003. Nature 437 pp. 245-248.
Berland J &M Salaün (2014) Report on energetic efficiency of system tested in subtask 3.3.2: Co-
generation of renewable energy. Deliverable 3.4 CANTOGETHER Project Report.
Chardon X, Raison C, Le Gall A, Morvan T & P. Faverdin (2008). Fumigene: A model to study the
impact of management rules and constraints on agricultural waste allocation at the farm level.
Journal of Agricultural Science, 146, 521-539.
Coleman K & DS Jenkinson (1999) Roth-C-26.3 - A Model for the turnover of carbon in soil.
Rothemsted, Harpenden.
Dollé JP & K Klump (2016) Carbon sequestration / release in grassland systems. in: Default
approaches for cross-cutting issues for the cattle related product environmental footprint pilots.
Tuomisto HL, Saouter E & R Plant (Eds.) JRC Technical Report 94878, ISPRA, European
Commission.
EC (2011) Cap Reform – an explanation of the main elements. Memo/11/685. 12 October 2011.
European Commission, Brussels.
Egan JF & DA Mortensen (2012). A comparison of land-sharing and land-sparing strategies for plant
richness conservation in agricultural landscapes. Ecological Applications, 22: 459–471.
FAO/USDA Soil Classification System.
Description of Work (2011) EU-Project CANTOGETHER. INRA, Paris.
Den Boer DJ & B Zandstra (2013). Landbouwkundige maatregelen & betere waterkwaliteit in
grensoverschrijdend project Winterswijk-Oeding (Agricultural practices & improved water
quality in the crossingborder project Winterswijk-Oeding, in Dutch). NMI-report 1351, Nutrient
Management Institute, Wagenigen.
Den Boer DJ & MJG de Haas (2013) Mogelijkheden gemengde bedrijfssystemen en beperken N- en P-
63
verliezen in de regio Winterswijk (Options for mixed farming systems and reduction of N and P-
losses in the area Winterswijk in the Netherlands, in Dutch). NMI-report 1425, Nutrient
Management Institute, Wageningen.
Diaz Ismael A (2012) Nitrogen surplus and soil quality assessment of three dairy farms at the region
of Winterswijk, the Netherlands. Internship report. Nutrient Management Institute /
Wageningen University.
Donzallaz G (2012) A methodology to compare specialised and mixed farming systems. Master
Thesis, ISARA, Lyon.
Doussal E (2014) Analysis and evaluation of systemics changes aiming at limiting nitrate losses in a
network of 8 pilot farms on the Lieue de Grève watershed. Master 2 report, ESA Angers, 77 p.
Duru M, Therond O, Guillaume M, Martin-Clouaire R, Magne MA, Justes E, Journet EP, Aubertot JN,
Savary S, Bergez JE & JP Sarthou. (2015) How to implement biodiversity-based agriculture to
enhance ecosystem services: a review. Agronomy & Sustainainable Development.
Falloon P & DS Powlson (2004) Managing field margins for biodiversity and carbon sequestration: A
great Britain case study. Soil Use & Management 20:240-247.
Feldwisch N (2013) Minimierung von Nährstoffeinträgen aus diffusen Quellen im Einzugsgebiet der
Schlinge. Ingenieurbüro Feldwisch / Royal Haskoning DHV. Bergisch Gladbach.
Franko, U (1997) Modelling of soil organic matter turnover. Amsterdam.
Garcia F, Faverdin P, Delaby L & JL Peyraud (2005). Tournesol: amodel to simulate cropping plans in
dairy production systems. Renc. Rech. Rum. 12: 195–198.
Gascuel C, Ruiz L & F Vertès (2015) Comment réconcilier agriculture et littoral? Vers une agroécologie
des territoires (Reconciling agriculture and coastal areas? Towards territorial agroecology). Quae
Editions, Versailles, 150 p.
Godinot O, Carof M, Vertès F & P Leterme (2014) SyNE: An improved indicator to assess nitrogen
efficiency of farming systems. Agricultural Systems 127: 41–52.
Górski T & A Zaliwski (2002) Model Agroklimatu Polski, Pam. Puł., 130 (1), 251-260.
Gras et al (1989) in: Van der Werf & Petit (2002) Evaluation of the environmental impact of
agriculture at the farm level: a comparison and analysis of 12 indicator-based methods.
Agriculture, Ecosystems & Environment 93:131-145.
Halberg N, Van der Werf HMG, Basset-mens C, Dalgaard R & IJM de Boer (2005) Environmental
assessment tool fort the evaluation and improvement of European livestock production
systems. Livestock Production Science 96: 33-50.
Hanegraaf MC, Vertès F, Corson MS, Den Boer DJ, Moraine M & H. Korevaar (2015) Developing mixed
farming systems in a regional approach: examples from intensive dairy farming. Proceedings of
the 18th Symposium of the European Grassland Federation, Wageningen, the Netherlands, 15-17
June 2015.Grassland science in Europe, Vol. 20, pp. 96-98.
Korevaar, Hein, Rob Geerts, Jan Stronks & Arie Schoemaker (2014) Various perceptions of a cultural
landscape. Results and experiences of the Winterswijk CAP-pilot 2011-2013. Stichting WCL-
Winterswijk, Winterswijk.
Korevaar H & Geerts RHEM(2012) Experiences with ecosystem services on farms; a pilot study
towards CAP reform. Grassland Science in Europe, vol. 17: 756-758.
Korevaar H, Geerts RHEM, De Visser W & E Koldewey (2008) Vier jaar multifunctionele gras- en
bouwlanden in Winterswijk: gevolgen voor economie en ecologie op de bedrijven (Four years
multifunctional grass- and arable lands in Winterswijk: consequences for economy and ecology
at the farms. In Dutch.) Report 115, Plant Research International / LTI Noord Projecten,
64
Wageningen.
Korevaar, H. & R.H.E.M. Geerts. 2007. Productivity, biodiversity and nitrate in groundwater of
multifunctional grasslands. In: High Value Grassland. Providing biodiversity, a clean environment
and premium products. Occasional Symposium 38 British Grassland Society, Cirencester, UK: 64-
69.
Kuikman P, Ehlert PAI, Chardon WJ, Van Beek CL, Tóth G. & O Oenema (2008) Current status of risk
assessment methodologies for soil organic matter decline RAMSOIL report 2.5.
Lacoste M., Viaud V., Michot D.,Walter C. (2015) Landscape-scale modelling of erosion processes and soil carbon dynamics under land-use and climate change in agroecosystems. European Journal of Soil Science, July 2015, 66, 780–791.
Lantinga EA, Boele E & R Rabbinge (2013) Maximizing the nitrogen efficiency of a prototype mixed crop-livestock farm in The Netherlands. Wageningen journal of life sciences, NJAS 66:15–22.
Levain A, Vertès, Ruiz L, Delaby L, Gascuel-Odoux C & M Barbier (2015) ‘I am an Intensive Guy’: The Possibility and Conditions of Reconciliation Through the Ecological Intensification Framework. Environmental Management DOI 10.1007/s00267-015-0548-3.
Lima Paris Agenda for Action (LPAA) (2015) The “4‰ Initiative: soils for food security and climate”. French Ministry for Agriculture, Food and Forests, Paris.
Leifeld J, Zimmermann M & J Fuhrer (2008). Simulating decomposition of labile soil organic carbon:
Effects of pH. Soil Biology & Biochemistry 40 (2008) 2948–2951.
Levain A, Vertès F, Ruiz L, Delaby L, Gascuel-Odoux C & M Barbieret (2015) ‘I am an Intensive Guy’:
The Possibility and Conditions of Reconciliation Through the Ecological Intensification
Framework. Environmental Management DOI: 10.1007/s00267-015-0548-3.
Lityński T, Jurkowska H & E Gorlach (1976) Chemico- Agricultural Analyzes, Soil and Fertilizers. PWN.
Merante P, Dibari C, Ferrise R, Bindi M, Lesschen JP, Kuikman P, Sanchez B & A Iglesias (2015) Report
on critical low soil organic matter contents, which jeopardise good functioning of farming systems.
Report 2.4, EU-project Smartsoil.
Moraine M, Duru M, Nicholas P, Leterme P & O Therond (2014) Farming system design for innovative
crop-livestock integration in Europe. Animal 8, 1204–1217, doi:10.1017/S1751731114001189.
Moreau P, Ruiz L, Mabon F, Raimbault T, Durand P, Delaby L, Devienne S & F Vertès (2012)
Reconciling technical, economical and environmentalefficiency of farming systems in vulnerable
areas. Agriculture, Ecosystems and Environment 147:89-99.
Moreau P, Ruiz L, Vertès F, Baratte C, Delaby L, Faverdin P, Gascuel-Odoux C, Piquemal B, Ramat E,
Salmon-Monviola J & P Durand (2013) CASIMOD’N: An agro-hydrological distributed model of
catchment-scale nitrogen dynamics integrating farming system decisions. Agricultural Systems
118, 41-51.
National Agricultural Census of Poland.
Oehler F, Durand P, Bordenave P, Saadi Z & J Salmon-Monviola (2009) Modelling denitrification at the
catchment scale. Sci. Total Environ. 407: 1726–1737.
OstrowskaA, Gawliński S & Z Szczubiałka (1991), Methods for analyzing and assesing the properties of
soil and plants. Instytut Ochrony Środowiska, Warszawa, Poland.
Phalan B, Onial M, Balmford A & RE Green (2011) Reconciling Food Production and Biodiversity
Conservation: Land Sharing and Land Sparing Compared. Science 333, 1289-1291.
Kaczynski R, Siebielec G, Galazka R, Niedzwiecki J & S Polakova (2013) Assessment of soil organic
carbon status and changes in soils of Polish-Czech borderland. Central Institute for Supervising
and Testing in Agriculture (ÚKZÚZ), Institute for Soil Science and Plant Cultivation (IUNG).
Rutgers M, Van Wijnen HJ, Schouten AJ, Mulder C, Kuiten AMP, Brussaard L & AM Breure (2012) A

65
method to assess ecosystem services developed from soil attributes with stakeholders and data
of four arable farms. Science of the Total Environment 415:39-48.
Salmon-Monviola J, Durand P, Ferchaud F, Oehler F & L Sorel (2012) Modelling spatial dynamics of
cropping systems to assess agricultural practices at the catchment scale. Comput. Electron.
Agric. 81, 1–13.
Stuczyński T (2007) Przyrodnicze uwarunkowania produkcji rolniczej w Polsce. W: Współczesne
uwarunkowania organizacji produkcji w gospodarstwach rolniczych. Studia i Raporty IUNG-PIB,
Puławy, 7,pp. 77-115.
Van den Ham A & HH Luesink (2012) Developments in mineral surpluses and water quality in the
Dutch dairy sector, 1960-2010. Factsheet LEI Wageningen UR.
Van Keulen H & H Schiere (2004) Crop-livestock systems: old wine in new bottles? Proceedings of the
4th International Crop Science Congress, 26 Sep – 1 Oct 2004, Brisbane, Australia.
Vellinga TV & IE Hoving (2010) Maize silage for dairy cows: mitigation of methane emissions can be
offset by land use change. Nutr. Cycl. Agroecosyst DOI 10.1007/s10705-010-9405-1.
Vertès F & Mary B (2014) Grassland frequency in ley-arable rotations is a proxy for predicting SOC
changes on the long term. 18th Nitrogen Workshop.
Vertès F, Delaby L, Ruiz L, Moreau P & P Gascuel-Odoux (2011) Une méthode pour co-construire et
évaluer des options de réduction de pertes N en exploitations sur des bassins-versants côtiers
vulnérables. Renc. Rech. Rum. ,12: 7-8.
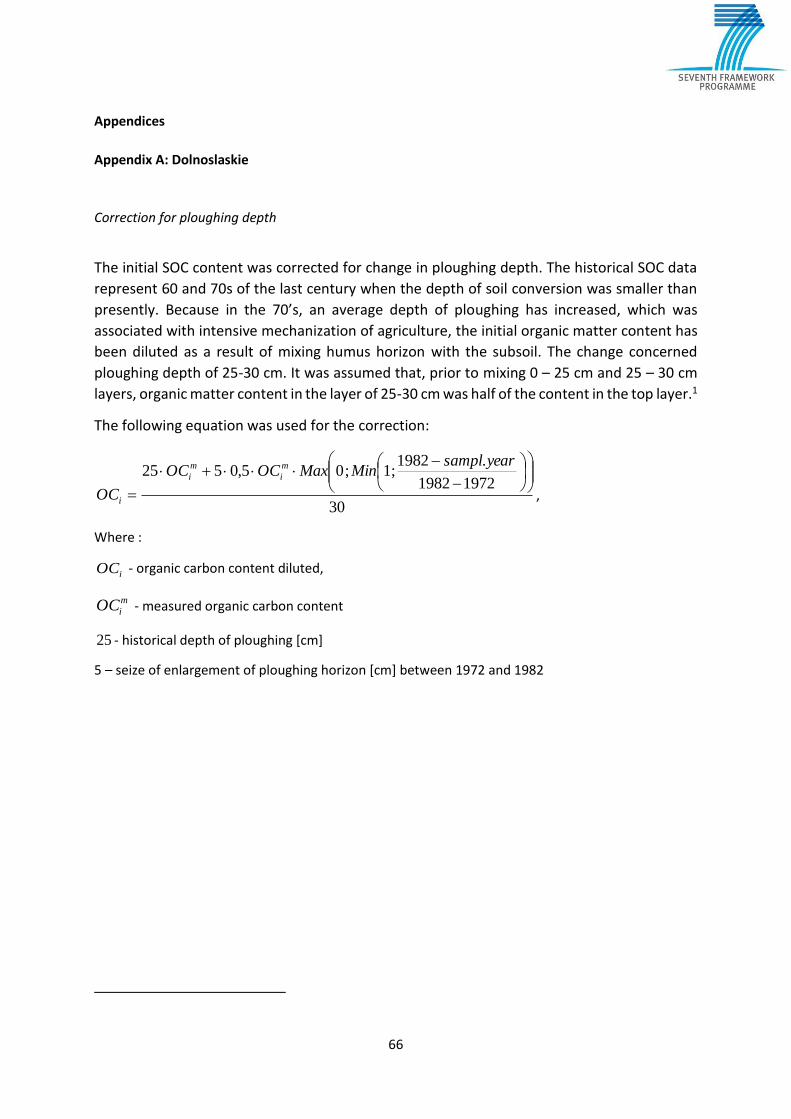
66
Appendices
Appendix A: Dolnoslaskie
Correction for ploughing depth
The initial SOC content was corrected for change in ploughing depth. The historical SOC data
represent 60 and 70s of the last century when the depth of soil conversion was smaller than
presently. Because in the 70’s, an average depth of ploughing has increased, which was
associated with intensive mechanization of agriculture, the initial organic matter content has
been diluted as a result of mixing humus horizon with the subsoil. The change concerned
ploughing depth of 25-30 cm. It was assumed that, prior to mixing 0 – 25 cm and 25 – 30 cm
layers, organic matter content in the layer of 25-30 cm was half of the content in the top layer.1
The following equation was used for the correction:
30
19721982
.1982;1;05,0525
yearsamplMinMaxOCOC
OC
m
i
m
i
i ,
Where :
iOC - organic carbon content diluted,
m
iOC - measured organic carbon content
25 - historical depth of ploughing [cm]
5 – seize of enlargement of ploughing horizon [cm] between 1972 and 1982

67
Appendix B: Winterswijk
Figure B.1. Description of the stakeholder process.
Phase 0 In 1975, Winterswijk was mentioned by the Dutch government as one of the potential new national countryside parks
(CRM, 1975). This resulted in the beginning of the 1980s in severe protests by farmers against the consequences for
environmental and nature-related claims on land, while the size of most farms was too small for further development of
the farms. Around 1990, the local farmers’ organization, a platform of local nature and environmental groups, the
municipality of Winterswijk and the Ministry of Agriculture, Nature and Fisheries joined in a number of surveys ‘to
maintain the beautiful landscape of Winterswijk, develop theagricultural infrastructure and improve the ecological values
of the region’. The surveys were successful. In 1993, Winterswijk became one of the 11 Dutch Valuable Man-made
Landscapes (WCL). A foundation was set up (WCL Winterswijk) in which the municipality, the farmers’ organization,
owners of small estates, local nature and environmental groups, the recreation and tourism sector and local industries
cooperated. This foundation became a driving force behind regional development.
Phase 1 In 1997, the region was selected for the Dutch research programme “Multiple Sustainable Land Use” (MDL), which led to the study of the major farm types (2002-2005). The results indicated that a combination of agronomic, ecological and environmental goals would be possible and that there are possibilities to combine high biodiversity with a rather high production level (Korevaar and Geerts, 2007). This in turn would offer good opportunities to create extra income from recreation and tourism. However, it was shown that in most cases multifunctionality is not profitable for the individual farmer. Phase 2 At the request of farmers a rewarding system for ecosystem services was developed and tested (2007 - 2008). Activities or ecosystem services that would be rewarded were chosen at the local level, including a number of typical features for that region, like restoration of old arable fields and adjacent (steep) edges. The activities were valuated with points, depending on their importance for landscape and/or community, and the acreage or intensity of that activity. Scores were multiplied by a payment per point which results in total payment to the farmer. The incentive was to reward farmers for their efforts instead of compensating them for production losses, which is the case in most agri-environmental schemes. WCL Winterswijk adopted this payment system and launched a countryside fund to reward farmers for offering ecosystem services in December 2008. Later on the development of the system stuck due to on-going debate on the terms under which the public budget could become available. Phase 3 The eastern part of the region became involved in actions directed at improvement of the water quality (2010-2012). This was initiated by regional water board organisations in the Netherlands and Germany. On their behalf, the participating farmers (c. 10) were supported with knowledge, advice and intensive monitoring to improve nutrient use efficiency and reduce nutrient losses. The focus was on measures that increase the utilisation of N and P input and/or reduce the losses of nutrients to streams and small rivers in the area. In addition, surveys were carried out covering 62 dairy farms in the Winterswijk region. Phase 4 The region served as a pilot for the CAP reform for the Dutch Ministry of Economic Affairs (2011 – 2014). About half of all
farms in the region have been participating with a number of activities for ‘greening’ and making the region more
sustainable. These included cultivation of more grains to produce part of the concentrates on-farm, nature conservation
on farm land as well as conservation of the landscape (Korevaar & Geerts, 2012; Korevaar et al., 2014).

68
Appendix B, continued. Table B.1. Green-blue services on the farms participating in the CAP-pilot in Winterswijk in 2011 (Korevaar & Geerts, 2012).
Service/activity Number of farms Units Area (ha) or length (km)
Payment (€) per unit Total costs (1000 €)
Biodiversity Preservation of small fields 97
(= all farms) ha 945.0 50 field 2-3 ha
125 field 1-2 ha 250 field 0.5-1 ha 400 field < 0.5 ha
20.3 49.0 28.8 12.7
Cleaning grassy field margins along forests and hedgerows
76 km 101.6 500 50.8
Reintroduction of cereals 19 ha 31.4 500 15.7 Sowing arable field boundary species 12 ha 5.5 2,000 11.0 Unharvest cereal crop 4 ha 1.8 1,400 2.6 Overwinter stubbles 7 ha 10.1 250 2.5 Reintroduction of species-rich grasslands
7 ha 9.4 1,400 13.2
Preservation of old meadows 62 ha 538.5 50 26.9 Sowing species rich margins along grasslands
2 ha 0.5 1,500 .8
Introduction of grass-clover swards 15 ha 36.4 250 9.1
Landscape Maintenance of woodlots < 0.5 ha 28 ha 7.3 5,000 36.3 Maintenance of solitary trees 28 number 110 50 5.5 Fencing solitary trees 14 number 47 100 4.7 Conservation of steep margins along arable fields
21 ha 1.8 5,000 9.0
Maintenance of sheltered fruit trees 21 number 315 20 6.3
Water quality Introduction of catch crops 21 ha 51.3 250 12.8
Education and open farms Education and farms open to visitors 22 hours 170 50 8.5 Footpaths over farm land 8 km 7.3 500 3.6
Total costs 330.1
In bolt: measure with effect on soil organic matter.

69
Appendix B, continued.
Table B.2. Regional upscaling of effects of mixed farming with services (Den Boer & De Haas, 2013).
Reduction potential loss (kg)
Measure Crop # ha Per ha WRIJ area
N P2O5 N P2O5
Manure in the row maize 1,000 46 26 43,010 24,310
No manure if soil-P is high maize, arable, grass
507 28 67 3,015 41,686
Postpone manure appl. if water table is high
grass 1,565 4,3 6,730
No manure as from August
grass 2,275 6,2 17,081
Nitrificatieremmer with mineral fertiliser
gras 2,850 12 34,200
Green crop maize 1,000 16.5 5.5 16,500 5,500
Raise pH maize 405 7 3 2,566 979
Total area (kg) 123,102 72,475
In bolt: measure with effect on soil organic matter.

70
Appendix B, continued.
Table B.3. Basic data on fertilisation management at model farms.
Crop Dairy Farmyard Manure Crop residue
Amount Month Amount Month
m3.ha-1 C kg3.ha-1
potato 30 March 1,790 October
winterwheat 30 February 5,700 October
maize 30 April 900 October
-catchcrop: ryegrass (poor) 0 250 April
-catchcrop: ryegrass (good) 0 1,000 April
grass 30 February 4,725 per month
15 May
15 June
grassclover 30 February 4,544 per month
May
15 June

71
Appendix C: Lieue de Grève
Phase 1 : Lieue de Grève Bay has been strongly affected by significant algal blooms since the 1970’s. This “catastrophe”
negatively affect seaside tourism and the economic development of the bay. An agrarian diagnosis and land use
reconstitution through remote sensing (1950 until now) highlighted the key changes leading to large release of nitrate:
permanent grassland and moors cultivation, correction of pH deficiencies, induced a large mineralization of high soil organic
matter stocks in the 60’s. Over-fertilisation of the new temporary grasslands and cultivation of maize (from the 1970’s)
leaving bare soils in winter which increased the losses (of N and P).
Phase 2 : Not to give up the idea of agriculture contributing to the common good, nor ignore the coastline damages created
a tension that led to the creation of a Comite´ Professionnel Agricole (CPA), through the initiative of a local representative
and a local leader of the main agricultural union, the Federation des syndicats d’exploitants agricoles (FNSEA).
Institutionalization of such a cooperation system required accepting the idea of sharing, beyond the main ‘‘union family’’,
the concerns that environmental issues posed for Breton agriculture. In this area farmers are expected to make more effort
than elsewhere to reduce N emissions: the water quality objective proposed is approximately 10 mg/l NO3 at watershed
outlets, i.e. 20 % of the limit defined by EU policies. For the local stakeholders who were largely excluded from agricultural
politics and had very few tools to change agriculture, the CPA was a gamble that opened an unprecedented field of
possibilities, since the organization guaranteed them stable spokespersons representing the diversity of the farmers.
This CPA obtained the participation of researchers by involving them in the reflection and diagnosis that was part of the
first so-called ‘‘preventive’’ control programs in the late 1990s. This partnership provided support for better adjustment of
agricultural practices (eg optimize fertilization) and access to new knowledge, but also afforded a different viewpoint of
empirical situations.
Phase 3 : A new working group was organized around three complementary objectives: (i) improve understanding of
mechanisms influencing the nitrogen cycle in the landscape; (ii) model nitrate emissions from the watershed, integrating
constraints of livestock farming systems in a model coupling agro-hydrological and farm functioning; and (iii) co-construct,
with farmers and local stakeholders, scenarios combining improvement in N management, and social acceptability, and
evaluate their impacts. A conceptual framework was shared on long response time of water quality to agricultural fluxes
changes, and an available model allowed to assess ex-ante the effects of scenarios on results rather than means. The CPA
asked researchers to deepen the diagnosis and help to open new ways to reduce nitrate losses, given new room for
manoeuvre: changes in production systems could be considered, and not simply optimization of present ones.
Phase 4 : 2010-2014 : after co-construction of a set of indicators to guide evolution and of specific scenario per farm, a
group of 9 pilot farms implemented changes toward N inputs reduction, increased link between animal and crop
production, increased part of grasslands in landscape and better nutrient recycling and use efficiency. The design process
and changes implemented were observed and measured, and used as input data in the model to assess at the territory level
the impacts of changes (each farm being a “type farm”).
Figure C.1. Description of the stakeholder process.

72
Appendix C, continued.
Table C.1.
Specialised Dairy Mixed dairy
Grass based
(9)
Grass + maize (13)
Milk + Meat (maize+grass)
(13)
Milk + cash crops + (grass + maize)
(21)
Res. ET Signif.
Area
AA (ha) 76.6 72.2 96.3 81.7 23.4 NS
Grassland % AA 75.3a 58.7b 48.4c 45.9c 8.9 ***
Maize % AA 11.4c 27.3bc 32.0a 24.8b 5.9 ***
Maize %fodder area 12.7c 31.1b 39.6a 34.5ab 7.5 ***
Fodder area % AA 89.6a 88.1a 81.1a 72.9b 8.7 ***
Cash crops % AA 9.1b 10.4b 16.5b 26.4a 8.0 ***
Grazing
Accessible area/DC (ares)
78a 48b 43b 49b 21.8 ***
Grazed area / DC (ares)
60a 30bc 22c 34b 12.8 ***
Labor
Labor unit 1.5 1.8 2.2 1.9 0.8 NS
Cattle herds
LSU 86.3b 97.1b 136.8a 81.3b 32.0 ***
Dairy cow (LSU) 48.1 59.0 60.6 53.1 15.8 NS
Steers (LSU) 2.7b 4.6b 20.8a 2.4b 10.7 ***
Milk production
Milk sold (L) 225,959a 351,164b 401,428b 378,884b 106,301 **
Milk / ha AA (L) 3,176b 4,943a 4,332ab 4,753a 1,179 **
Animal performances
Milk sold per cow 4,874c 5,917cb 6,672ba 7,109a 929 ***
Concentrate per cow (Kg)
472c 699b 1,259a 818b 360 ***
Ncon/l milk 4.2c 7.8b 11.8a 7.3b 2.9 ***
% farmers closing maize silage silo
89 62 8 22 # ***
Age at 1st veel (months)
32.7 a 32.6a 27.8b 28.5b 3.1 ***
N concentrates per ha 16c 45b 65a 38b 14.1 ***
N organic per ha 12.1 7.4 12.9 8.9 25.4 NS
Net mineral N par ha 22c 60ab 77a 51b 24.2 ***
Indicator “N inputs” per ha AA
46b 101b 139a 93b 25.2 ***
Letters a, b, and c indicate similarities or differences for each variable between the 4 types of farms.

73
Appendix C, continued.
Table C.2. Results of the Casimod’N modelling (in kg N par ha watershed) : mean values for the
simulation period 2008-2020.
BAU Indicators
inputs N fertilizers 40 26
N manure 26 27
N returns at grazing 44 38
N fixation 8 10
N deposition 14 14
Total N inputs 132 114
Stock variation Variation N in soils -11 -13
Variation N in water 0 -2
Variation N in crops 4 4
Total variation N -7 -11
outputs N denitrification 6 5
N volatilisation 9 7
N exported by crops 81 77
N uptake in woods/hedges 16 15
N in rivers 26 21
Total N outputs 138 125
Appendix A, continued.
Figure C.2. Results Casimod’N for 8 pilot farms (Doussad, 2014).
-350
-250
-150
-50
50
150
250
350
a b c d e f g h
Kg N/ha
Risque de lessivage
Bilan N sol
Pertes gazueses
Production végétale
Fixationatmosphérique
Azote organique
Engrais minéral