Embed Size (px)
Citation preview
Jan. 28, 2009 Canon Inc.
Canon Inc.FY 2008 Results
January 28, 2009Masahiro Osawa
Managing Director, Group ExecutiveFinance and Accounting Headquarters
This presentation contains forward-looking statements with respect to future results, performance and achievements that are subject to risk and uncertainties and reflect management’s views and assumptions formed by available information. All statements other than statements of historical fact are statements that could be considered forward-looking statements. When used in this document, words such as “anticipate,” “believe,” “estimate,”“expect,” “intend,” “may,” “plan,” “project” or “should” and similar expressions, as they relate to Canon, are intended to identify forward-looking statements. Many factors could cause the actual results, performance or achievements of Canon to be materially different from any future results, performance or achievements that may be expressed or implied by such forward-looking statements, including, among others, changes in general economic and business conditions, changes in currency exchange rates and interest rates, introduction of competing products by other companies, lack of acceptance of new products or services by Canon’s targeted customers, inability to meet efficiency and cost reduction objectives, changes in business strategy and various other factors, both referenced and not referenced in this presentation. A detailed description of these and other risk factors is included in Canon’s annual report on Form 20-F, which is on file with the United States Securities and Exchange Commission. Should one or more of these risks or uncertainties materialize, or should underlying assumptions prove incorrect, actual results may vary materially from those described herein. Canon does not intend or assume any obligation to update these forward-looking statements.
Jan. 28, 2009 Canon Inc.
P24 – 25Financial Situation
P14 – 23FY 2009 Projections
P3 – 134Q/FY 2008 Results
P26 – 31Supplementary Information
2
Agenda
Jan. 28, 2009 Canon Inc. 3
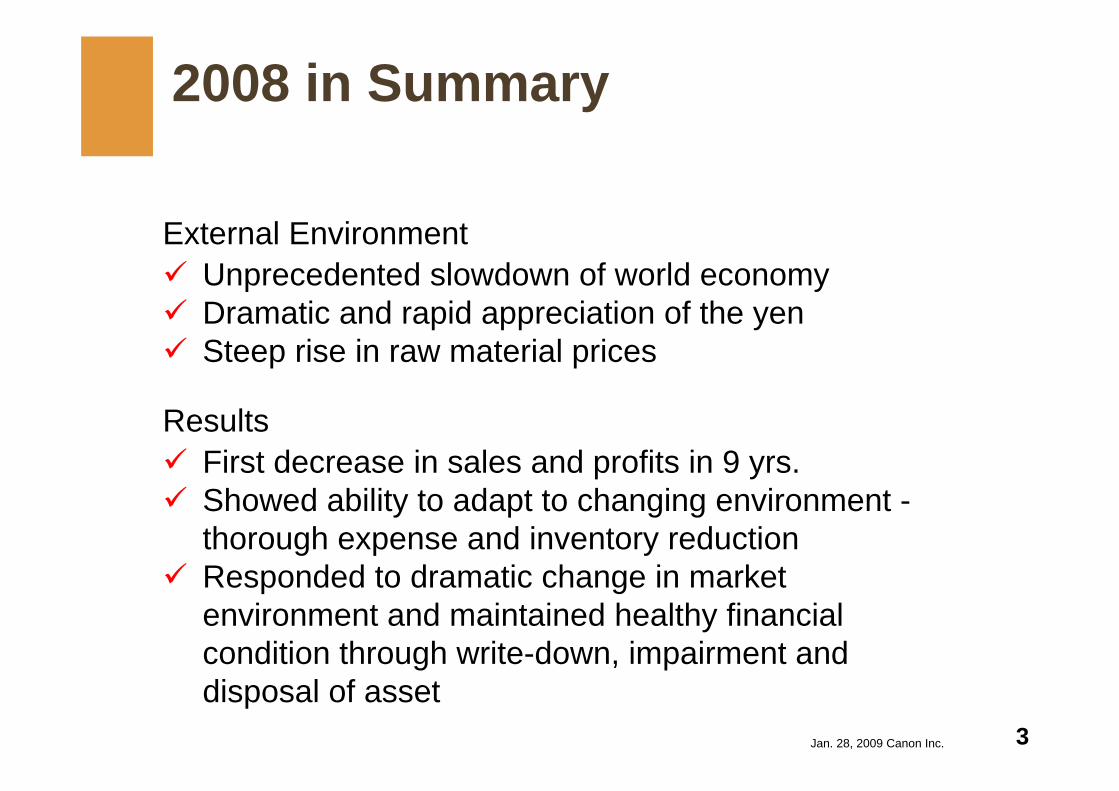
External EnvironmentUnprecedented slowdown of world economyDramatic and rapid appreciation of the yenSteep rise in raw material prices
ResultsFirst decrease in sales and profits in 9 yrs. Showed ability to adapt to changing environment -thorough expense and inventory reductionResponded to dramatic change in market environment and maintained healthy financial condition through write-down, impairment and disposal of asset
2008 in Summary
Jan. 28, 2009 Canon Inc.
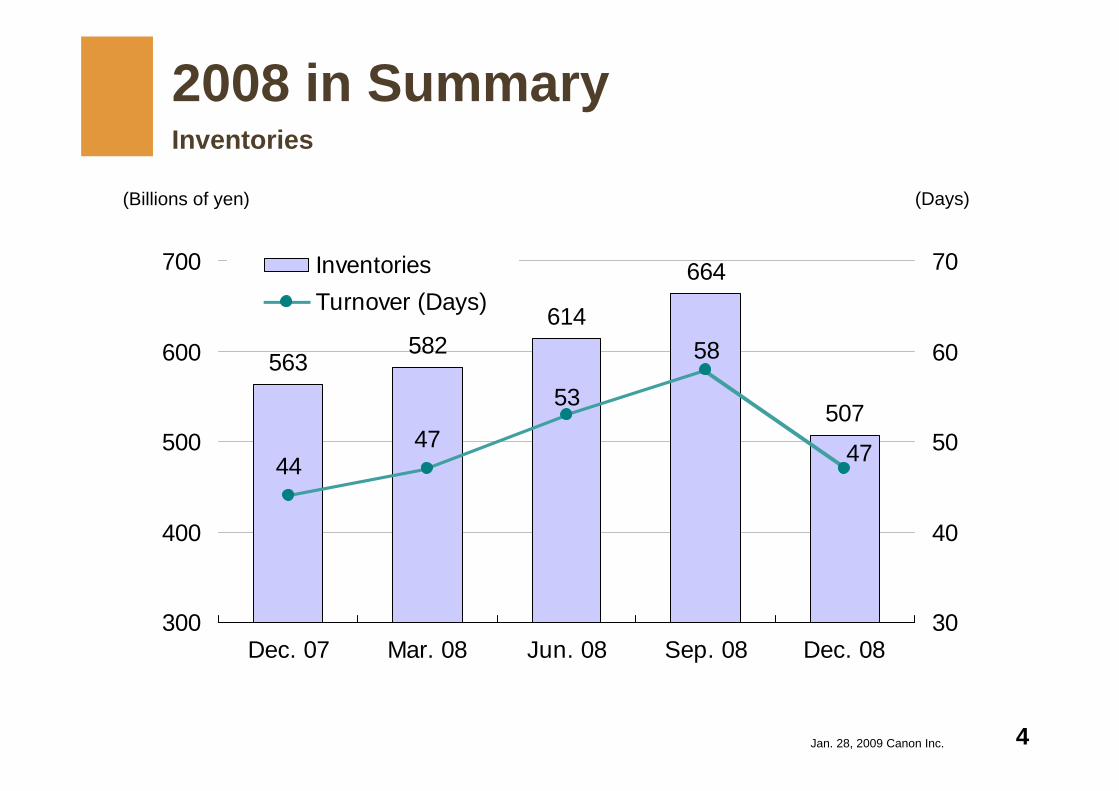
563582
614
664
507
4447
53
58
47
300
400
500
600
700
Dec. 07 Mar. 08 Jun. 08 Sep. 08 Dec. 0830
40
50
60
70InventoriesTurnover (Days)
(Billions of yen) (Days)
4
2008 in SummaryInventories
Jan. 28, 2009 Canon Inc.
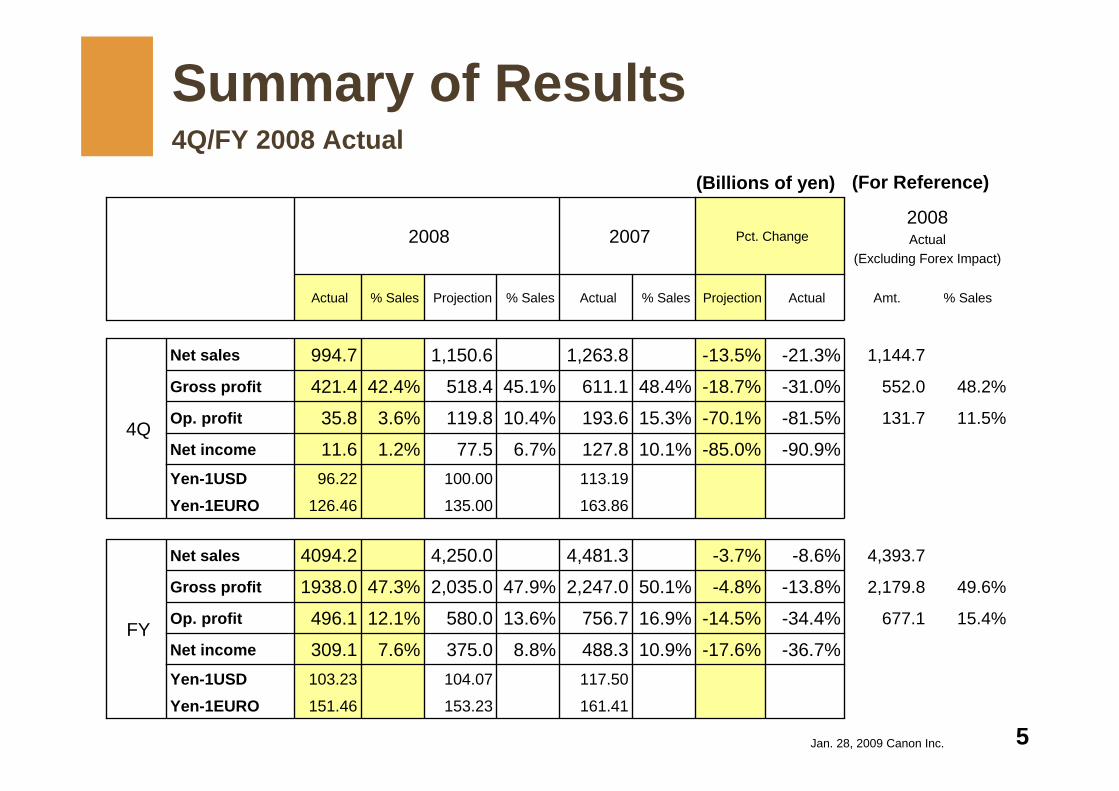
% SalesAmt.
677.1
2,179.8
4,393.7
131.7
552.0
1,144.7
-36.7%
-34.4%
-13.8%
-8.6%
-90.9%
-81.5%
-31.0%
-21.3%
Actual
163.86135.00126.46Yen-1EURO
-3.7%4,481.34,250.04094.2Net sales
FY
49.6%-4.8%50.1%2,247.047.9%2,035.047.3%1938.0Gross profit
15.4%-14.5%16.9%756.713.6%580.012.1%496.1Op. profit
-17.6%10.9%488.38.8%375.07.6%309.1Net income
117.50104.07103.23Yen-1USD
4Q
161.41153.23151.46Yen-1EURO
113.19100.0096.22Yen-1USD
-85.0%10.1%127.86.7%77.51.2%11.6Net income
11.5%-70.1%15.3%193.610.4%119.83.6%35.8Op. profit
48.2%-18.7%48.4%611.145.1%518.442.4%421.4Gross profit
-13.5%1,263.81,150.6994.7Net sales
Projection% SalesActual% SalesProjection% SalesActual
2008Actual
(Excluding Forex Impact)
Pct. Change20072008
5
Summary of Results4Q/FY 2008 Actual
(Billions of yen) (For Reference)
Jan. 28, 2009 Canon Inc. 6
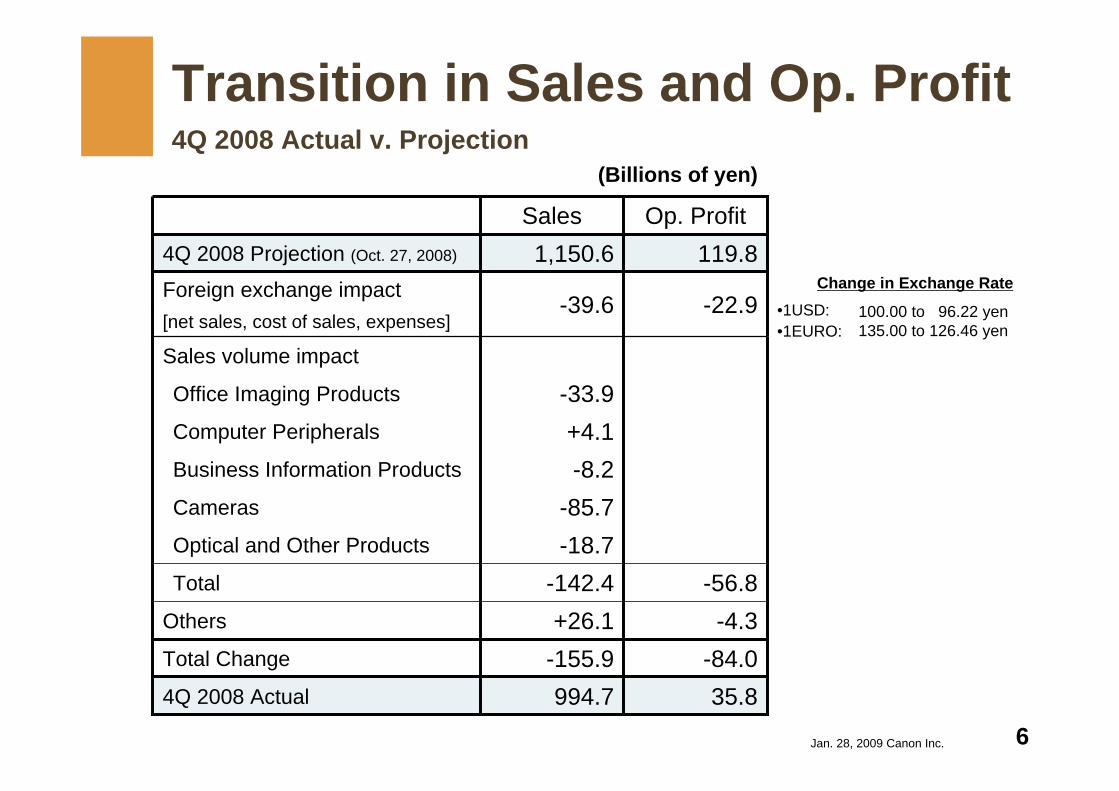
Transition in Sales and Op. Profit4Q 2008 Actual v. Projection
(Billions of yen)
Change in Exchange Rate
100.00 to 96.22 yen135.00 to 126.46 yen
•1USD:•1EURO:
-18.7Optical and Other Products
-33.9Office Imaging Products
+4.1Computer Peripherals
-8.2Business Information Products
-85.7Cameras
35.8994.74Q 2008 Actual
-84.0-155.9Total Change
-4.3+26.1Others
-56.8-142.4Total
Sales volume impact[net sales, cost of sales, expenses]
-22.9-39.6Foreign exchange impact
119.81,150.64Q 2008 Projection (Oct. 27, 2008)
Op. ProfitSales
Jan. 28, 2009 Canon Inc.
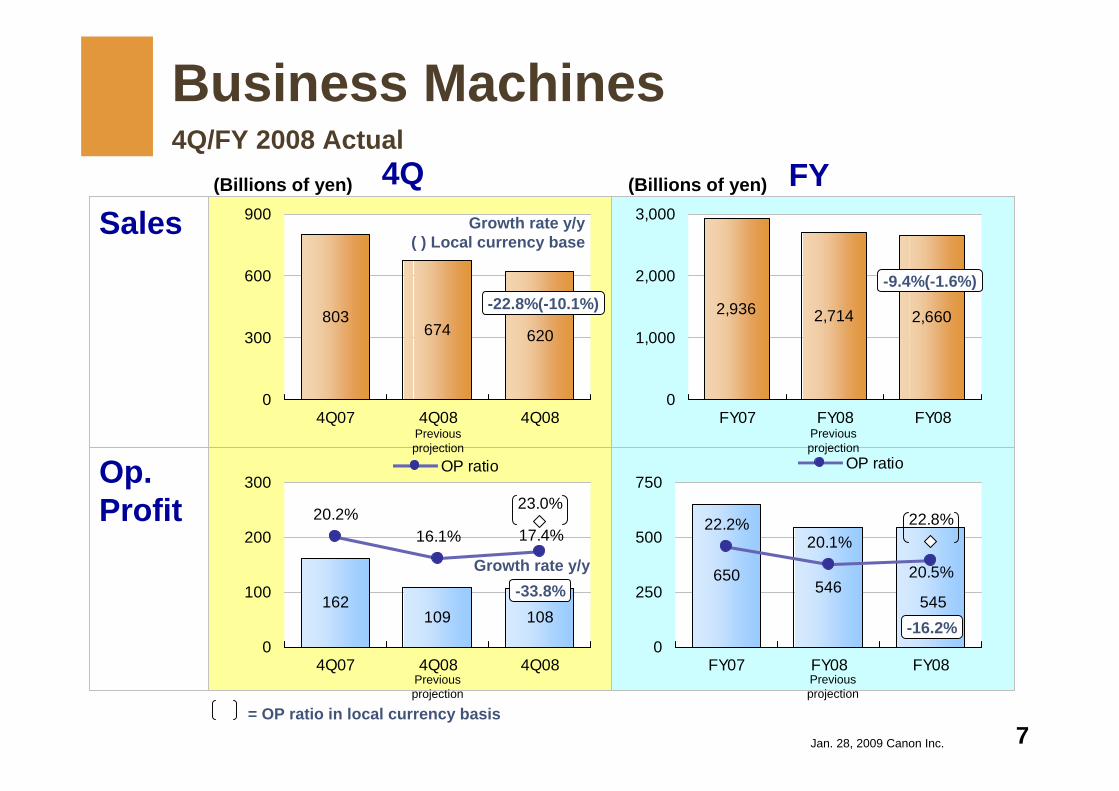
650546
545
22.2% 22.8%
20.5%
20.1%
0
250
500
750
FY07 FY08 FY08
OP ratio
803674 620
0
300
600
900
4Q07 4Q08 4Q08
2,936 2,714 2,660
0
1,000
2,000
3,000
FY07 FY08 FY08
Sales
Op.Profit
4Q FY
162109 108
20.2%17.4%16.1%
23.0%
0
100
200
300
4Q07 4Q08 4Q08
OP ratio
-9.4%(-1.6%)-22.8%(-10.1%)
-16.2%
-33.8%
Previous projection
7
Business Machines 4Q/FY 2008 Actual
(Billions of yen)(Billions of yen)
Previous projection
Previous projection
Previous projection
Growth rate y/y( ) Local currency base
Growth rate y/y
= OP ratio in local currency basis

Jan. 28, 2009 Canon Inc.
0
200
400
600
4Q07 4Q08 4Q08
OthersColorMonochrome
0
500
1,000
1,500
2,000
FY07 FY08 FY08
-24.8%(-16.8%)
-25.9%(-13.1%)
-33.6%(-22.4%)
-28.9%(-17.8%)
-20.0%(-13.7%)
-8.1%(-2.4%)
-7.4%(-3.3%)
-13.3%(-7.6%)
353
251
1,291
FY4Q
-3%-16%Total
-6%-19%Mono-chrome
+5%-5%Color
Copying machines
Growth rate y/y(Unit base)
1,120
8
2931,162
Office Imaging Products 4Q/FY 2008 Actual
Growth rate y/y( ) Local currency base
Sales(Billions of yen)
FY4Q
25%26%Unit base
47%49%Value base*
Color ratio (Copying machines)
Calculated on a post reclassification basis *Includes consumables
Previousprojection
Previousprojection
*Figures related to analog personal copying machines, which use to be included in “Monochrome,”were reclassified as “Others,” from fiscal 2007.
Jan. 28, 2009 Canon Inc.
0
200
400
600
4Q07 4Q08 4Q08
OthersIJPLBP
0
500
1,000
1,500
2,000
FY07 FY08 FY08
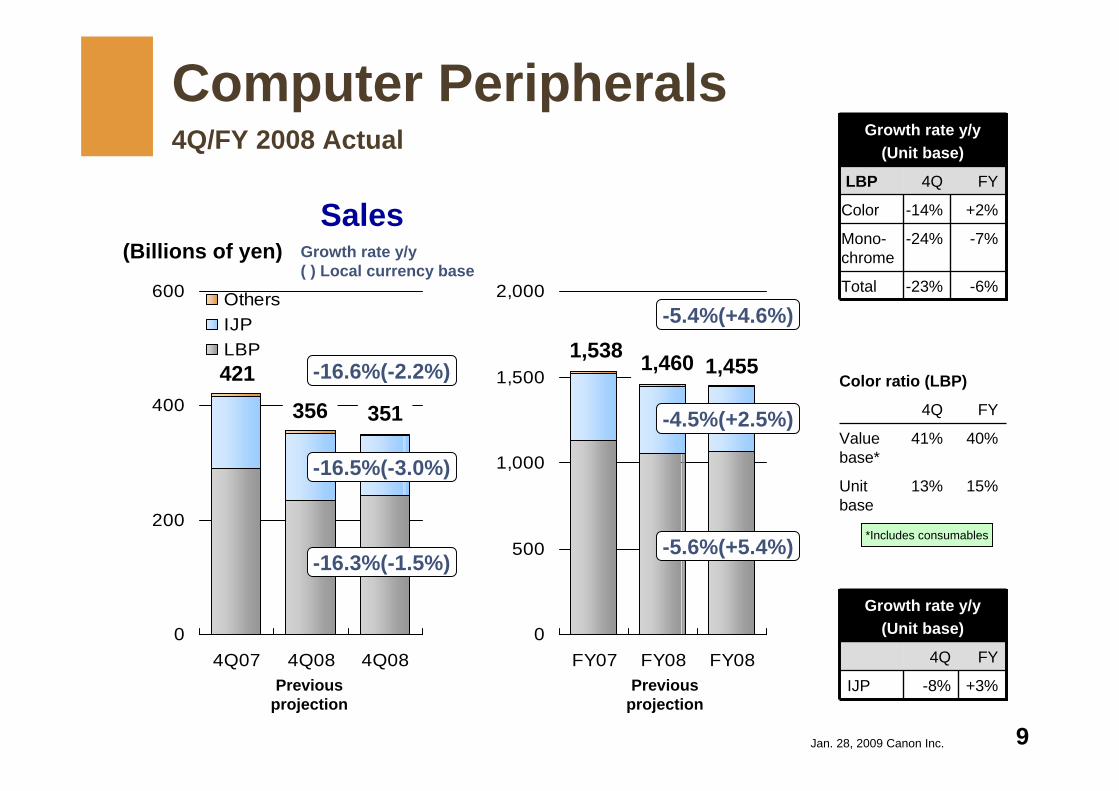
-16.5%(-3.0%)
-16.3%(-1.5%)
-16.6%(-2.2%)
-5.6%(+5.4%)
-4.5%(+2.5%)
-5.4%(+4.6%)1,538
421
351
FY4Q
-6%-23%Total
-7%-24%Mono-chrome
+2%-14%Color
LBP
Growth rate y/y(Unit base)
1,455
9
356
1,460
Computer Peripherals 4Q/FY 2008 Actual
Growth rate y/y( ) Local currency base
Sales(Billions of yen)
FY4Q
+3%-8%IJP
Growth rate y/y(Unit base)
FY4Q
15%13%Unit base
40%41%Value base*
Color ratio (LBP)
*Includes consumables
Previousprojection
Previousprojection

Jan. 28, 2009 Canon Inc.
307228 188
26.7%
18.0%
20.3% 22.5%
0
100
200
300
400
FY07 FY08 FY08
OP ratio
365 344263
0
100
200
300
400
500
4Q07 4Q08 4Q08
1,153 1,123 1,042
0
500
1,000
1,500
FY07 FY08 FY08
4Q FY
9370
30
25.5%
20.4%
11.5%
20.7%
0
50
100
150
4Q07 4Q08 4Q08
OP ratio
-9.6%(-1.0%)-28.0%(-14.3%)
-38.9%-67.7%
Cameras 4Q/FY 2008 Actual
(Billions of yen)(Billions of yen)
Previous projection
Previous projection
Previous projection
Previous projection
Growth rate y/y( ) Local currency base
Growth rate y/y
10= OP ratio in local currency basis
Sales
Op.Profit

Jan. 28, 2009 Canon Inc.
0
500
1,000
1,500
2,000
FY07 FY08 FY08
1,042
-4.8%(+4.0%)
-11.2%(-2.6%)
FY4Q
+4%-9%Digital cameras
Growth rate y/y(Unit base)
1,153
11
1,123
Cameras 4Q/FY 2008 Actual
FY4Q
44%45%Value base
15%15%Unit base
D SLR ratio*
* Percentage of digital cameras sales attributable to SLRs
Previousprojection
Previousprojection
0
200
400
600
4Q07 4Q08 4Q08
Video camerasDigital camerasInterchangeable lenses and others
-28.6%(-14.5%)
-25.1%(-13.4%)
365
263
-28.0%(-14.3%)
-28.3%(-14.0%)
344
Growth rate y/y( ) Local currency base
Sales(Billions of yen)
-4.2%(+4.4%)
-9.6%(-1.0%)
*From fiscal 2007, the segment previously named "Film cameras / Lenses“ was changed to "Interchangeable lenses and others."
Jan. 28, 2009 Canon Inc.
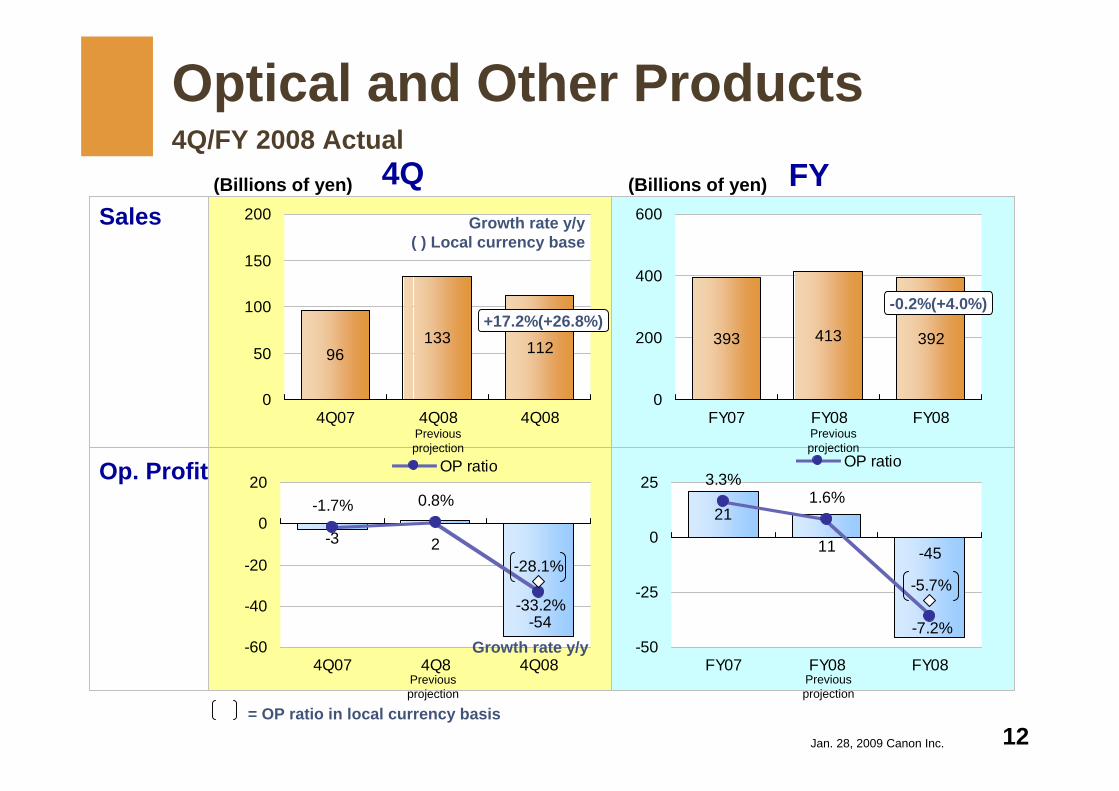
21
11 -45
3.3%
-7.2%
1.6%
-5.7%
-50
-25
0
25
FY07 FY08 FY08
OP ratio
96133 112
0
50
100
150
200
4Q07 4Q08 4Q08
393 413 392
0
200
400
600
FY07 FY08 FY08
4Q
-3 2
-54
-1.7% 0.8%
-33.2%
-28.1%
-60
-40
-20
0
20
4Q07 4Q8 4Q08
OP ratio
-0.2%(+4.0%)+17.2%(+26.8%)
Optical and Other Products 4Q/FY 2008 Actual
Sales
Op. Profit
FY(Billions of yen)(Billions of yen)
Previous projection
Previous projection
Previous projection
Previous projection
Growth rate y/y( ) Local currency base
Growth rate y/y
12= OP ratio in local currency basis
Jan. 28, 2009 Canon Inc.
0
200
400
600
FY07 FY08 FY08
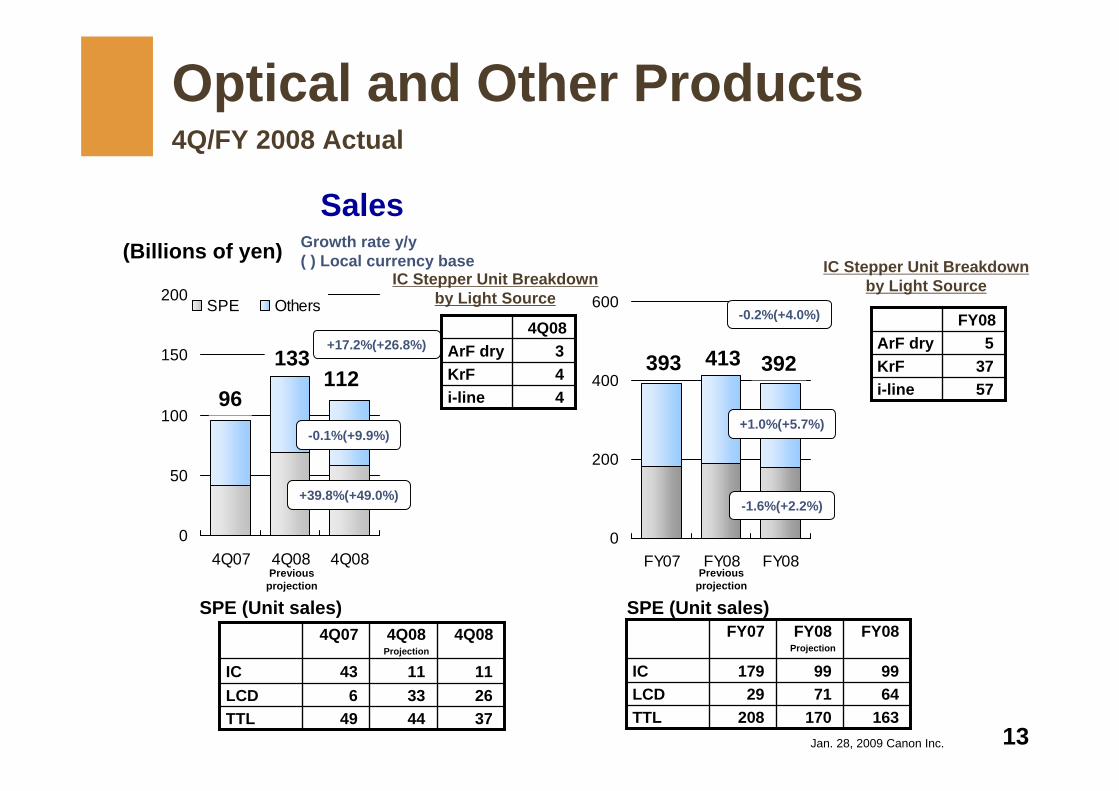
393
0
50
100
150
200
4Q07 4Q08 4Q08
SPE Others
443311
4Q08Projection
4Q084Q07
3749TTL266LCD1143IC
-0.2%(+4.0%)
+1.0%(+5.7%)
-1.6%(+2.2%)
112
-0.1%(+9.9%)
+39.8%(+49.0%)
4KrF
4Q08
4i-line
3ArF dry
FY08
57i-line37KrF5ArF dry
1707199
FY08Projection
FY08FY07
163208TTL6429LCD99179IC
392133
96
413
Optical and Other Products 4Q/FY 2008 Actual
Growth rate y/y( ) Local currency base
Sales(Billions of yen)
SPE (Unit sales) SPE (Unit sales)
Previousprojection
Previousprojection
IC Stepper Unit Breakdownby Light SourceIC Stepper Unit Breakdown
by Light Source
+17.2%(+26.8%)
13

Jan. 28, 2009 Canon Inc.
Operating profit
Impact of Exchange Rate Movement (FY09 impact given a one yen change)
151.46 yen
103.23 yen
FY08
120.00 yenYen-1EURO
9.1 billion yen16.5 billion yenUSD
5.0 billion yen
FY09Average Exchange Rate
90.00 yenYen-1USD
Net sales
6.9 billion yenEURO
AssumptionsFY 2009
14

Jan. 28, 2009 Canon Inc.
AssumptionsContinued weakness in global economy Strong yen against the U.S. dollar and euro
ProjectionsLower sales and profits, under a severe environmentTimely launch of better targeted new products Optimal control of inventory, capital expenditures, expenses, through enhanced ability to swiftly respond to changeBurst ahead of competition - Continued strategic investmentAccelerated cost reduction
Key PointsFY 2009
15
Jan. 28, 2009 Canon Inc.
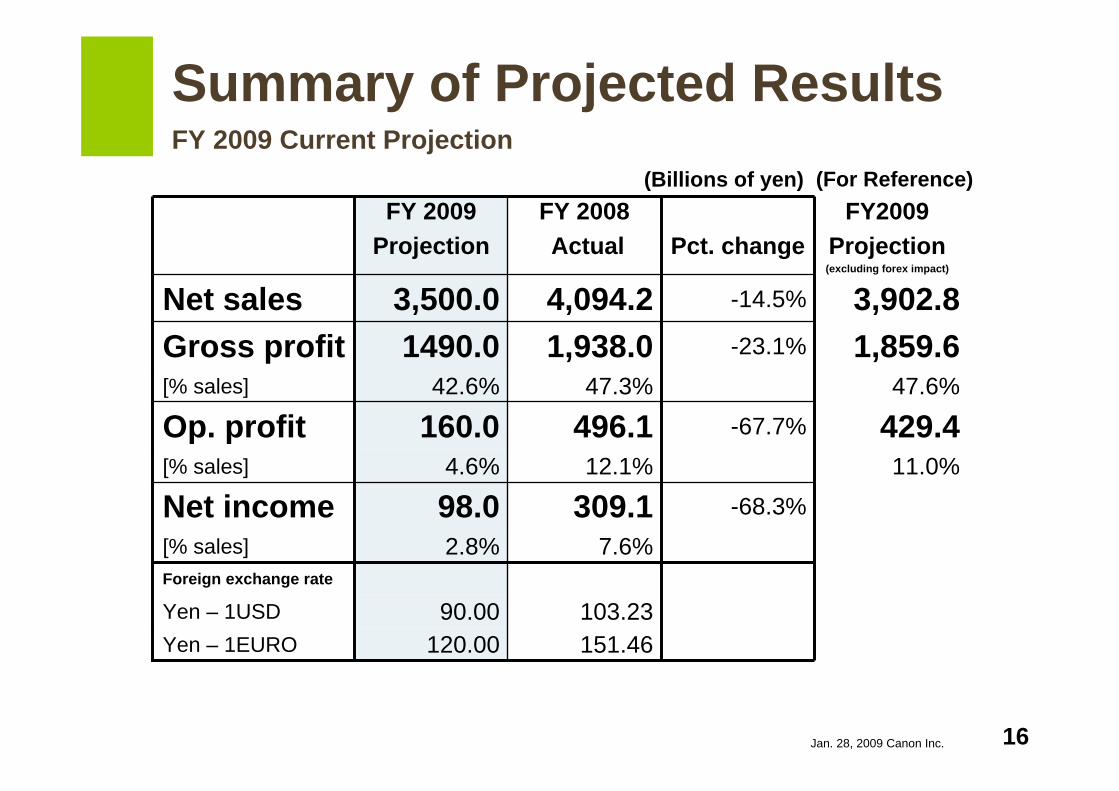
-68.3%
-67.7%
-23.1%
-14.5%
Pct. change
151.46120.00Yen – 1EURO103.2390.00Yen – 1USD
Foreign exchange rate
7.6%2.8%[% sales]
309.198.0Net income11.0%12.1%4.6%[% sales]
429.4496.1160.0Op. profit47.6%47.3%42.6%[% sales]
1,859.61,938.01490.0Gross profit3,902.84,094.23,500.0Net sales
FY2009Projection
(excluding forex impact)
FY 2008Actual
FY 2009Projection
(Billions of yen)
Summary of Projected Results FY 2009 Current Projection
(For Reference)
16
Jan. 28, 2009 Canon Inc.
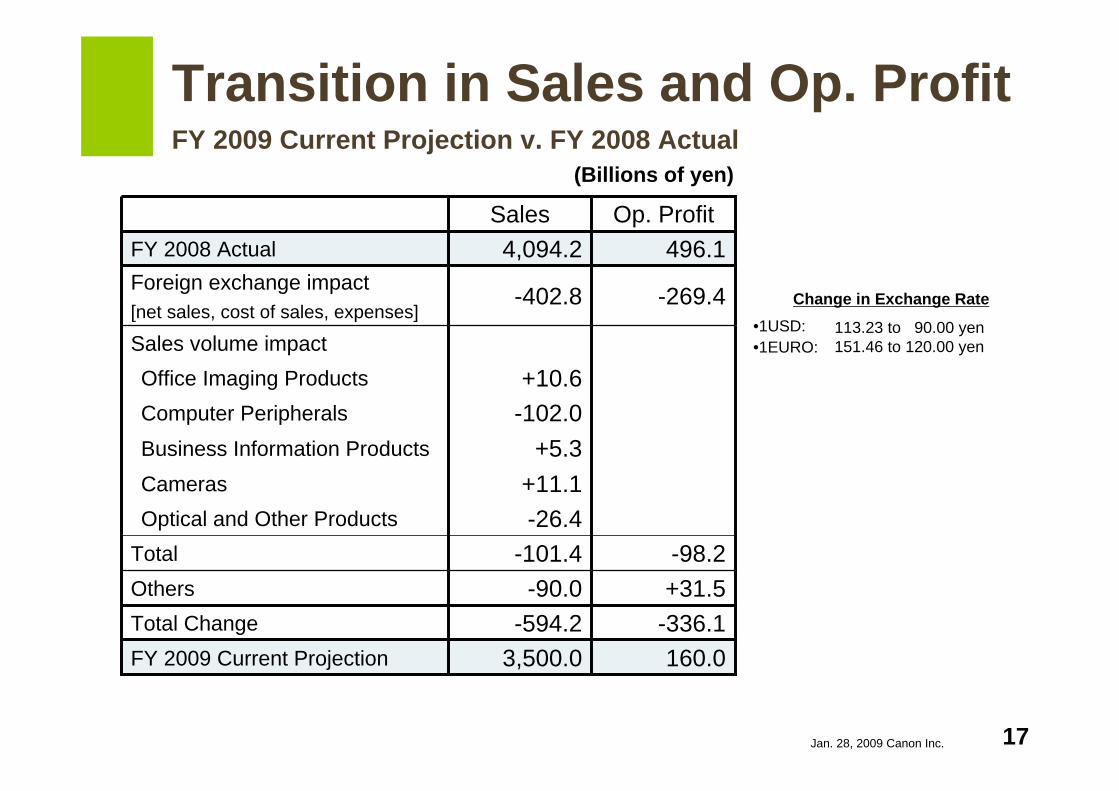
Transition in Sales and Op. ProfitFY 2009 Current Projection v. FY 2008 Actual
(Billions of yen)
+10.6Office Imaging Products
-102.0Computer Peripherals
+5.3Business Information Products
+11.1Cameras
160.03,500.0FY 2009 Current Projection-336.1-594.2Total Change+31.5-90.0Others-98.2-101.4Total
-26.4Optical and Other Products
Sales volume impact[net sales, cost of sales, expenses]
-269.4-402.8Foreign exchange impact496.14,094.2FY 2008 Actual
Op. ProfitSales
Change in Exchange Rate
113.23 to 90.00 yen151.46 to 120.00 yen
•1USD:•1EURO:
17
Jan. 28, 2009 Canon Inc.
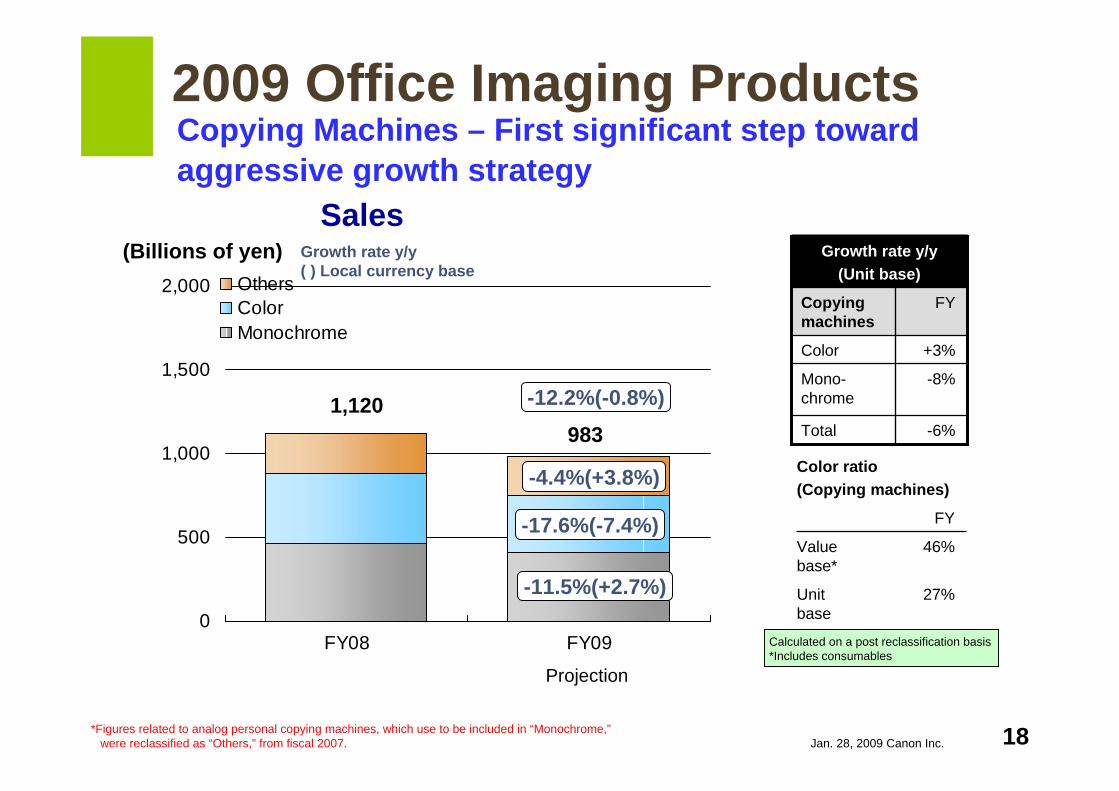
Copying Machines – First significant step toward aggressive growth strategy
0
500
1,000
1,500
2,000
FY08 FY09
OthersColorMonochrome
-4.4%(+3.8%)
-17.6%(-7.4%)
-11.5%(+2.7%)
-12.2%(-0.8%)
9831,120
2009 Office Imaging Products
Growth rate y/y( ) Local currency base
Sales(Billions of yen)
FY
27%Unit base
46%Value base*
Color ratio (Copying machines)
Calculated on a post reclassification basis *Includes consumables
Projection
FY
+3%Color
-8%Mono-chrome
-6%Total
Copying machines
Growth rate y/y(Unit base)
*Figures related to analog personal copying machines, which use to be included in “Monochrome,”were reclassified as “Others,” from fiscal 2007. 18
Jan. 28, 2009 Canon Inc.
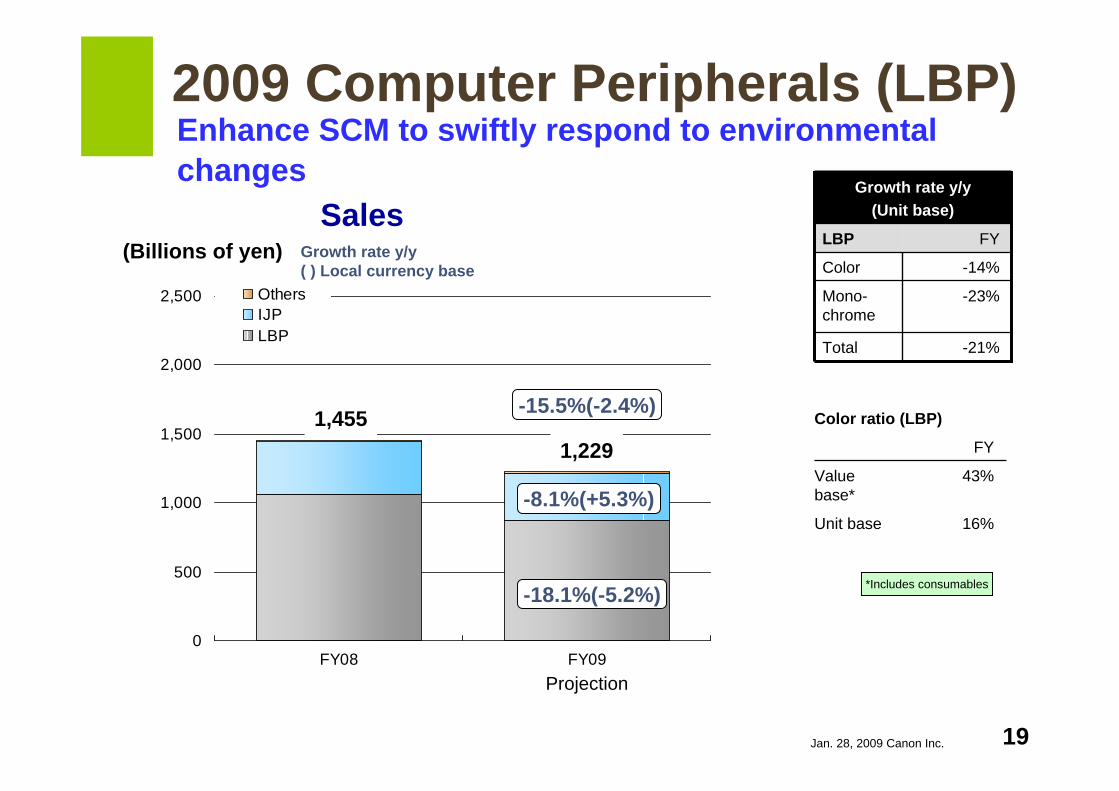
Enhance SCM to swiftly respond to environmental changes
0
500
1,000
1,500
2,000
2,500
FY08 FY09
OthersIJPLBP
-8.1%(+5.3%)
-18.1%(-5.2%)
-15.5%(-2.4%)
1,2291,455
2009 Computer Peripherals (LBP)
Growth rate y/y( ) Local currency base
Sales(Billions of yen) FY
-21%Total
-23%Mono-chrome
-14%Color
LBP
Growth rate y/y(Unit base)
*Includes consumables
FY
16%Unit base
43%Value base*
Color ratio (LBP)
Projection
19

Jan. 28, 2009 Canon Inc.
Further expansion of print volume
0
500
1,000
1,500
2,000
2,500
FY08 FY09
OthersIJPLBP
-8.1%(+5.3%)
-18.1%(-5.2%)
-15.5%(-2.4%)
1,2291,455
2009 Computer Peripherals (IJP)
Growth rate y/y( ) Local currency base
Sales(Billions of yen)
Projection
FY
0%IJP
Growth rate y/y(Unit base)
20
Jan. 28, 2009 Canon Inc.
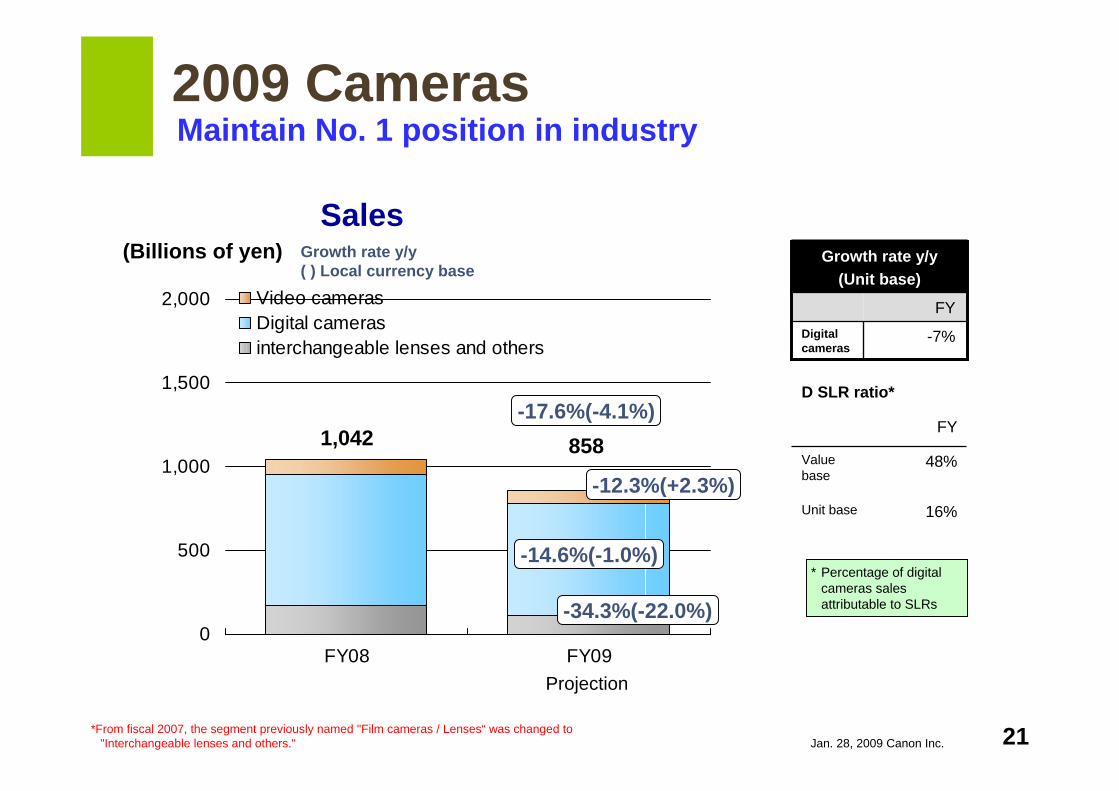
Maintain No. 1 position in industry
0
500
1,000
1,500
2,000
FY08 FY09
Video camerasDigital camerasinterchangeable lenses and others
-12.3%(+2.3%)
-14.6%(-1.0%)
-34.3%(-22.0%)
-17.6%(-4.1%)858
FY
-7%Digital cameras
Growth rate y/y(Unit base)
FY
48%Value base
16%Unit base
D SLR ratio*
1,042
Growth rate y/y( ) Local currency base
Sales(Billions of yen)
* Percentage of digital cameras sales attributable to SLRs
2009 Cameras
Projection
*From fiscal 2007, the segment previously named "Film cameras / Lenses“ was changed to "Interchangeable lenses and others." 21
Jan. 28, 2009 Canon Inc.
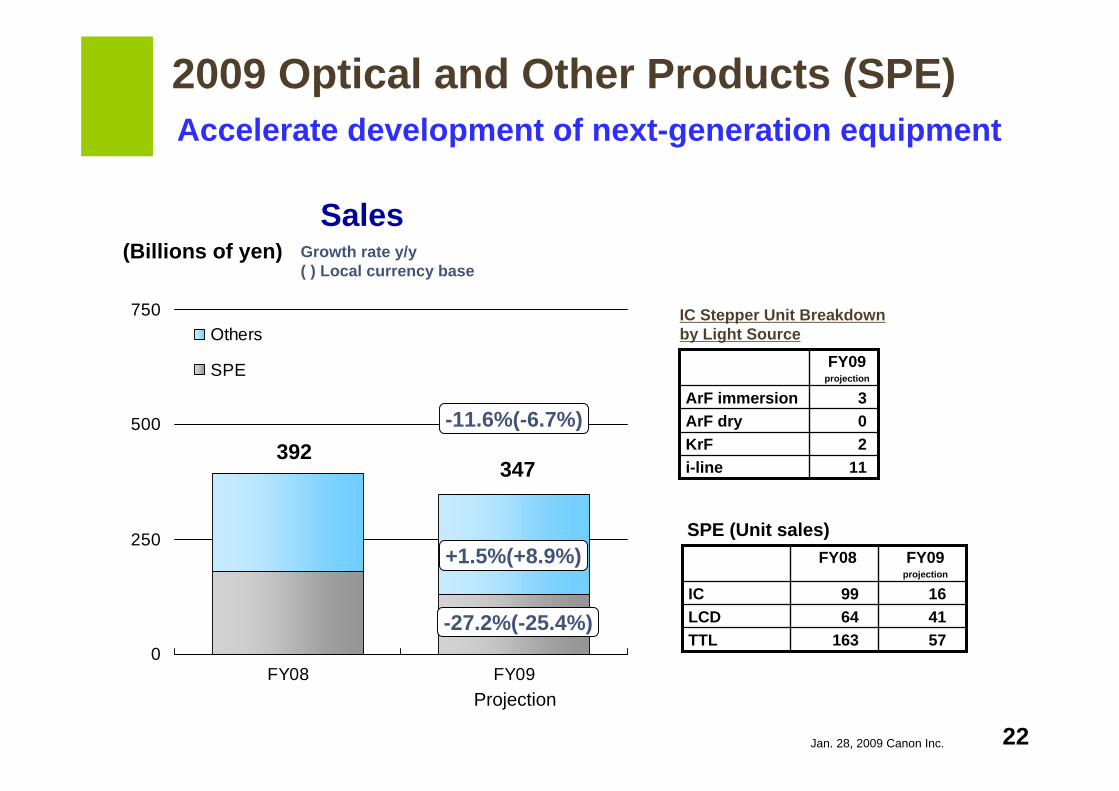
FY09projection
FY08
57163TTL4164LCD1699IC
0
250
500
750
FY08 FY09
Others
SPE
+1.5%(+8.9%)
-27.2%(-25.4%)
-11.6%(-6.7%)
347
0ArF dry
FY09projection
11i-line2KrF
3ArF immersion
392
Accelerate development of next-generation equipment
Growth rate y/y( ) Local currency base
Sales(Billions of yen)
IC Stepper Unit Breakdownby Light Source
SPE (Unit sales)
2009 Optical and Other Products (SPE)
Projection
22
Jan. 28, 2009 Canon Inc.
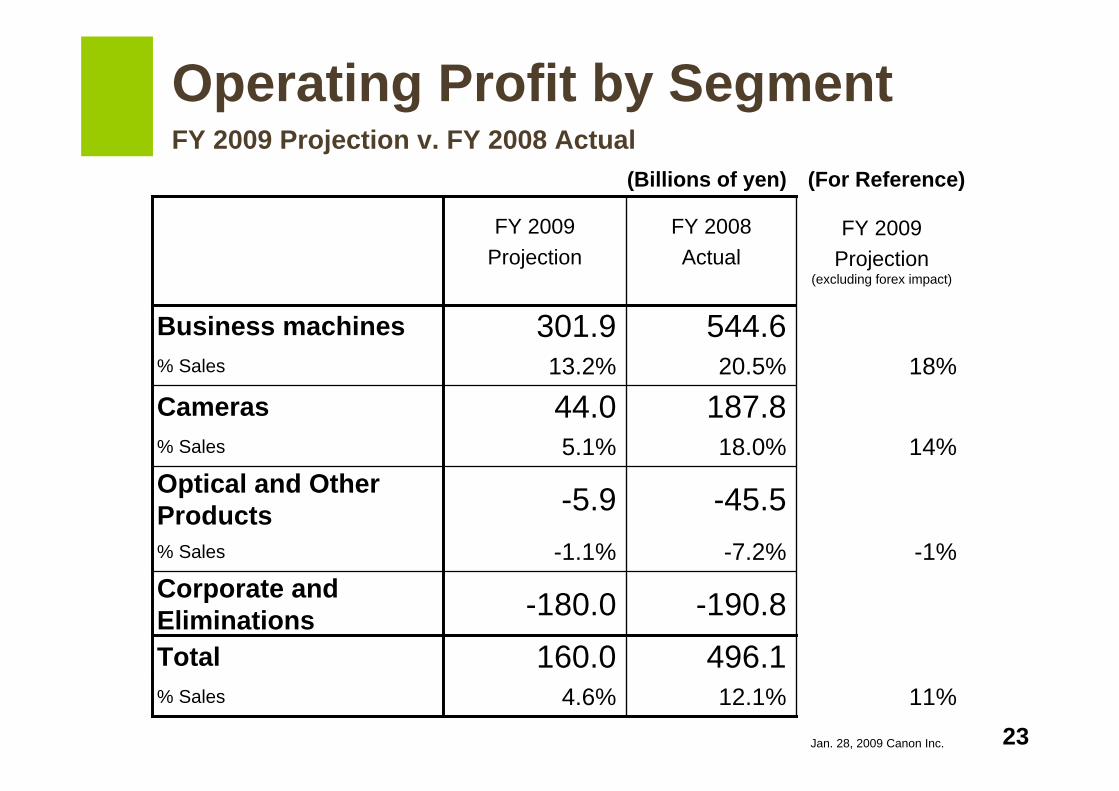
12.1%496.1
-190.8
-7.2%
-45.5
18.0%187.820.5%
544.6
FY 2008Actual
-180.0Corporate and Eliminations
Cameras
Optical and Other Products
% Sales 4.6%160.0
-1.1%
-5.9
5.1%44.013.2%
301.9
FY 2009Projection
Business machines
11%Total
-1%% Sales
14%% Sales
18%% Sales
FY 2009Projection
(excluding forex impact)
Operating Profit by SegmentFY 2009 Projection v. FY 2008 Actual
(Billions of yen) (For Reference)
23
Jan. 28, 2009 Canon Inc.
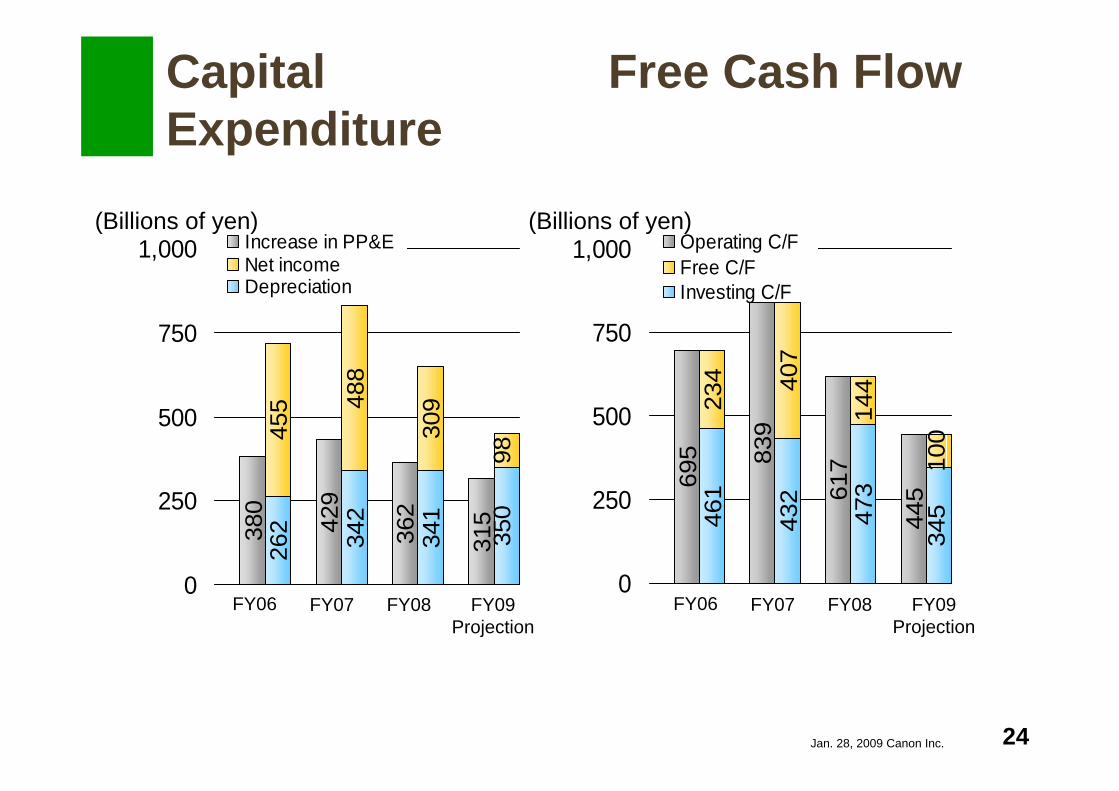
262 342
341
350
455 48
8
309
380
429
362
315
98
0
250
500
750
1,000 Increase in PP&ENet incomeDepreciation
461
432
473
345
234
144
100
695 83
9
617
445
407
0
250
500
750
1,000 Operating C/FFree C/FInvesting C/F
FY06 FY07 FY08 FY09Projection
Free Cash FlowCapitalExpenditure
(Billions of yen)(Billions of yen)
FY06 FY07 FY08 FY09Projection
24

Jan. 28, 2009 Canon Inc.
6783
11011023.1% 24.4%
44.4%
28.8%
FY05 FY06 FY07 FY08
Dividend per sharePayout ratio
(100)(125)
(165)
(Yen)1,005
1,156
944
679610
3.23.4
2.6
2.0 2.1
FYE05 FYE06 FYE07 FYE08 FYE09
Cash on handCash on hand
(165)*
Cash on Hand (Year-end) Dividend
Cash on Hand and Return to Shareholders
*Figures in parenthesis represent dividend per share expressed on a pre- 3-for-2 forward stocksplit basis (effective date July 1, 2006)
(Billions of yen)
Note: In 2007, 450 billion yen was used to acquire own share.In 2008, 100 billion yen.
(Consolidated basis)
Projection
(In months of full-year net sales)
Plan
25

Jan. 28, 2009 Canon Inc.
Supplementary Information
26
Jan. 28, 2009 Canon Inc.
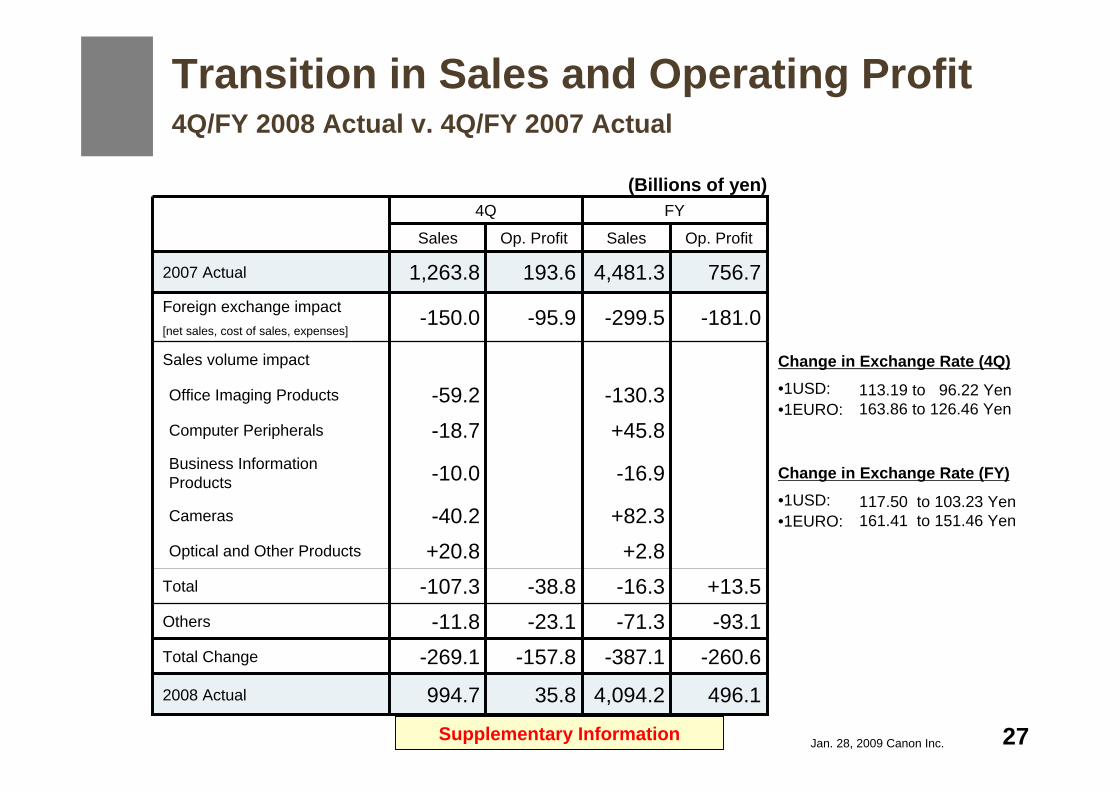
Transition in Sales and Operating Profit4Q/FY 2008 Actual v. 4Q/FY 2007 Actual
(Billions of yen)
35.8
-157.8-23.1-38.8
-95.9
193.6
Op. Profit
994.7
-269.1-11.8
-107.3+20.8-40.2
-10.0
-18.7-59.2
-150.0
1,263.8
Sales
4Q
-130.3Office Imaging Products
+45.8Computer Peripherals
-16.9Business Information Products
+82.3Cameras
496.14,094.22008 Actual
-260.6-387.1Total Change
-93.1-71.3Others
+13.5-16.3Total
+2.8Optical and Other Products
Sales volume impact
[net sales, cost of sales, expenses]-181.0-299.5Foreign exchange impact
756.74,481.32007 Actual
Op. ProfitSales
FY
Supplementary Information
Change in Exchange Rate (4Q)
113.19 to 96.22 Yen163.86 to 126.46 Yen
•1USD:•1EURO:
Change in Exchange Rate (FY)
117.50 to 103.23 Yen161.41 to 151.46 Yen
•1USD:•1EURO:
27
Jan. 28, 2009 Canon Inc.
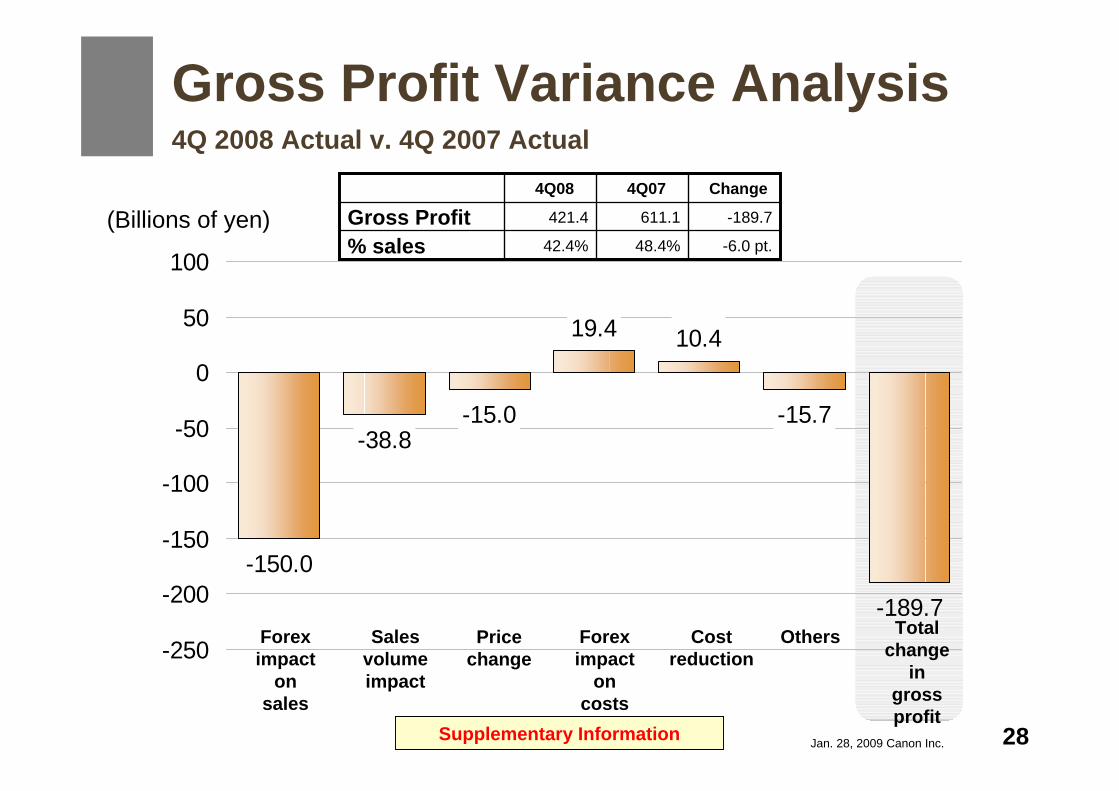
-150.0
-15.0
19.4 10.4
-15.7
-189.7
-38.8
-250
-200
-150
-100
-50
0
50
100
Gross Profit Variance Analysis 4Q 2008 Actual v. 4Q 2007 Actual
-6.0 pt.48.4%42.4%% sales-189.7611.1421.4Gross Profit
Change4Q074Q08
Forex impact
on sales
Sales volume impact
Price change
Forex impact
on costs
Cost reduction
Others Total change
in gross profit
(Billions of yen)
Supplementary Information 28
Jan. 28, 2009 Canon Inc.
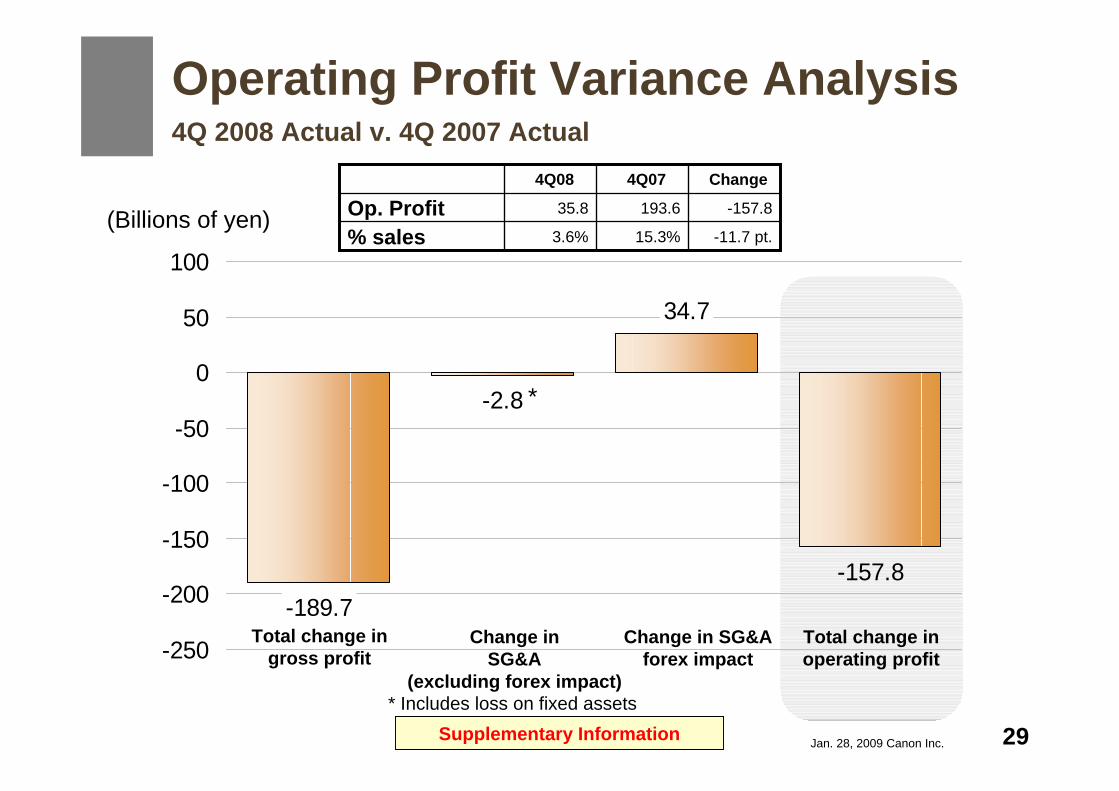
-189.7
34.7
-157.8
-2.8
-250
-200
-150
-100
-50
0
50
100
Operating Profit Variance Analysis4Q 2008 Actual v. 4Q 2007 Actual
-11.7 pt.15.3%3.6%% sales-157.8193.635.8Op. Profit
Change4Q074Q08
Total change in gross profit
Change inSG&A
(excluding forex impact)
Change in SG&A forex impact
Total change in operating profit
Supplementary Information
(Billions of yen)
*
* Includes loss on fixed assets
29
Jan. 28, 2009 Canon Inc.
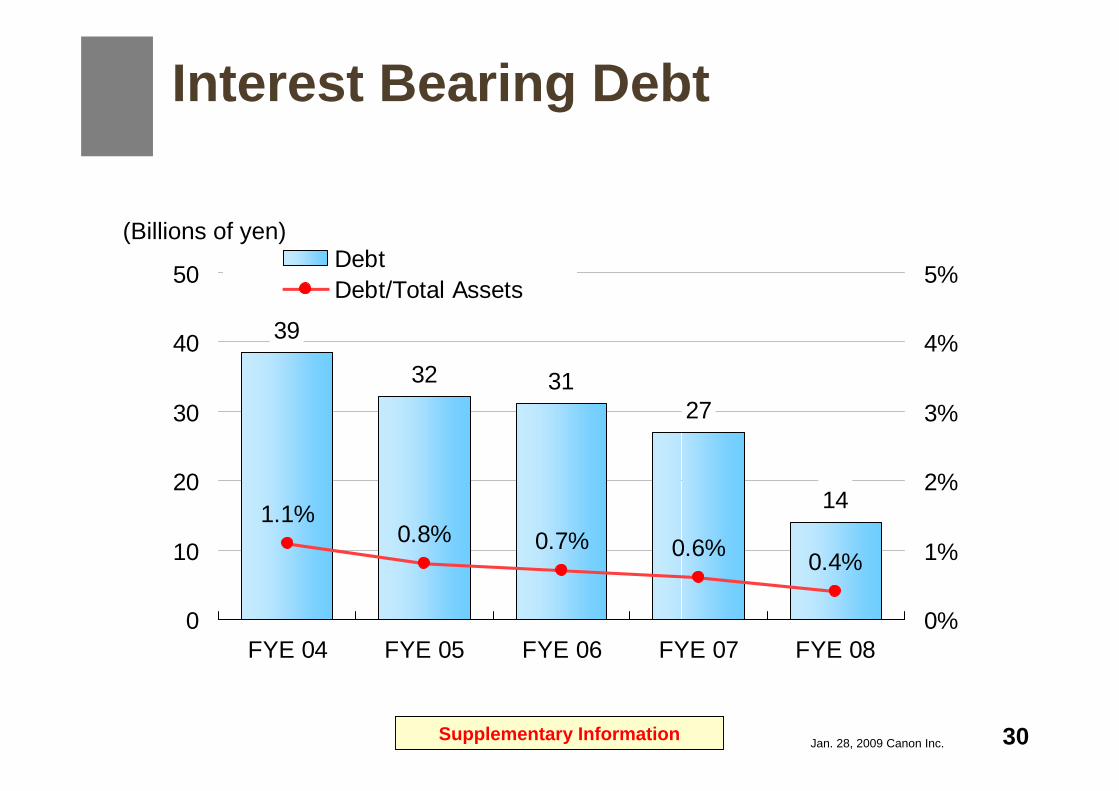
Interest Bearing Debt
39
32 3127
141.1%0.8% 0.7% 0.6% 0.4%
0
10
20
30
40
50
FYE 04 FYE 05 FYE 06 FYE 07 FYE 080%
1%
2%
3%
4%
5%DebtDebt/Total Assets
(Billions of yen)
Supplementary Information 30
Jan. 28, 2009 Canon Inc.
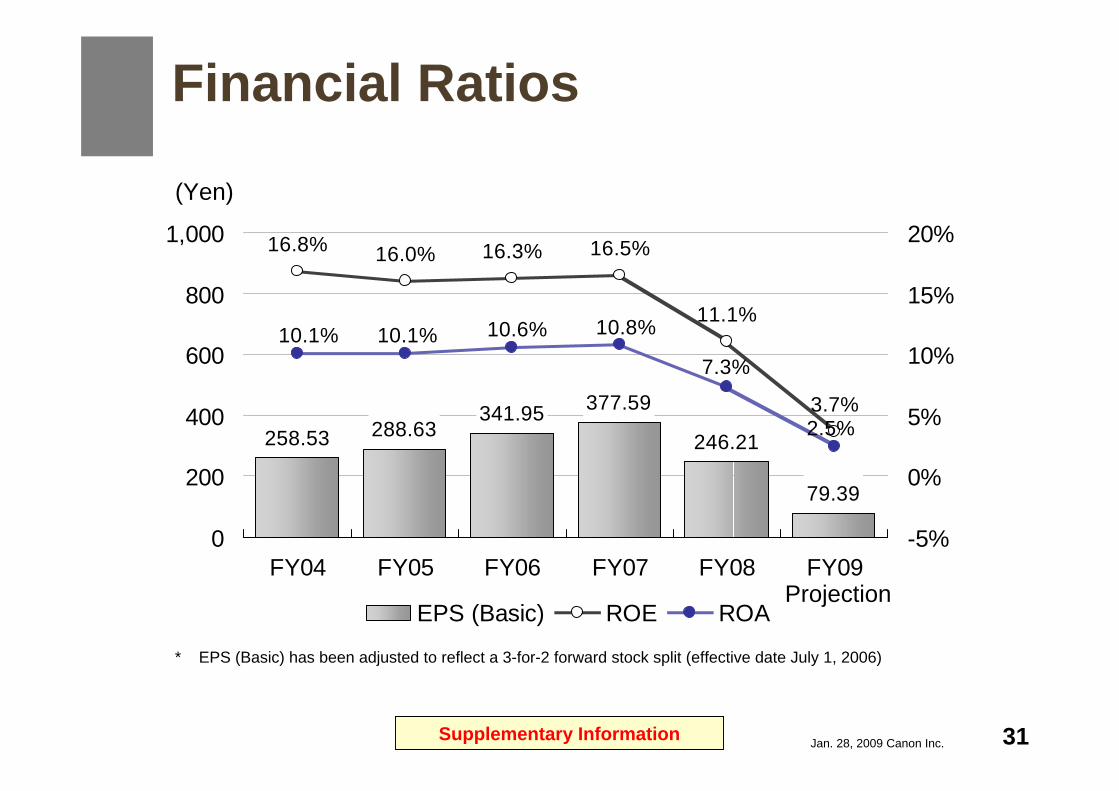
79.39
377.59341.95246.21258.53 288.63
16.8% 16.0% 16.3% 16.5%
11.1%
3.7%2.5%
7.3%
10.8%10.6%10.1% 10.1%
0
200
400
600
800
1,000
FY04 FY05 FY06 FY07 FY08 FY09-5%
0%
5%
10%
15%
20%
EPS (Basic) ROE ROA
Financial Ratios
Projection
EPS (Basic) has been adjusted to reflect a 3-for-2 forward stock split (effective date July 1, 2006)*
Supplementary Information
(Yen)
31