Embed Size (px)
Citation preview

CANON ANNUAL REPORT 2017Fiscal Year Ended December 31, 2017
CA
NO
N A
NN
UA
L RE
PO
RT
20
17

Strategy 1 Financial Highlights
2 To Our Shareholders
9 Growth Strategy
Business Segment/Corporate Structure
18 At a Glance
20 Research & Development
22 Production
24 Sales & Marketing
26 ESG
Financial Section 34 Financial Overview
48 Ten-Year Financial Summary
50 Consolidated Balance Sheets
51 Consolidated Statements of Income
51 Consolidated Statements of Comprehensive Income
52 Consolidated Statements of Equity
53 Consolidated Statements of Cash Flows
54 Notes to Consolidated Financial Statements
86 Schedule II Valuation and Qualifying Accounts
87 Management’s Report on Internal Control Over Financial Reporting
88 Reports of Independent Registered Public Accounting Firm
Corporate Data 90 Transfer and Registrar’s Office
90 Shareholder Information
91 Major Consolidated Subsidiaries
Cover Photo:
Axis network cameras installedat Malmö station in Sweden
Network cameras that can monitor a wide area through their advanced zooming func-tion, watching over people’s safety.
TABLE OF CONTENTS

4,000Net Sales (Billions of yen)
3,000
2,000
1,000
0
300Net Income Attributable to Canon Inc. (Billions of yen)
200
100
0
300
Net Income Attributable to Canon Inc. Shareholders per Share (Yen)
200
100
0
10ROE/ROA (%)
8
6
4
2
0
Basic Diluted ROE ROA
2013 2014 2015 2016 2017 2013 2014 2015 2016 2017
2013 2014 2015 2016 2017 2013 2014 2015 2016 2017
Notes: 1. Canon’s consolidated financial statements are prepared in accordance with U.S. generally accepted accounting principles. 2. U.S. dollar amounts are translated from yen at the rate of JPY113=U.S.$1, the approximate exchange rate on the Tokyo Foreign Exchange Market as of December
29, 2017, solely for the convenience of the reader.
Millions of yen(except per share amounts)
Thousands of U.S. dollars(except per share amounts)
2017 2016 Change (%) 2017
Net sales ¥ 4,080,015 ¥ 3,401,487 +19.9 $ 36,106,327
Operating profit 331,479 228,866 +44.8 2,933,442
Income before income taxes 353,884 244,651 +44.6 3,131,717
Net income attributable to Canon Inc. 241,923 150,650 +60.6 2,140,912
Net income attributable to Canon Inc. shareholders per share:
—Basic ¥ 222.88 ¥ 137.95 +61.6 $ 1.97
—Diluted 222.88 137.95 +61.6 1.97
Total assets ¥5,198,291 ¥5,138,529 +1.2 $ 46,002,575
Canon Inc. shareholders’ equity ¥ 2,870,630 ¥ 2,783,129 +3.1 $ 25,403,805
CANON ANNUAL REPORT 2017 1
F INANCIAL HIGHLIGHTS

FUJIO MITARAIChairman & CEOCanon Inc.
CANON ANNUAL REPORT 20172
TO OUR SHAREHOLDERS
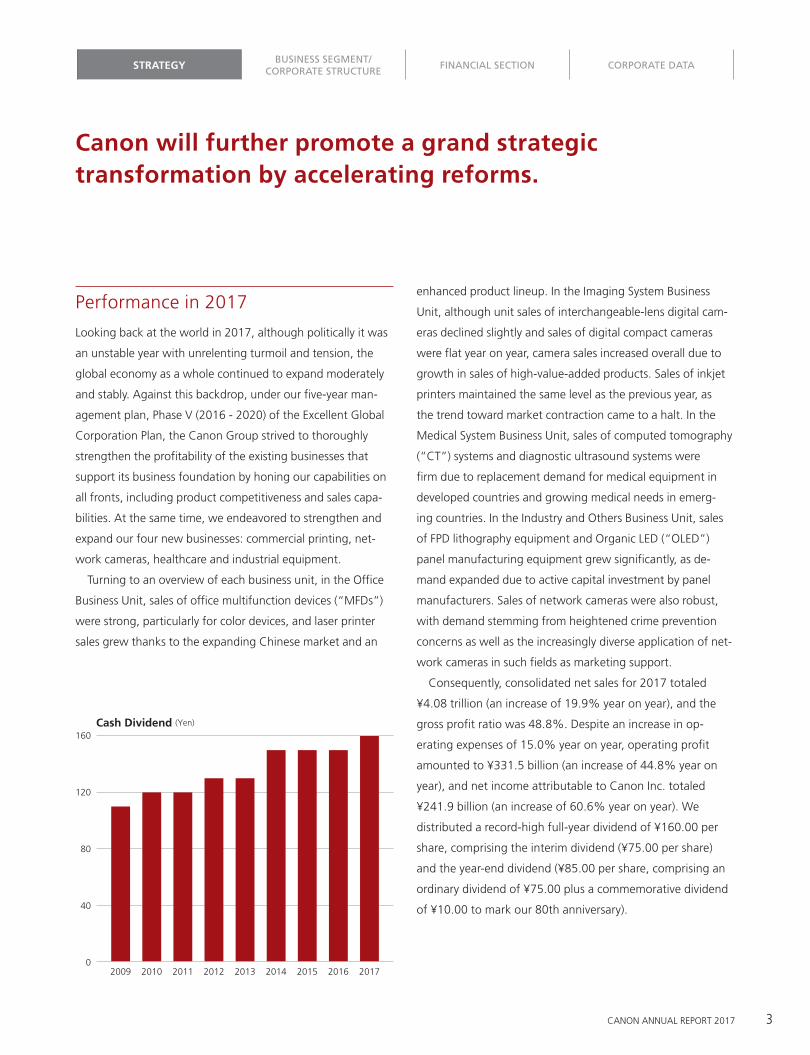
Canon will further promote a grand strategic transformation by accelerating reforms.
Looking back at the world in 2017, although politically it was
an unstable year with unrelenting turmoil and tension, the
global economy as a whole continued to expand moderately
and stably. Against this backdrop, under our five-year man-
agement plan, Phase V (2016 - 2020) of the Excellent Global
Corporation Plan, the Canon Group strived to thoroughly
strengthen the profitability of the existing businesses that
support its business foundation by honing our capabilities on
all fronts, including product competitiveness and sales capa-
bilities. At the same time, we endeavored to strengthen and
expand our four new businesses: commercial printing, net-
work cameras, healthcare and industrial equipment.
Turning to an overview of each business unit, in the Office
Business Unit, sales of office multifunction devices (“MFDs”)
were strong, particularly for color devices, and laser printer
sales grew thanks to the expanding Chinese market and an
enhanced product lineup. In the Imaging System Business
Unit, although unit sales of interchangeable-lens digital cam-
eras declined slightly and sales of digital compact cameras
were flat year on year, camera sales increased overall due to
growth in sales of high-value-added products. Sales of inkjet
printers maintained the same level as the previous year, as
the trend toward market contraction came to a halt. In the
Medical System Business Unit, sales of computed tomography
(“CT”) systems and diagnostic ultrasound systems were
firm due to replacement demand for medical equipment in
developed countries and growing medical needs in emerg-
ing countries. In the Industry and Others Business Unit, sales
of FPD lithography equipment and Organic LED (“OLED”)
panel manufacturing equipment grew significantly, as de-
mand expanded due to active capital investment by panel
manufacturers. Sales of network cameras were also robust,
with demand stemming from heightened crime prevention
concerns as well as the increasingly diverse application of net-
work cameras in such fields as marketing support.
Consequently, consolidated net sales for 2017 totaled
¥4.08 trillion (an increase of 19.9% year on year), and the
gross profit ratio was 48.8%. Despite an increase in op-
erating expenses of 15.0% year on year, operating profit
amounted to ¥331.5 billion (an increase of 44.8% year on
year), and net income attributable to Canon Inc. totaled
¥241.9 billion (an increase of 60.6% year on year). We
distributed a record-high full-year dividend of ¥160.00 per
share, comprising the interim dividend (¥75.00 per share)
and the year-end dividend (¥85.00 per share, comprising an
ordinary dividend of ¥75.00 plus a commemorative dividend
of ¥10.00 to mark our 80th anniversary).
Performance in 2017
Cash Dividend (Yen)
160
80
120
40
020102009 2011 2012 201720162013 2014 2015
CANON ANNUAL REPORT 2017 3
STRATEGYBUSINESS SEGMENT/
CORPORATE STRUCTUREFINANCIAL SECTION CORPORATE DATA

Canon launched the Excellent Global Corporation Plan in
1996, and has strengthened its management base through
each of the plan’s five-year initiatives, from Phase I to Phase IV.
During Phase I, we stressed thorough cash-flow manage-
ment and significantly boosted productivity through the
introduction of our cell production system, along with other
measures. In Phase II, we stepped up efforts to digitalize our
copying machines and camera offerings, while building the
foundation for a robust financial structure. During Phase III,
we actively carried out M&A activities, and welcomed Océ to
the Group in 2010, clearing the way for a move into the com-
mercial printing market, which has shown growth potential.
As the markets for our core businesses—such as cameras
and office equipment—were maturing, during Phase IV,
which began in 2011, we promoted diversification via the
lateral expansion of our existing businesses—such as the
Cinema EOS System and commercial photo printers—while
also accelerating our M&A strategy. In this manner, we set
a clear direction for shifting our focus for growth from B2C
to B2B. We subsequently reinforced and expanded our rap-
idly growing network camera business by making Milestone
Systems (“Milestone”) a subsidiary in 2014, followed by
Axis Communications (“Axis”) in 2015. Additionally, Canon
Nanotechnologies, formerly Molecular Imprints, became a
subsidiary in 2014, and we are accelerating the development
of next-generation semiconductor manufacturing equipment
that uses nanoimprint lithography, which will make it possible
to achieve both miniaturization and cost reductions for semi-
conductor devices.
As a manufacturer, Canon strives unceasingly to achieve
production reforms and thorough cost reductions. At the
same time, we stay on top of opportunities to add excellent
companies to the Group, in order to shift our focus towards
changing growth markets, with the aim of unlocking new
growth potential.
To strengthen its financial structure, Canon trans-formed its mindset to a focus on total optimiza-tion and profitability. The Company introduced vari-ous business innovations, including the selection and consolidation of business areas, and reform activities in such areas as production and development.
Aiming to become No. 1 in all major business areas, Canon focused on strengthening product competitiveness along with the changing times, stepping up efforts to digitalize its products. The Company also conducted structural reforms across all Canon Group compa-nies around the world.
Canon moved ahead with such growth strategies as enhancing existing businesses and expanding into new areas while also thoroughly implementing supply chain management and IT reforms.
Responding to weakness in the global economy, Canon revised its management policy from a strategy targeting expansion of scale to a strategy aimed at further strengthening its financial structure. While actively pursuing M&A activities, the Company restructured its business at a founda-tional level to introduce new growth engines for future expansion.
Phase I1996–2000
Phase II2001–2005
Phase III2006–2010
Phase IV2011–2015
Phase V2016–2020
Excellent Global Corporation Plan
From Phase I to Phase IV (1996-2015)
CANON ANNUAL REPORT 20174

The year 2016 marked the start of Phase V, our latest five-year
initiative within the Excellent Global Corporation Plan. Under
the basic policy of “Embracing the challenge of new growth
through a grand strategic transformation,” we aim to achieve
net sales of ¥5 trillion, a cost-of-sales ratio of 45% or less,
an operating profit ratio of 15% or more, a net income ratio
of 10% or more, and a shareholders’ equity ratio of 70% or
more (based on exchange rates of US$1 = ¥125 and €1 = ¥135)
in 2020, the final year of Phase V.
In 2017, the year in which Canon marked the 80th anni-
versary of its founding, we worked to thoroughly bolster the
profitability of existing businesses, while strengthening and
expanding our four new businesses: commercial printing, net-
work cameras, healthcare and industrial equipment.
Explanations regarding the progress of the key strategies of
Phase V, as well as our future course of action, are presented
as follows.
Establish a new production system to achieve a
cost-of-sales ratio of 45%
Reinforce and expand new businesses while
creating future businesses
Restructure the global sales network in
accordance with market changes
Enhance R&D capabilities through open
innovation
Complete the Three Regional Headquarters
management system capturing world dynamism
1
2
3
4
5
Phase V (2016-2020)
Canon’s foundation is made up of our existing businesses,
and we must continue to reinforce these businesses within
their maturing markets. We are taking a two-pronged ap-
proach to achieve this: developing and expanding the market
shares of “Dantotsu Products” and thoroughly reducing
manufacturing costs.
“Dantotsu Products” refers to products with extraordinary
features that cannot be imitated by other companies. In order
to strengthen our product capabilities, Canon will move for-
ward with development by steadily evolving the technologies
we possess, while accelerating the shift from B2C to B2B in all
areas from development to design, procurement, manufactur-
ing, quality management, logistics, sales and services.
We are engaged in efforts to reduce manufacturing costs in
all processes, including development, design and procurement.
We are actively promoting such measures as the utilization of
cutting-edge production and manufacturing technologies—
including automation and robotics—in-house production,
sharing knowhow between businesses and across the Group,
and strengthening collaboration with external entities.
Establish a new production system to achieve a cost-of-sales ratio of 45%
Strategy 1
We are enhancing productivity via automated toner cartridge production.
Key Strategies
CANON ANNUAL REPORT 2017 5
STRATEGYBUSINESS SEGMENT/
CORPORATE STRUCTUREFINANCIAL SECTION CORPORATE DATA

With the aim of reinforcing and expanding our four new
businesses where greater growth is expected—commercial
printing, network cameras, healthcare and industrial equip-
ment, Canon has steadily achieved results by leveraging
synergies between Group companies. In commercial printing,
we are raising our presence by combining the technologies
of Canon and Océ. In network cameras, we are collaborating
with Milestone and Axis to accelerate product development.
We are expanding the breadth of solutions we offer by refin-
ing our image-analysis technologies in addition to camera
performance. In healthcare, we are pursuing further growth
by combining the technologies possessed by Canon with
those of Canon Medical Systems (“Canon Medical”), which
changed its company name from Toshiba Medical Systems
(“TMSC”) as of January 4, 2018. In industrial equipment, we
are striving to achieve thorough cost reductions while estab-
lishing an innovative manufacturing approach with regard
to the manufacturing equipment handled by Canon Tokki,
Canon ANELVA and Canon Machinery.
CEO Fujio Mitarai (middle) listening to the explanation from Canon Medical President Toshio Takiguchi (left) on the Ultra High-Resolution CT “Aquilion PrecisionTM” introduced at the International Technical Exhibition of Medical Imaging 2017 (Japan).
In order to adapt to our strengthening B2B shift, we are rein-
forcing our organization to ascertain customer needs from an
early stage and present optimal solutions by coordinating the
entire process from R&D to production, sales and logistics. As
part of such efforts, we are training highly-skilled sales engi-
neers who possess in-depth knowledge of both hardware and
software and can provide effective consulting.
We are also focusing on responding to the rapidly expand-
ing e-commerce market. In China, where growth has been
especially rapid, we are steadily increasing the e-commerce
ratio of Canon China’s consumer-oriented business. At Canon
U.S.A., we are concentrating on providing limited-edition and
customized products and strengthening services and support
in order to significantly increase e-commerce sales.
Canon is focusing on e-commerce sites where customers can purchase products online anywhere at any time.
Strategy 2 Strategy 3
Reinforce and expand new businesses while creating future businesses
Restructure the global sales network in accordance with market changes
CANON ANNUAL REPORT 20176

With R&D representing a rising share of expenses in recent
years, Canon will promote the selection and concentration of
research themes and carry out more efficient R&D investment.
In preparation for the coming age of the Internet of Things
(“IoT”), we are pursuing open innovation that utilizes external
expertise and technology as necessary to accelerate the pace
of development. For example, Canon is a partner in a basic
research consortium organized by IBM in which we are col-
laborating on cutting-edge technology programs in such areas
as artificial intelligence (“AI”), big data and sensing. Canon
researchers are dispatched to R&D centers in order to acceler-
ate the creation of practical applications. We are also engaged
in joint development programs for photoacoustic tomogra-
phy in cooperation with Kyoto University and Keio University
and we are continuing to pursue collaboration with industry,
government and academic partners in order to accelerate
technological innovation.
Furthermore, as software becomes increasingly important in
bringing out the full potential of a product and for providing
various services, we are training highly-skilled software engi-
neers with a focus on trends in AI and IoT technologies.
Canon engages in medical research collaboration with Harvard-affiliated medical institutions (Healthcare Optics Research Lab, Canon U.S.A., United States)
With global headquarters in Japan, the United States and
Europe, Canon aims to establish a system that promotes
global development through diversification by leveraging the
unique features of each region.
Canon U.S.A.’s Healthcare Optics Research Laboratory is
collaborating with Massachusetts General Hospital (“MGH”)
and Brigham and Women’s Hospital (“BWH”), both teaching
affiliates of Harvard Medical School, on the development of
an ultra-miniature endoscope that can make possible direct
examination and diagnosis in anatomies that have previously
been inaccessible, as well as a guided needle insertion system
that assists with the insertion of needles in patients by guiding
a needle to a precise position and depth.
In Europe, our collaboration with Océ has enabled us to ex-
pand the scope of our commercial printing business to cover
a variety of fields. Furthermore, many new synergies are being
created as Canon and Océ integrate our sales networks and
provide various products and services.
R&D on high-speed cut-sheet inkjet printers (Océ, Netherlands)
Strategy 4 Strategy 5
Enhance R&D capabilities through open innovation
Complete the Three Regional Headquarters management system capturing world dynamism
CANON ANNUAL REPORT 2017 7
STRATEGYBUSINESS SEGMENT/
CORPORATE STRUCTUREFINANCIAL SECTION CORPORATE DATA

Since launching Phase I of the Excellent Global Corporation
Plan in 1996, Canon has built a strong financial founda-
tion and successfully weathered the 2008 financial crisis
and numerous other difficulties, including exchange rate
fluctuations, guided by our commitment to pursuing total
optimization and profitability. Today, we are in the midst of a
digital revolution in which the dramatic development of IT has
ushered in the age of IoT, known as the fourth industrial revo-
lution. We are now confronted with the question of how to
respond to this profound transformation of society.
The global economy in 2018 is generally expected to con-
tinue a trend toward gradual recovery. In that environment,
we will return to a policy of total optimization and profit-
ability to take Canon to the next level as an excellent global
corporation.
We look forward to your continued understanding
and support.
Our basic policy for 2018 is to “Pursue total optimization and
profitability to complete our grand strategic transformation,”
as we work on the following six key challenges.
The first of these is to strengthen our research capabilities in
the world’s leading-edge technologies. We aim to strengthen
our investigation and analysis abilities to accurately grasp
global trends that contribute to our strategic initiatives.
The second is to strengthen our product development
capability. We will accelerate the selection and concentration
of research themes as well as the pursuit of open innovation.
In addition to implementing prototype-less design, product
design optimized for robotic assembly and standardized
product platforms, we will also strengthen our software
development capability.
The third challenge is to comprehensively reinforce our
manufacturing abilities. In addition to building a glob-
ally optimized manufacturing system, we will promote our
mother plant concept that integrates development, produc-
tion technology and manufacturing. We will also thoroughly
implement cost reduction measures, including for new busi-
nesses, through strengthening in-house production of key
components, generic parts and production equipment.
The fourth is to thoroughly strengthen our strategic pro-
curement functions. In addition to accelerating a global
procurement network, we will promote component sharing,
adoption of generic parts and in-house production.
The fifth is to reform our sales organization to reflect mar-
ket changes. We will enhance the capabilities of our global
sales engineers, bolster local service support systems and opti-
mize such sales channels as e-commerce.
Our sixth challenge is to establish human resource policies
that evolve with changing times. We aim to create a person-
nel system and human resources training system that will
open up diverse career paths.
In Conclusion Key Challenges for 2018
Fujio Mitarai Chairman & CEO
Canon Inc.
CANON ANNUAL REPORT 20178

G R O W T HS T R AT E G Y
CANON ANNUAL REPORT 2017 9

The Océ VarioPrint i300 sheet-fed inkjet color press, which is a high-speed commercial printer, uses Océ’s unique paper transport technology to achieve stable, high-speed output. Océ’s proven technologies enable printing on a range of media, including coated paper, to meet diverse needs in commercial printing. (Customer Experience Center Venlo, Netherlands)
CANON ANNUAL REPORT 201710
COMMERCIAL PRINTING

Aiming to become the world’s No. 1 printing company in a commercial printing market that is becoming increasingly digitized.
The commercial printing market, encompassing newspapers,
magazines and books, promotional catalogs and flyers, and
transaction printing such as statements and invoices, has
long been dominated by offset printing, which offers superb
quality, low cost, and high speed printing of large-volume
publications. However, the field of digital printing, which can
print straight from data without the use of plates, has contin-
ued to expand since the 1990s. In particular, in recent years
the diversification and segmentation of commercial printing
needs, including production of a broader range of applica-
tions requiring shorter turnaround times, has propelled the
shift to digital printing.
Digital printing needs are also growing in the industrial
printing market, including printing on non-paper materials
such as ceramic, glass, and plastic, as well as 3D printing,
which involves applying hundreds of layers of ink.
Canon made a full-fledged entry into the commercial print-
ing market in 2006, based on the core technologies it had
accumulated in printer development since the development
of the copy machine in the 1960s. In 2010, we welcomed the
Dutch company, Océ into the Canon Group. Océ is a printer
manufacturer with a history spanning 140 years. Its high-
productivity printers are highly regarded for black-and-white
printing jobs in the fields of invoices, direct mail, and pub-
lishing. Océ’s high-speed continuous-feed printers make it a
strong contender in the European and U.S. markets.
Currently, we are generating new synergies for growth,
including the introduction of Océ’s print controller into
Canon’s printing systems. In February 2017, Océ announced
the continuous feed printer, Océ ProStream 1000, aiming
for the growing graphic arts market, where items such as
catalogs demand high image quality. This digital system has
attracted attention for providing the same high level of image
quality and productivity as in offset printing. In April 2017,
Canon opened the Customer Experience Center Tokyo at our
Shimomaruko headquarters. This center, which is the fourth
large facility worldwide for equipment demonstrations and
inspections, allows commercial printing businesses to experi-
ence Canon’s leading digital printing solutions.
With a wide-ranging product lineup, Canon has been lay-
ing the groundwork to become the world’s No. 1 printing
company since its entry into the commercial printing market.
We will continue seeking business growth by further pursu-
ing new possibilities in the digital printing market, which
is expected to encompass various fields, including package
printing and industrial printing, which involves printing on
non-paper materials.
The shift in demand towards digital printing is accelerating
To be the world’s No. 1 printing company
At the Customer Experience Center Tokyo, customers can bring in their print data and have it verified. (Shimomaruko Headquarters, Canon Inc., Japan)
CANON ANNUAL REPORT 2017 11
STRATEGYBUSINESS SEGMENT/
CORPORATE STRUCTUREFINANCIAL SECTION CORPORATE DATA

Canon network cameras play a role in enabling optimal video stream at high resolution and definition 24 hours a day at an aircraft maintenance center.
CANON ANNUAL REPORT 201712
NETWORK CAMERAS

Responding to demand for network cameras used in all sorts of settings through rapidly expanding solutions business
The network camera industry continues to expand due to
rising security concerns worldwide. In the era of the IoT,
network cameras are evolving as a means of visualizing real-
time information based on higher performance cameras and
sophistication in image analysis technologies, along with AI
technologies. As a result, the scope of solutions businesses
using network cameras is spreading in all sorts of settings,
including stores and commercial facilities, factories, healthcare
and nursing care, sports and other events, and transportation.
Based on the camera and camcorder technologies Canon
has cultivated since our foundation, we have been producing
the cameras for the purpose of security and surveillance. We
formally established our network camera business in 2013,
and welcomed Axis into the Group in 2015. An outstanding
range of network image processing technologies enables Axis
to offer solutions to more than 90,000 partner companies in
180 countries and regions. Canon and Axis collaborate in the
areas of product development, service, and support, while
striving to improve efficiency, and in April 2017 we launched
our first jointly developed product, the AXIS Q1659 inter-
changeable-lens network camera. The AXIS Q1659 employs
eight different interchangeable lenses for EOS-series cameras,
ranging from wide-angle to telephoto, which can be used
to satisfy a wide range of monitoring needs in environments
such as airports and stadiums.
Taking maximum advantage of network cameras, in which
multiple cameras are coordinated, requires video manage-
ment software that provides centralized management of
high-resolution images. In 2014, Canon welcomed Milestone,
the leading provider of video management software for video
images captured by network cameras, into the Group. Canon
and Milestone are striving to develop video analysis technolo-
gies. We are also proposing innovative solutions that combine
Canon’s high-sensitivity, high-resolution differentiated cam-
eras with image analysis software capable of counting people
and identifying physical attributes.
Canon’s aim is to provide innovative network imaging
solutions that integrate Axis’s network image processing tech-
nology and Milestone’s video management technology with
Canon’s proprietary imaging technology. Network cameras are
evolving for a growing range of applications that will support
a safe and secure future.
Rapid growth by expanding the scope of solutions
Becoming an innovative network imaging solutions company
Axis network cameras protect the safety of people in Yokohama, one of the largest cities in Japan.
CANON ANNUAL REPORT 2017 13
STRATEGYBUSINESS SEGMENT/
CORPORATE STRUCTUREFINANCIAL SECTION CORPORATE DATA

Canon Medical’s 320-row detector, Aquilion ONETM, which achieves wide-area, high-speed imaging with low radiation exposure and high image quality, is widely used for the diagnosis of cerebral aneurysms and cancer. (Fujita Health University Hospital, Japan)
CANON ANNUAL REPORT 201714
HEALTHCARE

Expanding our healthcare business centered on Canon Medical
The healthcare industry, which comprises the field of health,
including health promotion, disease prevention, and nursing
care, and the field of medicine, including testing, diagnosis,
treatment, and rehabilitation, represents a growing market
driven by the growing global population and the aging of
societies. This market is expected to expand dramatically,
increasing from ¥16 trillion in 2013 to ¥37 trillion in 2030
in Japan, and from ¥163 trillion to ¥525 trillion overseas.
According to the Ministry of Economy, Trade and Industry, the
global market for medical equipment continues to grow at
a rate of 8% per year, and is expected to be worth approxi-
mately $450 billion (roughly ¥50 trillion) in 2018.
Canon entered the healthcare business in 1940 with the devel-
opment of Japan’s first indirect X-ray camera. Since that time,
we have continued to support new areas of advanced medical
care through the development of products such as digital radi-
ography equipment and ophthalmic equipment, based on our
proprietary optical and image processing technologies.
In 2016, Canon welcomed TMSC, a leading manufacturer
of medical equipment, into the Group, and in January 2018
changed the company’s name to Canon Medical. Canon
Medical has a broad product portfolio that spans diagnostic
X-ray systems, X-ray computed tomography (“CT”) systems,
magnetic resonance imaging (“MRI”) systems, diagnostic
ultrasound systems, diagnostic nuclear medicine systems,
and medical sample testing systems. In the CT market,
Canon Medical holds the top market share position in Japan
and maintains high market share globally. In April 2017,
Canon Medical carried out the domestic launch of Aquilion
PrecisionTM, a high-precision CT scanner that delivers substan-
tially higher resolution than ever before. In the future, through
synergies generated from the strengths of Canon and Canon
Medical in manufacturing technology and sales networks, we
will aim to create new value in medical care.
The Healthcare Optics Research Lab at Canon U.S.A. has
been steadily pursuing research on ultra-miniature endo-
scopes and medical robotics, including a needle guidance
system, based on open innovation.
Through synergies with Canon Medical and integrated
medical operations spanning from R&D to sales in the United
States, we will continue to provide total solutions for the
needs of today’s medical facilities and better healthcare for
the future.
Dramatically growing healthcare industry due to population growth and aging societies
Expanding the scope of our healthcare business
Research has been pursued on the needle guidance system, which assists physicians to insert a needle accurately into the targeted location of internal organ. (Healthcare Optics Research Lab, Canon U.S.A., United States)
CANON ANNUAL REPORT 2017 15
STRATEGYBUSINESS SEGMENT/
CORPORATE STRUCTUREFINANCIAL SECTION CORPORATE DATA

Canon Tokki produces OLED panel manufacturing equipment with unrivalled technology required for advanced manufacturing equipment, including vacuum evaporation equipment for depositing organic materials onto panel substrates and automated supply lines for glass substrates. Canon Tokki continues to be the industry leader.
CANON ANNUAL REPORT 201716
INDUSTRIAL EQUIPMENT

Seeking new growth with industrial equipment that support manufacturing and achieve innovation
With the arrival of the fourth industrial revolution, the indus-
trial equipment field has entered a new era of growth in areas
such as semiconductor manufacturing equipment and organic
LED (“OLED”) panel manufacturing equipment. In particular,
demand for OLED panels is growing rapidly for devices such
as smartphones and TVs, due to advantages such as thinness,
light weight, low power consumption, and ability to produce
vibrant colors. Expectations are high for OLED panels in terms
of applications, including the capability to be bent, and in the
future, folded.
Canon supports the growth of manufacturing and industry
by applying proprietary technologies that we have developed
over many years to the creation of industrial equipment.
Canon Tokki, Canon ANELVA, and Canon Machinery play
key roles in meeting the needs of a wide range of industries,
from semiconductor manufacturing equipment to OLED panel
manufacturing equipment.
Canon Tokki’s OLED panel manufacturing equipment leads
the industry, setting the standard worldwide. In 2017, we sig-
nificantly increased production of OLED panel manufacturing
equipment due to a rapid increase in demand for OLED panels
used in smartphones. Orders were so strong we were nearly
unable to keep up. This contributed significantly to substantial
sales growth in industrial equipment in 2017.
Canon ANELVA engages in the development, manufactur-
ing, and sales of vacuum thin-film deposition equipment that
meet the needs of the times, based on its proprietary ultra-
high vacuum technology and thin-film deposition technology.
Canon Machinery boasts the top domestic market share for
its die bonders, a device which attaches dies (individual semi-
conductor chips printed with circuits) to substrates. In 2017,
Canon Machinery began expanding its Malaysia plant in order
to strengthen its production system by further enhancing
production capacity. Canon Machinery develops and produces
customized automation and labor-saving equipment, such as
automotive component assembly equipment and assembly
equipment for secondary batteries for electric vehicles, which
are expected to see rapid growth in the future.
Canon, together with Canon Tokki, Canon ANELVA, and
Canon Machinery, will continue to aim for high growth in
the industrial equipment field by leveraging group synergies
through collaboration in areas such as manufacturing
technology, procurement, and personnel support.
Industrial equipment enters a new era of growth in the fourth industrial revolution
Leading the industry in OLED panel manufacturing equipment
In order to meet the needs of miniaturized semiconductor devices, Canon ANELVA is proceeding with the development of sputtering equipment based on thin-film deposition technologies.
CANON ANNUAL REPORT 2017 17
STRATEGYBUSINESS SEGMENT/
CORPORATE STRUCTUREFINANCIAL SECTION CORPORATE DATA

IMAGING SYSTEM BUSINESS UNIT
OFFICE BUSINESS UNIT
Interchangeable-lens digital cameras—Digital SLR cameras
Inkjet printers
Interchangeable-lens digital cameras—Compact-system cameras
Large format inkjet printers
Laser multifunction printers (MFPs)
High speed continuous feed printers
Office multifunction devices (MFDs)
Digital production printing systems
Main Products• Office multifunction devices (MFDs)
• Laser multifunction printers (MFPs)
• Laser printers
• Digital production printing systems
• High speed continuous feed printers
• Wide-format printers
• Document solutions
27.8%
Main Products• Interchangeable-lens digital cameras
• Digital compact cameras
• Digital camcorders
• Digital cinema cameras
• Interchangeable lenses
• Compact photo printers
• Inkjet printers
• Large format inkjet printers
• Commercial photo printers
• Image scanners
• Multimedia projectors
• Broadcast equipment
• Calculators
45.7%
Composition of Sales (%)
Composition of Sales (%)
CANON ANNUAL REPORT 201718
AT A GLANCE

Network cameras
MEDICAL SYSTEM BUSINESS UNIT
INDUSTRY AND OTHERS BUSINESS UNIT
Digital radiography systems
Magnetic resonance imaging
Organic LED (OLED) panel manufacturing equipment
Diagnostic ultrasound systems
Computed tomography
Semiconductor lithography equipment FPD (Flat panel display) lithography equipment
Main Products• Diagnostic X-ray systems
• Computed tomography
• Magnetic resonance imaging
• Diagnostic ultrasound systems
• Clinical chemistry analyzers
• Digital radiography systems
• Ophthalmic equipment
17.9%
Main Products• Semiconductor lithography equipment
• FPD (Flat panel display) lithography
equipment
• Vacuum thin-film deposition equipment
• Organic LED (OLED) panel manufacturing
equipment
• Die bonders
• Micromotors
• Network cameras
• Handy terminals
• Document scanners
Note: The percentage figures for the four business units presented in the pie charts above do not add up to 100% because “Eliminations,” recorded in consolidation accounting, were not included in calculation considerations.
10.7%
Composition of Sales (%)
Composition of Sales (%)
CANON ANNUAL REPORT 2017 19
STRATEGY BUSINESS SEGMENT/CORPORATE STRUCTURE
FINANCIAL SECTION CORPORATE DATA

A. Our photoacoustic tomography (“PAT”), which can capture 3-D images of blood vessels in a human hand, for example, is expected to be applied to diagnostic imaging. Clinical research for PAT technology is currently being carried out in collaboration with Kyoto University and Keio University. (Kyoto University, Japan) B. CE-SAT-I, a microsatellite developed by Canon Electronics, was loaded on a rocket launched by the Indian Space Research Organization (“ISRO”). (Satish Dhawan Space Center, India)
2017 Top Ten U.S. Patent Holders by Company
*IBM is an abbreviation for International Business Machines Corporation.
SourcePreliminary data released by IFI CLAIMS Patent Services, a U.S. research company specialized in patent information.
Intel 3,023
LG Electronics 2,701
Qualcomm 2,628
Google 2,457
Microsoft TechnologyLicensing 2,441
Taiwan SemiconductorManufacturing 2,425
IBM* 9,043
SamsungElectronics 5,837
CANON 3,285
SamsungDisplay 2,273
B
A
CANON ANNUAL REPORT 201720
RESEARCH & DEVELOPMENT
Canon is engaged in efforts to discover new technologies that will help create future businesses
Canon is bolstering R&D activities to enable the ongoing
development of innovative products and services. In the year
under review, R&D expenses amounted to ¥330.1 billion, up
9.2%, or ¥27.7 billion, from the previous year. The ratio of
R&D expenses to net sales was 8.1%.
This focus on R&D activities has cemented Canon’s high
status in the field of intellectual property. In 2017, Canon was
granted 3,285 patents in the United States, ranking it third in
the world and the top ranked Japanese company for a thir-
teenth consecutive year.
Canon has a long-term perspective as it concentrates its ef-
forts on discovering new technologies for the future.
CMOS Sensors
Canon is conducting in-house development and production
of CMOS sensors, a key device in interchangeable-lens digital
cameras. We are developing our proprietary ultra-high-
resolution 250 megapixel CMOS sensors that make it possible
to capture images of the lettering printed on the body of an air-
plane roughly 18 kilometers away and ultra-high-sensitivity 35
mm full-frame CMOS sensors capable of capturing vivid images
in color even in extreme low-light conditions. We anticipate
various applications for security, dashboard cameras, healthcare
and space observation. We are also developing global shutter-
equipped CMOS sensor that can capture distortion-free images
even when shooting fast-moving objects. We are putting in
place a system for external sales to industrial fields.
Photoacoustic Tomography
Canon participates in the Impulsing Paradigm Change through
Disruptive Technologies (“ImPACT”) Program organized by the
Cabinet Office of Japan. We are working on research in photo-
acoustic tomography (“PAT”) that can capture 3-D images of
blood vessels using a pulse laser and ultrasonic sensors, with-
out the use of X-rays or contrast agents. In the healthcare field,
where further growth is expected, TMSC was welcomed into
the Canon Group in 2016. In addition to introducing Canon’s
advanced production technologies, including precision design
and microfabrication technologies, to the new company, we
will use our original high-speed X-ray imaging sensors and
new technologies such as PAT to develop highly innovative
next-generation medical equipment.
Free Viewpoint Video System
Canon is developing its Free Viewpoint Video System, a
new visual solution that incorporates the optical and sensor
technologies cultivated by the Company over many years.
The system comprises several high-resolution cameras set up
around a stadium, which are connected to a network and
controlled via software to capture a game from multiple view-
points. The video is rendered as high-resolution 3-D spatial
data. By achieving a new video experience that gives users a
sense that they are really at a sporting event, etc., Canon is
expanding the boundaries of visual expression and contribut-
ing to the development of video culture.
Space Exploration
Canon is also conducting proprietary development in fields
related to space exploration. As a participant in the Thirty
Meter Telescope (“TMT”) project to build an extremely large
telescope in Hawaii, Canon is involved in processing of the
primary mirror, which demands an exceptional level of preci-
sion. Meanwhile, Canon Electronics has used its technologies
originally cultivated for cameras and printers to develop a
proprietary microsatellite, which was mounted on a rocket
launched by the Indian Space Research Organization (“ISRO”)
in 2017. Images captured by the camera attached to the micro-
satellite are expected to provide valuable information in a wide
range of areas including agriculture and disaster response.
Initiatives to Establish New Businesses
R&D Expenses and Patents
CANON ANNUAL REPORT 2017 21
STRATEGY BUSINESS SEGMENT/CORPORATE STRUCTURE
FINANCIAL SECTION CORPORATE DATA

A. In inkjet printer production, Canon seeks to raise the bar in high-quality product manufacturing while striving to improve production efficiency. (Canon Hi-Tech (Thailand), Thailand) B. With one of the largest semi-anechoic chambers in Japan, Canon conducts certification testing on large-scale products such as commercial printing systems using in-house facilities. (Tamagawa Office, Canon Inc., Japan) C. At Japan’s National Skills Competition in 2017, our technicians entered the Mechatronics category. Canon has won prizes in this technical contest for thirteen successive years since 2005.
B C
A
CANON ANNUAL REPORT 201722
PRODUCTION

Canon aims to establish a new production system that achieves a cost-of-sales ratio of 45% through the evolution of our manufacturing capabilities
Canon has established a globally optimized production sys-
tem in which we determine production locations based on a
comprehensive analysis of costs, taxes, logistics, procurement,
labor and other factors. In Japan, we are promoting automa-
tion technology in order to increase production. In the United
States and Europe, we are accelerating the localized produc-
tion of consumables. And in labor intensive manufacturing
sites, we are boosting productivity by honing our employees’
skills. We aim to maximize the strengths of each region to
produce high-quality products.
Seeking to produce original products, Canon actively pro-
motes in-house production of key devices and components
such as CMOS sensors, manufacturing equipment such as
automated assembly machines and high-precision processing
machines, as well as molding dies. To produce high-quality
products at efficient costs, we strive to maintain highly reliable
automated production lines. We have been introducing fully
automated production for toner cartridges. Now we are pur-
suing full automation for the manufacturing of our cameras,
too. In 2016, we established the Techno Wing R&D facility at
Oita Canon, as a hub for pursuing superior manufacturing
and product technologies. Our aim is to fully automate manu-
facturing of digital cameras.
Furthermore, Miyazaki Canon has decided to establish a
new production site for digital cameras, which is scheduled
to begin operations in 2019. By applying the full-automation
technology developed at the Techno Wing to the new facility
in Miyazaki and other production sites, we aim to establish a
highly efficient manufacturing system.
Canon provides human resource training to nurture the
skills of employees at our production sites worldwide. Our
programs teach manufacturing techniques and craftsman-
ship—including hands-on practice—and educate employees
with leadership potential in Canon management methods.
To hone the technical skills of our employees in Japan, we
participate in Japan’s National Skills Competition. The spirit
of challenge that we cultivate through such activities can be
found at Canon manufacturing sites around the world.
To advance our manufacturing, Canon honors our most
skilled technicians. At our factories worldwide, we recog-
nize employees who have contributed to Canon production
through their skills and knowledge of assembly and com-
ponent processing. These employees are awarded the title
Meister. Employees who display transcendent skills earn the
title Master Craftsman.
From product design and development, to production, logistics,
product use and recycling, throughout the product’s lifecycle in
all areas of our business, Canon is engaged in manufacturing ini-
tiatives that are friendly to the global environment and minimize
environmental impact.
Canon has established a quality management system that
combines the requirements of ISO9001, an international quality
management standard, with work mechanisms unique to Canon
to ensure that our products are safe, can be enjoyed with peace
of mind, and provide satisfaction to our customers. In addition to
thoroughly implementing operations in accordance with quality
standards, certifications, and related laws and regulations of various
countries around the world, we carry out strict evaluations using
cutting-edge testing facilities that are at the forefront of the industry.
Automation and In-house Production
Environmentally Friendly Manufacturing; Enhanced Product Quality
Globally Optimized Production Human Resources for Manufacturing
CANON ANNUAL REPORT 2017 23
STRATEGY BUSINESS SEGMENT/CORPORATE STRUCTURE
FINANCIAL SECTION CORPORATE DATA

A. The Océ Colorado 1640 printer, built on Canon UV gel technology, proved to be one of the star digital innovations of the FESPA 2017, pulling in large crowds to hourly demonstrations. B. The recently established “Professional Technology & Support Center” in Burbank provides comprehensive support services for video production equipment professionals. C. Activity exhibited at industry events with an eye to expand B2B business. Canon China displayed at a business exhibition for government institutions in Beijing.
B C
A
CANON ANNUAL REPORT 201724
SALES & MARKETING

Accelerating growth in commercial printing, network cameras, healthcare and industrial equipment as key drivers of Canon’s next-generation business
Sales in Japan amounted to ¥884.8 billion, or 21.7% of con-
solidated net sales.
Performance was strong for products including hardware
such as MFPs, consumables, and IT solutions as capital invest-
ment by companies in Japan picked up. In the security business,
sales of surveillance cameras, software and other products con-
tinued to increase. In industrial equipment, sales and service of
equipment for semiconductor manufacturers were favorable,
backed by brisk investment by customers. Regarding products
for consumers, while sales of mirrorless cameras were up, sales
of inkjet printers declined due to a shrinking market.
Sales in the Americas amounted to ¥1,107.5 billion, or 27.1%
of consolidated net sales.
In the office equipment market, we reinforced our sales
network by developing a system that can better support and
manage our approximately 400 dealers across the Americas.
We also brought together our comprehensive support and
services for professional video-production equipment at a
strategic hub in Burbank, California, near Hollywood. We also
began offering our “Next Day” repair services for professional
photographers, the first initiative of its kind for the industry,
and it was met with a favorable response.
Sales in Europe amounted to ¥1,028.4 billion, or 25.2% of
consolidated net sales.
Canon in EMEA maintained their leading position in Imaging
System thanks to solid sales of interchangeable-lens cameras.
Additionally, through strategic acquisitions, we strengthened
the imaging ecosystem for consumers. In the B2B area, we
enhanced business through the launch of a new wide-format
printer for the signage and graphics industry. To further ex-
pand operations in emerging markets, a new innovation centre
was opened in Dubai to help foster local talent and business.
We continued structural reform efforts and also made a lot of
progress in furthering our customer-centric approach.
Sales in Asia and Oceania amounted to ¥1,059.3 billion, or
26.0% of consolidated net sales.
As an Asia-wide initiative, we are promoting expansion of
B2B business with the launch of a project aimed at strength-
ening the sales and brand of copiers and commercial printers.
Six of our sales companies in Asia marked anniversaries in
2017, including the 20th anniversary of Canon China and
the 45th anniversary of Canon Hongkong. Commemorative
events and sales promotion activities were held in many areas.
The efforts contributed to an increase in sales in the Asia
region. In Oceania, Harbour IT and Converga, which have
recently joined the Canon Group, conducted cross-selling to
approach each other’s customers.
The Americas
Europe (Europe, Middle East, Africa)
Japan
Asia and Oceania
Composition of Sales by Region
Net Sales
¥4,080.0billion
The Americas
27.1%
¥1,107.5 billion
Europe
25.2%
¥1,028.4 billion
Japan
21.7%
¥884.8 billion
Asia and Oceania
26.0%
¥1,059.3 billion
CANON ANNUAL REPORT 2017 25
STRATEGY BUSINESS SEGMENT/CORPORATE STRUCTURE
FINANCIAL SECTION CORPORATE DATA

ESG
Governance
Environment Social
G
E S
Canon’s Approach
Based on the Canon Environmental Vision, Canon is working to reduce envi-ronmental burden throughout the entire product lifecycle, from procurement of raw materials and parts to collection and recycling of used products, in an effort to realize a society that promotes both enriched lifestyles and the global environment.
Canon’s Approach
Canon makes sincere efforts to engage in corporate social responsibilities, in-cluding product safety, human rights, labor management, and accountable procurement activities. In addition, as a good corporate citizen, we promote efforts such as disaster relief and sup-port for culture, and also work to resolve social issues through our technology and business activities.
Canon’s Approach
Canon maintains sound corporate gov-ernance as part of efforts to maximize its shareholders’ value and become a truly excellent global corporation.
Environment: Social: Governance:
Key Activities
• Contributing to a Low-Carbon Society
• Contributing to a Circular Economy
• Eliminating Hazardous Substances and Preventing Pollution
• Contributing to a Society in Harmony with Nature
Key Activities
• Promoting Diversity
• Addressing the Issue of Conflict Minerals
• Supporting Art and Culture
Key Activities
• Board of Directors, Audit & Supervisory Board, Non-statutory Committees
• Constructive Dialogue with Shareholders
In recent years, the ethical role of corporations has increased
in importance amid wide-ranging societal expectations and
responsibilities. Canon adopted kyosei as its corporate phi-
losophy in 1988, and since then we have worked to fulfill our
responsibilities to society and build solid relationships not only
with our customers and business partners, but also with coun-
tries, communities, nature, and the global environment. The
approach we take with our corporate philosophy harmonizes
with the ideals laid out in the Sustainable Development Goals
(“SDGs”) adopted by the United Nations in 2015. As members
of society, high expectations are being placed on corporations.
Accordingly, we will contribute to society by leveraging our
technological capabilities to create new value, resolve social
issues, and engage in activities to preserve and protect the
global environment, while continuing to be a company that
always gives due consideration to people and society.
ESG
For details, please refer to the Canon Sustainability Report. http://global.canon/en/csr/report/index.html
CANON ANNUAL REPORT 201726

Canon is working towards the goal of achieving a 3%-per-
year improvement in lifecycle CO2 emissions per product.
From 2008 to 2017, we have achieved an average improve-
ment of around 5% per year.
Canon has been promoting improvements in CO2 efficiency at
all stages of the product lifecycle: manufacture of raw materi-
als and parts, operational site activities, logistics and customer
use of products.
In order to achieve more efficient use of resources, Canon
pursues advanced resource circulation through product-
to-product recycling, and is carrying out remanufacturing
of multifunction devices and closed-loop recycling of toner
cartridges. We are also actively promoting initiatives such as
designing more compact products.
Canon strictly manages chemical substances in products in
line with Canon Green Procurement Standards, as well as
those used in manufacturing processes. Additionally, we make
proactive contributions to the establishment of international
frameworks for the appropriate management of chemical
substances in the supply chain.
Based on the Canon Biodiversity Policy, Canon is promoting
conservation and protection activities around the world. One
such activity is the Canon Bird Branch Project, which encour-
ages consideration of “the Cycle of Life” by focusing on birds
as a symbol of the top of the local ecosystem pyramid.
Contributing to a Low-Carbon Society
Contributing to a Circular Economy
Canon is implementing the Canon Bird Branch Project, which examines the cycle of life by focusing on birds as a symbol of the ecosystem pyramid. The Shimomaruko Forest, a lush expanse of green space occupying about 30% of Canon’s headquarters site in Tokyo, plays host to bird watching parties, research studies, and ecosystem monitoring events as part of this project.Canon’s Toride Plant, Susono Plant, and Kawasaki Office, as well as Oita Canon’s Oita Plant and Canon Research Centre France are also engaged in these efforts, expanding the activities globally.
Eliminating Hazardous Substances and Preventing Pollution
Contributing to a Society in Harmony with Nature
ENVIRONMENT
CANON ANNUAL REPORT 2017 27
STRATEGY BUSINESS SEGMENT/CORPORATE STRUCTURE
FINANCIAL SECTION CORPORATE DATA

SOCIAL
Canon is committed to diversity of human resources. We wel-
come people of all types—irrespective of race, gender, age,
customs, and value perceptions—and deploy such differences
to foster our growth as an organization. Since 2012, we have
engaged in in-house projects fostering diversity. In 2017,
Canon held meetings with Group company presidents at 24
Group companies in Japan organized by the VIVID diversity
promotion program, where they promoted activities to enable
more active roles for women in the workplace Group-wide.
Seeking to ensure that customers can use Canon products
with peace of mind, Canon conducts inquiries into conflict
minerals every year and discloses its findings to the U.S.
Securities and Exchange Commission and publishes them
on the Company’s website. Canon is a member of the
Responsible Minerals Initiative (“RMI”), an international
program that plays a leading role in response to the issue of
conflict minerals, and continues to support industry activities.
As a company that contributes to the development of visual
culture, Canon engages in activities to foster the richness of
human feelings and emotions. In 2007, Canon and the Kyoto
Culture Association (“NPO”) launched the Tsuzuri Project (of-
ficially known as the Cultural Heritage Inheritance Project).
This initiative combines Canon’s latest digital technologies
with traditional Japanese craft techniques to create high-reso-
lution reproductions of Japanese cultural assets and use them
effectively. As of March 2018, 35 works have been donated.
Promoting Diversity
Addressing the Issue of Conflict Minerals
Supporting the Arts and Culture
The Tsuzuri Project has been creating high-resolution reproductions such as “Tatars Playing Polo and Hunting” attributed to Kano Soshu (photo, top) and “Landscape of the Four Seasons” by Shikibu Terutada. The two original pieces have been stored at the Asian Art Museum of San Francisco, and with the museum’s cooperation, the reproductions were finished and donated to the Kyoto National Museum in June 2017. The Project brings high-resolution facsimiles of Japanese cultural assets, that have been sent overseas, back to Japan and it donates reproductions to art museums, shrines, and temples, where they are displayed to the public, and at schools as living educational aids for teaching history. In such ways, the Project provides people with opportunities to experience Japan’s outstanding art and culture firsthand.
CANON ANNUAL REPORT 201728
ESG

business fields, including office equipment, consumer products,
medical equipment, and industrial equipment, and aims to ag-
gressively expand into new business fields in the future. In order
to make prompt decisions in each business field, and make
important decisions for the entire Canon Group or matters that
straddle several business fields from a company-wide perspec-
tive and at the same time secure appropriate decision making
and execution of operation, the Company judges the corporate
governance structure below to be effective.
Board of Directors
While the focus of the organizational structure of the Board of
Directors is on Representative Directors that oversee Company-
wide business strategies or execution such as the CEO, COO,
CFO, CTO, and Representative Directors or Executive Directors
that oversee multiple business fields or headquarters functions, in
order to secure sound management, two or more Independent
GOVERNANCE
At a monthly company-wide meeting of executive officers, the CEO provides updates on earnings progress and important matters to implement in the future as a way to share crucial information.
In order to establish a sound corporate governance structure
and continuously raise corporate value, Canon believes that
it is essential to improve management transparency and
strengthen management supervising functions. At the same
time, a sense of ethics and mission held by each executive and
employee of Canon is very important in order to achieve con-
tinuous corporate growth and development. Details of Canon
Inc.’s corporate governance structure are available on the
Company’s official website under “an overview of Corporate
Governance at Canon Inc.”
(http://global.canon/en/ir/strategies/governance.html).
Fundamental Policy
The Company is globally expanding its businesses in various
Fundamental Policy
Governance Structure
CANON ANNUAL REPORT 2017 29
STRATEGY BUSINESS SEGMENT/CORPORATE STRUCTURE
FINANCIAL SECTION CORPORATE DATA

GOVERNANCE
Outside Directors are appointed. The Board of Directors, in accor-
dance with laws and regulations, makes important decisions and
supervises the execution of duties by officers.
Except for the above, the CEO and other Representative
Directors are active in decision making and execution, and
under the command and supervision of the Representative
Directors, Executive Officers that are elected through resolu-
tion of the Board of Directors make decisions and execute
operations of each business field or function.
The Board of Directors consists of seven members, five
Representative Directors from inside Canon and two Outside
Directors that qualify as Independent Directors*. As of April
1, 2018, there will be 36 Executive Officers, including two fe-
males and one non-Japanese.
* Independent directors: Stock exchanges in Japan require listed companies to appoint out-side directors and/or outside Audit & Supervisory Board members and to report their name. Outside directors and Audit & Supervisory Board members should have no possible conflict of interests with regular shareholders. People related to the parent company or major busi-ness partners, consultants who receive large remunerations from the company, and their close relatives cannot be selected as independent directors.
Audit & Supervisory Board
As a body which is in charge of the audit of operations,
under the principles of autonomy, which is independent
from the Board of Directors, the Company has full-time
Audit & Supervisory Board Members that are familiar with
the Company’s businesses or its management structure, and
Independent Outside Audit & Supervisory Board Members
that have extensive knowledge in specialized areas such as
law, finance and accounting. The Audit & Supervisory Board,
which is composed of these individuals, cooperates with the
Company’s accounting auditors and internal audit division,
oversees the status of duty execution of operations and cor-
porate assets to secure the soundness of management.
The Audit & Supervisory Board consists of five individuals,
three of which are Independent Outside Audit & Supervisory
Board Members. In accordance with auditing policies and
plans decided at Audit & Supervisory Board meetings,
the Audit & Supervisory Board Members attend Board of
Directors’ meetings, Corporate Strategy Committee meetings,
etc., receive reports from directors and employees, review
documents related to important decisions, and conduct audits
by investigating etc. the situation of businesses and property
of the Company and its subsidiaries. In this way, the Audit
& Supervisory Board conducts strict audits of directors’ ex-
ecution of duty, including the status of development of the
internal control system.
Procedures in the Nomination of Directors etc.
The Company established the “Nomination and Remuneration
Advisory Committee,” a non-statutory committee, which
consists of the CEO, two Independent Outside Directors, and
Directors and Audit & Supervisory Board Members (as of April 1, 2018)
Representative DirectorChairman & CEO
Fujio Mitarai
Representative DirectorPresident & COO
Masaya Maeda
Representative DirectorExecutive Vice President & CFO
Toshizo TanakaGroup Executive of Finance & Accounting HeadquartersGroup Executive of Public Affairs HeadquartersGroup Executive of Facilities Management Headquarters
Representative Director Executive Vice President &In charge of Office Business
Toshio HommaChief Executive of Office Imaging Products Operations
Representative DirectorExecutive Vice President & CTO
Shigeyuki MatsumotoGroup Executive of R&D Headquarters
Directors
Kunitaro Saida (Outside)
Attorney
Haruhiko Kato (Outside)
President & CEO of Japan Securities Depository Center, Incorporated
Audit & Supervisory Board Members
Kazuto OnoMasaaki NakamuraTadashi Ohe (Outside)
Hiroshi Yoshida (Outside)
Koichi Kashimoto (Outside)
Note: Although this annual report is for FY2017, the above list of Directors and Audit & Supervisory Board members is as of April 1, 2018.
CANON ANNUAL REPORT 201730
ESG

Corporate Strategy Committee, Risk Management
Committee, and Disclosure Committee
The Company established the Corporate Strategy Committee,
consisting of Representative Directors and some Executive
Officers. Among items to be decided by the CEO, the
Committee undertakes prior deliberations on important mat-
ters pertaining to Canon Group strategies. Outside Directors
and Audit & Supervisory Board Members attend Corporate
Strategy Committee meetings and are able to express their
own opinions.
Based on a resolution passed by the Board of Directors,
Canon set up the Risk Management Committee, which
one Independent Outside Audit & Supervisory Board Member.
At the time Director and Audit & Supervisory Board Member
candidates are nominated and Executive Officers are selected
(includes the selection of the successor of chief executive of-
ficer), the CEO recommends candidates thereof from among
individuals that have been recognized as having met the pre-
scribed requirements, and the Committee checks the fairness
and validity of such recommendation prior to submission to
and deliberation by the Board of Directors. Additionally, as
for Audit & Supervisory Board Member candidates, prior to
deliberation of the Board of Directors, consent of the Audit &
Supervisory Board shall be acquired.
Governance Structure (as of March 29, 2018)
Audit & Supervisory Board5 Members
(Includes 3 Independent Members)
General Meeting of Shareholders
Board of Directors7 Members
(Includes 2 Independent Members)
Representative DirectorsCEO and others
Accounting Auditor(Audit Firm)
Executive Officers, and each General Manager
Corporate Audit Center
Disclosure Committee
Corporate Strategy CommitteeRepresentative Directors and
Executive Officers with direct control of an organizational division
Nomination and Remuneration Advisory Committee
(CEO, two Independent Outside Directors, and one Independent Outside
Audit & Supervisory Board Member)
Financial Risk ManagementSubcommittee
Compliance Subcommittee
Business Risk ManagementSubcommittee
Risk Management Committee
Elect/Dismiss
Elect/DismissApprove/Supervise
Instruct/OrderApprove/Supervise
Elect/Dismiss Elect/DismissAudit
Cooperation
Financial Audit
Cooperation
CooperationReport Audit
Report
Report
Report
Report
Report
Internal Audit
Consult
Consult
Report
Cooperation
Report
CANON ANNUAL REPORT 2017 31
STRATEGY BUSINESS SEGMENT/CORPORATE STRUCTURE
FINANCIAL SECTION CORPORATE DATA

dialogue with shareholders through an ordinary general
meeting of shareholders, corporate strategy conferences,
financial results conferences, and interviews with major insti-
tutional investors.
The Structure to Promote Dialogue
Finance & accounting (Investor Relations (“IR”)), legal affairs,
corporate communications are responsible for working to-
gether and promoting dialogue. The Executive Vice President
& CFO oversees the entire structure to promote dialogue.
For analysts and institutional investors, the CEO hosts a
corporate strategy conference at the beginning of the year.
Other than this, the CFO hosts quarterly financial results con-
ferences. For individual investors, conferences are held when
appropriate and on Canon’s official website, specific pages
containing information about corporate strategy, financial
results, and financial data etc. have been set up using descrip-
tions that are easy to understand.
Additionally, Canon works for dialogue with domestic and
overseas analysts and institutional investors, arranging inter-
view opportunities appropriately. For detail, see “an overview
of Corporate Governance at Canon Inc.”
As for the opinions or demands that are obtained through
dialogue with shareholders, accordingly, the department in
charge reports to the CFO and the CFO will report important
ones to the CEO or the Board of Directors.
Controlling Insider Information
Canon has set the “Rules on Prevention of Insider Trading,”
which makes thorough control of undisclosed material informa-
tion and provides the procedure of information disclosure.
formulates policy and action proposals regarding improve-
ment of the Canon Group risk management system. The
Risk Management Committee consists of three entities: the
Financial Risk Management Subcommittee, which is tasked
with improving systems to ensure reliability of financial re-
porting; the Compliance Subcommittee, which is tasked with
promoting corporate ethics and improving legal compliance
systems; and the Business Risk Management Subcommittee,
which is charged with improving systems to manage overall
business risks, including risks related to product quality and
information leak.
The Risk Management Committee verifies the risk manage-
ment system’s improvement and implementation and reports
the status to the CEO and the Board of Directors.
In addition, the Disclosure Committee was established to
undertake deliberations pertaining to information disclosure,
including content and timing, to ensure important corporate
information will be disclosed in a timely and accurate manner.
Internal Audit Division
The Corporate Audit Center, the Company’s internal audit-
ing arm, as an independent and specialized organization and
in accordance with internal audit rules, conducts audits and
evaluations and provides guidance on such matters as compli-
ance with laws and the internal control system. Furthermore,
the Corporate Audit Center is primarily responsible for audits
covering such areas as quality, the environment, and informa-
tion security, and conducts them in collaboration with the
divisions in charge. Additionally, based on senior executive
management policy, for all work processes, audits must be
conducted from a specialized viewpoint and there are plans
to increase the number of members from the current 70 to
strengthen auditing functions.
Policy
For sustainable growth and to help improve corporate value
over a mid- to long-term perspective, Canon has constructive
Constructive Dialogue with Shareholders
GOVERNANCE
CANON ANNUAL REPORT 201732
ESG

TABLE OF CONTENTS
34 Financial Overview
48 Ten-Year Financial Summary
50 Consolidated Balance Sheets
51 Consolidated Statements of Income
51 Consolidated Statements of Comprehensive Income
52 Consolidated Statements of Equity
53 Consolidated Statements of Cash Flows
54 Notes to Consolidated Financial Statements
86 Schedule II Valuation and Qualifying Accounts
87 Management’s Report on Internal Control Over Financial Reporting
88 Reports of Independent Registered Public Accounting Firm
CANON ANNUAL REPORT 2017 33
FINANCIAL SECTION

GENERALThe following discussion and analysis provides information that management believes to be relevant to understanding Canon’s consolidated financial condition and results of opera-tions. References in this discussion to the “Company” are to Canon Inc. and, unless otherwise indicated, references to the financial condition or operating results of “Canon” refer to Canon Inc. and its consolidated subsidiaries.
OVERVIEWCanon is one of the world’s leading manufacturers of plain paper copying machines, office multifunction devices (“MFDs”), laser printers, cameras, inkjet printers, medical equipment, semiconductor lithography equipment and FPD (Flat panel display) lithography equipment. Canon earns reve-nues primarily from the manufacture and sale of these products domestically and internationally. Canon’s basic management policy is to contribute to the prosperity and well-being of the world while endeavoring to become a truly excellent global corporate group targeting continued growth and development.
Canon divides its businesses into four segments: the Office Business Unit, the Imaging System Business Unit, the Medical System Business Unit which was newly established in 2017 and the Industry and Others Business Unit.
Economic environmentLooking back at the global economy in 2017, the U.S. econ-omy continued to grow steadily as employment conditions and corporate earnings improved. In Europe, the economy remained stable as unemployment rates decreased and capi-tal investment increased due to strong exports. The Chinese economy rallied due to public investments while the econo-mies of emerging countries realized moderate recovery as the economies of Russia and Brazil bottomed out owing to the ris-ing price of natural resources. In Japan, corporate earnings improved and consumer spending showed signs of recovery. As a result, the global economy overall continued to recover more robustly than was expected at the beginning of the year.
Market environmentAs for the markets in which Canon operates amid these con-ditions, demand for office multifunction devices (“MFDs”) and laser printers remained at around the same level as the previous year. While demand for cameras shrank moder-ately, demand for inkjet printers increased from the previous year with the economies recovering in emerging countries. Additionally, there was solid demand for medical equipment, mainly outside of Japan. Within the Industry and Others sec-tor, demand for FPD (Flat panel display) lithography equipment and manufacturing equipment for organic LED (“OLED”) pan-els enjoyed strong growth and the demand for network cam-era also enjoyed solid growth.
The average value of the yen during the year was ¥112.13 against the U.S. dollar, a year-on-year depreciation of approx-imately ¥4, and ¥126.69 against the euro, a year-on-year depreciation of approximately ¥6.
Summary of operationsDuring 2017, unit sales of office MFDs increased compared with the previous year due to the expanded sales of color models. Additionally, unit sales of laser printers increased com-pared with the previous year, supported by the steady sales of newly launched models, as demand recovered in emerg-ing countries. While unit sales of interchangeable-lens digi-tal cameras decreased compared with the previous year, unit sales of digital compact cameras remained at around the same level amid the shrinking market, owing to increased sales of high-value-added models. Looking at inkjet printers, unit sales increased compared with the previous year, thanks to such factors as strong sales of newly launched home-use models and refillable ink tank models for emerging countries. Additionally, sales of semiconductor lithography equipment, FPD lithography equipment, and manufacturing equipment for OLED panels exceeded those of the previous year, thanks to favorable market conditions, and sales of network cameras increased steadily in response to the growing market. Under these conditions, along with the impact of acquiring TMSC, net sales for the year increased by 19.9% year on year to ¥4,080,015 million. Although the gross profit ratio decreased by 0.4 points to 48.8% due to the effect of the product mix, gross profit increased by 19.0% year on year to ¥1,992,691 million, thanks to such factors as the increase in sales and con-tinuous cost reduction efforts. Operating expenses increased by 15.0% year on year, mainly due to impairment loss on goodwill of commercial printing business in Office Business Unit and the impact of acquiring TMSC. As a result, operating profit increased by 44.8% to ¥331,479 million. Other income (deductions) increased by ¥6,620 million mainly due to gain on securities contributed to retirement benefit trust and for-eign currency exchange losses while income before income taxes increased by 44.6% year on year to ¥353,884 million and net income attributable to Canon Inc. increased by 60.6% to ¥241,923 million.
Key performance indicatorsThe following are the key performance indicators (“KPIs”) that Canon uses in managing its business. The changes from year to year in these KPIs are set forth in the table shown on page 35.
Net sales and profit ratioAs Canon pursues the goal to become a truly excellent global company, one indicator upon which Canon’s management places strong emphasis is revenue. The following are some of the KPIs related to revenue that management considers to be important.
Net sales is one such KPI. Canon derives net sales primar-ily from the sale of products and, to a lesser extent, provision of services associated with its products. Sales vary depending on such factors as product demand, the number and size of transactions within the reporting period, market acceptance for new products, and changes in sales prices. Other factors involved are market share and market environment. In addi-tion, management considers the evaluation of net sales by segment to be important for the purpose of assessing Canon’s
CANON ANNUAL REPORT 201734
FINANCIAL OVERVIEW

sales performance in various segments, taking into account recent market trends.
Gross profit ratio (ratio of gross profit to net sales) is another KPI for Canon. Through its reforms of product devel-opment, Canon has been striving to shorten product develop-ment lead times in order to launch new, competitively priced products at a faster pace. Furthermore, Canon has further achieved cost reductions through enhancement of efficiency in its production. Canon believes that these achievements have contributed to improving Canon’s gross profit ratio, and will continue pursuing the curtailment of product development lead times and reductions of production costs.
Operating profit ratio (ratio of operating profit to net sales) and R&D expense to net sales ratio are considered to be KPIs by Canon. Canon is focusing on two areas for improvement. Canon is striving to control and reduce its selling, general and administrative expenses as its first key point. Secondly, Canon’s R&D policy is designed to maintain adequate spending in core technology to sustain Canon’s leading position in its cur-rent business areas and to exploit opportunities in other mar-kets. Canon believes such investments will create the basis for future success in its business and operations.
Cash flow managementCanon also places significant emphasis on cash flow manage-ment. The following are the KPIs relating to cash flow man-agement that Canon’s management believes to be important.
Inventory turnover measured in days is a KPI because it mea-sures the efficiency of supply chain management. Inventories have inherent risks of becoming obsolete, physically damaged
or otherwise decreasing significantly in value, which may adversely affect Canon’s operating results. To mitigate these risks, management believes that it is crucial to continue reduc-ing work-in-process inventories by decreasing production lead times in order to promptly recover related product expenses, while balancing risks of supply chain disruptions by optimiz-ing finished goods inventories in order to avoid losing poten-tial sales opportunities.
The debt to total assets ratio is also one of the KPIs. For a man-ufacturing company like Canon, it generally takes considerable time to realize profit from a business due to lead times required for R&D, manufacturing and sales has to be followed for suc-cess. Therefore, management believes that it is important to have sufficient financial strength. Canon will continue to reduce its dependency on external funds for capital investments in favor of generating the necessary funds from its own operations.
Canon Inc. shareholders’ equity to total assets ratio is another KPI for Canon. Canon believes that its shareholders’ equity to total assets ratio measures its long-term sustainabil-ity. Canon also believes that achieving a high or rising share-holders’ equity ratio indicates that Canon has maintained a strong financial position or further improved its ability to fund debt obligations and other unexpected expenses. In the long-term, Canon’s management believes a high sharehold-ers’ equity ratio will enable the company to maintain a high level of stable investments for its future operations and devel-opment. As Canon puts strong emphasis on its R&D activities, management believes that it is important to maintain a stable financial base and, accordingly, a high level of its shareholders’ equity to total assets ratio.
KEY PERFORMANCE INDICATORS
2017 2016 2015 2014 2013
Net sales (Millions of yen) 4,080,015 3,401,487 3,800,271 3,727,252 3,731,380
Gross profit to net sales ratio 48.8% 49.2% 50.9% 49.9% 48.2%
R&D expense to net sales ratio 8.1% 8.9% 8.6% 8.3% 8.2%
Operating profit to net sales ratio 8.1% 6.7% 9.3% 9.8% 9.0%
Inventory turnover measured in days 49 days 59 days 47 days 50 days 52 days
Debt to total assets ratio 10.2% 11.9% 0.0% 0.0% 0.1%
Canon Inc. shareholders' equity to total assets ratio 55.2% 54.2% 67.0% 66.8% 68.6%
Note: Inventory turnover measured in days is determined by: Inventory divided by net sales for the previous six months, multiplied by 182.5. The increase of inventory turnover in 2016 was primarily due to the acquisition of TMSC on December 19, 2016. If this factor were excluded, the inventory turnover would show 50 days.
CRITICAL ACCOUNTING POLICIES AND ESTIMATESThe consolidated financial statements are prepared in accor-dance with U.S. generally accepted accounting principles (“U.S. GAAP”) and based on the selection and application of signifi-cant accounting policies which require management to make significant estimates and assumptions. These estimates and assumptions include future market conditions, net sales growth rate, gross margin and discount rate. Though Canon believes that the estimates and assumptions are reasonable, actual
future results may differ from these estimates and assumptions. Canon believes that the following are the more critical judg-ment areas in the application of its accounting policies that cur-rently affect its financial condition and results of operations.
Revenue recognitionCanon generates revenue principally through the sale of office, imaging system and medical system products, equip-ment, supplies, and related services under separate contractual
CANON ANNUAL REPORT 2017 35
STRATEGYBUSINESS SEGMENT/
CORPORATE STRUCTURE FINANCIAL SECTION CORPORATE DATA

arrangements. Canon recognizes revenue when persuasive evidence of an arrangement exists, delivery has occurred and title and risk of loss have been transferred to the customer or services have been rendered, the sales price is fixed or deter-minable, and collectibility is probable.
Revenue from sales of office products, such as office MFDs and laser printers, and imaging system products, such as digi-tal cameras and inkjet printers, is recognized upon shipment or delivery, depending upon when title and risk of loss transfer to the customer.
Canon also offers separately priced product maintenance contracts for most office products, for which the customer typi-cally pays a stated base service fee plus a variable amount based on usage. Revenue from these service maintenance contracts is measured at the stated amount of the contract and recognized as services are provided and variable amounts are earned.
Revenue from the sale of equipment under sales-type leases is recognized at the inception of the lease. Income on sales-type leases and direct-financing leases is recognized over the life of each respective lease using the interest method. Leases not qualifying as sales-type leases or direct-financing leases are accounted for as operating leases and related revenue is rec-ognized ratably over the lease term. When equipment leases are bundled with product maintenance contracts, revenue is allocated based upon the estimated relative fair value of the lease and non-lease deliverables. Lease deliverables generally include equipment, financing and executory costs, while non-lease deliverables generally consist of product maintenance contracts and supplies.
Revenue from sales of equipment that are sold with cus-tomer acceptance provisions related to their functionality including optical equipment such as semiconductor lithogra-phy equipment and FPD lithography equipment, and certain medical equipment such as computed tomography and mag-netic resonance imaging, is recognized when the equipment is installed at the customer site and the specific criteria of the equipment functionality are successfully tested. Service reve-nue is derived primarily from separately priced product main-tenance contracts on the equipment sold to customers and is measured at the stated amount of the contract and recog-nized as services are provided.
For all other arrangements with multiple elements, Canon allocates revenue to each element based on its relative selling price if such element meets the criteria for treatment as a sep-arate unit of accounting. Otherwise, revenue is deferred until the undelivered elements are fulfilled and accounted for as a single unit of accounting.
Canon records estimated reductions to sales at the time of sale for sales incentive programs including product discounts, customer promotions and volume-based rebates. Estimated reductions to sales are based upon historical trends and other known factors at the time of sale. In addition, Canon provides price protection to certain resellers of its products, and records reductions to sales for the estimated impact of price protec-tion obligations when announced.
Estimated product warranty costs are recorded at the time
revenue is recognized and are included in selling, general and administrative expenses. Estimates for accrued product war-ranty costs are based on historical experience, and are affected by ongoing product failure rates, specific product class failures outside of the baseline experience, material usage and service delivery costs incurred in correcting a product failure.
Allowance for doubtful receivables Allowance for doubtful receivables is determined using a com-bination of factors to ensure that Canon’s trade and financ-ing receivables are not overstated due to uncollectibility. These factors include the length of time receivables are past due, the credit quality of customers, macroeconomic conditions and historical experience. Also, Canon records specific reserves for individual accounts when Canon becomes aware of a custom-er’s inability to meet its financial obligations to Canon, due for example to bankruptcy filings or deterioration in the cus-tomer’s operating results or financial position. If circumstances related to customers change, estimates of the recoverability of receivables are further adjusted.
Valuation of inventoriesInventories are stated at the lower of cost or net realizable value. Cost is determined by the average method for domes-tic inventories and principally the first-in, first-out method for overseas inventories. Net realizable value is the estimated selling price in the ordinary course of business less the esti-mated costs of completion and the estimated costs neces-sary to make a sale. Canon routinely reviews its inventories for their salability and for indications of obsolescence to deter-mine if inventories should be written-down to market value. Judgments and estimates must be made and used in con-nection with establishing such allowances in any accounting period. In estimating the net realizable value of its inventories, Canon considers the age of the inventories and the likelihood of spoilage or changes in market demand for its inventories.
Impairment of long-lived assetsLong-lived assets, such as property, plant and equipment, and acquired intangibles subject to amortization, are reviewed for impairment whenever events or changes in circumstances indi-cate that the carrying amount of an asset may not be recover-able. If the carrying amount of the asset exceeds its estimated undiscounted future cash flows, an impairment charge is recog-nized in the amount by which the carrying amount of the asset exceeds the fair value of the asset. Determining the fair value of the asset involves the use of estimates and assumptions.
Property, plant and equipmentProperty, plant and equipment are stated at cost. Depreciation is calculated principally by the declining-balance method, except for certain assets which are depreciated by the straight-line method over the estimated useful lives of the assets.
Business combinationsThe acquisition is accounted for using the acquisition method
FINANCIAL OVERVIEW
CANON ANNUAL REPORT 201736

of accounting. The acquisition method of accounting requires the identification and measurement of all acquired tangible and intangible assets and assumed liabilities at their respective fair values, as of the acquisition date. The determination of the fair value of net assets acquired involves significant judgment and estimates, such as future cash flow projections, appro-priate discount and capitalization rates and other estimates based on available market information. Estimates of future cash flows are based on a number of factors including oper-ating results, known and anticipated trends, as well as market and economic conditions.
Goodwill and other intangible assetsGoodwill and other intangible assets with indefinite use-ful lives are not amortized, but are instead tested for impair-ment annually in the fourth quarter of each year, or more frequently if indicators of potential impairment exist. All good-will is assigned to the reporting unit or units that benefit from the synergies arising from each business combination. If the carrying amount assigned to the reporting unit exceeds the fair value of the reporting unit, Canon recognizes an impair-ment charge in an amount equal to that excess, limited to the total amount of goodwill allocated to that reporting unit. Fair value of a reporting unit is determined primarily based on the discounted cash flow analysis which involves estimates of projected future cash flows and discount rates. Estimates of projected future cash flows are primarily based on Canon’s forecast of future growth rates. Estimates of discount rates are determined based on the weighted average cost of capi-tal, which considers primarily market and industry data as well as specific risk factors. Canon has completed its impairment test in the fourth quarter of 2017 and recognized an impair-ment charge for the commercial printing business included in Office Business Unit for the amount by which the carrying amount exceeded the reporting unit’s fair value. For further information, please refer to Notes 8 and 20 of the Notes to Consolidated Financial Statements. The fair values of remain-ing reporting units exceeded its respective carrying amount, and thus no other impairment charges were recognized as a result of 2017 impairment test. However, since goodwill attributed to Medical System Business Unit and network cam-era business included in Industry and Others Business Unit were resulted from recent acquisitions, fair values in excess of reported carrying values as a percentage are relatively low. As a result, a future reduction more than expected in cash flows of the related business, could trigger an impairment. The goodwill related to these reporting units are ¥499,915 million and ¥235,172 million, respectively. Intangible assets with finite useful lives consist primarily of software, trademarks, patents and developed technology, license fees and customer relation-ships, which are amortized using the straight-line method. The estimated useful lives of software are from 3 years to 6 years, trademarks are 15 years, patents and developed technology are from 7 years to 17 years, license fees are 7 years, and cus-tomer relationships are from 11 years to 15 years, respectively.
Income tax uncertaintiesCanon considers many factors when evaluating and estimat-ing income tax uncertainties. These factors include an evalua-tion of the technical merits of the tax positions as well as the amounts and probabilities of the outcomes that could be real-ized upon settlement. The actual resolutions of those uncer-tainties will inevitably differ from those estimates, and such differences may be material to the financial statements.
Valuation of deferred tax assetsCanon currently has significant deferred tax assets, which are subject to periodic recoverability assessments. Realization of Canon’s deferred tax assets is principally dependent upon its achievement of projected future taxable income. Canon’s judgments regarding future profitability may change due to future market conditions, its ability to continue to successfully execute its operating restructuring activities and other factors. Any changes in these factors may require possible recognition of significant valuation allowances to reduce the net carrying value of these deferred tax asset balances. When Canon deter-mines that certain deferred tax assets may not be recover-able, the amounts, which may not be realized, are charged to income tax expense and will adversely affect net income.
Employee retirement and severance benefit plansCanon has significant employee retirement and severance benefit obligations that are recognized based on actuarial val-uations. Inherent in these valuations are key assumptions, including discount rates and expected return on plan assets. Management must consider current market conditions, includ-ing changes in interest rates, in selecting these assumptions. Other assumptions include assumed rate of increase in com-pensation levels, mortality rate, and withdrawal rate. Changes in assumptions inherent in the valuation are reasonably likely to occur from period to period. Actual results that differ from the assumptions are accumulated and amortized over future periods and, therefore, generally affect future pension expenses. While management believes that the assumptions used are appropriate, the differences may affect employee retirement and severance benefit costs in the future.
In preparing its financial statements for 2017, Canon esti-mated a weighted-average discount rate used to determine benefit obligations of 0.6% for Japanese plans and 2.2% for foreign plans and a weighted-average expected long-term rate of return on plan assets of 3.1% for Japanese plans and 4.2% for foreign plans. In estimating the discount rate, Canon uses available information about rates of return on high-qual-ity fixed-income government and corporate bonds currently available and expected to be available during the period to the maturity of the pension benefits. Canon establishes the expected long-term rate of return on plan assets based on management’s expectations of the long-term return of the various plan asset categories in which it invests. Management develops expectations with respect to each plan asset category based on actual historical returns and its current expectations for future returns.
CANON ANNUAL REPORT 2017 37
STRATEGYBUSINESS SEGMENT/
CORPORATE STRUCTURE FINANCIAL SECTION CORPORATE DATA
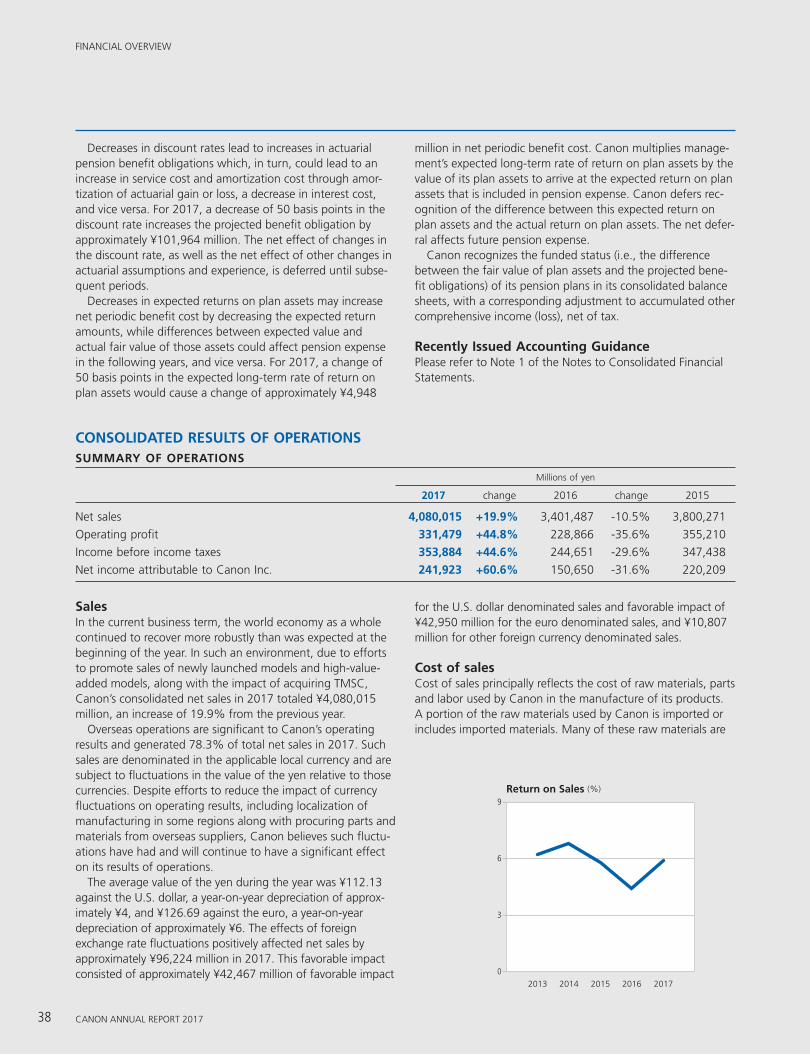
Decreases in discount rates lead to increases in actuarial pension benefit obligations which, in turn, could lead to an increase in service cost and amortization cost through amor-tization of actuarial gain or loss, a decrease in interest cost, and vice versa. For 2017, a decrease of 50 basis points in the discount rate increases the projected benefit obligation by approximately ¥101,964 million. The net effect of changes in the discount rate, as well as the net effect of other changes in actuarial assumptions and experience, is deferred until subse-quent periods.
Decreases in expected returns on plan assets may increase net periodic benefit cost by decreasing the expected return amounts, while differences between expected value and actual fair value of those assets could affect pension expense in the following years, and vice versa. For 2017, a change of 50 basis points in the expected long-term rate of return on plan assets would cause a change of approximately ¥4,948
million in net periodic benefit cost. Canon multiplies manage-ment’s expected long-term rate of return on plan assets by the value of its plan assets to arrive at the expected return on plan assets that is included in pension expense. Canon defers rec-ognition of the difference between this expected return on plan assets and the actual return on plan assets. The net defer-ral affects future pension expense.
Canon recognizes the funded status (i.e., the difference between the fair value of plan assets and the projected bene-fit obligations) of its pension plans in its consolidated balance sheets, with a corresponding adjustment to accumulated other comprehensive income (loss), net of tax.
Recently Issued Accounting GuidancePlease refer to Note 1 of the Notes to Consolidated Financial Statements.
SalesIn the current business term, the world economy as a whole continued to recover more robustly than was expected at the beginning of the year. In such an environment, due to efforts to promote sales of newly launched models and high-value-added models, along with the impact of acquiring TMSC, Canon’s consolidated net sales in 2017 totaled ¥4,080,015 million, an increase of 19.9% from the previous year.
Overseas operations are significant to Canon’s operating results and generated 78.3% of total net sales in 2017. Such sales are denominated in the applicable local currency and are subject to fluctuations in the value of the yen relative to those currencies. Despite efforts to reduce the impact of currency fluctuations on operating results, including localization of manufacturing in some regions along with procuring parts and materials from overseas suppliers, Canon believes such fluctu-ations have had and will continue to have a significant effect on its results of operations.
The average value of the yen during the year was ¥112.13 against the U.S. dollar, a year-on-year depreciation of approx-imately ¥4, and ¥126.69 against the euro, a year-on-year depreciation of approximately ¥6. The effects of foreign exchange rate fluctuations positively affected net sales by approximately ¥96,224 million in 2017. This favorable impact consisted of approximately ¥42,467 million of favorable impact
for the U.S. dollar denominated sales and favorable impact of ¥42,950 million for the euro denominated sales, and ¥10,807 million for other foreign currency denominated sales.
Cost of salesCost of sales principally reflects the cost of raw materials, parts and labor used by Canon in the manufacture of its products. A portion of the raw materials used by Canon is imported or includes imported materials. Many of these raw materials are
FINANCIAL OVERVIEW
SUMMARY OF OPERATIONS
Millions of yen
2017 change 2016 change 2015
Net sales 4,080,015 +19.9% 3,401,487 -10.5% 3,800,271
Operating profit 331,479 +44.8% 228,866 -35.6% 355,210
Income before income taxes 353,884 +44.6% 244,651 -29.6% 347,438
Net income attributable to Canon Inc. 241,923 +60.6% 150,650 -31.6% 220,209
CONSOLIDATED RESULTS OF OPERATIONS
Return on Sales (%)
9
6
3
02016 2017201520142013
CANON ANNUAL REPORT 201738

subject to fluctuations in world market prices accompanied by fluctuations in foreign exchange rates that may affect Canon’s cost of sales. Other components of cost of sales include depreciation expenses, maintenance expenses, light and fuel expenses, and rent expenses. The ratios of cost of sales to net sales for 2017 and 2016 were 51.2% and 50.8%, respectively.
Gross profit Canon’s gross profit in 2017 increased by 19.0% to ¥1,992,691 million from 2016. The gross profit ratio also decreased by 0.4 points year on year to 48.8%. The decrease in the gross profit ratio is primarily due to the effect of product mix.
Operating expensesThe major components of operating expenses are payroll, R&D, advertising expenses and other marketing expenses. Operating expenses increased 15.0% year on year to ¥1,661,212 million owing to such factors as the increase in foreign-currency-denominated operating expenses after con-version into yen due to the depreciation of the yen, the impact of acquiring TMSC, and the impact of recognizing impairment losses on goodwill.
Operating profitOperating profit in 2017 increased 44.8% from 2016 to a total of ¥331,479 million. The ratio of operating profit to net sales increased 1.4 points to 8.1% from 2016.
Other income (deductions)Other income (deductions) for 2017 was ¥22,405 million, an increase of ¥6,620 million from 2016 mainly due to gain on securities contributed to retirement benefit trust which was partially offset by foreign currency exchange losses.
Income before income taxesIncome before income taxes in 2017 was ¥353,884 million, an increase of 44.6% from 2016, and constituted 8.7% of net sales.
Income taxesIncome taxes in 2017 increased by ¥15,343 million from 2016. The effective tax rate for 2017 was 27.7%, which was lower than the statutory tax rate in Japan. This was mainly due to the effect of reversal of deferred tax liabilities derived from US tax reform in 2017 and the tax credit for R&D expenses which were partially offset by the impact of impairment losses on goodwill.
Net income attributable to Canon Inc.As a result, net income attributable to Canon Inc. in 2017 increased by 60.6% to ¥241,923 million, which represents 5.9% of net sales.
Segment informationCanon divides its businesses into four segments: the Office Business Unit, the Imaging System Business Unit, the Medical System Business Unit which was newly established in 2017, and the Industry and Others Business Unit.The Office Business Unit mainly includes Office multifunc-tion devices (MFDs) / Laser multifunction printers (MFPs) / Laser printers / Digital production printing systems / High speed continuous feed printers / Wide-format printers / Document solutionsThe Imaging System Business Unit mainly includes Interchangeable-lens digital cameras / Digital compact cameras / Digital camcorders / Digital cinema cameras / Interchangeable lenses / Compact photo printers / Inkjet printers / Large format inkjet printers / Commercial photo printers / Image scanners / Multimedia projectors / Broadcast equipment / Calculators The Medical System Business Unit mainly includes Digital radiography systems / Diagnostic X-ray systems / Computed tomography / Magnetic resonance imaging / Diagnostic ultrasound systems / Clinical chemistry analyzers / Ophthalmic equipmentThe Industry and Others Business Unit mainly includes Semiconductor lithography equipment / FPD (Flat panel dis-play) lithography equipment / Vacuum thin-film deposition equipment / Organic LED (OLED) panel manufacturing equip-ment / Die bonders / Micromotors / Network cameras / Handy terminals / Document scanners
Sales by Segment (Billions of yen)
Office Business UnitImaging SystemBusiness UnitMedical SystemBusiness UnitIndustry and OthersBusiness UnitEliminations
5,000
3,000
2,000
1,000
0
4,000
2016 2017201520142013
Sales by Geographic Area (Billions of yen)
JapanAmericasEuropeAsia and Oceania
5,000
3,000
2,000
1,000
0
4,000
2016 2017201520142013
CANON ANNUAL REPORT 2017 39
STRATEGYBUSINESS SEGMENT/
CORPORATE STRUCTURE FINANCIAL SECTION CORPORATE DATA

SALES BY REGION
Millions of yen
2017 change 2016 change 2015
Japan 884,828 +25.2% 706,979 -1.0% 714,280
Americas 1,107,515 +14.9% 963,544 -15.8% 1,144,422
Europe 1,028,415 +12.6% 913,523 -15.0% 1,074,366
Asia and Oceania 1,059,257 +29.6% 817,441 -5.7% 867,203
Total 4,080,015 +19.9% 3,401,487 -10.5% 3,800,271
Note: This summary of net sales by geographic area is determined by the location where the product is shipped to the customers.
SALES BY SEGMENT
Millions of yen
2017 change 2016 change 2015
Office 1,865,928 +3.2% 1,807,819 -14.4% 2,110,816
Imaging System 1,136,188 +3.7% 1,095,289 -13.3% 1,263,835
Medical System 436,187 — — — —
Industry and Others 731,704 +25.2% 584,660 +11.4% 524,651
Eliminations (89,992) — (86,281) — (99,031)
Total 4,080,015 +19.9% 3,401,487 -10.5% 3,800,271
FINANCIAL OVERVIEW
Sales by segment Within the Office Business Unit, unit sales of office MFDs increased from the previous year and achieved higher growth than the market average, supported by steady sales of next-generation color models designed to strengthen the product lineup such as the newly launched color A3 (12”x18”) imag-eRUNNER ADVANCE C3500 series for small- and medium-size offices. Among high-speed continuous-feed printers, unit sales of the Océ-produced VarioPrint i300, a high-speed sheet-fed color inkjet press that offers superior low-running-cost perfor-mance, increased. As for laser printers, sales of both hardware and consumables increased from the previous year, supported by steady sales of new models that achieve low power con-sumption and compact body designs. These factors resulted in total sales for the business unit of ¥1,865,928 million, a year-on-year increase of 3.2%, while operating profit totaled ¥180,648 million, a year-on-year increase of 6.6%.
Within the Imaging System Business Unit, while the pace of decline in demand for interchangeable-lens digital cam-eras is gradually decelerating, the sales of the advanced-ama-teur-models —including the EOS 6D Mark II—enjoyed solid demand, allowing Canon to maintain the top share, mainly in the United States, Europe, and Japan. As for compact-sys-tem cameras, the advanced-amateur-model EOS M6 and the entry-level EOS M100 enjoyed strong demand. As for digi-tal compact cameras, amid the shrinking market, unit sales remained at the same level as the previous year, supported by the increased sales of such high-value-added models as the newly launched G9 X Mark II—part of the high-image-quality PowerShot G-series lineup. As for inkjet printers, the
newly designed home-use TS-series, refillable ink tank mod-els targeting emerging countries and the imagePROGRAF PRO series of large format inkjet printer targeting the professional photo and graphic art markets enjoyed strong demand, result-ing in unit sales increasing from the previous year. As a result, sales for the business unit increased by 3.7% year on year to ¥1,136,188 million, while operating profit totaled ¥175,913 million, a year-on-year increase of 21.8%.
Within the Medical System Business Unit, TMSC’s com-puted tomography (“CT”) products increased the sales and maintained the top share in the Japanese market thanks to the solid sales of the newly launched Aquilion Precision CT scanner, which delivers the industry’s highest level of high-res-olution imaging. As for diagnostic ultrasound systems, sale of the Aplio i-series, which delivers proprietary high-resolution imaging technology, remained firm. As a result, sales for the business unit totaled ¥436,187 million, while operating profit totaled ¥22,505 million.
In the Industry and Others Business Unit, unit sales of semi-conductor lithography equipment increased from the previ-ous year as a result of increasing demand for memory devices used in data centers. Additionally, sales of FPD lithography equipment and manufacturing equipment for OLED pan-els increased significantly in response to continued grow-ing demand for high-definition OLED displays used in mobile devices. As for network cameras, amid increasing market demand, Axis enjoyed solid sales, resulting in a considerable sales increase compared with the previous year. Consequently, sales for the business unit increased by 25.2% year on year to ¥731,704 million, while operating profit grew by ¥49,340
CANON ANNUAL REPORT 201740

million from the previous year to ¥56,788 million.Intersegment sales of ¥89,992 million, representing 2.2%
of total sales, are eliminated from total sales for the four seg-ments, and are described as “Eliminations”.
Sales by geographic areaPlease refer to the table of sales by geographic area in Note 21 of the Notes to Consolidated Financial Statements.
In Japan, net sales increased 25.2% from the previous year mainly due to the impact of acquiring TMSC.
In the Americas, net sales increased 14.9% from the previ-ous year due to the impact of acquiring TMSC, solid sales of network cameras and the positive effects of favorable currency exchange rates.
In Europe, net sales increased 12.6% from the previous year due to the impact of acquiring TMSC, solid sales of net-work cameras and the positive effects of favorable currency exchange rates.
In Asia and Oceania, net sales increased by 29.6% from the previous year due to the impact of acquiring TMSC and strong sales of manufacturing equipment for OLED displays which is sold by Canon Tokki and manufacturing equipment for FPD (Flat panel display).
Operating profit by segmentPlease refer to the table of segment information in Note 21 of the Notes to Consolidated Financial Statements.
Operating profit for the Office Business Unit in 2017 increased by 6.6% from the previous year to ¥180,648 mil-lion, owing to the positive effects of favorable currency exchange rates.
Operating profit for the Imaging System Business Unit in 2017 increased by 21.8% from the previous year to ¥175,913 million, owing to the improvement in profitability from the sales shift to high-added-value models in cameras, along with the positive effects of favorable currency exchange rates.
Operating profit for the Medical System Business Unit, which was newly established from this year, was ¥22,505 mil-lion in 2017.
Operating profit for the Industry and Others Business Unit in 2017 grew by ¥49,340 million to ¥56,788 million thanks to strong sales of manufacturing equipment for OLED displays and network cameras.
FOREIGN OPERATIONS AND FOREIGN CURRENCY TRANSACTIONSCanon’s marketing activities are performed by subsidiaries in various regions in local currencies, while the cost of sales is generally in yen. Given Canon’s current operating structure, appreciation of the yen has a negative impact on net sales and the gross profit ratio. To reduce the financial risks from changes in foreign exchange rates, Canon utilizes derivative financial instruments, which consist principally of forward cur-rency exchange contracts.
The operating profit on foreign operation sales is usually
lower than that from domestic operations because foreign operations consist mainly of marketing activities. Marketing activities are generally less profitable than production activities, which are mainly conducted by the Company and its domestic subsidiaries. Please refer to the table of geographic information in Note 21 of the Notes to Consolidated Financial Statements.
LIQUIDITY AND CAPITAL RESOURCES Cash and cash equivalents increased by ¥91,621 million to ¥721,814 million in fiscal 2017 compared to the previous year. Canon’s cash and cash equivalents are primarily denomi-nated in Japanese yen and in U.S. dollars, with the remainder denominated in other currencies.
Net cash provided by operating activities increased by ¥90,274 million to ¥590,557 million in fiscal 2017 compared to the previous year thanks to the increase in net income. The major component of Canon’s cash inflow is cash received from customers, and the major components of Canon’s cash out-flow are payments for parts and materials, selling, general and administrative expenses, R&D expenses and income taxes.
For fiscal 2017, cash inflow from cash received from custom-ers increased thanks to sales growth. There were no significant changes in Canon’s collection rates. Cash outflow for pay-ments for parts and materials, selling, general and administra-tive expenses and R&D expenses increased mainly due to sales growth. Cash outflow for payments for income taxes decreased thanks to a decrease in taxable income in fiscal 2016.
Net cash used in investing activities decreased by ¥672,115 million to ¥165,010 million in fiscal 2017. This mainly reflects the acquisition of TMSC in fiscal 2016.
Canon defines “free cash flow” as cash flows from operat-ing activities less cash flows from investing activities. For fiscal 2017, free cash flow increased by ¥762,389 million to positive ¥425,547 million as compared with negative ¥336,842 million for fiscal 2016.Note: “Free cash flow” is non-GAAP measure. Refer to “Non-GAAP Financial
Measures” section for the explanation and the reconciliation to the reported GAAP measure.
Canon’s management places importance on cash flow man-agement and frequently monitors this indicator. Furthermore, Canon’s management believes that this indicator is significant in understanding Canon’s current liquidity and the alterna-tives of use in financing activities because it takes into con-sideration its operating and investing activities and believes that such indicator is beneficial to an investor’s understand-ing. Canon refers to this indicator together with relevant U.S. GAAP financial measures shown in its consolidated statements of cash flows and consolidated balance sheets for cash avail-ability analysis.
Net cash provided in financing activities totaled negative ¥340,464 million in fiscal 2017, mainly resulting from the div-idend payout of ¥162,887 million, the repayment for long-term loans of ¥126,578 million and the acquisition of own shares in ¥50,036 million. The Company paid dividends in fis-cal 2017 of ¥160.00 per share.
CANON ANNUAL REPORT 2017 41
STRATEGYBUSINESS SEGMENT/
CORPORATE STRUCTURE FINANCIAL SECTION CORPORATE DATA

To the extent Canon relies on external funding for its liquid-ity and capital requirements, it generally has access to vari-ous funding sources, including the issuance of additional share capital, issuance of corporate bond or loans. While Canon has been able to obtain funding from its traditional financing sources and from the capital markets, and believes it will con-tinue to be able to do so in the future, there can be no assur-ance that adverse economic or other conditions will not affect Canon’s liquidity or long-term funding in the future.
Short-term loans (including the current portion of long-term debt) increased to ¥39,328 million at December 31, 2017 compared with ¥1,850 million at December 31, 2016, which was mainly due to a new consolidation of subsidiary. Long-term debt (excluding the current portion) amounted to ¥493,238 million at December 31, 2017 compared with ¥611,289 million at December 31, 2016 thanks to the repay-ment for long-term loans.
Canon’s long-term debt mainly consists of bank borrowings and lease obligations.
In order to facilitate access to global capital markets, Canon obtains credit ratings from two rating agencies: Moody’s Investors Services, Inc. (“Moody’s”) and Standard and Poor’s Ratings Services (“S&P”). In addition, Canon maintains a rating from Rating and Investment Information, Inc. (“R&I”), a rating agency in Japan, for access to the Japanese capital market.
As of March 9, 2018, Canon’s debt ratings are: Moody’s: Aa3 (long-term); S&P: AA- (long-term), A-1+ (short-term); and R&I: AA+ (long-term). Canon does not have any rating down-grade triggers that would accelerate the maturity of a material amount of its debt. A downgrade in Canon’s credit ratings or outlook could, however, increase the cost of its borrowings.
Canon’s management policy in recent periods to optimize inventory levels is intended to maintain an appropriate balance among relevant imperatives, including minimizing working capital, avoiding undue exposure to the risk of inventory obso-lescence, and maintaining the ability to sustain sales despite the occurrence of unexpected disasters.
Reflecting the foregoing circumstances, Canon’s total inven-tory turnover ratios were 49, 59, and 47 days at the end of the fiscal years 2017, 2016, and 2015, respectively. The
increase of inventory turnover in 2016 was primarily due to the acquisition of TMSC on December 19, 2016. If this factor were excluded, the inventory turnover would show 50 days.
Increase in property, plant and equipment on an accrual basis in 2017 amounted to ¥147,542 million compared with ¥171,597 million in 2016 and ¥195,120 million in 2015. For 2018, Canon projects its increase in property, plant and equip-ment will be approximately ¥200,000 million.
Employer contributions to Canon’s worldwide defined ben-efit pension plans were ¥50,628 million in 2017, ¥14,575 million in 2016 and ¥19,565 million in 2015. Employer con-tributions to Canon’s worldwide defined contribution pension plans were ¥18,979 million in 2017, ¥17,603 million in 2016, and ¥17,277 million in 2015. In addition, employer contribu-tions to the multiemployer pension plan of certain subsidiar-ies were ¥4,165 million in 2017, ¥3,482 million in 2016 and ¥3,864 million in 2015.
Working capital in 2017 increased by ¥6,790 million to ¥1,123,169 million, compared with ¥1,116,379 million in 2016 and ¥1,241,850 million in 2015. Canon believes its working capital will be sufficient for its requirements for the foreseeable future. Canon’s capital requirements are primar-ily dependent on management’s business plans regarding the levels and timing of purchases of fixed assets and investments. The working capital ratio (ratio of current assets to current lia-bilities) for 2017 was 2.01 compared to 2.14 for 2016 and to 2.52 for 2015.
Return on assets (net income attributable to Canon Inc. divided by the average of total assets) was 4.7% in 2017, compared to 3.1% in 2016 and 5.0% in 2015.
Return on Canon Inc. shareholders’ equity (net income attributable to Canon Inc. divided by the average of total Canon Inc. shareholders’ equity) was 8.6% in 2017 compared with 5.2% in 2016 and 7.4% in 2015.
FINANCIAL OVERVIEW
Working Capital Ratio3.0
2.5
2.0
1.5
1.0
0
0.5
2016 2017201520142013
Return on Canon Inc.Shareholders’ Equity (%)
12
9
6
3
02016 2017201520142013
Increase in Property,Plant and Equipment (Billions of yen)
300
200
0
100
2016 2017201520142013
CANON ANNUAL REPORT 201742

FREE CASH FLOW
Millions of yen
2017 2016
Net cash provided by operating activities 590,557 500,283
Net cash used in investing activities (165,010) (837,125)
Free cash flow 425,547 (336,842)
less financial risk.Canon would have to perform under a guarantee if the bor-
rower defaults on a payment within the contract terms. The contract terms are 1 year to 30 years in case of employees with housing loans, and 1 year to 7 years in case of affiliates and other companies with lease obligations and bank loans. The maximum amount of undiscounted payments Canon would have had to make in the event of default is ¥6,059 mil-lion at December 31, 2017. The carrying amounts of the liabil-ities recognized for Canon’s obligations as a guarantor under those guarantees at December 31, 2017 were not significant.
The debt to total assets ratios were 10.2%, 11.9% and 0.0% as of December 31, 2017, 2016 and 2015, respectively. Canon had short-term loans and long-term debt of ¥532,566 million as of December 31, 2017, ¥613,139 million as of December 31, 2016 and ¥1,569 million as of December 31, 2015.
Non-GAAP Financial MeasuresWe have reported our financial results in accordance with U.S. generally accepted accounting principles (“U.S. GAAP”). In addition, we have discussed our results using the combination
of two GAAP cash flow measures, Net cash provided by oper-ating activities and Net cash used for investing activities, which we refer to as “Free Cash Flow” which is non-GAAP measure. We believe this measure is beneficial to an investor’s under-standing on Canon’s current liquidity and the alternatives of use in financing activities because it takes into consideration its operating and investing activities. A reconciliation of these non-GAAP financial measures and the most directly compa-rable measures calculated and presented in accordance with GAAP are set forth on the following table.
OFF-BALANCE SHEET ARRANGEMENTS As part of its ongoing business, Canon does not participate in transactions that generate relationships with unconsolidated entities or financial partnerships, such as entities often referred to as structured finance or special purpose entities established for the purpose of facilitating off-balance sheet arrangements or other contractually narrow or limited purposes.
Canon provides guarantees for its employees, affiliates and other companies. The guarantees for the employees are prin-cipally made for their housing loans. The guarantees for affili-ates and other companies are made for their lease obligations and bank loans to ensure that those companies operate with
CONTRACTUAL OBLIGATIONS AND COMMERCIAL COMMITMENTSThe following summarizes Canon’s contractual obligations at December 31, 2017.
Payments due by period
Millions of yen Total Less than 1 year 1-3 years 3-5 years More than 5 years
Contractual obiligations:
Long-term debt:
Loan from the banks 490,000 — — 490,000 —
Other debt 9,168 5,930 2,776 390 72
Operating lease obligations 111,502 28,414 37,622 22,495 22,971
Purchase commitments for:
Property, plant and equipment 36,199 36,199 — — —
Parts and raw materials 135,649 135,649 — — —
Other long-term liabilities:
Contribution to defined benefit pension plans 36,750 36,750 — — —
Total 819,268 242,942 40,398 512,885 23,043
Note: The table does not include provisions for uncertain tax positions and related accrued interest and penalties, as the specific timing of future payments related to these obligations cannot be projected with reasonable certainty. See Note 12, Income Taxes in the Notes to Consolidated Financial Statements for further details. Contribution to defined benefit pension plans reflects the expected amount only for the next fiscal year, since contributions beyond the next fiscal year are not currently determinable due to uncertainties related to changes in actuarial assumptions, returns on plan assets and changes to plan membership.
CANON ANNUAL REPORT 2017 43
STRATEGYBUSINESS SEGMENT/
CORPORATE STRUCTURE FINANCIAL SECTION CORPORATE DATA
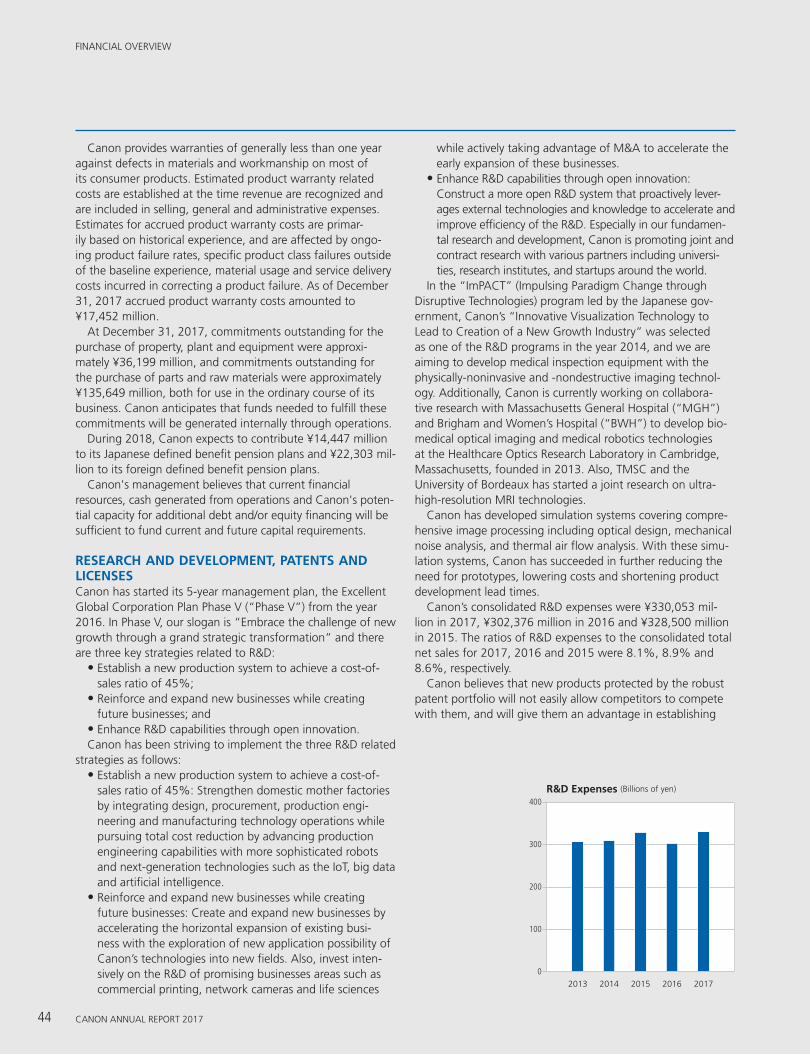
R&D Expenses (Billions of yen)
400
300
200
100
02016 2017201520142013
FINANCIAL OVERVIEW
Canon provides warranties of generally less than one year against defects in materials and workmanship on most of its consumer products. Estimated product warranty related costs are established at the time revenue are recognized and are included in selling, general and administrative expenses. Estimates for accrued product warranty costs are primar-ily based on historical experience, and are affected by ongo-ing product failure rates, specific product class failures outside of the baseline experience, material usage and service delivery costs incurred in correcting a product failure. As of December 31, 2017 accrued product warranty costs amounted to ¥17,452 million.
At December 31, 2017, commitments outstanding for the purchase of property, plant and equipment were approxi-mately ¥36,199 million, and commitments outstanding for the purchase of parts and raw materials were approximately ¥135,649 million, both for use in the ordinary course of its business. Canon anticipates that funds needed to fulfill these commitments will be generated internally through operations.
During 2018, Canon expects to contribute ¥14,447 million to its Japanese defined benefit pension plans and ¥22,303 mil-lion to its foreign defined benefit pension plans.
Canon's management believes that current financial resources, cash generated from operations and Canon's poten-tial capacity for additional debt and/or equity financing will be sufficient to fund current and future capital requirements.
RESEARCH AND DEVELOPMENT, PATENTS AND LICENSESCanon has started its 5-year management plan, the Excellent Global Corporation Plan Phase V (“Phase V”) from the year 2016. In Phase V, our slogan is “Embrace the challenge of new growth through a grand strategic transformation” and there are three key strategies related to R&D:
• Establish a new production system to achieve a cost-of-sales ratio of 45%;
• Reinforce and expand new businesses while creating future businesses; and
• Enhance R&D capabilities through open innovation.Canon has been striving to implement the three R&D related
strategies as follows:• Establish a new production system to achieve a cost-of-
sales ratio of 45%: Strengthen domestic mother factories by integrating design, procurement, production engi-neering and manufacturing technology operations while pursuing total cost reduction by advancing production engineering capabilities with more sophisticated robots and next-generation technologies such as the IoT, big data and artificial intelligence.
• Reinforce and expand new businesses while creating future businesses: Create and expand new businesses by accelerating the horizontal expansion of existing busi-ness with the exploration of new application possibility of Canon’s technologies into new fields. Also, invest inten-sively on the R&D of promising businesses areas such as commercial printing, network cameras and life sciences
while actively taking advantage of M&A to accelerate the early expansion of these businesses.
• Enhance R&D capabilities through open innovation: Construct a more open R&D system that proactively lever-ages external technologies and knowledge to accelerate and improve efficiency of the R&D. Especially in our fundamen-tal research and development, Canon is promoting joint and contract research with various partners including universi-ties, research institutes, and startups around the world.
In the “ImPACT” (Impulsing Paradigm Change through Disruptive Technologies) program led by the Japanese gov-ernment, Canon’s “Innovative Visualization Technology to Lead to Creation of a New Growth Industry” was selected as one of the R&D programs in the year 2014, and we are aiming to develop medical inspection equipment with the physically-noninvasive and -nondestructive imaging technol-ogy. Additionally, Canon is currently working on collabora-tive research with Massachusetts General Hospital (“MGH”) and Brigham and Women’s Hospital (“BWH”) to develop bio-medical optical imaging and medical robotics technologies at the Healthcare Optics Research Laboratory in Cambridge, Massachusetts, founded in 2013. Also, TMSC and the University of Bordeaux has started a joint research on ultra-high-resolution MRI technologies.
Canon has developed simulation systems covering compre-hensive image processing including optical design, mechanical noise analysis, and thermal air flow analysis. With these simu-lation systems, Canon has succeeded in further reducing the need for prototypes, lowering costs and shortening product development lead times.
Canon’s consolidated R&D expenses were ¥330,053 mil-lion in 2017, ¥302,376 million in 2016 and ¥328,500 million in 2015. The ratios of R&D expenses to the consolidated total net sales for 2017, 2016 and 2015 were 8.1%, 8.9% and 8.6%, respectively.
Canon believes that new products protected by the robust patent portfolio will not easily allow competitors to compete with them, and will give them an advantage in establishing
CANON ANNUAL REPORT 201744

Millions of yen
Available-for-sale securities Cost Fair value
Debt securitiesDue within one year 1,222 1,222Due after one year through five years 605 605Due after five years 340 506
Fund trusts 122 124Equity securities 10,965 20,901
13,254 23,358
standards in the market and industry.Canon obtained the third greatest number of private sector
patents in 2017, according to the United States patent annual list, released by IFI CLAIMS® Patent Services.
MARKET RISK EXPOSURESCanon is exposed to market risks, including changes in foreign currency exchange rates, interest rates and prices of market-able securities and investments. In order to hedge the risks of
changes in foreign currency exchange rates, Canon uses deriv-ative financial instruments.
Equity price riskCanon holds marketable securities included in current assets, which consist generally of highly-liquid and low-risk instru-ments. Investments included in noncurrent assets are held as long-term investments. Canon does not hold marketable secu-rities and investments for trading purposes.
Maturities and fair values of such marketable securities and investments with original maturities of more than three months, all of which were classified as available-for-sale securities, were as follows at December 31, 2017.
Foreign currency exchange rate and interest rate riskCanon operates internationally, exposing it to the risk of changes in foreign currency exchange rates. Derivative finan-cial instruments are comprised principally of foreign currency exchange contracts utilized by the Company and certain of its subsidiaries to reduce the risk. Canon assesses foreign cur-rency exchange rate risk by continually monitoring changes in the exposures and by evaluating hedging opportunities. Canon does not hold or issue derivative financial instruments for trading purposes. Canon is also exposed to credit-related losses in the event of non-performance by counterparties to derivative financial instruments, but it is not expected that any counterparties will fail to meet their obligations. Most of the counterparties are internationally recognized financial
institutions and selected by Canon taking into account their financial condition, and contracts are diversified across a num-ber of major financial institutions.
Canon’s international operations expose Canon to the risk of changes in foreign currency exchange rates. Canon uses foreign exchange contracts to manage certain foreign currency exchange exposures principally from the exchange of U.S. dol-lars and euros into Japanese yen. These contracts are primar-ily used to hedge the foreign currency exposure of forecasted intercompany sales and intercompany trade receivables which are denominated in foreign currencies. In accordance with Canon’s policy, a specific portion of foreign currency exposure resulting from forecasted intercompany sales are hedged using foreign exchange contracts which principally mature within three months.
CANON ANNUAL REPORT 2017 45
STRATEGYBUSINESS SEGMENT/
CORPORATE STRUCTURE FINANCIAL SECTION CORPORATE DATA

FINANCIAL OVERVIEW
Millions of yen U.S.$ Euro Others Total
Forwards to sell foreign currencies: Contract amounts 119,128 127,449 25,986 272,563 Estimated fair value 61 (1,720) (426) (2,085)Forwards to buy foreign currencies: Contract amounts 38,775 2,399 4,994 46,168
Estimated fair value (448) (187) 5 (630)
Canon expects that fair value changes and cash flows result-ing from reasonable near-term changes in interest rates will be immaterial. Accordingly, Canon believes interest rate risk is insignificant. See also Note 9 of the Notes to Consolidated Financial Statements.
Changes in the fair value of derivative financial instruments designated as cash flow hedges, including foreign currency exchange contracts associated with forecasted intercom-pany sales, are reported in accumulated other comprehen-sive income (loss). These amounts are subsequently reclassified into earnings through other income (deductions) in the same period as the hedged items affect earnings. Substantially all such amounts recorded in accumulated other comprehen-sive income (loss) at year-end are expected to be recognized in earnings over the next twelve months. Canon excludes the time value component from the assessment of hedge effectiveness. Changes in the fair value of a foreign cur-rency exchange contract for the period between the date that the forecasted intercompany sales occur and its matu-rity date are recognized in earnings and not considered hedge ineffectiveness.
The amount of the hedging ineffectiveness was not material for the years ended December 31, 2017, 2016 and 2015. The amounts of net losses excluded from the assessment of hedge effectiveness (time value component) which was recorded in other income (deductions) were ¥332 million, ¥311 million and ¥131 million for the years ended December 31, 2017, 2016 and 2015, respectively.
Canon has entered into certain foreign currency exchange contracts to manage its foreign currency exposures. These for-eign currency exchange contracts have not been designated as hedges. Accordingly, the changes in fair values of these con-tracts are recorded in earnings immediately.
LOOKING FORWARDUnder the corporate philosophy of kyosei—living and work-
ing together for the common good—Canon’s basic manage-ment policy is to contribute to the prosperity and well-being of the world while endeavoring to become a truly excellent global corporation targeting continued growth and development.
Based on this basic management policy, Canon launched the Excellent Global Corporation Plan in 1996 and, from Phase
The following table provides information about Canon’s major derivative financial instruments related to foreign currency exchange transactions existing at December 31, 2017. All of the foreign exchange contracts described in the following table have a contractual maturity date in 2018.
I through to Phase IV, has worked to strengthen its manage-ment base and improve corporate value. In 2016, under the slogan “Embracing the challenge of new growth through a grand strategic transformation,” Canon embarked on a new five-year initiative: Phase V of the Excellent Global Corporation Plan. Under this plan, Canon aims to facilitate growth through structural transformation by reinforcing existing businesses and taking steps to cultivate and strengthen new businesses.
Despite the growing concerns about geopolitical risks, the world economy is expected to continue achieving moderate growth in 2018.
In the businesses in which Canon is involved, for office MFDs, demand for color models is expected to grow mod-erately and make up for the contraction of the market for monochrome models, leading to the same level of demand overall compared with the previous year. Looking at the laser printer market, although the demand in developed countries is expected to decrease, demand in emerging countries con-tinues to recover, resulting in overall demand remaining at the same level as the previous year. For interchangeable-lens digital cameras, demand is expected to decrease moderately. Projections for digital compact cameras indicate continued market contraction, centered mainly on low-priced mod-els, despite solid demand for high-value-added models. With regard to inkjet printers, demand is expected to continue to exceed that of the previous year. As for the medical equip-ment market, demand is expected to remain firm in response to replacement demand for medical equipment in developed countries, increasing medical needs associated with popula-tion growth in emerging countries and changes in the prev-alence of diseases. Looking at industrial equipment, within the semiconductor lithography equipment segment, the mar-ket is expected to enjoy healthy growth due to the increase in demand for memory devices used in data centers and mobile devices. The outlook for FPD lithography equipment and OLED panel manufacturing equipment points to continued active capital investment by panel manufacturers, which is expected to increase demand. The network camera market is also expected to grow in response to the increasing use of network cameras for diverse applications in such areas as marketing support in addition to disaster monitoring and crime preven-tion applications.
CANON ANNUAL REPORT 201746

Amid these conditions, 2018 marks the year of accelerated progress toward the target “to achieve net sales of 5.0 tril-lion yen” under Phase V (2016 - 2020) of “Excellent Global Corporation Plan” with the new business portfolio includ-ing the four new business areas (commercial printing, net-work cameras, healthcare, and industrial equipment), and will work to address the following key challenges under the theme of “Pursue total optimization and prioritize profits to com-plete our grand strategic transformation.” Canon will once again return to the slogans of “total optimization” and “focus on profit,” which Canon have upheld since 1996, and review everything from scratch based on them aiming to raise the level of the overall management one step higher.
Strengthen capability to research leading-edge technology Strengthen research and analysis functions that contrib-ute to the expansion of strategic initiatives that response to changing times and rapid and constant innovation. Comprehensively strengthen capability to research not only global leading-edge technology, but also political, eco-nomic, industrial, social and other areas.
Strengthen product development capability Focus resources in areas that hold future promise, promot-ing even more strictly the selection and concentration of development themes. Efficiently accelerate technological development through collaboration and the use of exter-nal research institutes, and start-up enterprises. Further improve quality, cost, and delivery, promoting such initia-tives as elimination of prototypes by improving simulation technology, optimal designs for robot assembly, and the sharing of product platforms. Enhance software develop-ment capability and work to obtain the optimal balance between outsourcing and in-house production.
Comprehensively strengthen manufacturing prowessAccelerate reduction in the production cost ratio of new businesses. Establish an advanced and efficient produc-tion system that brings together, development, produc-tion engineering, and manufacturing, and strongly promote the expansion of this via the “mother factory” concept. Thoroughly pursue cost reduction, expanding the in-house production of production equipment and parts that are shared among various products in addition to key compo-nents. Construct a globally optimized manufacturing sys-tem, which enables monitoring of costs in real time by country and region. Eradicate waste in product develop-ment stage, having product development and quality orga-nizations work in unison.
Comprehensively strengthen strategic procurement functionFurther strengthen and accelerate cooperation with world-wide suppliers in the global procurement network developed so far. Promote in-house production of parts and materials and realize cost reduction by promoting standardization of parts and adoption of general-purpose components.
Reform sales organizations to correspond to market changesCultivate global sales engineers essential for B2B busi-nesses such as commercial printing and network camera, and while striving to enhance the capabilities of these sales engineers, work to strengthen local service support systems with a focus on sales companies. Carry out the optimiza-tion of sales channels to correspond to changes in product and market landscapes, such as adapting to e-commerce.
Establish a human resource management system that adapts to the changing timesBuild a human resource development system, a personnel system that enables a wide range of career paths that are in step with changes in the business environment and times.
Forward looking statements The foregoing discussion and other disclosure in this report contains forward-looking statements that reflect manage-ment’s current views with respect to certain future events and financial performance. Actual results may differ materially from those projected or implied in the forward-looking state-ments. Further, certain forward-looking statements are based upon assumptions of future events that may not prove to be accurate. The following important factors could cause actual results to differ materially from those projected or implied in any forward-looking statements: foreign currency exchange rate fluctuations; the uncertainty of Canon’s ability to imple-ment its plans to localize production and other measures to reduce the impact of foreign currency exchange rate fluctua-tions; uncertainty as to economic conditions in Canon’s major markets; uncertainty of continued demand for Canon’s high-value-added products; Canon’s ability to continue to develop products and to market products that incorporate new tech-nology on a timely basis, are competitively priced, and achieve market acceptance; the possibility of losses resulting from for-eign currency transactions designed to reduce financial risks from changes in foreign currency exchange rates; and inven-tory risk due to shifts in market demand.
CANON ANNUAL REPORT 2017 47
STRATEGYBUSINESS SEGMENT/
CORPORATE STRUCTURE FINANCIAL SECTION CORPORATE DATA

Millions of yen (except per share amounts)
2017 2016 2015 2014
Net sales:
Domestic 884,828 706,979 714,280 724,317
Overseas 3,195,187 2,694,508 3,085,991 3,002,935
Total 4,080,015 3,401,487 3,800,271 3,727,252
Percentage of previous year 119.9% 89.5% 102.0% 99.9%
Net income attributable to Canon Inc. 241,923 150,650 220,209 254,797
Percentage of sales 5.9% 4.4% 5.8% 6.8%
Advertising 61,207 58,707 80,907 79,765
Research and development expenses 330,053 302,376 328,500 308,979
Depreciation of property, plant and equipment 189,712 199,133 223,759 213,739
Increase in property, plant and equipment 147,542 171,597 195,120 182,343
Long-term debt, excluding current installments 493,238 611,289 881 1,148
Canon Inc. shareholders’ equity 2,870,630 2,783,129 2,966,415 2,978,184
Total assets 5,198,291 5,138,529 4,427,773 4,460,618
Per share data:
Net income attributable to Canon Inc. shareholders per share:
Basic 222.88 137.95 201.65 229.03
Diluted 222.88 137.95 201.65 229.03
Dividend per share 160.00 150.00 150.00 150.00
Stock price
High 4,472 3,656 4,539 4,045
Low 3,218 2,780 3,402 2,889
Average number of common shares in thousands 1,085,439 1,092,071 1,092,018 1,112,510
Number of employees 197,776 197,673 189,571 191,889
Common Stock Price Range (Tokyo Stock Exchange) (Yen)
8,000
6,000
4,000
2,000
0
7,000
5,000
3,000
1,000
20122011201020092008 20172016201520142013
CANON ANNUAL REPORT 201748
TEN-YEAR FINANCIAL SUMMARY

Notes: U.S. dollar amounts are translated from yen at the rate of U.S.$1 = JPY113, the approximate exchange rate on the Tokyo Foreign Exchange Market as of December 29, 2017.
Thousands of U.S. dollars (except per share amounts)
2013 2012 2011 2010 2009 2008 2017
715,863 720,286 694,450 695,749 702,344 868,280 $ 7,830,336
3,015,517 2,759,502 2,862,983 3,011,152 2,506,857 3,225,881 28,275,991
3,731,380 3,479,788 3,557,433 3,706,901 3,209,201 4,094,161 36,106,327
107.2% 97.8% 96.0% 115.5% 78.4% 91.4% 119.9%
230,483 224,564 248,630 246,603 131,647 309,148 2,140,912
6.2% 6.5% 7.0% 6.7% 4.1% 7.6% 5.9%
86,398 83,134 81,232 94,794 78,009 112,810 541,655
306,324 296,464 307,800 315,817 304,600 374,025 2,920,823
223,158 211,973 210,179 232,327 277,399 304,622 1,678,867
188,826 270,457 226,869 158,976 216,128 361,988 1,305,681
1,448 2,117 3,368 4,131 4,912 8,423 $ 4,364,938
2,910,262 2,598,026 2,551,132 2,645,782 2,688,109 2,659,792 25,403,805
4,242,710 3,955,503 3,930,727 3,983,820 3,847,557 3,969,934 46,002,575
200.78 191.34 204.49 199.71 106.64 246.21 $ 1.97
200.78 191.34 204.48 199.70 106.64 246.20 1.97
130.00 130.00 120.00 120.00 110.00 110.00 1.42
4,115 4,015 4,280 4,520 4,070 5,820 39.58
2,913 2,308 3,220 3,205 2,115 2,215 28.48
1,147,934 1,173,648 1,215,832 1,234,817 1,234,482 1,255,626
194,151 196,968 198,307 197,386 168,879 166,980
CANON ANNUAL REPORT 2017 49
STRATEGYBUSINESS SEGMENT/
CORPORATE STRUCTURE FINANCIAL SECTION CORPORATE DATA

Millions of yen
ASSETS 2017 2016
Current assets:
Cash and cash equivalents (Note 1) 721,814 630,193
Short-term investments (Note 2) 1,965 3,206
Trade receivables, net (Note 3) 650,872 641,458
Inventories (Note 4) 570,033 560,736
Prepaid expenses and other current assets (Notes 6 and 17) 287,965 264,155
Total current assets 2,232,649 2,099,748
Noncurrent receivables (Note 18) 35,444 29,297
Investments (Note 2) 48,320 73,680
Property, plant and equipment, net (Notes 5 and 6) 1,126,620 1,194,976
Intangible assets, net (Notes 7 and 8) 420,972 446,268
Goodwill (Notes 7 and 8) 936,722 936,424
Other assets (Notes 6, 11 and 12) 397,564 358,136
Total assets 5,198,291 5,138,529
LIABILITIES AND EQUITY
Current liabilities:
Short-term loans and current portion of long-term debt (Note 9) 39,328 1,850
Trade payables (Note 10) 380,654 372,269
Accrued income taxes (Note 12) 77,501 30,514
Accrued expenses (Notes 11 and 18) 330,188 304,901
Other current liabilities (Notes 1, 5, and 17) 281,809 273,835
Total current liabilities 1,109,480 983,369
Long-term debt, excluding current installments (Notes 9 and 19) 493,238 611,289
Accrued pension and severance cost (Note 11) 365,582 407,200
Other noncurrent liabilities (Note 12) 133,816 142,049
Total liabilities 2,102,116 2,143,907
Commitments and contingent liabilities (Note 18)
Equity:
Canon Inc. shareholders’ equity:
Common stock
Authorized 3,000,000,000 shares; issued 1,333,763,464 shares in 2017 and 2016 174,762 174,762
Additional paid-in capital 401,386 401,385
Legal reserve (Note 13) 66,879 66,558
Retained earnings (Note 13) 3,429,312 3,350,728
Accumulated other comprehensive income (loss) (Note 14) (143,228) (199,881)
Treasury stock, at cost; 254,007,681shares in 2017 and 241,695,310 shares in 2016 (1,058,481) (1,010,423)
Total Canon Inc. shareholders’ equity 2,870,630 2,783,129
Noncontrolling interests 225,545 211,493
Total equity 3,096,175 2,994,622
Total liabilities and equity 5,198,291 5,138,529
CONSOLIDATED BALANCE SHEETSCanon Inc. and SubsidiariesDecember 31, 2017 and 2016
See accompanying Notes to Consolidated Financial Statements.
CANON ANNUAL REPORT 201750

See accompanying Notes to Consolidated Financial Statements.
See accompanying Notes to Consolidated Financial Statements.
Millions of yen
2017 2016 2015
Consolidated net income 255,860 161,970 231,333Other comprehensive income (loss), net of tax (Note 14): Foreign currency translation adjustments 47,090 (107,666) (55,504) Net unrealized gains and losses on securities (9,362) 997 2,010 Net gains and losses on derivative instruments 2,588 (2,948) 2,785 Pension liability adjustments 21,207 (70,355) (6,543)
61,523 (179,972) (57,252)
Comprehensive income (loss) 317,383 (18,002) 174,081Less: Comprehensive income attributable to noncontrolling interests 18,807 1,745 11,973
Comprehensive income (loss) attributable to Canon Inc. 298,576 (19,747) 162,108
CONSOLIDATED STATEMENTS OF COMPREHENSIVE INCOMECanon Inc. and SubsidiariesYears ended December 31, 2017, 2016 and 2015
Millions of yen
2017 2016 2015
Net sales 4,080,015 3,401,487 3,800,271Cost of sales (Notes 5, 8, 11 and 18) 2,087,324 1,727,654 1,865,887
Gross profit 1,992,691 1,673,833 1,934,384
Operating expenses (Notes 1, 5, 8, 11, 18 and 20): Selling, general and administrative expenses 1,297,247 1,142,591 1,250,674 Research and development expenses 330,053 302,376 328,500 Impairment losses on goodwill 33,912 — —
1,661,212 1,444,967 1,579,174
Operating profit 331,479 228,866 355,210Other income (deductions): Interest and dividend income 6,012 4,762 5,501 Interest expense (818) (1,061) (584) Other, net (Notes 1, 2 and 17) 17,211 12,084 (12,689)
22,405 15,785 (7,772)
Income before income taxes 353,884 244,651 347,438
Income taxes (Note 12) 98,024 82,681 116,105
Consolidated net income 255,860 161,970 231,333
Less: Net income attributable to noncontrolling interests 13,937 11,320 11,124
Net income attributable to Canon Inc. 241,923 150,650 220,209
Yen
Net income attributable to Canon Inc. shareholders per share (Note 16): Basic 222.88 137.95 201.65 Diluted 222.88 137.95 201.65Cash dividends per share 160.00 150.00 150.00
CANON ANNUAL REPORT 2017 51
CONSOLIDATED STATEMENTS OF INCOMECanon Inc. and SubsidiariesYears ended December 31, 2017, 2016 and 2015

See accompanying Notes to Consolidated Financial Statements.
Millions of yen
Commonstock
Additionalpaid-incapital
Legalreserve
Retainedearnings
Accumulatedother
comprehensiveincome (loss)
Treasurystock
TotalCanon Inc.
shareholders’equity
Noncontrollinginterests
Totalequity
Balance at December 31, 2014 174,762 401,563 64,599 3,320,392 28,286 (1,011,418) 2,978,184 162,574 3,140,758
Equity transactions with noncontrolling interests and other (29) 73 44 (29,627) (29,583)Dividends to Canon Inc. shareholders (174,711) (174,711) (174,711)Dividends to noncontrolling interests (3,958) (3,958)
Acquisition of subsidiaries 77,086 77,086
Transfer to legal reserve 690 (690) — —Comprehensive income: Net income 220,209 220,209 11,124 231,333 Other comprehensive income (loss), net of tax (Note 14): Foreign currency translation adjustments (57,592) (57,592) 2,088 (55,504) Net unrealized gains and losses on securities 1,509 1,509 501 2,010 Net gains and losses on derivative instruments 2,785 2,785 — 2,785 Pension liability adjustments (4,803) (4,803) (1,740) (6,543)
Total comprehensive income 162,108 11,973 174,081
Repurchases and reissuance of treasury stock (176) (42) 1,008 790 790
Balance at December 31, 2015 174,762 401,358 65,289 3,365,158 (29,742) (1,010,410) 2,966,415 218,048 3,184,463
Equity transactions with noncontrolling interests and other 27 258 285 (5,270) (4,985)Dividends to Canon Inc. shareholders (163,810) (163,810) (163,810)Dividends to noncontrolling interests (4,077) (4,077)
Acquisition of subsidiaries 1,047 1,047
Transfer to legal reserve 1,269 (1,269) — —Comprehensive income: Net income 150,650 150,650 11,320 161,970 Other comprehensive income (loss), net of tax (Note 14): Foreign currency translation adjustments (101,257) (101,257) (6,409) (107,666) Net unrealized gains and losses on securities 1,196 1,196 (199) 997 Net gains and losses on derivative instruments (2,924) (2,924) (24) (2,948) Pension liability adjustments (67,412) (67,412) (2,943) (70,355)
Total comprehensive income (loss) (19,747) 1,745 (18,002)
Repurchases and reissuance of treasury stock (1) (13) (14) (14)
Balance at December 31, 2016 174,762 401,385 66,558 3,350,728 (199,881) (1,010,423) 2,783,129 211,493 2,994,622
Equity transactions with noncontrolling interests and other 1 1 (1) —Dividends to Canon Inc. shareholders (162,887) (162,887) (162,887)Dividends to noncontrolling interests (4,814) (4,814)
Acquisition of subsidiaries 60 60
Transfer to legal reserve 321 (321) — —Comprehensive income: Net income 241,923 241,923 13,937 255,860 Other comprehensive income (loss), net of tax (Note 14): Foreign currency translation adjustments 44,168 44,168 2,922 47,090 Net unrealized gains and losses on securities (9,767) (9,767) 405 (9,362) Net gains and losses on derivative instruments 2,562 2,562 26 2,588 Pension liability adjustments 19,690 19,690 1,517 21,207
Total comprehensive income (loss) 298,576 18,807 317,383
Repurchases of treasury stock (50,036) (50,036) (50,036)
Reissuance of treasury stock (131) 1,978 1,847 1,847
Balance at December 31, 2017 174,762 401,386 66,879 3,429,312 (143,228) (1,058,481) 2,870,630 225,545 3,096,175
CANON ANNUAL REPORT 201752
CONSOLIDATED STATEMENTS OF EQUITYCanon Inc. and SubsidiariesYears ended December 31, 2017, 2016 and 2015

See accompanying Notes to Consolidated Financial Statements.
Millions of yen
2017 2016 2015
Cash flows from operating activities:Consolidated net income 255,860 161,970 231,333Adjustments to reconcile consolidated net income to net cash provided by operating activities: Depreciation and amortization 261,881 250,096 273,327 Loss on disposal of fixed assets 6,935 5,203 7,975 Equity in earnings of affiliated companies (1,196) (890) (447) Impairment losses on goodwill (Notes 8 and 20) 33,912 — — Gain on securities contributed to retirement benefit trust (Note 2) (17,836) — — Deferred income taxes (17,603) 7,188 4,672 (Increase) decrease in trade receivables 3,563 (4,155) 22,720 Decrease in inventories 2,967 6,156 14,249 Increase (decrease) in trade payables 4,951 56,844 (17,288) Increase (decrease) in accrued income taxes 46,296 (16,456) (8,731) Increase (decrease) in accrued expenses 18,503 (5,256) (25,529) Increase in accrued (prepaid) pension and severance cost 522 5,489 4,622 Other, net (8,198) 34,094 (32,179)
Net cash provided by operating activities 590,557 500,283 474,724
Cash flows from investing activities: Purchases of fixed assets (Note 5) (189,484) (206,971) (252,948) Proceeds from sale of fixed assets (Note 5) 26,444 6,177 3,824 Purchases of available-for-sale securities (2,220) (84) (98) Proceeds from sale and maturity of available-for-sale securities 970 1,181 804 Decrease in time deposits, net 3,373 15,414 47,665 Acquisitions of businesses, net of cash acquired (Note 7) (6,557) (649,570) (251,534) Purchases of other investments (928) (4,460) (1,220) Other, net 3,392 1,188 (112)
Net cash used in investing activities (165,010) (837,125) (453,619)
Cash flows from financing activities: Proceeds from issuance of long-term debt (Note 9) 1,570 610,552 717 Repayments of long-term debt (Note 9) (126,578) (856) (1,350) Increase (decrease) in short-term loans, net (Note 9) 5,628 (80,580) — Purchases of noncontrolling interests — (4,993) (29,570) Dividends paid (162,887) (163,810) (174,711) Repurchases and reissuance of treasury stock (50,034) (14) 790 Other, net (8,163) (4,607) (6,078)
Net cash provided by (used in) financing activities (340,464) 355,692 (210,202)
Effect of exchange rate changes on cash and cash equivalents 6,538 (22,270) (21,870)
Net change in cash and cash equivalents 91,621 (3,420) (210,967)
Cash and cash equivalents at beginning of year 630,193 633,613 844,580
Cash and cash equivalents at end of year 721,814 630,193 633,613
Supplemental disclosure for cash flow information: Cash paid during the year for: Interest 1,026 738 653 Income taxes 71,473 76,714 117,643
CANON ANNUAL REPORT 2017 53
CONSOLIDATED STATEMENTS OF CASH FLOWSCanon Inc. and SubsidiariesYears ended December 31, 2017, 2016 and 2015

1. BASIS OF PRESENTATION AND SIGNIFICANT ACCOUNTING POLICIES
(a) Description of BusinessCanon Inc. (the “Company”) and subsidiaries (collectively “Canon”) is one of the world’s leading manufacturers in such fields as office products, imaging system products, medical system products and industry and other products. Office prod-ucts consist mainly of office multifunction devices (“MFDs”), laser multifunction printers (“MFPs”), laser printers, digital pro-duction printing systems, high speed continuous feed print-ers, wide-format printers and document solutions. Imaging system products consist mainly of interchangeable-lens digi-tal cameras, digital compact cameras, digital camcorders, dig-ital cinema cameras, interchangeable lenses, compact photo printers, inkjet printers, large format inkjet printers, commer-cial photo printers, image scanners, multimedia projectors, broadcast equipment and calculators. Medical system prod-ucts consist mainly of digital radiography systems, diagnos-tic X-ray systems, computed tomography, magnetic resonance imaging, diagnostic ultrasound systems, clinical chemistry ana-lyzers and ophthalmic equipment. Industry and other prod-ucts consist mainly of semiconductor lithography equipment, FPD (Flat panel display) lithography equipment, vacuum thin-film deposition equipment, organic LED (“OLED”) panel man-ufacturing equipment, die bonders, micromotors, network cameras, handy terminals and document scanners. Sales are made principally under the Canon brand name, almost entirely through sales subsidiaries. These subsidiaries are responsible for marketing and distribution, and primarily sell to retail deal-ers in their geographic area. Further segment information is described in Note 21.
Canon sells laser printers on an OEM basis to HP Inc.; such sales constituted 13.1%, 14.8% and 17.8% of consolidated net sales for the years ended December 31, 2017, 2016 and 2015, respectively, and are included in the Office Business Unit.
Canon’s manufacturing operations are conducted primarily at 30 plants in Japan and 18 overseas plants which are located in countries or regions such as the United States, Germany, France, the Netherlands, Taiwan, China, Malaysia, Thailand, Vietnam and Philippines.
(b) Basis of PresentationThe Company and its domestic subsidiaries maintain their books of account in conformity with financial accounting stan-dards of Japan. Foreign subsidiaries maintain their books of account in conformity with financial accounting standards of the countries of their domicile.
Certain adjustments and reclassifications have been incorpo-rated in the accompanying consolidated financial statements to conform with U.S. generally accepted accounting principles (“U.S. GAAP”). These adjustments were not recorded in the statutory books of account.
(c) Principles of ConsolidationThe consolidated financial statements include the accounts of the Company, its majority owned subsidiaries and those
variable interest entities where the Company or its consoli-dated subsidiaries are the primary beneficiaries. All significant intercompany balances and transactions have been eliminated.
(d) Use of EstimatesThe preparation of the consolidated financial statements in conformity with U.S. GAAP requires management to make estimates and assumptions that affect the reported amounts of assets and liabilities and the disclosure of contingent assets and liabilities at the date of the consolidated financial state-ments and the reported amounts of revenues and expenses during the period. Significant estimates and assumptions are reflected in valuation and disclosure of accounts including: rev-enue recognition, allowance for doubtful receivables, inven-tories, long-lived assets, goodwill and other intangible assets with indefinite useful lives, environmental liabilities, deferred tax assets, uncertain tax positions and employee retirement and severance benefit obligations. Actual results could differ materially from those estimates.
(e) Translation of Foreign CurrenciesAssets and liabilities of the Company’s subsidiaries located outside Japan with functional currencies other than Japanese yen are translated into Japanese yen at the rates of exchange in effect at the balance sheet date. Income and expense items are translated at the average exchange rates prevailing during the year. Gains and losses resulting from translation of finan-cial statements are excluded from earnings and are reported in other comprehensive income (loss).
Gains and losses resulting from foreign currency trans-actions, including foreign exchange contracts, and transla-tion of assets and liabilities denominated in foreign currencies are included in other income (deductions) in the consoli-dated statements of income. Foreign currency exchange gains and losses were net losses of ¥9,775 million, ¥2 million and ¥22,149 million for the years ended December 31, 2017, 2016 and 2015, respectively.
(f) Cash EquivalentsAll highly liquid investments acquired with original maturi-ties of three months or less are considered to be cash equiv-alents. Certain debt securities with original maturities of less than three months, classified as available-for-sale securities of ¥70,500 million and ¥30,500 million at December 31, 2017 and 2016, respectively, are included in cash and cash equiva-lents in the consolidated balance sheets.
(g) InvestmentsInvestments consist primarily of time deposits with original maturities of more than three months, debt and marketable equity securities, investments in affiliated companies and non-marketable equity securities. Canon reports investments with maturities of less than one year as short-term investments.
Canon classifies investments in debt and marketable equity
CANON ANNUAL REPORT 201754
NOTES TO CONSOLIDATED FINANCIAL STATEMENTSCanon Inc. and Subsidiaries

securities as available-for-sale securities. Canon does not hold any trading securities which are bought and held primarily for the pur-pose of sale in the near term, or any held-to-maturity securities.
Available-for-sale securities are recorded at fair value. Fair value is determined based on quoted market prices, projected discounted cash flows or other valuation techniques as appro-priate. Unrealized holding gains and losses, net of the related tax effect, are reported as a separate component of accumu-lated other comprehensive income (loss) until realized.
Available-for-sale securities are regularly reviewed for other-than-temporary declines in the carrying amount based on cri-teria that include the length of time and the extent to which the market value has been less than cost, the financial condi-tion and near-term prospects of the issuer and Canon’s intent and ability to retain the investment for a period of time suf-ficient to allow for any anticipated recovery in market value. For debt securities for which the declines are deemed to be other-than-temporary and there is no intent to sell, impair-ments are separated into the amount related to credit loss, which is recognized in earnings, and the amount related to all other factors, which is recognized in other comprehensive income (loss). For debt securities for which the declines are deemed to be other-than-temporary and there is an intent to sell, impairments in their entirety are recognized in earnings. For equity securities for which the declines are deemed to be other-than-temporary, impairments in their entirety are recog-nized in earnings. Canon recognizes an impairment loss to the extent by which the cost basis of the investment exceeds the fair value of the investment.
Realized gains and losses are determined by the average cost method and reflected in earnings.
Investments in affiliated companies over which Canon has the ability to exercise significant influence, but does not hold a con-trolling financial interest, are accounted for by the equity method.
Non-marketable equity securities in companies over which Canon does not have the ability to exercise significant influence are stated at cost and reviewed periodically for impairment.
(h) Allowance for Doubtful ReceivablesAllowance for doubtful trade and finance receivables is main-tained for all customers based on a combination of fac-tors, including aging analysis, macroeconomic conditions and historical experience. An additional reserve for individual accounts is recorded when Canon becomes aware of a cus-tomer’s inability to meet its financial obligations, such as in the case of bankruptcy filings. If circumstances related to cus-tomers change, estimates of the recoverability of receivables would be further adjusted. When all collection options are exhausted including legal recourse, the accounts or portions thereof are deemed to be uncollectable and charged against the allowance.
(i) InventoriesInventories are stated at the lower of cost or net realizable value. Cost is determined by the average method for domestic inventories and principally by the first-in, first-out method for overseas inventories.
(j) Impairment of Long-Lived AssetsLong-lived assets, such as property, plant and equipment, and acquired intangible assets subject to amortization, are reviewed for impairment whenever events or changes in cir-cumstances indicate that the carrying amount of an asset may not be recoverable. Recoverability of assets to be held and used is measured by a comparison of the carrying amount of the asset and the estimated undiscounted future cash flows expected to be generated by the asset. If the carrying amount of the asset exceeds its estimated undiscounted future cash flows, an impairment charge is recognized in the amount by which the carrying amount of the asset exceeds the fair value of the asset. Assets to be disposed of by sale are reported at the lower of the carrying amount or fair value less costs to sell, and are no longer depreciated.
(k) Property, Plant and EquipmentProperty, plant and equipment are stated at cost. Depreciation is calculated principally by the declining-balance method, except for certain assets which are depreciated by the straight-line method over the estimated useful lives of the assets.
The depreciation period ranges from 3 years to 60 years for buildings and 1 year to 20 years for machinery and equipment.
Assets leased to others under operating leases are stated at cost and depreciated to the estimated residual value of the assets by the straight-line method over the lease term, gener-ally from 2 years to 5 years.
(l) Goodwill and Other Intangible AssetsGoodwill and other intangible assets with indefinite useful lives are not amortized, but are instead tested for impairment annually in the fourth quarter of each year, or more frequently if indicators of potential impairment exist. All goodwill is assigned to the reporting unit or units that benefit from the synergies arising from each business combination. If the car-rying amount assigned to the reporting unit exceeds the fair value of the reporting unit, Canon recognizes an impairment charge in an amount equal to that excess, limited to the total amount of goodwill allocated to that reporting unit.
Intangible assets with finite useful lives consist primarily of software, trademarks, patents and developed technology, license fees and customer relationships, which are amortized using the straight-line method. The estimated useful lives of software are from 3 years to 6 years, trademarks are 15 years, patents and developed technology are from 7 years to 17 years, license fees are 7 years, and customer relationships are from 11 years to 15 years, respectively. Certain costs incurred in connection with developing or obtaining internal-use soft-ware are capitalized. These costs consist primarily of payments made to third parties and the salaries of employees working on such software development. Costs incurred in connection with developing internal-use software are capitalized at the application development stage. In addition, Canon develops or obtains certain software to be sold where related costs are capitalized after establishment of technological feasibility.
CANON ANNUAL REPORT 2017 55
STRATEGYBUSINESS SEGMENT/
CORPORATE STRUCTURE FINANCIAL SECTION CORPORATE DATA

(m) Environmental LiabilitiesLiabilities for environmental remediation and other environ-mental costs are accrued when environmental assessments or remedial efforts are probable and the costs can be reasonably estimated. Such liabilities are adjusted as further information develops or circumstances change. Costs of future obligations are not discounted to their present values.
(n) Income TaxesDeferred tax assets and liabilities are recognized for the esti-mated future tax consequences attributable to differences between the financial statement carrying amounts of existing assets and liabilities and their respective tax bases and oper-ating loss and tax credit carryforwards. Deferred tax assets and liabilities are measured using enacted tax rates expected to apply to taxable income in the years in which those tem-porary differences are expected to be recovered or settled. The effect on deferred tax assets and liabilities of a change in tax rates is recognized in income in the period that includes the enactment date. Canon records a valuation allowance to reduce the deferred tax assets to the amount that is more likely than not realizable.
Canon recognizes the financial statement effects of tax posi-tions when it is more likely than not, based on the technical merits, that the tax positions will be sustained upon exami-nation by the tax authorities. Benefits from tax positions that meet the more-likely-than-not recognition threshold are mea-sured at the largest amount of benefit that is greater than 50% likely of being realized upon settlement. Interest and penalties accrued related to unrecognized tax benefits are included in income taxes in the consolidated statements of income.
(o) Stock-Based CompensationCanon measures stock-based compensation cost at the grant date, based on the fair value of the award, and recognizes the cost on a straight-line basis over the requisite service period, which is the vesting period.
(p) Net Income Attributable to Canon Inc. Shareholders per Share
Basic net income attributable to Canon Inc. shareholders per share is computed by dividing net income attributable to Canon Inc. by the weighted-average number of com-mon shares outstanding during each year. Diluted net income attributable to Canon Inc. shareholders per share includes the effect from potential issuances of common stock based on the assumptions that all stock options were exercised.
(q) Revenue RecognitionCanon generates revenue principally through the sale of office, imaging system and medical system products, equip-ment, supplies, and related services under separate contractual arrangements. Canon recognizes revenue when persuasive evidence of an arrangement exists, delivery has occurred and title and risk of loss have been transferred to the customer or services have been rendered, the sales price is fixed or
determinable, and collectability is probable.Revenue from sales of office products, such as office MFDs
and laser printers, and imaging system products, such as digi-tal cameras and inkjet printers, is recognized upon shipment or delivery, depending upon when title and risk of loss transfer to the customer.
Canon also offers separately priced product maintenance contracts for most office products, for which the customer typi-cally pays a stated base service fee plus a variable amount based on usage. Revenue from these service maintenance contracts is measured at the stated amount of the contract and recognized as services are provided and variable amounts are earned.
Revenue from the sale of equipment under sales-type leases is recognized at the inception of the lease. Income on sales-type leases and direct-financing leases is recognized over the life of each respective lease using the interest method. Leases not qualifying as sales-type leases or direct-financing leases are accounted for as operating leases and related revenue is rec-ognized ratably over the lease term. When equipment leases are bundled with product maintenance contracts, revenue is allocated based upon the estimated relative fair value of the lease and non-lease deliverables. Lease deliverables generally include equipment, financing and executory costs, while non-lease deliverables generally consist of product maintenance contracts and supplies.
Revenue from sales of equipment that are sold with cus-tomer acceptance provisions related to their functionality including optical equipment such as semiconductor lithogra-phy equipment and FPD lithography equipment, and certain medical equipment such as computed tomography and mag-netic resonance imaging, is recognized when the equipment is installed at the customer site and the specific criteria of the equipment functionality are successfully tested. Service reve-nue is derived primarily from separately priced product main-tenance contracts on the equipment sold to customers and is measured at the stated amount of the contract and recog-nized as services are provided.
For all other arrangements with multiple elements, Canon allocates revenue to each element based on its relative selling price if such element meets the criteria for treatment as a sep-arate unit of accounting. Otherwise, revenue is deferred until the undelivered elements are fulfilled and accounted for as a single unit of accounting.
Canon records amounts received in advance from custom-ers in excess of revenue recognized primarily for sales of opti-cal equipment and product maintenance contracts as deferred revenue until the revenue recognition criteria are satisfied. Deferred revenue were ¥125,965 million and ¥102,298 mil-lion at December 31, 2017 and 2016, respectively, and are included in other current liabilities in the accompanying con-solidated balance sheets.
Canon records estimated reductions to sales at the time of sale for sales incentive programs including product discounts, customer promotions and volume-based rebates. Estimated reductions to sales are based upon historical trends and other known factors at the time of sale. Canon regularly adjusts its
NOTES TO CONSOLIDATED FINANCIAL STATEMENTS
CANON ANNUAL REPORT 201756

estimates each period in the ordinary course of establishing sales incentive program accruals based on current information. Canon also provides price protection to certain resellers of its products, and records reductions to sales for the estimated impact of price protection obligations when announced.
Estimated product warranty costs are recorded at the time revenue is recognized and are included in selling, general and administrative expenses in the consolidated statements of income. Estimates for accrued product warranty costs are based on historical experience, and are affected by ongoing product failure rates, specific product class failures outside of the baseline experience, material usage and service delivery costs incurred in correcting a product failure.
Taxes collected from customers and remitted to governmen-tal authorities are excluded from revenues in the consolidated statements of income.
(r) Research and Development CostsResearch and development costs are expensed as incurred.
(s) Advertising CostsAdvertising costs are expensed as incurred. Advertising expenses were ¥61,207 million, ¥58,707 million and ¥80,907 million for the years ended December 31, 2017, 2016 and 2015, respectively.
(t) Shipping and Handling CostsShipping and handling costs totaled ¥52,953 million, ¥44,296 million and ¥52,504 million for the years ended December 31, 2017, 2016 and 2015, respectively, and are included in selling, general and administrative expenses in the consolidated state-ments of income.
(u) Derivative Financial InstrumentsAll derivatives are recognized at fair value and are included in prepaid expenses and other current assets, or other current lia-bilities in the consolidated balance sheets.
Canon uses and designates certain derivatives as a hedge of a forecasted transaction or the variability of cash flows to be received or paid related to a recognized asset or liability (“cash flow” hedge). Canon formally documents all relation-ships between hedging instruments and hedged items, as well as its risk-management objective and strategy for undertaking various hedge transactions. Canon also formally assesses, both at the hedge’s inception and on an ongoing basis, whether the derivatives that are used in hedging transactions are highly effective in offsetting changes in cash flows of hedged items. When it is determined that a derivative is not highly effec-tive as a hedge or that it has ceased to be a highly effective hedge, Canon discontinues hedge accounting prospectively. Changes in the fair value of a derivative that is designated and qualifies as a cash flow hedge are recorded in other compre-hensive income (loss), until earnings are affected by the vari-ability in cash flows of the hedged item. Gains and losses from hedging ineffectiveness are included in other income (deduc-tions). Gains and losses related to the components of hedging
instruments excluded from the assessment of hedge effective-ness are included in other income (deductions).
Canon also uses certain derivative financial instruments which are not designated as hedges. The changes in fair val-ues of these derivative financial instruments are immediately recorded in earnings.
Canon classifies cash flows from derivatives as cash flows from operating activities in the consolidated statements of cash flows.
(v) GuaranteesCanon recognizes, at the inception of a guarantee, a liability for the fair value of the obligation it has undertaken in issu-ing guarantees.
(w) Recently Issued Accounting GuidanceIn January 2017, the Financial Accounting Standards Board (“FASB”) issued an amendment which eliminates the second step from the impairment test of goodwill. This amendment requires the entity to recognize an impairment charge for the amount by which the carrying amount exceeds the fair value of reporting unit; however, the impairment charge is limited to the amount of goodwill allocated to that reporting unit. Canon early adopted this amended guidance from the impairment test performed after January 1, 2017.
In May 2014, the FASB issued a new accounting standard related to revenue from contracts with customers, as amended. This standard requires an entity to recognize revenue when promised goods or services are transferred to customers in an amount that reflects the consideration to which the entity expects to be entitled in exchange for those goods or services. This standard is effective for Canon from the quarter begin-ning January 1, 2018. Canon will apply the modified retrospec-tive method of adoption to contracts that are not completed as of the adoption. While Canon currently does not expect the adoption of this standard to have a material impact on revenue recognition pattern of each performance obligation, the adop-tion of this standard is expected to result in changes in alloca-tion of transaction prices between goods and services primarily in Office Business Unit. Canon is in the process of finalizing the assessment of the effect from the adoption and related adjust-ments. Also, in the course of the adoption of the guidance, Canon has reconsidered the scope of performance obligations related to services, and as a result, Canon will separately dis-close revenues and costs of services from those of products and equipment from the quarter beginning January 1, 2018. In this context, certain costs related to service will be also reclassified from operating expenses to cost of sales.
In January 2016, the FASB issued an amendment which addresses certain aspects of recognition, measurement, pre-sentation, and disclosure of financial instruments. This guid-ance includes the requirement that equity investments that do not result in consolidation and are not accounted for under the equity method be measured at fair value with changes in the fair value recognized in net income. This guidance is effective for Canon from the first quarter beginning January 1, 2018, and Canon will recognize a cumulative-effect adjustment to
CANON ANNUAL REPORT 2017 57
STRATEGYBUSINESS SEGMENT/
CORPORATE STRUCTURE FINANCIAL SECTION CORPORATE DATA

retained earnings of ¥5,343 million as of January 1, 2018 for the after-tax unrealized gains of available-for-sale equity secu-rities previously recognized in accumulated other comprehen-sive income.
In February 2016, the FASB issued an amendment which requires lessees to recognize most leases on their balance sheets but recognize expenses on their income statements in a man-ner similar to current guidance. For lessors, the guidance modi-fies the classification criteria and the accounting for sales-type and direct financing leases. The new guidance is required to be applied with a modified retrospective approach. The guidance is effective for annual reporting periods beginning after December 15, 2018, and early adoption is permitted. Canon currently plans to adopt the guidance from the quarter beginning after January 1, 2019. The adoption of the guidance is expected to have an impact on its consolidated balance sheet by recognizing right-of-use assets and lease liabilities for non-cancelable oper-ating leases. Canon is currently evaluating the effect that the adoption of the guidance will have on its consolidated results of operations and financial condition.
In October 2016, the FASB issued an amendment which requires an entity to recognize the income tax consequences of an intra-entity transfer of an asset other than inventory when the transfer occurs. Consequently, the amendments in this guid-ance eliminate the exception for an intra-entity transfer of an asset other than inventory. Two common examples of assets included in the scope of this guidance are intellectual property and property, plant, and equipment. The amendments in this guidance should be applied on a modified retrospective basis through a cumulative effect adjustment directly to retained earnings as of the beginning of the period of adoption. This guidance is effective for Canon from the quarter beginning January 1, 2018. Canon does not expect the adoption of this guidance to have a material impact on its consolidated results of operation and financial condition.
In March 2017, the FASB issued an amendment which requires an entity to disaggregate the service cost component from the other components of net benefit cost and report the service cost component in the same line item or items as other compensation costs arising from services rendered by the per-tinent employees during the period. The other components of net benefit cost are required to be presented in the income statement separately from the service cost component, such as in other income (deductions). The amendments also allow only the service cost component to be eligible for capitalization (for example, as a cost of internally manufactured inventory). The amendments in this guidance should be applied retro-spectively for the presentation of the service cost component and the other components of net benefit cost, and prospec-tively for the capitalization of the service cost component of net benefit cost. This guidance is effective for Canon from the quarter beginning January 1, 2018 and the adoption of this standard will result in the decrease in operating profit and the increase in other income of ¥9,874 million, ¥12,441 million and ¥11,352 million for the years ended December 31, 2017, 2016 and 2015, respectively.
In August 2017, the FASB issued an amendment which amends existing guidance to simplify the application of the hedge accounting in certain situations and enable an entity to better portray the economic results of an entity’s risk manage-ment activities in its financial statements. This guidance elimi-nates the requirement to separately measure and report hedge ineffectiveness, and requires an entity to present the earnings effect of the hedging instrument in the same income state-ment line item which the earnings effect of the hedged item is reported. This guidance is effective for annual reporting periods beginning after December 15, 2018, and early adoption is per-mitted. Canon is currently evaluating the adoption date and the effect that the adoption of this guidance will have on its consol-idated results of operations and financial condition.
NOTES TO CONSOLIDATED FINANCIAL STATEMENTS
2. INVESTMENTS
The cost, gross unrealized holding gains, gross unrealized holding losses and fair value for available-for-sale securities included in short-term investments and investments by major security type at December 31, 2017 and 2016 are as follows:
December 31
Millions of yen CostGross unrealized
holding gainsGross unrealizedholding losses Fair value
2017: Current: Corporate bonds 1,222 — — 1,222
1,222 — — 1,222 Noncurrent: Government bonds 305 — 16 289 Corporate bonds 640 182 — 822 Fund trusts 122 2 — 124 Equity securities 10,965 11,612 1,676 20,901
12,032 11,796 1,692 22,136
CANON ANNUAL REPORT 201758

Millions of yen CostGross unrealized
holding gainsGross unrealizedholding losses Fair value
2016: Noncurrent: Government bonds 277 — 8 269 Corporate bonds 43 188 2 229 Fund trusts 85 1 — 86 Equity securities 19,026 23,439 21 42,444
19,431 23,628 31 43,028
Maturities of available-for-sale debt securities included in short-term investments and investments in the accompanying consol-idated balance sheets are as follows at December 31, 2017:
Millions of yen
Cost Fair value
Due within one year 1,222 1,222Due after one year through five years 605 605Due after five years 340 506
2,167 2,333
During the year ended December 31, 2017, Canon con-tributed certain marketable equity securities, not including those of its subsidiaries and affiliated companies, to an estab-lished employee retirement benefit trust, with no cash pro-ceeds there on. The fair value of those securities at the time of contribution was ¥30,473 million. Upon contribution of those available-for-sale securities, the unrealized gains amounting to ¥17,836 million were realized and were included in “Other, net” in the consolidated statements of income.
Gross realized gains were ¥18,514 million, ¥750 million and ¥329 million for the years ended December 31, 2017, 2016 and 2015, respectively. Gross realized losses, including write-downs for impairments that were other-than-temporary, were ¥42 million, ¥1,032 million and ¥31 million for the years ended December 31, 2017, 2016 and 2015, respectively.
At December 31, 2017, substantially all of the available-for-sale securities with unrealized losses had been in a continuous unrealized loss position for less than twelve months.
Time deposits with original maturities of more than three months were ¥743 million and ¥3,206 million at December 31,
2017 and 2016, respectively, and were included in short-term investments in the accompanying consolidated balance sheets.
Aggregate cost of non-marketable equity securities accounted for under the cost method totaled ¥3,760 million and ¥7,800 million at December 31, 2017 and 2016, respec-tively. These investments were not evaluated for impairment at December 31, 2017 and 2016, respectively, because (a) Canon did not estimate the fair value of those investments as it was not practicable to estimate the fair value of the investments and (b) Canon did not identify any events or changes in cir-cumstances that might have had significant adverse effects on the fair value of those investments.
Investments in affiliated companies accounted for by the equity method amounted to ¥20,496 million and ¥21,514 million at December 31, 2017 and 2016, respectively. Canon’s share of the net earnings in affiliated companies accounted for by the equity method, included in other income (deduc-tions), were earnings of ¥1,196 million, ¥890 million and ¥447 million for the years ended December 31, 2017, 2016 and 2015 respectively.
3. TRADE RECEIVABLES
Trade receivables are summarized as follows:
December 31 Millions of yen
2017 2016
Notes 37,077 28,811Accounts 627,173 623,722
664,250 652,533Less allowance for doubtful receivables (13,378) (11,075)
650,872 641,458
CANON ANNUAL REPORT 2017 59
STRATEGYBUSINESS SEGMENT/
CORPORATE STRUCTURE FINANCIAL SECTION CORPORATE DATA

NOTES TO CONSOLIDATED FINANCIAL STATEMENTS
4. INVENTORIES
Inventories are summarized as follows:
December 31 Millions of yen
2017 2016
Finished goods 377,632 373,337Work in process 144,251 143,298Raw materials 48,150 44,101 570,033 560,736
5. PROPERTY, PLANT AND EQUIPMENT
Property, plant and equipment are stated at cost less accumulated depreciation and are summarized as follows:
December 31 Millions of yen
2017 2016
Land 274,551 283,893Buildings 1,638,202 1,656,087Machinery and equipment 1,804,982 1,778,552Construction in progress 46,940 54,786
3,764,675 3,773,318Less accumulated depreciation (2,638,055) (2,578,342)
1,126,620 1,194,976
Depreciation expenses for the years ended December 31, 2017, 2016 and 2015 were ¥189,712 million, ¥199,133 mil-lion and ¥223,759 million, respectively.
Amounts due for purchases of property, plant and equip-ment were ¥23,432 million and ¥31,318 million at December
31, 2017 and 2016, respectively, and are included in other current liabilities in the accompanying consolidated balance sheets. Fixed assets presented in the consolidated statements of cash flows include property, plant and equipment and intangible assets.
6. FINANCE RECEIVABLES AND OPERATING LEASES
Finance receivables represent financing leases which consist of sales-type leases and direct-financing leases resulting from the sales of Canon’s and complementary third-party products. These receivables typically have terms ranging from 1 year to
6 years. The components of the finance receivables, which are included in prepaid expenses and other current assets, and other assets in the accompanying consolidated balance sheets, are as follows:
December 31 Millions of yen
2017 2016
Total minimum lease payments receivable 361,686 306,766Unguaranteed residual values 15,055 14,776Executory costs (2,216) (34)Unearned income (32,286) (30,288)
342,239 291,220Less allowance for credit losses (2,681) (2,325)
339,558 288,895Less current portion (120,186) (105,308)
219,372 183,587
CANON ANNUAL REPORT 201760

The activity in the allowance for credit losses is as follows:
Years ended December 31 Millions of yen
2017 2016
Balance at beginning of year 2,325 2,878Charge-offs (1,523) (978)Provision 1,436 398Translation adjustments and other 443 27
Balance at end of year 2,681 2,325
Canon has policies in place to ensure that its products are sold to customers with an appropriate credit history, and con-tinuously monitors its customers’ credit quality based on infor-mation including length of period in arrears, macroeconomic conditions, initiation of legal proceedings against custom-ers and bankruptcy filings. The allowance for credit losses of finance receivables are evaluated collectively based on histori-cal experience of credit losses. An additional reserve for indi-vidual accounts is recorded when Canon becomes aware of a customer’s inability to meet its financial obligations, such as in
the case of bankruptcy filings. Finance receivables which are past due or individually evaluated for impairment at December 31, 2017 and 2016 are not significant.
The cost of equipment leased to customers under oper-ating leases included in property, plant and equipment, net at December 31, 2017 and 2016 was ¥103,078 million and ¥97,890 million, respectively. Accumulated depreciation on equipment under operating leases at December 31, 2017 and 2016 was ¥78,307 million and ¥75,997 million, respectively.
The following is a schedule by year of the future minimum lease payments to be received under financing leases and noncan-celable operating leases at December 31, 2017.
Year ending December 31: Millions of yen
Financing leases Operating leases
2018 134,020 8,5802019 102,203 4,4462020 69,180 2,6362021 38,264 1,3472022 14,819 401Thereafter 3,200 34
361,686 17,444
7. ACQUISITIONS
On March 17, 2016, Canon entered into a Shares and Other Securities Transfer Agreement with Toshiba Corporation and acquired the share options for consideration of cash to acquire all the ordinary shares of Toshiba Medical Systems Corporation (“TMSC”), which is exercisable upon the clearances of nec-essary competition regulatory authorities. As such clear-ances were obtained, Canon exercised the share options and acquired all the ordinary shares of TMSC on December 19, 2016. The acquisition date was December 19, 2016 and the purchase price was ¥665,498 million, which approximates the fair value at that date.
The acquisition was accounted for using the acquisi-tion method of accounting. Acquisition-related costs were expensed as incurred and were not material.
Under Phase V of the Excellent Global Corporation Plan, a five-year initiative that Canon has been implementing since 2016, “embracing the challenge of new growth through a grand strategic transformation” has been set as a basic policy. With regard to “strengthening and growing new businesses, and creating future businesses,” a particularly important
strategy, Canon intends to develop a health care business within the realm of “safety and security,” as a next-generation pillar of growth.
TMSC is one of the leading global companies in the med-ical equipment industry. Within the field of medical X-ray computed tomography systems in particular, TMSC is the over-whelming market share leader in Japan and has been steadily increasing its global market share. By maximizing the com-bination of both companies’ management resources, Canon aims to solidify its business foundation for health care that can contribute to the world.
The purchase price allocation was based on estimated fair values of the assets acquired and liabilities assumed at acqui-sition date. Since the acquisition date of TMSC was near the balance sheet date in 2016, and TMSC is composed of vari-ous entities located around the world, the purchase price allo-cation was preliminary at December 31, 2016. The purchase price allocation was finalized in the fourth quarter of 2017. The certain underlying inputs for inventories and intangible assets have been updated during the measurement period.
CANON ANNUAL REPORT 2017 61
STRATEGYBUSINESS SEGMENT/
CORPORATE STRUCTURE FINANCIAL SECTION CORPORATE DATA

NOTES TO CONSOLIDATED FINANCIAL STATEMENTS
Millions of yen Preliminary
MeasurementPeriod
Adjustment Final
Cash and cash equivalents 25,301 — 25,301 Other current assets 169,545 (1,962) 167,583 Intangible assets 227,500 627 228,127 Other noncurrent assets 42,975 — 42,975Total assets acquired 465,321 (1,335) 463,986 Current liabilities 199,223 (877) 198,346 Noncurrent liabilities 92,231 (1,049) 91,182Total liabilities assumed 291,454 (1,926) 289,528Noncontrolling interest 1,047 — 1,047 Net identifiable assets acquired 172,820 591 173,411Goodwill 492,678 (591) 492,087 Net assets acquired 665,498 — 665,498
The following table summarizes the estimated fair values of the assets acquired and liabilities assumed at acquisition date.
Intangible assets subject to amortization acquired during the year ended December 31, 2017, including those recorded from businesses acquired, totaled ¥35,112 million, which pri-marily consist of software of ¥33,437 million and customer relationships of ¥1,203 million. The weighted average amorti-zation periods for intangible assets in total acquired during the year ended December 31, 2017 are approximately 5 years. The weighted average amortization periods for software and cus-tomer relationships acquired during the year ended December 31, 2017 are approximately 5 years and 8 years, respectively.
Intangible assets subject to amortization acquired during
the year ended December 31, 2016, including those recorded from businesses acquired, totaled ¥266,325 million, which pri-marily consist of customer relationships of ¥155,997 million, patents and developed technology of ¥73,451 million and software of ¥36,054 million. The weighted average amortiza-tion periods for intangible assets in total acquired during the year ended December 31, 2016 are approximately 14 years. The weighted average amortization periods for customer relationships, patents and developed technology and soft-ware acquired during the year ended December 31, 2016 are approximately 15 - 20 years, 10 years and 5 years, respectively.
8. GOODWILL AND OTHER INTANGIBLE ASSETS
Intangible assets acquired, which are subject to amortiza-tion, mainly consist of customer relationships of ¥143,600 mil-lion, and patents and developed technology of ¥73,000 million. Canon has estimated the amortization period for the customer relationships, and patents and developed technology to be 15 years and 10 years, respectively. The weighted average amorti-zation period for all intangible assets is approximately 13 years.
Goodwill recorded is attributable primarily to expected syn-ergies from combining operations of TMSC and Canon, such as accelerating entry into new fields, further improvement in quality through shared production technology and expanding business domains through the enhancement of R&D capabil-ities. None of the goodwill is expected to be deductible for tax purposes.
The amounts of net sales of TMSC since the acquisition date
included in the Canon’s consolidated statement of income for the year ended December 31, 2016 were ¥13,582 million. The amounts of net income of TMSC included in the Canon’s con-solidated statement of income were not material.
The unaudited pro forma net sales for the years ended December 31, 2016 and 2015 as if TMSC had been included in Canon’s consolidated statement of income from the begin-ning of the year ended December 31, 2015 were ¥3,806,667 million and ¥4,224,181 million, respectively. Pro forma net income was not disclosed because the impact on Canon’s con-solidated statements of income was not material.
Canon acquired businesses other than that described above during the years ended December 31, 2017 and 2016 that were not material to its consolidated financial statements.
CANON ANNUAL REPORT 201762

December 31
Millions of yen
2017 2016Gross carrying
amountAccumulated amortization
Gross carrying amount
Accumulated amortization
Software 342,322 217,654 313,599 193,785Customer relationships 162,832 22,463 172,234 11,146Patents and developed technology 121,886 27,085 106,250 16,272Trademarks 48,823 9,890 44,704 5,610License fees 13,565 6,375 15,561 6,756Other 18,592 8,136 17,713 8,250
708,020 291,603 670,061 241,819
The components of intangible assets subject to amortization at December 31, 2017 and 2016 were as follows:
Aggregate amortization expense for the years ended December 31, 2017, 2016 and 2015 was ¥72,169 million, ¥50,963 million and ¥49,568 million, respectively. Estimated amortization expense for intangible assets currently held for the next five years ending December 31 is ¥67,791 million in 2018, ¥57,214 million in 2019, ¥45,435 million in 2020, ¥37,265 million in 2021, and ¥30,805 million in 2022.
Intangible assets not subject to amortization other than
goodwill at December 31, 2017 were not significant. Intangible assets not subject to amortization other than good-will at December 31, 2016 were ¥18,026 million, which primarily consist of in-process research and development recorded from businesses acquired.
For management reporting purposes, goodwill is not allo-cated to the segments. Goodwill has been allocated to its respective segment for impairment testing.
The changes in the carrying amount of goodwill by segment for the years ended December 31, 2017 and 2016 were as follows:
Years ended December 31Millions of yen Office
ImagingSystem
Medical System
Industry andOthers Unallocated*1 Total
2017: Balance at beginning of year 136,256 49,034 — 258,456 492,678 936,424 Goodwill acquired during the year 857 236 — 2,394 — 3,487 Transfer*1 — — 499,855 (7,177) (492,678) — Impairment loss*2 (33,912) — — — — (33,912) Translation adjustments and other 9,855 3,291 60 17,517 — 30,723 Balance at end of year 113,056 52,561 499,915 271,190 — 936,722
Years ended December 31Millions of yen Office
ImagingSystem
Medical System
Industry andOthers Unallocated*1 Total
2016: Balance at beginning of year 142,551 53,474 — 282,918 — 478,943 Goodwill acquired during the year 863 — — 4,589 492,678 498,130 Translation adjustments and other (7,158) (4,440) — (29,051) — (40,649)
Balance at end of year 136,256 49,034 — 258,456 492,678 936,424
*1 Canon did not complete the allocation of goodwill to the segments for impairment testing which was attributable to the acquisition of TMSC as of December 31, 2016. Based on the realignment of Canon’s internal reporting and management structure, Canon newly established Medical System Business Unit effec-tive at the beginning of the second quarter of 2017. Goodwill related to TMSC as well as goodwill related to certain medical business which was previously included in Industry and Others Business Unit have been transferred to Medical System Business Unit.
*2 After entering the commercial printing business through the acquisition of Océ N.V. in 2010, the market environment surrounding this business has become significantly competitive and rapid technological changes have required increasing investments into R&D. These factors resulted in lower operating margin than expected, which led to the decline in the estimated fair value of this business which was determined based on the income approach. As the result of the annual goodwill impairment test as of October 1, 2017, it was determined that the estimated fair value of commercial printing business was less than its carry-ing value of the reporting unit. Based on the accounting policy described in Note 1, Canon recognized an impairment charge of ¥33,912 million representing the excess of the carrying amount over the reporting unit’s fair value.
CANON ANNUAL REPORT 2017 63
STRATEGYBUSINESS SEGMENT/
CORPORATE STRUCTURE FINANCIAL SECTION CORPORATE DATA

NOTES TO CONSOLIDATED FINANCIAL STATEMENTS
The aggregate annual maturities of long-term debt outstanding at December 31, 2017 were as follows:
Year ending December 31: Millions of yen
2018 5,9302019 2,3722020 4042021 490,3422022 48Thereafter 72
499,168
Both short-term and long-term bank loans are primarily made under general agreements which provide that security and guarantees for present and future indebtedness will be given upon request of the bank, and that the bank shall have
the right to offset cash deposits against obligations that have become due or, in the event of default, against all obligations due to the bank.
9. SHORT-TERM LOANS AND LONG-TERM DEBT
Short-term loans consisting of bank borrowings at December 31, 2017 and 2016 were ¥33,398 million and ¥601 million, respec-tively. The weighted average interest rate on short-term borrowings outstanding at December 31, 2017 was 0.52%.
Long-term debt consisted of the following:
December 31 Millions of yen
2017 2016
Loan from the banks; bearing interest of 0.06% at December 31, 2017 and 0.13% at December 31, 2016*1 490,000 610,000Other debt*2 9,168 2,538
499,168 612,538Less current portion (5,930) (1,249)
493,238 611,289
*1 On January 31, 2017, Canon entered into the unsecured revolving credit facility contracts expiring in December 2021 in order to refinance the bank term loan which was due in 2017. Canon prepaid ¥120,000 million of the loan with cash flows generated during the year. The outstanding loans under the credit facili-ties are ¥490,000 million at a floating interest of 0.06% and Canon has no unused credit facilities as of December 31, 2017.
*2 The other debt consisted of term-loans and capital lease obligations as of December 31, 2017 and 2016.
10. TRADE PAYABLES
Trade payables are summarized as follows:
December 31 Millions of yen
2017 2016
Notes 81,002 38,073
Accounts 299,652 334,196
380,654 372,269
CANON ANNUAL REPORT 201764

11. EMPLOYEE RETIREMENT AND SEVERANCE BENEFITS
The Company and certain of its subsidiaries have contributory and noncontributory defined benefit pension plans covering substantially all of their employees. Benefits payable under the plans are based on employee earnings and years of service. The Company and certain of its subsidiaries also have defined contri-bution pension plans covering substantially all of their employees.
TMSC temporarily participates in Toshiba Corporate Pension Fund. However, it is not allowed to permanently continue to participate in the fund as a result of the acquisition by Canon.
In addition, Canon is required to maintain an equivalent level of pension benefit and therefore plans to establish a new pension plan in 2018. Canon calculated the projected bene-fit obligations based on the benefit level of Toshiba Corporate Pension Fund at December 31, 2017 and 2016, and included proportional share of the plan assets of TMSC to which they have legal right in the following tables. These obligations and plan assets are expected to be reasonable estimates of the impact of creating the new plan.
Employer contributions for the year ended December 31, 2017 include contribution of equity securities to a retirement benefit trust. The fair value of those securities at the time of contribution was ¥30,473 million.
Amounts recognized in the consolidated balance sheets at December 31, 2017 and 2016 are as follows:
December 31 Japanese plans Foreign plans
Millions of yen Millions of yen
2017 2016 2017 2016
Other assets 1,695 976 1,215 1,346Accrued expenses — — (1,004) (840)Accrued pension and severance cost (195,812) (239,547) (169,770) (167,653)
(194,117) (238,571) (169,559) (167,147)
Obligations and funded statusReconciliations of beginning and ending balances of the projected benefit obligations and the fair value of the plan assets are as follows:
December 31 Japanese plans Foreign plans
Millions of yen Millions of yen
2017 2016 2017 2016
Change in benefit obligations: Projected benefit obligations at beginning of year 906,007 781,350 392,086 349,680 Service cost 30,889 29,367 6,962 6,816 Interest cost 5,689 8,238 8,691 8,792 Plan participants’ contributions — — 1,644 1,594 Actuarial (gain) loss 11,112 45,778 (1,760) 55,629 Benefits paid (29,020) (25,032) (7,884) (6,268) Acquisition 4,239 71,040 — 21,285 Plan amendments 1,149 (4,734) (1,069) — Curtailments and settlements (435) — — — Foreign currency exchange rate changes — — 24,909 (45,442) Projected benefit obligations at end of year 929,630 906,007 423,579 392,086
Change in plan assets: Fair value of plan assets at beginning of year 667,436 626,575 224,939 217,870 Actual return on plan assets 47,376 12,145 14,262 18,276 Employer contributions 43,468 7,304 7,160 7,271 Plan participants’ contributions — — 1,644 1,594 Benefits paid (23,967) (21,782) (7,884) (6,268) Acquisition 1,223 43,194 — 14,972 Settlements (23) — — — Foreign currency exchange rate changes — — 13,899 (28,776) Fair value of plan assets at end of year 735,513 667,436 254,020 224,939Funded status at end of year (194,117) (238,571) (169,559) (167,147)
CANON ANNUAL REPORT 2017 65
STRATEGYBUSINESS SEGMENT/
CORPORATE STRUCTURE FINANCIAL SECTION CORPORATE DATA

The accumulated benefit obligation for all defined benefit plans was as follows:
Amounts recognized in accumulated other comprehensive income (loss) at December 31, 2017 and 2016 before the effect of income taxes are as follows:
December 31 Japanese plans Foreign plans
Millions of yen Millions of yen
2017 2016 2017 2016
Actuarial loss 221,106 251,078 105,883 116,930Prior service credit (57,430) (71,439) (3,638) (2,652)
163,676 179,639 102,245 114,278
December 31 Japanese plans Foreign plans
Millions of yen Millions of yen
2017 2016 2017 2016
Accumulated benefit obligation 894,329 869,355 402,390 377,004
December 31 Japanese plans Foreign plans
Millions of yen Millions of yen
2017 2016 2017 2016
Plans with projected benefit obligations in excess of plan assets: Projected benefit obligations 924,536 905,975 420,383 390,942 Fair value of plan assets 728,724 666,428 249,609 222,449Plans with accumulated benefit obligations in excess of plan assets: Accumulated benefit obligations 889,652 867,706 394,840 375,860 Fair value of plan assets 728,724 664,586 245,247 222,449
Components of net periodic benefit cost and other amounts recognized in other comprehensive income (loss)Net periodic benefit cost for Canon’s employee retirement and severance defined benefit plans for the years ended December 31, 2017, 2016 and 2015 consisted of the following components:
Years ended December 31 Japanese plans Foreign plans
Millions of yen Millions of yen
2017 2016 2015 2017 2016 2015
Service cost 30,889 29,367 30,009 6,962 6,816 7,760Interest cost 5,689 8,238 8,008 8,691 8,792 10,572Expected return on plan assets (20,493) (19,443) (19,579) (10,722) (10,012) (11,857)Amortization of prior service credit (12,860) (13,230) (12,592) (83) 85 (145)Amortization of actuarial loss 14,220 10,944 10,402 5,747 2,185 3,839(Gain) loss on curtailments and settlements (63) — — — — —
17,382 15,876 16,248 10,595 7,866 10,169
The projected benefit obligations and the fair value of plan assets for the pension plans with projected benefit obligations in excess of plan assets, and the accumulated benefit obligations and the fair value of plan assets for the pension plans with accu-mulated benefit obligations in excess of plan assets are as follows:
NOTES TO CONSOLIDATED FINANCIAL STATEMENTS
CANON ANNUAL REPORT 201766

The estimated prior service credit and actuarial loss for the defined benefit pension plans that will be amortized from accumu-lated other comprehensive income (loss) into net periodic benefit cost over the next year are summarized as follows:
Years ended December 31 Japanese plans Foreign plans
2017 2016 2015 2017 2016 2015
Discount rate 0.7% 1.1% 1.1% 2.2% 3.0% 2.9%Assumed rate of increase in future compensation levels 2.6% 3.0% 3.0% 2.1% 2.0% 2.0%Expected long-term rate of return on plan assets 3.1% 3.1% 3.1% 4.2% 4.4% 5.6%
Japanese plans Foreign plans
Millions of yen Millions of yen
Prior service credit (12,727) (52)Actuarial loss 11,821 4,466
December 31 Japanese plans Foreign plans
2017 2016 2017 2016
Discount rate 0.6% 0.7% 2.2% 2.2%Assumed rate of increase in future compensation levels 2.6% 2.6% 1.8% 2.1%
AssumptionsWeighted-average assumptions used to determine benefit obligations are as follows:
guidelines of the “model” portfolio in order to produce a total return that will match the expected return on a mid-term to long-term basis. Canon evaluates the gap between expected return and actual return of invested plan assets on an annual basis to determine if such differences necessitate a revision in the formulation of the “model” portfolio. Canon revises the “model” portfolio when and to the extent considered necessary to achieve the expected long-term rate of return on plan assets.
Canon’s model portfolio for Japanese plans consists of three major components: approximately 25% is invested in equity securities, approximately 50% is invested in debt securities, and approximately 25% is invested in other investment vehi-cles, primarily consisting of investments in life insurance com-pany general accounts.
Other changes in plan assets and benefit obligations recognized in other comprehensive income (loss) for the years ended December 31, 2017, 2016 and 2015 are summarized as follows:
Years ended December 31 Japanese plans Foreign plans
Millions of yen Millions of yen
2017 2016 2015 2017 2016 2015
Current year actuarial (gain) loss (15,771) 53,076 9,519 (5,300) 47,365 6,302Current year prior service credit 1,149 (4,734) — (1,069) — (2,655)Amortization of actuarial loss (14,220) (10,944) (10,402) (5,747) (2,185) (3,839)Amortization of prior service credit 12,860 13,230 12,592 83 (85) 145Curtailments and settlements 19 — — — — —
(15,963) 50,628 11,709 (12,033) 45,095 (47)
Weighted-average assumptions used to determine net periodic benefit cost are as follows:
Canon determines the expected long-term rate of return based on the expected long-term return of the various asset categories in which it invests. Canon considers the current expectations for future returns and the actual historical returns of each plan asset category.
Plan assetsCanon’s investment policies are designed to ensure adequate plan assets are available to provide future payments of pen-sion benefits to eligible participants. Taking into account the expected long-term rate of return on plan assets, Canon for-mulates a “model” portfolio comprised of the optimal com-bination of equity securities and debt securities. Plan assets are invested in individual equity and debt securities using the
CANON ANNUAL REPORT 2017 67
STRATEGYBUSINESS SEGMENT/
CORPORATE STRUCTURE FINANCIAL SECTION CORPORATE DATA

December 31, 2016 Millions of yen
Japanese plans Foreign plans
Level 1 Level 2 Level 3 Total Level 1 Level 2 Level 3 Total
Equity securities: Japanese companies (e) 46,630 — — 46,630 — — — — Foreign companies 7,902 — — 7,902 22,680 — — 22,680 Pooled funds (f) — 133,023 — 133,023 — 62,641 — 62,641Debt securities: Government bonds (g) 99,157 — — 99,157 11,558 — — 11,558 Municipal bonds — 1,317 — 1,317 — 2,577 — 2,577 Corporate bonds — 14,298 — 14,298 — 19,989 — 19,989 Pooled funds (h) — 121,066 — 121,066 — 22,296 — 22,296 Mortgage backed securities (and other asset backed securities) — 13,612 — 13,612 — — — —
Life insurance company general accounts — 128,220 — 128,220 — 6,898 — 6,898
Other assets — 90,637 — 90,637 — 71,358 24 71,382
Investment measured at net asset value — — — 11,574 — — — 4,918
153,689 502,173 — 667,436 34,238 185,759 24 224,939
December 31, 2017 Millions of yen
Japanese plans Foreign plans
Level 1 Level 2 Level 3 Total Level 1 Level 2 Level 3 Total
Equity securities: Japanese companies (a) 83,765 — — 83,765 — — — — Foreign companies 8,261 — — 8,261 32,240 — — 32,240 Pooled funds (b) — 164,946 — 164,946 — 73,968 — 73,968Debt securities: Government bonds (c) 138,092 — — 138,092 9,343 — — 9,343 Municipal bonds — 1,166 — 1,166 — 2,901 — 2,901 Corporate bonds — 15,246 — 15,246 — 22,045 — 22,045 Pooled funds (d) — 130,507 — 130,507 — 25,821 — 25,821 Mortgage backed securities (and other asset backed securities) — 8,076 — 8,076 — 3 — 3
Life insurance company general accounts — 126,985 — 126,985 — 8,683 — 8,683
Other assets — 43,070 — 43,070 — 73,320 — 73,320Investment measured at net asset value — — — 15,399 — — — 5,696
230,118 489,996 — 735,513 41,583 206,741 — 254,020
Outside Japan, investment policies vary by country, but the long-term investment objectives and strategies remain con-sistent. Canon’s model portfolio for foreign plans has been developed as follows: approximately 40% is invested in equity securities, approximately 25% is invested in debt securities, and approximately 35% is invested in other investment vehi-cles, primarily consisting of investments in real estate assets.
The equity securities are selected primarily from stocks that are listed on the securities exchanges. Prior to investing, Canon has investigated the business condition of the investee compa-nies, and appropriately diversified investments by type of indus-try and other relevant factors. The debt securities are selected primarily from government bonds, public debt instruments,
and corporate bonds. Prior to investing, Canon has investi-gated the quality of the issue, including rating, interest rate, and repayment dates, and has appropriately diversified the investments. Pooled funds are selected using strategies con-sistent with the equity and debt securities described above. As for investments in life insurance company general accounts, the contracts with the insurance companies include a guaran-teed interest rate and return of capital. With respect to invest-ments in foreign investment vehicles, Canon has investigated the stability of the underlying governments and economies, the market characteristics such as settlement systems and the taxa-tion systems. For each such investment, Canon has selected the appropriate investment country and currency.
The three levels of input used to measure fair value are more fully described in Note 20. The fair values of Canon’s pension plan assets at December 31, 2017 and 2016, by asset category, are as follows:
NOTES TO CONSOLIDATED FINANCIAL STATEMENTS
CANON ANNUAL REPORT 201768
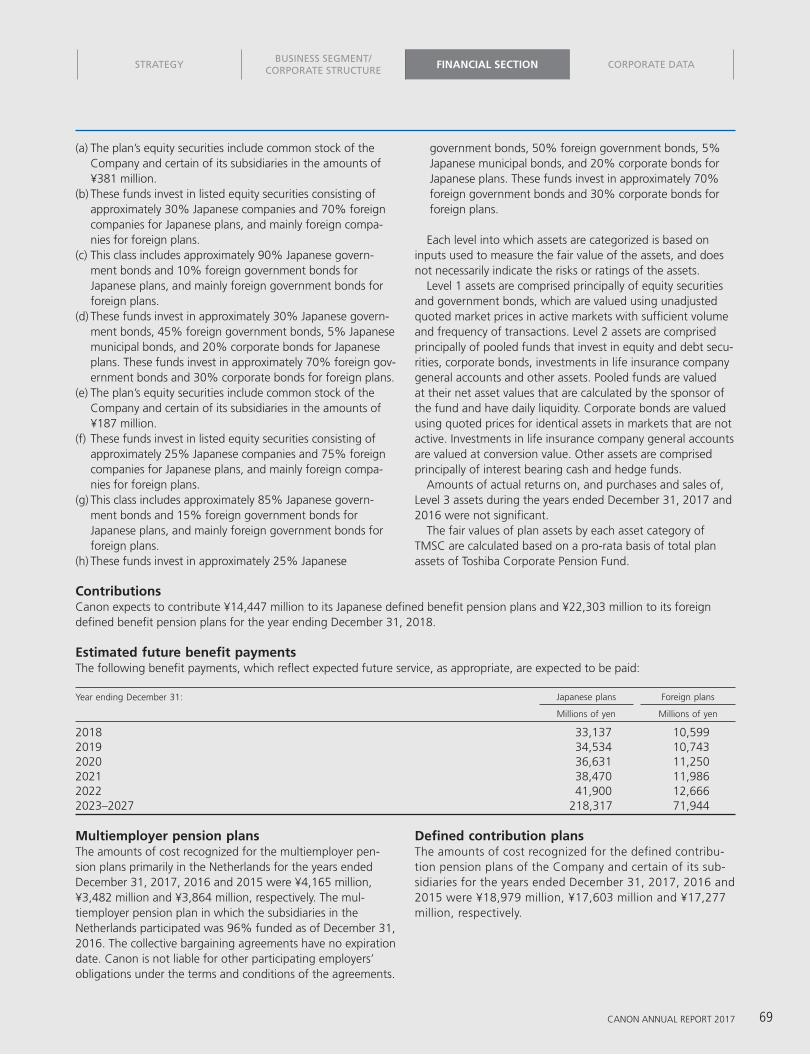
(a) The plan’s equity securities include common stock of the Company and certain of its subsidiaries in the amounts of ¥381 million.
(b) These funds invest in listed equity securities consisting of approximately 30% Japanese companies and 70% foreign companies for Japanese plans, and mainly foreign compa-nies for foreign plans.
(c) This class includes approximately 90% Japanese govern-ment bonds and 10% foreign government bonds for Japanese plans, and mainly foreign government bonds for foreign plans.
(d) These funds invest in approximately 30% Japanese govern-ment bonds, 45% foreign government bonds, 5% Japanese municipal bonds, and 20% corporate bonds for Japanese plans. These funds invest in approximately 70% foreign gov-ernment bonds and 30% corporate bonds for foreign plans.
(e) The plan’s equity securities include common stock of the Company and certain of its subsidiaries in the amounts of ¥187 million.
(f) These funds invest in listed equity securities consisting of approximately 25% Japanese companies and 75% foreign companies for Japanese plans, and mainly foreign compa-nies for foreign plans.
(g) This class includes approximately 85% Japanese govern-ment bonds and 15% foreign government bonds for Japanese plans, and mainly foreign government bonds for foreign plans.
(h) These funds invest in approximately 25% Japanese
government bonds, 50% foreign government bonds, 5% Japanese municipal bonds, and 20% corporate bonds for Japanese plans. These funds invest in approximately 70% foreign government bonds and 30% corporate bonds for foreign plans.
Each level into which assets are categorized is based on inputs used to measure the fair value of the assets, and does not necessarily indicate the risks or ratings of the assets.
Level 1 assets are comprised principally of equity securities and government bonds, which are valued using unadjusted quoted market prices in active markets with sufficient volume and frequency of transactions. Level 2 assets are comprised principally of pooled funds that invest in equity and debt secu-rities, corporate bonds, investments in life insurance company general accounts and other assets. Pooled funds are valued at their net asset values that are calculated by the sponsor of the fund and have daily liquidity. Corporate bonds are valued using quoted prices for identical assets in markets that are not active. Investments in life insurance company general accounts are valued at conversion value. Other assets are comprised principally of interest bearing cash and hedge funds.
Amounts of actual returns on, and purchases and sales of, Level 3 assets during the years ended December 31, 2017 and 2016 were not significant.
The fair values of plan assets by each asset category of TMSC are calculated based on a pro-rata basis of total plan assets of Toshiba Corporate Pension Fund.
Year ending December 31: Japanese plans Foreign plans
Millions of yen Millions of yen
2018 33,137 10,5992019 34,534 10,7432020 36,631 11,2502021 38,470 11,9862022 41,900 12,6662023–2027 218,317 71,944
ContributionsCanon expects to contribute ¥14,447 million to its Japanese defined benefit pension plans and ¥22,303 million to its foreign defined benefit pension plans for the year ending December 31, 2018.
Estimated future benefit paymentsThe following benefit payments, which reflect expected future service, as appropriate, are expected to be paid:
Multiemployer pension plansThe amounts of cost recognized for the multiemployer pen-sion plans primarily in the Netherlands for the years ended December 31, 2017, 2016 and 2015 were ¥4,165 million, ¥3,482 million and ¥3,864 million, respectively. The mul-tiemployer pension plan in which the subsidiaries in the Netherlands participated was 96% funded as of December 31, 2016. The collective bargaining agreements have no expiration date. Canon is not liable for other participating employers’ obligations under the terms and conditions of the agreements.
Defined contribution plansThe amounts of cost recognized for the defined contribu-tion pension plans of the Company and certain of its sub-sidiaries for the years ended December 31, 2017, 2016 and 2015 were ¥18,979 million, ¥17,603 million and ¥17,277 million, respectively.
CANON ANNUAL REPORT 2017 69
STRATEGYBUSINESS SEGMENT/
CORPORATE STRUCTURE FINANCIAL SECTION CORPORATE DATA

12. INCOME TAXES
Domestic and foreign components of income before income taxes and the current and deferred income tax expense attributable to such income are summarized as follows:
Years ended December 31 Millions of yen
Japanese Foreign Total
2017: Income before income taxes 276,149 77,735 353,884 Income taxes: Current 80,225 35,402 115,627 Deferred (7,453) (10,150) (17,603)
72,772 25,252 98,024
2016: Income before income taxes 135,131 109,520 244,651 Income taxes: Current 47,687 27,806 75,493 Deferred 4,126 3,062 7,188
51,813 30,868 82,681
2015: Income before income taxes 228,871 118,567 347,438
Income taxes: Current 80,020 31,413 111,433 Deferred 3,414 1,258 4,672
83,434 32,671 116,105
The Company and its domestic subsidiaries are subject to a number of income taxes, which, in the aggregate, repre-sent a statutory income tax rate of approximately 31%, 33% and 35% for the years ended December 31, 2017, 2016 and 2015, respectively.
The statutory income tax rate utilized for deferred tax assets and liabilities which are expected to be settled or realized in the periods from January 1, 2017 is approximately 31%. The adjustments of deferred tax assets and liabilities for amend-ments to the Japanese tax regulations which have been reflected in income taxes in the consolidated statements of
income for the years ended December 31, 2016 and 2015 were ¥3,498 million and ¥6,456 million, respectively.
The Tax Cuts and Jobs Act of 2017 (the “Act”) was enacted in the U.S. on December 22, 2017. Due to the Act, the fed-eral corporate income tax rate in the U.S. is reduced from 35% to 21% from the fiscal year commencing on January 1, 2018. The adjustment to deferred tax assets and liabilities for the tax rate change was tax benefit of ¥14,563 million for the year ended December 31, 2017. The impacts related to other changes from the Act are not material.
Years ended December 31 2017 2016 2015
Japanese statutory income tax rate 31.0% 33.0% 35.0%Increase (reduction) in income taxes resulting from: Expenses not deductible for tax purposes* 3.7 0.8 0.8 Income of foreign subsidiaries taxed at lower than Japanese statutory tax rate (2.1) (3.0) (2.9) Tax credit for research and development expenses (4.8) (3.0) (4.8) Change in valuation allowance 1.7 (0.8) (0.4) Effect of enacted changes in tax laws and rates on Japanese tax — 1.4 1.9 Effect of enacted changes in U.S. tax laws (3.6) — — Other 1.8 5.4 3.8
Effective income tax rate 27.7% 33.8% 33.4%
A reconciliation of the Japanese statutory income tax rate and the effective income tax rate as a percentage of income before income taxes is as follows:
NOTES TO CONSOLIDATED FINANCIAL STATEMENTS
* Expenses not deductible for tax purposes for the year ended December 31, 2017 primarily consist of impairment losses on goodwill.
CANON ANNUAL REPORT 201770

The tax effects of temporary differences that give rise to the deferred tax assets and deferred tax liabilities at December 31, 2017 and 2016 are presented below:
December 31 Millions of yen
2017 2016
Deferred tax assets: Inventories 11,921 15,387 Accrued business tax 4,705 1,835 Accrued pension and severance cost 98,114 108,781 Research and development—costs capitalized for tax purposes 5,383 5,998 Property, plant and equipment 33,488 26,519 Accrued expenses 30,126 31,316 Net operating losses carried forward 29,006 29,167 Other 38,526 33,782
251,269 252,785 Less valuation allowance (30,783) (26,687)
Total deferred tax assets 220,486 226,098
Deferred tax liabilities: Undistributed earnings of foreign subsidiaries (9,859) (9,450) Net unrealized gains on securities (1,815) (7,321) Tax deductible reserve (4,396) (4,449) Financing lease revenue (38,287) (47,802) Intangible assets (74,377) (85,888) Other (30,908) (29,751)
Total deferred tax liabilities (159,642) (184,661)
Net deferred tax assets 60,844 41,437
Millions of yen
Within one year 654After one year through five years 38,641After five years through ten years 39,278After ten years through twenty years 52,250Indefinite period 54,814
Total 185,637
Net deferred income tax assets and liabilities are included in the accompanying consolidated balance sheets under the follow-ing captions:
December 31 Millions of yen
2017 2016
Other assets 150,854 149,866Other noncurrent liabilities (90,010) (108,429)
60,844 41,437
The net changes in the total valuation allowance were an increase of ¥4,096 million for the year ended December, 2017 and a decrease of ¥6,244 million and ¥4,567 million for the years ended December 31, 2016 and 2015, respectively.
Based on the level of historical taxable income and
projections for future taxable income over the periods which the net deductible temporary differences are expected to reverse, management believes it is more likely than not that Canon will realize the benefits of these deferred tax assets, net of the valuation allowance, at December 31, 2017.
At December 31, 2017, Canon had net operating losses which can be carried forward for income tax purposes of ¥185,637 million to reduce future taxable income. Periods available to reduce future taxable income vary in each tax jurisdiction and gener-ally range from one year to an indefinite period as follows:
CANON ANNUAL REPORT 2017 71
STRATEGYBUSINESS SEGMENT/
CORPORATE STRUCTURE FINANCIAL SECTION CORPORATE DATA

Years ended December 31 Millions of yen
2017 2016 2015
Balance at beginning of year 7,318 6,056 6,431Additions for tax positions of the current year 2,956 2,741 2,174Additions for tax positions of prior years 250 — 165Reductions for tax positions of prior years (915) (665) (1,180)Settlements with tax authorities — (370) (505)Other 673 (444) (1,029)
Balance at end of year 10,282 7,318 6,056
Income taxes have not been accrued on undistributed earn-ings of domestic subsidiaries as the tax law provides a means by which the dividends from a domestic subsidiary can be received tax free.
Canon has not recognized deferred tax liabilities of ¥27,361 million for a portion of undistributed earnings of foreign subsidiaries of ¥961,735 million as of December 31,
2017 because Canon currently does not expect to have such amounts distributed or paid as dividends to the Company in the foreseeable future. Deferred tax liabilities will be recog-nized when Canon expects that it will realize those undistrib-uted earnings in a taxable manner, such as through receipt of dividends or sale of the investments.
A reconciliation of the beginning and ending amount of unrecognized tax benefits is as follows:
The total amounts of unrecognized tax benefits that would reduce the effective tax rate, if recognized, were ¥10,282 million and ¥7,318 million at December 31, 2017 and 2016, respectively.
Although Canon believes its estimates and assumptions of unrecognized tax benefits are reasonable, uncertainty regard-ing the final determination of tax examination settlements and any related litigation could affect the effective tax rate in a future period. Based on each of the items of which Canon is aware at December 31, 2017, no significant changes to the unrecognized tax benefits are expected within the next twelve months.
Canon recognizes interest and penalties accrued related to unrecognized tax benefits in income taxes. Both inter-est and penalties accrued at December 31, 2017 and 2016,
and interest and penalties included in income taxes for the years ended December 31, 2017, 2016 and 2015 were not significant.
Canon files income tax returns in Japan and various foreign tax jurisdictions. In Japan, Canon is no longer subject to reg-ular income tax examinations by the tax authority for years before 2017 with few exceptions. Canon is also no longer subject to a transfer pricing examination by the tax author-ity for years before 2017 with few exceptions. In other major foreign tax jurisdictions, including the United States and the Netherlands, Canon is no longer subject to income tax examinations by tax authorities for years before 2007 with few exceptions. The tax authorities are currently conducting income tax examinations of Canon’s income tax returns for years after 2006 in major foreign tax jurisdictions.
NOTES TO CONSOLIDATED FINANCIAL STATEMENTS
CANON ANNUAL REPORT 201772

14. OTHER COMPREHENSIVE INCOME (LOSS)
Changes in accumulated other comprehensive income (loss) for the years ended December 31, 2017, 2016 and 2015 are as follows:
Millions of yen
Foreigncurrency translation
adjustments
Unrealized gainsand losses
on securities
Gains andlosses on
derivative instruments
Pensionliability
adjustments Total
Balance at December 31, 2014 144,557 12,546 (2,603) (126,214) 28,286 Equity transactions with noncontrolling interests and other 73 — — — 73 Other comprehensive income (loss) before reclassifications (57,592) 1,691 (256) (6,155) (62,312) Amounts reclassified from accumulated other comprehensive income (loss) — (182) 3,041 1,352 4,211
Net change during the year (57,519) 1,509 2,785 (4,803) (58,028)
Balance at December 31, 2015 87,038 14,055 182 (131,017) (29,742) Equity transactions with noncontrolling interests and other 259 — — (1) 258 Other comprehensive income (loss) before reclassifications (101,350) 814 938 (67,511) (167,109) Amounts reclassified from accumulated other comprehensive income (loss) 93 382 (3,862) 99 (3,288)
Net change during the year (100,998) 1,196 (2,924) (67,413) (170,139)
Balance at December 31, 2016 (13,960) 15,251 (2,742) (198,430) (199,881) Equity transactions with noncontrolling interests and other — — — — — Other comprehensive income (loss) before reclassifications 44,184 2,813 (1,452) 14,785 60,330 Amounts reclassified from accumulated other comprehensive income (loss) (16) (12,580) 4,014 4,905 (3,677)
Net change during the year 44,168 (9,767) 2,562 19,690 56,653
Balance at December 31, 2017 30,208 5,484 (180) (178,740) (143,228)
13. LEGAL RESERVE AND RETAINED EARNINGS
The Corporation Law of Japan provides that an amount equal to 10% of distributions from retained earnings paid by the Company and its Japanese subsidiaries be appropriated as a legal reserve. No further appropriations are required when the total amount of the additional paid-in capital and the legal reserve equals 25% of their respective stated capital. The Corporation Law of Japan also provides that additional paid-in capital and legal reserve are available for appropriations by resolution of the shareholders. Certain foreign subsidiaries are also required to appropriate their earnings to legal reserves under the laws of their respective countries.
Cash dividends and appropriations to the legal reserve charged to retained earnings for the years ended December 31, 2017, 2016 and 2015 represent dividends paid out during
those years and the related appropriations to the legal reserve. Retained earnings at December 31, 2017 did not reflect cur-rent year-end dividends in the amount of ¥91,779 million which were approved by the shareholders in March 2018.
The amount available for dividends under the Corporation Law of Japan is based on the amount recorded in the Company’s nonconsolidated books of account in accordance with financial accounting standards of Japan. Such amount was ¥953,952 million at December 31, 2017.
Retained earnings at December 31, 2017 included Canon’s equity in undistributed earnings of affiliated compa-nies accounted for by the equity method in the amount of ¥17,139 million.
CANON ANNUAL REPORT 2017 73
STRATEGYBUSINESS SEGMENT/
CORPORATE STRUCTURE FINANCIAL SECTION CORPORATE DATA

Reclassifications out of accumulated other comprehensive income (loss) for the years ended December 31, 2017, 2016 and 2015 are as follows:
Years ended December 31 Amount reclassified from accumulated other comprehen-sive income (loss)*1
Millions of yen Affected line items in consolidated statements of income2017 2016 2015
Foreign currency translation adjustments (39) 139 — Other, net 12 (46) — Income taxes
(27) 93 — Consolidated net income
11 — —Net income attributable to noncontrollinginterests
(16) 93 — Net income attributable to Canon Inc.
Unrealized gains and losses on securities (18,472) 282 (298) Other, net 5,727 (94) 104 Income taxes
(12,745) 188 (194) Consolidated net income
165 194 12Net income attributable to noncontrollinginterests
(12,580) 382 (182) Net income attributable to Canon Inc.
Gains and losses on derivative instruments 5,772 (5,890) 4,217 Other, net (1,732) 2,049 (1,180) Income taxes
4,040 (3,841) 3,037 Consolidated net income
(26) (21) 4Net income attributable to noncontrolling interests
4,014 (3,862) 3,041 Net income attributable to Canon Inc.
Pension liability adjustments 7,005 (16) 1,504 See Note 11 (1,832) 164 (175) Income taxes
5,173 148 1,329 Consolidated net income
(268) (49) 23Net income attributable to noncontrollinginterests
4,905 99 1,352 Net income attributable to Canon Inc.
Total amount reclassified, net of tax and noncontrolling interests (3,677) (3,288) 4,211
*1 Amounts in parentheses indicate gains in consolidated statements of income.
NOTES TO CONSOLIDATED FINANCIAL STATEMENTS
CANON ANNUAL REPORT 201774

Tax effects allocated to each component of other comprehensive income (loss) and reclassification adjustments, including amounts attributable to noncontrolling interests, are as follows:
Years ended December 31 Millions of yen
Before-taxamount
Tax (expense)or benefit
Net-of-taxamount
2017:Foreign currency translation adjustments: Amount arising during the year 47,825 (708) 47,117 Reclassification adjustments for gains and losses realized in net income (39) 12 (27) Net change during the year 47,786 (696) 47,090Net unrealized gains and losses on securities: Amount arising during the year 5,100 (1,717) 3,383 Reclassification adjustments for gains and losses realized in net income (18,472) 5,727 (12,745) Net change during the year (13,372) 4,010 (9,362)Net gains and losses on derivative instruments: Amount arising during the year (2,080) 628 (1,452) Reclassification adjustments for gains and losses realized in net income 5,772 (1,732) 4,040 Net change during the year 3,692 (1,104) 2,588Pension liability adjustments: Amount arising during the year 20,991 (4,957) 16,034 Reclassification adjustments for gains and losses realized in net income 7,005 (1,832) 5,173 Net change during the year 27,996 (6,789) 21,207Other comprehensive income (loss) 66,102 (4,579) 61,5232016:Foreign currency translation adjustments: Amount arising during the year (108,280) 521 (107,759) Reclassification adjustments for gains and losses realized in net income 139 (46) 93
Net change during the year (108,141) 475 (107,666)Net unrealized gains and losses on securities: Amount arising during the year 1,184 (375) 809 Reclassification adjustments for gains and losses realized in net income 282 (94) 188
Net change during the year 1,466 (469) 997Net gains and losses on derivative instruments: Amount arising during the year 1,619 (726) 893 Reclassification adjustments for gains and losses realized in net income (5,890) 2,049 (3,841)
Net change during the year (4,271) 1,323 (2,948)Pension liability adjustments: Amount arising during the year (95,707) 25,204 (70,503) Reclassification adjustments for gains and losses realized in net income (16) 164 148
Net change during the year (95,723) 25,368 (70,355)
Other comprehensive income (loss) (206,669) 26,697 (179,972)
2015:Foreign currency translation adjustments (56,054) 550 (55,504)Net unrealized gains and losses on securities: Amount arising during the year 3,249 (1,045) 2,204 Reclassification adjustments for gains and losses realized in net income (298) 104 (194)
Net change during the year 2,951 (941) 2,010Net gains and losses on derivative instruments: Amount arising during the year 52 (304) (252) Reclassification adjustments for gains and losses realized in net income 4,217 (1,180) 3,037
Net change during the year 4,269 (1,484) 2,785Pension liability adjustments: Amount arising during the year (13,166) 5,294 (7,872) Reclassification adjustments for gains and losses realized in net income 1,504 (175) 1,329
Net change during the year (11,662) 5,119 (6,543)
Other comprehensive income (loss) (60,496) 3,244 (57,252)
CANON ANNUAL REPORT 2017 75
STRATEGYBUSINESS SEGMENT/
CORPORATE STRUCTURE FINANCIAL SECTION CORPORATE DATA

15. STOCK-BASED COMPENSATION
On May 1, 2011, based on the approval of the shareholders, the Company granted stock options to its directors, execu-tive officers and certain employees to acquire 912,000 shares of common stock. These option awards vest after two years of continued service beginning on the grant date and have a four year exercisable period. The grant-date fair value per share of the stock options granted during the year ended December 31, 2011 was ¥772.
On May 1, 2010, based on the approval of the shareholders,
the Company granted stock options to its directors, execu-tive officers and certain employees to acquire 890,000 shares of common stock. These option awards vest after two years of continued service beginning on the grant date and have a four year exercisable period. The grant-date fair value per share of the stock options granted during the year ended December 31, 2010 was ¥988.
The compensation cost recognized for these stock options for the years ended December 31, 2017, 2016 and 2015 was nil.
A summary of option activity under the stock option plans as of and for the years ended December 31, 2017, 2016 and 2015 is presented below:
Shares
Weighted-average
exercise price
Weighted-averageremainingcontractual
termAggregate
intrinsic value
Yen Year Millions of yen
Outstanding at January 1, 2015 1,861,800 4,036 0.7 248Exercised (249,600) 3,311Forfeited/Expired (316,200) 3,678
Outstanding at December 31, 2015 1,296,000 4,263 0.4 —Exercised — —Forfeited/Expired (693,000) 4,500
Outstanding at December 31, 2016 603,000 3,990 0.2 —Exercised — —Forfeited/Expired (603,000) 3,990
Outstanding at December 31, 2017 — — —
Exercisable at December 31, 2017 — — —
Cash received from the exercise of stock options for the years ended December 31, 2017 and 2016 were nil, and 2015 was ¥826 million, respectively.
NOTES TO CONSOLIDATED FINANCIAL STATEMENTS
CANON ANNUAL REPORT 201776

16. NET INCOME ATTRIBUTABLE TO CANON INC. SHAREHOLDERS PER SHARE
A reconciliation of the numerators and denominators of basic and diluted net income attributable to Canon Inc. shareholders per share computations is as follows:
The computation of diluted net income attributable to Canon Inc. shareholders per share for the years ended December 31, 2017 and 2016 excludes outstanding stock options because the effect would be anti-dilutive. The computation of diluted net income attributable to Canon Inc. shareholders per share for the year ended December 31, 2015 excludes certain outstanding stock options because the effect would be anti-dilutive.
Years ended December 31 Millions of yen
2017 2016 2015
Net income attributable to Canon Inc. 241,923 150,650 220,209
Number of shares
Average common shares outstanding 1,085,439,370 1,092,070,680 1,092,017,955
Effect of dilutive securities:
Stock options — — 34,931
Diluted common shares outstanding 1,085,439,370 1,092,070,680 1,092,052,886
Yen
Net income attributable to Canon Inc. shareholders per share:
Basic 222.88 137.95 201.65
Diluted 222.88 137.95 201.65
17. DERIVATIVES AND HEDGING ACTIVITIES
Risk management policyCanon operates internationally, exposing it to the risk of changes in foreign currency exchange rates. Derivative finan-cial instruments are comprised principally of foreign exchange contracts utilized by the Company and certain of its subsid-iaries to reduce the risk. Canon assesses foreign currency exchange rate risk by continually monitoring changes in the exposures and by evaluating hedging opportunities. Canon does not hold or issue derivative financial instruments for trad-ing purposes. Canon is also exposed to credit-related losses in the event of non-performance by counterparties to derivative financial instruments, but it is not expected that any counter-parties will fail to meet their obligations. Most of the counter-parties are internationally recognized financial institutions and selected by Canon taking into account their financial condi-tion, and contracts are diversified across a number of major financial institutions.
Foreign currency exchange rate risk managementCanon’s international operations expose Canon to the risk of changes in foreign currency exchange rates. Canon uses for-eign exchange contracts to manage certain foreign currency exchange exposures principally from the exchange of U.S. dol-lars and euros into Japanese yen. These contracts are primar-ily used to hedge the foreign currency exposure of forecasted intercompany sales and intercompany trade receivables that are denominated in foreign currencies. In accordance with Canon’s policy, a specific portion of foreign currency exposure resulting from forecasted intercompany sales are hedged using foreign exchange contracts which principally mature within three months.
CANON ANNUAL REPORT 2017 77
STRATEGYBUSINESS SEGMENT/
CORPORATE STRUCTURE FINANCIAL SECTION CORPORATE DATA

Fair value of derivative instruments in the consolidated balance sheetsThe following tables present Canon’s derivative instruments measured at gross fair value as reflected in the consolidated balance sheets at December 31, 2017 and 2016.
Contract amounts of foreign exchange contracts at December 31, 2017 and 2016 are set forth below:
December 31 Millions of yen
2017 2016
To sell foreign currencies 272,563 371,644
To buy foreign currencies 46,168 46,741
Derivatives designated as hedging instruments
December 31 Fair value
Millions of yen
Balance sheet location 2017 2016
Assets:
Foreign exchange contracts Prepaid expenses and other current assets 255 19
Liabilities:
Foreign exchange contracts Other current liabilities 367 1,913
Derivatives not designated as hedging instruments
December 31 Fair value
Millions of yen
Balance sheet location 2017 2016
Assets:
Foreign exchange contracts Prepaid expenses and other current assets 289 567
Liabilities:
Foreign exchange contracts Other current liabilities 2,892 7,479
Cash flow hedgeChanges in the fair value of derivative financial instruments designated as cash flow hedges, including foreign exchange contracts associated with forecasted intercompany sales, are reported in accumulated other comprehensive income (loss). These amounts are subsequently reclassified into earn-ings through other income (deductions) in the same period as the hedged items affect earnings. Substantially all amounts recorded in accumulated other comprehensive income (loss) at year-end are expected to be recognized in earnings over the next twelve months. Canon excludes the time value com-ponent from the assessment of hedge effectiveness. Changes in the fair value of a foreign exchange contract for the period
between the date that the forecasted intercompany sales occur and its maturity date are recognized in earnings and not considered hedge ineffectiveness.
Derivatives not designated as hedgesCanon has entered into certain foreign exchange contracts to primarily offset the earnings impact related to fluctuations in foreign currency exchange rates associated with certain assets denominated in foreign currencies. Although these foreign exchange contracts have not been designated as hedges as required in order to apply hedge accounting, the contracts are effective from an economic perspective. The changes in the fair value of these contracts are recorded in earnings immediately.
NOTES TO CONSOLIDATED FINANCIAL STATEMENTS
CANON ANNUAL REPORT 201778

Future minimum lease payments required under noncancelable operating leases that have initial or remaining lease terms in excess of one year at December 31, 2017 are as follows:
Effect of derivative instruments in the consolidated statements of incomeThe following tables present the effect of Canon’s derivative instruments in the consolidated statements of income for the years ended December 31, 2017, 2016 and 2015.
Derivatives in cash flow hedging relationships
Years ended December 31Gain (loss) recognized
in OCI (effective portion)
Gain (loss) reclassified fromaccumulated OCI into income
(effective portion)
Gain (loss) recognized in income(ineffective portion and amount excluded
from effectiveness testing)
Millions of yen Amount Location Amount Location Amount
2017: Foreign exchange contracts (2,080) Other, net (5,772) Other, net (332)
2016: Foreign exchange contracts 1,619 Other, net 5,890 Other, net (311)
2015: Foreign exchange contracts 52 Other, net (4,217) Other, net (131)
18. COMMITMENTS AND CONTINGENT LIABILITIES
CommitmentsAt December 31, 2017, commitments outstanding for the pur-chase of property, plant and equipment approximated ¥36,199 million, and commitments outstanding for the purchase of parts and raw materials approximated ¥135,649 million.
Canon occupies sales offices and other facilities under lease arrangements accounted for as operating leases. Deposits
made under such arrangements aggregated ¥13,740 million and ¥13,128 million at December 31, 2017 and 2016, respec-tively, and are included in noncurrent receivables in the accom-panying consolidated balance sheets. Rental expenses of cancelable and noncancelable operating leases amounted to ¥47,619 million, ¥42,714 million and ¥46,483 million for the years ended December 31, 2017, 2016 and 2015, respectively.
Derivatives not designated as hedging instruments
Years ended December 31 Gain (loss) recognized in income on derivative
Millions of yen
Location 2017 2016 2015
Foreign exchange contracts Other, net (7,932) 7,018 1,099
Year ending December 31: Millions of yen
2018 28,414
2019 21,437
2020 16,185
2021 12,721
2022 9,774
Thereafter 22,971
Total future minimum lease payments 111,502
CANON ANNUAL REPORT 2017 79
STRATEGYBUSINESS SEGMENT/
CORPORATE STRUCTURE FINANCIAL SECTION CORPORATE DATA

GuaranteesCanon provides guarantees for its employees, affiliates and other companies. The guarantees for the employees are prin-cipally made for their housing loans. The guarantees for affili-ates and other companies are made for their lease obligations and bank loans to ensure that those companies operate with less financial risk.
Canon would have to perform under a guarantee if the bor-rower defaults on a payment within the contract terms. The
contract terms are 1 year to 30 years in case of employees with housing loans, and 1 year to 7 years in case of affiliates and other companies with lease obligations and bank loans.The maximum amount of undiscounted payments Canon would have had to make in the event of default is ¥6,059 mil-lion at December 31, 2017. The carrying amounts of the liabil-ities recognized for Canon’s obligations as a guarantor under those guarantees at December 31, 2017 were not significant.
Legal proceedingsCanon is involved in various claims and legal actions arising in the ordinary course of business. Canon has recorded pro-visions for liabilities when it is probable that liabilities have been incurred and the amount of loss can be reasonably esti-mated. Canon reviews these provisions at least quarterly and adjusts these provisions to reflect the impact of the negotia-tions, settlements, rulings, advice of legal counsel and other
information and events pertaining to a particular case. Based on its experience, although litigation is inherently unpredict-able, Canon believes that any damage amounts claimed in outstanding matters are not a meaningful indicator of Canon’s potential liability. In the opinion of management, any reason-ably possible range of losses from outstanding matters would not have a material adverse effect on Canon’s consolidated financial position, results of operations, or cash flows.
Years ended December 31 Millions of yen
2017 2016
Balance at beginning of year 13,168 14,014Additions 18,893 15,403Utilization (12,957) (12,759)Other (1,652) (3,490)
Balance at end of year 17,452 13,168
Canon also issues contractual product warranties under which it generally guarantees the performance of products delivered and services rendered for a certain period or term. Changes in accrued product warranty costs for the years ended December 31, 2017 and 2016 are summarized as follows:
NOTES TO CONSOLIDATED FINANCIAL STATEMENTS
CANON ANNUAL REPORT 201780
20. FAIR VALUE MEASUREMENTS
Fair value is the price that would be received to sell an asset or paid to transfer a liability (an exit price) in the principal or most advantageous market for the asset or liability in an orderly transaction between market participants at the measure-ment date. A three-level fair value hierarchy that prioritizes the inputs used to measure fair value is as follows:
Level 1— Inputs are quoted prices in active markets for identi-cal assets or liabilities.
Level 2— Inputs are quoted prices for similar assets or liabil-ities in active markets, quoted prices for identical
or similar assets or liabilities in markets that are not active, inputs other than quoted prices that are observable, and inputs that are derived principally from or corroborated by observable market data by correlation or other means.
Level 3— Inputs are derived from valuation techniques in which one or more significant inputs or value drivers are unobservable, which reflect the reporting entity’s own assumptions about the assumptions that mar-ket participants would use in establishing a price.
19. DISCLOSURES ABOUT THE FAIR VALUE OF FINANCIAL INSTRUMENTS AND CONCENTRATIONS OF CREDIT RISK
Fair value of financial instrumentsThe estimated fair values of Canon’s financial instruments at December 31, 2017 and 2016 are set forth below. The following summary excludes cash and cash equivalents, trade receivables, finance receivables, noncurrent receivables, short-term loans, trade payables and accrued expenses for which fair values approximate their carrying amounts. The summary also excludes investments and derivative instruments which are disclosed in Note 2 and Note 17, respectively.
December 31 Millions of yen
2017 2016
Carryingamount
Estimatedfair value
Carryingamount
Estimatedfair value
Long-term debt, including current installments (499,168) (499,126) (612,538) (612,668)
The following methods and assumptions are used to esti-mate the fair value in the above table.
Long-term debtCanon’s long-term debt instruments are classified as Level 2 instruments and valued based on the present value of future cash flows associated with each instrument discounted using current market borrowing rates for similar debt instruments of comparable maturity. The levels are more fully described in Note 20.
Limitations of fair value estimatesFair value estimates are made at a specific point in time, based
on relevant market information and information about the financial instruments. These estimates are subjective in nature and involve uncertainties and matters of significant judgment and therefore cannot be determined with precision. Changes in assumptions could significantly affect the estimates.
Concentrations of credit riskAt December 31, 2017 and 2016, one customer accounted for approximately 8% and 12% of consolidated trade receiv-ables, respectively. Although Canon does not expect that the customer will fail to meet its obligations, Canon is potentially exposed to concentrations of credit risk if the customer failed to perform according to the terms of the contracts.
CANON ANNUAL REPORT 2017 81
STRATEGYBUSINESS SEGMENT/
CORPORATE STRUCTURE FINANCIAL SECTION CORPORATE DATA

Assets and liabilities measured at fair value on a recurring basisThe following tables present Canon’s assets and liabilities that are measured at fair value on a recurring basis consistent with the fair value hierarchy at December 31, 2017 and 2016.
December 31Millions of yen Level 1 Level 2 Level 3 Total
2017: Assets: Cash and cash equivalents — 70,500 — 70,500 Available-for-sale (current): Corporate bonds 1,222 — — 1,222 Available-for-sale (noncurrent): Government bonds 289 — — 289 Corporate bonds 605 217 — 822 Fund trusts 13 111 — 124 Equity securities 20,901 — — 20,901 Derivatives — 544 — 544
Total assets 23,030 71,372 — 94,402
Liabilities: Derivatives — 3,259 — 3,259
Total liabilities — 3,259 — 3,259
Year ended December 31, 2017Millions of yen Total loss Level 1 Level 2 Level 3 Total
2017: Asset: Goodwill (33,912) — — 29,370 29,370
Millions of yen Level 1 Level 2 Level 3 Total
2016: Assets: Cash and cash equivalents — 30,500 — 30,500 Available-for-sale (noncurrent): Government bonds 269 — — 269 Corporate bonds — 229 — 229 Fund trusts 12 74 — 86 Equity securities 42,444 — — 42,444 Derivatives — 586 — 586
Total assets 42,725 31,389 — 74,114
Liabilities:
Derivatives — 9,392 — 9,392
Total liabilities — 9,392 — 9,392
Assets and liabilities measured at fair value on a nonrecurring basisThe following table presents the Canon’s asset that was measured at fair value on a nonrecurring basis consistent with the fair value hierarchy and related impairment charge recognized during the year ended December 31, 2017. There were no assets or liabilities to be measured at fair value on a nonrecurring basis during the year ended December 31, 2016.
Level 1 investments are comprised principally of Japanese equity securities, which are valued using an unadjusted quoted market price in active markets with sufficient volume and fre-quency of transactions. Level 2 cash and cash equivalents are valued based on market approach, using quoted prices for identical assets in markets that are not active.
Derivative financial instruments are comprised of for-eign exchange contracts. Level 2 derivatives are valued using quotes obtained from counterparties or third parties, which are periodically validated by pricing models using observable market inputs, such as foreign currency exchange rates and interest rates, based on market approach.
NOTES TO CONSOLIDATED FINANCIAL STATEMENTS
CANON ANNUAL REPORT 201782

Goodwill was classified as Level 3 items and valued based on an income approach using unobservable inputs. Canon performed the annual goodwill impairment test as of October 1, 2017, which indicated that the fair value of the reporting unit was less than its carrying value. Canon recog-nized the impairment charge for the amount representing the excess of the carrying amount over the reporting unit’s
fair value. The fair value for the reporting unit was mea-sured based on the discounted cash flow method with 6.0% of weighted average cost of capital and estimated future cash flows. Future cash flows are based on management’s estimates of projected revenues, gross profits, operating expenses, a long-term growth rate, taking into consideration industry trends and market conditions.
Canon operates its business in four segments: the Office Business Unit, the Imaging System Business Unit, the Medical System Business Unit, and the Industry and Others Business Unit, which are based on the organizational structure and information reviewed by Canon’s management to evaluate results and allocate resources.
Based on the realignment of Canon’s internal reporting and management structure, Canon newly established Medical System Business Unit effective at the beginning of the second quarter of 2017, and certain businesses included in Industry and Others Business Unit have been reclassified. Operating results for the year ended December 31, 2017 have been reclassified and for the years ended December 31, 2016 and 2015 were not restated since they were not material. Total assets for the year ended December 31, 2016 have been restated and for the year ended December 31, 2015 were not restated since they were not material.
The primary products included in each segment are as follows:
Office Business Unit:Office multifunction devices (MFDs) / Laser multifunction print-ers (MFPs) / Laser printers / Digital production printing systems / High speed continuous feed printers / Wide-format printers / Document solutions
Imaging System Business Unit:Interchangeable-lens digital cameras / Digital compact cameras / Digital camcorders / Digital cinema cameras / Interchangeable lenses / Compact photo printers / Inkjet printers / Large format inkjet printers / Commercial photo printers / Image scanners / Multimedia projectors / Broadcast equipment / Calculators
Medical System Business Unit:Digital radiography systems / Diagnostic X-ray systems /Computed tomography / Magnetic resonance imaging /Diagnostic ultrasound systems / Clinical chemistry analyzers /Ophthalmic equipment
Industry and Others Business Unit:Semiconductor lithography equipment / FPD (Flat panel dis-play) lithography equipment / Vacuum thin-film deposition equipment / Organic LED (OLED) panel manufacturing equip-ment / Die bonders / Micromotors / Network cameras / Handy terminals / Document scanners
The accounting policies of the segments are substantially the same as those described in the significant accounting poli-cies in Note 1. Canon evaluates performance of, and allocates resources to, each segment based on operating profit.
21. SEGMENT INFORMATION
CANON ANNUAL REPORT 2017 83
STRATEGYBUSINESS SEGMENT/
CORPORATE STRUCTURE FINANCIAL SECTION CORPORATE DATA
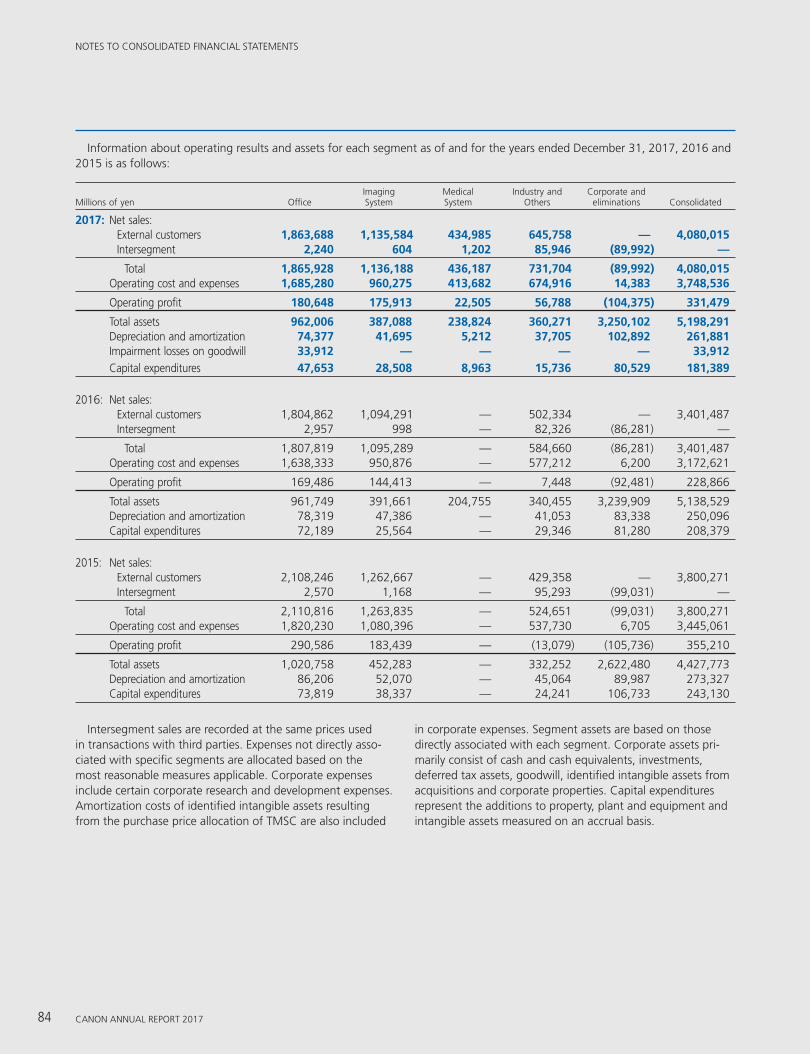
Millions of yen OfficeImagingSystem
MedicalSystem
Industry andOthers
Corporate andeliminations Consolidated
2017: Net sales: External customers 1,863,688 1,135,584 434,985 645,758 — 4,080,015 Intersegment 2,240 604 1,202 85,946 (89,992) —
Total 1,865,928 1,136,188 436,187 731,704 (89,992) 4,080,015 Operating cost and expenses 1,685,280 960,275 413,682 674,916 14,383 3,748,536
Operating profit 180,648 175,913 22,505 56,788 (104,375) 331,479
Total assets 962,006 387,088 238,824 360,271 3,250,102 5,198,291 Depreciation and amortization 74,377 41,695 5,212 37,705 102,892 261,881 Impairment losses on goodwill 33,912 — — — — 33,912 Capital expenditures 47,653 28,508 8,963 15,736 80,529 181,389
2016: Net sales: External customers 1,804,862 1,094,291 — 502,334 — 3,401,487 Intersegment 2,957 998 — 82,326 (86,281) —
Total 1,807,819 1,095,289 — 584,660 (86,281) 3,401,487 Operating cost and expenses 1,638,333 950,876 — 577,212 6,200 3,172,621
Operating profit 169,486 144,413 — 7,448 (92,481) 228,866
Total assets 961,749 391,661 204,755 340,455 3,239,909 5,138,529 Depreciation and amortization 78,319 47,386 — 41,053 83,338 250,096 Capital expenditures 72,189 25,564 — 29,346 81,280 208,379
2015: Net sales: External customers 2,108,246 1,262,667 — 429,358 — 3,800,271 Intersegment 2,570 1,168 — 95,293 (99,031) —
Total 2,110,816 1,263,835 — 524,651 (99,031) 3,800,271 Operating cost and expenses 1,820,230 1,080,396 — 537,730 6,705 3,445,061
Operating profit 290,586 183,439 — (13,079) (105,736) 355,210
Total assets 1,020,758 452,283 — 332,252 2,622,480 4,427,773 Depreciation and amortization 86,206 52,070 — 45,064 89,987 273,327 Capital expenditures 73,819 38,337 — 24,241 106,733 243,130
Information about operating results and assets for each segment as of and for the years ended December 31, 2017, 2016 and 2015 is as follows:
Intersegment sales are recorded at the same prices used in transactions with third parties. Expenses not directly asso-ciated with specific segments are allocated based on the most reasonable measures applicable. Corporate expenses include certain corporate research and development expenses. Amortization costs of identified intangible assets resulting from the purchase price allocation of TMSC are also included
in corporate expenses. Segment assets are based on those directly associated with each segment. Corporate assets pri-marily consist of cash and cash equivalents, investments, deferred tax assets, goodwill, identified intangible assets from acquisitions and corporate properties. Capital expenditures represent the additions to property, plant and equipment and intangible assets measured on an accrual basis.
NOTES TO CONSOLIDATED FINANCIAL STATEMENTS
CANON ANNUAL REPORT 201784

Information about product sales to external customers by business unit for the years ended December 31, 2017, 2016 and 2015 is as follows:
Years ended December 31 Millions of yen
2017 2016 2015
Office Monochrome copiers 287,823 289,532 328,061 Color copiers 405,576 386,193 421,209 Printers 702,491 664,846 857,369 Others 467,798 464,291 501,607
Total 1,863,688 1,804,862 2,108,246Imaging System Cameras 702,598 666,868 782,623 Inkjet printers 333,721 329,066 362,663 Others 99,265 98,357 117,381
Total 1,135,584 1,094,291 1,262,667Medical System Diagnostic equipment 434,985 — —Industry and Others Lithography equipment 193,113 121,090 123,887 Others 452,645 381,244 305,471
Total 645,758 502,334 429,358
Consolidated 4,080,015 3,401,487 3,800,271
Millions of yen
2017 2016 2015
Net sales: Japan 884,828 706,979 714,280 Americas 1,107,515 963,544 1,144,422 Europe 1,028,415 913,523 1,074,366 Asia and Oceania 1,059,257 817,441 867,203
Total 4,080,015 3,401,487 3,800,271
Long-lived assets: Japan 1,081,522 1,163,374 937,716 Americas 141,937 147,129 150,105 Europe 174,889 166,734 183,451 Asia and Oceania 149,244 164,007 189,588
Total 1,547,592 1,641,244 1,460,860
Information by major geographic area as of and for the years ended December 31, 2017, 2016 and 2015 is as follows:
Net sales are attributed to areas based on the location where the product is shipped to the customers. Other than in Japan and the United States, Canon does not conduct busi-ness in any individual country in which its sales in that coun-try exceed 10% of consolidated net sales. Net sales in the United States were ¥1,022,305 million, ¥884,083 million and
¥1,047,838 million for the years ended December 31, 2017, 2016 and 2015, respectively.
Long-lived assets represent property, plant and equipment and intangible assets for each geographic area.
CANON ANNUAL REPORT 2017 85
STRATEGYBUSINESS SEGMENT/
CORPORATE STRUCTURE FINANCIAL SECTION CORPORATE DATA

SCHEDULE II VALUATION AND QUALIFYING ACCOUNTS
Years ended December 31
Millions of yenBalance at
beginning of periodAddition-charged
to incomeDeduction bad debts
written offTranslation
adjustments and otherBalance at
end of period
2017: Allowance for doubtful receivables Trade receivables 11,075 3,574 (1,787) 516 13,378 Finance receivables 2,325 1,436 (1,523) 443 2,6812016: Allowance for doubtful receivables Trade receivables 12,077 1,460 (1,824) (638) 11,075 Finance receivables 2,878 398 (978) 27 2,3252015: Allowance for doubtful receivables Trade receivables 12,122 2,180 (1,745) (480) 12,077 Finance receivables 6,276 55 (1,343) (2,110) 2,878
CANON ANNUAL REPORT 201786

The management of Canon is responsible for establishing and maintaining adequate internal control over financial reporting. Internal control over financial reporting is defined in Rule 13a-15(f) promulgated under the Securities Exchange Act of 1934, as amended, as a process designed by, or under the supervision of, the company’s principal executive and principal financial officers and effected by the company’s board of directors, management and other personnel, to provide reasonable assurance regarding the reliability of financial reporting and the preparation of financial statements for external purposes in accordance with gener-ally accepted accounting principles and includes those policies and procedures that (1) pertain to the maintenance of records that in reasonable detail accurately and fairly reflect the transactions and dispositions of the assets of the company; (2) provide rea-sonable assurance that transactions are recorded as necessary to permit preparation of financial statements in accordance with generally accepted accounting principles, and that receipts and expenditures of the company are being made only in accordance with authorizations of management and directors of the company; and (3) provide reasonable assurance regarding prevention or timely detection of unauthorized acquisition, use or disposition of the company’s assets that could have a material effect on the financial statements.
Because of its inherent limitations, internal control over financial reporting may not prevent or detect misstatements. Also, pro-jections of any evaluation of effectiveness to future periods are subject to the risk that controls may become inadequate because of changes in conditions, or that the degree of compliance with the policies or procedures may deteriorate.
Canon’s management assessed the effectiveness of internal control over financial reporting as of December 31, 2017. In making this assessment, management used the criteria established in internal Control –Integrated Framework issued by the Committee of Sponsoring Organizations of the Treadway Commission (2013 framework) (the “COSO criteria”).
Based on its assessment, management concluded that, as of December 31, 2017, Canon’s internal control over financial report-ing was effective based on the COSO criteria.
Canon’s independent registered public accounting firm, Ernst & Young ShinNihon LLC, has issued an audit report on the effec-tiveness of Canon’s internal control over financial reporting. This report appears in Item 18.
During 2017, Toshiba Medical Systems Corporation (“TMSC”) (Canon Medical Systems Corporation as of January 4, 2018) which Canon acquired in 2016 was integrated into the Canon’s internal control over financial reporting. Canon assessed the effective-ness of internal control over financial reporting of TMSC as of December 31, 2017. There are no other changes in Canon’s inter-nal control over financial reporting that occurred during the period covered by this Annual Report that has materially affected, or is reasonably likely to materially affect, its internal control over financial reporting.
CANON ANNUAL REPORT 2017 87
MANAGEMENT’S REPORT ON INTERNAL CONTROL OVER FINANCIAL REPORTING
To the Shareholders and the Board of Directors ofCanon Inc.
Opinion on the Financial StatementsWe have audited the accompanying consolidated balance sheets of Canon Inc. and subsidiaries (the Company) as of December 31, 2017 and 2016, the related consolidated statements of income, comprehensive income, equity and cash flows for each of the three years in the period ended December 31, 2017, and the related notes and schedule of valuation and qualifying accounts (collectively referred to as the “consolidated financial statements”). In our opinion, the consolidated financial statements present fairly, in all material respects, the financial position of the Company at December 31, 2017 and 2016, and the results of its operations and its cash flows for each of the three years in the period ended December 31, 2017, in conformity with U.S. generally accepted accounting principles.
We also have audited, in accordance with the standards of the Public Company Accounting Oversight Board (United States) (PCAOB), the Company’s internal control over financial reporting as of December 31, 2017, based on criteria established in Internal Control—Integrated Framework issued by the Committee of Sponsoring Organizations of the Treadway Commission (2013 framework) and our report dated March 29, 2018 expressed an unqualified opinion thereon.
Basis for OpinionThese financial statements are the responsibility of the Company’s management. Our responsibility is to express an opinion on the Company’s financial statements based on our audits. We are a public accounting firm registered with the PCAOB and are required to be independent with respect to the Company in accordance with the U.S. federal securities laws and the applicable rules and regulations of the Securities and Exchange Commission and the PCAOB.
We conducted our audits in accordance with the standards of the PCAOB. Those standards require that we plan and perform the audit to obtain reasonable assurance about whether the financial statements are free of material misstatement, whether due to error or fraud. Our audits included performing procedures to assess the risks of material misstatement of the financial statements, whether due to error or fraud, and performing procedures that respond to those risks. Such procedures included examining, on a test basis, evidence regard-ing the amounts and disclosures in the financial statements. Our audits also included evaluating the accounting principles used and sig-nificant estimates made by management, as well as evaluating the overall presentation of the financial statements. We believe that our audits provide a reasonable basis for our opinion.
We have served as the Company’s auditor for SEC reporting purposes since 2004, and as its Japanese statutory auditor since 1978.
March 29, 2018
CANON ANNUAL REPORT 201788
REPORT OF INDEPENDENT REGISTEREDPUBLIC ACCOUNTING FIRM
To the Shareholders and the Board of Directors ofCanon Inc.
Opinion on Internal Control over Financial ReportingWe have audited Canon Inc. and subsidiaries’ internal control over financial reporting as of December 31, 2017, based on criteria estab-lished in Internal Control—Integrated Framework issued by the Committee of Sponsoring Organizations of the Treadway Commission (2013 framework) (the COSO criteria). In our opinion, Canon Inc. and subsidiaries (the Company) maintained, in all material respects, effective internal control over financial reporting as of December 31, 2017, based on the COSO criteria.
We also have audited, in accordance with the standards of the Public Company Accounting Oversight Board (United States) (PCAOB), the consolidated balance sheets of the Company as of December 31, 2017 and 2016, the related consolidated statements of income, comprehensive income, equity and cash flows for each of the three years in the period ended December 31, 2017, and the related notes and schedule of valuation and qualifying accounts and our report dated March 29, 2018 expressed an unqualified opinion thereon.
Basis for OpinionThe Company’s management is responsible for maintaining effective internal control over financial reporting and for its assessment of the effectiveness of internal control over financial reporting included in the accompanying Management’s Report on Internal Control over Financial Reporting. Our responsibility is to express an opinion on the Company’s internal control over financial reporting based on our audit. We are a public accounting firm registered with the PCAOB and are required to be independent with respect to the Company in accordance with the U.S. federal securities laws and the applicable rules and regulations of the Securities and Exchange Commission and the PCAOB.
We conducted our audit in accordance with the standards of the PCAOB. Those standards require that we plan and perform the audit to obtain reasonable assurance about whether effective internal control over financial reporting was maintained in all material respects.
Our audit included obtaining an understanding of internal control over financial reporting, assessing the risk that a material weakness exists, testing and evaluating the design and operating effectiveness of internal control based on the assessed risk, and performing such other procedures as we considered necessary in the circumstances. We believe that our audit provides a reasonable basis for our opinion.
Definition and Limitations of Internal Control Over Financial ReportingA company’s internal control over financial reporting is a process designed to provide reasonable assurance regarding the reliability of financial reporting and the preparation of financial statements for external purposes in accordance with generally accepted accounting principles. A company’s internal control over financial reporting includes those policies and procedures that (1) pertain to the maintenance of records that, in reasonable detail, accurately and fairly reflect the transactions and dispositions of the assets of the company; (2) provide reasonable assurance that transactions are recorded as necessary to permit preparation of financial statements in accordance with gener-ally accepted accounting principles, and that receipts and expenditures of the company are being made only in accordance with authori-zations of management and directors of the company; and (3) provide reasonable assurance regarding prevention or timely detection of unauthorized acquisition, use or disposition of the company’s assets that could have a material effect on the financial statements.
Because of its inherent limitations, internal control over financial reporting may not prevent or detect misstatements. Also, projections of any evaluation of effectiveness to future periods are subject to the risk that controls may become inadequate because of changes in con-ditions, or that the degree of compliance with the policies or procedures may deteriorate.
March 29, 2018
CANON ANNUAL REPORT 2017 89
REPORT OF INDEPENDENT REGISTEREDPUBLIC ACCOUNTING FIRM

Canon Inc.
30-2, Shimomaruko 3-chome, Ohta-ku, Tokyo 146-8501, Japan
Manager of the Register of Shareholders
Mizuho Trust & Banking Co., Ltd.2-1, Yaesu 1-chome, Chuo-ku, Tokyo 103-8670, Japan
Depositary and Agent with Respect to AmericanDepositary Receipts for Common Shares
JPMorgan Chase Bank, N.A.4 New York Plaza Floor 12, New York, NY 10004, USA
Stock Exchange Listings:
Tokyo, Nagoya, Fukuoka, Sapporo and New Yorkstock exchanges
American Depositary Receipts are traded on the New YorkStock Exchange (CAJ).
Ordinary General Meeting of Shareholders:
March 29, 2018, in Tokyo
Further Information:
For publications or information, please contact thePublic Affairs Headquarters, Canon Inc., Tokyo,or access Canon’s Website atglobal.canon/en
CANON ANNUAL REPORT 201790
TRANSFER AND REGISTRAR’S OFFICE
SHAREHOLDERINFORMATION

Manufacturing
Canon Precision Inc.
Fukushima Canon Inc.
Toshiba Medical Systems Corporation
Toshiba Electron Tubes & Devices Co., Ltd.
Canon Chemicals Inc.
Canon Components, Inc.
Canon Electronics Inc.
Canon Finetech Nisca Inc.
Canon Tokki Corporation
Canon ANELVA Corporation
Nagahama Canon Inc.
Canon Machinery Inc.
Oita Canon Materials Inc.
Oita Canon Inc.
Nagasaki Canon Inc.
Miyazaki Canon Inc.
Canon Virginia, Inc.
Canon Bretagne S.A.S.
Axis Communications AB
Océ-Technologies B.V.
Océ Printing Systems G.m.b.H. & Co. KG
Canon Dalian Business Machines, Inc.
Canon (Suzhou) Inc.
Canon Zhongshan Business Machines Co., Ltd.
Canon Zhuhai, Inc.
Canon Inc., Taiwan
Canon Vietnam Co., Ltd.
Canon Hi-Tech (Thailand) Ltd.
Canon Prachinburi (Thailand) Ltd.
Canon Business Machines (Philippines), Inc.
Canon Opto (Malaysia) Sdn. Bhd.
Toshiba Medical Systems Manufacturing Asia Sdn. Bhd.
Research & Development
Canon Research Centre France S.A.S.
Canon Information Systems Research Australia Pty. Ltd.
Marketing & Other
Canon Marketing Japan Inc.
Canon System and Support Inc.
Canon IT Solutions Inc.
Toshiba Medical Finance Co., Ltd.
Canon U.S.A., Inc.
Canon Canada Inc.
Canon Solutions America, Inc.
Canon Financial Services, Inc.
Toshiba America Medical Systems, Inc.
Axis AB
Canon Europa N.V.
Canon Europe Ltd.
Canon Ru LLC
Canon (UK) Ltd.
Canon Deutschland GmbH
Canon (Schweiz) AG
Canon Nederland N.V.
Canon France S.A.S.
Canon Middle East FZ-LLC
Canon Italia S.p.A.
Toshiba Medical Systems Europe B.V.
Canon (China) Co., Ltd.
Canon Hongkong Co., Ltd.
Canon Singapore Pte. Ltd.
Canon India Pvt. Ltd.
Canon Australia Pty. Ltd.
MAJOR CONSOLIDATED SUBSIDIARIES(As of December 31, 2017)
CANON ANNUAL REPORT 2017 91

©Canon Inc. 2018 PUB.BEP027-01 0418
CA
NO
N A
NN
UA
L RE
PO
RT
20
17
30-2, Shimomaruko 3-chome, Ohta-ku, Tokyo 146-8501, Japan
CANON INC.