Embed Size (px)
Citation preview

Canola Derived Biodiesel as Blending Agent for Petroleum Based Fuels
A Thesis submitted in partial fulfillment of the requirements for the degree of Master of
Science at George Mason University
by
Phung Kim Vo
Bachelor of Science
George Mason University, 2012
Director: George W. Mushrush, Professor
Department of Chemistry
Fall Semester 2013
George Mason University
Fairfax, VA

ii
This work is licensed under a creative commons
attribution-noderivs 3.0 unported license.

iii
DEDICATION
This thesis is dedicated to my family, especially my parents, Vo Trung Mai and Ha Thi
Minh Phi, for their unconditional love, support and belief in me. I also dedicate this thesis
to my love, Phan Nguyen Lap, for always being by my side, and his words of
encouragement have been a big support through my graduate school.

iv
ACKNOWLEDGEMENTS
I would like to express my deepest appreciation to my research mentor, Dr. George W.
Mushrush, for his guidance, kindness and encouragement during my undergraduate and
graduate school to finish this research. I would not be able to get this far without his
support.
I would also like to thank Mr. Harry Castillo for giving me opportunities to assist his
doctoral project, which gave me helpful knowledge to carry out my own research project.
I would also like show my appreciation to Mr. Michael Girgis for his great help during
my laboratory work, Ms. Jun Liu for helping me perform GC/MS and her feedback in my
GC/MS analysis.
And again, I would like to send my appreciation to my parents and my brother for their
financial support throughout my college life, and my boyfriend, for his support,
encouragement and unwavering belief in me all these years. For all my friends who have
been always by my side when I was about to give up halfway, I would like to thank you
all and be grateful for all you guys have done for me.

v
TABLE OF CONTENTS
Page
List of Tables ..................................................................................................................... vi
List of Figures ................................................................................................................... vii
List of Abbreviations or Symbols .................................................................................... viii
Abstract .............................................................................................................................. ix
1.0 Background ................................................................................................................... 1
1.1 Gasoline ..................................................................................................................... 1
1.2 Jet Fuel ...................................................................................................................... 2
1.3 Pressure on Fuel Industry .......................................................................................... 3
1.4 Biodiesel .................................................................................................................... 4
1.5 Canola Oil ................................................................................................................. 5
2.0 Thesis ............................................................................................................................ 8
3.0 Experimental ................................................................................................................. 9
3.1 Reagents .................................................................................................................... 9
3.2 Method .................................................................................................................... 10
3.2.1 Gas Chromatography/Mass Spectrometry ........................................................ 12
4.0 Result and analysis ...................................................................................................... 13
4.1 Result Data from GC/MS ........................................................................................ 13
4.2 Discussion ............................................................................................................... 16
5.0 Conclusion .................................................................................................................. 18
6.0 Future directions and expectation ............................................................................... 19
References ......................................................................................................................... 20

vi
LIST OF TABLES
Table Page
Table 1: Gasoline Properties ............................................................................................... 2 Table 2: Jet Fuel (JP-5 and JP-8) Properties ....................................................................... 3
Table 3: Canola Oil Properties (Gunstone 2009) ................................................................ 6
Table 4: Fatty Acid Composition ........................................................................................ 7
Table 5: MS 15-minute Area % Report ............................................................................ 13 Table 6: MS 30-minute Area % Report ............................................................................ 14 Table 7: MS 60-minute Area % Report ............................................................................ 14 Table 8: MS 90-minute Area % Report ............................................................................ 15

vii
LIST OF FIGURES
Figure Page
Figure 1: Biodiesel Production 2011-2013 ......................................................................... 5 Figure 2: Conversion Reaction of Fatty Acid to FAME ..................................................... 9
Figure 3: Stainless Steel Tube 316 .................................................................................... 11
Figure 4: Furnace 47900 ................................................................................................... 11
Figure 5: Experimental Set-up .......................................................................................... 12 Figure 6: GC 15-minute Interval....................................................................................... 13 Figure 7: GC 30-minute Interval....................................................................................... 14 Figure 8: GC 60-min Interval ........................................................................................... 14
Figure 9: GC 90-min Interval ........................................................................................... 15 Figure 10: MS of C-17 ...................................................................................................... 15
Figure 11: Library MS of Hexadecane ............................................................................. 16 Figure 12: Possible Mechanism of Conversion Fatty Acid to Long Chain Hydrocarbon 17

viii
LIST OF ABBREVIATIONS OR SYMBOLS
U.S. Energy Information Administration........................................................................ EIA
Fatty Acid Methyl Ester ............................................................................................. FAME
Gas Chromatography/Mass Spectrometry ................................................................ GC/MS
DCM .......................................................................................................... Dichloromethane
RT .................................................................................................................. Retention time
ARS ........................................................................................ Agriculture Research Service

ix
ABSTRACT
CANOLA DERIVED BIODIESEL AS BLENDING AGENT FOR PETROLEUM
BASED FUELS
Phung Kim Vo, M.S.
George Mason University, 2013
Thesis Director: Dr. George W. Mushrush
The fuel industry has been under significant pressures due to economic and
environmental concerns. Finding cleaner and safer alternative fuel source was put in high
demand. Biodiesel has been the most favorable source in the biofuel field for a while, and
soybean has been the leading feedstock for making biodiesel. There are also other types
of oil such as corn, palm, peanut or canola oil for making either 100% biodiesel (B100)
or biodiesel blending stock for petroleum based fuels. Canola oil when crushed out will
give up to 44% of oil content, the highest oil content among other types of the
agricultural oil while soybean has about 20% and corn has 5% of oil content respectively.
Because of its properties such as high flash point, lower cloud point and the stability in
cold-weather region, and flexible crop season in fall and spring, canola oil methyl ester,
derived product of canola oil esterification, was taken into research in which it was
subjected to conditions that mimic the petroleum refining process (delayed coking). Four

x
tubes of canola oil ME went through pyrolysis process (90 psi and 400oC) in different
time interval: 15, 30, 60 and 90 minutes. Result from GC/MS showed the presence of
FAMEs such as palmitic, oleic, elaidic, and stearic acid methyl ester. In GC of 90-minute
interval, all FAMEs except stearic acid methyl ester were replaced by hexadecane peaks
(C16H34). The total area percentage of all hexadecane peak in GC of 90-minute is 32.27
%.

1
1.0 BACKGROUND
1.1 Gasoline
Gasoline is the main fuel source now in the automobile industry despite the fluctuation in
supply and pricing. Crude oil is the raw material for gasoline which must undergoes
complex refining process to crack into lighter hydrocarbon chains (C4-C12 hydrocarbon
for gasoline). Other products from crude oil along with gasoline are naphtha, kerosene,
diesel, heating oil, or lubricating oils. In the United States, gasoline is blended with
approximately 15% of C4-C8 alkanes, 25-40% of C4-C10, 10% cycloalkanes, and
maximum of 25% aromatic compounds, and about 10% of alkenes and cyclic alkenes
(Ritter 2005). Some other components sometimes found in gasoline are toluene, xylene,
and even lead (which appear as a big concern for human health and environment).
Gasoline appears as colorless or pale brown; boiling points depend on percentage of
distillation. Its flash point is very low compared to other fuel sources, -46oC (ATSDR
Gasoline Profile 1995). Gasoline is the main consumer fuel sources and even though
diesel and biodiesel are more economical, vehicles running on gasoline engine are still
cheaper than ones run on diesel and biodiesel. World consumption for crude oil in 2012
was 89.2 million barrel per day (bpd), and is expected to reach 1.05 million bpd in 2013
and 1.4 in 2014. United States produced about 6.4 million bpd of crude oil in 2012;
however, this number has decreased since 2012 probably due to increases in crude oil

2
import from unstable oil-producing countries (IER 2012). Table 1 below lists some
general properties of gasoline such as solubility, density, auto-ignition temperature and
flash point.
Table 1: Gasoline Properties
Property
Color Colorless/Pale Brown
Physical State Liquid
Boiling Point (Depending on % of distilled) 10% distilled 60oC
50% distilled 110oC
90% distilled 170oC
Density 0.7-0.8 g/cm3
Solubility
Insoluble in water
Soluble in absolute alcohol, ether,
chloroform, and benzene
Auto-ignition temperature 280-486oC
Flash Point -46oC
1.2 Jet Fuel Jet fuel does not have a specific formula or general properties like gasoline. It is a special
type of blended fuel from fractionated distillation of crude oil (Alglas). Jet fuel is more
complex than gasoline because of its working conditions like aircraft turbine engines
which are often required to operate in extreme weather conditions. Kerosene, thin oil
distillated from petroleum or shale oil, is the most common compounds in most of jet fuel
types. There are many jet fuel types such as JET A-1, JP4, JP5, JP7, or JP8, depending on
their purpose of usage. JET A-1 is most commonly used in commercial aviation; JP4, 5, 7
and are mostly used in U.S Navy and U.S Air Force. Each jet fuel type has different
melting and boiling point, density, auto-ignition temperature and flash point. Jet fuel is
less volatile than gasoline due to higher flash point. JP5 which is mainly served as U.S

3
Navy fuel has about 53% of C9-C16, 31% of cyclo-paraffin, and 16% of aromatic
compounds. JP-8 is similar to Jet A-1, mainly composed of C8-C9 aliphatic hydrocarbons,
9% of C10-C14 and 65% of C15-C17 (Henderson et al 1996).Table 2 displays general
properties of JP-5 and JP-8 used in military aircrafts (ATSDR Jet Fuel Profile 1998).
Table 2: Jet Fuel (JP-5 and JP-8) Properties
JP-5 JP-8
Color Clear and Bright Clear and bright
Melting point -46oC -52
oC
Boiling point 170oC 170
oC
Density 0.788-0.845kg/L 0.775-0.840kg/L
Auto-ignition temp 229oC (kerosene)
Flash Point 60oC 38
oC
1.3 Pressure on Fuel Industry
Fuel prices in the US have been increasing in the past couple years, and not showed any
sign of stabilizing. Since the United States only produces about half of the amount of
crude oil barrel to satisfy domestic demand, it must rely heavily on importing from other
oil-producing countries. Imbalance between supply and demand has sparked many
interests in alternative options to petroleum. These alternatives come in both flavors: non-
renewable sources such as used automobile oil and renewable sources such as biofuels.
Diesel has always been a major source of energy for heavy duty vehicles and equipment.
However, it remains an unpopular choice for consumer vehicles due to the several factors
such as higher cost of ownership, lack of choices, and its negative impact on public health
effects due to emission exhaust. Diesel exhaust tends to have higher amount of carbon
4
dioxide, carbon monoxides, nitrogen oxides, sulfur oxides, or aldehyde compounds such
as formaldehydes and acetaldehyde, benzene, some polycyclic aromatic hydrocarbons
(PAHs) and nitro-PAHs, and other pollutants which ultimately can cause cancers or
genetic mutations (UCUSA 2002).
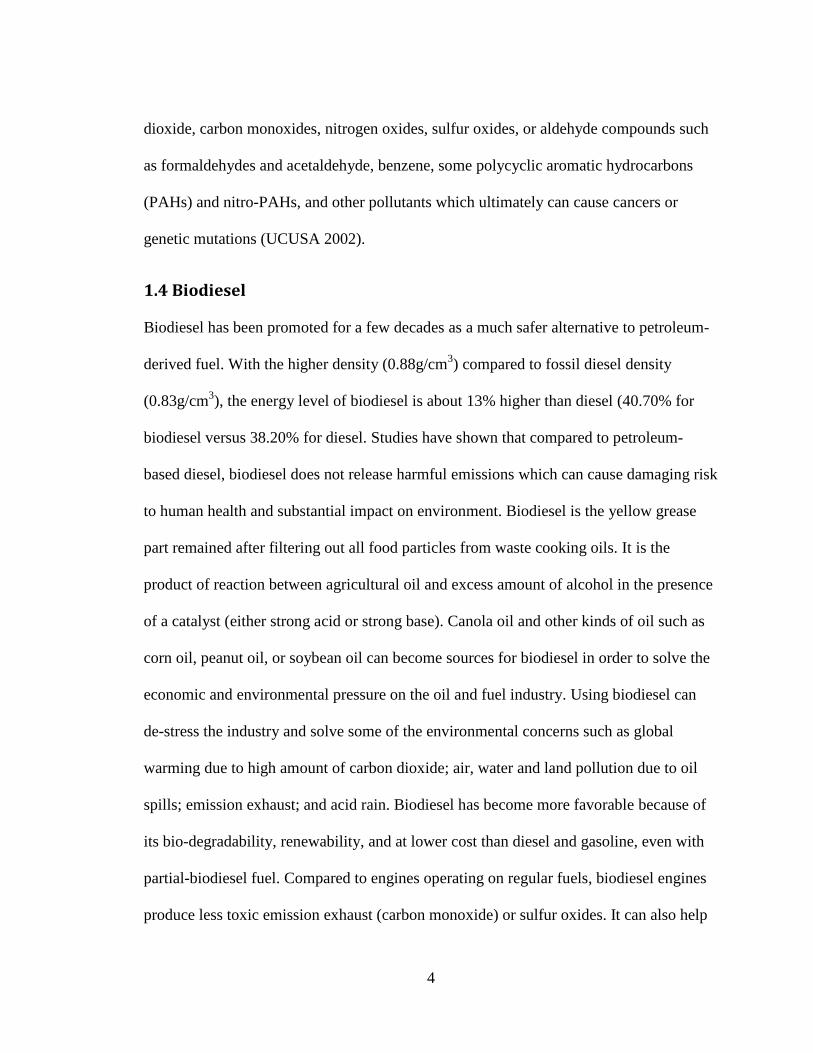
1.4 Biodiesel
Biodiesel has been promoted for a few decades as a much safer alternative to petroleum-
derived fuel. With the higher density (0.88g/cm3) compared to fossil diesel density
(0.83g/cm3), the energy level of biodiesel is about 13% higher than diesel (40.70% for
biodiesel versus 38.20% for diesel. Studies have shown that compared to petroleum-
based diesel, biodiesel does not release harmful emissions which can cause damaging risk
to human health and substantial impact on environment. Biodiesel is the yellow grease
part remained after filtering out all food particles from waste cooking oils. It is the
product of reaction between agricultural oil and excess amount of alcohol in the presence
of a catalyst (either strong acid or strong base). Canola oil and other kinds of oil such as
corn oil, peanut oil, or soybean oil can become sources for biodiesel in order to solve the
economic and environmental pressure on the oil and fuel industry. Using biodiesel can
de-stress the industry and solve some of the environmental concerns such as global
warming due to high amount of carbon dioxide; air, water and land pollution due to oil
spills; emission exhaust; and acid rain. Biodiesel has become more favorable because of
its bio-degradability, renewability, and at lower cost than diesel and gasoline, even with
partial-biodiesel fuel. Compared to engines operating on regular fuels, biodiesel engines
produce less toxic emission exhaust (carbon monoxide) or sulfur oxides. It can also help

5
enhancing fuel stability in both hot and cold weather regions, higher flash point, and
decreasing emission exhaust.
Figure 1: Biodiesel Production 2011-2013
Production of biodiesel in the United States was 127 million gallons in September 2013,
with approximately 64% from the Midwest region; compared to 20122, this is an increase
of 31.1 million gallons. Biodiesel is both sold as B100 (100% biodiesel) or as blending
stock with other fuel sources. About 976 million pounds of feedstock was used to
produce biodiesel, and soybean oil is still the leading stock for biodiesel with 502 million
pounds used during September 2013 (EIA Report 2013).
1.5 Canola Oil
Canola oil is rapeseed oil with low erucic acid concentration. Its name was changed in
1979 after Western Canadian Oilseed Crushers Association succeeded in lowering the
amount of erucic acid (less than 2% now in canola oil) in rapeseed oil to decrease the risk
of cardiovascular diseases. Canola has relatively high crop production for its wide

6
availability of seeded types in both fall and spring seasons (Oplinger et al 1989). Another
advantage of growing canola is its adaptability to extreme weather conditions especially
in cold regions such as North Dakota, South Dakota, Michigan or the Midwest regions of
United States. According to report from U.S Canola Association, approximately 1.5
million acres of canola are grown in the U.S, mainly in North Dakota. Demand for canola
oil in food industry is increasing; however, ratio of supply versus demand is 1:3, which
means that crop production needs to be accelerated and expanded in order to provide
sufficiency for both feedstock and fuel industry.
Some advantages of canola oil are stability in cold tests, high oil content, high flash
point, and low cloud point and pour point. High flash point of canola oil compared to
gasoline and jet fuel can lower the risk of flammation, cloud point of -3oC can enhance
durability and safety of engines in cold weather, and low pour point can contribute to
maximizing fuel usage.
Table 3: Canola Oil Properties (Gunstone 2009)
Property
Density 0.914-0.917 g/cm3
Smoke Point 220-230oC
Flash Point (open cup) 275-290oC
Specific Heat (J/g) 1.91-1.916
Cloud Point -3oC
Pour Point -9oC
Oil Content 44%

7
Table 4: Fatty Acid Composition
Fatty Acid Composition (Weight Percent %)
Canola Corn Peanut Soybean
C 16:0 Palmitic 4 - 5 7 - 13 6 -12.5 2.3 - 11
C 18:0 Stearic 1 - 2 2.5 - 3 2.5 - 6 2.4 - 6
C 18:1 Oleic 55 - 63 30.5 - 43 37 - 61 22 – 30.8
C 18:2 Linoleic 20 - 31 39 - 52 13 - 41 49 - 53
C 18:3 Linolenic 9 - 10 1 1 2 -10.5
Table 4 demonstrates the percentage of fatty acid composition in canola oil with highest
content of oleic acid, linoleic, linolenic, plamitic and stearic acid. Those acids are
expected to show in gas chromatogram of each run, and as time expands longer, they can
break down to alkenes or alkanes.
8
2.0 THESIS
As price of fuel continues to escalate in the present and more concerns arise for both
environment and human health, the needs for more biodiesel increase. Greenhouse gas
emission has been reduced at least 57% and up to 86% when substituting petroleum
diesel with biodiesel. However, the main source for making biodiesel is soybean which is
also necessary source for feedstock; limited supply of soybean together with high demand
from both industries can cause shortage at some. As a result, canola was brought into
research for its high oil content when crushed out compared to soybean and corn oil.
The objective of this research is examining the product of canola-derived diesel to
determine its ability as blending agents for petroleum-based fuels. The method applied in
this research is based on the procedure of refining petroleum in fuel industry, called
delayed coking. Delayed coking is heat-required thermal cracking in completing the
coking reactions with the help of a furnace, which helps to shorten the time of coking
(Fahim et al 2009). Pyrolysis of agricultural oil has not been studied before so our
prediction is that FAMEs will probably undergo a free radical attack at the double bond
of the fatty acids in canola oil methyl ester and even break down to alkanes in either
gasoline or jet fuel range. Expected results are based on those of previous research of
soybean-derived biodiesel in which canola oil methyl-ester should enhance fuel stability.

9
3.0 EXPERIMENTAL
3.1 Reagents
The canola methyl-ester sample was made by one graduate student at George
Mason University. The general procedure was canola oil sample heated to 55oC after
having water and any particulates removed, and then taken into reacting with methoxide
(mixing 99% pure methanol and 85% pure potassium hydroxide). Fatty acid methyl-ester
(FAMEs), or biodiesel, and glycerol by-product were formed in the ratio of 10:1. The
products were separated then washed with water, and its purity was confirmed by
dissolution in methanol until the clear solution formed without any deposit appearance.
Figure 2 below illustrated reaction of fatty acid converted to fatty acid methyl esters.
Figure 2: Conversion Reaction of Fatty Acid to FAME
O
O
O
O
O
O
R
R
R
R OH
Orecycled
R OCH3
O
(a)
(b)(c)
O
O
O
O
O
O
R
R
R
R OH
Orecycled
R OCH3
O
(a)
(b)(c)

10
3.2 Method
Set-up apparatus for this research included a vacuum machine, hot water
container and isopropyl container to keep dry-ice for quenching process (showed in
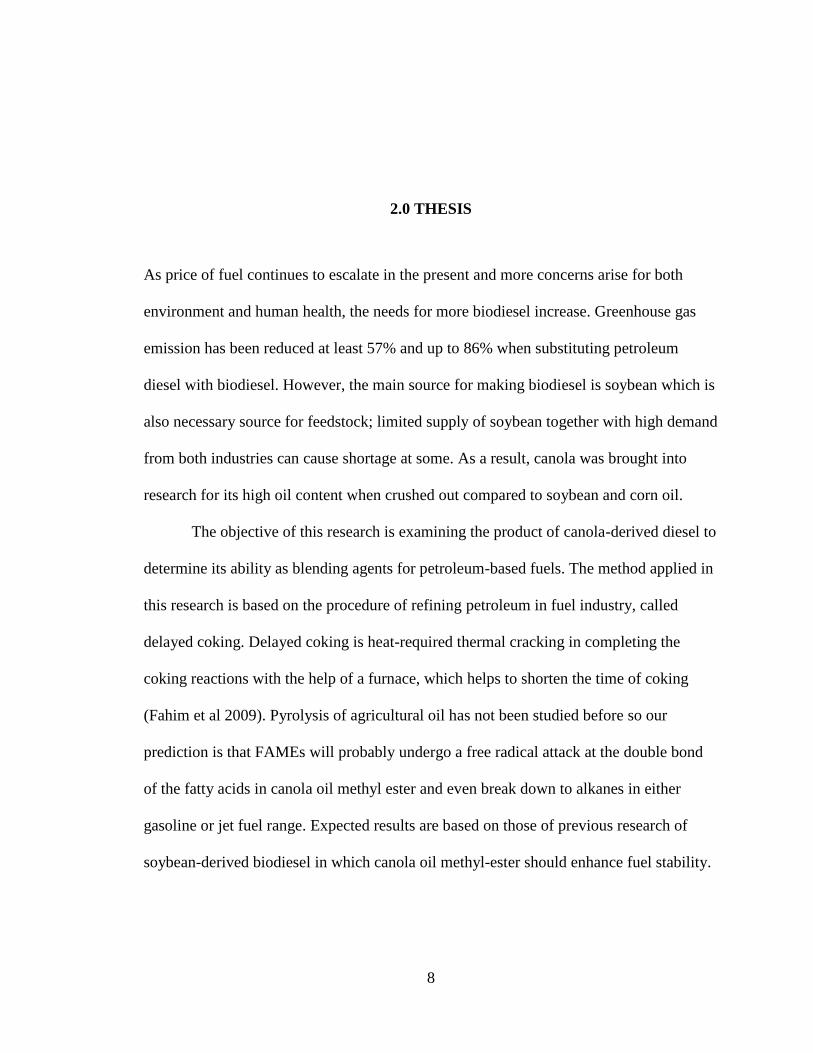
figure 6). Four 15 cm long, 6.4 mm-o.d.(1/4-inch-o.d.) 316 stainless steel tubes with one
end closed and the other fitted with a stainless steel valve via a Swagelok fitting with 0.1
g of canola oil methyl ester in each tube were the significant parts of the experiment
because it ensured that no significant of residues forming on the tube wall. Each tube was
attached to the vacuum system, cooled to 195K then subjected to three freeze-pump-thaw
cycles (Mushrush et al 1984). The first stainless tube to the valve with vacuum valve was
opened for 3 minutes then closed; the tube was into a silver dry ice container for another
3 minutes (freeze), opened the valve gently (pump), put the tube into hot water container
for 3 minutes (thaw), then closed the valve, repeated this process for another two times
before closing both valves and closed the tube tightly. The same procedure was applied
for another three tubes (30, 60 and 90 minutes). Four tubes were left to room temperature
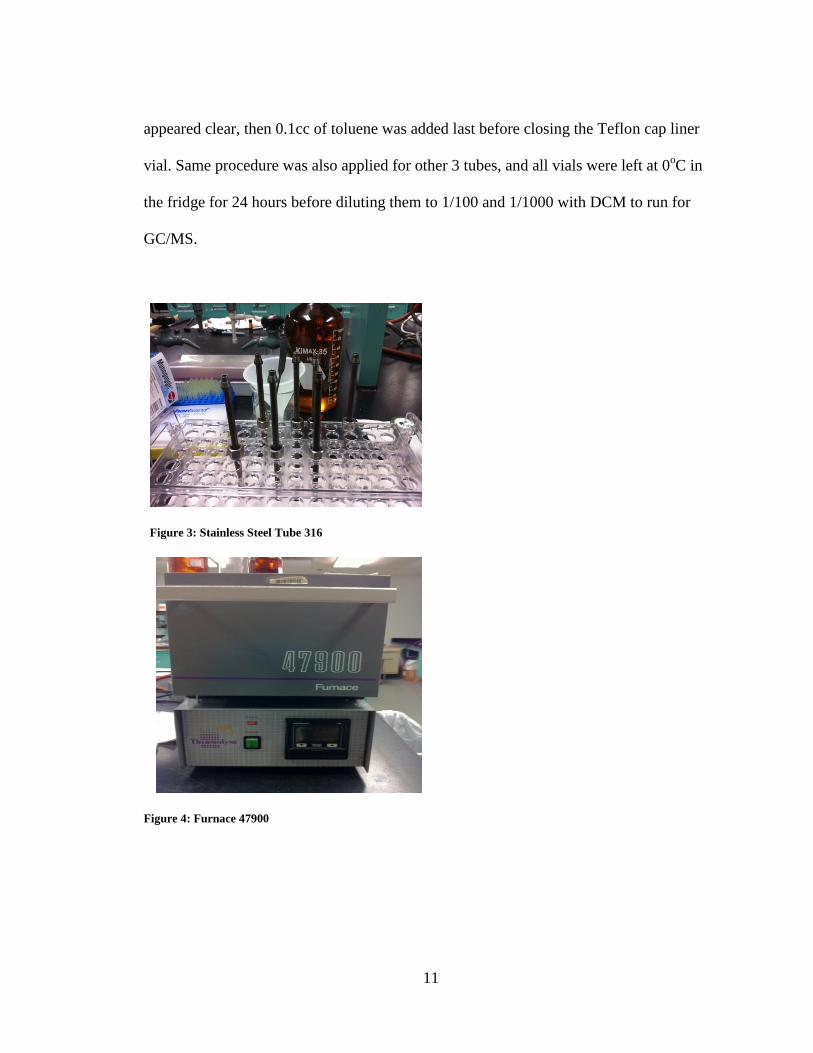
and pyrolyzed by being inserted the 90-minute tube first into 7-mm holes in a 15-cm
diameter aluminum block fitted with heaters and temperature controller (Furnace 47900),
followed by 15, 60 and 30-minuted tubes. Pyrolysis temperature was 400oC with pressure
of 90 psi (620 kPa). Stainless steel tube 316 would not show any catalytic behavior below
823oC, as seen in the study of thermal cracking of n-octane by Marschner group. After
the pyrolysis period, all tubes were cooled down to room temperature (22oC), and
tightened valves were removed. About 100 μL of toluene was first added to each tube,
followed by 0.5 cc of DCM (about 3 times for each tube) until liquid poured into vial
11
appeared clear, then 0.1cc of toluene was added last before closing the Teflon cap liner
vial. Same procedure was also applied for other 3 tubes, and all vials were left at 0oC in
the fridge for 24 hours before diluting them to 1/100 and 1/1000 with DCM to run for
GC/MS.
Figure 3: Stainless Steel Tube 316
Figure 4: Furnace 47900

12
Figure 5: Experimental Set-up
3.2.1 Gas Chromatography/Mass Spectrometry
The result from the experiment was analyzed by combined capillary GC/MS in
Prince William Campus of George Mason University. The GC/MS system was Agilent
Technologies Model 6890, a gas chromatography configured for spiltless injection (1µL),
with a Finnegan INCOS 50B mass spectrometer. The GC part was equipped with all
glass inlet system which has 0.32 mm x 30m fused silica capillary column (column flow
1mL/min, cross-linked 5% phenyl methyl silicone supplied by Agilent Technologies. The
set up injector temperature was 250oC and the detector temperature was 320
oC. Initial
temperature was set at 60oC for 5 minute, a ramp of 5
oC/min, to a final temperature of
260oC. The Finnegan INCOS 50B mass spectrometer was operated in the electron impact
ionization mode (70 eV) with continuous scan acquisition from 50 to 300 amu at a
cycling rate of 1 scan/sec. The electron multiplier was 1050 V; source temperature was
200oC; and the transfer line temperature was 290
oC (Mushrush et al 2012).

13
4.0 RESULT AND ANALYSIS
4.1 Result Data from GC/MS
Figure 6: GC 15-minute Interval
Table 5: MS 15-minute Area % Report
# peak R.T min % of total Result
4 20.369 10.13 Palmitic acid ME
5 22.091 37.62 Oleic acid ME
6 22.139 30.94 Elaidic acid ME
7 22.296 7.26 Stearic acid ME

14
Figure 7: GC 30-minute Interval
Table 6: MS 30-minute Area % Report
# peak R.T min % of total Result
1 20.372 10.91 Palmitic acid ME
2 22.084 60.98 Oleic acid ME
3 22.125 28.11 Elaidic acid ME
4 22.293 #### Stearic acid ME
Figure 8: GC 60-min Interval
Table 7: MS 60-minute Area % Report
# peak R.T min % of total Result
18 17.973 4.09 C-16
19 20.376 9.94 Palmitic acid ME
20 22.303 9.25 Stearic acid ME

15
Figure 9: GC 90-min Interval
Table 8: MS 90-minute Area % Report
# peak R.T min % of total Result
13 14.334 4.49 C-17
14 15.617 9.15 C-17
15 16.832 4.5 C-17
16 17.978 14.13 C-17
17 22.093 5.24 Stearic acid ME
Figure 10: MS of C-17

16
Figure 11: Library MS of Hexadecane
4.2 Discussion Gas chromatogram of the 15-minute and 30-minute interval showed four peaks of four
main fatty acids in canola oil such as plamitic acid, stearic acid, oleic acid, and elaidic
acid. Oleic acid and elaidic acid methyl esters have the highest percentage in the
compounds. Only stearic acid methyl ester in GC of 30-minute didn’t have any
percentage in the compounds despite its peak presence in the GC. It could the error or not
having enough concentration to be detected in the GC. In 60-minute, hexadecane peak
started to show at 17.973 RT with percentage of 4.09, and oleic acid and elaidic acid have
disappeared, which indicated that those two FAMEs may be broken down and yield the
hexadecane product. All the FAMEs have gone in GC of 90-minute except for stearic
acid ME and yield the same product which was hexadecane C16H34. The MS of
experimental compound for hexadecane looked almost identical to the library result,
which supported that most of the FAMEs except for stearic acid ME were mostly broken
down. The total area percentage of all hexadecane peaks in GC of 90-minute is 32.27.
Because there is no clear evidence which FAME was broken down first and which yield
the most hexadecane, no detail mechanism can be given, however, plamitic and oleic

17
acids were studied to determine the range of hydrocarbons they converted by using
activated carbons in near and supercritical water with no hydrogen added. It showed that
palmitic gave products in C8-C15 range, and oleic acid yield about C12-C17 alkanes and
some C17 olefins (Savage et al 2011). The proposed mechanism is the double bond in
FAMEs will undergo free radical attack first, followed by leaving the carboxylic group
which eventually produces long chain hydrocarbons. The figure below was result from
Savage research group proposing the possible mechanism, however, our research did not
use activated carbon and our temperature was higher:
Figure 12: Possible Mechanism of Conversion Fatty Acid to Long Chain Hydrocarbon

18
5.0 CONCLUSION
Using waste vegetable oil as the primary reagent for biodiesel products can help to reduce
about 70-95% for the petroleum cost and solve some of the environmental problems. The
appearance of hexadecane after pyrolysis process is supporting evidence that canola
derived biodiesel can be a suitable blending agent for petroleum based fuel. Further
research can continue on examining the stability of petroleum fuel when adding canola
derived biodiesel. Blending any agent into petroleum based fuels has to be done with
significant consideration, for example, flash point consideration, engine types, or
solubility of both petroleum fuel and blending stock. The blending agent cannot affect the
stability of the original fuel. Overall, this research provides more opportunities for
alternative fuels in order to reduce pressure on fuel industry, and also gives
encouragement for farmers to boost the crop production to decrease competing with food
industry.

19
6.0 FUTURE DIRECTIONS AND EXPECTATION
The U.S airline industry has consumed about 19 billion gallons of fuel, and the
amount will increase significantly in the near future based on its current growing rate.
The result of this thesis is promising for another future of aviation bio jet-fuel; however,
it has to be further examined for the stability when blending in jet fuel with different
concentration. In addition, the supply of agricultural oil in food industry is not equivalent
to market demand, which makes mass production of fuel from vegetable oil is still a
concern. The quality of oil can also a factor in determining the quality of biofuels,
therefore, some on-going research projects are looking for high quality ideal plant oil to
make renewable jet fuel. Scientists have been working with farmers to improve crop
production or increase harvesting process. Another possible approach is rotating the
different type of oilseed, for example, ARS chemists have been working on identifying
rapeseed and wheat rotation systems to determine if it can help in reducing erosion,
improving the conditions of the field such as water holding capacities or herbicide needs.
The main purpose of this project is to test if the rate of conversion agricultural oil to
biofuels, especially jet-fuel, will increase with high-quality oil (ARS 2012).

20
REFERENCES
Airline Energy Q&A. (n.d.). Airlines for America. Retrieved December 3, 2013, from
http://www.airlines.org/Pages/Airline-Energy-QA-.aspx
Airline Fuel Cost and Consumption (U.S. Carriers-Scheduled) January 2000-September
2013. (2013, December 3). Research and Innovative Technology Administration.
Retrieved December 3, 2013, from http://www.transtats.bts.gov/fuel.asp
Altun, S., Yasar, F., & Oner, C. (2010). The Fuel Properties of Methyl Esters Produced
from Canola oil-Animal Tallow Blends by Base-Catalyzed Transesterification.
International Journal of Engineering Research and Development, 2(2), 2–5.
Argumugam, S., Zinoviev, S., Foransiero, P., Miertus, S., Muller-Langer, F., Kaltschmitt,
M., … Thraen, D. (2007, June 28). Bio-Fuels Technology Status and Future Trends,
Technology Assessment and Decision Support Tools. ICS UNIDO. Retrieved from
http://www.fao.org/uploads/media/0706_ICS_UNIDO_-_Bio-fuels.pdf
ARS Researchers Flying Higher With New Jet Fuels. (n.d.). Agricultural Research,
(September 2012). Retrieved from
http://www.ars.usda.gov/is/AR/archive/sep12/jet0912.htm
Biodiesel Basics. (n.d.). Biodiesel America’s Advanced Biofuel. Retrieved December 4,
2013, from http://www.biodiesel.org/what-is-biodiesel

21
Coking is a refinery process that produces 19% of finished petroleum product exports.
(2013, January 28). U.S. Energy Information Administration. Retrieved December 3,
2013, from http://www.eia.gov/todayinenergy/detail.cfm?id=9731
Crop Production. (n.d.). U.S. Canola Association. Retrieved December 3, 2013, from
http://www.uscanola.com/crop-production/
Fahim, M. A., Al-Sahhaf, T. A., & Elkilani, A. (2009). Fundamentals of Petroleum
Refining. Elsevier.
Gunstone, F. (2009). Rapeseed and Canola Oil: Production, Processing, Properties and
Uses. John Wiley & Sons.
Henderson, R., Carter, D., Feigley, C., Karch, N., Medinsky, M., Mullick, F., … Witschi,
H. (1996). Permissible Exposure Levels for Selected Military Fuel Vapors.
Washington D.C: National Academy Press. Retrieved from
http://www.nap.edu/openbook.php?record_id=9133&page=13
Jet Fuels JP-4 and JP-7. (n.d.). ATSDR. Retrieved December 4, 2013, from
http://www.atsdr.cdc.gov/substances/toxsubstance.asp?toxid=149
Jet Fuels JP-5 and JP-8. (n.d.). ATSDR. Retrieved December 4, 2013, from
http://www.atsdr.cdc.gov/substances/toxsubstance.asp?toxid=150
Monthly Biodiesel Production Report. (2013, November 27). U.S Energy Petroleum
Administration. Retrieved December 3, 2013, from
http://www.eia.gov/biofuels/biodiesel/production/

22
Mushrush, G., Hughes, J. M., & Willauer, H. (2012). Blends of Soybean Biodiesel with
Petroleum Diesel: Advantages. Industrial & Engineering Chemistry Research,
52(4), 1764–1768.
Mushrush, G. W., & Hazlett, R. N. (1984). Pyrolysis of Organic Compounds Containing
Long Unbranched Alkyl Groups. Industrial & Engineering Chemistry
Fundamentals, 23(3), 288–294. doi:10.1021/i100015a004
Mushrush, G., DeRoule, Q., Castillo, N., Lussos, M., Nguyen, C., Nguyen, H. O., … Vo,
P. (2012). Storage Stability and Lubricity of Soy, Corn, and Canola Derived
Biodiesel Blended with Petroleum-Derived Diesel. Journal of Undergraduate
Chemistry Research, 11(1), 30–33.
Oplinger, E. ., Hardman, L. ., Gritton, E. ., Doll, J. ., & Kelling, K. . (n.d.). Canola
(Rapeseed). Purdue Agriculture. Retrieved December 4, 2013, from
http://www.hort.purdue.edu/newcrop/afcm/canola.html
Plumer, B. (2013, February 11). The boom in U.S. oil drilling hasn’t lowered gas prices.
Washington Post. Retrieved from
http://www.washingtonpost.com/blogs/wonkblog/wp/2013/02/11/the-boom-in-u-s-
oil-drilling-hasnt-lowered-gas-prices/
Ritter, S. (2005, February 21). Gasoline. Chemical & Engineering News, 83(8), 37.
Savage, P. E., Fu, J., Thompson, L. T., Shi, F., & Lu, X. (2011). Activated Carbons for
Hydrothermal Decarboxylation of Fatty Acids. ACS Catalysis, 1(3), 227–231.

23
Teeters-Kennendy, S., Hall, J., Adams, A., Williams, A., Tolmachoff, M., Walke, K., &
Chikwana, E. (2012). Use of Waste Cooking Oil for Small-Scalr Biodiesel
Production. Journal of Undergraduate Chemistry Research, 11(2), 52–55.
The American Petroleum Institute. (2010, September 21). Kerosene/Jet Fuel Category
Assessment Document. US EPA. Retrieved from
http://www.epa.gov/hpv/pubs/summaries/kerjetfc/c15020ad2.pdf
The Hidden Cost of Fossil Fuels | UCSUSA. (n.d.). Union of Concerned Scientists.
Retrieved December 4, 2013, from http://www.ucsusa.org/clean_energy/our-energy-
choices/coal-and-other-fossil-fuels/the-hidden-cost-of-fossil.html
The History of Jet Fuel. (n.d.). Air BP. Retrieved December 3, 2013, from
http://www.bp.com/sectiongenericarticle.do?categoryId=4503664&contentId=57733
Toxicological Profile for Automotive Gasoline. (1995, June). Retrieved December 3,
2013, from http://www.atsdr.cdc.gov/ToxProfiles/tp.asp?id=468&tid=83
Toxicological Profile: Jet Fuels JP-5 and JP-8. (n.d.). Retrieved December 5, 2013, from
http://www.atsdr.cdc.gov/toxprofiles/tp.asp?id=773&tid=150
Types of Jet Fuel. (n.d.). Alglas UK. Retrieved December 3, 2013, from
http://www.alglas.com/jet_fuel.htm
Watkins, J. M., Mushrush, G. W., Hazlett, R. N., & Beal, E. J. (1989). Hydroperoxide
Formation and Reactivity in Jet Fuels. Energy & Fuels, 3(2), 231–236.
doi:10.1021/ef00014a018

24
Why Are Gas Prices So High? (n.d.). Institute for Energy Research. Retrieved December
3, 2013, from http://www.instituteforenergyresearch.org/gas/why-are-gas-prices-so-
high/
Yasar, F., Altun, S., & Adin, H. (2010). Fuel Properties of Biodiesel Produced from Blends
of Canola Oil and Animal Tallow. Energy Education Science and Technology Part A:
Energy Science and Research, 27(1), 199–208.

25
BIOGRAPHY
Phung Kim Vo received her Bachelor of Science from George Mason University in 2012.
Her professional interest is in inorganic chemistry, oil-industry with concentration on
biofuels, and chemical quality control.
Work experience:
2010-present: Department of Chemistry, George Mason University
- Conducted research in fuel alternative for gasoline or jet fuel, especially interest
in bio-fuels for green environmental.
2010-Present: Center for Social Science Research, George Mason University
Computer-assisted Telephone Interviewer (CATI)
- Collect high quality data for research projects for various organizations in the
community and professional institutions.
June 2013-August 2013: FCC Control and Fumigation Company (Internship)
- Assisted in quality control of fertilizer, import food product (coffee, tea), or
determination of chemical compounds in agricultural products.
Publications and Presentation:
1 Publication
2 Presentations
1 Poster presentation.
.


![Effects of Canola Oil Biodiesel Fuel Blends on Combustion ......calorific value of biodiesel is less than that of conventional diesel fuel. Ileri et al. [20] experimentally analyzed](https://img.pdfslide.us/doc/110x75/5fe42c4c18a3bd31bf26d4f4/effects-of-canola-oil-biodiesel-fuel-blends-on-combustion-calorific-value.jpg)