Embed Size (px)
Citation preview
Cannabis Drying Report Top-Down Cannabis tray Drying vs. Hang Drying
Corné van Teulingen & Nick Abbingh
Cannabis Drying Report: Top-Down Cannabis tray Drying vs. Hang Drying
Abstract
The drying process of cannabis is one of the most important processes in the production of cannabis,
but it is also the most overlooked process in the cannabis industry. Most facilities still dry their
cannabis by hangings stems of the plant upside down in a conditioned room. Cannabis-drying.com
developed a new drying system where the bucked or wet trimmed flowers of the cannabis are placed
in trays and a ventilator sucks the conditioned air Top-down through the trays. In the case of this
experiment the cannabis trays were filled with bucked flowers. Results with regard to the terpene
and cannabinoid content of the flowers that were dried with Cannabis-drying.com’s system were
compared to flowers that were dried by hanging the stems upside down in a drying rack. Both
systems were placed in the same drying cell so that the conditions of the air (temperature and
humidity) were the same for both drying methods. Very few differences in cannabinoid and terpene
content were found, whilst the Cannabis-Drying.com system is more practical in use, space-efficient
and has a more evenly spread of airflow through the product. The equivalent of 20 drying racks for
hanging plants could be placed in the system of Cannabis-Drying.com, with regard to the amount of
cannabis. The system of Cannabis-Drying.com is 89% more space-efficient than the drying racks.
Cannabis Strain 1 Cannabis Strain 2 Cannabis Strain 3
Component CD H CD H CD H
alpha-Bisabolol 0.12 0.13 0.10 0.10 0.10 0.10
trans-Caryophyllene 0.22 0.23 0.53 0.53 0.29 0.29
alpha-Cedrene 0.05 0.05 0.12 0.12 0.08 0.08
Endo-fenchyl Alcohol 0.05 0.05 - - 0.06 0.06
alpha-Humulene 0.09 0.09 0.33 0.33 0.11 0.11
Limonene 0.23 0.20 0.15 0.16 0.36 0.34
Linalool 0.08 0.08 0.10 0.10 0.17 0.17
beta-Myrcene - - 0.11 0.12 0.20 0.20
alpha-Pinene - - - - 0.04 0.03
beta-Pinene 0.04 0.03 0.03 0.03 0.06 0.06
Terpineol - - - - 0.07 0.07
Total Terpenes 0.95 0.91 1.53 1.54 1.54 1.52
THC-A 12.62 12.64 22.19 22.70 19.12 19.57
delta 9-THC 0.14 0.18 0.16 0.18 0.38 0.41
CBG-A 0.72 0.75 1.38 1.49 0.44 0.45
CBG - - 0.14 0.15 - -
Total THC 11.20 11.27 19.60 20.08 17.14 17.56
Total Cannabinoids 13.56 13.63 23.87 24.51 20.02 20.51
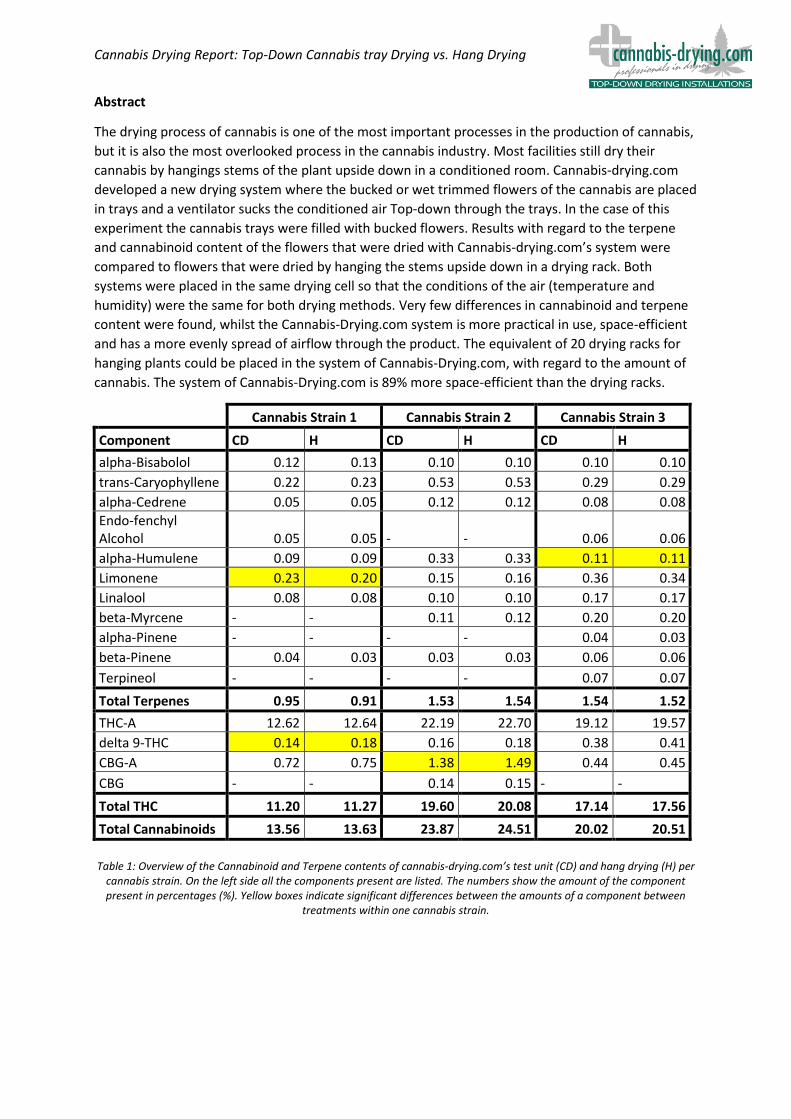
Table 1: Overview of the Cannabinoid and Terpene contents of cannabis-drying.com’s test unit (CD) and hang drying (H) per
cannabis strain. On the left side all the components present are listed. The numbers show the amount of the component present in percentages (%). Yellow boxes indicate significant differences between the amounts of a component between
treatments within one cannabis strain.
Cannabis Drying Report: Top-Down Cannabis tray Drying vs. Hang Drying
Introduction
The cannabis market is growing rapidly and each part of the production process is getting more
sophisticated. Although, there are many developments in the methods of irrigation, lighting,
substrates and climate during the growth of the plant, the post-harvest processing of the cannabis
plant is often overlooked and rushed. The drying process of the cannabis plant is mostly done by
hanging the stems of the plant upside down on racks in a conditioned room.
A lot of master growers in the cannabis market believe that drying the whole cannabis plant,
or stems of the plants, result in a better retention of cannabinoids and terpenes compared to when
the flowers of the cannabis plants are dried in a tray. One of our customers wanted to find out if
these beliefs where true and so a test was conducted with the traditional hang drying method and a
test unit from Cannabis-Drying.com that was filled with bucked flowers.
Cannabis-drying.com developed a drying system where the flowers of the plants are placed
in specially designed Cannabis trays (figure 5). The Cannabis trays are placed on a ventilation pallet
(Figure 3) and a ventilator sucks the air Top-down through the Cannabis trays filled with cannabis.
Cannabis-drying.com’s testing unit and the racks with hanging plants (Figure 7) where placed
in the same conditioned room. So, the conditions of the air that both drying methods received, were
the same.
The goal of this study was to find out if there where any differences in cannabinoid and
terpene content between Cannabis-drying.com’s testing unit and the racks with hanging plants. It
was hypothesized that there would be no differences in cannabinoid and terpene content.
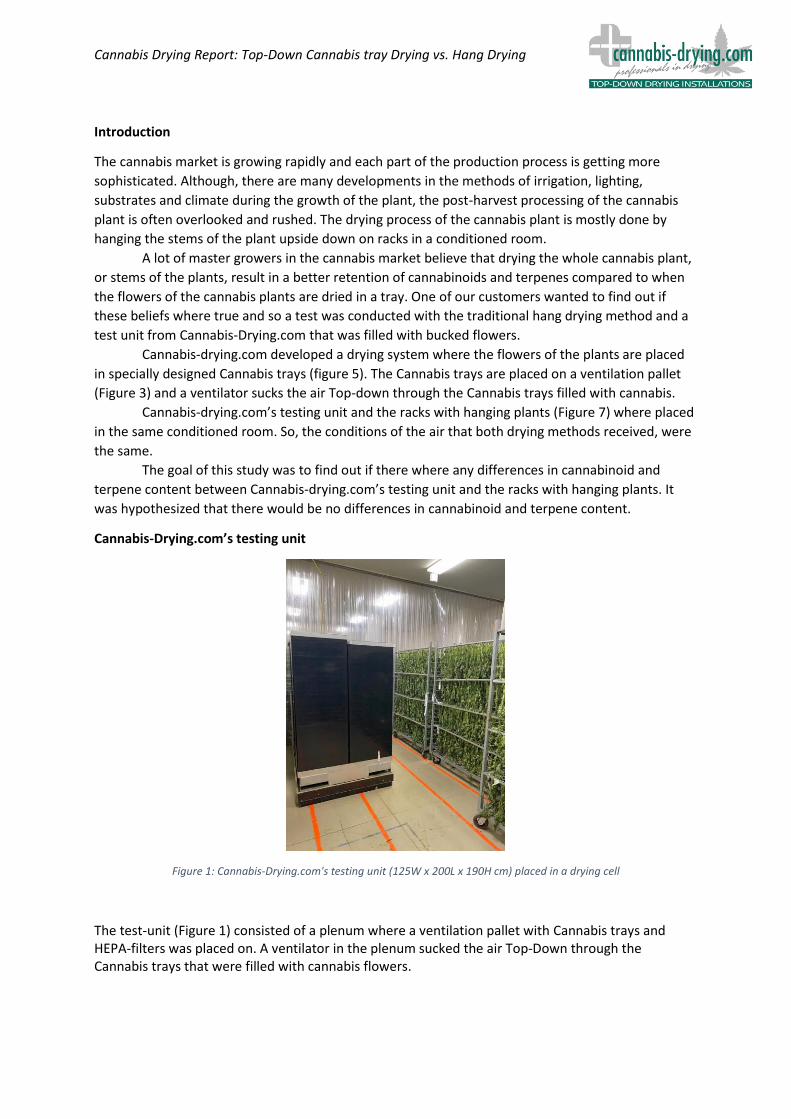
Cannabis-Drying.com’s testing unit
Figure 1: Cannabis-Drying.com's testing unit (125W x 200L x 190H cm) placed in a drying cell
The test-unit (Figure 1) consisted of a plenum where a ventilation pallet with Cannabis trays and HEPA-filters was placed on. A ventilator in the plenum sucked the air Top-Down through the Cannabis trays that were filled with cannabis flowers.
Cannabis Drying Report: Top-Down Cannabis tray Drying vs. Hang Drying
Plenum
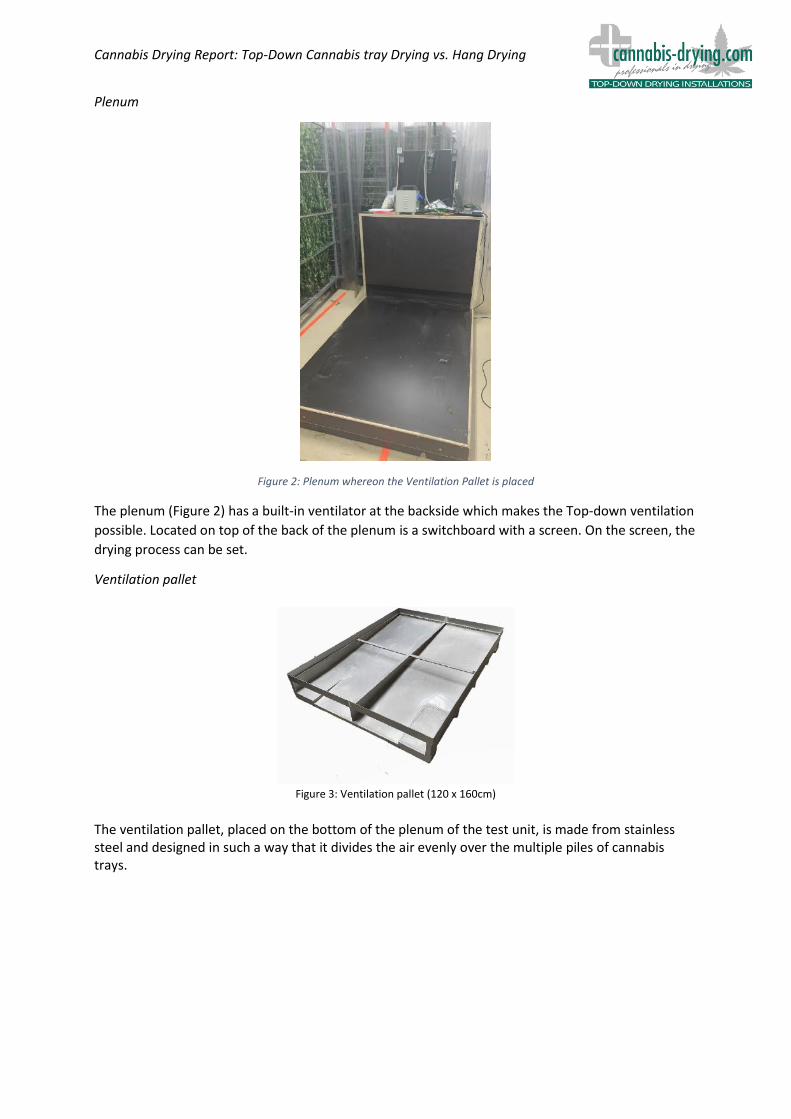
Figure 2: Plenum whereon the Ventilation Pallet is placed
The plenum (Figure 2) has a built-in ventilator at the backside which makes the Top-down ventilation
possible. Located on top of the back of the plenum is a switchboard with a screen. On the screen, the
drying process can be set.
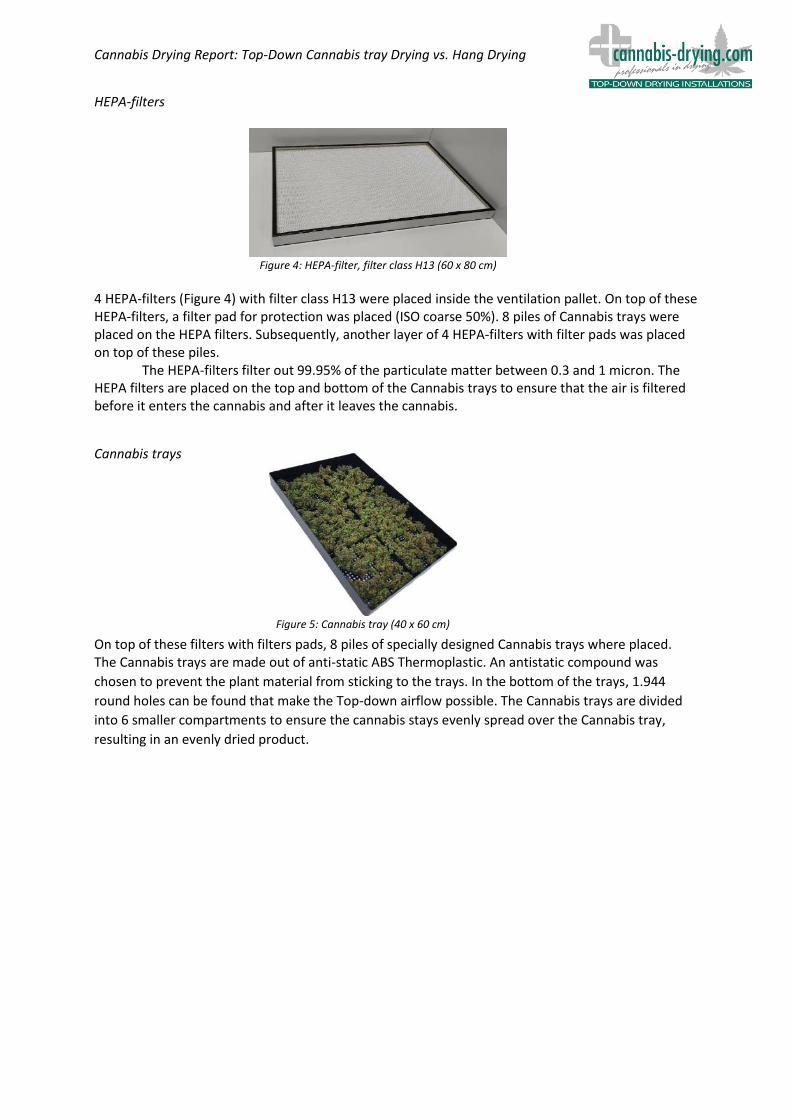
Ventilation pallet The ventilation pallet, placed on the bottom of the plenum of the test unit, is made from stainless steel and designed in such a way that it divides the air evenly over the multiple piles of cannabis trays.
Figure 3: Ventilation pallet (120 x 160cm)
Cannabis Drying Report: Top-Down Cannabis tray Drying vs. Hang Drying
HEPA-filters
4 HEPA-filters (Figure 4) with filter class H13 were placed inside the ventilation pallet. On top of these HEPA-filters, a filter pad for protection was placed (ISO coarse 50%). 8 piles of Cannabis trays were placed on the HEPA filters. Subsequently, another layer of 4 HEPA-filters with filter pads was placed on top of these piles.
The HEPA-filters filter out 99.95% of the particulate matter between 0.3 and 1 micron. The HEPA filters are placed on the top and bottom of the Cannabis trays to ensure that the air is filtered before it enters the cannabis and after it leaves the cannabis.
Cannabis trays
On top of these filters with filters pads, 8 piles of specially designed Cannabis trays where placed. The Cannabis trays are made out of anti-static ABS Thermoplastic. An antistatic compound was
chosen to prevent the plant material from sticking to the trays. In the bottom of the trays, 1.944
round holes can be found that make the Top-down airflow possible. The Cannabis trays are divided
into 6 smaller compartments to ensure the cannabis stays evenly spread over the Cannabis tray,
resulting in an evenly dried product.
Figure 4: HEPA-filter, filter class H13 (60 x 80 cm)
Figure 5: Cannabis tray (40 x 60 cm)
Cannabis Drying Report: Top-Down Cannabis tray Drying vs. Hang Drying
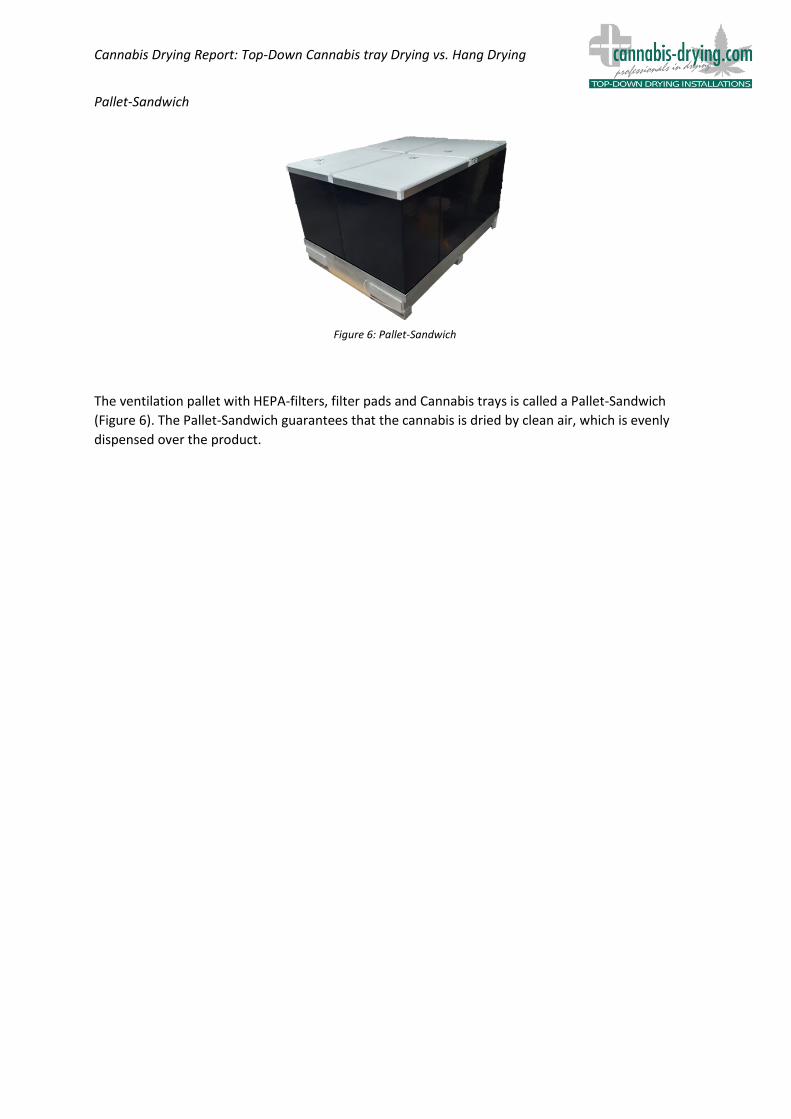
Pallet-Sandwich
The ventilation pallet with HEPA-filters, filter pads and Cannabis trays is called a Pallet-Sandwich
(Figure 6). The Pallet-Sandwich guarantees that the cannabis is dried by clean air, which is evenly
dispensed over the product.
Figure 6: Pallet-Sandwich
Cannabis Drying Report: Top-Down Cannabis tray Drying vs. Hang Drying
Method
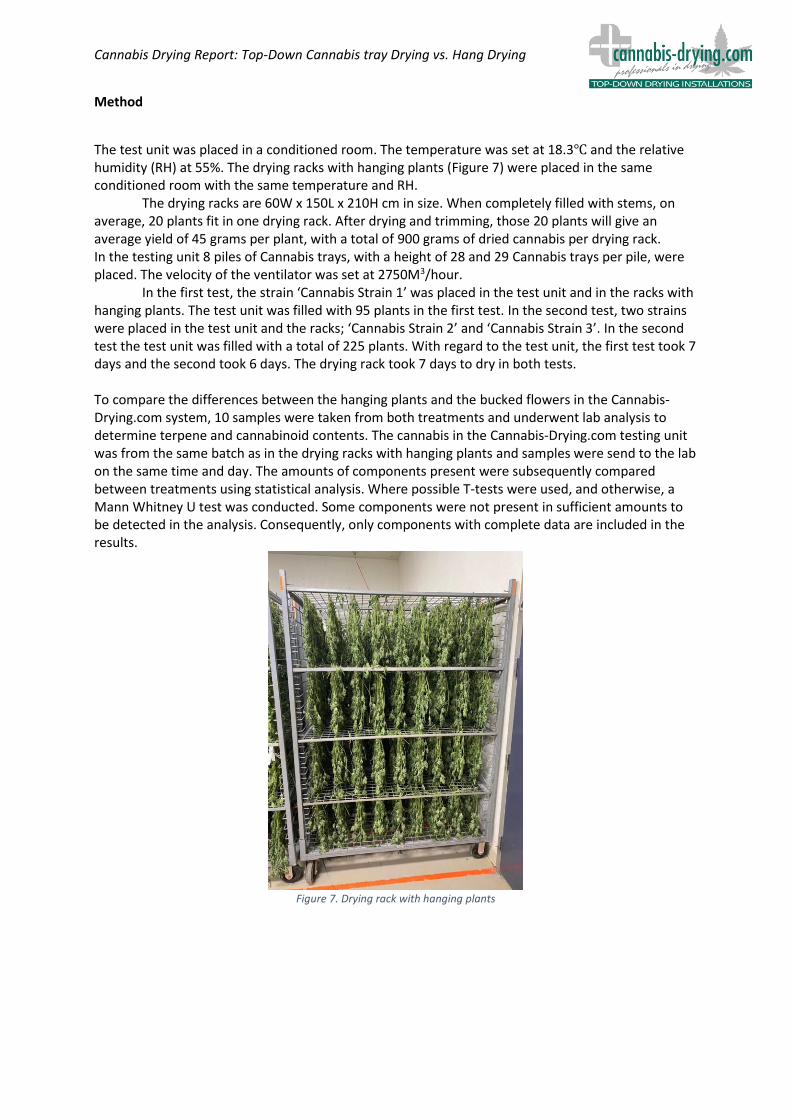
The test unit was placed in a conditioned room. The temperature was set at 18.3℃ and the relative humidity (RH) at 55%. The drying racks with hanging plants (Figure 7) were placed in the same conditioned room with the same temperature and RH. The drying racks are 60W x 150L x 210H cm in size. When completely filled with stems, on average, 20 plants fit in one drying rack. After drying and trimming, those 20 plants will give an average yield of 45 grams per plant, with a total of 900 grams of dried cannabis per drying rack. In the testing unit 8 piles of Cannabis trays, with a height of 28 and 29 Cannabis trays per pile, were placed. The velocity of the ventilator was set at 2750M3/hour. In the first test, the strain ‘Cannabis Strain 1’ was placed in the test unit and in the racks with hanging plants. The test unit was filled with 95 plants in the first test. In the second test, two strains were placed in the test unit and the racks; ‘Cannabis Strain 2’ and ‘Cannabis Strain 3’. In the second test the test unit was filled with a total of 225 plants. With regard to the test unit, the first test took 7 days and the second took 6 days. The drying rack took 7 days to dry in both tests. To compare the differences between the hanging plants and the bucked flowers in the Cannabis-Drying.com system, 10 samples were taken from both treatments and underwent lab analysis to determine terpene and cannabinoid contents. The cannabis in the Cannabis-Drying.com testing unit was from the same batch as in the drying racks with hanging plants and samples were send to the lab on the same time and day. The amounts of components present were subsequently compared between treatments using statistical analysis. Where possible T-tests were used, and otherwise, a Mann Whitney U test was conducted. Some components were not present in sufficient amounts to be detected in the analysis. Consequently, only components with complete data are included in the results.
Figure 7. Drying rack with hanging plants
Cannabis Drying Report: Top-Down Cannabis tray Drying vs. Hang Drying
Results & Conclusion
Cannabis Strain 1 Cannabis Strain 2 Cannabis Strain 3
Component CD H CD H CD H
alpha-Bisabolol 0.12 0.13 0.10 0.10 0.10 0.10
trans-Caryophyllene 0.22 0.23 0.53 0.53 0.29 0.29
alpha-Cedrene 0.05 0.05 0.12 0.12 0.08 0.08
Endo-fenchyl Alcohol 0.05 0.05 - - 0.06 0.06
alpha-Humulene 0.09 0.09 0.33 0.33 0.11 0.11
Limonene 0.23 0.20 0.15 0.16 0.36 0.34
Linalool 0.08 0.08 0.10 0.10 0.17 0.17
beta-Myrcene - - 0.11 0.12 0.20 0.20
alpha-Pinene - - - - 0.04 0.03
beta-Pinene 0.04 0.03 0.03 0.03 0.06 0.06
Terpineol - - - - 0.07 0.07
Total Terpenes 0.95 0.91 1.53 1.54 1.54 1.52
THC-A 12.62 12.64 22.19 22.70 19.12 19.57
delta 9-THC 0.14 0.18 0.16 0.18 0.38 0.41
CBG-A 0.72 0.75 1.38 1.49 0.44 0.45
CBG - - 0.14 0.15 - -
Total THC 11.20 11.27 19.60 20.08 17.14 17.56
Total Cannabinoids 13.56 13.63 23.87 24.51 20.02 20.51
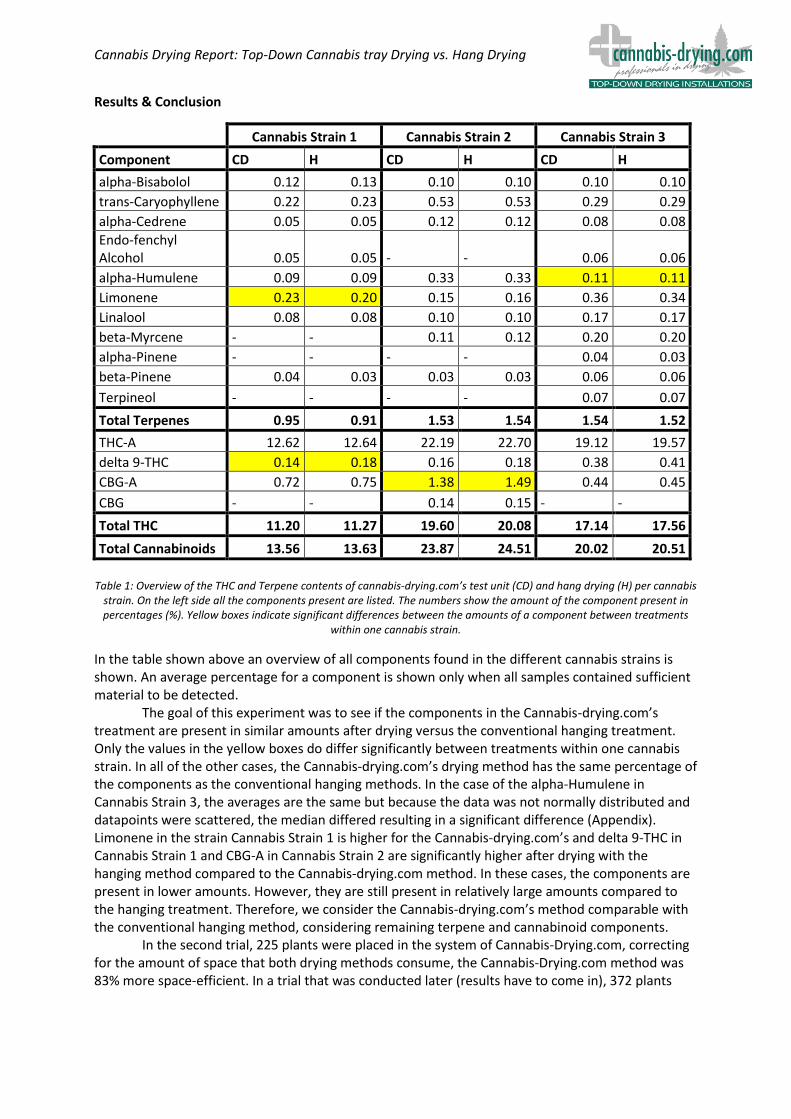
Table 1: Overview of the THC and Terpene contents of cannabis-drying.com’s test unit (CD) and hang drying (H) per cannabis
strain. On the left side all the components present are listed. The numbers show the amount of the component present in percentages (%). Yellow boxes indicate significant differences between the amounts of a component between treatments
within one cannabis strain.
In the table shown above an overview of all components found in the different cannabis strains is shown. An average percentage for a component is shown only when all samples contained sufficient material to be detected. The goal of this experiment was to see if the components in the Cannabis-drying.com’s treatment are present in similar amounts after drying versus the conventional hanging treatment. Only the values in the yellow boxes do differ significantly between treatments within one cannabis strain. In all of the other cases, the Cannabis-drying.com’s drying method has the same percentage of the components as the conventional hanging methods. In the case of the alpha-Humulene in Cannabis Strain 3, the averages are the same but because the data was not normally distributed and datapoints were scattered, the median differed resulting in a significant difference (Appendix). Limonene in the strain Cannabis Strain 1 is higher for the Cannabis-drying.com’s and delta 9-THC in Cannabis Strain 1 and CBG-A in Cannabis Strain 2 are significantly higher after drying with the hanging method compared to the Cannabis-drying.com method. In these cases, the components are present in lower amounts. However, they are still present in relatively large amounts compared to the hanging treatment. Therefore, we consider the Cannabis-drying.com’s method comparable with the conventional hanging method, considering remaining terpene and cannabinoid components.
In the second trial, 225 plants were placed in the system of Cannabis-Drying.com, correcting for the amount of space that both drying methods consume, the Cannabis-Drying.com method was 83% more space-efficient. In a trial that was conducted later (results have to come in), 372 plants
Cannabis Drying Report: Top-Down Cannabis tray Drying vs. Hang Drying
were placed in in the testing unit, resulting in a space efficiency of 89%. If the cannabis trays are filled with wet trimmed flower instead of bucked flowers, space-efficiency can go up to 96%
Discussion
Since the test was conducted in a conditioned room, where both drying methods received the same air conditions at the same time, most variables are very similar between methods. After drying, only a few slight differences between the amounts of components can be addressed, not yielding a major difference in cannabis quality.
The benefit of the drying system of Cannabis-drying.com is that it is way more efficient and controlled. The Cannabis-drying.com system uses 80-96% less space to dry the same quantity of flowers. The Cannabis-drying.com system also ensures each part of the cannabis receives the same amount of airflow, resulting in an evenly dried product. Wet spots on the cannabis won’t emerge, because of the evenly distributed air, giving mold and bacteria no chance to emerge on the wet spots. The fact that the air is filtered before and after it comes in contact with the cannabis, guarantees that the cannabis is dried with clean air and that there is less contamination in the drying cell.
All in all, Cannabis-drying.com’s drying methods is easier to work with, without the loss of cannabis components compared to the conventional hanging method.
Further research will focus on additional strains of cannabis, the same test will be repeated multiple times. The cannabis trays in this research were filled with bucked flowers, in further research a trial will be conducted with wet trimmed flowers.
Cannabis Drying Report: Top-Down Cannabis tray Drying vs. Hang Drying
Appendix Cannabis Strain 1
Component Significant Difference
Value Used statistical test
alpha-Bisabolol No 0.39 T-test homoscedastic
trans-Caryophyllene No 48.50 Mann Whitney U
alpha-Cedrene No 50.00 Mann Whitney U
Eo-fenchyl Alcohol No 45.00 Mann Whitney U
alpha-Humulene No 41.00 Mann Whitney U
Limonene Yes 0.01 T-test homoscedastic
Linalool No 42.00 Mann Whitney U
beta-Pinene No 43.00 Mann Whitney U
Total Terpenes No 0.32 T-test homoscedastic
THC-A No 0.97 T-test homoscedastic
delta 9-THC Yes 0.01 T-test homoscedastic
CBG-A No 35.50 Mann Whitney U
Total THC No 0.89 T-test homoscedastic
Total Cannabinoids No 0.91 T-test homoscedastic
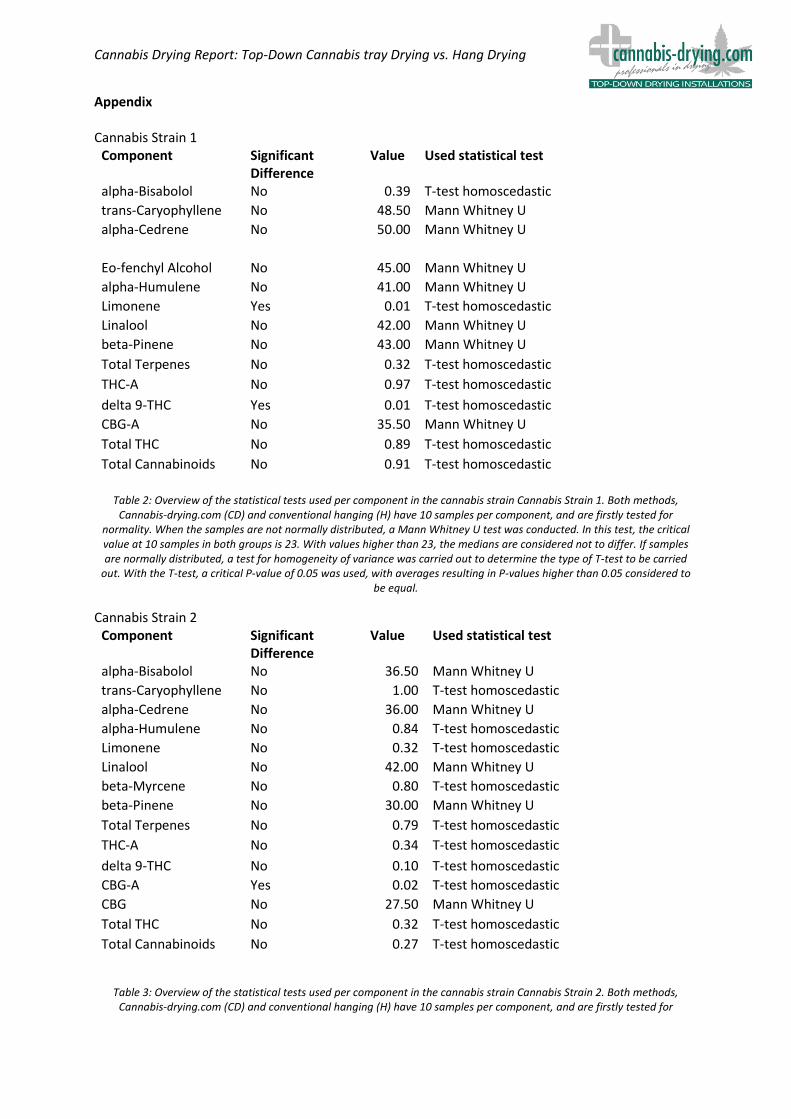
Table 2: Overview of the statistical tests used per component in the cannabis strain Cannabis Strain 1. Both methods,
Cannabis-drying.com (CD) and conventional hanging (H) have 10 samples per component, and are firstly tested for normality. When the samples are not normally distributed, a Mann Whitney U test was conducted. In this test, the critical value at 10 samples in both groups is 23. With values higher than 23, the medians are considered not to differ. If samples are normally distributed, a test for homogeneity of variance was carried out to determine the type of T-test to be carried
out. With the T-test, a critical P-value of 0.05 was used, with averages resulting in P-values higher than 0.05 considered to be equal.
Cannabis Strain 2 Component Significant
Difference Value Used statistical test
alpha-Bisabolol No 36.50 Mann Whitney U
trans-Caryophyllene No 1.00 T-test homoscedastic
alpha-Cedrene No 36.00 Mann Whitney U
alpha-Humulene No 0.84 T-test homoscedastic
Limonene No 0.32 T-test homoscedastic
Linalool No 42.00 Mann Whitney U
beta-Myrcene No 0.80 T-test homoscedastic
beta-Pinene No 30.00 Mann Whitney U
Total Terpenes No 0.79 T-test homoscedastic
THC-A No 0.34 T-test homoscedastic
delta 9-THC No 0.10 T-test homoscedastic
CBG-A Yes 0.02 T-test homoscedastic
CBG No 27.50 Mann Whitney U
Total THC No 0.32 T-test homoscedastic
Total Cannabinoids No 0.27 T-test homoscedastic
Table 3: Overview of the statistical tests used per component in the cannabis strain Cannabis Strain 2. Both methods, Cannabis-drying.com (CD) and conventional hanging (H) have 10 samples per component, and are firstly tested for
Cannabis Drying Report: Top-Down Cannabis tray Drying vs. Hang Drying
normality. When the samples are not normally distributed, a Mann Whitney U test was conducted. In this test, the critical value of 10 samples in both groups is 23. With values higher than 23, the medians are considered not to differ. If samples are
normally distributed, a test for homogeneity of variance was carried out to determine the type of T-test to be carried out. With theT-test, a critical P-value of 0.05 was used, with averages resulting in P-values higher than 0.05 considered to be
equal.
Cannabis Strain 3
Component Significant Difference
Value Used statistical test
alpha-Bisabolol No 40.00 Mann Whitney U
trans-Caryophyllene No 35.00 Mann Whitney U
alpha-Cedrene No 34.50 Mann Whitney U
Endo-fenchyl Alcohol No 39.00 Mann Whitney U
alpha-Humulene Yes 19.50 Mann Whitney U
Limonene No 0.38 T-test homoscedastic
Linalool No 37.50 Mann Whitney U
beta-Myrcene No 49.50 Mann Whitney U
alpha-Pinene No 40 Mann Whitney U
beta-Pinene No 1.00 T-test homoscedastic
Terpineol No 33 Mann Whitney U
Total Terpenes No 47.00 Mann Whitney U
THC-A No 0.61 T-test homoscedastic
delta 9-THC No 0.20 T-test homoscedastic
CBG-A No 0.65 T-test homoscedastic
Total THC No 0.60 T-test homoscedastic
Total Cannabinoids No 0.60 T-test homoscedastic
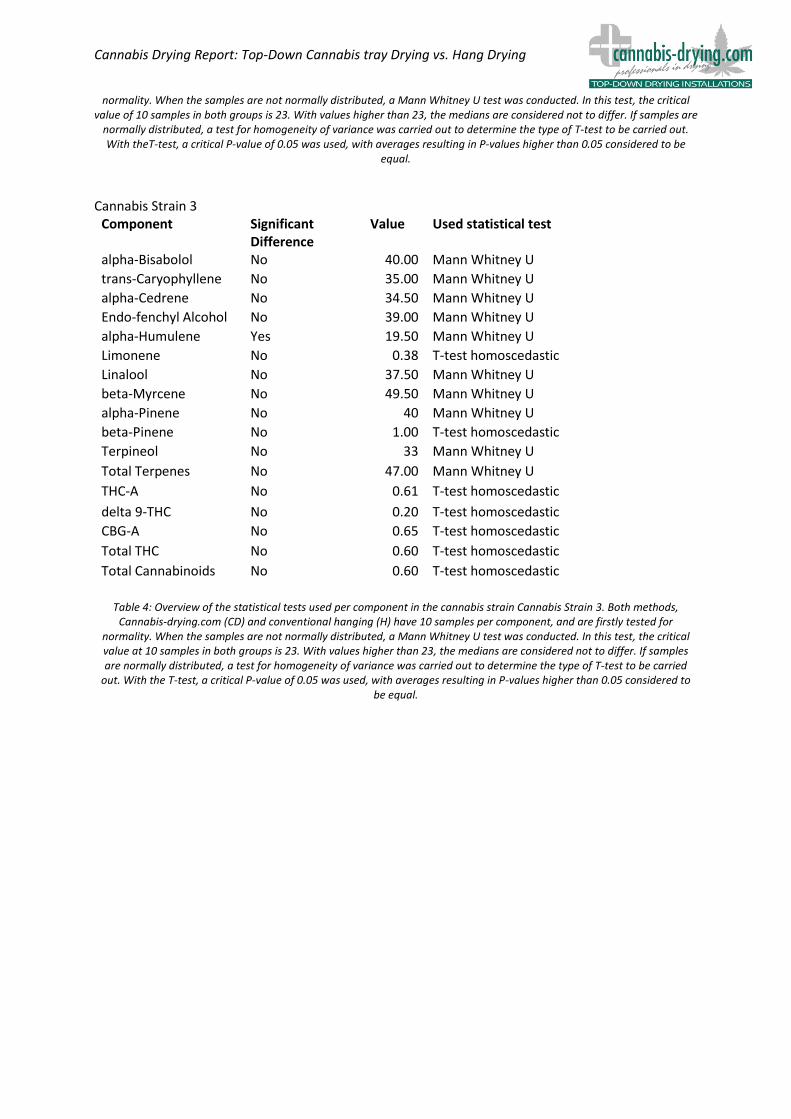
Table 4: Overview of the statistical tests used per component in the cannabis strain Cannabis Strain 3. Both methods,
Cannabis-drying.com (CD) and conventional hanging (H) have 10 samples per component, and are firstly tested for normality. When the samples are not normally distributed, a Mann Whitney U test was conducted. In this test, the critical value at 10 samples in both groups is 23. With values higher than 23, the medians are considered not to differ. If samples are normally distributed, a test for homogeneity of variance was carried out to determine the type of T-test to be carried
out. With the T-test, a critical P-value of 0.05 was used, with averages resulting in P-values higher than 0.05 considered to be equal.
Cannabis Drying Report: Top-Down Cannabis tray Drying vs. Hang Drying