Embed Size (px)
Citation preview
Cannabinoid receptor 2 mediates the retention ofimmature B cells in bone marrow sinusoids
Joao P Pereira1, Jinping An1, Ying Xu1, Yong Huang2 & Jason G Cyster1
Immature B cells developing in the bone marrow are found in the parenchyma and sinusoids. The mechanisms that control the
positioning of B cells in the sinusoids are not understood. Here we show that the integrin a4b1 (VLA-4) and its ligand VCAM-1
were required, whereas the chemokine receptor CXCR4 was dispensable, for sinusoidal retention of B cells. Instead, cannabinoid
receptor 2 (CB2), a Gai protein–coupled receptor upregulated in immature B cells, was required for sinusoidal retention. Using
two-photon microscopy, we found immature B cells entering and crawling in sinusoids; these immature B cells were displaced
by CB2 antagonism. Moreover, CB2-deficient mice had a lower frequency of immunoglobulin k-chain–positive B cells in the
peripheral blood and spleen. Our findings identify unique requirements for the retention of B cells in the bone marrow sinusoidal
niche and suggest involvement of CB2 in the generation of the B cell repertoire.
The bone marrow contains specialized yet poorly defined micro-environments that help maintain stem cells and support hemato-poiesis. In early studies examining the compartmentalization ofdeveloping B cells, B220+ cells and immature immunoglobulinM–positive (IgM+) cells were found scattered throughout the bonemarrow parenchyma, and immature IgM+ cells have also beenreported in sinusoids1–4. Bone marrow sinusoids are specializedthin-walled venous blood vessels that travel through the tissueparenchyma, often joining by anastomosis before connecting to thelarge central sinusoid that carries the blood and newly produced cellsto the venous circulation5. All cells produced in the bone marrow,including red blood cells, platelets, granulocytes and lymphocytes, arethought to enter the circulation through the sinusoids5. Given thiscellular diversity, sinusoids are unexpectedly enriched for lympho-cytes, and it has been suggested that there might be ‘lymphocyteloading’ of sinusoids2,6. However, the mechanisms that control theretention of immature B cells in bone marrow sinusoids or theirrelease from these sinusoids have not been defined.
The integrin-ligand pair a4b1 (VLA-4)–VCAM-1 helps retainhematopoietic stem cells in the bone marrow7–9. VCAM-1 is expressedby a subset of bone marrow stromal cells and by sinusoidal endo-thelium9. The function of a4b1–VCAM-1 interactions in B celldevelopment or retention in the bone marrow has been unclear, assome gene-ablation studies have suggested minimal involvement10–13,whereas others have documented fewer immature and mature B cellsin the bone marrow after ablation14,15. SDF-1 (CXCL12), a chemokinethat can activate a4b1 (ref. 16), is produced by bone marrow stromalcells and has also been detected on bone marrow endothelium17–19.The SDF-1 receptor CXCR4 helps retain hematopoietic progenitor
cells and developing B cells in the bone marrow20,21 and promotes thehoming of progenitor cells, plasma cells and T cells from blood tobone marrow19,22,23. However, CXCR4 is partially downregulatedbetween the pre–B cell and immature B cell stages16,21,24–26, and it isunclear whether CXCR4 continues to function in immature B cells.
The Gai protein–coupled cannabinoid receptor 2 (CB2) is abun-dantly expressed in mature B cells and is also present in myeloid cells,natural killer cells and various other cell types27,28. The CB2 ligand2-arachidonoylglycerol (2-AG) is generated from arachidonic acid–containing phospholipids and has been detected in many tissues,including bone28,29. Intake of cannabinoid receptor agonists has avariety of effects on the immune system, but the direct in vivo actionsof such agonists on lymphoid cells remain poorly understood30.
Here we use an in vivo pulse-labeling procedure to distinguish cellsin bone marrow sinusoids from those in the parenchyma and toestablish that the retention of immature B cell in sinusoids isdependent on a4b1 and VCAM-1. We found that CXCR4 was notcritical for retention in sinusoids but that pertussis toxin–mediatedinhibition of Gai displaced sinusoidal cells. The expression andfunction of CB2 were upregulated in immature B cells, and intrinsicdeficiency in CB2 prevented the accumulation of immature B cells inbone marrow sinusoids. Using two-photon microscopy, we foundimmature B cells entering and crawling in bone marrow sinusoids;these cells were displaced by CB2 antagonism. Finally, CB2deficiency resulted in a lower percentage of peripheral B cells thatexpressed immunoglobulin l-chain. Our findings identify uniquerequirements for the retention of B cells in the bone marrowsinusoidal niche and suggest a function for CB2 in the formation ofthe B cell repertoire.
Received 10 December 2008; accepted 26 January 2009; published online 1 March 2009; doi:10.1038/ni.1710
1Howard Hughes Medical Institute and Department of Microbiology and Immunology, University of California San Francisco, San Francisco, California, USA. 2Drug StudiesUnit, Department of Biopharmaceutical Sciences, University of California San Francisco, South San Francisco, California, USA. Correspondence should be addressed toJ.G.C. ([email protected]).
NATURE IMMUNOLOGY VOLUME 10 NUMBER 4 APRIL 2009 403
A R T I C L E S
©20
09 N
atu
re A
mer
ica,
Inc.
All
rig
hts
res
erve
d.
RESULTS
Labeling of cells in bone marrow sinusoids
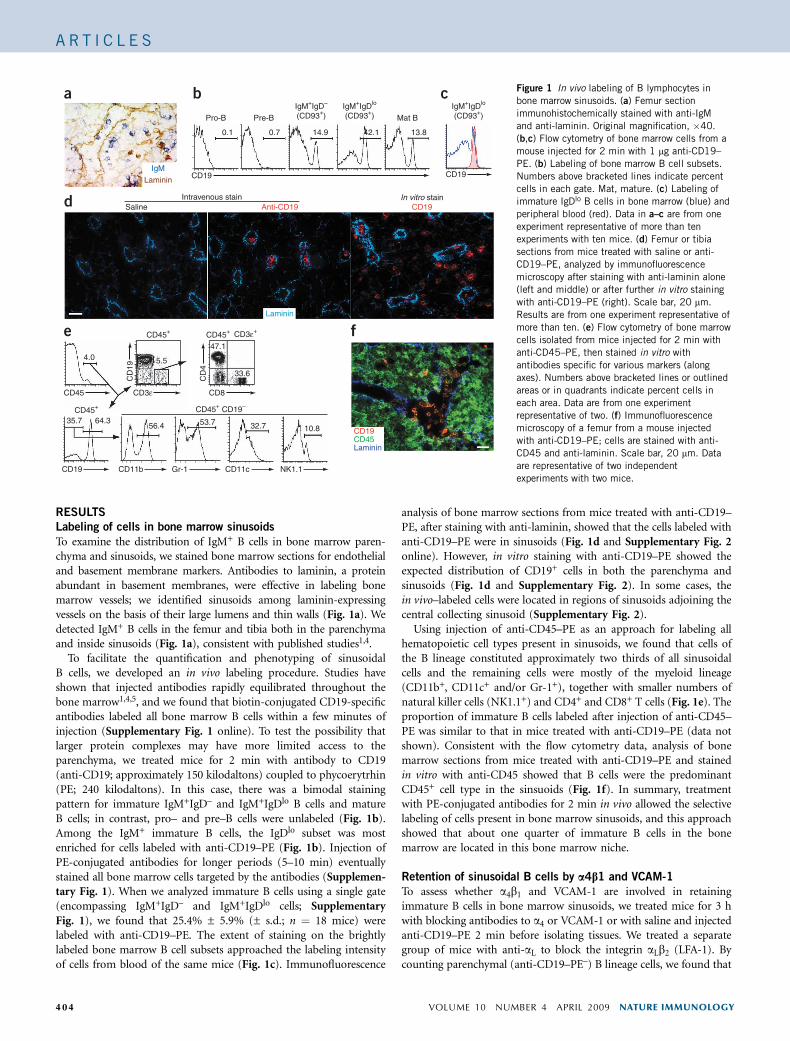
To examine the distribution of IgM+ B cells in bone marrow paren-chyma and sinusoids, we stained bone marrow sections for endothelialand basement membrane markers. Antibodies to laminin, a proteinabundant in basement membranes, were effective in labeling bonemarrow vessels; we identified sinusoids among laminin-expressingvessels on the basis of their large lumens and thin walls (Fig. 1a). Wedetected IgM+ B cells in the femur and tibia both in the parenchymaand inside sinusoids (Fig. 1a), consistent with published studies1,4.
To facilitate the quantification and phenotyping of sinusoidalB cells, we developed an in vivo labeling procedure. Studies haveshown that injected antibodies rapidly equilibrated throughout thebone marrow1,4,5, and we found that biotin-conjugated CD19-specificantibodies labeled all bone marrow B cells within a few minutes ofinjection (Supplementary Fig. 1 online). To test the possibility thatlarger protein complexes may have more limited access to theparenchyma, we treated mice for 2 min with antibody to CD19(anti-CD19; approximately 150 kilodaltons) coupled to phycoerytrhin(PE; 240 kilodaltons). In this case, there was a bimodal stainingpattern for immature IgM+IgD– and IgM+IgDlo B cells and matureB cells; in contrast, pro– and pre–B cells were unlabeled (Fig. 1b).Among the IgM+ immature B cells, the IgDlo subset was mostenriched for cells labeled with anti-CD19–PE (Fig. 1b). Injection ofPE-conjugated antibodies for longer periods (5–10 min) eventuallystained all bone marrow cells targeted by the antibodies (Supplemen-tary Fig. 1). When we analyzed immature B cells using a single gate(encompassing IgM+IgD– and IgM+IgDlo cells; SupplementaryFig. 1), we found that 25.4% ± 5.9% (± s.d.; n ¼ 18 mice) werelabeled with anti-CD19–PE. The extent of staining on the brightlylabeled bone marrow B cell subsets approached the labeling intensityof cells from blood of the same mice (Fig. 1c). Immunofluorescence
analysis of bone marrow sections from mice treated with anti-CD19–PE, after staining with anti-laminin, showed that the cells labeled withanti-CD19–PE were in sinusoids (Fig. 1d and Supplementary Fig. 2online). However, in vitro staining with anti-CD19–PE showed theexpected distribution of CD19+ cells in both the parenchyma andsinusoids (Fig. 1d and Supplementary Fig. 2). In some cases, thein vivo–labeled cells were located in regions of sinusoids adjoining thecentral collecting sinusoid (Supplementary Fig. 2).
Using injection of anti-CD45–PE as an approach for labeling allhematopoietic cell types present in sinusoids, we found that cells ofthe B lineage constituted approximately two thirds of all sinusoidalcells and the remaining cells were mostly of the myeloid lineage(CD11b+, CD11c+ and/or Gr-1+), together with smaller numbers ofnatural killer cells (NK1.1+) and CD4+ and CD8+ T cells (Fig. 1e). Theproportion of immature B cells labeled after injection of anti-CD45–PE was similar to that in mice treated with anti-CD19–PE (data notshown). Consistent with the flow cytometry data, analysis of bonemarrow sections from mice treated with anti-CD19–PE and stainedin vitro with anti-CD45 showed that B cells were the predominantCD45+ cell type in the sinsuoids (Fig. 1f). In summary, treatmentwith PE-conjugated antibodies for 2 min in vivo allowed the selectivelabeling of cells present in bone marrow sinusoids, and this approachshowed that about one quarter of immature B cells in the bonemarrow are located in this bone marrow niche.
Retention of sinusoidal B cells by a4b1 and VCAM-1
To assess whether a4b1 and VCAM-1 are involved in retainingimmature B cells in bone marrow sinusoids, we treated mice for 3 hwith blocking antibodies to a4 or VCAM-1 or with saline and injectedanti-CD19–PE 2 min before isolating tissues. We treated a separategroup of mice with anti-aL to block the integrin aLb2 (LFA-1). Bycounting parenchymal (anti-CD19–PE–) B lineage cells, we found that
IgM
Pro-B
a
d
e f
b c
0.1
CD19
Intravenous stain
4.0 5.5
47.1
33.6
10.8 CD19CD45Laminin
32.753.756.464.335.7
CD45
CD19 CD11b Gr-1 CD11c NK1.1
CD45+ CD45+ CD3ε+
CD45+CD45+ CD19–
CD
19
CD3ε
CD
4
CD8
Saline
CD19
Anti-CD19In vitro stain
CD19
0.7 14.9 42.1 13.8
IgM+IgD–
(CD93+)IgM+IgDlo
(CD93+)IgM+IgDlo
(CD93+)Pre-B Mat B
Laminin
Laminin
Figure 1 In vivo labeling of B lymphocytes in
bone marrow sinusoids. (a) Femur section
immunohistochemically stained with anti-IgM
and anti-laminin. Original magnification, �40.
(b,c) Flow cytometry of bone marrow cells from a
mouse injected for 2 min with 1 mg anti-CD19–
PE. (b) Labeling of bone marrow B cell subsets.
Numbers above bracketed lines indicate percentcells in each gate. Mat, mature. (c) Labeling of
immature IgDlo B cells in bone marrow (blue) and
peripheral blood (red). Data in a–c are from one
experiment representative of more than ten
experiments with ten mice. (d) Femur or tibia
sections from mice treated with saline or anti-
CD19–PE, analyzed by immunofluorescence
microscopy after staining with anti-laminin alone
(left and middle) or after further in vitro staining
with anti-CD19–PE (right). Scale bar, 20 mm.
Results are from one experiment representative of
more than ten. (e) Flow cytometry of bone marrow
cells isolated from mice injected for 2 min with
anti-CD45–PE, then stained in vitro with
antibodies specific for various markers (along
axes). Numbers above bracketed lines or outlined
areas or in quadrants indicate percent cells in
each area. Data are from one experiment
representative of two. (f) Immunofluorescencemicroscopy of a femur from a mouse injected
with anti-CD19–PE; cells are stained with anti-
CD45 and anti-laminin. Scale bar, 20 mm. Data
are representative of two independent
experiments with two mice.
404 VOLUME 10 NUMBER 4 APRIL 2009 NATURE IMMUNOLOGY
A R T I C L E S
©20
09 N
atu
re A
mer
ica,
Inc.
All
rig
hts
res
erve
d.
mice treated with a4-blocking antibodies had slightly but significantlyfewer immature IgD– and IgDlo cells, whereas in mice treated withanti-aL, the numbers remained unchanged (Fig. 2a). The number ofmature B cells was also diminished by treatment with anti-a4 and anti-VCAM-1 but not by treatment with anti-aL (Fig. 2a). In contrast tothose mild effects, we found a considerably fewer immature B cellsinside the sinusoids (anti-CD19–PE+) of mice treated with a4- orVCAM-1-blocking antibodies (Fig. 2b). There were also fewer sinu-soidal mature B cells. However, treatment with anti-aL did not resultin significant changes in the number of sinusoidal B cells (Fig. 2b). Bycounting IgM+ cells in frozen sections, we confirmed the displacementof B cells from bone marrow sinusoids after a4 blockade (Supple-mentary Fig. 3 online). Release of cells from bone marrow sinusoidsof mice treated with a4- or VCAM-1-blocking antibodies was reflectedin a significant increase in the numbers of the same B cell subsets inthe peripheral blood (P o 0.005; Supplementary Fig. 3). We alsodetected some pro– and pre–B cells in the blood, which often seemedprominent relative their absence in control blood; however, consistentwith the bone marrow data, their absolute numbers were at least anorder of magnitude lower than the number of immature B cells.Blocking P-selectin or blocking P- and E-selectins for 3 h did not resultin significant changes in the number of B cells in bone marrowsinusoids (data not shown).
We were able to distinguish immature B cells in the bone marrowparenchyma and sinusoids from those in the blood by their higher cellsurface expression of CD93 (AA4.1; Fig. 2c). Notably, the immatureB cells found in blood after treatment with anti-a4 resembled those inthe bone marrow in terms of CD93 expression (Fig. 2c). This findingis consistent with the conclusion that the increase in blood immatureB cells was due to release of cells from the bone marrow. The CD93staining data also emphasized the phenotypic similarity of the bonemarrow parenchymal and sinusoidal immature B cell populations(Supplementary Fig. 1).
To assess the function of the b1 integrin chain in the retention ofB cells in sinusoids, we crossed mice bearing loxP sites flanking Itgb1(which encodes b1 integrin; Itgb1f/f or Itgb1f/+ mice)31 with mice thatexpress Cre recombinase from the Cd19 locus (Cd19Cre/+ mice)32. InItgb1f/fCd19Cre/+ mice, the proportion of B cells that underwentdeletion of Igtb1 (identified by lack of surface b1 staining) increasedgradually during B cell development (Fig. 3a), consistent with ongoingCre-mediated deletion33. Pulse labeling with anti-CD45–PE showedthat in Itgb1f/+Cd19Cre/+ and Itgb1f/fCd19Cre/+ mice, there was astrong ‘bias’ against b1-deficient immature B cells in the sinusoidalCD45+ compartment (Fig. 3a,b). In contrast, peripheral blood wasenriched for immature B cells that had lost b1 expression (Fig. 3c),consistent with the idea that b1 promotes retention of these cells inthe bone marrow. Analysis of mature B cells was difficult becausesurface staining of b1 on this subset did not allow clear distinctionbetween cells expressing and lacking b1 (data not shown). Thesefindings collectively indicate that a4b1 and VCAM-1 are required
0.398.1
70.1
5.520.8
3.784.9
13.6 0.9
0.779.0
0.220.6
0.2
24.572.387.3 7.9
66.1
0.233.7
0.1
0.193.7
Inte
grin
β1
CD45
Pro-B Pre-B IgM+IgD–
(CD93+)IgM+IgDlo
(CD93+)a
0
5
10
15
20
25
30
35
40
**
*
Sin
usoi
dal c
ells
(%
)
IgD–
b
0
10
20
30
40
50
60
70
80
90
100
β 1– cel
ls (
%)
c
*
*
Itgb1f/+Cd19Cre/+ (β1+)
Itgb1f/fCd19Cre/+ (β1+)
Itgb1f/fCd19Cre/+ (β1–)
Itgb1f/+
Cd19Cre/+
Itgb1f/f
Cd19Cre/+
BMBlood
IgDlo IgD– IgDlo
0.0
0.1
0.2
0.3
0.4
0.5
**
**
**
0.0
0.05
0.10
0.15
0.20
0.25
0.0
0.1
0.2
0.3
0.4
0.5
0.6 Saline
**
b**
**0.0
1.0
2.0
3.0
4.0
5.0
****
Par
ench
ymal
cel
ls (
106 )
0.0
1.0
2.0
3.0
4.0
0.0
1.0
2.0
3.0
4.0
5.0
6.0
7.0
*
*a
Pro-B
Pre-B
IgDlo
Mat
BIg
D–
Pro-B
Pre-B
IgDlo
Mat
BIg
D–
Pro-B
Pre-B
IgDlo
Mat
BIg
D–
Pro-B
Pre-B
IgDlo
Mat
BIg
D–
Pro-B
Pre-B
IgDlo
Mat
BIg
D–
Pro-B
Pre-B
IgDlo
Mat
BIg
D–
SalineAnti-α4
SalineAnti-αL
Sin
usoi
dal c
ells
(10
6 )
c
CD93
BMCtrl
PBCtrlα4
α4
SalineAnti-α4
SalineAnti-αL
SalineAnti-VCAM-1
Anti-VCAM-1
Sin
usoi
dal c
ells
(10
6 )
Sin
usoi
dal c
ells
(10
6 )
Par
ench
ymal
cel
ls (
106 )
Par
ench
ymal
cel
ls (
106 )
Figure 2 Retention of B cells in bone marrow sinusoids is promoted by a4 and VCAM-1. (a,b) Analysis of bone marrow B cell subsets in mice treated
for 3 h with saline, anti-a4, anti-aL or anti-VCAM-1, with anti-CD19-PE added for the final 2 min, counted as parenchymal cells (anti-CD19–PE–; a) or
sinusoidal cells (anti-CD19–PE+; b). Bars indicate the mean; symbols indicate individual mice. *, P o 0.05, and **, P o 0.005 (unpaired, two-tailed
Student’s t-test). (c) Flow cytometry of CD93 expression on immature IgDlo B cells (open histograms) in the bone marrow (BM) and peripheral blood (PB) of
mice treated for 3 h with saline (control (Ctrl)) or anti-a4 (a4). Filled histogram, mature B cells. Data are representative of three experiments with eight to
ten mice per experiment.
Figure 3 Retention of B lymphocytes in bone marrow sinusoids by b1
integrins. (a) Flow cytometry of the expression of b1 integrin on bone marrow
B lineage cells from Itgb1f/+Cd19Cre/+ or Itgb1f/fCd19Cre/+ mice treated for
2 min with anti-CD45–PE. Numbers in quadrants indicate percent cells in
each. (b) Sinusoidal (CD45+) cells in each B cell stage gated as in a oncells with deletion (b1
–) or no deletion (b1+) of b1 integrin. Similar results
were obtained with mice expressing one or two Cd19Cre alleles, so
those data are presented together; Itgb1f/+Cd19Cre/+, n ¼ 9 mice, and
Itgb1f/fCd19Cre/+, n ¼ 5 mice. (c) Flow cytometry of immature B cells with
deletion of b1 integrin in the bone marrow and blood of Itgb1f/fCd19Cre/+
mice (n ¼ 4). *, P o 0.05 and **, P o 0.005 (unpaired, two-tailed
Student’s t-test). Bars indicate the mean; symbols indicate individual mice
(b,c). Data are pooled from three experiments.
NATURE IMMUNOLOGY VOLUME 10 NUMBER 4 APRIL 2009 405
A R T I C L E S
©20
09 N
atu
re A
mer
ica,
Inc.
All
rig
hts
res
erve
d.
for the retention of immature B cells and mature recirculatingB cells in bone marrow sinusoids.
Retention in the parenchyma requires CXCR4
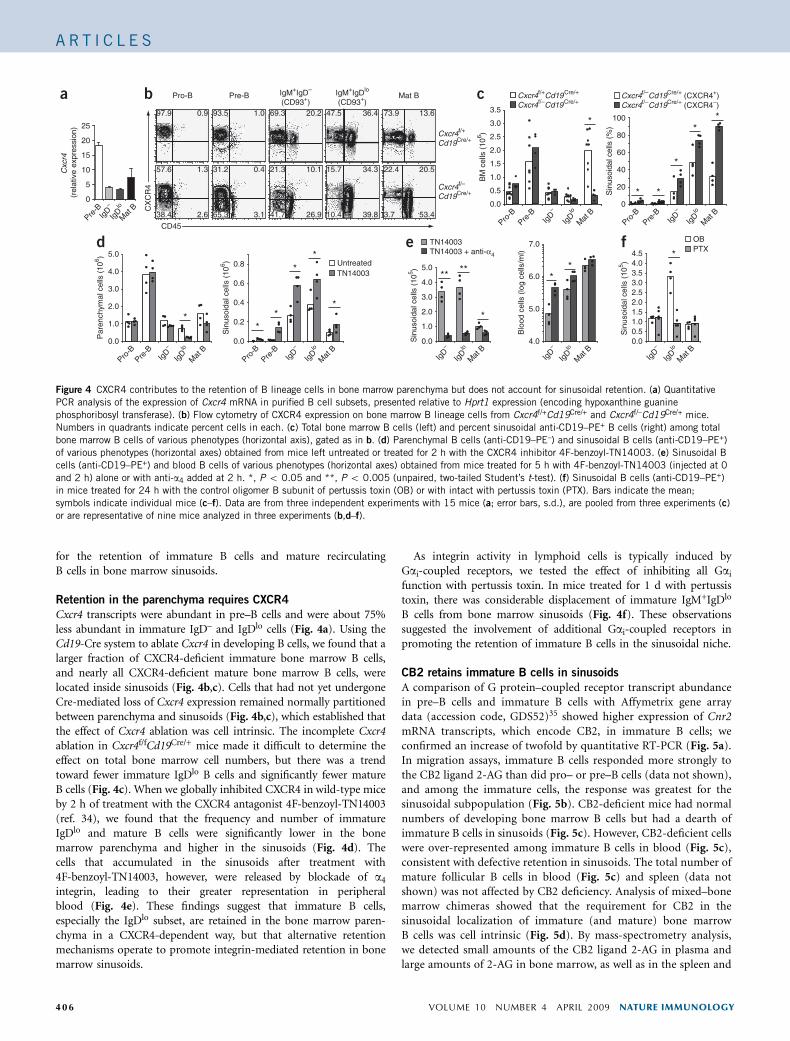
Cxcr4 transcripts were abundant in pre–B cells and were about 75%less abundant in immature IgD– and IgDlo cells (Fig. 4a). Using theCd19-Cre system to ablate Cxcr4 in developing B cells, we found that alarger fraction of CXCR4-deficient immature bone marrow B cells,and nearly all CXCR4-deficient mature bone marrow B cells, werelocated inside sinusoids (Fig. 4b,c). Cells that had not yet undergoneCre-mediated loss of Cxcr4 expression remained normally partitionedbetween parenchyma and sinusoids (Fig. 4b,c), which established thatthe effect of Cxcr4 ablation was cell intrinsic. The incomplete Cxcr4ablation in Cxcr4f/fCd19Cre/+ mice made it difficult to determine theeffect on total bone marrow cell numbers, but there was a trendtoward fewer immature IgDlo B cells and significantly fewer matureB cells (Fig. 4c). When we globally inhibited CXCR4 in wild-type miceby 2 h of treatment with the CXCR4 antagonist 4F-benzoyl-TN14003(ref. 34), we found that the frequency and number of immatureIgDlo and mature B cells were significantly lower in the bonemarrow parenchyma and higher in the sinusoids (Fig. 4d). Thecells that accumulated in the sinusoids after treatment with4F-benzoyl-TN14003, however, were released by blockade of a4
integrin, leading to their greater representation in peripheralblood (Fig. 4e). These findings suggest that immature B cells,especially the IgDlo subset, are retained in the bone marrow paren-chyma in a CXCR4-dependent way, but that alternative retentionmechanisms operate to promote integrin-mediated retention in bonemarrow sinusoids.
As integrin activity in lymphoid cells is typically induced byGai-coupled receptors, we tested the effect of inhibiting all Gai
function with pertussis toxin. In mice treated for 1 d with pertussistoxin, there was considerable displacement of immature IgM+IgDlo
B cells from bone marrow sinusoids (Fig. 4f). These observationssuggested the involvement of additional Gai-coupled receptors inpromoting the retention of immature B cells in the sinusoidal niche.
CB2 retains immature B cells in sinusoids
A comparison of G protein–coupled receptor transcript abundancein pre–B cells and immature B cells with Affymetrix gene arraydata (accession code, GDS52)35 showed higher expression of Cnr2mRNA transcripts, which encode CB2, in immature B cells; weconfirmed an increase of twofold by quantitative RT-PCR (Fig. 5a).In migration assays, immature B cells responded more strongly tothe CB2 ligand 2-AG than did pro– or pre–B cells (data not shown),and among the immature cells, the response was greatest for thesinusoidal subpopulation (Fig. 5b). CB2-deficient mice had normalnumbers of developing bone marrow B cells but had a dearth ofimmature B cells in sinusoids (Fig. 5c). However, CB2-deficient cellswere over-represented among immature B cells in blood (Fig. 5c),consistent with defective retention in sinusoids. The total number ofmature follicular B cells in blood (Fig. 5c) and spleen (data notshown) was not affected by CB2 deficiency. Analysis of mixed–bonemarrow chimeras showed that the requirement for CB2 in thesinusoidal localization of immature (and mature) bone marrowB cells was cell intrinsic (Fig. 5d). By mass-spectrometry analysis,we detected small amounts of the CB2 ligand 2-AG in plasma andlarge amounts of 2-AG in bone marrow, as well as in the spleen and
0
5
10
15
20
25
Pre-B
IgD–
IgDlo
Mat
B
a
0.0
0.5
1.0
1.5
2.0
2.5
3.0
3.5
BM
cel
ls (
106 )
*
0
20
40
60
80
100
Sin
usoi
dal c
ells
(%
)
c
* *
*
**
Pro-B
Pre-B
Ig
D–
Mat
B
Cxc
r4
(rel
ativ
e ex
pres
sion
)
CX
CR
4
Cxcr4f/+
Cd19Cre/+
b97.9 0.9 93.5 1.0 69.3 20.2 47.5 36.4 73.9 13.6
57.6 1.3
2.638.4
31.2 0.4
3.165.3
21.3 10.1
26.941.7
15.7 34.3
39.8
22.4 20.5
53.43.7
Pro-B Pre-B IgM+IgD–
(CD93+)IgM+IgDlo
(CD93+)Mat B
10.4
CD45
Cxcr4f/–
Cd19Cre/+
Cxcr4f/+Cd19Cre/+
Cxcr4f/–Cd19Cre/+Cxcr4f/–Cd19Cre/+ (CXCR4+)Cxcr4f/–Cd19Cre/+ (CXCR4–)
IgDlo
Pro-B
Pre-B
Ig
D–
Mat
BIg
Dlo
UntreatedTN14003
*
0.0
1.0
2.0
3.0
4.0
5.0
Par
ench
ymal
cel
ls (
106 )
**
**
*
0.0
0.6
0.2
0.4
0.8
dS
inus
oida
l cel
ls (
106 )
0.0
1.0
2.0
3.0
4.0
5.0
e
Sin
usoi
dal c
ells
(10
5 )
TN14003TN14003 + anti-α4
** **
*
0.00.51.01.52.02.53.03.54.04.5 *
f PTXOB
4.0
5.0
6.0
7.0
Blo
od c
ells
(lo
g ce
lls/m
l)
**
Sin
usoi
dal c
ells
(10
5 )
IgD–
Mat
BIg
Dlo
IgD–
Mat
BIg
Dlo
IgD–
Mat
BIg
Dlo
Pro-B
Pre-B
Ig
D–
Mat
BIg
Dlo
Pro-B
Pre-B
Ig
D–
Mat
BIg
Dlo
Figure 4 CXCR4 contributes to the retention of B lineage cells in bone marrow parenchyma but does not account for sinusoidal retention. (a) Quantitative
PCR analysis of the expression of Cxcr4 mRNA in purified B cell subsets, presented relative to Hprt1 expression (encoding hypoxanthine guanine
phosphoribosyl transferase). (b) Flow cytometry of CXCR4 expression on bone marrow B lineage cells from Cxcr4f/+Cd19Cre/+ and Cxcr4f/–Cd19Cre/+ mice.
Numbers in quadrants indicate percent cells in each. (c) Total bone marrow B cells (left) and percent sinusoidal anti-CD19–PE+ B cells (right) among total
bone marrow B cells of various phenotypes (horizontal axis), gated as in b. (d) Parenchymal B cells (anti-CD19–PE–) and sinusoidal B cells (anti-CD19–PE+)
of various phenotypes (horizontal axes) obtained from mice left untreated or treated for 2 h with the CXCR4 inhibitor 4F-benzoyl-TN14003. (e) Sinusoidal B
cells (anti-CD19–PE+) and blood B cells of various phenotypes (horizontal axes) obtained from mice treated for 5 h with 4F-benzoyl-TN14003 (injected at 0
and 2 h) alone or with anti-a4 added at 2 h. *, P o 0.05 and **, P o 0.005 (unpaired, two-tailed Student’s t-test). (f) Sinusoidal B cells (anti-CD19–PE+)
in mice treated for 24 h with the control oligomer B subunit of pertussis toxin (OB) or with intact with pertussis toxin (PTX). Bars indicate the mean;
symbols indicate individual mice (c–f). Data are from three independent experiments with 15 mice (a; error bars, s.d.), are pooled from three experiments (c)
or are representative of nine mice analyzed in three experiments (b,d–f).
406 VOLUME 10 NUMBER 4 APRIL 2009 NATURE IMMUNOLOGY
A R T I C L E S
©20
09 N
atu
re A
mer
ica,
Inc.
All
rig
hts
res
erve
d.
brain (Fig. 5e). Finally, transfer of activated B cells transducedwith a retrovirus encoding CB2 showed that higher expression ofCB2 resulted in more sinusoidal than parenchymal lodgment of
transferred cells (Fig. 5f). These findings demonstrate that CB2has high activity in sinusoidal B cells and is required for theirefficient lodgment in bone marrow sinusoids.
0
1
2
3
4
Cnr
2
(Rel
ativ
e ex
pres
sion
)
PreB
a
*
*
*
0
10
20
30
40
d
IgM+CD93+ IgM+CD93+
2-A
G (
nmol
/g)
e
0.001
0.01
0.1
1
10
100
BM
Plasm
a
Spleen
Brain
14.8
18.426.4
31.5
14.714.6
CD19
GF
P
Ctrl CB2
f
0
20
40
60
80
100
CtrlCB2
0
20
40
60
80
100
CtrlCB2
*GFP+ GFP–
02468
101214
IgM
+Ig
D–
cells
(%
of i
nput
)
SinusoidsParenchyma
Nil 0.1 1 10 SDF
2-AG (µM)
b
***
*
Nil 0.1 1 10 SDF
2-AG (µM)Ig
D–
IgDlo
0.0
0.5
1.0
1.5
2.0
2.5
3.0
Par
ench
ymal
cel
ls (
106 )
0.0
0.1
0.2
0.3
3
4
5
6
7 Cnr2 +/+
Cnr2 –/–
*
**
**
***
c
Mat
B02468
101214
IgM
+Ig
Dlo
cel
ls
(% o
f inp
ut)
Sin
usoi
dal c
ells
(10
6 )
IgD– IgDlo Mat B IgD– IgDlo Mat B IgD– IgDlo Mat BS
inus
oida
l cel
ls (
%)
Cnr2 –/– (Ly5.2)Cnr2 +/+ (Ly5.1)
0
10
20
30
40
Sin
usoi
dal c
ells
(%
)
Blo
od c
ells
(lo
g ce
lls/m
l)
39.0 40.4
Sin
usoi
dal c
ells
(%
)
Sin
usoi
dal c
ells
(%
)
Cnr2 +/+ (Ly5.1)
Cnr2 +/+ (Ly5.2)
IgD– IgDlo Mat B IgD– IgDlo Mat B
Figure 5 CB2 is requiredfor the lodgment of imma-
ture B cells in bone marrow
sinusoids. (a) Quantitative
PCR analysis of the
expression of Cnr2 mRNA
in purified B cell subsets,
presented relative to Hprt1
expression. Data are
representative of two
experiments with two mice. (b) Transwell assay of the migration of immature IgM+D– and IgM+Dlo bone marrow B cells from mice treated with anti-CD19–PE,
assessing movement toward 2-AG (concentration, horizontal axes) or SDF-1 (0.3 mg/ml; SDF). Nil, no chemokine. Data are representative of ten experiments
with one mouse in each. (c) Parenchymal (anti-CD19–PE–) and sinusoidal (anti-CD19–PE+) bone marrow B cells and blood B cells of various types (horizontal
axes), obtained from Cnr2+/+ mice (n ¼ 8) and Cnr2–/– mice (n ¼ 7). Data are pooled from three experiments. (d) In vivo anti-CD19–PE–labeled cells of
various phenotypes (horizontal axes) from the bone marrow of mice reconstituted with a mixture of Ly5.1+Cnr2+/+ and Ly5.2+Cnr2+/+ bone marrow cells (left)
or Ly5.1+Cnr2+/+ and Ly5.2+Cnr2–/– bone marrow cells (right). Data are representative of four experiments with five mice per group. (e) Mass spectrometry of
2-AG in bone marrow, plasma, spleen and brain. Data are pooled from three experiments with four to ten mice. (f) Flow cytometry of bone marrow (left) and
transferred GFP+ and GFP– cells in bone marrow sinusoids (anti-CD19–PE+; right) from mice that received B cells transduced with retrovirus encoding GFP
alone (Ctrl) or CB2 and GFP (CB2), then were injected with anti-CD19–PE 2 min before analysis. Numbers in quadrants (left) indicate percent cells in each.Data are pooled from three experiments with two mice in each. Bars indicate the mean; symbols indicate individual mice (b–f).
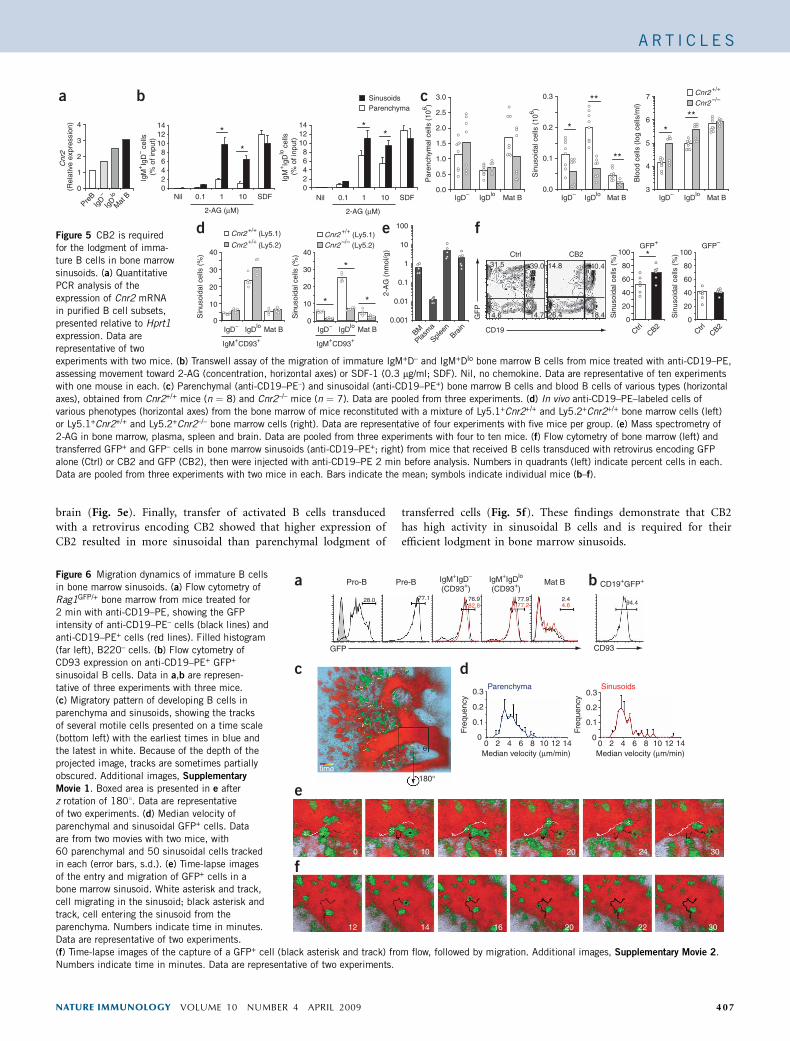
Figure 6 Migration dynamics of immature B cells
in bone marrow sinusoids. (a) Flow cytometry of
Rag1GFP/+ bone marrow from mice treated for
2 min with anti-CD19–PE, showing the GFP
intensity of anti-CD19–PE– cells (black lines) and
anti-CD19–PE+ cells (red lines). Filled histogram
(far left), B220– cells. (b) Flow cytometry ofCD93 expression on anti-CD19–PE+ GFP+
sinusoidal B cells. Data in a,b are represen-
tative of three experiments with three mice.
(c) Migratory pattern of developing B cells in
parenchyma and sinusoids, showing the tracks
of several motile cells presented on a time scale
(bottom left) with the earliest times in blue and
the latest in white. Because of the depth of the
projected image, tracks are sometimes partially
obscured. Additional images, Supplementary
Movie 1. Boxed area is presented in e after
z rotation of 1801. Data are representative
of two experiments. (d) Median velocity of
parenchymal and sinusoidal GFP+ cells. Data
are from two movies with two mice, with
60 parenchymal and 50 sinusoidal cells tracked
in each (error bars, s.d.). (e) Time-lapse images
of the entry and migration of GFP+ cells in abone marrow sinusoid. White asterisk and track,
cell migrating in the sinusoid; black asterisk and
track, cell entering the sinusoid from the
parenchyma. Numbers indicate time in minutes.
Data are representative of two experiments.
(f) Time-lapse images of the capture of a GFP+ cell (black asterisk and track) from flow, followed by migration. Additional images, Supplementary Movie 2.
Numbers indicate time in minutes. Data are representative of two experiments.
0.3Parenchyma Sinusoids
0.2
Freq
uenc
y
Freq
uenc
y
0.1
0.3
0.2
180°time
e
0.1
000 2 4 6 8 10Median velocity (µm/min)
12 140 2 4 6 8 10Median velocity (µm/min)
12 14
GFP
Pro-Ba b
c
e
f
d
28.0 77.1 76.9 77.982.8 77.2
2.494.44.6
Mat B
CD93
Pre-B IgM+IgD–
(CD93+)IgM+IgDlo
(CD93+)CD19+GFP+
0 10 15 20 24 30
12 14 16 20 22 30
NATURE IMMUNOLOGY VOLUME 10 NUMBER 4 APRIL 2009 407
A R T I C L E S
©20
09 N
atu
re A
mer
ica,
Inc.
All
rig
hts
res
erve
d.
Dynamic activity of sinusoidal B cells
To examine the migration dynamics of immature B cells in sinusoids,we did intravital two-photon microscopy of Rag1GFP/+ cells in bonemarrow in the mouse calvarium. Rag1GFP/+ mice have a cassetteencoding green fluorescent protein (GFP) ‘knocked into’ one alleleencoding recombination-activating gene 1 (Rag1). As expected, usingflow cytometry, we detected GFP in Rag1GFP/+ pro–B cells and moreabundant GFP in pre–B cells and immature B cells, whereas mostmature B cells did not express GFP36 (Fig. 6a). Using in vivo CD19-PElabeling, we confirmed that the immature IgM+IgD– and IgM+IgDlo
B cells inside the sinusoids were GFPhi (Fig. 6a) and, reciprocally,that over 94% of the GFPhi sinusoidal B cells expressed CD93(Fig. 6b).
Using dextran-rhodamine to distinguish sinusoids and other bloodvessels from bone marrow parenchyma, we identified many GFP+ cellsin the parenchyma, which most likely corresponded to pre–B cells andimmature B cells; a fraction of these cells were motile (Fig. 6c andSupplementary Movies 1 and 2 online), some with median velocitiesof 4–7 mm/min (Fig. 6d). Many of the cells with median velocities of2–4 mm/min corresponded to cells that extended processes but showedlittle displacement above background movement in the tissue. Nota-bly, there were also GFP+ cells in vessels, and although many werepoorly motile, some migrated in various directions (Fig. 6e andSupplementary Movies 1 and 2) at median velocities ranging from5 mm/min to 10 mm/min (Fig. 6d). Although only small numbers ofnewly generated B cells are expected to migrate from the parenchymainto the sinusoids during imaging periods of 30–60 min, we did findseveral examples of GFP+ cells entering sinusoids (Fig. 6e andSupplementary Movie 1). Notably, after entering, these cells remainedadherent and in some cases continued tomigrate. Occasionally, a cell in flow in thesinusoid became adherent and began crawl-ing (Fig. 6f and Supplementary Movie 2).We also detected GFP+ cells detaching andbeing rapidly carried away with the bloodflow (Supplementary Movie 2). GFP– cellsappeared as dark halos in the dextran-rhoda-mine–labeled sinusoids and often movedbidirectionally in a given vessel (Supplemen-tary Movies 1 and 2). Consistent with thefact that most immature sinusoidal B cellshad recently entered from the bone marrowparenchyma, labeling experiments with thethymidine analog BrdU showed that sinusoi-dal B cells were replaced by newly generatedcells with only a slight lag compared with the
replacement of parenchymal B cells and more rapidly than immatureB cells in the blood (Supplementary Fig. 4 online).
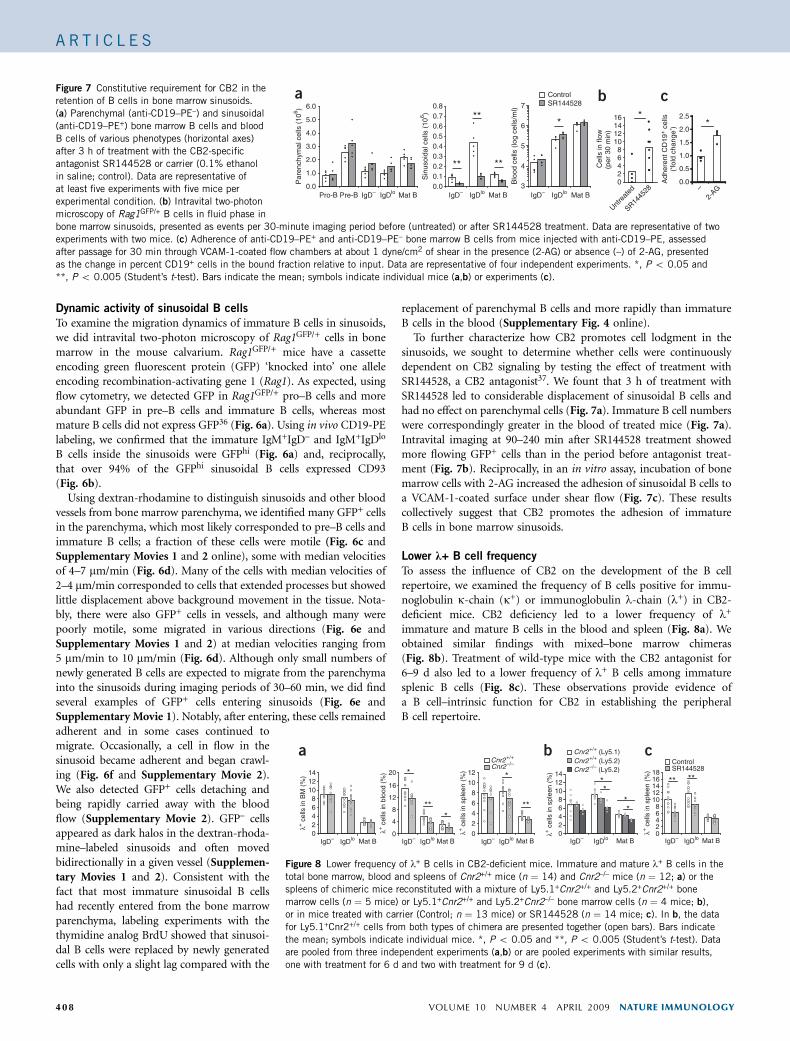
To further characterize how CB2 promotes cell lodgment in thesinusoids, we sought to determine whether cells were continuouslydependent on CB2 signaling by testing the effect of treatment withSR144528, a CB2 antagonist37. We fount that 3 h of treatment withSR144528 led to considerable displacement of sinusoidal B cells andhad no effect on parenchymal cells (Fig. 7a). Immature B cell numberswere correspondingly greater in the blood of treated mice (Fig. 7a).Intravital imaging at 90–240 min after SR144528 treatment showedmore flowing GFP+ cells than in the period before antagonist treat-ment (Fig. 7b). Reciprocally, in an in vitro assay, incubation of bonemarrow cells with 2-AG increased the adhesion of sinusoidal B cells toa VCAM-1-coated surface under shear flow (Fig. 7c). These resultscollectively suggest that CB2 promotes the adhesion of immatureB cells in bone marrow sinusoids.
Lower k+ B cell frequency
To assess the influence of CB2 on the development of the B cellrepertoire, we examined the frequency of B cells positive for immu-noglobulin k-chain (k+) or immunoglobulin l-chain (l+) in CB2-deficient mice. CB2 deficiency led to a lower frequency of l+
immature and mature B cells in the blood and spleen (Fig. 8a). Weobtained similar findings with mixed–bone marrow chimeras(Fig. 8b). Treatment of wild-type mice with the CB2 antagonist for6–9 d also led to a lower frequency of l+ B cells among immaturesplenic B cells (Fig. 8c). These observations provide evidence ofa B cell–intrinsic function for CB2 in establishing the peripheralB cell repertoire.
Figure 7 Constitutive requirement for CB2 in the
retention of B cells in bone marrow sinusoids.
(a) Parenchymal (anti-CD19–PE–) and sinusoidal
(anti-CD19–PE+) bone marrow B cells and blood
B cells of various phenotypes (horizontal axes)
after 3 h of treatment with the CB2-specific
antagonist SR144528 or carrier (0.1% ethanol
in saline; control). Data are representative ofat least five experiments with five mice per
experimental condition. (b) Intravital two-photon
microscopy of Rag1GFP/+ B cells in fluid phase in
bone marrow sinusoids, presented as events per 30-minute imaging period before (untreated) or after SR144528 treatment. Data are representative of two
experiments with two mice. (c) Adherence of anti-CD19–PE+ and anti-CD19–PE– bone marrow B cells from mice injected with anti-CD19–PE, assessed
after passage for 30 min through VCAM-1-coated flow chambers at about 1 dyne/cm2 of shear in the presence (2-AG) or absence (–) of 2-AG, presented
as the change in percent CD19+ cells in the bound fraction relative to input. Data are representative of four independent experiments. *, P o 0.05 and
**, P o 0.005 (Student’s t-test). Bars indicate the mean; symbols indicate individual mice (a,b) or experiments (c).
b
Untre
ated
SR1445
2802468
10121416
Cel
ls in
flow
(per
30
min
)
0.0
0.5
1.0
1.5
2.0
2.5
2-AG–
Adh
eren
t CD
19+ c
ells
(‘fol
d ch
ange
’)
c
**
Par
ench
ymal
cel
ls (
106 )
0.0
1.0
3.0
4.0
2.0
5.0
6.0
0.00.1
0.30.4
0.2
0.50.60.70.8
3
4
5
6
7
**
**
**
*
SR144528a Control
Sin
usoi
dal c
ells
(10
6 )
Pro-B Pre-B IgD– Mat BIgDlo IgD– Mat BIgDlo IgD– IgDlo Mat B
Blo
od c
ells
(lo
g ce
lls/m
l)
0
2
4
6
8
10
12
0
4
8
12
16
20 *
***
*
**
02468
101214
λ+ c
ells
in B
M (
%)
Cnr2+/+a
Cnr2–/–
λ+ c
ells
in b
lood
(%
)
λ+ c
ells
in s
plee
n (%
)
IgD– Mat BIgDlo IgD– IgDlo IgD– IgDlo IgD– IgDlo IgD– IgDloMat B Mat B02468
101214
Cnr2+/+ (Ly5.1)Cnr2+/+ (Ly5.2)Cnr2–/– (Ly5.2)
**
**
b
Mat B Mat B02468
1012141618
ControlSR144528
c
** **
λ+ c
ells
in s
plee
n (%
)
λ+ c
ells
in s
plee
n (%
)
Figure 8 Lower frequency of l+ B cells in CB2-deficient mice. Immature and mature l+ B cells in the
total bone marrow, blood and spleens of Cnr2+/+ mice (n ¼ 14) and Cnr2–/– mice (n ¼ 12; a) or the
spleens of chimeric mice reconstituted with a mixture of Ly5.1+Cnr2+/+ and Ly5.2+Cnr2+/+ bone
marrow cells (n ¼ 5 mice) or Ly5.1+Cnr2+/+ and Ly5.2+Cnr2–/– bone marrow cells (n ¼ 4 mice; b),or in mice treated with carrier (Control; n ¼ 13 mice) or SR144528 (n ¼ 14 mice; c). In b, the data
for Ly5.1+Cnr2+/+ cells from both types of chimera are presented together (open bars). Bars indicate
the mean; symbols indicate individual mice. *, P o 0.05 and **, P o 0.005 (Student’s t-test). Data
are pooled from three independent experiments (a,b) or are pooled experiments with similar results,
one with treatment for 6 d and two with treatment for 9 d (c).
408 VOLUME 10 NUMBER 4 APRIL 2009 NATURE IMMUNOLOGY
A R T I C L E S
©20
09 N
atu
re A
mer
ica,
Inc.
All
rig
hts
res
erve
d.


![Anaphase Promoting Complex activity mediates clinical ... · 5/26/2020 · humans with renal failure [39,40]. There was no alteration to differential cell counts, with immature bands](https://img.pdfslide.us/doc/110x75/6018d851684eb86ffa2e970d/anaphase-promoting-complex-activity-mediates-clinical-5262020-humans-with.jpg)