Embed Size (px)
Citation preview
Olivas-Aguirre et al. Cell Death and Disease (2019) 10:779
https://doi.org/10.1038/s41419-019-2024-0 Cell Death & Disease
ART ICLE Open Ac ce s s
Cannabidiol directly targets mitochondria anddisturbs calcium homeostasis in acutelymphoblastic leukemiaMiguel Olivas-Aguirre 1, Liliana Torres-López1, Juan Salvador Valle-Reyes1, Arturo Hernández-Cruz2,Igor Pottosin 1 and Oxana Dobrovinskaya 1
AbstractAnticancer properties of non-psychoactive cannabinoid cannabidiol (CBD) have been demonstrated on tumors ofdifferent histogenesis. Different molecular targets for CBD were proposed, including cannabinoid receptors and someplasma membrane ion channels. Here we have shown that cell lines derived from acute lymphoblastic leukemia of Tlineage (T-ALL), but not resting healthy T cells, are highly sensitive to CBD treatment. CBD effect does not depend oncannabinoid receptors or plasma membrane Ca2+-permeable channels. Instead, CBD directly targets mitochondriaand alters their capacity to handle Ca2+. At lethal concentrations, CBD causes mitochondrial Ca2+ overload, stablemitochondrial transition pore formation and cell death. Our results suggest that CBD is an attractive candidate to beincluded into chemotherapeutic protocols for T-ALL treatment.
IntroductionAcute lymphoblastic leukemia (ALL) of T lineage (T-
ALL) represents a highly aggressive cancer, resistant tochemotherapy and with increased risk of relapse, whichoccurs in 15% of childhood and 25% of adult ALL cases.In T-ALL, a long-term remission fails in ~20% of childrenand 40% of adult patients. The prognosis for these groupsremains poor, with a 5-year survival rate of <25%1–5.Thus, novel therapeutic strategies for the T-ALL treat-ment are needed.Cannabinoids are a group of more than 60 structurally
related terpenophenolic compounds. Most of them exerttheir effects through cannabinoid CB1 and CB2 receptors,which belong to the family of G protein-coupled
receptors. Lymphocytes mainly express CB2, whereas CB1are highly expressed in the central nervous system (CNS).Cannabinoids have been used for decades in the field ofpalliative care. Recently two phytocannabinoids, Δ9-tet-rahydrocannabinol (THC) and cannabidiol (CBD), werefound to possess antitumorigenic properties6,7. Contraryto THC, a well-known strong CB1 agonist with psycho-tropic effect, CBD has a low binding affinity for CB1/2receptors and is considered as a “non-intoxicating drug”8.Molecular targets for CBD are uncertain. Among putativecandidates, some members of the TRP channels´ family,orphan cannabinoid receptor GPR55, 5HT and PPARγreceptors have been proposed6,9.In the present study we addressed the immediate targets
for CBD in leukemic cell lines, derived from T-ALLpatients in relapse.
ResultsCBD suppresses viability and impairs migration ofleukemic T cellsCytotoxic effect of CBD was first evaluated in leukemic
cell lines of different lineages, including T-ALL, B lineage-
© The Author(s) 2019OpenAccessThis article is licensedunder aCreativeCommonsAttribution 4.0 International License,whichpermits use, sharing, adaptation, distribution and reproductionin any medium or format, as long as you give appropriate credit to the original author(s) and the source, provide a link to the Creative Commons license, and indicate if
changesweremade. The images or other third partymaterial in this article are included in the article’s Creative Commons license, unless indicated otherwise in a credit line to thematerial. Ifmaterial is not included in the article’s Creative Commons license and your intended use is not permitted by statutory regulation or exceeds the permitted use, you will need to obtainpermission directly from the copyright holder. To view a copy of this license, visit http://creativecommons.org/licenses/by/4.0/.
Correspondence: Igor Pottosin ([email protected]) orOxana Dobrovinskaya ([email protected])1Laboratory of Immunobiology and Ionic Transport Regulation, UniversityCenter for Biomedical Research, University of Colima, Av. 25 de Julio 965, Col.28030 Colima, Mexico2Department of Cognitive Neuroscience and National Laboratory ofChannelopathies (LaNCa), Institute of Cellular Physiology, NationalAutonomous University of Mexico, Mexico-City, MexicoEdited by M. Diederich
Official journal of the Cell Death Differentiation Association
1234
5678
90():,;
1234
5678
90():,;
1234567890():,;
1234
5678
90():,;

derived ALL (B-ALL), and chronic myelogenous leukemia(CML) by means of metabolic assay. T-ALL were themost CBD-sensitive among tested cell lines (Fig. 1a).However, there is an uncertainty in the interpretation ofthis result, which may be explained by mitochondrialmetabolism inhibition, decreased proliferation rate,increased level of cell death, or combination of theseeffects. Then survival and proliferation of CBD- treatedJurkat cells were evaluated in long-lasting (72 h) culturesby counting live and dead cells CBD at 30–100 μMinduced cell death, while at 10 μM the cells remained alive,but did not proliferate. Noteworthy, at low (1 μM) con-centration, CBD stimulated the cell proliferation (Fig. 1b,left). Stimulation was also obtained in experiments with asequential (1 μM every 24 h) CBD administration (Fig. 1b,right). Strikingly, dose dependence was very similar in bothcases, irrespective to supposed CBD accumulation duringsequential application. Apparently, cell fate was definedalready by the first CBD administration.In additional experiments, cervical and breast cancer
cell lines were included for a comparison, because CBDeffect on these types of cancer was reported earlier. Again,among 10 cell lines tested, cytotoxic effect of CBD was themost pronounced in T-ALL (Fig. 1c).We also tested CBD toxicity in non-tumoral cells.
Murine bone marrow-derived cell line OP9 displayed highresistance to CBD (Fig. 1d). Strikingly, in contrast toactivated human CD4+ T cells, resting CD4+ T cells wererelatively insensitive to CBD. Noteworthy, resting CD4+
T cells pretreated with CBD (30 μM, 24 h) were able torespond to activating stimuli. At 72 h of activation theirproliferative response was statistically indistinguishablefrom that of untreated CD4+ cells (Fig. 1e).The infiltration of lymph nodes and CNS by leukemic
cells and formation of a mediastinal mass are tightlyrelated to disease relapse and unfavorable prognosis in T-ALL10. Thus, the effect of CBD on the T-ALL cellsmigration was addressed. Since CXCL12/CXCR4 axisplays a significant role in the dissemination of leukemiccells11,12, CXCL12 was used as a chemoattractant.Migration of T-ALL cells was shown to be significantlysuppressed by 2 h preincubation with 30 μM CBD (Fig. 1f).CBD (30–100 μM) triggered apoptosis in a part of the
cell population (Annexin V - single positive cells). At thesame time, loss of plasma membrane integrity wasobserved in a large cell population as early as at 4 h oftreatment (Annexin V/ propidium iodide (PI) – doublepositive cells), indicating necrosis (Fig. 1g–i).Transmission electron microscopy (TEM) imaging
revealed multiple dramatic changes in cell morphologyalready after 2 h of CBD (30 μM) exposure (Fig. 2). Two ofthe most characteristic features were extensive cyto-plasmic vacuolation and numerous swollen mitochondria,devoid of cristae. Golgi complex and endoplasmic
reticulum (ER) were disassembled, which seems to berelated to cytoplasmic vacuolation. Plasma membraneblebbing and apoptotic bodies (ApoBDs) formation weredetected. The observed morphological changes pointedout to a complex mechanism, with both apoptotic andnecrotic symptoms. In addition, double membranevacuoles, containing degrading material (autophago-somes), were much more numerous in CBD-treated cellsas compared to control.
Sublethal CBD concentrations activate autophagy inleukemic cellsAutophagy is a catabolic cellular process, representing
an important strategy to ensure cell homeostasis by theelimination of defunct organelles in both physiologicaland pathological conditions13. Basal levels of autophagyserve a housekeeping function, whereas stress stimulatesautophagy. CBD was shown to cause cell death by indu-cing a crosstalk between apoptosis and autophagy inbreast cancer14. To reveal the ability of CBD to induceautophagy in T-ALL, LC3-I to LC3-II conversion andLC3-II turnover were monitored by immunoblotting. Inthe course of autophagy, microtubule-associated proteinLC3-I first conjugates with phosphatidylethanolamine,forming LC3-II, followed by the LC3-II translocation toautophagosomes. An increased LC3-II level is consideredas an indicator of the autophagy, but LC3-II is degradedby lysosomal proteases after autophagosome-lysosomefusion. Chloroquine (CQ) is known to preventautophagosome-lysosome fusion and to inhibit the LC3-IIdegradation, thus LC3-II is accumulated in the presenceof CQ15,16. Western blot analysis of LC3 variantsdemonstrated that sublethal CBD concentration (10 µM)effectively induced autophagy in Jurkat cells (Fig. 3a, b),since LC3-II level was higher in cells treated with bothCBD (10 µM) and CQ (20 µM) when compared to either20 µM CQ (basal autophagy) or 10 µM CBD treatmentalone. Note that accumulation of LC3-II was diminishedby its degradation during the autophagic flux in thesamples without CQ.Proceeding of the autophagic flux at the single-cell level
was monitored using mCherry-GFP-LC3 expressing Jur-kat cells. The mCherry-GFP-LC3 experimental strategy isbased on the fact that GFP is quenched at acidic pH,found in the autophagolysosome, while mCherry is not.Accordingly, enhancement of the mCherry/GFP ratiosensitive to CQ indicates the autophagolysosome forma-tion17. Figure 3c shows representative images from theexperiment, in which Jurkat GFP-mCherry-LC3 cells wereincubated with CBD (10 and 30 µM) and CQ, alone or incombination. High mCherry/GFP ratio, efficiently equal-ized by CQ, was observed in samples, treated with 10 µMCBD (Fig. 3d, e), evidencing a throughput of the autop-hagic pathway. In samples treated with 30 µM CBD this
Olivas-Aguirre et al. Cell Death and Disease (2019) 10:779 Page 2 of 19
Official journal of the Cell Death Differentiation Association

Fig. 1 (See legend on next page.)
Olivas-Aguirre et al. Cell Death and Disease (2019) 10:779 Page 3 of 19
Official journal of the Cell Death Differentiation Association

ratio was low (Fig. 3d, e). However, the number ofautophagosomes was increased at early times after CBDadministration (30 µM), as it was revealed by an enhancedlevel of both GFP+ and mCherry+ puncta (Fig. 3f, g).These data may be explained by a truncation of basal, and,possibly, also CBD-induced autophagy at late phases indamaged cells.
CBD causes mitochondrial damage and inducescytochrome C releaseDissipation of the mitochondrial transmembrane
potential (ΔΨm) is a hallmark of the mitochondrial per-meability transition (MPT) - driven necrosis as well as ofintrinsic apoptosis. It involves an irreversible mitochon-drial outer membrane permeabilization and a release ofvarious pro-apoptotic factors, including cytochrome C(Cyt-C), to the cytosol. In the cytosol, Cyt-C contributesto the apoptosome formation, with a consequent activa-tion of the initiator caspase 9, which cleaves and activatesexecutioner caspases18.We monitored ΔΨm in Jurkat cells double-stained with
green fluorescent dye MtGreen, which covalently binds tomitochondrial matrix proteins, and tetramethylrhodamineethyl ester (TMRE), a cationic fluorescent dye that isreadily sequestered by energized mitochondria (Fig. 4a).When exposed to CBD (30 μM), the intensity of TMREfluorescence, in contrast to that of MtGreen, was graduallydecreased within the first 10min of treatment, indicating arapid ΔΨm loss (Fig. 4a, Supplementary Movie 1). The loss
of TMRE fluorescence was dose-dependent (Fig. 4b). Tomonitor Cyt-C release from mitochondria in a response toCBD treatment, Jurkat cells were transfected with EYFP-Cyt-C. In untreated cells, Cyt-C localization was restrictedto mitochondria, as confirmed by punctate distribution ofEYFP-Cyt-C staining and its colocalization with TMRE(Fig. 4c, d). After treatment with CBD (30 μM), EYFP-Cyt-C distribution in the cytoplasm of treated cells becamemore diffuse (Fig. 4e), indicating Cyt-C release frommitochondria, observed as early as within the first 20minof treatment (Fig. 4f). Concomitantly, cell volume wassignificantly reduced, as it was previously reported forCBD-treated Jurkat cells by others19. Jurkat cells, exposedto CBD, exhibited an enhanced activity of caspases 9 and3, confirming the triggering of intrinsic apoptotic pathway(Fig. 4g).Collapse of the ΔΨm is frequently associated with the
induction of the mitochondrial permeability transitionpore (mPTP), a wide channel formed through inner andouter mitochondrial membranes. The formation of mPTPis potently blocked by cyclosporine A (CsA)20. Two dis-tinct mechanisms, leading to the Cyt-C release frommitochondria were suggested: one is related to the mPTPand inhibited by CsA and another is Bax-dependent butCsA-insensitive21,22. In our experiments both CBD-induced phenomena, Cyt-C release from mitochondriaand cell shrinkage were inhibited by CsA (Fig. 4h). mPTPopening is associated with the oxidative stress20. CBD-induced reactive oxygen species (ROS) overproduction
(see figure on previous page)Fig. 1 CBD effect on viability in different cancer cell lines. a Cell viability, evaluated by resazurin-based metabolic assay, as a function of CBDconcentration in human leukemic cell lines of different lineages at 24 h of treatment. Cell lines derived from T-ALL (Jurkat, MOLT-3, and CEM), B-ALL(RS4;11 and Reh) and CML (K562) were tested. Data (resorufin fluorescence intensity, arbitrary units) were normalized to the vehicle-treated controland shown as mean ± SD (n= 8; *p < 0.05; **p < 0.01; ***p < 0.001; ****p < 0.0001; ns, not significant; one-way ANOVA). b Live cell count (trypan blueexclusion test) in long-lasting Jurkat cells cultures exposed to different CBD concentrations (0–100 μM). Left: cell count at 72 h after single CBDadministration; right: fresh CBD was added, 50% of medium volume was changed and cells were counted every 24 h. Data are normalized to theinitial point (0 h) and shown as mean ± SD (n= 3; **p < 0.01; ***p < 0.001; ****p < 0.0001, one-way ANOVA test). c Cell viability was evaluated byresazurin-based metabolic assay at 24 h of treatment with CBD (30 μM) in human tumor cell lines of different histogenesis, including CML (K562), B-ALL (Reh and RS4;11), T-ALL (CEM, MOLT-3, and Jurkat), cervical cancer (SiHa and HeLa), and breast cancer (MCF7-7 and MDA-MB-231). Data (resorufinfluorescence intensity) were normalized to vehicle-treated control and reported as mean ± SD (n= 8 of four independent experiments; (*p < 0.05;**p < 0.01; ***p < 0.001; ****p < 0.0001, Student’s t-test). d Cell viability was evaluated by resazurin-based metabolic assay at 24 h of treatment withCBD (30 μM) in non-cancerous cells. Human CD4+ cells were activated with anti-CD3/CD28 antibodies as described in Materials and Methods section.Data (resorufin fluorescence intensity) are normalized to the vehicle-treated control and reported as mean ± SD (n= 8 in at least three independentexperiments; *p < 0.05; **p < 0.01; ***p < 0.001; ****p < 0.0001; Student’s t-test). e After preincubation with CBD (30 μM, 24 h), non-cancerous CD4+
cells were activated by anti-CD3/antiCD28 antibodies. Cell viability was evaluated by resazurin-based metabolic assay every 24 h. Data (resorufinfluorescence intensity) were normalized to 0 h time point and shown as mean ± SD (n= 8 in at least three independent experiments). Statisticalcomparison between control and pretreated samples was undertaken at each time point (*p < 0.05; **p < 0.01; ***p < 0.001; ****p < 0.0001, Student’st-test). f Migration capacity of Jurkat cells pretreated with CBD (10 or 30 μM, 2 h) was evaluated by chemotactic migration assay, using a Transwellsystem. Cells were allowed to migrate for 4 h, CXCL12 was used as a chemoattractant. The percentage of migrated cells was determined by cellscount in the lower chamber. Data are mean ± SD (n= 4). Statistical comparison was made with respect to positive control (CXCL12) (*p < 0.05; **p <0.01; ***p < 0.001; ****p < 0.0001, one-way ANOVA test). g–i Cell death was evaluation by flow cytometry (g, h) and fluorescent microscopy (I) inJurkat cells treated with different concentrations of CBD using Annexin V-AF488/PI double staining. Representative dot plots (2, 4, and 6 h) andimages (12 h) are shown in g and i, correspondingly. Scale bar: 20 μm. In every dot plot lower left quadrant represents Annexin V−PI− (DN) live cells,in the lower right quadrant are Annexin V+PI− (early apoptotic) cells, Annexin V−PI+ (primary necrotic) cells are in the upper left quadrant, whereasthe double-stained population Annexin V+PI+ (DP) in the upper right quadrant represents dead cells, which may include necrotic and late apoptoticones. Statistical analysis of flow cytometry data is given in h (n= 3; *p < 0.05; **p < 0.01; ***p < 0.001; ****p < 0.0001, one-way ANOVA test)
Olivas-Aguirre et al. Cell Death and Disease (2019) 10:779 Page 4 of 19
Official journal of the Cell Death Differentiation Association

was previously reported in different cell models14,23. Asshown in the Fig. 4i, CBD within few minutes provoked adose-dependent increase in ROS generation.
CBD-induced mitochondrial Ca2+ overload is responsiblefor the formation of mPTPCBD-mediated elevation of the cytosolic free
Ca2+ ([Ca2+]i) has been observed in several cancer andnon-cancerous cells24,25. Calcium signal signature definesthe cell fate, survival, or death scenarios26. Elevatedintramitochondrial Ca2+ ([Ca2+]m) is a prerequisite forthe mPTP formation20. It is generally assumed that [Ca2+]mincrease is triggered by an increase of [Ca2+]i. In many
cases, Ca2+ source can be ER, whose membranes come to avery close proximity with the outer mitochondrial mem-brane (OMM)27.CBD promoted a dose-dependent elevation of [Ca2+]i
from the resting level of 100 nM up to 300 nM, both in T-ALL cells (Fig. 5a–d) and in healthy lymphocytes(Fig. 5e, f). Pharmacological analysis revealed that neitherCB1/2 nor GPR55 receptors were involved in the CBD-induced [Ca2+]i rise. Importantly, CBD-induced [Ca2+]irise was neither dependent on Ca2+ permeable channelsin plasma membrane nor on extracellular Ca2+ (Fig. 5g–j).Thus, the source of CBD-induced [Ca2+]i rise wereintracellular Ca2+ stores. Blockage of plasma membrane
Fig. 2 CBD induces ultrastructural alterations in Jurkat cells. a, b Representative TEM images of untreated Jurkat cells (a) and Jurkat cells, fixedafter 2 h of incubation with CBD (30 μM, b). Scale bars are indicated. c, d High-resolution TEM images of control (c) and CBD-treated cells (d). Scalebar: 2 μm. Cell components are indicated as following: nucleus (N), Golgi apparatus (GA), mitochondria (M), endoplasmic reticulum (ER), andautophagic vacuoles (AV). Note autophagic bodies (ABd) in b, panel a; inclusion of condensed chromatin in one of ABds is indicated by arrow. Anelectron dense lysosome in the neighborhood of an autophagic vacuole is indicated by arrow in c
Olivas-Aguirre et al. Cell Death and Disease (2019) 10:779 Page 5 of 19
Official journal of the Cell Death Differentiation Association
Ca2+ permeable channels by Gd3+ and ruthenium red(RR) did not protect leukemic cells against CBD (Fig. 5i, j).To monitor [Ca2+]m, Jurkat cells were transfected with a
Ca2+-sensitive, mitochondrial targeted indicator CEPIA3mt(Kd= 11 μM)28. Specific mitochondrial targeting of
CEPIA3mt was confirmed by its colocalization with TMRE(Fig. 6a). Concurrent measurement of [Ca2+]i were con-ducted with cells loaded with a conventional cytosolicratiometric dye Fura-2. CBD-induced [Ca2+]i increase waspreceded by [Ca2+]m transient (Fig. 6b). Peak value for
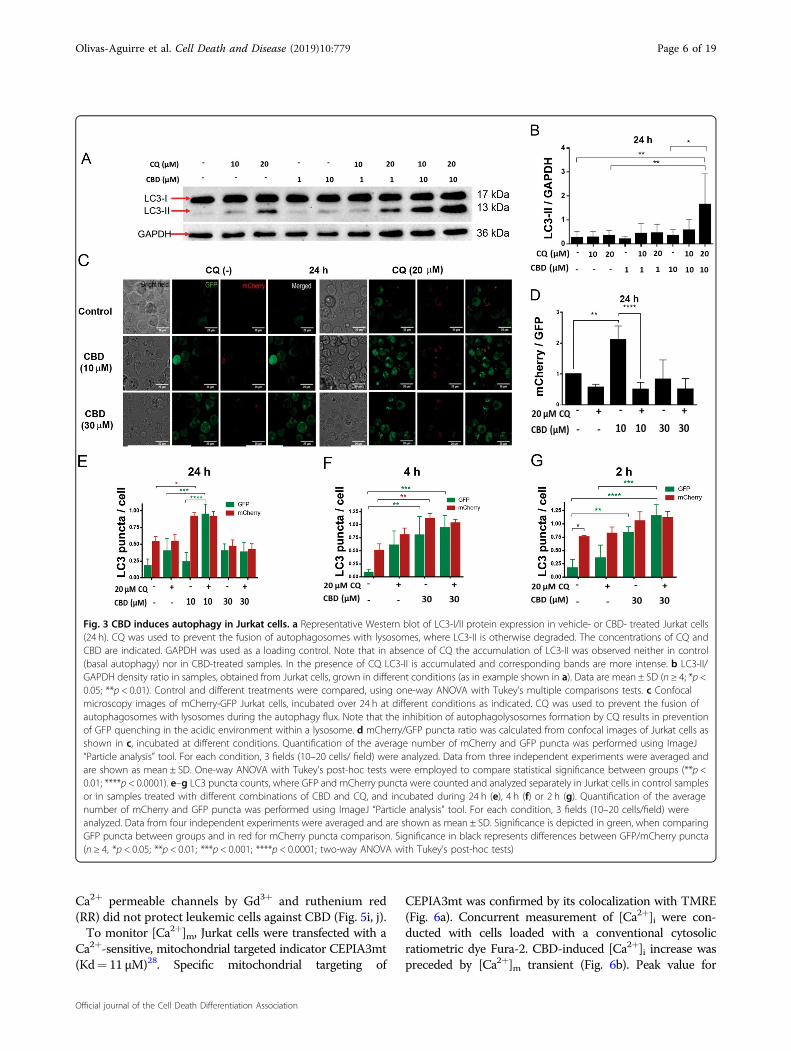
Fig. 3 CBD induces autophagy in Jurkat cells. a Representative Western blot of LC3-I/II protein expression in vehicle- or CBD- treated Jurkat cells(24 h). CQ was used to prevent the fusion of autophagosomes with lysosomes, where LC3-II is otherwise degraded. The concentrations of CQ andCBD are indicated. GAPDH was used as a loading control. Note that in absence of CQ the accumulation of LC3-II was observed neither in control(basal autophagy) nor in CBD-treated samples. In the presence of CQ LC3-II is accumulated and corresponding bands are more intense. b LC3-II/GAPDH density ratio in samples, obtained from Jurkat cells, grown in different conditions (as in example shown in a). Data are mean ± SD (n ≥ 4; *p <0.05; **p < 0.01). Control and different treatments were compared, using one-way ANOVA with Tukey’s multiple comparisons tests. c Confocalmicroscopy images of mCherry-GFP Jurkat cells, incubated over 24 h at different conditions as indicated. CQ was used to prevent the fusion ofautophagosomes with lysosomes during the autophagy flux. Note that the inhibition of autophagolysosomes formation by CQ results in preventionof GFP quenching in the acidic environment within a lysosome. d mCherry/GFP puncta ratio was calculated from confocal images of Jurkat cells asshown in c, incubated at different conditions. Quantification of the average number of mCherry and GFP puncta was performed using ImageJ“Particle analysis” tool. For each condition, 3 fields (10–20 cells/ field) were analyzed. Data from three independent experiments were averaged andare shown as mean ± SD. One-way ANOVA with Tukey’s post-hoc tests were employed to compare statistical significance between groups (**p <0.01; ****p < 0.0001). e–g LC3 puncta counts, where GFP and mCherry puncta were counted and analyzed separately in Jurkat cells in control samplesor in samples treated with different combinations of CBD and CQ, and incubated during 24 h (e), 4 h (f) or 2 h (g). Quantification of the averagenumber of mCherry and GFP puncta was performed using ImageJ “Particle analysis” tool. For each condition, 3 fields (10–20 cells/field) wereanalyzed. Data from four independent experiments were averaged and are shown as mean ± SD. Significance is depicted in green, when comparingGFP puncta between groups and in red for mCherry puncta comparison. Significance in black represents differences between GFP/mCherry puncta(n ≥ 4, *p < 0.05; **p < 0.01; ***p < 0.001; ****p < 0.0001; two-way ANOVA with Tukey’s post-hoc tests)
Olivas-Aguirre et al. Cell Death and Disease (2019) 10:779 Page 6 of 19
Official journal of the Cell Death Differentiation Association

Fig. 4 CBD impairs mitochondrial function, induces Cyt-C liberation and ROS production. a Monitoring of Δψm loss in CBD-treated leukemic cells.Jurkat cells were double-stained with MtGreen and TMRE, mitochondria (ROI) were selected (upper panel) and intensity of fluorescence was monitored byconfocal microscopy after CBD (30 μM) administration (lower panel, n= 36; see also Supplementary movie 1). b Intensity of TMRE fluorescence as an indicatorof Δψm in Jurkat cells, treated with different concentrations of CBD (0–100 μM) during 10min. FCCP (10 μM) was used as a positive control. Data are mean ±SD (n= 8 in three independent experiments). Statistical comparison with control was performed by means of one-way ANOVA test (*p< 0.05; ****p< 0.0001).c EYFP-Cyt-C is localized in mitochondria of Jurkat cells after 12 h of transfection. EYFP-Cyt-C and TMRE fluorescence are colocalized (200 nM TMRE, 200 ngEYFP-Cyt-C, pseudocolor). Images were acquired by confocal microscopy at 12 h after transfection, scale bar: 10 μm. d Representative images of five Jurkatcells, transfected with EYFP-Cyt-C (as in c). Dense green fluorescent puncta (pseudocolor) reflect Cyt-C localization in intact mitochondria. Scale bar: 10 μm. eRepresentative images of five Jurkat cells, transfected with EYFP-Cyt-C (as in c) and treated with CBD (30 μM, 1 h). Cyt-C was released from mitochondria asevidenced by a diffuse EYFP-CytC distribution. Scale bar: 10 μm. f EYFP-Cyt-C distribution in Jurkat cells, expressing EYFP-Cyt-C, at 0, 5, and 20min with CBD(30 μM). Scale bar: 10 μm. g Caspase-9 and caspase-3 activity in vehicle- and CBD- treated (30 μM, 12 h) Jurkat cells. Staurosporine (STS, 5 μM) was used as apositive control. After incubation, cells were lysed, and caspase activity was determined by colorimetric assay (BioVision). Fold increase in activity compared tocontrol was plotted as mean ± SE (four independent experiments). One-way ANOVA test was performed to compare CBD-treated to control group (*p< 0.05;**p< 0.01). h Pretreatment with mPTP inhibitor CsA (10 μM) prevents Cyt-C release, induced by CBD (30 μM; 1 h). Compare these images with Fig. 4d, e(vehicle- and CBD-treated cells) and note the protective effect of CsA. Scale bar: 10 μm. i ROS production as evaluated by fluorescent microscopy in DCF-loaded (2 μM) Jurkat cells. CBD effect on ROS production was monitored after 1 h of incubation. PMA (1 μM) was used as a positive control
Olivas-Aguirre et al. Cell Death and Disease (2019) 10:779 Page 7 of 19
Official journal of the Cell Death Differentiation Association
[Ca2+]m signal was ~5 μM, basing on the titration curve forCEPIA3mt28. Notably, CBD-induced [Ca2+]m transientoccurred at time when [Ca2+]i remained at the resting level.Thus, causal relation between CBD-induced [Ca2+]m and[Ca2+]i increases was further addressed. Jurkat cells highlyexpress functional H1 histamine receptors and histaminetreatment was proved to induce the inositol 1,4,5-trispho-sphate receptor (IP3R)-dependent Ca
2+ release from the ERfor this cell model29. Artificial depletion of the ER Ca2+ byhistamine or thapsigargin and block of the ER Ca2+ releasevia IP3R channels by 2-aminoethoxydiphenyl borate (2-APB) abolished the CBD-induced [Ca2+]i increase. Thus,ER was the source of the CBD-induced [Ca2+]i rise (Fig.
6c, d, f). CBD-induced [Ca2+]m rise was potentiated by ERCa2+ release (and concomitant cytosolic Ca2+ rise) andreduced upon the conditions, when ER Ca2+ release wasblocked (Fig. 6c–e). Thus, ER Ca2+ release partly fuels theCBD-induced [Ca2+]m rise. However, note that [Ca2+]mrise was switched first upon CBD administration, not byCa2+ release from the ER per se. Mitochondria act as asink for Ca2+, artificially released from the ER prior toCBD application as evidenced by an abrupt decrease of[Ca2+]i in a response to CBD (Fig. 6c, f).Ca2+ uptake from the cytosol to mitochondria is
mediated by voltage-dependent anion channel (VDAC) inthe OMM and the mitochondrial Ca2+ uniporter (MCU)
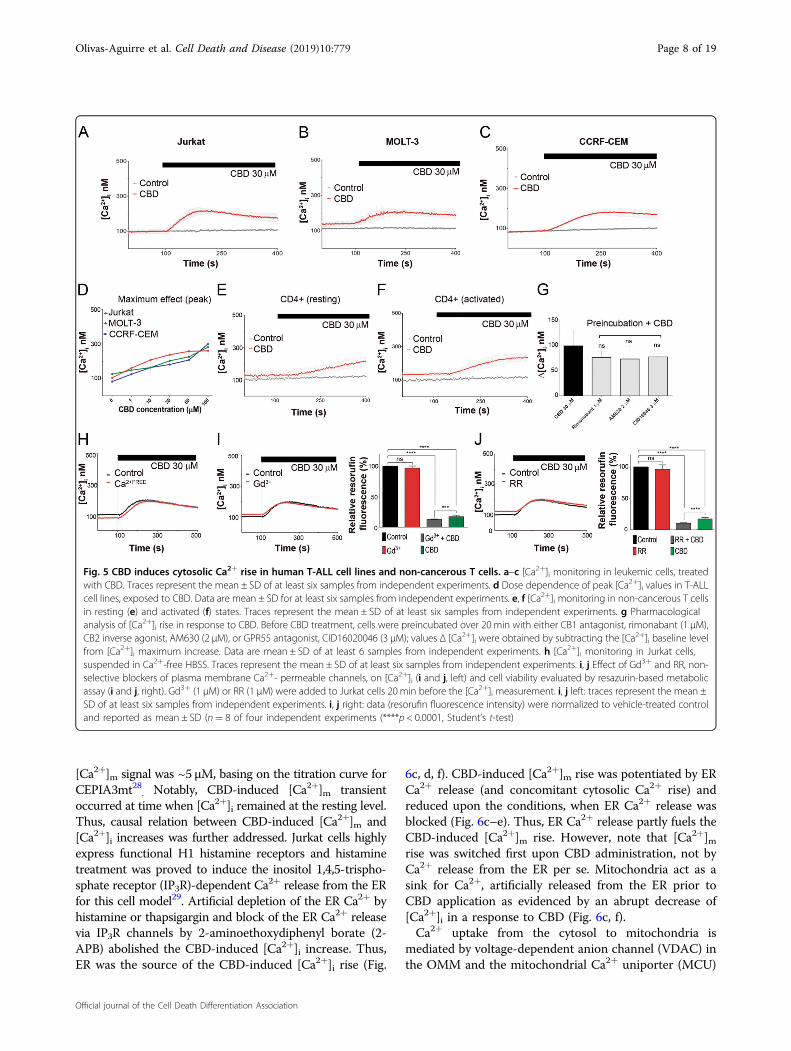
Fig. 5 CBD induces cytosolic Ca2+ rise in human T-ALL cell lines and non-cancerous T cells. a–c [Ca2+]i monitoring in leukemic cells, treatedwith CBD. Traces represent the mean ± SD of at least six samples from independent experiments. d Dose dependence of peak [Ca2+]i values in T-ALLcell lines, exposed to CBD. Data are mean ± SD for at least six samples from independent experiments. e, f [Ca2+]i monitoring in non-cancerous T cellsin resting (e) and activated (f) states. Traces represent the mean ± SD of at least six samples from independent experiments. g Pharmacologicalanalysis of [Ca2+]i rise in response to CBD. Before CBD treatment, cells were preincubated over 20 min with either CB1 antagonist, rimonabant (1 μM),CB2 inverse agonist, AM630 (2 μM), or GPR55 antagonist, CID16020046 (3 μM); values Δ [Ca2+]i were obtained by subtracting the [Ca2+]i baseline levelfrom [Ca2+]i maximum increase. Data are mean ± SD of at least 6 samples from independent experiments. h [Ca2+]i monitoring in Jurkat cells,suspended in Ca2+-free HBSS. Traces represent the mean ± SD of at least six samples from independent experiments. i, j Effect of Gd3+ and RR, non-selective blockers of plasma membrane Ca2+- permeable channels, on [Ca2+]i (i and j, left) and cell viability evaluated by resazurin-based metabolicassay (i and j, right). Gd3+ (1 μM) or RR (1 μM) were added to Jurkat cells 20 min before the [Ca2+]i measurement. i, j left: traces represent the mean ±SD of at least six samples from independent experiments. i, j right: data (resorufin fluorescence intensity) were normalized to vehicle-treated controland reported as mean ± SD (n= 8 of four independent experiments (****p < 0.0001, Student’s t-test)
Olivas-Aguirre et al. Cell Death and Disease (2019) 10:779 Page 8 of 19
Official journal of the Cell Death Differentiation Association
in the inner mitochondrial membrane (IMM). In ourexperiments, CBD-induced [Ca2+]m rise was completelysuppressed by a permeable MCU blocker Ru360 (Fig. 6g),but not significantly affected by CGP-37157, the inhibitorof the inner membrane Na+/Ca2+ exchanger, NCX (Fig.6h). Specific inhibitor of mPTP, CsA, stabilized[Ca2+]m at a high level (Fig. 6h). Of special note, theinhibition of mitochondrial Ca2+ overload and of mPTPby Ru360 and CsA, respectively, precluded the cytosolicCa2+ rise (Fig. 6i–j). Thus, the ER Ca2+ release is causallydependent on the mitochondrial response. Collectively,our [Ca2+]m data imply that CBD-induced Ca2+ uptakeinto the mitochondrial matrix via MCU caused a rapid[Ca2+]m overload, which induced the mPTP opening anda subsequent [Ca2+]m release. Thus, mitochondria appear
to be a primary target for CBD and mPTP opening isrequired for the induction of Ca2+ release from the ER.MCU inhibitor Ru360 prevented CBD-induced ROS for-mation, Cyt-C release and cell death as revealed byAnnexin V/PI assay (Fig. 6k–m). The last result is veryessential, because it links mitochondrial Ca2+ overload tocell death. Remarkably, CsA, albeit per se possessingimmunosuppressing activity, partially improved cell via-bility of CBD-treated cells, while CB2 inverse agonistAM630 and 2-APB were inefficient (Fig. 6n).
CBD interacts directly with mitochondria to promote theorganelle dysfunctionTo verify the conclusion that mitochondria are direct
targets for CBD action, mitochondria were freshly isolated
Fig. 6 (See legend on next page.)
Olivas-Aguirre et al. Cell Death and Disease (2019) 10:779 Page 9 of 19
Official journal of the Cell Death Differentiation Association

from Jurkat cells. Mitochondria were stained withMtGreen and fluorescent Ca2+ indicator Rhod-2, andevaluated by flow cytometry. High percentage of double-stained particles evidenced high purity of mitochondriapopulation (Fig. 7a). Upon exposure to 30 μM CBD iso-lated mitochondria exhibited [Ca2+]m increase at externalfree Ca2+ of 100 nM, equal to the resting cytosolic Ca2+
level (Fig. 7b). The response of high affinity Ca2+ indicatorRhod-2 (Kd ~ 0.6 μM) was saturated, implying that free[Ca2+]m level was above 1 μM for a long time. Incubationof isolated mitochondria with CBD over 10min produceda strong dose-dependent decrease of ΔΨm (Fig. 7c),similar to that in whole cells (Fig. 4b).
CBD binding to VDAC: in silico evidencesIn some cell models CBD can induce cell death via
direct interaction with VDAC, promoting its closure to aconformational substate30. This substate possesses areduced capacity to transport metabolites and increasedCa2+ permeability31. We performed in silico analysis ofVDAC- CBD interactions. VDAC surface and N-terminuswere tested for CBD binding. Among the main VDACcavities, β9–12 and N-terminus regions exhibited themost suitable sites for the CBD binding, basing onrespective free energy changes (docking score, see Sup-plementary Table 1). 3D analysis of the CBD-VDAC
interaction revealed that more likely CBD interacts with 3residues, Thr9, Asp12, and Leu13 at the N-terminus andneighboring pore residues Val146, Gln157, Gly175,Gln182, and His184 (Fig. 7d). Further analysis revealedthat CBD binding is stabilized mainly by steric interac-tions and hydrogen bonds (Fig. 7e). Of putative CBD-interacting residues, Thr9, Asp 12, and Hist184 have ahighest contribution to the overall binding energy (Sup-plementary Fig. 1, Supplementary Table 1).
DiscussionA crucial role of mitochondria in cell metabolism and
bioenergetics, as well as in signaling pathways, regulationof transcriptional activity, proliferation, migration, andcell death is tightly related to their involvement into theintracellular Ca2+ dynamics32. In the present study, bymeans of concurrent monitoring of [Ca2+]m and [Ca2+]iin a response to the CBD treatment, we have provided theexperimental evidences that mitochondria are primaryCBD target in T-ALL. In the first place, acute transient[Ca2+]m rise, preceding the [Ca2+]i increase, was observedin a response to CBD (Fig. 6b). Furthermore, [Ca2+]mincrease together with a dissipation of ΔΨm was observedalso in isolated mitochondria, treated with CBD (Fig. 7b, c).Ca2+ accumulation in mitochondrial matrix requires thecrossing of both OMM and IMM. VDAC channel,
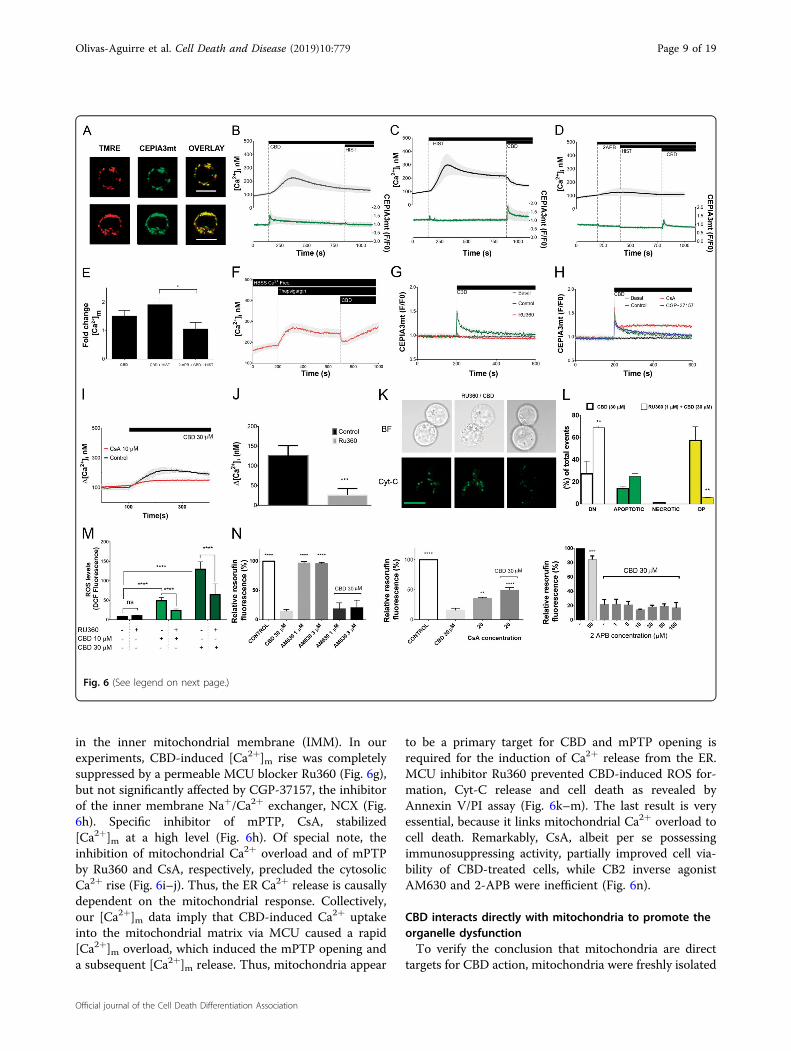
(see figure on previous page)Fig. 6 CBD directly induces mitochondrial Ca2+ overload and mPTP opening. a CEPIA3mt fluorescence is colocalized with mitochondrial markerTMRE in Jurkat cells. Scale bar: 10 μm. b–d Concurrent monitoring of [Ca2+]i and [Ca2+]m in Jurkat cells. [Ca2+]i and [Ca2+]m changes were evaluatedwith Fura-2 (2 μM) and CEPIA3mt, respectively. Note that cells were loaded either with Fura-2 or with CEPIA3mt; individual time courses for Fura-2and CEPIA3mt, were synchronized with respect to the timepoint of CBD addition and averaged [Ca2+]i and [Ca2+]m responses were plotted at theupper and lower panels, respectively. CBD (30 μM), histamine (10 μM) and membrane-permeable IP3R blocker 2 APB (50 μM μM) were added asindicated. Traces are mean ± SD of at least six samples from independent experiments. e Peak values for [Ca2+]m changes, induced by CBD, from theexperiments shown in b–d, with a variable level of [Ca2+]i due to manipulations with Ca2+ release from the ER. Bars represent mean ± SD of at leastsix samples from independent experiments. One-way ANOVA test (*p < 0.05). f [Ca2+]i monitoring in Jurkat cells, loaded with Fura-2 (2 μM). ER Ca2+
was depleted by thapsigargin (1 μM). Experiments were performed in Ca2+-free medium (HBSS). Addition of CBD causes an abrupt decrease of [Ca2+]i(cf with c). Traces are mean ± SD of at least three samples from independent experiments. g, h [Ca2+]m monitoring in Jurkat cells, transfected withCEPIA3mt. CBD (30 μM) was added as indicated. When indicated, cells were preincubated over 20 min with either MCU blocker RU360 (1 μM), mPTPinhibitor CsA (10 μM), or inhibitor of mitochondrial Na+/Ca2+ exchanger NCLX CGP37157 (1 μM). Traces are mean ± SD of at least six samples fromindependent experiments. i [Ca2+]i monitoring in Jurkat cells, loaded with Fura-2 (2 μM). CBD (30 μM) was added as indicated. Cells werepreincubated during 20 min with vehicle or CsA (10 μM), specific inhibitor of the mPTP. Values Δ [Ca2+]i were obtained by subtracting the [Ca2+]ibaseline level from the peak [Ca2+]i. Traces are ±SD of at least six samples from independent experiments. j Cytosolic Ca2+ response to CBD (30 μM)in Jurkat cells was abolished by a preincubation with the MCU blocker Ru360 (1 μM) over 20 min. Values Δ [Ca2+]i were obtained by subtracting the[Ca2+]i baseline level from peak [Ca2+]i. Data are mean ± SD of a minimum of six independent experiments (**p < 0.01; ***p < 0.001; Student’s t-test).k Representative images of Jurkat cells, transfected with EYFP-Cyt-C, pretreated with RU360 (1 μM, 20 min), and subsequently treated with CBD(30 μM, 1 h). Discrete green fluorescent puncta (pseudocolor) represent Cyt-C localization in intact mitochondria whereas Cyt-C release frommitochondria is evidenced by a more diffuse EYFP-Cyt-C distribution. Compare these images with Fig. 4d, e (vehicle- and CBD-treated cells) and notethe protective effect of RU360. Scale bar: 10 μm. l MCU blocker RU360 effectively prevents CBD-induced cell death in Jurkat cells. Cell death wasevaluated by flow cytometry, using Annexin V-AF488/PI double staining. Cells were preincubated with vehicle or RU360 (1 μM, 2 min), and thentreated with CBD (30 μM, 6 h). Data of three independent experiments are present (**p < 0.01, one-way ANOVA test).m ROS levels were evaluated byDCF fluorescence intensity. Cells were either only treated with CBD (10 or 30 μM, 1 h, light and dark green bars, respectively) or additionallypretreated with RU360 (1 μM, 20 min). In all, 50 cells from at least three independent experiments were analyzed for each condition. Data are mean of±SD. Statistic comparisons between control and CBD-treated samples, or between RU360-pretreated and non-pretreated samples were performed.****p < 0.0001, one-way ANOVA. n Effects of the CB2 inverse agonist, AM630 (n= 8), mPTP inhibitor CsA (n= 6) and membrane-permeable IP3Rblocker 2APB (n= 6) on the viability of Jurkat cells, treated with CBD. Cell viability was evaluated by resazurin-based metabolic assay (24 h). Data aremean ± SD. Statistical comparison was made in relation to CBD-treated samples; *p < 0.05; **p < 0.01; ***p < 0.001; ****p < 0.0001, one-way ANOVA
Olivas-Aguirre et al. Cell Death and Disease (2019) 10:779 Page 10 of 19
Official journal of the Cell Death Differentiation Association
ubiquitously expressed in OMM, is normally responsiblefor the OMM permeability to Ca2+33. Under physiologicalconditions, VDAC permeability to Ca2+ at levels, requiredfor an optimal function of TCA enzymes, is regulated byVDAC interaction with IP3R in ER and chaperone 75 kDaglucose-regulated protein GRP7534. Our in silico analysiswhich demonstrated that CBD may interact directly withVDAC (Fig. 7) is in agreement with findings by others thatCBD colocalizes with VDAC-rich mitochondrial
membranes fraction from BV-2 microglia cell line andthat purified VDAC, incorporated into lipid bilayers, isswitched from fully open to major subconductance stateby CBD30. Such “closed” channel state is known to behighly permeable for Ca2+, due to the exposure of anionicgroups within the channel pore31.Based on the available data, the following working model
can be proposed (Fig. 8). Due to its direct interaction withCBD, VDAC1 is “fixed” in the Ca2+-permeable state. This
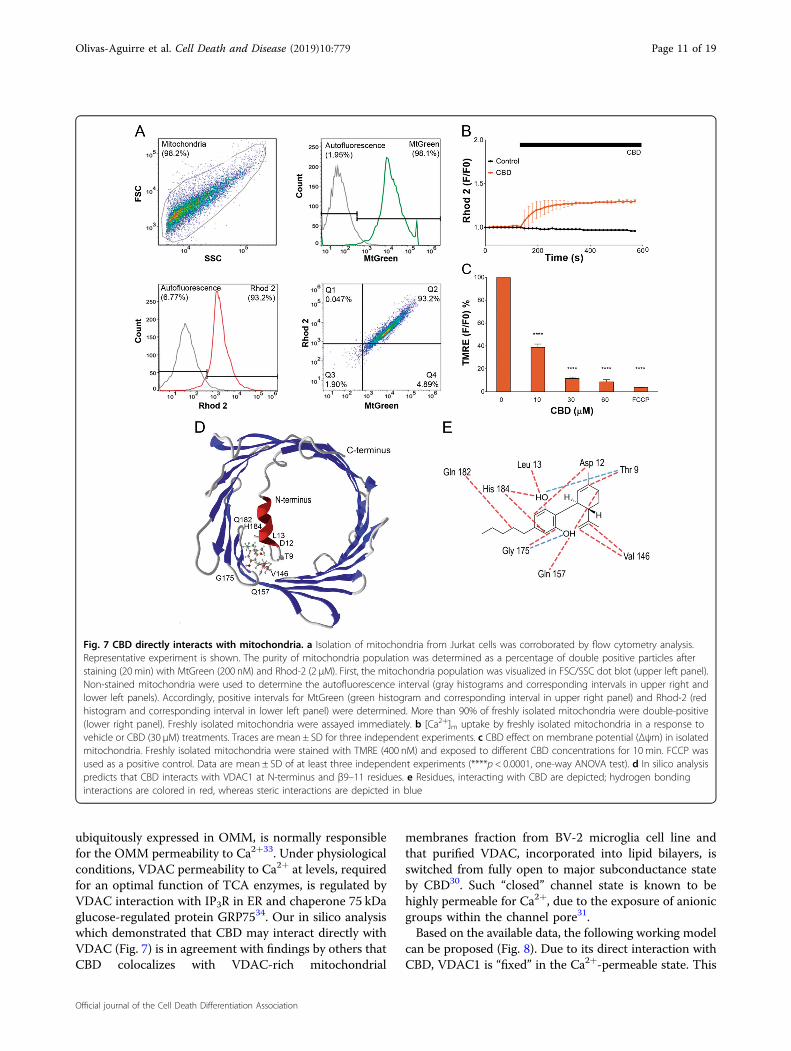
Fig. 7 CBD directly interacts with mitochondria. a Isolation of mitochondria from Jurkat cells was corroborated by flow cytometry analysis.Representative experiment is shown. The purity of mitochondria population was determined as a percentage of double positive particles afterstaining (20 min) with MtGreen (200 nM) and Rhod-2 (2 μM). First, the mitochondria population was visualized in FSC/SSC dot blot (upper left panel).Non-stained mitochondria were used to determine the autofluorescence interval (gray histograms and corresponding intervals in upper right andlower left panels). Accordingly, positive intervals for MtGreen (green histogram and corresponding interval in upper right panel) and Rhod-2 (redhistogram and corresponding interval in lower left panel) were determined. More than 90% of freshly isolated mitochondria were double-positive(lower right panel). Freshly isolated mitochondria were assayed immediately. b [Ca2+]m uptake by freshly isolated mitochondria in a response tovehicle or CBD (30 μM) treatments. Traces are mean ± SD for three independent experiments. c CBD effect on membrane potential (Δψm) in isolatedmitochondria. Freshly isolated mitochondria were stained with TMRE (400 nM) and exposed to different CBD concentrations for 10 min. FCCP wasused as a positive control. Data are mean ± SD of at least three independent experiments (****p < 0.0001, one-way ANOVA test). d In silico analysispredicts that CBD interacts with VDAC1 at N-terminus and β9–11 residues. e Residues, interacting with CBD are depicted; hydrogen bondinginteractions are colored in red, whereas steric interactions are depicted in blue
Olivas-Aguirre et al. Cell Death and Disease (2019) 10:779 Page 11 of 19
Official journal of the Cell Death Differentiation Association

causes Ca2+ entry into the intermembrane space. Ca2+
needs to concentrate to micromolar level there, to unlockand activate the MCU35. This is commonly believed to beinduced by a substantial increase of extramitochondrialCa2+. Our data suggest that mitochondrial Ca2+ overloadoccurred already at resting 0.1 μM cytosolic Ca2+ (Figs. 6b,d and 7b). The driving force for Ca2+ accumulation withinthe intermembrane space could be a negative Donnanpotential of −20 to −40mV across the OMM36. Thisallows the concentration of Ca2+ in the intermembranespace up to 20-fold as compared to the cytosolic Ca2+
concentration, providing that the outer membrane ispermeable for Ca2+. The magnitude of the Donnanpotential across the OMM depends on the accumulationof impermeable large anions within the intermembranespace. Such accumulation, e.g. of ATP, may be provokedby the same conformational shift within VDAC1, whichnot only increases its Ca2+ permeability, but also makes itadenine nucleotide-impermeable36. Activation of MCUalong with a large negative potential across the IMM
drives Ca2+ entry into the mitochondrial matrix, leading toa rapid [Ca2+]m overload (Fig. 6). The latter triggers astable mPTP formation, which causes depolarization of theIMM, mitochondrial dysfunction, severe oxidative stress,and Ca2+ and Cyt-C release into the cytosol.Noteworthy, multiple leukemic phenotypes express
higher levels of VDAC in a comparison to healthy cellsand VDAC expression is increased upon chemotherapy.Moreover, the degree of overexpression is positively cor-related with the cell death induction by anticanceragents37–39.We have observed different outcome of the CBD
treatment depending on its concentration. At high CBDconcentration, various scenarios of regulated cell deathmay be triggered in LLA-T (Fig. 8). In the present study,we reported apoptotic features such as Cyt-C release frommitochondria to cytosol, activation of caspases 9/3 andexternalization of phosphatidylserine. On the other hand,appearance of the huge Annexin V+PI+ population in theearly phases of CBD treatment evidenced MPT-driven
Fig. 8 Proposed mechanism for the CBD effect on T-ALL cells. Highly lipophilic CBD readily permeates plasma membrane and enters the cytosol,approaching mitochondria. Direct CBD interaction with VDAC favors the channel closed substate with increased Ca2+ permeability. It favorsmitochondrial Ca2+ uptake through VDAC and MCU, leading to the mitochondrial Ca2+ overload that promotes the mPTP formation, Δψm loss,mitochondrial swelling, and cristae disruption. mPTP opening promotes the Cyt-C release from mitochondria. In cytoplasm, Cyt-C may orchestratethe apoptosome formation, caspases´ activation, and triggers the intrinsic apoptosis. mPTP rapidly triggers Ca2+ release from the ER, which tends topromote the mitochondrial Ca2+ overload in a feedforward manner. The CBD-induced dysfunction of mitochondria is accompanied by severeoxidative stress and rapid loss of ATP production, resulting in the MPT-driven necrosis. Autophagy occurs in T-ALL cells treated with sublethal CBDconcentrations
Olivas-Aguirre et al. Cell Death and Disease (2019) 10:779 Page 12 of 19
Official journal of the Cell Death Differentiation Association
necrosis. One can hypothesize that development of MPT-driven apoptosis may be blocked due to energy penalty, adecreased ATP level caused by a cessation of oxidativephosphorylation by defunct mitochondria40. At sublethal(10 μM CBD) concentration, autophagy was induced andapparently efficiently prevented cell death (Fig. 1b, c, g, h;Fig. 3a–d). Low CBD concentrations even stimulated cellproliferation (Fig. 1b). This phenomenon may beexplained in the frame of the same basic model, providingthey promoted only limited [Ca2+]m increase. Suchmoderate [Ca2+]m accelerates metabolism due toCa2+-dependence of TCA cycle enzymes41.In conclusion, CBD directly targets mitochondria in T-
ALL and changes their capacity to handle Ca2+, which inturn affects multiple cellular functions, including ROSproduction and Ca2+ signaling, metabolic switch and theinduction of autophagy and cell death. The latter isdirectly proved for our experimental model as the inhi-bitor of mitochondrial Ca2+ uptake Ru360 protected T-ALL cells from the CBD-induced cell death. Consideringthe pivotal role of mitochondria in oncogenic re-pro-gramming, CBD may be plausible candidate to be inclu-ded into chemotherapeutic protocols. Importantly, restingT cells, representing major T lymphocyte population,were resistant to CBD and retained their ability to antigenactivation. Healthy activated T cells were CBD-sensitive,but this population is small in T-ALL patients with aweakened immunologic system. However, contrastingeffects of low and high CBD concentrations and possibledifferences in its tissue distribution and bioavailabilityrequires further studies on animal models, with a focus onsafety issues.
Materials/subjects and methodsCell lines and culture conditionsLeukemic cell lines Jurkat (ATCC®TIB™, Clone E6-1,
male, 14 years), MOLT-3 (ATCC®CRL-1552™, male, 19years), CCFR-CEM (ATCC®CCL-119™, T-ALL, female, 4years), K562 (ATCC®CCL-243™, female, 53 years), Reh(ATCC®CRL-8286™, female) and RS4;11 (ATCC®CRL-1873™, female, 32 years) purchased from ATCC® (Man-assas, VA, USA) were grown in suspension in AdvancedRPMI 1640 medium, supplemented with 5% (v/v) of heat-inactivated fetal bovine serum (FBS), 100 U/mL of peni-cillin, 100 µg/mL streptomycin and 1% of GlutaMAX™ (allfrom Invitrogene, Carlsbad, CA, USA). Tandem-labeledmCherry-GFP-LC3 Jurkat cells (gift from Dr. A. Thor-burn, Colorado, USA) were maintained in completegrowth medium (as for wild type Jurkat cells), additionallysupplemented with 400 µg/mL of hygromycin B (Sigma,H3274) for selection. Suspension cells were maintained inthe logarithmic growth phase by daily medium refresh-ment. Adherent cell lines MDA-MB-231 (ATCC®HTB-26™, female, 51 years), MCF7 (ATCC®HTB-22™, female,
69 years), SiHa (ATCC®HTB-35™, female, 55 years) andHeLa (ATCC®CCL-2™, female, 31 years) were maintainedin DMEM medium supplemented with 10% (v/v) of heat-inactivated FBS, 100 U/mL of penicillin, 100 µg/mLstreptomycin and 1% of GlutaMAX™. Adherent cells werepassaged when they were in the logarithmic growth phase.All cells were cultured in a humidified incubator in 5%CO2/95% air atmosphere at 37 °C.
Human samplesBlood samples (10 mL) from non-cancerous, apparently
healthy volunteers (6 males and 6 females, younger than35 years) were collected by capacitated personal underaseptic conditions. A written informed consent wasobtained from all persons, prior to sample collection,according to the Declaration of Helsinki. Sample acqui-sition protocol was evaluated and approved by theBioethics and Biosecurity Committee of the BiomedicalResearch Centre and the Faculty of Medicine of theUniversity of Colima, in agreement with the federal laws(Artículo 100, Ley General de Salud).
CannabidiolCBD solution in methanol (10 mg/mL, equivalent to
32mM) was purchased from Cayman Chemical (90081)and stored at −20 °C. Working solutions in completegrowth medium were prepared daily. Methanol (154903,Merck) was used in vehicle-treated controls. Referencemethanol concentration for a vehicle control was 0.3% v/v,which corresponds to that applied with the highest testedCBD concentration (100 μM).
Purification and activation of CD4+ lymphocytesHeparinized freshly isolated blood samples were diluted
1:1 with cold PBS. Peripheral blood mononuclear cells(PBMC) were separated by centrifugation in Ficoll (17-144002, Ficoll-Paque 1.073, GE Healthcare) gradient(1:1.5 blood/Ficoll ratio, 1000 × g, 30 min, RT). PBMCwere collected from the interphase and carefully washedin PBS. Finally, cells were resuspended in a fresh RPMI1640 medium, supplemented with 10% of FBS and incu-bated overnight for cell recovery. Next day, PBMC weresubjected to negative selection (to avoid activation) withhuman CD4+ T cell isolation kit (130-096-533, MiltenyiBiotec Miltenyi Biotec), following manufacturers’ specifi-cations. Briefly, PBMC were collected, washed (400 × g,5 min) and the pellet was resuspended in cold MACSbuffer. Live cells were counted (trypan blue exclusion test)and incubated with CD4+ T cell biotin-antibody cocktail(1 μL/1 × 106 cells) against CD8a, CD11b, CD11c, CD19,CD45R (B220), CD49b (DX5), CD105, Anti-MHC ClassII, Ter-119, and TCRγ/δ, for 20 min at 4 °C with agitation,followed by incubation with microbeads, conjugated tomonoclonal anti- biotin antibodies (2 μL/1 × 106 cells)
Olivas-Aguirre et al. Cell Death and Disease (2019) 10:779 Page 13 of 19
Official journal of the Cell Death Differentiation Association

over 20min at 4 °C. Next, 1 mL of MACS buffer wasadded, cells were centrifuged (400 × g, 5 min), supernatantwas discarded to remove the excess of antibodies and cellswere resuspended in 1mL of cold MACS buffer. CD4+ Tcell population was separated using a MACS separator. LScolumn was placed in the MAC separator, rinsed with3 mL of MACS buffer and cell suspension was added.Enriched CD4+ T (negative) cells were collected andcolumn was washed three times with MACS buffer for acomplete CD4+ harvesting. Enriched CD4+ T cell popu-lation was centrifuged (400 × g, 5 min), resuspended incomplete Advanced RPMI 1640 medium and incubated at37 °C in a humidified atmosphere (5% CO2, 95% air) priorto the experiments. The population purity was more than95% as verified by flow cytometry (FACSCanto II, BDBiosciences), using antiCD4 antibodies (BioLegend357404).For polyclonal activation, resting CD4+ lymphocytes
were pretreated in 96-well plates with antiCD3 mono-clonal antibodies (5 µg/mL) (BD, 555336) for 2 h at 37 °C.Medium excess was removed and cells were furtherincubated with antiCD28 monoclonal antibodies (2 µg/mL)(BD, 555725) for 4 days. Ligation of CD3/CD28 provides anantigen-independent activation stimulus by cross-linking Tcell receptor (TCR), resulting in transit from quiescent toproliferation state.
Resazurin-based metabolic assayTo estimate cell drug toxicity, resazurin-based meta-
bolic assay was used. Bioreduction of resazurin reagent(Tox 8, Sigma-Aldrich) by viable cells reduces the amountof its oxidized form and concomitantly increases theamount of its fluorescent intermediate resorufin. Theamount of dye conversion in solution was measuredfluorometrically, using a fluorescence plate reader Glo-Max Discover (PROMEGA). Cells (106/mL) were seededinto 96-well plates in 180 µL of complete RPMI mediumper well. Cells were incubated 24 h without or with CBD(1–100 μM). For assay, 20 μL aliquots of resazurin reagentwere added to each well to a final volume of 200 μL andcells were further incubated for 4 h (37 °C). Samples’fluorescence was measured by excitation at 520 nm andemission was collected at 580–640 nm. RPMI fluores-cence was subtracted for each condition. Samples wererun in triplicate, in at least three independent experi-ments. Data obtained from resorufin fluorescence wereaveraged, normalized to their controls and expressed ascell viability.
Sequential CBD administrationJurkat cells (2.5 × 10⁵/mL per well) were seeded into a
48-well plate in complete Advanced RPMI medium. Cellswere exposed to CBD (1–100 µM, dissolved in 500 μL ofRPMI) and incubated for 24 h. After incubation, cell
culture was gently resuspended, and 10 μL of suspensionwas taken for cell counting, using a hemocytometer andtrypan blue exclusion test, to determine the number ofviable cells. A second dose of CBD was administered, andcells were incubated for the next 24 h. The procedure wasrepeated one more time, so that total assay was completedin 72 h. Initial cell number was taken as 100%, and dailycell count was normalized to this point. Three cell counts(n= 3) from three independent experiments were aver-aged and expressed as percentage of viability.
CD4+ T cell recovery testNon-cancerous CD4+ T-cells from healthy donors were
cultured (1 × 10⁶ cells/mL) in complete Advanced RPMI1640 medium. Cells were preincubated with CBD (30 μM)or vehicle over 24 h. After CBD treatment, cells werewashed and resuspended in a CBD-free medium and usedfor activation with antiCD3 and antiCD28 antibodies, asdescribed earlier. Cell viability was determined byresazurin-based metabolic assay (Tox8, Sigma-Aldrich) aspreviously described, using a fluorescence plate reader(GloMax Discover, PROMEGA). Samples were excited at520 nm and emission was collected at 580–640 nm. RPMIfluorescence was subtracted for each condition and datawas generated in triplicate, in at least three independentexperiments. Data obtained from resorufin fluorescencewere averaged, normalized to their control values andexpressed as cell viability.
Migration assayLeukemic cells were seeded in 12-well plates (3422,
Transwell system, Corning Inc.) and preincubated for 1 hwith CBD. Pretreated cells (2 × 10⁵) were placed in 400 µLof serum-free medium in the upper chamber of Transwellinserts (8 μM pore size). Recombinant human CXCL12(Sigma-Aldrich) was used as a chemoattractant(100 ng/mL) in the lower chamber, filled with completeRPMI (10% FBS) medium. Cells were allowed to migrateover 4 hours. After incubation, insert was removed andcells from the lower chamber were counted, usinghemocytometer. Migration was expressed as a percentageof migrated cells in relation to the total cell number.
Cell death analysisFor this assay, Alexa Fluor® 488 Annexin V/Dead Cell
Apoptosis Kit (V13241, Thermo Fisher Scientific) wasused, following manufacturer specifications. Kit providesa nucleophilic marker (propidium iodide, PI, Ex/Em max= 535/617 nm) as an indicator of plasma membranedamage and Annexin V-Alexa Fluor 488 (Ex/Em max=488/510 nm), binding to externalized phosphatidylserine(a hallmark of apoptosis). Jurkat cells (106/mL) wereseeded in a 24 well plate and incubated with or withoutCBD (0–100 μM) for determined period (2, 4, 6, or 12 h).
Olivas-Aguirre et al. Cell Death and Disease (2019) 10:779 Page 14 of 19
Official journal of the Cell Death Differentiation Association
After the incubation period, cells were centrifuged (400 ×g) and washed with cold PBS. Then cells (1 × 10⁶) wereresuspended in 100 μL of 1X Annexin V-binding bufferand 5 μL of Annexin V conjugate with 1 μL of PI workingsolution (200 μg/mL) were added. The mixture wasincubated for 20min at room temperature (protectedfrom light), 200 μL of Annexin V - binding buffer wasadded and cells were analyzed either by confocal micro-scopy (LSM 700, Carl Zeiss) or by flow cytometry(FACSCanto II, BD Biosciences).For confocal microscopy, cells were placed into home-
made coverslips-bottomed chambers (poly-L-lysine-coated coverslips were fixed at the bottom of chamberusing Dow corning® high vacuum grease). 40×/63x oil-immersion objectives were used. For excitation, 488 nmlaser was used for both Alexa Fluor 488 and PI. Raw datawere further processed, and images were generated usingZen software (Zeiss).For flow cytometry analysis, color compensation (Alexa
Fluor 488 vs PI) was performed previously to dataacquisition. 488 nm laser was used for excitation. PIfluorescence was measured using 556LP mirror and 585/42 filter, Alexa Fluor 488 fluorescence was measuredusing 502LP mirror and 530/30 filter. Debris and doubletswere gated out, and 10,000 events of single cells persample were collected. Autofluorescence control was usedto determine the positive fluorescence threshold. AnnexinV−PI− populations were classified as healthy, AnnexinV+PI− as early apoptotic, Annexin V-PI+ as primarynecrotic, and Annexin V+PI+ as necrotic/late apoptotic.Data analysis was performed with FlowJo 10.2 software.
Determination of mitochondrial membrane potentialJurkat cells (106/mL) were double-labeled with Mito-
TrackerTM Green (100 nM, Ex/Em max= 490/518 nm;M7514, Thermo Fisher Scientific) and TMRE (200 nM,Ex/Em max= 555/582 nm; T669, Thermo Fisher Scien-tific), both from Thermo Fisher Scientific, by incubatingover 30min. After incubation period, cells were cen-trifuged (400 × g, 10 min) and washed with HanksBalanced Salt Solution (HBSS; NaCl 143 mM, KCl 6 mM,MgSO4 5mM, CaCl2 1 mM, HEPES 20mM, BSA 0.1%,glucose 5 mM, pH 7.4, ≈300mOsm) to remove excessivedye. For imaging, cells were placed in home-made cov-erslips-bottomed chambers and analyzed by confocalmicroscopy (LSM 700, Carl Zeiss) in a time series mode.Images were acquired every second and raw data werefurther processed by ImageJ program, where regions ofinterest (ROI) were defined, based on MitoTracker Greendistribution. The fluorescence of each ROI for both dyes(TMRE/MtGr) was then averaged and expressed as atemporal ratio between the fluorescence of each frameand the initial fluorescence (F/F0). To evaluate drugs’effect, CBD (0–100 μM) or FCCP (10 μM; C2920, Merck)
were administered, and cells were incubated for 10min,centrifuged (400 × g, 10 min), resuspended in HBSS, andtransferred to a 96-well plate. TMRE retention wasassessed by measurement of fluorescence intensity, usinga GloMax Discover plate reader, by exciting the sample at549 nm and collecting the emission signal at 575 nm. Datafrom independent experiments were averaged and theeffect of CBD/FCCP was expressed as percentage ofTMRE signal in comparison to control.
EYFP-Cyt c transfectionDH5α competent bacteria (18258012, Thermo Fisher
Scientific) were transformed by heat shock and EYFP-Cyt-C construct42 was added and incubated for 14 h at 37 °Cin LB agar (22700025, Thermo Fisher Scientific), supple-mented with 100 μg/μL of ampicillin (11593027, ThermoFisher Scientific). Colonies were selected and transferredto supplemented media for further incubation during 14 hfor bacterial growth. Plasmid DNA was purified byNucleoBond XtraMidi (740410.10, Macherey-Nagel) kit,and DNA purity and concentration were evaluated spec-trophotometrically by absorption at 260/280 nm. Fortransfection, 105 Jurkat cells were starved in Optimemreduced media for 12 h, then exposed to complexescomposed by lipofectamine 3000 (L3000015, ThermoFisher Scientific) and plasmidic DNA (500 ng) and cen-trifuged (400 × g) for 30 min to promote interaction.Transfected cells were incubated at 37 °C, with 5% CO2
overnight, whereas FBS (10%) was added at the next day.Protein expression was monitored, and experiments wereperformed 12 h after transfection. Images were acquiredusing a confocal microscope (LSM 700, Carl Zeiss)equipped with ×40/×63 oil-immersion objectives.
Cyt-C release microscopic assayJurkat cells transfected with EYFP-Cyt-C (Ex/Em max
= 514/526 nm) were labeled with TMRE (200 nM,30min) to confirm mitochondrial EYFP-Cyt-C localiza-tion. EYFP-Cyt-C expression and distribution were eval-uated in Jurkat cells 12 h after transfection by confocalmicroscopy. The effect of CBD (30 μM) was monitored intransfected cells incubated for indicated period with thedrug. To evaluate the effects of CsA and Ru360, cells werepreincubated with one of these drugs for 10min, followedby treatment with CBD. For data acquisition, cells wereplaced in home-made coverslips-bottomed chambers. Theimages were acquired using a confocal microscope (LSM700, Carl Zeiss), equipped with ×40/×63 oil-immersionobjectives.
ROS productionTo evaluate ROS production, 2′,7′-Dichlorofluorescin
diacetate (DCFDA, D6883, Merck) was used followingmanufacturer’s recommendations. Jurkat cells (106/mL)
Olivas-Aguirre et al. Cell Death and Disease (2019) 10:779 Page 15 of 19
Official journal of the Cell Death Differentiation Association
were loaded with permeable DCFDA (2 μM) for 30min inHBSS. After this, cells were washed to remove extracellulardye. Cells were resuspended in RPMI1640 medium andallowed to recover and to hydrolyze the AM groups, pro-ducing the insoluble form. Culture media was removed,and cells were resuspended in HBSS and treated either withPMA (1 μM, P8139, Merck) as a positive control or withCBD (10 and 30 μM). For data acquisition, cells wereplaced in home-made coverslips-bottomed chambers.Images were acquired by confocal microscopy (LSM 700,Carl Zeiss), equipped with ×40/×63 oil-immersion objec-tives and analyzed by ZEN imaging software.
Caspase 3/9 assayCaspase 3/9 colorimetric assays (K106/119, BioVision)
were used following manufacturer’s recommendations.Jurkat cells were grown in the presence of vehicle,staurosporine (positive control) or CBD during 12 h. Afterthis period, 106 cells from each sample were washed,resuspended in lysis buffer and incubated over 10 min onice. Then samples were centrifuged (10,000 × g, 15 min)and supernatants (cytosolic fraction) were transferred intonew tubes. For caspase activity assays, 100 μg of protein(as estimated by BCA protein quantification kit, Merck)from every sample were mixed with 50 μL of reactionbuffer (containing 10mM DTT) and 5 μL (4 mM) of thecaspases´ substrates (DEVD-pNA for caspase 3, LEHD-pNA for caspase 9). Mixtures were incubated for 2 h at37 °C and placed into a 96-well plate. Absorbance wasmeasured at 405 nm, using a GloMax Discover platereader. Data from three independent experiments wereaveraged and normalized in relation to non-treated cells,yielding fold increase in caspase activity.
Transmission electron microscopyJurkat cells were treated with CBD (30 μM) for 2 h.
Next, control or treated cells were centrifuged (400 × g),supernatants were discarded and the pellets were fixedwith 2.5% glutaraldehyde and post-fixed in 1% OsO4 and0.8% K4Fe(CN)6 • 3H2O, and 5mM Ca2+. Post-fixed cellswere dehydrated in acetone and embedded in Epon.Ultrathin sections were stained with uranyl acetate andlead citrate and examined under a JEOL JEM 12 000 EIItransmission electron microscope at the Unidad de Ima-genología, Instituto de Fisiología Celular (IFC), UNAM,Mexico City.
CEPIA3mt transfectionDH5α competent bacteria (18258012, Thermo Fisher
Scientific) were transformed by heat shock andCEPIA3mt/pCMV construct (58219, Addgene) wasadded27. Samples were incubated for 14 h at 37 °C in LBagar (22700025, Thermo Fisher Scientific), supplementedwith 100 μg/μl of ampicillin (11593027, Gibco). Colonies
were selected and transferred to supplemented media forfurther incubation during 14 h for bacterial growth.Plasmid DNA was purified by NucleoBond XtraMidi(740410.10, Macherey-Nagel) kit and purity and DNAconcentration were determined by spectrophotometry(absorption at 260/280 nm). For the transfection, 105
Jurkat cells were starved in Optimem reduced media over12 h, collected, exposed to complexes of lipofectamine3000 (L3000015, Thermo Fisher Scientific) and plasmidicDNA (1 µg), and centrifuged (400 × g) for 30 min to pro-mote interaction. Cells were incubated at 37 °C with 5%CO2 overnight, whereas FBS (10%) was added at the nextday. Protein expression was monitored, and experimentswere performed 24 h after transfection. For confocalimaging, cells were placed in home-made coverslips-bot-tomed chambers. Images were acquired using a confocalmicroscope (LSM 700, Carl Zeiss) equipped with ×40/×63oil-immersion objectives.
Determination of the intracellular free Ca2+ concentrationFor free [Ca2+]i measurements, cells were loaded with
ratiometric Ca2+ indicator Fura-2 (F1201, Thermo FisherScientific). Cells were twice washed with PBS and resus-pended in a loading solution (HBSS, 0.01% pluronic acid,2 µM Fura-2/AM), incubated for 30min at room tem-perature protected from light, washed, and resuspendedin HBSS. Changes in fluorescence were recorded with aF7000 spectrophotometer (Hitachi High-Technologies).Measurements were realized in quartz cuvettes, contain-ing 1.5 × 10⁶ cells/mL. Loaded cells were excited alter-nately at 340/380 nm and the fluorescence emission wascollected every 2 s at 510 nm. Fluorescence was recordedby means of the FL-solutions software. Maximum andminimum free [Ca2+] levels were determined at the end ofeach experiment by adding 0.3% Triton X-100 and con-sequent addition of EGTA to a final concentration of35 mM, respectively. Free [Ca2+]i was calculated by usingthe following equation:
Ca2þ� �
i ¼ Kd R� RMINð Þ= RMAX � Rð Þ
where R stays for the ratio of fluorescence intensity uponexcitation at 340 to that at 380 nm and RMIN and RMAX
correspond to maximal and minimal values of this ratio,determined as described above43.In some experiments Ca2+-free HBSS was used (NaCl
143mM, KCl 6 mM, MgSO4 5mM, HEPES 20mM, BSA0.1%, glucose 5 mM, EGTA 1mM, pH 7.4, ≈300mOsm).
Mitochondrial Ca2+ measurementsCEPIA3mt (Ex/Em max= 488/510 nm) expression and
its mitochondrial localization were confirmed in trans-fected Jurkat cells, loaded with TMRE, by confocalmicroscopy (LSM700, Carl Zeiss). For [Ca2+]m
Olivas-Aguirre et al. Cell Death and Disease (2019) 10:779 Page 16 of 19
Official journal of the Cell Death Differentiation Association

measurements, 105 cells (24 h after transfection) wereplaced in a quartz cuvette and fluorescence was evaluatedby spectrofluorometry, using a F7000 HITACHI spec-trofluorometer (FL solution software). Samples wereexcited at 488 nm and fluorescence was measured at510 nm. [Ca2+]m was evaluated as fluorescence intensityin relation to the initial fluorescence intensity (F/F0).
Mitochondria isolationMitochondria were isolated as reported earlier39, with
some modifications. Jurkat cells were harvested and cen-trifuged (400 × g) at 4 °C for 10min, washed twice withPBS (pH 7.4) and resuspended in 10x of volume of iso-lation buffer (IB, HEPES-KOH 20mM, PMSF 1mM,sucrose 250mM, mercaptoethanol 1 mM, EGTA 1mM,EDTA 1mM, MgCl2 1.5 mM, KCl 10mM). Cells wereincubated on ice for 10 min and homogenized with aDounce homogenizer. Homogenate was then centrifugedat 650 × g for 10 min at 4 °C, pellet, containing nuclei, wasdiscarded and the supernatant was collected for a further12500 × g centrifugation for 30min at 4 °C. Pellet con-taining the heavy membrane fractions (HMF) was col-lected and the supernatant was discarded. HMF werewashed with IB and resuspended in isotonic sucrosebuffer (sucrose 250mM, EDTA 1mM, Tris-HCl pH 7.410mM). Homogenate was placed in a discontinuoussucrose gradient (sucrose 1/1.5M, EDTA 1mM, Tris-HClpH 7.4 10mM) and centrifuged for 25 min at 60,000 × g,4 °C. Mitochondria were collected from the interphase,washed and resuspended in the experimental buffer (KCl125mM, KH2PO4 1mM, Tris-HCl 10mM, glutamate5 mM, malate 2.5 mM, EGTA 1mM, CaCl2 0.7 mM).Isolated mitochondria were suspended in the lysis buffer(Nonidet P-40 0.5% w/v, Tris-HCL 50mM, NaCl150mM, EDTA 1mM, and PMSM 1mM) for 1 h andcentrifuged at 15000 × g for 5 min. The supernatant wascollected, and isolation yield was estimated by the proteincontent (BCA quantification assay). Finally, mitochondrialsamples, containing 50 µg of protein, were used in theexperiments. To evaluate the purity and integrity of iso-lated mitochondria, a small fraction was stained withMtGreen (200 nM, Ex/Em max= 490/510 nm; M7514,Thermo Fisher Scientific) as mitochondrial marker, fol-lowed by staining with Rhod (2 μM, Ex/Em max= 552/581 nm; R1244, Thermo Fisher Scientific) or TMRE(200 nM, Ex/Em max= 549/575 nm; T669, ThermoFisher Scientific). Samples were acquired by flow cyto-metry (FACSCantoII, BD Biosciences) and data wereanalyzed by FlowJo software.
Ca2+ measurement in isolated mitochondriaFreshly isolated mitochondrial samples (50 μg of protein
per sample) were incubated with Rhod2 (2 μM) over30min, washed by centrifugation (12500 × g, 5 min) and
resuspended in experimental buffer (KCl 125mM,KH2PO4 1mM, TrisHCl 10mM, glutamate 5 mM, malate2.5 mM, EGTA 1mM, CaCl2 0.7 mM). Samples wereplaced in a quartz cuvette, and fluorescence was evaluatedby F7000 spectrophotometer (Hitachi High-Technolo-gies), using excitation at 552 nm and collecting thefluorescence at 581 nm. Data was recorded using the FL-Solution software (Hitachi). [Ca2+]m change was eval-uated by taking fluorescence for each acquisition inrelation to the initial fluorescence value, F/F0.
Membrane potential measurements on isolatedmitochondriaIsolated mitochondria (50 μg of protein/sample) were
stained with TMRE (200 nM; 30min), treated with CBD(0–60 μM) or FCCP (10 μM) for 10min, washed, resus-pended in experimental buffer (KCl 125 mM, KH2PO4
1mM, TrisHCl 10 mM, glutamate 5 mM, malate 2.5 mM,EGTA 1mM, CaCl2 0.7 mM) and placed in a 96-wellplate. Fluorescence was assayed using a GloMax Discoverplate reader, by exciting the sample at 549 nm and col-lecting the emission at 575 nm. Data from independentexperiments were averaged and the effect of CBD orFCCP on membrane potential value is defined as % ofTMRE fluorescence with respect to control.
Detection of autophagic flux by LC3 immunoblottingDuring autophagy, the amount of LC3-I decreases and
that of LC3-II increases. But at the late phase after autop-hagolysosome formation LC3-II disappears being degradedby lysosomal proteases. If cells are treated with lysosomalprotease inhibitors or with drugs inhibiting autophagosome-lysosome fusion, LC3-II degradation is prevented. Thus,LC3-II amount at a certain time point does per se serve ameasure of the total autophagic flux. This flux should bemore accurately evaluated by comparison of the amount ofLC3-II between samples in the presence and absence oflysosomal protease inhibitors or compounds preventingautophagosome-lysosome fusion15,44. CQ was shown toprevent autophagosome-lysosome fusion16 and was usedtherefore in the present work.For Western blot analysis, cells after corresponding
treatments (CQ, CBD, or CQ and CBD combination)were harvested and lysed with RIPA buffer (Tris-HCl25mM, pH 7.6, NaCl 150mM, EDTA 5mM, NP-40 1%,sodium deoxycholate 1%, SDS 0.1%), supplemented withprotease inhibitors (11697498001, Complete, Roche). Forprotein quantification, BCA Protein Assay Kit (Sigma)was used. For each sample, 15 µg/line of protein wereloaded on a 15% SDS-PAGE gel. After electrophoresis(100 V, ~2 h), proteins were transferred onto PVDFmembranes. Membranes were blocked for 1 hour with 5%BSA in TBS Tween-20 buffer (TBS-T) and incubatedovernight at 4 °C with anti-human LC3 rabbit antibodies
Olivas-Aguirre et al. Cell Death and Disease (2019) 10:779 Page 17 of 19
Official journal of the Cell Death Differentiation Association

(Novus-Biologicals, NB100-2220, dilution 1:3000) andmouse monoclonal anti-human GAPDH antibodies(SCBT, sc-47724, dilution 1:1000) as a loading control. Assecondaryantibodies, HRP-conjugated goat anti-rabbit IgG (Novus-Biologicals, NBP2-30348H, dilution 1:3000) and HRP-conjugated anti-mouse IgGκ (SCBT, sc-516102, dilution1:1000) were used for LC3 and GAPDH, respectively.Membranes were incubated with secondary antibodiesover 1 h at room temperature, followed by incubationwith the ECL detection reagent (Bio-Rad, 170-5061).Protein bands were visualized with Bio-Rad UniversalHood II system and analyzed with Image Lab 5.0 software.
Autophagic flux measurement with mCherry-GFP-LC3To measure autophagic flux at the single cell level,
Jurkat cells, stably expressing tandem mCherry-GFP-LC3,were used45. Cells were cultured in the presence of CBD,CQ or their combination for 2, 4, and 24 h. After theseperiods, cells were collected by centrifugation (100 × g),suspended in PBS and placed in a in home-made cover-slips-bottomed chambers for microscopy imaging. Doublepositive mCherry+ /GFP+ puncta represented autopha-gosomes, whereas fusion with the lysosome (autophago-lysosomes) caused quenching of the pH-sensitive GFP,resulting in appearance of mCherry+GFP- puncta. CQprevents GFP quenching by inhibiting autophagosome-lysosome fusion16. Samples were analyzed by confocalmicroscopy (LSM700, Carl Zeiss). Alternatively, custom-made confocal microscope (Solamere Technology Group,Salt Lake City, USA) based on a Yakogawa spindiskconfocal scan head (CSUX1M1, Yokogawa Electronic Co.,Tokio, Japan), equipped with solid state Coherent Obislasers (405, 488, 561 and 640 nm) was used. Autophagyflux was evaluated by counting red (mCherry+) and green(GFP+) puncta (0.5–3 µm2) in the cells. Data analysis wasperformed using “Particle analysis” tool of ImageJ soft-ware, as reported by others46–48. Three fields for eachcondition (10–20 cells/ field) in at least three independentexperiments were analyzed. Data are presented as mean ofLC3 puncta/ cell or as mean of mCherry/GFP ratio.
Protein-ligand dockingTo explore binding sites for CBD within human VDAC1
channel, molecular docking analysis was performed, usingMolegro virtual docker 6.0 software. Chemical structure ofCBD was obtained from Pubchem (NIH, 644019), whereashVDAC1 channel structure was downloaded from theprotein data bank (PDB, 2JK4). For the beginning, threemain cavities for hVDAC1 were defined and explored aspossible CBD-interacting sites. MolDock Optimizer wasselected as a search algorithm, 20 runs (number of timesthat the docking is repeated for each ligand) was chosen,and 1000 ligand binding conformations were established.
From them, the best 5, based on their docking score(MolDock Score), were selected for each cavity. For all15 selected binding conformations the contribution ofeach participating residue in the CBD binding was eval-uated (Ligand map > Ligand Energy Inspector). Finally,basing on Total energy/MolDock Score, the best bindingconformation was revealed and plotted by creating back-bone visualization in the workspace.
AcknowledgementsThis study was funded by CONACyT grants 220793 to I.P., FC2015/1-140 toO.D., and PAPIIT IG200119 (DGAPA-UNAM) to A.H.C.; doctoral fellowships (M.O.A., L.T.L. and J.SV.R). We thank Dr. Boehning and Dr. Methner for providingEYFP-Cyt C and CEPIA3mt plasmids, Dr. Thorburn for gifting mCherry-GFP-LC3expressing Jurkat cells, Dr. Rincón-Heredia and Dr. Díaz for sample preparationand data acquisition by TEM, and Dr. Gómez and Mr. Reyes for their assistancein the docking simulations. Technical assistance of L. Liñan-Rico and M. Flores(University of Colima), Dr. Picones, Dr. Loza, O. Lara, and L. Durán (NationalLaboratory of Channelopathies) is appreciated.
Conflict of interestThe authors declare that they have no conflict of interest.
Publisher’s noteSpringer Nature remains neutral with regard to jurisdictional claims inpublished maps and institutional affiliations.
Supplementary Information accompanies this paper at (https://doi.org/10.1038/s41419-019-2024-0).
Received: 21 May 2019 Revised: 22 August 2019 Accepted: 24 September2019
References1. Nguyen, K. et al. Factors influencing survival after relapse from acute lym-
phoblastic leukemia: a Children’s Oncology Group Study. Leukemia 22,2142–2150 (2008).
2. Bassan, R. & Hoelzer, D. Modern therapy of acute lymphoblastic leukemia. J.Clin. Oncol. 29, 532–543 (2011).
3. Pui, C. H. & Evans, W. E. A 50-year journey to cure childhood acute lympho-blastic leukemia. Semin. Hematol. 50, 185–196 (2013).
4. Raetz, E. A. & Teachey, D. T. T-cell acute lymphoblastic leukemia. Hematol. Am.Soc. Hematol. Educ. Program. 2016, 580–588 (2016).
5. Pui, C. H., Yang, J. J., Bhakta, N. & Galindo, C. Global efforts toward the cure ofchildhood acute lymphoblastic leukaemia. Lancet Child Adolesc. Health 2,440–454 (2018).
6. Solinas, M, Cinquina, V. & Parolaro, D. Cannabidiol and Cancer — An Overviewof the Preclinical Data, Molecular Considerations and Evolving Surgical Man-agement Issues in the Treatment of Patients with a Brain Tumor. Ch. 8. (Inte-chOpen, London, 2015).
7. Ladin, D. A., Soliman, E., Griffin, L. & Van Dross, R. Preclinical and clinicalassessment of cannabinoids as anti-cancer agents. Front. Pharmacol. 7, 361(2016).
8. Russo, E. B. Cannabidiol claims and misconceptions. Trends Pharmacol. Sci. 38,198–201 (2017).
9. Massi, P., Solinas, M., Cinquina, V. & Parolaro, D. Cannabidiol as potentialanticancer drug. Br. J. Clin. Pharmacol. 75, 303–312 (2013).
10. Yadav, B. D. et al. Heterogeneity in mechanism of emergent resistant inpediatric T-cell acute lymphoblastic leukemia. Oncotarget 7, 58728–58742(2016).
11. Pitt, L. A. et al. CXCL12-producing vascular endothelial niches control acute Tcell leukemia maintenance. Cancer Cell 27, 755–768 (2015).
12. Passaro, D. et al. CXCR4 is required for leukemia-initiating cell activity in T cellacute lymphoblastic leukemia. Cancer Cell 27, 769–779 (2015).
Olivas-Aguirre et al. Cell Death and Disease (2019) 10:779 Page 18 of 19
Official journal of the Cell Death Differentiation Association
13. Galluzzi, L., Pietrocola, F., Levine, B. & Kroemer, G. Metabolic control ofautophagy. Cell 159, 1263–1376 (2014).
14. Shrivastava, A., Kuzontkoski, P. M., Groopman, J. E. & Prasad, A. Cannabidiolinduces programmed cell death in breast cancer cells by coordinating thecross-talk between apoptosis and autophagy. Mol. Cancer Ther. 10, 1161–1172(2011).
15. Mizushima, N. & Yoshimori, T. How to interpret LC3 immunoblotting. Autop-hagy 3, 542–545 (2007).
16. Mauthe, M. et al. Chloroquine inhibits autophagic flux by decreasingautophagosome-lysosome fusion. Autophagy 14, 1435–1455 (2018).
17. Pankiv, S. et al. p62/SQSTM1 binds directly to Atg8/LC3 to facilitate degra-dation of ubiquitinated protein aggregates by autophagy. J. Biol. Chem. 282,24131–24145 (2007).
18. Galluzzi, L. et al. Molecular mechanisms of cell death: recommendations of theNomenclature Committee on Cell Death 2018. Cell Death Differ. 25, 486–541(2018).
19. Kalenderoglou, N., Macpherson, T. & Wright, K. L. Cannabidiol reduces leu-kemic cell size - but is it important?. Front. Pharmacol. 8, 144 (2017).
20. Giorgio, V., Guo, L., Bassot, C., Petronilli, V. & Bernardi, P. Calcium and regulationof the mitochondrial permeability transition. Cell Calcium 70, 56–63 (2018).
21. Eskes, R. et al. Bax-induced cytochrome C release from mitochondria isindependent of the permeability transition pore but highly dependent onMg2+ ions. J. Cell Biol. 143, 217–224 (1998).
22. Brustovetsky, N., Brustovetsky, T., Jemmerson, R. & Dubinsky, J. M. Calcium-induced cytochrome c release from CNS mitochondria is associated with thepermeability transition and rupture of the outer membrane. J. Neurochem. 80,207–218 (2002).
23. McKallip, R. J. et al. Cannabidiol-induced apoptosis in human leukemia cells: anovel role of cannabidiol in the regulation of p22phox and Nox4 expression.Mol. Pharmacol. 70, 897–908 (2006).
24. Ligresti, A. et al. Antitumor activity of plant cannabinoids with emphasis onthe effect of cannabidiol on human breast carcinoma. J. Pharmacol. Exp. Ther.318, 1375–1387 (2006).
25. Ryan, D., Drysdale, A. J., Lafourcade, C., Pertwee, R. G. & Platt, B. Cannabidioltargets mitochondria to regulate intracellular Ca2+ levels. J. Neurosci. 29,2053–2063 (2009).
26. Orrenius, S., Gogvadze, V. & Zhivotovsky, B. Calcium and mitochondria in theregulation of cell death. Biochem. Biophys. Res. Commun. 460, 72–81 (2015).
27. Giacomello, M. & Pellegrini, L. The coming of age of the mitochondria-ERcontact: a matter of thickness. Cell Death Differ. 23, 1417–1427 (2016).
28. Suzuki, J. et al. Imaging intraorganellar Ca2+ at subcellular resolution usingCEPIA. Nat. Commun. 5, 4153 (2014).
29. Kitamura, Y., Arima, T., Kitayama, Y. & Nomura, Y. Regulation of [Ca2+]i riseactivated by doxepin-sensitive H1-histamine receptors in Jurkat cells, clonedhuman T lymphocytes. Gen. Pharmacol. 27, 285–291 (1996).
30. Rimmerman, N. et al. Direct modulation of the outer mitochondrial mem-brane channel, voltage-dependent anion channel 1 (VDAC1) by cannabidiol: a
novel mechanism for cannabinoid-induced cell death. Cell Death Dis. 4, e949(2013).
31. Tan, W. & Colombini, M. VDAC closure increases calcium ion flux. Biochim.Biophys. Acta 1768, 2510–2505 (2007).
32. Rizzuto, R., De Stefani, D., Raffaello, A. & Mammucari, C. Mitochondria as sensorsand regulators of calcium signaling. Nat. Rev. Mol. Cell Biol. 13, 566–578 (2012).
33. Szabo, I. & Zoratti, M. Mitochondrial channels: ion fluxes and more. Physiol. Rev.94, 519–608 (2014).
34. Szabadkai, G. et al. Chaperone-mediated coupling of endoplasmic reticulumand mitochondrial Ca2+ channels. J. Cell Biol. 175, 901–911 (2006).
35. De Stefani, D., Patron, M. & Rizzuto, R. Structure and function of the mito-chondrial calcium uniporter complex. Biochim. Biophys. Acta 1853, 2006–2011(2015).
36. Colombini, M. Mitochondrial outer membrane channels. Chem. Rev. 112,6373–6387 (2012).
37. Rezaul, K., Wu, L., Mayva, V., Hwang, S. & Han, D. A systematic characterizationof mitochondrial proteome from human T leukemia cells. Mol. Cell Proteom. 4,169–181 (2005).
38. Jiang, N. et al. Identification of prognosis protein biomarkers in childhoodacute lymphoblastic leukemia (ALL). J. Proteom. 74, 843–857 (2011).
39. Prezma, T. et al. VDAC1-based peptides: novel pro-apoptotic agents andpotential therapeutics or B-cell chronic lymphocytic leukemia. Cell Death Dis. 4,e809 (2013).
40. Bonora, M. & Pinton, P. The mitocondrial permeability transition pore andcancer: molecular mechanisms involved in cell death. Front. Oncol. 4, 302(2014).
41. Denton, R. Regulation of mitochondrial dehydrogenases by calcium ions.Biochim. Biophys. Acta 1787, 1309–1316 (2009).
42. Boehning, D. et al. Cytochrome c binds to inositol (1,4,5) trisphosphatereceptors, amplifying calcium-dependent apoptosis. Nat. Cell Biol. 5,1051–1061 (2003).
43. Grynkiewicz, G., Poenie, M. & Tsien, R. Y. A new generation of Ca2+ indicatorswith greatly improved fluorescence properties. J. Biol. Chem. 260, 3440–3450(1985).
44. Klionsky, D. J. et al. Guidelines for the use and interpretation of assays formonitoring autophagy. Autophagy 12, 443 (2016).
45. Gump, J. M. & Thorburn, A. Sorting cells for basal and induced autophagic fluxby quantitative ratiometric flow cytometry. Autophagy 10, 1327–1334 (2014).
46. Zhou, C. et al. Monitoring autophagic flux by an improved tandemfluorescent-tagged LC3 (mTagRFP-mWasabi-LC3) reveals that high-doserapamycin impairs autophagic flux in cancer cells. Autophagy 8, 1215–1226(2012).
47. Castillo, K., Valenzuela, V., Oñate, M. & Hetz, C. A molecular reporter formonitoring autophagic flux in nervous system in vivo. Methods Enzymol. 588,109–131 (2017).
48. Runwal, G. et al. LC3-positive structures are prominent in autophagy-deficientcells. Sci. Rep. 9, 10147 (2019).
Olivas-Aguirre et al. Cell Death and Disease (2019) 10:779 Page 19 of 19
Official journal of the Cell Death Differentiation Association