Embed Size (px)
Citation preview

Technical Report
TR-06-04
Svensk Kärnbränslehantering ABSwedish Nuclear Fueland Waste Management CoBox 5864SE-102 40 Stockholm Sweden Tel 08-459 84 00 +46 8 459 84 00Fax 08-661 57 19 +46 8 661 57 19
Canister displacement in KBS-3V
A theoretical study
Lennart Börgesson, Clay Technology AB
Jan Hernelind, FEMTech AB
February 2006

Canister displacement in KBS-3V
A theoretical study
Lennart Börgesson, Clay Technology AB
Jan Hernelind, FEMTech AB
February 2006
This report concerns a study which was conducted for SKB. The conclusions and viewpoints presented in the report are those of the authors and do not necessarily coincide with those of the client.
A pdf version of this document can be downloaded from www.skb.se

�
Abstract
The vertical displacement of the canister in the KBS-3V concept has been studied in a number of consolidation and creep calculations using the FE-program ABAQUS. The creep model used for the calculations is based on Singh-Mitchell’s creep theory, which has been adapted to and verified for the buffer material MX-80 in earlier tests. A porous elastic model with Drucker-Prager plasticity has been used for the consolidation calculations. For simplicity the buffer has been assumed to be water saturated from start.
In one set of calculations only the consolidation and creep in the buffer without considering the interaction with the backfill was studied. In the other set of calculations the interaction with the backfill was included for a backfill consisting of an in situ compacted mixture of 30% bentonite and 70% crushed rock. The motivation to also study the behaviour of the buffer alone was that the final choice of backfill material and backfilling technique is not made yet so that set of calculations simulates a backfill that has identical properties with the buffer. The two cases represent two extreme cases, one with a backfill that has a low stiffness and the lowest allowable swelling pressure and one that has the highest possible swelling pressure and stiffness..
The base cases in the calculations correspond to the final average density at saturation of 2,000 kg/m3 with the expected swelling pressure of 7 MPa in a buffer. In order to study the sensitivity of the system to loss in bentonite mass and swelling pressure seven additional calculations were done with reduced swelling pressure down to 80 kPa corresponding to a density at water saturation of about 1,500 kg/m3.
The calculations included two stages, where the first stage models the swelling and consolidation that takes place in order for the buffer to reach force equilibrium. This stage takes place during the saturation phase and the subsequent consolidation/swelling phase. The second stage models the deviatoric creep in the buffer during 100,000 years.
The volumetric creep is not modelled, which thus may cause a slight underestimation of the canister displacement. The motive for excluding volumetric creep is that a canister settlement caused by volumetric creep will not change the total mass of bentonite under the canister but will only increase the density and is thus not judged to be a problem. Moreover, the volumetric creep is of the same order of magnitude as the deviatoric, which means that the canister displacement caused by this creep will be as insignificant as the deviatoric creep.
The calculations show that the canister settlement is very small even at low swelling pressure and density. The base case corresponding to the expected final swelling pressure of the buffer 7,000 kPa yields a total settlement of the canister of only 0.35 mm for the fixed boundary case, while there is a heave of the canister of about 4.5 mm at the other case with 30/70 backfill due to the upwards swelling of the buffer. At reduced swelling pressure the settlement increases but is not more than about 23 mm at the very low swelling pressure 80 kPa for both cases.
Figure 1 shows the consolidation and creep settlement as a function of applied swelling pressure for the two sets of calculations.

�
Another phenomenon that may affect the buffer is a reduction in strength or friction angle with time, which affects the degree of mobilized shear strength, which is a critical creep parameter. A reduced friction angle will reduce the strength and thus affect the degree of mobilized strength in a similar way as a reduced swelling pressure. So the reduction in shear strength can for the creep also correspond to a reduction in friction angle with kept initial density and swelling pressure. At the swelling pressure 80 kPa the deviatoric stress at failure is only 70 kPa, which for the swelling pressure 7,000 kPa corresponds to a friction angle of only 0.29°. This shows that not even a strong reduction in friction angle is a threat to the canister integrity.
The conclusion is thus that the expected displacement of the canister from consolidation and creep during 100,000 years is very small and for the case of 30/70 backfill actually will result in a heave of the canister. The sensitivity analyses with reduced swelling pressure corresponding to reduced density or reduced friction angle also show that the canister displacement is very insensitive to such phenomena since the total settlement will be less than a few cm even at a buffer density of 1,500 kg/m3 or at a friction angle of 0.3°.
Figure 1. Vertical displacement of the canister as a function of swelling pressure for the two cases with fixed boundary buffer/backfill (left) and free boundary with 30/70 backfill (right). Negative displacement implies sinking.
Only consolidation Consolidation + creep

�
Sammanfattning
Den vertikala förskjutningen av kapseln i KBS-3H konceptet har studerats i ett antal konsoliderings- och krypberäkningar med FE-programmet ABAQUS. Krypmodellen som använts i beräkningarna är baserad på Singh-Mitchells krypteori, vilken har anpassats till och verifierats för buffermaterialet i tidigare tester. För konsolideringsberäkningarna har en materialmodell med Porous Elastic och Drucker-Prager plasticitet använts. För att förenkla och renodla analyserna har bufferten antagits vara fullt vattenmättad från start.
I en serie beräkningar har enbart konsolideringen och krypningen i bufferten utan att hänsyn tagits till samverkan med återfyllningen studertats. I en annan serie beräkningar har samverkan med återfyllningen beaktats, där återfyllningen bestod av en in-situ kompakterad blandning av 30 % bentonit och 70 % krossat berg. Motivet till att även studera enbart hur bufferten utan samverkan med återfyllningen beter sig var att det slutgiltiga valet av återfyllnadsmaterial och åtefyllnadsteknik ännu inte gjorts. Den beräkningsserien simulerar en återfyllnad som har identiska egenskaper med bufferten. De två fallen representerar två extremfall, det ena med en återfyllnad som har låg styvhet och det lägsta tillåtna sväll-trycket, och det andra med en återfyllnad som har högsta möjliga styvhet och svälltryck.
Basfallet i beräkningarna svarar till det förväntade svälltrycket 7 MPa i en buffert med en slutlig medeldensiteten vid vattenmättnad på 2 000 kg/m3. För att studera systemets känslighet vad gäller minskad bentonitmassa och minskat svälltryck har sju ytterligare beräkningar utförts med reducerat svälltryck ner till 80 kPa, motsvarande en densitet vid vattenmättnad på ca 1 500 kg/m3.
Beräkningarna inkluderar två steg, där det första modellerar den svällning och konsolidering som äger rum för att bufferten skall uppnå kraftjämvikt. Detta steg äger rum under bevätningsfasen och den påföljande konsoliderings/svällningsfasen. Det andra steget modellerar deviatorisk krypning i bufferten under 100 000 år.
Den volymetriska krypningen modelleras inte, vilket kan leda till en smärre underskattning av kapselförskjutningen. Motivet till att utesluta volymetrisk krypning är att en kapsel-sjunkning som orsakas av volymetrisk krypning inte ändrar den totala mängden bentonit under kapseln, utan ökar enbart densiteten och anses därför inte utgöra något problem. Dessutom är den volymetriska krypningen av samma storleksordning som den deviatoriska, vilket innebär att kapselförskjutningen som orsakas av denna krypning kommer att vara lika obetydlig som den deviatoriska krypningen.
Beräkningarna visar att kapselsättningen är mycket liten, även vid låga svälltryck och densiteter. Basfallet, motsvarande det förväntade slutliga buffertsvälltrycket 7 000 kPa, resulterar i en total sättning av kapseln på endast 0.35 mm i fallet med fix rand, medan kapseln reser sig ca 4.5 mm i fallet med 30/70 återfyllnad eftersom bufferten expanderar uppåt. Vid ett minskat svälltryck ökar sättningen, men den är inte mer än ca 23 mm vid det mycket låga svälltrycket 80 kPa i båda fallen.
Figur 1 visar konsolideringen och krypsättningen som en funktion av svälltrycket för båda beräkningarna.

�
Ett annat fenomen som kan påverka bufferten är en minskning av buffertens hållfasthet eller friktionsvinkel med tiden, vilket påverkar graden av mobiliserad skjuvhållfasthet, vilken är en kritisk krypparameter. En reducerad friktionsvinkel kommer att minska hållfastheten och således påverka graden av mobiliserad skjuvhållfasthet på liknande sätt som ett minskat svälltryck. Den minskade skruvhållfastheten kan för krypberäkningen således också mot-svara en minskning av friktionsvinkeln med bibehållen densitet och svälltryck. Vid 80 kPa svälltryck är deviatorspänningen vid brott bara 70 kPa, vilket vid ett svälltryck på 7 000 kPa motsvarar en friktionsvinkel på endast 0,29°. Detta visar att inte ens en stor minskning av friktionsvinkeln är ett hot mot kapselns integritet.
Slutsatsen är således att den förväntade rörelsen hos kapseln i ett deponeringshål på grund av konsolidering och krypning under 100 000 år är mycket liten, och i fallet med 30/70 återfyllning kommer det till och med att resultera i en rörelse uppåt av kapseln. Känslighetsanalyserna med minskat svälltryck som motsvarar minskad densitet eller minskad friktionsvinkel visar också att kapselns rörelse är mycket okänslig för sådana fenomen, eftersom den totala sättningen kommer att vara mindre än ett fåtal cm även vid en buffertdensitet på 1 500 kg/m3, eller vid en friktionsvinkel på 0,3°.
Figur 1. Vertikal rörelse hos kapseln som funktion av svälltrycket i de två fallen fix rand buffert/återfyllning (vänster) och fri rand med 30/70 återfyllning (höger). Negativ rörelse betyder sjunkning.
Enbart konsolidering Konsolidering + krypning

�
Contents
1 Introduction 9
2 Creeptheory 112.1 General 112.2 Deviatoric creep 112.3 ABAQUS application 14
3 Finiteelementcodeandfiniteelementmodels 153.1 General 153.2 Element mesh 153.3 Creep properties of the buffer 163.4 Mechanical properties of the buffer and backfill 173.5 Canister and rock properties 183.6 Properties of surface elements 18
4 Calculations 194.1 General 194.2 Calculations with fixed boundaries buffer/backfill and buffer/rock 19
4.2.1 General 194.2.2 Scope and specification of the calculations 204.2.3 Calculation sequence 234.2.4 Results 24
4.3 Calculations that include buffer/backfill interaction 284.3.1 General 284.3.2 Scope and specification of the calculations 294.3.3 Results 29
5 Analysesandconclusions 41
References 43

�
1 Introduction
Canister settlement consists mainly of four different processes:1. Consolidation/swelling due to the canister weight.2. Volumetric creep due to the canister weight.3. Deviatoric creep due to the canister weight.4. Stress changes due to upwards swelling of the buffer/backfill interface.
a) Consolidation/swelling.b) Volumetric creep.c) Deviatoric creep.
The fourth process consists also of the first three processes but the consolidation and creep is caused by the swelling pressure from the buffer on the backfill instead of the weight of the canister.
The calculations include two stages, where the first stage models the swelling and consoli-dation that takes place in order for the buffer to reach force equilibrium. This stage takes place during the saturation phase and the subsequent consolidation/swelling phase. The second stage models the deviatoric creep in the buffer during 100,000 years.
The modeling that has been performed and is reported here takes into account all processes except the volumetric creep, which thus may cause a slight underestimation of the canister displacement. The motive for excluding volumetric creep is that a canister settlement caused by volumetric creep will not change the total mass of bentonite under the canister but will only increase the density and is thus not judged to be a problem. Moreover, volumetric creep can be included in the consolidation process by decreasing the stiffness of the buffer. The volumetric creep is of the same order of magnitude as the deviatoric and since the deviatoric creep turns out to be insignificant for the function of the buffer the influence of volumetric creep has not bee further dealt with.
11
2 Creeptheory
2.1 GeneralThe definition of creep is according to normal soil mechanics terminology a strain that will increase with time at a constant load and constant pore water pressure. The latter requirement is necessary in order to distinguish creep from consolidation. The rate of creep is thus controlled by viscosity related deformations in the structure while consolidation is controlled by the rate of the pore water flux out from (or into) the soil pore system. Creep processes take place also when the material is volumetrically confined and will at constant volume yield a change in stress with time (stress relaxation).
Creep at constant stress can be divided into two main processes, namely the volumetric creep and the deviatoric creep with the following symbols:
Volumetric creep strain: εcv
Volumetric creep rate: cvε& = dεcv /dt
Deviatoric creep strain: εcd
Deviatoric creep rate: cdε& = dεcd /dt
Deviatoric creep is developed after a change in deviatoric stress at constant average stress, while volumetric creep rate is caused by a change only in average stress. Only deviatoric creep is considered in the creep model (see Chapter 1).
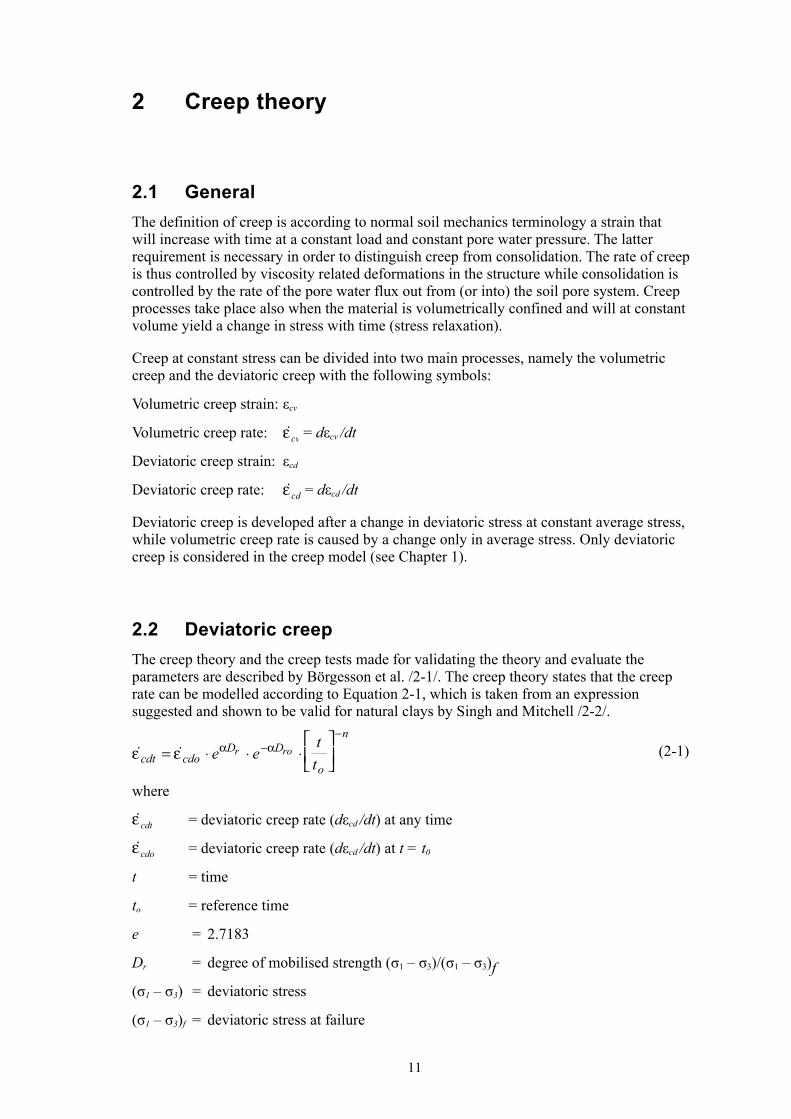
2.2 DeviatoriccreepThe creep theory and the creep tests made for validating the theory and evaluate the parameters are described by Börgesson et al. /2-1/. The creep theory states that the creep rate can be modelled according to Equation 2-1, which is taken from an expression suggested and shown to be valid for natural clays by Singh and Mitchell /2-2/.
& &ε ε α αcdt cdo
D D
o
n
e et
tr ro= ⋅ ⋅ ⋅
−
− (2-1)
where
cdtε& = deviatoric creep rate (dεcd /dt) at any time
cdoε& = deviatoric creep rate (dεcd /dt) at t = t0
t = time
to = reference time
e = 2.7183
Dr = degree of mobilised strength (σ1 – σ3)/(σ1 – σ3)f
(σ1 – σ3) = deviatoric stress
(σ1 – σ3)f = deviatoric stress at failure

12
Dro = reference degree of mobilised strength (σ1 – σ3)o/(σ1 – σ3)fα = inclination of the relation between cdoε& and Dr plotted in a semi-logarithmic diagram
n = inclination of the relation between and t plotted in a double-logarithmic diagram
The reference parameters are
tr = 10,000 s
Dro = 0.5
The validity of Equation 2-1 rests on two observations. The first one is that the relation between cdoε& and Dr is a straight line in a semi-logarithmic diagram. As indicated in Figure 2-1 this is not true for low values of Dr and of course not for Dr = 0. It is neither true for high values of Dr. and of course not for Dr = 1. Instead the relation shown in Figure 2-1 is used. The second observation is that the relation between cdtε& and t is a straight line in a double-logarithmic diagram. Figure 2-2 shows an example of measurements that confirm this for MX-80. See also Börgesson et al. /2-1/.
0.1<Dr<0.9
The following values were found for Equation 2-1 and the reference parameters:
cdoε& = 4.4×10⁻⁸ 1/s
α = 4.15
n = 0.91
Equation 2-1 is thus only valid for 0.1 < Dr < 0.9 and another relation is required outside this range.
Dr<0.1
Figure 2-1. Measured relation between creep rate cdtε& and degree of mobilised strength Dr for MX-80 at different densities (left) and used in the model (right).

1�
The following equation based on Figure 2-1 and Equation 2-1 is proposed:
&ε cdt ra
o
n
A Dt
t= ⋅ ⋅
−
(2-2)
with the following parameters
to = 10,000 s
n = 0.91
A = 8.0×10⁻⁸ 1/s
a = 1.0
Dr>0.9
The following Equation based on Figure 2-1 and Equation 2-1 is proposed:
[ ]&ε cdt rb
o
n
B Dt
t= ⋅ − ⋅
−
−
1 (2-3)
with the following parameters
to = 10,000 s
n = 0.91
B = 2.3×10⁻⁸ 1/s
b = 1.0
Figure 2-2. Example of measured creep rate of a sample of MX-80 as a function of time. ρm = 1.99 t/m3, σ3 = 4.83 Mpa, ui = 0.75 Mpa, Dr = 0.40.

1�
2.3 ABAQUSapplicationThe creep theory has been implemented in ABAQUS. Since the theory according to Equations 2-1 to 2-3 is derived in two dimensions it assumes that the intermediate principle stress σ2 is equal to the minimum principle stress σ3, which is the case for the triaxial tests. In the 3D space, which is treated by ABAQUS, σ2 usually differs from the two other principle stresses. The deviatoric stress D is more generally expressed with von Mises stress q that takes the intermediate principal stress into account according to Equation 2-4.
q = (((σ1 – σ3)2 + (σ1 – σ2)2 + (σ2 – σ3)2)/2)1/2 (2-4)
If σ2 = σ3 Mises stress will be equal to the deviatoric stress (q = D)
In ABAQUS the degree mobilized deviatoric strength Dr is exchanged for the degree of mobilized Mises strength Qr.
Qr = q/qf
where
q = actual Mises stress
qf = Mises stress at failure

1�
3 Finiteelementcodeandfiniteelementmodels
3.1 GeneralThe finite element code ABAQUS was used for the calculations. ABAQUS contains a capability of modelling a large range of processes in many different materials as well as complicated three-dimensional geometries.
The code includes special material models for rock and soil and ability to model geological formations with infinite boundaries and in situ stresses by e.g. the own weight of the medium. It also includes capability to make substructures with completely different finite element meshes and mesh density without connecting all nodes. Detailed information of the available models, application of the code and the theoretical background is given in the ABAQUS Manuals /3-1/. An overview of how ABAQUS handles the THM-processes for buffer and backfill materials is given in other SKB reports (see e.g. /2-1/ and /3-2/).
The creep subroutine according to Equations 2-1 and 2-2 has been coded and verified. For the swelling and consolidation processes ABAQUS Standard has been used.
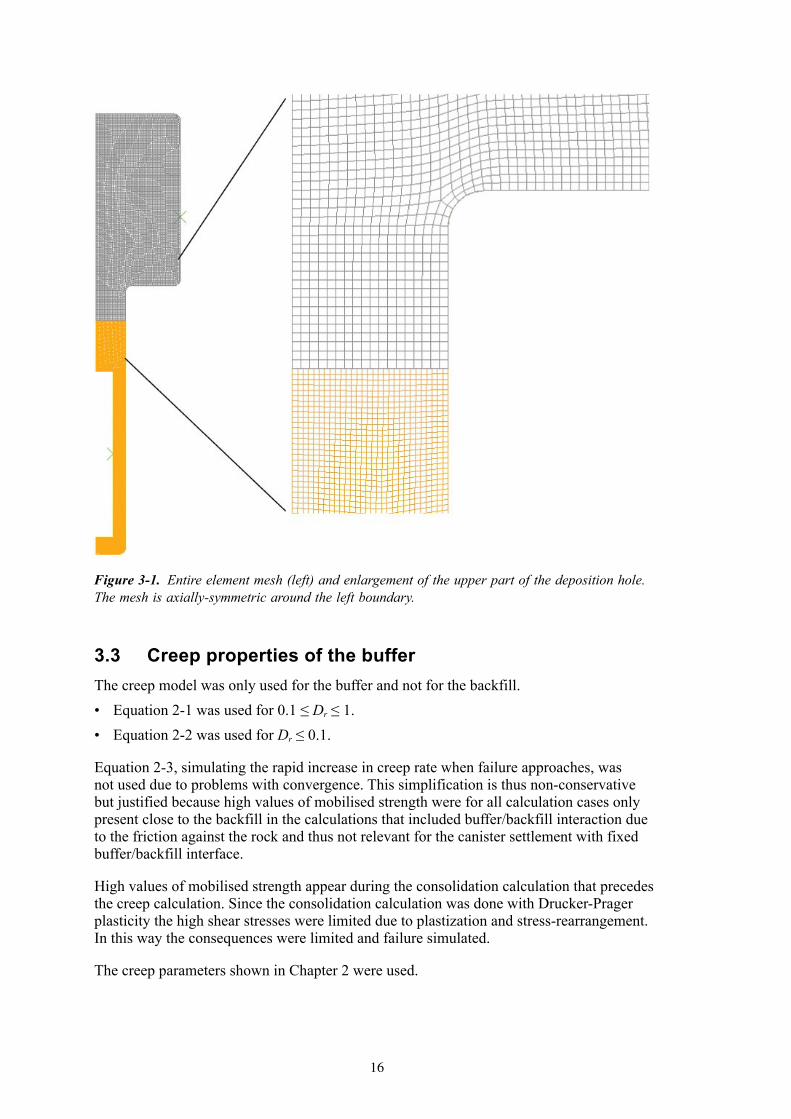
3.2 ElementmeshThe element mesh of the deposition hole is shown in Figure 3-1. The mesh is axial symmetric around the vertical centre line of the deposition hole. The elements in the buffer are about 3×3 cm2 and in the backfill about 5×5 cm2. The approximate number of elements in the buffer are 4,300 and in the backfill 5,000.
Contact elements were applied at the rock surface in some calculations.
1�
3.3 CreeppropertiesofthebufferThe creep model was only used for the buffer and not for the backfill. • Equation 2-1 was used for 0.1 ≤ Dr ≤ 1.• Equation 2-2 was used for Dr ≤ 0.1.
Equation 2-3, simulating the rapid increase in creep rate when failure approaches, was not used due to problems with convergence. This simplification is thus non-conservative but justified because high values of mobilised strength were for all calculation cases only present close to the backfill in the calculations that included buffer/backfill interaction due to the friction against the rock and thus not relevant for the canister settlement with fixed buffer/backfill interface.
High values of mobilised strength appear during the consolidation calculation that precedes the creep calculation. Since the consolidation calculation was done with Drucker-Prager plasticity the high shear stresses were limited due to plastization and stress-rearrangement. In this way the consequences were limited and failure simulated.
The creep parameters shown in Chapter 2 were used.
Figure 3-1. Entire element mesh (left) and enlargement of the upper part of the deposition hole. The mesh is axially-symmetric around the left boundary.

1�
3.4 MechanicalpropertiesofthebufferandbackfillEach creep calculation was preceded by a consolidation calculation were the mechanical response of the weight of the canister and in some calculations the upwards swelling of the buffer were considered.
Buffer
The mechanical properties of the buffer controlling the consolidation phase preceding the creep are based on the models and properties derived for MX-80 by Börgesson et al. /2-1/.
The porous Elastic Model implies a logarithmic relation between the void ratio e and the average effective stress p according to Equation 3-1.
∆e = κ∆lnp (3-1)
where κ = porous bulk modulus
Poisson’s ratio ν is also required.
Drucker prager plasticity model contains the following parameters:
β = friction angle in the p-q plane
d = cohesion in the p-q plane
ψ = dilation angle
q = f(εdpl) = yield function
The yield function is the relation between Mises stress q and the plastic deviatoric strain εdp
at a specified stress path. The dilation angle determines the volume change during shear.
The following data has been derived and used for the porous Elastic model (valid for e < 1.5):
κ = 0.21
ν = 0.4
The following data has been derived for the Drucker prager plasticity model
β = 16°
d = 100 kPa
ψ = 2°
The mentioned properties are the basic properties of the buffer. However, these properties were not used during the creep calculations since the Drucker Prager model and Porous Elastic cannot be combined with the creep routine. Instead a linear elastic model was used in the creep calculations with elasticity adapted to the Porous Elastic behaviour at the specified swelling pressure. Since a number of calculations were done with different initial swelling pressure the properties had to be changed and adapted to the stress level at each calculation. The data are shown in connection with presentation of the respective calculation.

18
Backfill
The backfill was considered linear elastic with the following properties:
E = 30 MPa
v = 0.3
3.5 CanisterandrockpropertiesThe canister was modelled as a rigid body with the weight 200 kN, which corresponds to the weight under water since hydrostatic water pressure was not included.
The rock was modelled as a rigid surface. Surface elements were applied at the rock surface between the rock and the buffer and the rock and the backfill.
3.6 PropertiesofsurfaceelementsThe interface between the rock and the buffer and the rock and the backfill was modelled with surface elements. These elements define a surface that 1. has friction, 2. prevents movements perpendicular to the surface past the surface,3. allows movements from the surface (lost contact).
The following friction angles have been used for the surface elements• Rock/buffer interface: φ = 10°• Rock/backfill interface: φ = 30°
Table5-5. Yieldfunction.
q
(kPa)
εpl
1 0
50 0.005
100 0.02
150 0.04
200 0.1
1�
4 Calculations
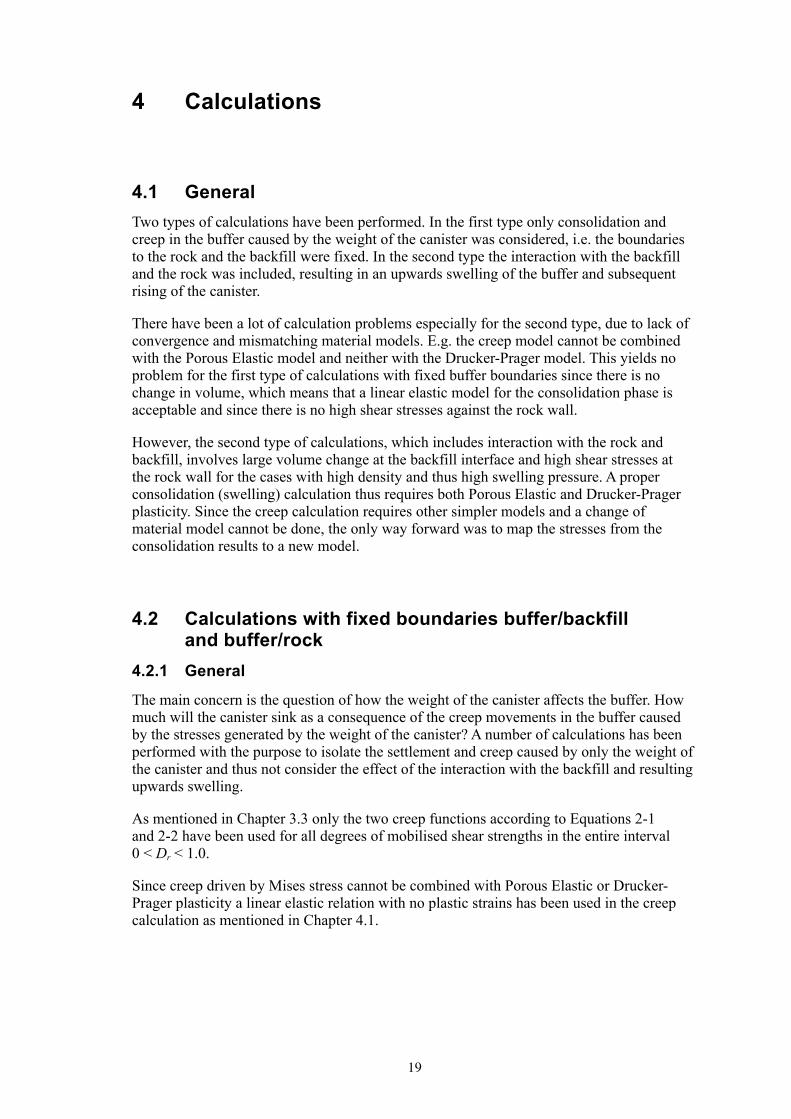
4.1 GeneralTwo types of calculations have been performed. In the first type only consolidation and creep in the buffer caused by the weight of the canister was considered, i.e. the boundaries to the rock and the backfill were fixed. In the second type the interaction with the backfill and the rock was included, resulting in an upwards swelling of the buffer and subsequent rising of the canister.
There have been a lot of calculation problems especially for the second type, due to lack of convergence and mismatching material models. E.g. the creep model cannot be combined with the Porous Elastic model and neither with the Drucker-Prager model. This yields no problem for the first type of calculations with fixed buffer boundaries since there is no change in volume, which means that a linear elastic model for the consolidation phase is acceptable and since there is no high shear stresses against the rock wall.
However, the second type of calculations, which includes interaction with the rock and backfill, involves large volume change at the backfill interface and high shear stresses at the rock wall for the cases with high density and thus high swelling pressure. A proper consolidation (swelling) calculation thus requires both Porous Elastic and Drucker-Prager plasticity. Since the creep calculation requires other simpler models and a change of material model cannot be done, the only way forward was to map the stresses from the consolidation results to a new model.
4.2 Calculationswithfixedboundariesbuffer/backfillandbuffer/rock
4.2.1 General
The main concern is the question of how the weight of the canister affects the buffer. How much will the canister sink as a consequence of the creep movements in the buffer caused by the stresses generated by the weight of the canister? A number of calculations has been performed with the purpose to isolate the settlement and creep caused by only the weight of the canister and thus not consider the effect of the interaction with the backfill and resulting upwards swelling.
As mentioned in Chapter 3.3 only the two creep functions according to Equations 2-1 and 2-2 have been used for all degrees of mobilised shear strengths in the entire interval 0 < Dr < 1.0.
Since creep driven by Mises stress cannot be combined with Porous Elastic or Drucker-Prager plasticity a linear elastic relation with no plastic strains has been used in the creep calculation as mentioned in Chapter 4.1.

20
4.2.2 Scopeandspecificationofthecalculations
The main determinant of the creep rate is the magnitude of the degree of mobilised shear strength. However, the shear strength decreases with decreasing swelling pressure. In order to study the sensitivity of the canister displacement to changes in properties of the buffer eight calculations with different assumed swelling pressure of the buffer have been performed. The swelling pressure has been varied from 7,000 kPa down to 80 kPa.
By changing the other properties (mainly the stiffness) of the buffer accordingly the variation simulates a change in density at saturation of the buffer from ρ = 2,000 kg/m3 (swelling pressure 7,000 kPa) to ρ = 1,500 kg/m3 (swelling pressure 80 kPa) at non-saline conditions.
The following properties are thus required at each density for these calculations:• Swelling pressure.• Deviator (Mises) stress at failure.• Modulus of elasticity.
The other properties are the same as given in Chapters 2 and 3.
The relation between swellingpressureandfailurestress is taken from Figure 4-1 /2-1/. The relation can be expressed according to Equation 4-1.
bf ppqq )/( 00= (4-1)
where
p = average stress (swelling pressure)
p0 = reference average stress (swelling pressure)
qf = deviator (Mises) stress at failure
q0 = reference deviator (Mises) stress at p0
b = constant
For MX-80 at non-saline condition:
p0 = 1,000 kPa
q0 = 500 kPa
b = 0.77
which yields
77.045.2 pq f = (4-2)
21
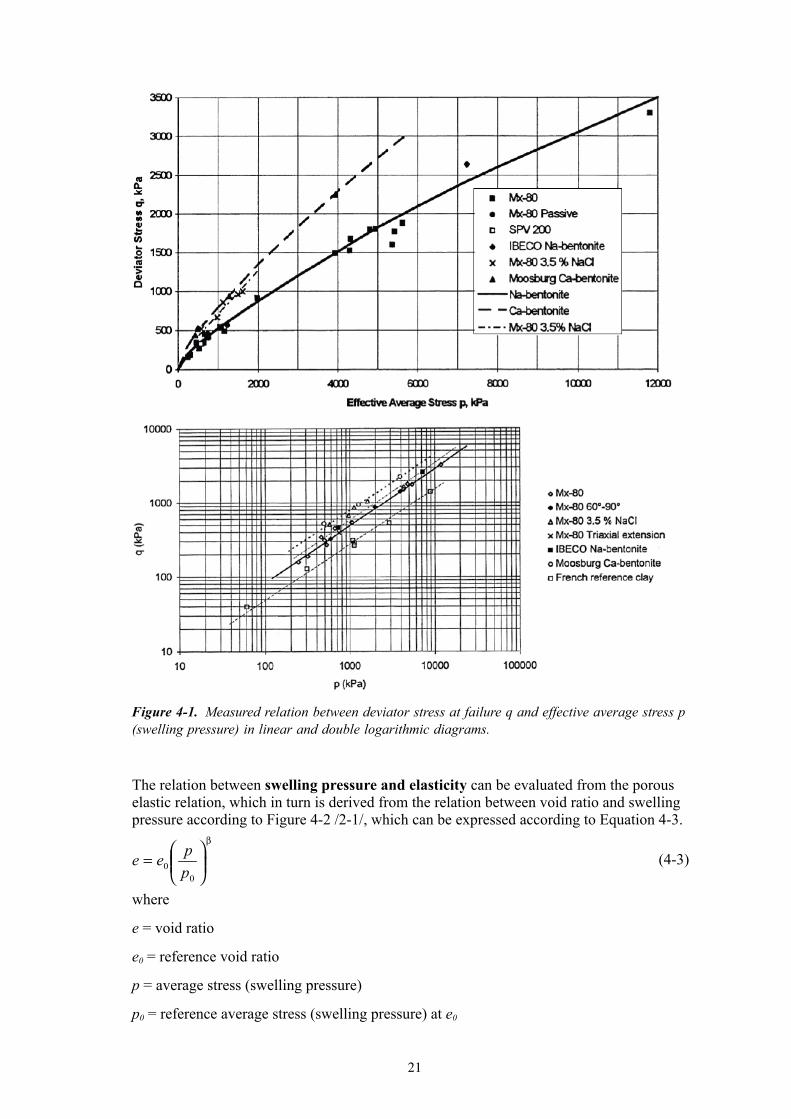
Figure 4-1. Measured relation between deviator stress at failure q and effective average stress p (swelling pressure) in linear and double logarithmic diagrams.
The relation between swellingpressureandelasticity can be evaluated from the porous elastic relation, which in turn is derived from the relation between void ratio and swelling pressure according to Figure 4-2 /2-1/, which can be expressed according to Equation 4-3.
β
=
00 p
pee (4-3)
where
e = void ratio
e0 = reference void ratio
p = average stress (swelling pressure)
p0 = reference average stress (swelling pressure) at e0

22
According to Figure 4-2 the parameter values for MX-80 at non-saline condition and e < 1.5 are
p0 = 1,000 kPa
e0 = 1.1
β = –0.19
which yields
e = 4.09×p–0.19 (4-4)
Equation 4-3 can be transformed to an E-modulus, which is a function of the swelling pressure according to Equations 4-5 to 4-8.
Derivation of Equation 4-4 yields
( ) ( ) 1
0
0/ −= ββ p
pedpde (4-5)
Figure 4-2. Measured relation between swelling pressure and void ratio.
0.1
1
10
10 100 1,000 10,000 100,000
Pressure, kPa
Mx-80 Na-mont.
Mx-80 + 3.5% NaCl
Moosburg Ca
IBECO Ca
Void
ratio

2�
A change in void ratio can be expressed as a change in volumetric strain εv according Equation 4-6.
01 ee
v +∆=ε (4-6)
which yields
( ) ( ) ( ) Kppe
edpd v /11
/ 1
00
0 =⋅+
= −ββε (4-7)
where
K = compression modulus
The relation between K and E is
KE )21(3 ν−= (4-8)
Table 4-1 shows derived data that needs to be used in the different calculations using Equation 4-2 for calculating the deviator stress at failure and Equations 4-7 and 4-8 for calculating the E-modulus.
Table4-1. MisesstressatfailureandYoung’smodulusasfunctionsoftheswellingpressurederivedaccordingtoEquations4-2,4-7and4-8.
CalculationNo
Voidratioe
Densityatsaturationρm(kg/m3)
Swellingpressurep(kPa)
Misesstressatfailureqf(kPa)
Young’smodulusE(kPa)
1 (base case) 0.76 2,010 7,000 2,238 33,000
2 0.87 1,950 3,500 1,312 16,500
3 0.99 1,890 1,750 770 8,250
4 1.13 1,840 875 451 4,125
5 1.29 1,780 438 265 2,063
6 1.47 1,720 219 155 1,031
7 1.59 (1.8)1) 1,690 (1,640)1) 160 122 7512)
8 1.88 (2.8)1) 1,620 (1,470)1) 80 72 3762)
1) Actual values of void ratio and density at saturation since e > 1.5. 2) Overestimated since e > 1.5.
4.2.3 Calculationsequence
The calculation is divided into the following six main steps:1. Establishment of initial conditions in the structure. The reference node for the canister is
fixed with all nodes locked. No friction is applied between the buffer or backfill and the rock.
2. Friction between the buffer or backfill and the rock is activated. Release of the vertical displacement of the reference node of the canister.
2�
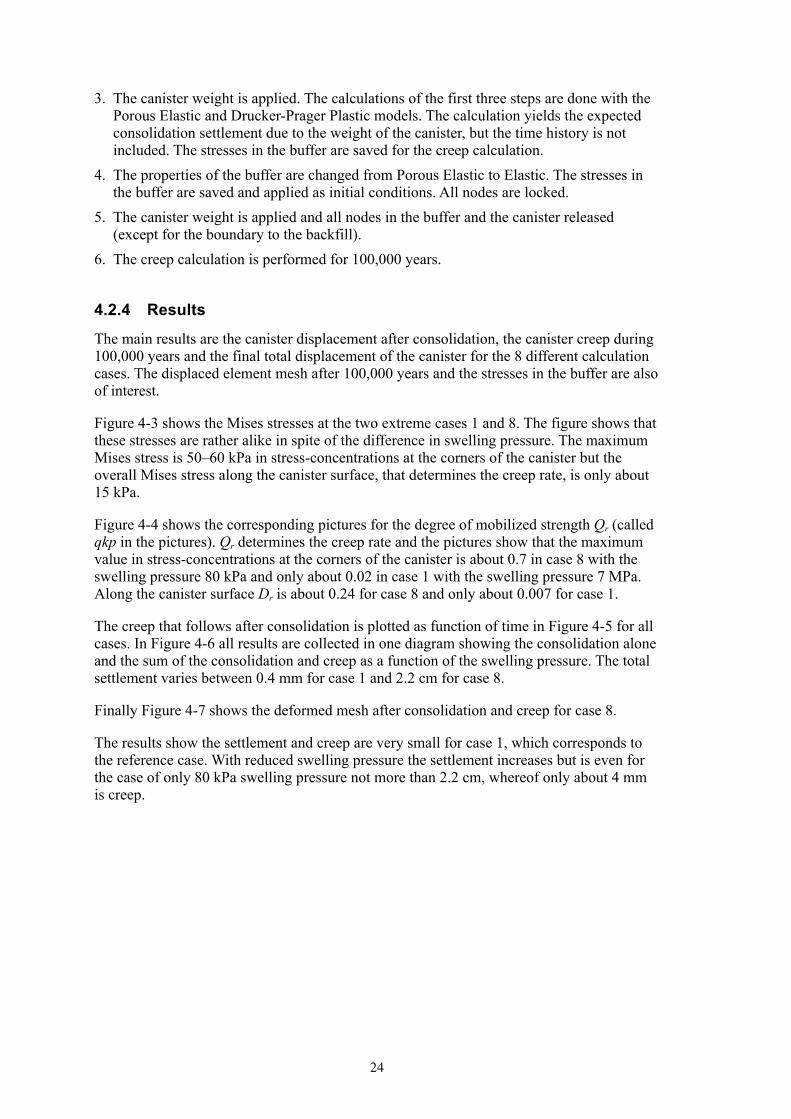
3. The canister weight is applied. The calculations of the first three steps are done with the Porous Elastic and Drucker-Prager Plastic models. The calculation yields the expected consolidation settlement due to the weight of the canister, but the time history is not included. The stresses in the buffer are saved for the creep calculation.
4. The properties of the buffer are changed from Porous Elastic to Elastic. The stresses in the buffer are saved and applied as initial conditions. All nodes are locked.
5. The canister weight is applied and all nodes in the buffer and the canister released (except for the boundary to the backfill).
6. The creep calculation is performed for 100,000 years.
4.2.4 Results
The main results are the canister displacement after consolidation, the canister creep during 100,000 years and the final total displacement of the canister for the 8 different calculation cases. The displaced element mesh after 100,000 years and the stresses in the buffer are also of interest.
Figure 4-3 shows the Mises stresses at the two extreme cases 1 and 8. The figure shows that these stresses are rather alike in spite of the difference in swelling pressure. The maximum Mises stress is 50–60 kPa in stress-concentrations at the corners of the canister but the overall Mises stress along the canister surface, that determines the creep rate, is only about 15 kPa.
Figure 4-4 shows the corresponding pictures for the degree of mobilized strength Qr (called qkp in the pictures). Qr determines the creep rate and the pictures show that the maximum value in stress-concentrations at the corners of the canister is about 0.7 in case 8 with the swelling pressure 80 kPa and only about 0.02 in case 1 with the swelling pressure 7 MPa. Along the canister surface Dr is about 0.24 for case 8 and only about 0.007 for case 1.
The creep that follows after consolidation is plotted as function of time in Figure 4-5 for all cases. In Figure 4-6 all results are collected in one diagram showing the consolidation alone and the sum of the consolidation and creep as a function of the swelling pressure. The total settlement varies between 0.4 mm for case 1 and 2.2 cm for case 8.
Finally Figure 4-7 shows the deformed mesh after consolidation and creep for case 8.
The results show the settlement and creep are very small for case 1, which corresponds to the reference case. With reduced swelling pressure the settlement increases but is even for the case of only 80 kPa swelling pressure not more than 2.2 cm, whereof only about 4 mm is creep.

2�
Left figure: Mises stress at σs=7 MPa
Scale (kPa)
Right figure: Mises stress at σs=7 MPa
Scale (kPa)
Figure 4-3. Mises stresses in the buffer after 100,000 years creep in case 1 (σs = 7 Mpa) to the left and in case 8 (σs = 80 kpa) to the right. No backfill.

2�
Figure 4-4. Degree of mobilized strength Qr in the buffer after 100,000 years creep in case 1 (σs = 7 Mpa) and in case 8 (σs = 80 kpa). No backfill. Observe the difference in scale.
Scale
Scale
Left figure: Qr at σs=7 MPa
Right figure:Qr at σs=80 kPa

2�
Figure 4-5. Canister creep as a function of time for all 8 cases in linear and double logarithmic diagrams, with case 1 yielding the smallest creep (red line) and case 8 the largest (blue line). No backfill.
Figure 4-6. Canister settlement for all cases with no backfill. Red line: only consolidation. Green line: consolidation + creep for 100,000 years.

28
4.3 Calculationsthatincludebuffer/backfillinteraction4.3.1 General
If the swelling pressure of the buffer is higher than the swelling pressure of the backfill there will be an upwards swelling of the buffer and corresponding compression of the backfill. In order to have full understanding of the canister displacements this process must be included although it means that the canister will rise instead of sink for some of the cases.
These calculations have been more complicated due to the strong interaction with the backfill and the rock surface.
Also for these calculations only the creep models according to Equations 2-1 and 2-2 have been used, which is non-conservative for the high stresses between the rock and the buffer close to the backfill in some cases since the creep rate is underestimated. However, the effect on the creep of the canister is insignificant as concluded in Chapter 3.3.
Figure 4-7. Deformed mesh for case 8 after 2.2 cm total settlement. The green contour line indicates the original position of the canister. No backfill.

2�
4.3.2 Scopeandspecificationofthecalculations
The same material models have been used as in the calculations with fixed boundaries. These models are described in Chapter 3 and Section 4.2.2. The set of calculations and material properties described in Table 4-1 have also been used for these calculations i.e. the swelling pressure has been varied from 7 MPa to 80 kPa.
The differences between the calculations that include the interaction with the backfill and the rock and the calculations that don’t are that the nodes between the buffer and the backfill have been released and allowed to move and the contact elements at the rock surface have been activated.
4.3.3 Results
The results of most of the 8 calculations that include the backfill differ significantly from the results with locked boundary between buffer and backfill due to the strong interaction between the buffer and the backfill at least for the calculations with high swelling pressure in the buffer. The results will be illustrated with the results from the base case (that is the case with 7 MPa swelling pressure of the buffer) followed by comparison with the results of the other 7 cases.
Base case
Figure 4-8 shows two displacement plots of the base case. One refers to the vertical displacements caused by only the creep, showing that the maximum creep displacement takes place in the buffer between the canister and the backfill and is 1.4 cm upwards. The canister moves ~ 2 mm upwards by the creep. The other plot refers to the total displacement or the sum of the consolidation and creep, showing that the maximum total displacement takes place at the interface between the buffer and the backfill and is 10.7 cm upwards. The total canister displacement is too small to be observed in this scale.
Figure 4-9 shows the creep heave of the canister as a function of time.
The heave of the canister from the different phases is the following:
Heave from only swelling: 2.7 mm
Heave from only creep: 2.0 mm
Total heave (swelling + creep): 4.7 mm
The canister displacement during the creep phase, shown in Figure 4-9, is overestimated, since the creep in the calculation starts at the time 1 second and the creep is about 0.5 mm after 105 seconds. Since the values used for the shear strength and Young’s modulus are based on tests with duration of between 1 and 10 days this creep is already included in the consolidation model and the calculated creep should actually start after that time. However, since this overestimation is conservative (yields too large creep deformation) and the actual start point is not well defined the results have not been corrected.
The effect of the upwards swelling is much stronger in the consolidation phase than in the creep phase and the upwards movement of the buffer/backfill interface dominates the behaviour over the influence of the weight of the canister.
Figure 4-10 shows the heave of the interface between the buffer and the backfill and the creep displacement of the interface. The difference in total heave and creep in the different parts of the interface is caused by the friction against the rock surface.

�0
Figure 4-8. plots of the vertical displacements (m) upwards in the base case caused by only the creep (left) and the total displacements. Observe the difference in scale.
Vertical displacements
Left figure:Creep displacements
Scale (m)
Scale (m):
Right figure:Total displacements (cons. + creep)

�1
Figure 4-9. Creep displacement of the canister as a function of time for the reference case plotted both in linear and logarithmic scale.
Figure 4-10. Deformed element mesh after swelling and creep (black contour) and the creep deformation U2 (m) of three points on the buffer/backfill interface as a function of time (s).
�2
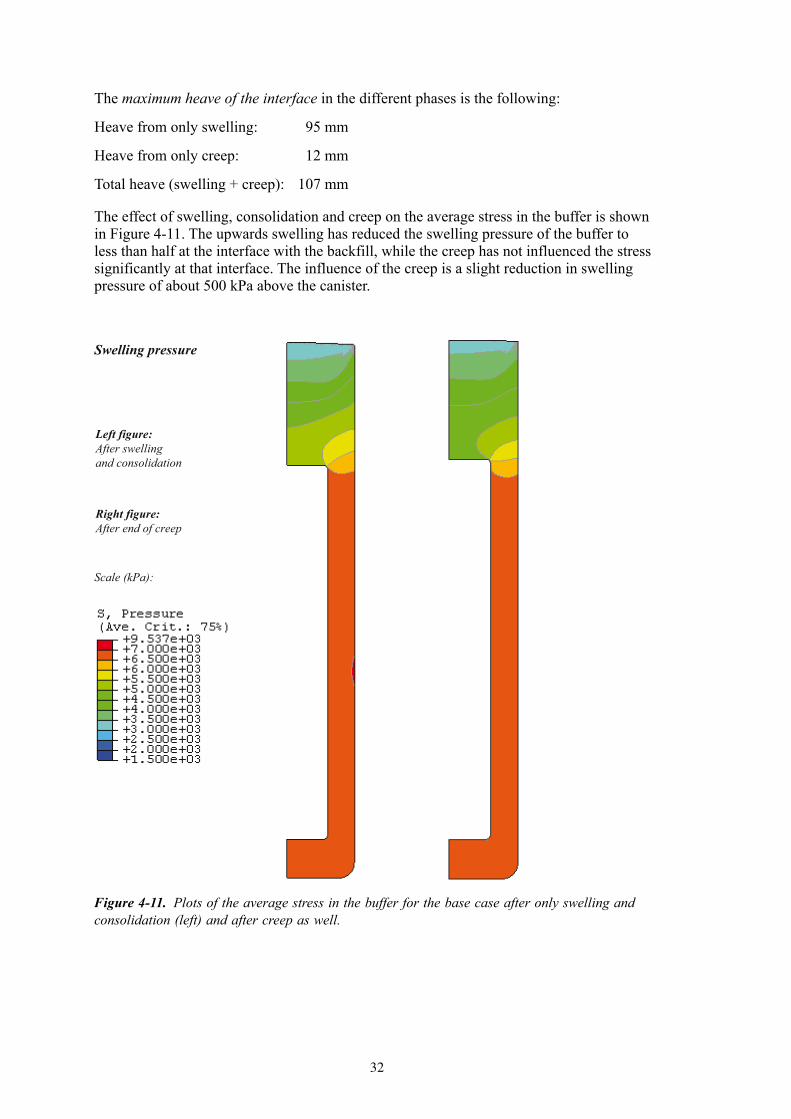
The maximum heave of the interface in the different phases is the following:
Heave from only swelling: 95 mm
Heave from only creep: 12 mm
Total heave (swelling + creep): 107 mm
The effect of swelling, consolidation and creep on the average stress in the buffer is shown in Figure 4-11. The upwards swelling has reduced the swelling pressure of the buffer to less than half at the interface with the backfill, while the creep has not influenced the stress significantly at that interface. The influence of the creep is a slight reduction in swelling pressure of about 500 kPa above the canister.
Figure 4-11. plots of the average stress in the buffer for the base case after only swelling and consolidation (left) and after creep as well.
Swelling pressure
Scale (kPa):
Left figure:After swelling and consolidation
Right figure: After end of creep

��
Influence of a reduction in swelling pressure
The magnitude of the swelling pressure has a strong influence on both the canister displace-ment and the displacement of the buffer/backfill interface.
The same contour plots of the displacement of the buffer that were shown for the base case in Figure 4-8 are shown for case 8 (the lowest swelling pressure) in Figure 4-12. The low swelling pressure means that both the canister and the interface are sinking.
The total maximum sinking of the buffer/backfill interface for case 8 and is about 6 mm.
The sinking of the canister from the different phases of case 8 is the following:
Canister sinking from only swelling and consolidation: 26 mm
Canister sinking from only creep: 3 mm
Total canister sinking: 29 mm
The canister creep as a function of time is shown in Figure 4-13 for all cases. The figure shows e.g. that the creep implies heave for cases 1 and 2 and (slightly) for case 3 (p > 1,700 kPa) and sinking for the other cases (p < 1,700 kPa).
The swelling pressure after consolidation and creep is shown in Figure 4-14 for cases 4 and 8. For case 8 the behaviour is different to the behaviour in case 1 since the pressure is increased below the canister and in the contact zone at the backfill while case 4 behaves more like case 1 with a reduced pressure with increased vertical distance from the canister above the canister. The reason is of course that the swelling pressure is higher in the backfill than in the buffer for case 8.
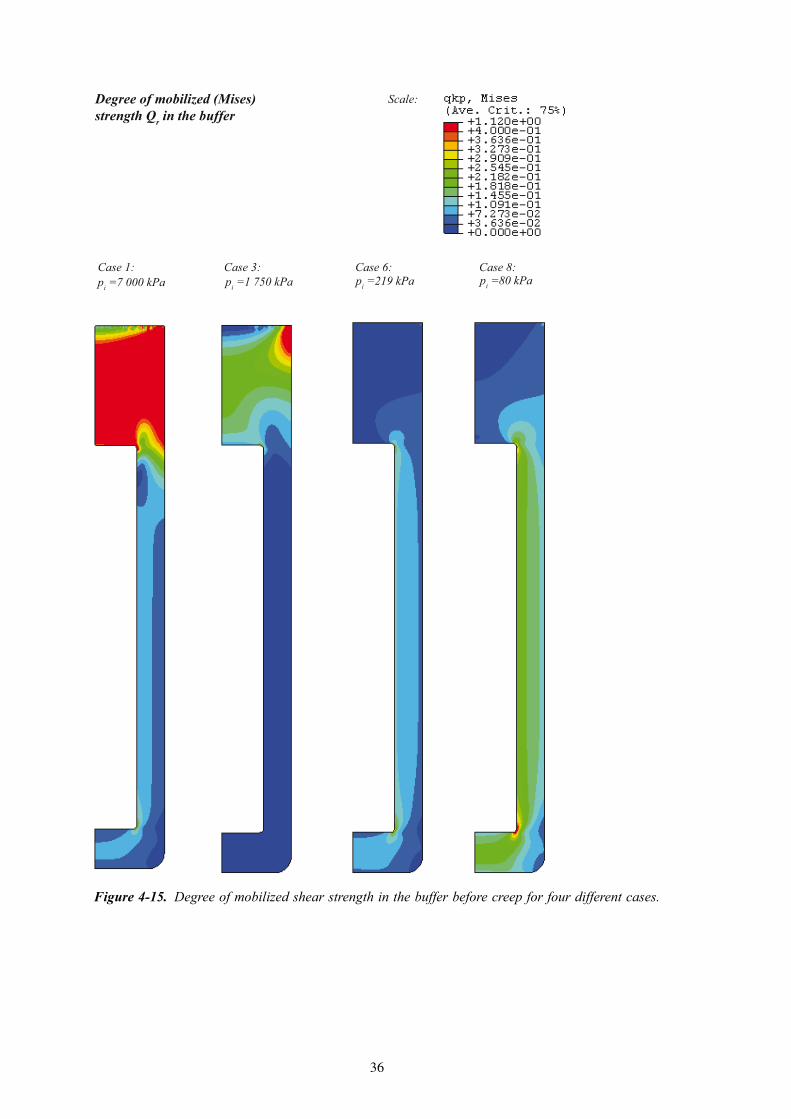
The creep rate is governed by the degree of mobilized strength Qr. Figure 4-15 shows a comparison of Qr for some cases. In case 1 with the high swelling pressure the mobilized strength is rather high (> 0.4) in almost the entire buffer above the canister due to the strong upwards swelling of the buffer. Along the canister surface Qr is slightly higher than 0.1. In case 3 Qr is much lower above the canister and also much lower along the canister surface (< 0.03) than in case 1. The reason for this reduction in mobilized strength with reduced swelling pressure is of course the reduced upwards swelling of the buffer.
As illustrated by cases 6 and 8 the mobilized strength is very low above the canister while it increases with decreasing swelling pressure along the canister, where Qr is about 0.1 for case 6 and about 0.2 for case 8. The reason for that Qr increases again with decreasing swelling pressure is the influence of the weight of the canister that dominates for these low swelling pressures. Rather high values are also noted close to the corners of the canister lids for case 8.
Figure 4-16 shows the relaxation of the stresses, expressed as mobilized strength, which takes place due to the creep. For the reference case the relaxation is rather strong above the canister where the mobilized strength is high while it is insignificant in the other parts. For the extreme case 8 the relaxation is small everywhere.

��
Figure 4-12. plots of the vertical displacements in case 8 (p = 80 kpa) caused by only the creep (left) and the total displacements. Observe the difference in scale. Negative values imply sinking.
Vertical displacements
Left figure:
Scale (m)
Right figure:Total displacements (cons. + creep)
Scale (m):
Creep displacements

��
Figure 4-13. Creep displacement of the canister as a function of time for all cases. plotted both in linear and logarithmic scale. Visco1 refers to case 1 etc.
Figure 4-14. plots of the average stress in the buffer after consolidation and creep for cases 8 and 4. Observe the difference in scale.
Left figure:Case 8 (p=80 kPa)
Scale (kPa)
Scale (kPa):
Right figure: Case 4 (p=875 kPa
Swelling pressure
��
Case 1: Case 3: Case 6: Case 8:
Degree of mobilized (Mises) strength Qr in the buffer
Scale:
pi =7 000 kPa pi =1 750 kPa pi =219 kPa pi =80 kPa
Figure 4-15. Degree of mobilized shear strength in the buffer before creep for four different cases.

��
Figure 4-16. Relaxation of the shear stress after 100,000 years creep. The degree of mobilized shear strength is shown before and after creep for two cases.
Degree of mobilized shear strength in the buffer
Case 1: Before creep
Case 1: After creep
Case 8:Before creep
Case 8:After creep
Scale:
pi =7 000 kPa pi =7 000 kPa pi =80 kPa pi =80 kPa
�8
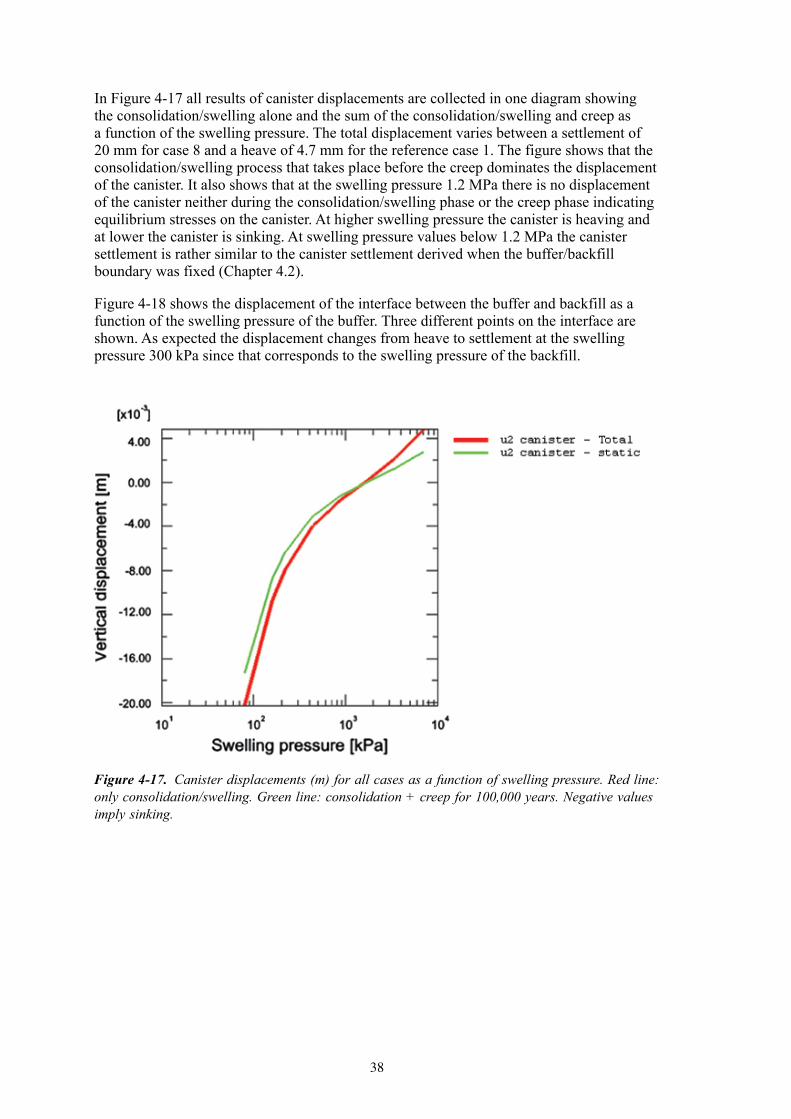
In Figure 4-17 all results of canister displacements are collected in one diagram showing the consolidation/swelling alone and the sum of the consolidation/swelling and creep as a function of the swelling pressure. The total displacement varies between a settlement of 20 mm for case 8 and a heave of 4.7 mm for the reference case 1. The figure shows that the consolidation/swelling process that takes place before the creep dominates the displacement of the canister. It also shows that at the swelling pressure 1.2 MPa there is no displacement of the canister neither during the consolidation/swelling phase or the creep phase indicating equilibrium stresses on the canister. At higher swelling pressure the canister is heaving and at lower the canister is sinking. At swelling pressure values below 1.2 MPa the canister settlement is rather similar to the canister settlement derived when the buffer/backfill boundary was fixed (Chapter 4.2).
Figure 4-18 shows the displacement of the interface between the buffer and backfill as a function of the swelling pressure of the buffer. Three different points on the interface are shown. As expected the displacement changes from heave to settlement at the swelling pressure 300 kPa since that corresponds to the swelling pressure of the backfill.
Figure 4-17. Canister displacements (m) for all cases as a function of swelling pressure. Red line: only consolidation/swelling. Green line: consolidation + creep for 100,000 years. Negative values imply sinking.

��
Figure 4-18. Vertical displacement of the buffer-backfill interface as a function of the swelling pressure of the buffer.

�1
5 Analysesandconclusions
The displacement of the canister in the KBS-3V concept has been studied in a number of consolidation and creep calculations. In one set of calculations only the consolidation and creep in the buffer without considering the interaction with the backfill was studied. In the other set of calculations the interaction with the backfill was included for a backfill consisting of an in situ compacted mixture of 30% bentonite and 70% crushed rock. The motivation to also study the behaviour of the buffer alone was that the final choice of backfill material and backfilling technique is not made yet so that set of calculations simulates a backfill that has identical properties with the buffer. The two cases thus represent two extreme cases, one with a backfill that has a low stiffness and the lowest allowable swelling pressure and one that has the highest possible swelling pressure and stiffness.
The base cases in the calculations correspond to the final average density at saturation of 2,000 kg/m3 with the expected swelling pressure 7 MPa in a buffer. In order to study the sensitivity of the system to loss in bentonite mass and swelling pressure seven additional calculations were done with reduced swelling pressure down to 80 kPa corresponding to a density at water saturation of about 1,500 kg/m3.
The calculations included two stages, where the first stage models the swelling and consoli-dation that takes place in order for the buffer to reach force equilibrium. This stage takes place during the saturation phase and the subsequent consolidation/swelling phase. The second stage models the deviatoric creep in the buffer during 100,000 years.
The volumetric creep is not modelled, which thus may cause a slight underestimation of the canister displacement. The motive for excluding volumetric creep is that a canister settlement caused by volumetric creep will not change the total mass of bentonite under the canister but will only increase the density and is thus not judged to be a problem. Moreover, the volumetric creep is of the same order of magnitude as the deviatoric, which means that the canister displacement caused by this creep will be as insignificant as the deviatoric creep.
The creep model in Equation 2-1 is based on a model presented by Singh and Mitchell /2-2/. A large number of creep tests have shown that this model is valid also for bentonite and these tests have been used for evaluating the parameters in the model /2-1/. A problem is that the laboratory tests can only be run for a limited time and the validity for 100,000 years cannot be proven.
The sensitivity of the creep has been investigated by reducing the swelling pressure and study the effect on the total creep displacement of the canister. The expected initial swelling pressure 7,000 kPa has in this study been reduced stepwise to 80 kPa, which thus corresponds to a loss in final density at saturation from 2,000 kg/m3 to 1,500 kg/m3. As shown in Figures 4-6 and 4-17 the canister settlement is very small even at low swelling pressure and density. The base case corresponding to the expected final swelling pressure of the buffer 7,000 kPa yields a total settlement of the canister of only 0.35 mm for the fixed boundary case, while there is a heave of the canister of about 4.5 mm at the other case with 30/70 backfill due to the upwards swelling of the buffer. At reduced swelling pressure the settlement increases but is not more than about 23 mm at the very low swelling pressure 80 kPa for both cases.

�2
Another phenomenon that may affect the buffer is a reduction in strength or friction angle with time, which affects the critical creep parameter Dr or Qr (degree of mobilized shear strength). A reduced friction angle will reduce the strength and thus affect the degree of mobilized strength in a similar way as a reduced swelling pressure. So the reduction in shear strength can also be considered a reduction in friction angle with retained initial density and swelling pressure. At the swelling pressure 80 kPa the deviatoric stress at failure is only 70 kPa according to Figure 4-1 and Equation 4-2. Such a low strength at the swelling pressure 7,000 kPa corresponds to a friction angle of only 0.29°, which shows that not even a strong reduction in friction angle is a threat to the container integrity. The results of the calculations with fixed backfill boundary and the corresponding friction angle at retained initial swelling pressure are summarized in Table 5-1.
The canister settlement also includes the consolidation settlement, which takes into account that the compressibility increases when the swelling pressure decreases while a reduced friction angle with time with retained swelling pressure will not have an increased compressibility. The settlements at the presented friction angles have on this reason been recalculated as the sum of the settlement of the base case and the creep from respective creep calculation.
The conclusion is thus that the expected displacement of the canister in a deposition hole from consolidation and creep during 100,000 years is very small and for the case of 30/70 backfill actually will result in a heave of the canister. The sensitivity analyses with reduced swelling pressure corresponding to reduced density or reduced friction angle also show that the canister displacement is very insensitive to such phenomena since the total settle-ment will be less than a few cm even at a buffer density of 1,500 kg/m3 or at a friction angle of 0.3°.
Table5-1. Summaryofresultsfromthecalculationswithfixedbuffer/backfillboundary.
CalculationNo
Densityatsaturationρm(kg/m3)
Swellingpressurep(kPa)
Misesstressatfailureqf(kPa)
Canistersettlement(mm)
Frictionangleatretainedswellingpressureφ(°)2)
Canistersettlementatcorrespondingfrictionangleandretainedswellingpressure(mm)3)
1 (base case) 2,010 7,000 2,238 0.35 8.8 0.35
2 1,950 3,500 1,312 0.67 5.2 0.47
3 1,890 1,750 770 1.26 3.1 0.67
4 1,840 875 451 2.42 1.8 1.04
5 1,780 438 265 4.63 1.1 1.67
6 1,720 219 155 8.89 0.63 2.78
7 1,690 (1,640)1) 160 122 12.0 0.50 3.51
8 1,620 (1,470)1) 80 72 22.5 0.29 5.54
1) Actual values of void ratio and density at saturation since e > 1.5 and Equation
2) 163
+=
fqpφ
3) Derived from the consolidation in the base case (0.20 mm) + the creep from respective creep calculation

��
References
/2-1/ BörgessonL,JohannessonL-E,SandénT,HernelindJ,1995. Modelling of the physical behaviour of water saturated clay barriers. Laboratory tests, material models and finite element application. SKB TR-95-20. Svensk Kärnbränslehantering AB.
/2-2/ SinghA,MitchellJK,1968. General stress-strain-time function for soils. American Society of Civil Engineers, Proceedings, Vol. 94, No SM1.
/3-1/ ABAQUSInc. ABAQUS manuals.
/3-2/ BörgessonL,HernelindJ,1999.Coupled Thermo-Hydro-Mechanical calculations of the water saturation phase of phase of a KBS-3 hole. SKB TR-99-41. Svensk Kärnbränslehantering AB.

ISSN 1404-0344CM Digitaltryck AB, Bromma, 2006