Embed Size (px)
Citation preview
366
%if soln.
INDUSTRIAL AND ENGINEERING CHEMISTRY
______
LEATHER, PRR 100 GRAMS COLLAGEN
H2S04 CrtOa
tion is not a function of pH value reached during neutrali- zation, for with sodium bicarbonate the final pH values of the three stronger solutions were practically the same, and yet the percentage of fat taken up decreased with increasing removal of sulfuric acid.
When the time of fat-liquoring is prolonged, the effect of neutralization of the leather on the percentage of fat absorbed becomes less pronounced. This is shown by the data of Table 11.
Time tat- :' liq-
uored
Table 11-Effect of Neutralization and Time of Fat-Liquoring on Fat Absorption
LEATHER, PER IO0 GRAMS COLLAGEN
Fat &SO4 CrzOa
Fat-liquor: 5.0 grams sulfonated neat's.foot oil in 200 cc. per 100 grams
Neutralizing liquor: indicated weight of borax in 200 cc. per 100 grams wet leather; initial pH = 8.92; initial temperature, 50" C.
wet leather; time, 1 hour; room temperature.
BORAX
100 No. GRAMS
WET LEATHER
PER
Grams 2-1 2 2-4 2 8-1 8 8-4 8
AFTER hTEIJTRALIZING
1 Grams Grams 7 . 8 6 10 .37 12 .28 7 . 8 6 10 .37 1 2 . 2 8 8 . 8 2 1 7 . 3 8 11.66 8 . 5 2 7 . 3 8 11 .66
AFTER FAT-LIQUORING I
Hours 1 Grams Grams Grams 1 7 . 7 0 I 9 . 1 6 9 . 5 8 1 2 . 0 5 4 6 . 7 6 16.92 8 . 6 2 12 .16 1 7 . 8 8 7 . 2 2 5 . 5 3 11 .91 4 7 . 5 1 15 .07 3 . 9 0 11 .78
VOl. 21, No. 4
After 1 hour the leather neutralized with 2 grams of borax had taken up nearly 2 per cent more fat than the leather neutral- ized with 8 grams, but after 4 hours the difference was only 0.85 per cent.
The additional fat taken up by the leather containing more acid and the additional fat taken up when the time of fat- liquoring is increased is all found in the outer layers of the leather. Neutralization does not seem to affect materially the penetration of the fat into the center of the skin, nor does increasing the time of fat-liquoring cause increased penetra- tion. These facts are proved by the data presented in Figure 3. Leathers neutralized with 2 grams and 8 grams borax per 100 grams wet leather, and fat-liquored for 1 and 4 hours for each degree of neutralization, were split into layers and each layer was analyzed separately for fat and hide substance. The thickness of each layer was measured. I n Figure 3, grams fat per 100 grams hide substance is plotted for each leather as a function of the mean depth of the layer below the grain surface. In none of the leathers did any appreciable amount of fat penetrate to the center portion of the skin, and the distance to which penetration did take place is practically the same regardless of extent of neutralization or time of fat- liquoring.
Cane-Wax Complex in Juices from Cane-Sugar Mills' C. F. Bardorf
439 MT. PLEASANT Am., WESTMOUNT, P. Q., CANADA
From the various juices, sirups, and sugars sampled, cane-wax complex was extracted to show to what extent the com- plex is eliminated or persists in the different suc.rose solutions of the mills and,$nally, as
appearing in the raw sugar itseg.
H E object of this series of experiments is to supplement the data established and presented in a previous T paper.* The endeavor has now been made to follow
the migration of cane-wax complex through some stations of cane-sugar mills in a manner somewhat analogous 60 that pursued in a sugar refinery. The methods used for gathering wax and waxlike material from mill juices, defecated juices, meladura, etc., were those described in the experiments con- ducted in a refinery. As the author had the opportunity of conducting his experiments, for comparative illustration, at four centrals in Cuba, in each of which different conditions of grinding prevailed, it is hoped that the data to be pre- sented may cast some light on conditions under which the wax constituents are carried into the juices and are later found passing through the stations of the mills.
Grinding Rate, Etc.
As the wax percentages (on 100" Brix) shown in the tables are of especial interest when compared and considered with reference to rate of grinding, method of maceration, and defecation employed, it may be well to present these general conditions in tabular form. Thus on the basis of a normal rate of grinding, defecator capacity, etc., of 100, the respective centrals were operating as follows:
Central A B C D Grinding 110 90 110 90 Maceration Defecation 100 70 110 90
All from 20 to 25
1 Presented before the Division of Sugar Chemistry at the 76th Meet- ing of the American Chemical Society, Swampscott, Mass., September 10 t o 14, 1928.
2 Bar orf, IND. ENO. CKEM., 10, 258 (1928).
Quality of Cane Ground
As all the centrals (designated as A, B, C, and D) were grinding rather unsatisfactory cane, this fact should also be considered. Three qualities of cane were being ground-viz., normal, left-over, and dead cane-respectively, Cans Normal, Quedada, and Muerta. Left-over cane was more than two years old, but not defective; dead cane was dry, brown, and hollow. The juice from dead cane was frequently of low purity, about 50, and sometimes it dropped to 30. It was estimated that the four centrals were grinding dead and left-over cane as follows:
Central A B C D Left-over (on basis of cane ground) 80 80 99 99 Dead (on basis of left-over cane) 10 8 10 10
Maceration
Maceration in A, B, and C was quite similar, except that in A the juice from the sixth set ran with the thin juice from the fourth and fifth rollers. In the centrals A, B, and C the thin juice from the last two rollers (fourth and fifth) was poured on the bagasse before it entered the second and third rollers. Maceration water was used a t fourth and fifth rollers, in mill A also on sixth rollers.
In central D two-fifths of secondary juice ran upon bagasse entering first roller set; secondary mud together with thin juice from fourth and fifth rollers went as maceration fluid to bagasse entering second and third roller sets.
From Table I it will be noted that centrals A and B must have been grinding about the same quality of cane, while central C was operating on a poorer cane. Central D cannot
April, 1929 INDUSTRIAL AND ENGINEERING CHEMISTRY 367
be compared with A, 13, and C, because a t D the Petree-Dorr was in operation and maceration, etc., was quite dissimilar.
Table I-Brix and Purity of Mill Juices CENTRAL A CENTRAL B CENTRAL C CENTRAL D
MILL Brix 70 O Brix % Brix % a Brix % Crusher
I I1 I11 I V V VI
1s: 0 1 4 . 2 11 .2 10.1 8 . 6 4 . 3
s2:4 8 1 . 5 8 0 . 8 7 8 . 2 75 .5 73.2
1 9 . 3 18.8 10 .5 7 . 4 3 . 4 3 . 0
85 .2 8 2 . 9 81 .6 79 .2 77 .4 7 4 . 1
1 7 . 6 1 6 . 7 1 0 . 8 7 . 8 5 . 4 2 . 4
82.7 79 .6 7 7 . 5 77 .2 75 .2 71.6
18.2 17 .0 1 4 . 1 14 .7 10.2 10 .3
85 .-2 83.2 7 9 . 4 78 .4 78.8 7 5 . 9
Cane-Wax Migration through the Mills
With these preliminary data in hand the cane-wax contents (of the different juices may be advantageously tabulated. As the acetone and alcohol extractions from all sources are generally characterized by greenish and brownish tints, respectively, the acetone extracts are designated by G and the alcohol extracts by B, and their sum by T in the tables.
In order to obtain comparative samples of juice from the same cane while passing through the mills, the samples of the juices were taken, as nearly as possible, from the bagasse as it passed through the successive roller sets, thus representing that cane from which crusher juice or first roller juice had been taken. With this method of sampling i t follows that the cane-wax percentages shown must represent the wax from the same cane entering the various juices from crusher to last mill. These data appear in Table 11.
Table 11-Cane Wax Extracted from Mill Juices (Per cent extracts on 100' Brix)
MILL CENTRAL A CENTRAL B CENTRAL C CENTRAL D 55 94 % 7" . _ . _ . -
Crusher G . . . 0.385 . . . 0.287 B . . . 0.452 . . . 0.285 T ... 0.837 . . . 0.572
I G 0 . 6 7 0 0.239 0 .367 0 .809 B 0.360 0.262 0 .364 0.658 T 1.030 0 . 5 0 1 0.731 1.467
I1 G 0.680 0 . 4 5 1 0 .472 0 .758 B 0.202 0.224 0 .292 0 .409 T 0.882 0 .675 0.764 1.167
I l l G 0,690 0.326 0 .673 1.006 B 0.069 0 .265 0.414 0 . 3 1 0 T 0 . 7 5 9 0 . 5 9 1 1.087 1.116
G . . . 0.342 0.509 0 .707 , . . 0.185 0 , 2 7 4 0 .201 . . . 0.527 0 . 7 8 3 0 .908
Cane Wax in Defecated Juice and Meladura
If we now turn to wax contents of defecated juices and meladuras of the four centrals (Table 1111, we note that the meladuras from A, B, and C hold less total wax per solids than the defecated juices from which the meladuras were obtained, ranging from 45 per cent less in B; 48 per cent in C ; and as ?sigh as 60 per cent in A. While the total wax in defecated juice D is the lowest, the gum precipitation, during concen- tration, is much less, only 11 per cent. It is a well-known fact that scale from effects may contain as much as 48 per cent of the organic matter, which no doubt Lonsists largely of gum trapped by the phosphates, which also form a not inappreciable percentage of the scale.
Fouling of Effects
In this respect, therefore, the fouling of effect may stand in direct relation to the quantity of wax in the defecated juice, and the quantity precipitated during concentration. The relative clarity of the sirup and ease of boiling sugar from i t may have some significance in this respect. Further in- vestigation on this phase of mill work would appear com- mendable.
Cane Wax in Raw Sugars
A great uniformity is noted in the raw sugars produced by the four centrals, not only in the total wax content, but in the composition of the wax. The range of the G wax is not wide -viz., 67.6 per cent in A, 62.2 per cent in B, 65.4 per cent in C, and 62.8 per cent in D.
Table 111-Mixed Juices, Defecated Juice, Meladura CENTRAL A CENTRAL B CENTRAL C CENTRAL D
Brix % Brix O Brix % B r i x % B R I X A N D PURITY
Defecatedjuice 13.6 80 .2 1 4 . 1 83 .4 1 4 . 1 80 .6n 17.8 8 4 . 4 Meladura 60.5 8 0 . 8 6 3 . 4 8 3 . 6 5 4 . 3 80.6b 15 .4 8 2 . 7 Press - filtered 5 3 . 4 8 4 . 6
juice 1 2 . 5 79 .2 W A X EXTRACTS
% 70 70 % Defecated juice 0.196 0 , 2 3 0 0.159 0 .137
0 .194 0 , 3 2 6 0.152 0 . 0 8 2 0.390 0 .556 0 . 3 1 1 0 .219
Meladura 0.075 0.190 0 .085 0.101 0 .070 0.112 0 .077 0 , 0 9 4 0.155 0 .302 0.162 0.195
Press juice 0.184 . . . . . . . . . 0.108 . . . . . . . . . 0.292 . . . . . . . . .
Secondary juice . . . . . . . . . 0.583 ... . . . . . . 0.327 . . . . . . . . . 0.910
a Primary juice. b Secondary juice.
Table IV gives the wax contents of raw sugars produced during February, 1928, and also for the same month in 1926 and 1927. All the sugar polarized a little over 97.0 with the exception of D 1926, which was 98.5.
Table IV-Cane War in Raw Sugars CENTRAL A CENTRAL B CENTRAL C CENTRAL D
% % % 70 Raws of 1926
Raws of 1927
Raws of 1928
. . . . 0.043 0.044 0.017 . , . . 0.023 0.109 0.014 . . . . 0.066 0 .153 0 .031
. . . . 0.076 0 .079 0 .078
. . . . 0.058 0.117 0.147 . . . . 0.134 0.196 0 .225
0.0469 0.0404 0 .0446 0.0366 0.0225 0.0245 0.0235 0.0216 0.0694 0.0649 0.0680 0,0582
Insoluble colloids, 1928 0 057 0 055 0.076 0 060
As the trapped method of necessity includes not only the colloidal gums, but also fine suspensions and bagacillia, these substances are to be found in the insoluble residues of the extractions. But along with the suspensions there is a muddy brown, tenacious, earthy material incorporated with the phosphates. This brown material is insoluble in acetone, alcohol, or hot water, but can be readily separated from the phosphate residues by dissolving the phosphates in dilute hydrochloric acid, filtering, washing with hot water, and drying. There is then obtained the earthy material just described. It does not fuse as a wax, but burns with the emission of evil-smelling vapors of burned bone or hair, indicating that a large percentage of nitrogen is present. The percentage of these insoluble colloids is very uniform in the raw sugars, as shown by raws of 1928, which contain: A, 0.057; B, 0.055; C, 0.076; D 0.060 per cent.
Conclusion
In so far as these limited investigations have gone, it appears that the migration of the cane-wax in cane-sugar mills resembles the migrations in a refinery.
In both cases the various extracts are quite similar, or have many points of resemblance, and it will no doubt be estab- lished that the complex maintains its character even after having passed through many processes from the cane mills to the finished products of the refinery.
368 INDUSTRIAL A N D ENGINEERING CHEMISTRY VOl. 21, Yo. 4
Acknowledgment estat'es, to carry out these investigations. His work was, mat>erially expedited by the kind cooperation of the official6 of the centrals visited, and the freedom of the laboratories of the establishments.
The author is indebted to the courtesy of the Eastern Cuban Sugar Corporation and the American Sugar Refining Company for the opportunity given him, while guest on their
Lord Kelvin's Law in Chemical Manufacture' Herbert H. Dow
Dow CIIEMICAL Co., MIDLAND, MICH.
N THE course of my remarks a t the dinner in my honor Many of the problems are less simple-the size of a steam given at the Chemists' Club in New York on February pipe, for example. Shall we carry a higher pressure on our 27, I chose to elaborate somewhat upon the application boilers, use smaller steam pipes and a greater drop on our
of Lord Kelvin's law with a few instances that had come to line and thereby reduce radiation? If we get the pressure my attention during my experience as a chemical manufac- above the point where equipment is reliable, then an uncertain turer. The interest manifested in these statements has factor comes into the problem, and in any event the higher
I prompted me to write them down for the benefit of those who were not present a t the dinner.
How large should a copper wire be for transmitting electrical energy? This was answered many years ago by Lord Kelvin, and the considerations which determine the best cross section of an electrical con- ductor also apply to like determinations of size and cost of many pieces of ap- paratus used in a chemical plant.
For example, how much heating surface should a vacuum pan have for a given capacity? The governing factors are the capital charge that goes along with a bigger and more expensive pan or with multiple effects and the accompanying saving in operating cost which the larger pan or multiple effect makes possible. When an additional investment is required to improve the pan and the saving through operation of this pan is just equal to the
'
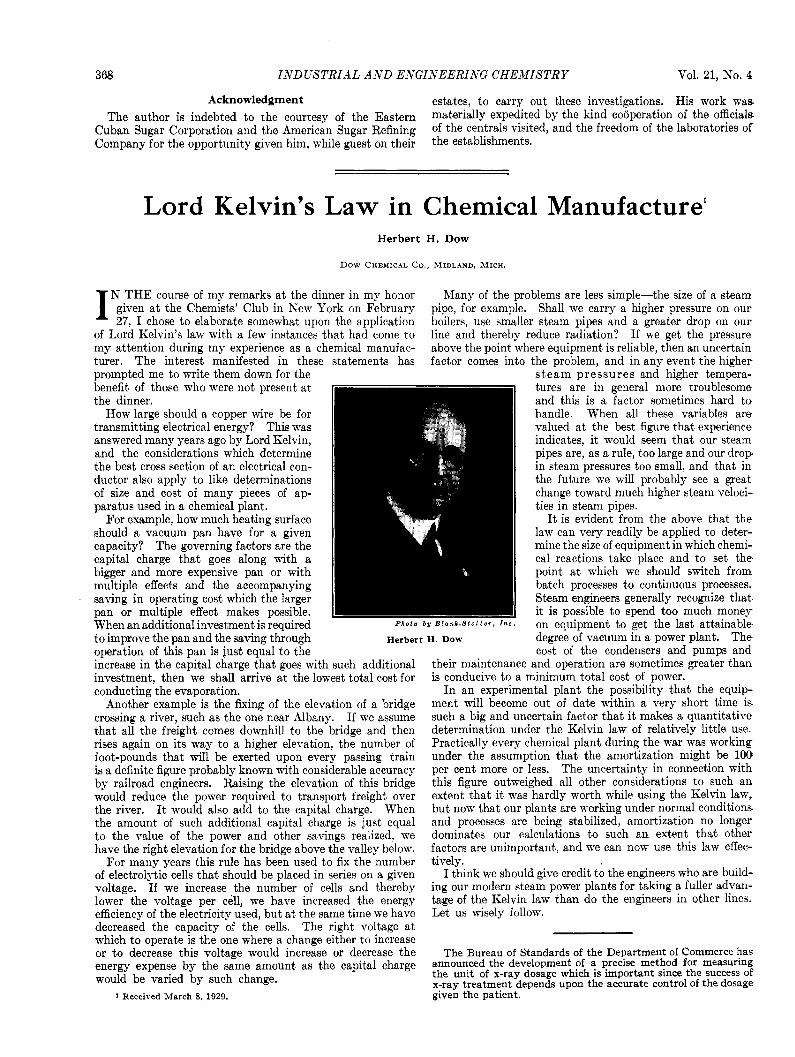
Herbert H. DOW
increase in the capital charge that goes with such additional investment, then we shall arrive a t the lowest total cost for conducting the evaporation.
Another example is the fixing of the elevation of a bridge crossing a river, such as the one near Albany. If we assume that all the freight comes downhill to the bridge and then rises again on its way to a higher elevation, the number of foot-pounds that will be exerted upon every passing train is a definite figure probably known with considerable accuracy by railroad engineers. Raising the elevation of this bridge would reduce the power required to transport freight over the river. When the amount of such additional capital charge is just equal to the value of the power and other savings realized, we have the right elevation for the bridge above the valley below.
For many years this rule has been used to fix the number of electrolytic cells that should be placed in series on a given voltage. If we increase the number of cells and thereby lower the voltage per cell, we have increased the energy efficiency of the electricity used, but a t the same time we have decreased the capacity of the cells. The right voltage a t which to operate is the one where a change either to increase or to decrease this voltage would increase or decrease the energy expense by the same amount as the capital charge would be varied by such change.
It would also add to the capital charge.
1 Received March 8, 1929.
s t e a m pre ssu res and higher tempera- tures are in general more troublesome and this is a factor sometimes hard to handle. When all these variables are valued at the best figure that experience indicates, it would seem that our steam pipes are, as a rule, too large and our drop in steam pressures too small, and that in the future we will probably see a great change toward much higher steam veloci- ties in steam pipes.
It is evident from the above that the law can very readily be applied to deter- mine the size of equipment in which chemi- cal reactions take place and to set the point a t which we should switch from batch processes to continuous processes. Steam engineers generally recognize that it is possible to spend too much money on equipment to get the last attainable degree of vacuum in a power plant. The cost of the condensers and pumps and - -
their maintenance and operation are sometimes greater than is conducive to a minimum total cost of power.
In an experimental plant the possibility that the equip- ment will become out of date within a very short time is such a big and uncertain factor that it makes a quantitative determination under the Kelvin law of relatively little use. Practically every chemical plant during the war was working under the assumption that the amortization might be 100 per cent more or less. The uncertainty in connection with this figure outweighed all other considerations to such an extent that it was hardly worth while using the Kelvin law, but now that our plants are working under normal conditions and processes are being stabilized, amortization no longer dominates our calculations to such an extent that other factors are unimportant, and we can now use this law effec- tively.
I think we should give credit tb the engineers who are build- ing our modern steam power plants for taking a fuller advan- tage of the Kelvin h w than do the engineers in other lines. Let us wisely follow.
The Bureau of Standards of the Department of Commerce has announced the development of a precise method for measuring the unit of x-ray dosage which is important since the success of x-ray treatment depends upon the accurate control of the dosage given the patient.