Embed Size (px)
Citation preview
Candor Engineering Ltd.
Project Report
COSIA SAGD Reference Facilities
March 24, 2017
Report #: 2017029-RPT-TECR-001 Rev 0
Prepared By: Song P. Sit, PhD, P. Eng.
2801 – 18th Street NE Calgary, Alberta T2E 7K5 Phone: (403) 250-8007 Fax: (403) 291-4543
www.candorengineering.com
COSIA SAGD Reference Facilities
Candor Engineering Ltd.
Page 2 of 60
Disclaimer
The information provided in this report has been obtained or prepared from sources that are believed to be reliable and accurate but not necessarily independently verified. Candor Engineering Ltd. makes no representations or warranties as to the accuracy or completeness of such information and data nor the conclusions that have been derived from its use. Therefore, any use of the information by the reader or other recipient shall be at the sole risk and responsibility of such reader or recipient.
Candor Engineering Ltd. expressly disclaims and takes no responsibility and shall not be liable for any financial or economic decisions or market positions taken by any person based in any way on information presented in this report, for any interpretation or misunderstanding of any such information on the part of any person or for any losses, costs or other damages whatsoever and howsoever caused in connection with any use of such information, including all losses, costs or other damages such as consequential or indirect losses, loss of revenue, loss of expected profit or loss of income, whether or not as a result of any negligent act or omission by Candor Engineering Ltd.
COSIA SAGD Reference Facilities
Candor Engineering Ltd.
Page 3 of 60
Table of Contents
Page
List of Abbreviations 4
List of Figures 6
List of Tables 7
1 Introduction 8
2 Oil Sands Overview 9
3 Synopses of the Six SAGD Reference Central Processing Facilities 12
4 Methodology, Assumptions, and Summaries of Results 15
5 Central Processing Facility #1 (ML-WLS-OTSG) 19
6 Central Processing Facility #2 (ML-Evap-OTSG) 24
7 Central Processing Facility #3 (GL-WLS-OTSG) 28
8 Central Processing Facility #4 (ML-WLS-OTSG-Cogen) 31
9 Central Processing Facility #5 (ML-Evap-OTSG-Cogen) 35
10 Central Processing Facility #6 (ML-WLS-Cogen) 38
11 References 41
12 Appendices of Process Flow Diagrams and Material and Heat/Energy Balances 42
12.1 Base Case CPF 43
12.2 CPF#2: ML-Evap-OTSG 46
12.3 CPF#3: GL-WLS-OTSG 49
12.4 CPF#4: ML-WLS-OTSG-Cogen 52
12.5 CPF#5: ML-Evap-OTSG-Cogen 55
12.6 CPF#6: ML-WLS-Cogeneration 58
COSIA SAGD Reference Facilities
Candor Engineering Ltd.
Page 4 of 60
List of Abbreviations
Abbreviations Full Name
API American Petroleum Institute
bbl Barrel
BFD Block Flow Diagram
BFW Boiler Feed Water
BPSD Barrel per Stream Day
BS&W Basic Sediment and Water
CCR Conradson Carbon Residue
COSIA Canada’s Oil Sands Innovation Alliance
cP Centipoise
CPF Central Processing Facility
CSS Cyclic Steam Stimulation
CWE Cold Water Equivalent
d Day
DB Duct Burning
dilbit Diluted Bitumen
EFD Energy Flow Diagram
ESP Electrical Submersible Pump
ETAP Environmental Technology Assessment Portal
Evap Evaporator
FADB Forced Air Duct Burning
FWKO Free Water Knock Out
GHG Greenhouse Gas
GL Gas Lift
GT Gas Turbine
HHV Higher Heating Value
HP High Pressure
HRSG Heat Recovery Steam Generator
h Hour
IBP Initial Boiling Point
IGF Induced Gas Floatation
ISF Induced Static Floatation
COSIA SAGD Reference Facilities
Candor Engineering Ltd.
Page 5 of 60
l Litre
LP Low Pressure
LPG Liquid Petroleum Gases
M&HB Material and Heat Balance
ML Mechanical Lift
mol molar
MPa Mega Pascal
MW Mega Watt
MWh Mega Watt hour
NOx Nitrogen Oxides
ORF Oil Recovery Filter
OTSG Once Through Steam Generator
PFD Process Flow Diagram (used interchangeably in this report with BFD)
PFV Pre-Flash Vessel
SAGD Steam Assisted Gravity Drainage
SGER Specified Gas Emitters Regulation
SOR Steam to Oil Ratio
STP Standard Temperature and Pressure
t Tonne or Metric Ton
TBP True Boiling Point
TDS Total Dissolved Solids
TOC Total Organic Carbon
VRU Vapour Recovery Unit
WAC Weak Acid Cation Exchanger
WLS Warm Lime Softening
wt Weight
COSIA SAGD Reference Facilities
Candor Engineering Ltd.
Page 6 of 60
List of Figures
Figures Title Page
Figure 1 Alberta Oil Sands Deposits 9
Figure 2 Schematic of Cyclic Steam Stimulation 9
Figure 3 Schematic of SAGD 10
Figure 4 A Schematic of a Typical commercial SAGD CPF 11
Figure 5 Base Case PFD and Mass Balance of the SAGD CPF 20
Figure 6 Base Case Energy Flow Diagram of a SAGD CPF 21
Figure 7 Case 2 PFD and Mass Balance of CPF Using Evaporators Instead of WLS 25
Figure 8 Case 2 Energy Flow Diagram of CPF Using Evaporators Instead of WLS 26
Figure 9 Case 3 PFD and Mass Balance using GL to Replace ML 29
Figure 10 Case 3 Energy Flow Diagram using GL to Replace ML 30
Figure 11 Case 4 PFD and Mass Balance with Cogeneration added to Base Case to eliminate Power Import and 2 OTSG 33
Figure 12 Case 4 Energy Flow with Cogeneration added to Base Case to eliminate Power Import and 2 OTSG 34
Figure 13 Case 5 PFD and Mass Balance of adding Cogeneration to Case 2 to Eliminate Power Import and 2 OTSG 36
Figure 14 Case 5 Energy Flow Diagram of adding Cogeneration to Case 2 to Eliminate Power Import and 2 OTSG 37
Figure 15 Case 6 PFD and Mass Balance of full Cogeneration with ML and WLS 39
Figure 16 Case 6 Energy Flow Diagram of full Cogeneration with ML and WLS 40
COSIA SAGD Reference Facilities
Candor Engineering Ltd.
Page 7 of 60
List of Tables
Table Title Page
Table 1 Bitumen Quality 15
Table 2 Diluent Quality 15
Table 3 Natural Gas Composition 15
Table 4 Summary of All 6 Cases 16
Table 5 Comparison of Specific Energy, Water and GHG Intensity of all 6 Cases 17
Table 6 Key Parameters of All 6 Cases 18
COSIA SAGD Reference Facilities
Candor Engineering Ltd.
Page 8 of 60
1. Introduction
1.1. Canada’s Oil Sands Innovation Alliance
Canada’s Oil Sands Innovation Alliance (COSIA) is a coalition of oil sands producers collaborating to accelerate the pace of improvement in environmental performance associated with oil sands crude production. Priority Areas include:
• Environmental Monitoring,
• Tailings,
• Land disturbance,
• Water conservation and
• Greenhouse Gas (GHG) emissions
In the GHG Environmental Priority Area, COSIA members collaborate to investigate ways to reduce energy use and associated GHG emissions through the development of innovative technologies for oil sands in situ and mining operations.
1.2. Scope of Report
COSIA has asked Candor Engineering (Candor) to complete this report to provide overviews of, and context for, six Steam Assisted Gravity Drainage (SAGD) reference Central Processing Facilities (CPFs). These reference CPFs (see Appendices 1 to 6) were prepared by JACOBS Consultancy (Jacobs) for COSIA and are depicted only as process flow diagrams (PFD) and energy flow diagrams (EFD).
This document provides context for these CPFs containing descriptions of:
(1) COSIA’s motivation for constructing SAGD reference CPFs (see Section 1.3 below),
(2) Description of how bitumen is extracted from in situ oil sands operations (see Section 2), and
(3) SAGD process and energy flow and interconnectivity for each of the six reference CPFs (see Sections 5 to 9).
1.3. Purpose of the Report
COSIA will use of this document to:
• Help technology vendors to become more familiar with SAGD operations, including the material and energy balances for various reference configurations in the respective CPFs,
• Inspire and stimulate creative new ideas to enhance the efficiency of, while reducing the environmental footprint associated with, SAGD production technologies, including GHG emissions and water use, and
• Support technology vendors to: o Identify how their technologies might integrate with existing SAGD facilities, o Assist them in quantifying the potential GHG and water benefits of their technology, and o Better present their proposals to COSIA.
Technology Vendors are encouraged to submit non-confidential information about their technology to COSIA through its Environmental Technology Assessment Portal (ETAP) at http://www.cosia.ca/etap?page=etap.
COSIA SAGD Reference Facilities
Candor Engineering Ltd.
Page 9 of 60
2. Oil Sands Overview
2.1. Location of deposits
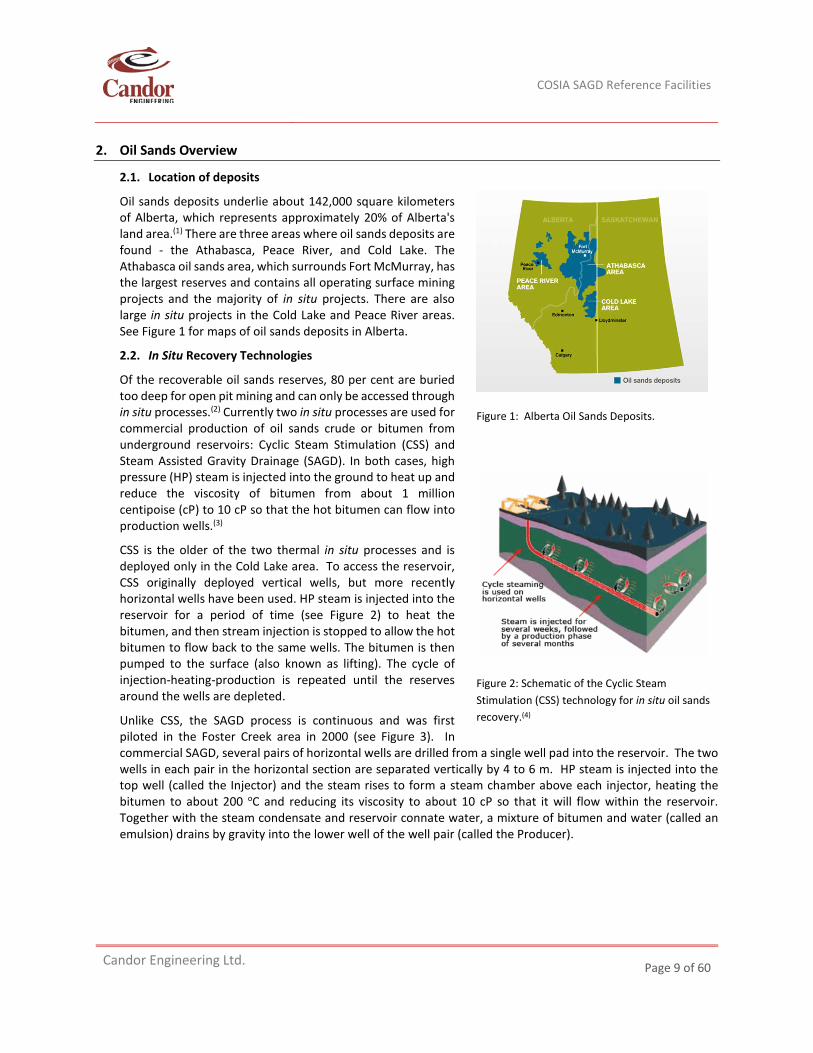
Oil sands deposits underlie about 142,000 square kilometers of Alberta, which represents approximately 20% of Alberta's land area.(1) There are three areas where oil sands deposits are found - the Athabasca, Peace River, and Cold Lake. The Athabasca oil sands area, which surrounds Fort McMurray, has the largest reserves and contains all operating surface mining projects and the majority of in situ projects. There are also large in situ projects in the Cold Lake and Peace River areas. See Figure 1 for maps of oil sands deposits in Alberta.
2.2. In Situ Recovery Technologies
Of the recoverable oil sands reserves, 80 per cent are buried too deep for open pit mining and can only be accessed through in situ processes.(2) Currently two in situ processes are used for commercial production of oil sands crude or bitumen from underground reservoirs: Cyclic Steam Stimulation (CSS) and Steam Assisted Gravity Drainage (SAGD). In both cases, high pressure (HP) steam is injected into the ground to heat up and reduce the viscosity of bitumen from about 1 million centipoise (cP) to 10 cP so that the hot bitumen can flow into production wells.(3)
CSS is the older of the two thermal in situ processes and is deployed only in the Cold Lake area. To access the reservoir, CSS originally deployed vertical wells, but more recently horizontal wells have been used. HP steam is injected into the reservoir for a period of time (see Figure 2) to heat the bitumen, and then stream injection is stopped to allow the hot bitumen to flow back to the same wells. The bitumen is then pumped to the surface (also known as lifting). The cycle of injection-heating-production is repeated until the reserves around the wells are depleted.
Unlike CSS, the SAGD process is continuous and was first piloted in the Foster Creek area in 2000 (see Figure 3). In commercial SAGD, several pairs of horizontal wells are drilled from a single well pad into the reservoir. The two wells in each pair in the horizontal section are separated vertically by 4 to 6 m. HP steam is injected into the top well (called the Injector) and the steam rises to form a steam chamber above each injector, heating the bitumen to about 200 oC and reducing its viscosity to about 10 cP so that it will flow within the reservoir. Together with the steam condensate and reservoir connate water, a mixture of bitumen and water (called an emulsion) drains by gravity into the lower well of the well pair (called the Producer).
Figure 1: Alberta Oil Sands Deposits.
Figure 2: Schematic of the Cyclic Steam Stimulation (CSS) technology for in situ oil sands recovery.(4)
COSIA SAGD Reference Facilities
Candor Engineering Ltd.
Page 10 of 60
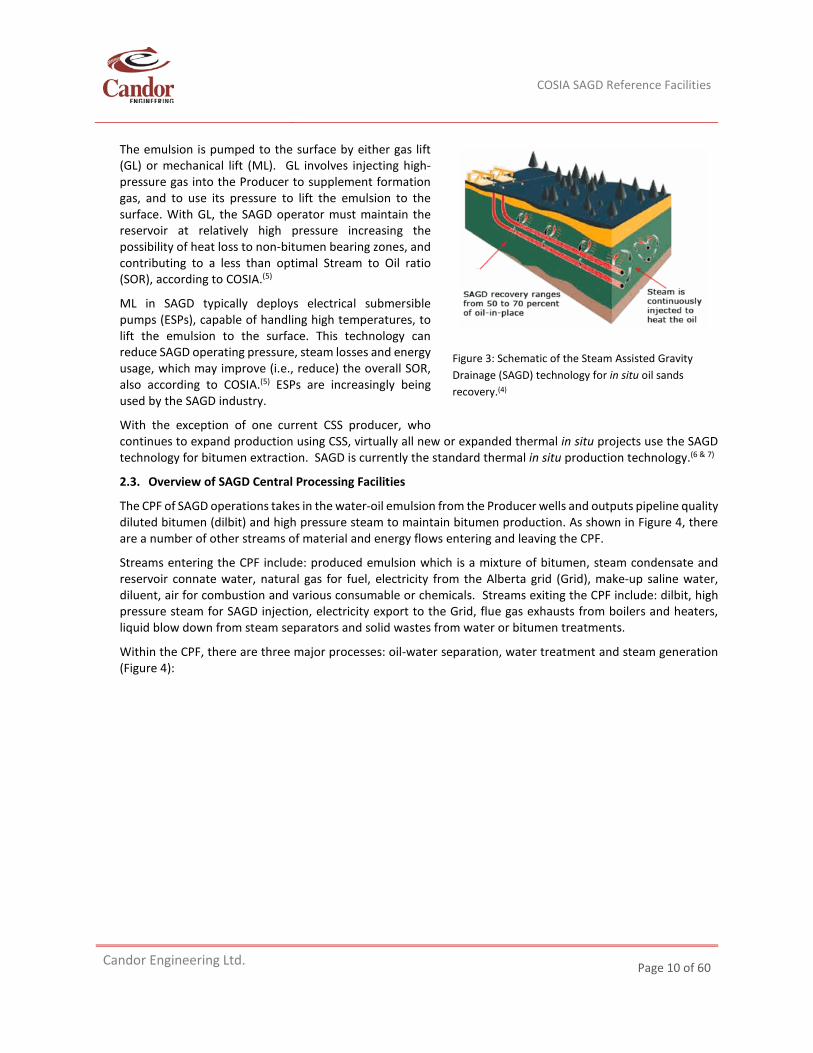
The emulsion is pumped to the surface by either gas lift (GL) or mechanical lift (ML). GL involves injecting high-pressure gas into the Producer to supplement formation gas, and to use its pressure to lift the emulsion to the surface. With GL, the SAGD operator must maintain the reservoir at relatively high pressure increasing the possibility of heat loss to non-bitumen bearing zones, and contributing to a less than optimal Stream to Oil ratio (SOR), according to COSIA.(5)
ML in SAGD typically deploys electrical submersible pumps (ESPs), capable of handling high temperatures, to lift the emulsion to the surface. This technology can reduce SAGD operating pressure, steam losses and energy usage, which may improve (i.e., reduce) the overall SOR, also according to COSIA.(5) ESPs are increasingly being used by the SAGD industry.
With the exception of one current CSS producer, who continues to expand production using CSS, virtually all new or expanded thermal in situ projects use the SAGD technology for bitumen extraction. SAGD is currently the standard thermal in situ production technology.(6 & 7)
2.3. Overview of SAGD Central Processing Facilities
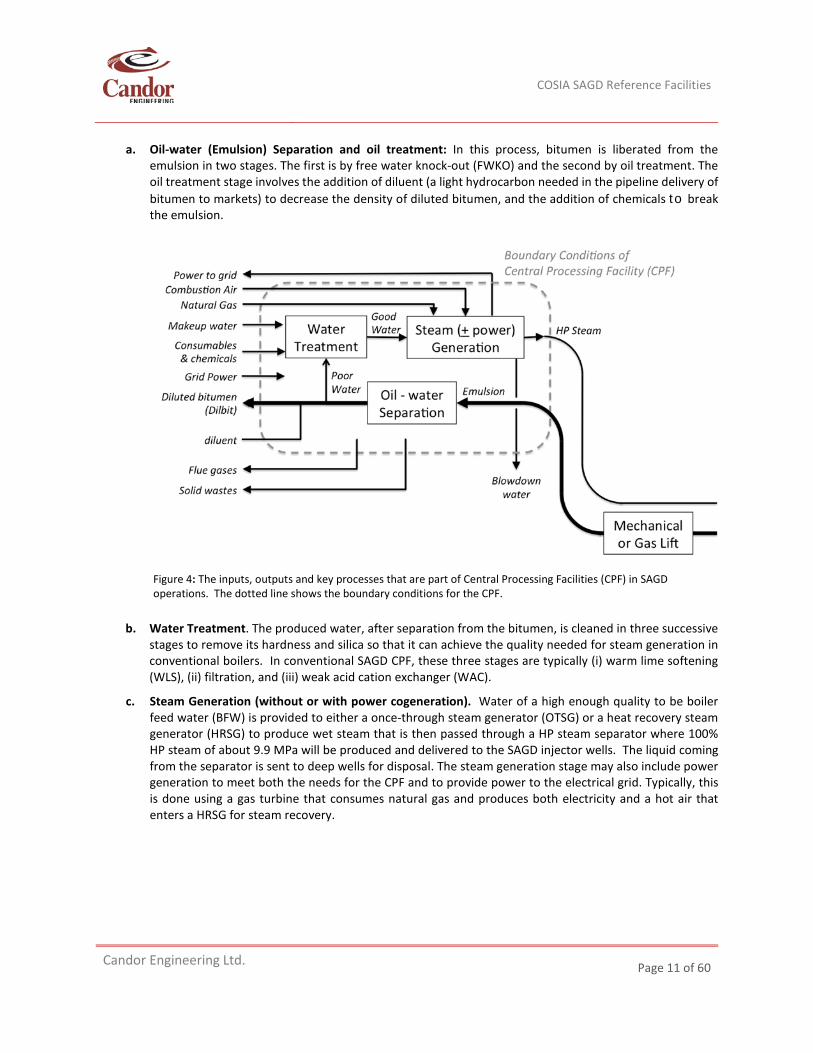
The CPF of SAGD operations takes in the water-oil emulsion from the Producer wells and outputs pipeline quality diluted bitumen (dilbit) and high pressure steam to maintain bitumen production. As shown in Figure 4, there are a number of other streams of material and energy flows entering and leaving the CPF.
Streams entering the CPF include: produced emulsion which is a mixture of bitumen, steam condensate and reservoir connate water, natural gas for fuel, electricity from the Alberta grid (Grid), make-up saline water, diluent, air for combustion and various consumable or chemicals. Streams exiting the CPF include: dilbit, high pressure steam for SAGD injection, electricity export to the Grid, flue gas exhausts from boilers and heaters, liquid blow down from steam separators and solid wastes from water or bitumen treatments.
Within the CPF, there are three major processes: oil-water separation, water treatment and steam generation (Figure 4):
Figure 3: Schematic of the Steam Assisted Gravity Drainage (SAGD) technology for in situ oil sands recovery.(4)
COSIA SAGD Reference Facilities
Candor Engineering Ltd.
Page 11 of 60
a. Oil-water (Emulsion) Separation and oil treatment: In this process, bitumen is liberated from the emulsion in two stages. The first is by free water knock-out (FWKO) and the second by oil treatment. The oil treatment stage involves the addition of diluent (a light hydrocarbon needed in the pipeline delivery of bitumen to markets) to decrease the density of diluted bitumen, and the addition of chemicals to break the emulsion.
b. Water Treatment. The produced water, after separation from the bitumen, is cleaned in three successive stages to remove its hardness and silica so that it can achieve the quality needed for steam generation in conventional boilers. In conventional SAGD CPF, these three stages are typically (i) warm lime softening (WLS), (ii) filtration, and (iii) weak acid cation exchanger (WAC).
c. Steam Generation (without or with power cogeneration). Water of a high enough quality to be boiler feed water (BFW) is provided to either a once-through steam generator (OTSG) or a heat recovery steam generator (HRSG) to produce wet steam that is then passed through a HP steam separator where 100% HP steam of about 9.9 MPa will be produced and delivered to the SAGD injector wells. The liquid coming from the separator is sent to deep wells for disposal. The steam generation stage may also include power generation to meet both the needs for the CPF and to provide power to the electrical grid. Typically, this is done using a gas turbine that consumes natural gas and produces both electricity and a hot air that enters a HRSG for steam recovery.
Figure 4: The inputs, outputs and key processes that are part of Central Processing Facilities (CPF) in SAGD operations. The dotted line shows the boundary conditions for the CPF.
COSIA SAGD Reference Facilities
Candor Engineering Ltd.
Page 12 of 60
3. Synopses of the Six SAGD Reference CPFs
Sections 5 to 10 of this report contain overviews of six different SAGD reference Central Processing Facilities (CPFs), each with their own Process Flow Diagram (PFD) and Energy Flow Diagram (EFD). This section introduces the six CPFs and identifies the exclusions and limitations in this analysis.
3.1. CPF Summary
The six CFPs are as follows:
CPF#1 (ML-WLS-OTSG): This Base case, as described in Section 5, deploys: • Electric Submersible Pump (ESP) as the mechanical lift (ML) technology to produce the emulsion from
the reservoir; • Warm Lime Softening (WLS) for water treatment; • Once-through Steam Generation (OTSG) to provide the steam requirements, and • Power is imported from the Grid.
CPF#2 (ML-Evap-OTSG): Similar to CPF#1, but: • An evaporator replaces WLS for water treatment to produce a much higher quality boiler feed water
(BFW). Section 6 will provide further description of Evaporators. As a result, higher quality steam could be produced in the OTSG, eliminating almost all the blow down and its deep well disposal.
CPF#3 (GL-WLS-OTSG): Similar to CPF#1, but: • Gas lift (GL) technology using pipeline HP natural gas replaces ESPs to produce the emulsion from the
reservoir. This process not only produces the emulsion to the surface, but also depressurizes the pipeline natural gas to meet the OTSG burner pressure requirement. Section 7 contains further details of the GL technology.
CPF#4 (ML-WLS-OTSG-Cogen): Similar to CPF#1, but: • Cogeneration using a combination of gas turbine (GT) and heat recovery steam generator (HRSG) are
used to eliminate power import and augment steam generation from the OTSG. The electricity output will be used on site and any excess is exported to the Grid. Further details can be found in Section 8, including how the OTSG and the new HRSG are integrated to supply the same steam requirement.
CPF#5 (ML-Evap-OTSG-Cogen): Similar to CPF#4, but: • An evaporator, as was described in CPF#2, replaces WLS for water treatment to produce a much higher
quality boiler feed water (BFW). Section 9 has more details.
CPF#6 (ML-WLS-Cogen): Similar to CPF#1, but: • Full cogeneration of HP steam from HRSG and electricity from GT will be implemented instead of OTSG
and power import. Water treatment is still accomplished with WLS. More details are contained in Section 10.
COSIA SAGD Reference Facilities
Candor Engineering Ltd.
Page 13 of 60
3.2. Exclusions to CPF Descriptions
The following are excluded from the work presented here:
• Reservoir characteristics, performance or properties other than those in the PFD;
• Engineering design, material, construction or performance of the horizontal wells and their pads;
• SAGD operation and performance external to the CPF with the exception of emulsion pumping;
• Blending of the treated SAGD crude for pipeline delivery to refineries other than those in the PFD;
• Design, material, construction and operation of the emulsion collection and delivery systems to CPF;
• Design, material, construction and operation of the CPF and steam distribution system including its mechanical and civil support system, steam condensate handling and thermal insulation from the steam generators to the well heads of each pad;
• Design, material, construction and operations of any and all electricity transforming, distribution and connection systems;
• Environmental monitoring systems;
• CPF process control;
• Operation and maintenance (O&M) including personnel;
• Any and all cost data;
• Any and all SAGD management or company information;
3.3. Limits to CPF Descriptions
Candor is not privy to the Jacobs’ methods or assumptions used to complete these SAGD reference CPFs, or to the private communication between COSIA and Jacobs in respect of authorizing, reviewing or approving its work.
Consequently, Candor can only use the information shown in the PFD, utilities and EFD. In providing overview and context, Candor will use publicly available information only.
This report does not include:
• Validation of Jacobs’ work, including but not limited to, its accuracy of calculation, design, estimate, data package, engineering or mathematic software, PFD or mass and heat balances (M&HB), or its technical capability.
• Any information not available in the public domain;
• Validation of any information whether public or proprietary provided by COSIA;
• Provide additional calculations, flow sheets or diagrams than those provided by Jacobs, unless specifically requested by COSIA and agreed to by the authors;
• Any vendor specific process or unit in respect of its design, material, construction or operation;
• Description of any chemical or consumables, energy and its compositions, process streams and their compositions as shown or absent in the PFD or M&HB;
• Validations of any equilibrium state or resultant compositions of any streams and their respective states as shown or absent in the PFD or M&HB;
COSIA SAGD Reference Facilities
Candor Engineering Ltd.
Page 14 of 60
• Validation any chemical reactions, their respective reactants or products, their equilibrium products, or their reaction kinetics as shown or absent in the PFD or M&HB;
• Validation of Jacobs’ numerical simulations; and
• Comparison or comments in respect of the economics of any and all the cases
COSIA SAGD Reference Facilities
Candor Engineering Ltd.
Page 15 of 60
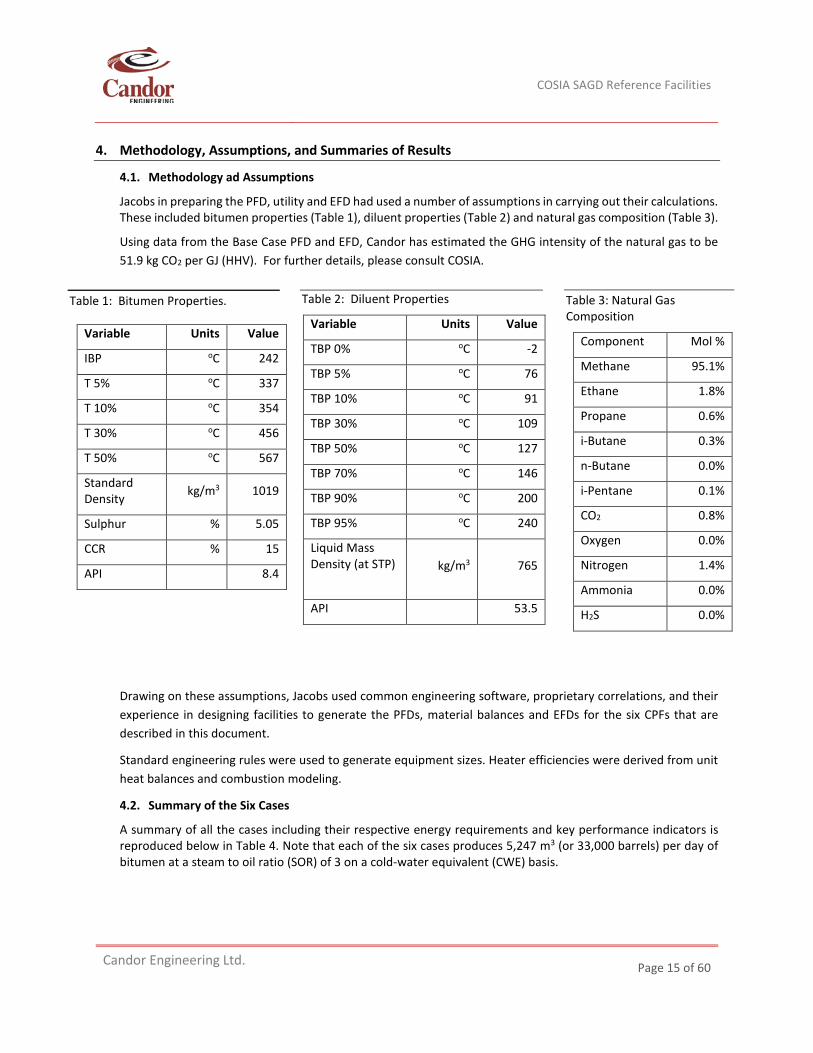
4. Methodology, Assumptions, and Summaries of Results
4.1. Methodology ad Assumptions
Jacobs in preparing the PFD, utility and EFD had used a number of assumptions in carrying out their calculations. These included bitumen properties (Table 1), diluent properties (Table 2) and natural gas composition (Table 3).
Using data from the Base Case PFD and EFD, Candor has estimated the GHG intensity of the natural gas to be 51.9 kg CO2 per GJ (HHV). For further details, please consult COSIA.
Drawing on these assumptions, Jacobs used common engineering software, proprietary correlations, and their experience in designing facilities to generate the PFDs, material balances and EFDs for the six CPFs that are described in this document.
Standard engineering rules were used to generate equipment sizes. Heater efficiencies were derived from unit heat balances and combustion modeling.
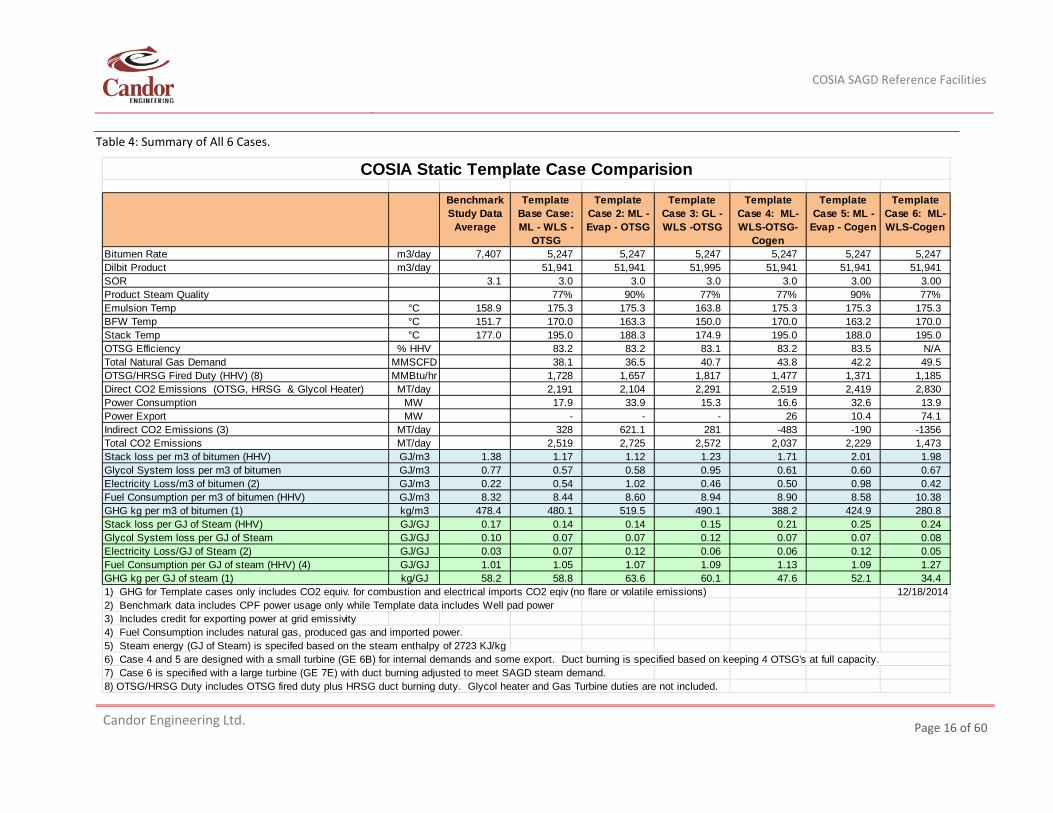
4.2. Summary of the Six Cases
A summary of all the cases including their respective energy requirements and key performance indicators is reproduced below in Table 4. Note that each of the six cases produces 5,247 m3 (or 33,000 barrels) per day of bitumen at a steam to oil ratio (SOR) of 3 on a cold-water equivalent (CWE) basis.
Table 1: Bitumen Properties.
Variable Units Value
IBP oC 242
T 5% oC 337
T 10% oC 354
T 30% oC 456
T 50% oC 567
Standard Density kg/m3 1019
Sulphur % 5.05
CCR % 15
API 8.4
Table 2: Diluent Properties
Variable Units Value
TBP 0% oC -2
TBP 5% oC 76
TBP 10% oC 91
TBP 30% oC 109
TBP 50% oC 127
TBP 70% oC 146
TBP 90% oC 200
TBP 95% oC 240
Liquid Mass Density (at STP) kg/m3 765
API 53.5
Table 3: Natural Gas Composition
Component Mol %
Methane 95.1%
Ethane 1.8%
Propane 0.6%
i-Butane 0.3%
n-Butane 0.0%
i-Pentane 0.1%
CO2 0.8%
Oxygen 0.0%
Nitrogen 1.4%
Ammonia 0.0%
H2S 0.0%
COSIA SAGD Reference Facilities
Candor Engineering Ltd.
Page 16 of 60
Table 4: Summary of All 6 Cases.
COSIA Static Template Case ComparisionBenchmark Study Data
Average
Template Base Case: ML - WLS -
OTSG
Template Case 2: ML -Evap - OTSG
Template Case 3: GL - WLS -OTSG
Template Case 4: ML-WLS-OTSG-
Cogen
Template Case 5: ML -
Evap - Cogen
Template Case 6: ML-WLS-Cogen
Bitumen Rate m3/day 7,407 5,247 5,247 5,247 5,247 5,247 5,247Dilbit Product m3/day 51,941 51,941 51,995 51,941 51,941 51,941SOR 3.1 3.0 3.0 3.0 3.0 3.00 3.00Product Steam Quality 77% 90% 77% 77% 90% 77%Emulsion Temp °C 158.9 175.3 175.3 163.8 175.3 175.3 175.3BFW Temp °C 151.7 170.0 163.3 150.0 170.0 163.2 170.0Stack Temp °C 177.0 195.0 188.3 174.9 195.0 188.0 195.0OTSG Efficiency % HHV 83.2 83.2 83.1 83.2 83.5 N/ATotal Natural Gas Demand MMSCFD 38.1 36.5 40.7 43.8 42.2 49.5OTSG/HRSG Fired Duty (HHV) (8) MMBtu/hr 1,728 1,657 1,817 1,477 1,371 1,185Direct CO2 Emissions (OTSG, HRSG & Glycol Heater) MT/day 2,191 2,104 2,291 2,519 2,419 2,830Power Consumption MW 17.9 33.9 15.3 16.6 32.6 13.9Power Export MW - - - 26 10.4 74.1Indirect CO2 Emissions (3) MT/day 328 621.1 281 -483 -190 -1356Total CO2 Emissions MT/day 2,519 2,725 2,572 2,037 2,229 1,473Stack loss per m3 of bitumen (HHV) GJ/m3 1.38 1.17 1.12 1.23 1.71 2.01 1.98Glycol System loss per m3 of bitumen GJ/m3 0.77 0.57 0.58 0.95 0.61 0.60 0.67Electricity Loss/m3 of bitumen (2) GJ/m3 0.22 0.54 1.02 0.46 0.50 0.98 0.42Fuel Consumption per m3 of bitumen (HHV) GJ/m3 8.32 8.44 8.60 8.94 8.90 8.58 10.38GHG kg per m3 of bitumen (1) kg/m3 478.4 480.1 519.5 490.1 388.2 424.9 280.8Stack loss per GJ of Steam (HHV) GJ/GJ 0.17 0.14 0.14 0.15 0.21 0.25 0.24Glycol System loss per GJ of Steam GJ/GJ 0.10 0.07 0.07 0.12 0.07 0.07 0.08Electricity Loss/GJ of Steam (2) GJ/GJ 0.03 0.07 0.12 0.06 0.06 0.12 0.05Fuel Consumption per GJ of steam (HHV) (4) GJ/GJ 1.01 1.05 1.07 1.09 1.13 1.09 1.27GHG kg per GJ of steam (1) kg/GJ 58.2 58.8 63.6 60.1 47.6 52.1 34.41) GHG for Template cases only includes CO2 equiv. for combustion and electrical imports CO2 eqiv (no flare or volatile emissions) 12/18/20142) Benchmark data includes CPF power usage only while Template data includes Well pad power3) Includes credit for exporting power at grid emissivity4) Fuel Consumption includes natural gas, produced gas and imported power.5) Steam energy (GJ of Steam) is specifed based on the steam enthalpy of 2723 KJ/kg
7) Case 6 is specified with a large turbine (GE 7E) with duct burning adjusted to meet SAGD steam demand.8) OTSG/HRSG Duty includes OTSG fired duty plus HRSG duct burning duty. Glycol heater and Gas Turbine duties are not included.
6) Case 4 and 5 are designed with a small turbine (GE 6B) for internal demands and some export. Duct burning is specified based on keeping 4 OTSG's at full capacity.
COSIA SAGD Reference Facilities
Candor Engineering Ltd.
Page 17 of 60
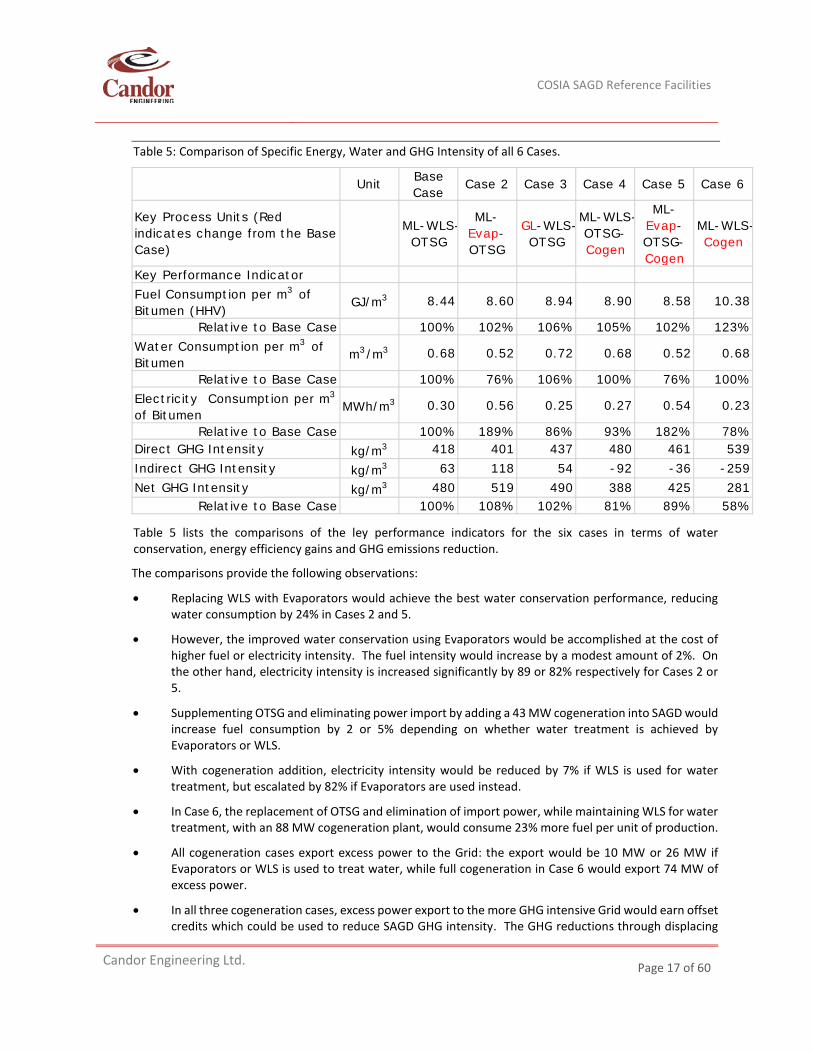
Table 5: Comparison of Specific Energy, Water and GHG Intensity of all 6 Cases.
Table 5 lists the comparisons of the ley performance indicators for the six cases in terms of water conservation, energy efficiency gains and GHG emissions reduction.
The comparisons provide the following observations:
• Replacing WLS with Evaporators would achieve the best water conservation performance, reducing water consumption by 24% in Cases 2 and 5.
• However, the improved water conservation using Evaporators would be accomplished at the cost of higher fuel or electricity intensity. The fuel intensity would increase by a modest amount of 2%. On the other hand, electricity intensity is increased significantly by 89 or 82% respectively for Cases 2 or 5.
• Supplementing OTSG and eliminating power import by adding a 43 MW cogeneration into SAGD would increase fuel consumption by 2 or 5% depending on whether water treatment is achieved by Evaporators or WLS.
• With cogeneration addition, electricity intensity would be reduced by 7% if WLS is used for water treatment, but escalated by 82% if Evaporators are used instead.
• In Case 6, the replacement of OTSG and elimination of import power, while maintaining WLS for water treatment, with an 88 MW cogeneration plant, would consume 23% more fuel per unit of production.
• All cogeneration cases export excess power to the Grid: the export would be 10 MW or 26 MW if Evaporators or WLS is used to treat water, while full cogeneration in Case 6 would export 74 MW of excess power.
• In all three cogeneration cases, excess power export to the more GHG intensive Grid would earn offset credits which could be used to reduce SAGD GHG intensity. The GHG reductions through displacing
Unit Base Case
Case 2 Case 3 Case 4 Case 5 Case 6
Key Process Units (Red indicates change from the Base Case)
ML-WLS-OTSG
ML-Evap-OTSG
GL-WLS-OTSG
ML-WLS-OTSG-Cogen
ML-Evap-OTSG-Cogen
ML-WLS-Cogen
Key Performance IndicatorFuel Consumption per m3 of Bitumen (HHV)
GJ/m3 8.44 8.60 8.94 8.90 8.58 10.38
Relative to Base Case 100% 102% 106% 105% 102% 123%Water Consumption per m3 of Bitumen
m3/m3 0.68 0.52 0.72 0.68 0.52 0.68
Relative to Base Case 100% 76% 106% 100% 76% 100%Electricity Consumption per m3
of BitumenMWh/m3 0.30 0.56 0.25 0.27 0.54 0.23
Relative to Base Case 100% 189% 86% 93% 182% 78%Direct GHG Intensity kg/m3 418 401 437 480 461 539Indirect GHG Intensity kg/m3 63 118 54 -92 -36 -259Net GHG Intensity kg/m3 480 519 490 388 425 281
Relative to Base Case 100% 108% 102% 81% 89% 58%
COSIA SAGD Reference Facilities
Candor Engineering Ltd.
Page 18 of 60
existing higher GHG intensity grid power result in emission intensities reductions of 92, 36 or 259 kg/m3 respectively for Cases 4, 5 or 6 as shown in Table 5. More details in respect of the credit calculations will be found in the appropriate sections.
• In Cases 4 and 5 when cogeneration is added to partially replace the OTSGs, the GHG intensity reduction is 11% or 19% respectively depending on whether Evaporators or WLS is used for water treatment. The best GHG intensity reduction of 42% is achieved when full cogeneration is implemented and WLS is kept for water treatment as shown in Case 6.
• Gas Lift would reduce electricity consummation by 14% but increase the fuel or water intensities by 6%, and GHG intensity by 2%.
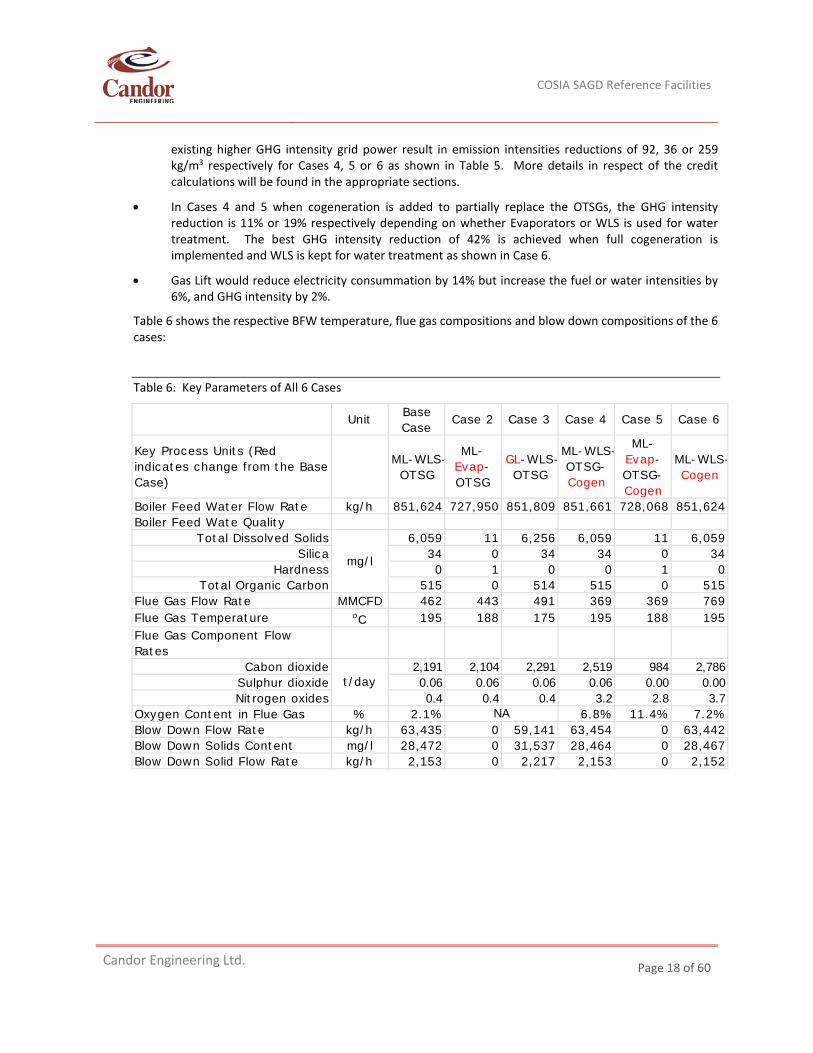
Table 6 shows the respective BFW temperature, flue gas compositions and blow down compositions of the 6 cases:
Table 6: Key Parameters of All 6 Cases
Unit Base Case
Case 2 Case 3 Case 4 Case 5 Case 6
Key Process Units (Red indicates change from the Base Case)
ML-WLS-OTSG
ML-Evap-OTSG
GL-WLS-OTSG
ML-WLS-OTSG-Cogen
ML-Evap-OTSG-Cogen
ML-WLS-Cogen
Boiler Feed Water Flow Rate kg/h 851,624 727,950 851,809 851,661 728,068 851,624Boiler Feed Wate Quality
Total Dissolved Solids 6,059 11 6,256 6,059 11 6,059Silica 34 0 34 34 0 34
Hardness 0 1 0 0 1 0Total Organic Carbon 515 0 514 515 0 515
Flue Gas Flow Rate MMCFD 462 443 491 369 369 769Flue Gas Temperature oC 195 188 175 195 188 195Flue Gas Component Flow Rates
Cabon dioxide 2,191 2,104 2,291 2,519 984 2,786Sulphur dioxide 0.06 0.06 0.06 0.06 0.00 0.00Nitrogen oxides 0.4 0.4 0.4 3.2 2.8 3.7
Oxygen Content in Flue Gas % 2.1% 6.8% 11.4% 7.2%Blow Down Flow Rate kg/h 63,435 0 59,141 63,454 0 63,442Blow Down Solids Content mg/l 28,472 0 31,537 28,464 0 28,467Blow Down Solid Flow Rate kg/h 2,153 0 2,217 2,153 0 2,152
mg/l
t/day
NA
COSIA SAGD Reference Facilities
Candor Engineering Ltd.
Page 19 of 60
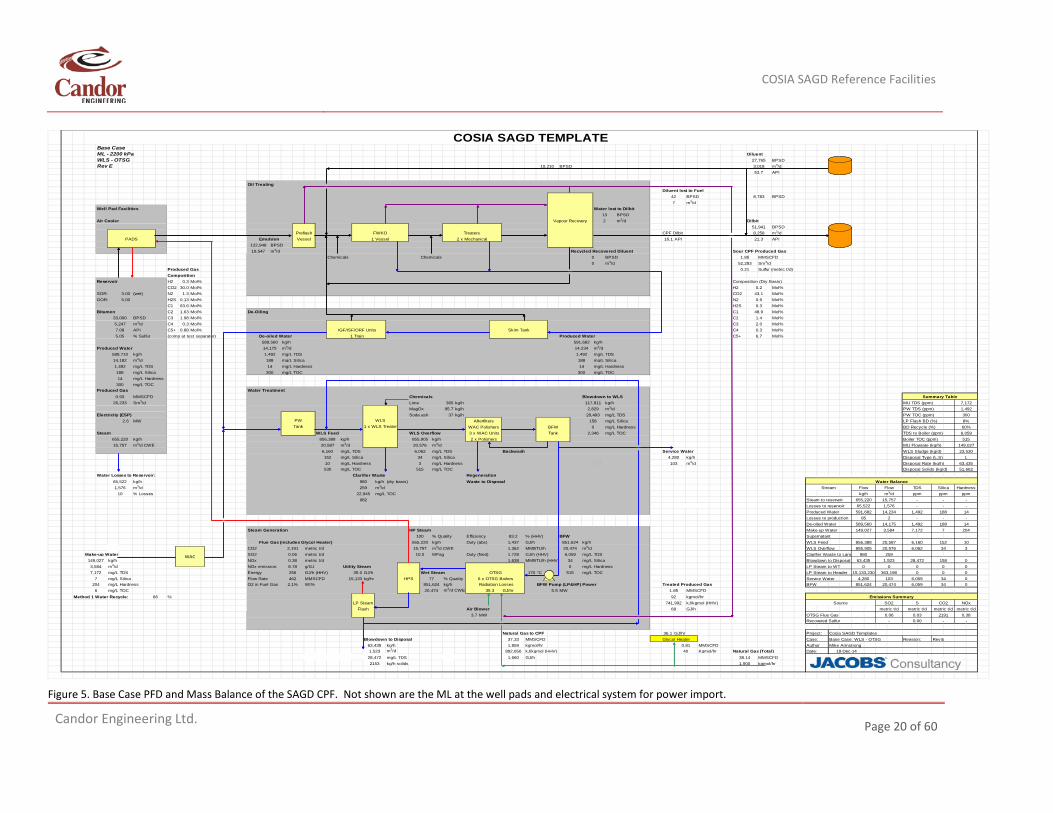
5. Central Processing Facility #1 (ML-WLS-OTSG)
The Process Flow Diagram (PFD) and Energy Flow Diagram (EFD) for this CPF#1 are provided in Figures 5 and 6, respectively. The following description will focus on the key technologies in each of the three processes in SAGD CPFs. They will not be encumbered by repeating the quantities and compositions of the flow streams which are available on the PFD or EFD.
5.1. Mechanical lift (ML)
Mechanical Lift (ML) using Electric Submersible Pumps (ESPs) (not shown in the PFD of Figure 5) is employed by the majority of commercial SAGD projects to produce bitumen-water emulsion from the reservoir to the surface. ESPs are a type of progressive cavity pumps driven by electricity sent by cables from the surface to the ESP motors located at the bottom of the Producers.(8) They pump the emulsion from each Producer to the surface of each pad. The emulsions from all the pads are then aggregated into a single pipeline and delivered to the CPF for oil-water separation and oil treatment.
5.2. Oil-Water Separation
The grey box at the top of Figure 5 summarizes the emulsion treatment to separate bitumen from the produced emulsion. It starts with pressure let down in the pre-flash vessel (PFV) to release dissolved gases from the emulsion. The de-gassed emulsion then flows to the free water knock-out (FWKO) vessel where un-emulsified water is separated with the aid of added chemicals to break down the emulsion and diluent. The purpose of the diluent is to form diluted bitumen (dilbit) that has a lower density in order to facilitate its separation from water by gravity.
The remaining emulsion is cooled from 175 to 133 oC by on-spec boiler feed water (BFW) and then flows to oil treaters where more chemicals are added. Cleaned dilbit is produced in the oil treaters and flows to a vapour recovery unit (VRU). In the VRU, liquid petroleum gases (LPGs) are separated from the clean dilbit to comply with pipeline vapour pressure limits. The recovered LPGs from the PFV and VRU are combined and used to supplement the total natural gas requirement for steam generation in the OTSG.
5.3. Water Treatment
The produced water separated from the oil is then treated to meet BFW quality for steam generation. The process is represented in the two boxes below the oil treatment box. The first step is to remove the residual bitumen in the recovered produced water from the FWKO and oil treaters. This is accomplished in a skim tank and then by induced gas floatation (IGF), induced static floatation (ISF) or oil recovery filters (ORF).(9) IGF or ISF separates oil from water by injecting small gas bubbles to attract the hydrophobic oil droplets and lift them to the water surface where the oil will be skimmed off. The recovered wet oil from IGF or ISF is sent to FWKO inlet stream while the de-oiled produced water will be treated in successive steps to meet BFW specification.
The goal of water treatment is to remove all the hardness and some silica from the produced water as well as from the make-up saline water such that the best quality steam could be produced subject to the remaining hardness and silica contents. Some hardness in the make-up saline water is first removed by ion exchangers and then added to the clean produced water for removal of the remaining hardness and some silica in the WLS process.(10)
COSIA SAGD Reference Facilities
Candor Engineering Ltd.
Page 20 of 60
Figure 5. Base Case PFD and Mass Balance of the SAGD CPF. Not shown are the ML at the well pads and electrical system for power import.
COSIA SAGD TEMPLATEBase CaseML - 2200 kPa DiluentWLS - OTSG 27,765 BPSDRev E BPSD 3,018 m3/d
API
Oil TreatingDiluent lost to Fuel
42 BPSD BPSD7 m3/d
Well Pad Facilities Water lost to Dilbit13 BPSD
Air Cooler Vapour Recovery 2 m3/d Dilbit51,941 BPSD
FWKO Treaters CPF Dilbit 8,258 m3/dPADS Emulsion 1 Vessel 2 x Mechanical 16.1 API API
122,948 BPSD19,547 m3/d Recycled Recovered Diluent Sour CPF Produced Gas
Chemicals Chemicals 0 BPSD 1.85 MMSCFD0 m3/d 52,283 Sm3/d
Produced Gas 0.21 Sulfur (metric t/d)Composition
Reservoir H2 0.3 Mol% Composition (Dry Basis)CO2 30.0 Mol% H2 Mol%
SOR: 3.00 (wet) N2 1.3 Mol% CO2 Mol%GOR: 5.00 H2S 0.13 Mol% N2 Mol%
C1 63.6 Mol% H2S Mol%Bitumen C2 1.63 Mol% De-Oiling C1 Mol%
33,000 BPSD C3 1.98 Mol% C2 Mol%5,247 m3/d C4 0.3 Mol% C3 Mol%7.08 API C5+ 0.88 Mol% IGF/ISF/ORF Units Skim Tank C4 Mol%5.05 % Sulfur (comp at test separator) De-oiled Water 1 Train Produced Water C5+ Mol%
589,560 kg/h 591,682 kg/hProduced Water 14,175 m3/d 14,234 m3/d
589,710 kg/h 1,492 mg/L TDS 1,492 mg/L TDS14,182 m3/d 188 mg/L Silica 188 mg/L Silica1,492 mg/L TDS 14 mg/L Hardness 14 mg/L Hardness188 mg/L Silica mg/L TOC mg/L TOC14 mg/L Hardness
mg/L TOCProduced Gas Water Treatment
0.93 MMSCFD Chemicals Blowdown to WLS Summary Table26,233 Sm3/d Lime 365 kg/h 117,811 kg/h MU TDS (ppm) 7,172
MagOx 95.7 kg/h 2,829 m3/d PW TDS (ppm) 1,492Electricity (ESP) Soda ash 37 kg/h 28,493 mg/L TDS PW TOC (ppm) 300
2.6 MW PW WLS Afterfilters 158 mg/L Silica LP Flash BD (%) 8%Tank 1 x WLS Treater WAC Polishers BFW 0 mg/L Hardness BD Recycle (%) 60%
Steam WLS Feed WLS Overflow 3 x WAC Units Tank mg/L TOC TDS to Boiler (ppm) 6,059655,220 kg/h kg/h 855,905 kg/h 2 x Polishers Boiler TOC (ppm) 51515,757 m3/d CWE 20,587 m3/d 20,576 m3/d MU Flowrate (kg/h) 149,027
6,160 mg/L TDS 6,062 mg/L TDS Backwash Service Water WLS Sludge (kg/d) 23,530152 mg/L Silica 34 mg/L Silica 4,280 kg/h Disposal Type (L,S) L10 mg/L Hardness 3 mg/L Hardness 103 m3/d Disposal Rate (kg/h) 63,435
mg/L TOC mg/L TOC Disposal Solids (kg/d) 51,662Water Losses to Reservoir: Clarifier Waste Regeneration
65,522 kg/h 980 kg/h (dry basis) Waste to Disposal Water Balance1,576 m3/d 259 m3/d Stream Flow Flow TDS Silica Hardness
10 % Losses mg/L TOC kg/h m3/d ppm ppm ppmSteam to reservoir 655,220 15,757 - - -Losses to reservoir 65,522 1,576 - - -Produced Water 591,682 14,234 1,492 188 14Losses to production 85 2 - - -De-oiled Water 589,560 14,175 1,492 188 14
Steam Generation HP Steam Make-up Water 149,027 3,584 7,172 7 204100 % Quality Efficiency % (HHV) BFW Supernatant
Flue Gas (includes Glycol Heater) 655,220 kg/h Duty (abs) GJ/h 851,624 kg/h WLS Feed 20,587 6,160 152 10CO2 2,191 metric t/d 15,757 m3/d CWE MMBTU/h 20,474 m3/d WLS Overflow 855,905 20,576 6,062 34 3
Make-up Water SO2 0.06 metric t/d MPag Duty (fired) GJ/h (HHV) 6,059 mg/L TDS Clarifier Waste to Land 980 259149,027 kg/h NOx 0.38 metric t/d MMBTU/h (HHV) 34 mg/L Silica Blowdown to Disposal 63,435 1,523 28,472 158 03,584 m3/d NOx emission: 8.78 g/GJ 0 mg/L Hardness LP Steam to WT 0 0 0 0 07,172 mg/L TDS Energy GJ/h (HHV) GJ/h Wet Steam OTSG 170 °C mg/L TOC LP Steam to Header 15,133,230 363,198 0 0 0
7 mg/L Silica Flow Rate MMSCFD kg/hr HPS 77 % Quality 6 x OTSG Boilers Service Water 4,280 103 6,059 34 0204 mg/L Hardness O2 in Fuel Gas Wt% 851,624 kg/h Radiation Losses BFW Pump (LP&HP) Power Treated Produced Gas BFW 851,624 20,474 6,059 34 0
mg/L TOC 20,474 m3/d CWE 35.3 GJ/hr 5.5 MW 1.85 MMSCFDMethod 1 Water Recycle: 86 % kgmol/hr Emissions Summary
kJ/kgmol (HHV) Source SO2 S CO2 NOxAir Blower GJ/h metric t/d metric t/d metric t/d metric t/d
3.7 MW OTSG Flue Gas 0.06 0.03 2191 0.38Recovered Sulfur - 0.00 - -
Natural Gas to CPF 36.1 GJ/hr Project: Cosia SAGD TemplatesBlowdown to Disposal 37.33 MMSCFD Glycol Heater Case: Base Case: WLS - OTSG Revision: Rev E
63,435 kg/h kgmol/hr MMSCFD Author Mike Armstrong1,523 m3/d kJ/kgmol (HHV) Kgmol/hr Natural Gas (Total) Date:
mg/L TDS GJ/h 38.14 MMSCFD2153 kg/h solids kgmol/hr
10,21053.7
8,783
PreflashVessel 21.3
300
0.243.10.90.3
48.91.42.00.36.7
300 300
856,388
530 515
22,945982
856,3881,362
10.0 1,728
2,346
256 35.0 515
83.21,437
LP Steam 741,992
1,638Utility Steam
462 15,1332.1%
692
Flash 68
1,859 0.81892,650 40 18-Dec-14
28,472 1,6601,900
WACWAC
COSIA SAGD Reference Facilities
Candor Engineering Ltd.
Page 21 of 60
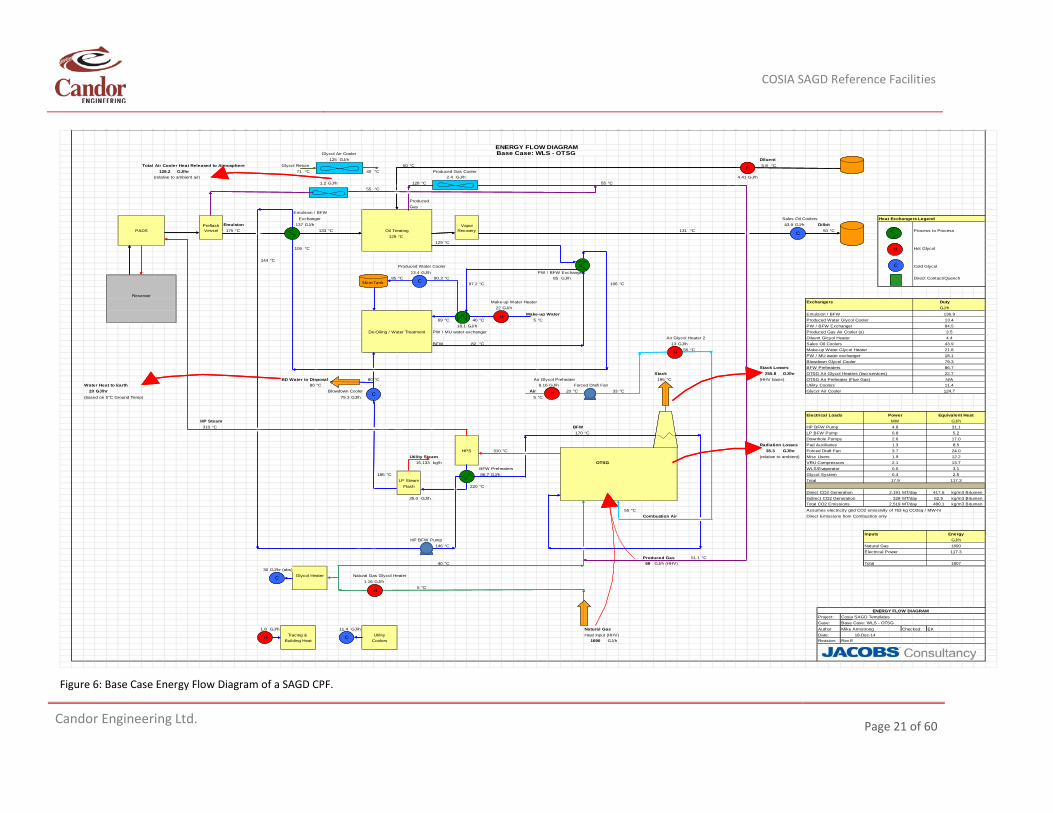
Figure 6: Base Case Energy Flow Diagram of a SAGD CPF.
Glycol Air Cooler125 GJ/h Diluent
Total Air Cooler Heat Released to Atmosphere Glycol Return 50 °C 5.8 °CGJ/hr 71 °C 40 °C Produced Gas Cooler
(relative to ambient air) GJ/h 4.41 GJ/h1.2 GJ/h 128 °C 55 °C
55 °C
ProducedGas
Emulsion / BFWExchanger Sales Oil Coolers Heat Exchangers Legend
Emulsion 137 GJ/h 43.9 GJ/h DilbitPADS 175 °C 133 °C Oil Treating 131 °C 50 °C Process to Process
129 °C129 °C
106 °C Hot Glycol
144 °CProduced Water Cooler Cold Glycol
13.4 GJ/h PW / BFW Exchanger85 °C 90.3 °C 85 GJ/h Direct Contact/Quench
97.2 °C 106 °C
ReservoirMake-up Water Heater Exchangers Duty
22 GJ/h GJ/hMake-up Water Emulsion / BFW 136.9
69 °C 40 °C 5 °C Produced Water Glycol Cooler 13.418.1 GJ/h PW / BFW Exchanger 84.5
De-Oiling / Water Treatment PW / MU water exchanger Produced Gas Air Cooler (s) 3.5Air Glycol Heater 2 Diluent Glcyol Heater 4.4
BFW 82 °C 13 GJ/h Sales Oil Coolers 43.955 °C Make-up Water Glycol Heater 21.8
PW / MU water exchanger 18.1Blowdown Glycol Cooler 79.3
Stack Losses BFW Preheaters 86.7Stack 255.8 GJ/hr OTSG Air Glycol Heaters (two services) 22.7
BD Water to Disposal 80 °C Air Glycol Preheater 195 °C (HHV basis) OTSG Air Preheater (Flue Gas) N/AWater Heat to Earth 80 °C 9.16 GJ/h Forced Draft Fan Utility Coolers 11.4
20 GJ/hr Blowdown Cooler Air 20 °C Fan 33 °C Glycol Air Cooler 124.7(based on 5°C Ground Temp) 79.3 GJ/h 5 °C
Electrical Loads Power Equivalent HeatHP Steam MW GJ/h310 °C BFW HP BFW Pump 4.8 31.1
170 °C LP BFW Pump 0.8 5.2Downhole Pumps 2.6 17.0
Radiation Losses Pad Auxiliaries 1.3 8.5HPS 310 °C 35.3 GJ/hr Forced Draft Fan 3.7 24.0
Utility Steam (relative to ambient) Misc Users 1.9 12.2kg/h OTSG VRU Compressors 2.1 13.7
BFW Preheaters WLS/Evaporator 0.5 3.1186 °C 86.7 GJ/h Glycol System 0.4 2.5
Total 17.9 117.3220 °C
Direct CO2 Generation MT/day 417.6 kg/m3 BitumenGJ/h Indirect CO2 Generation MT/day 62.5 kg/m3 Bitumen
Total CO2 Emissions MT/day kg/m3 Bitumen55 °C Assumes electricity grid CO2 emissivity of 763 kg CO2eq / MW-hr
Combustion Air Direct Emissions from Combustion only
Inputs EnergyHP BFW Pump GJ/h
146 °C Natural Gas 1690Electrical Power 117.3
Produced Gas 51.1 °C40 °C 68 GJ/h (HHV) Total 1807
30 GJ/hr (abs)Glycol Heater Natural Gas Glycol Heater
1.16 GJ/h5 °C
ENERGY FLOW DIAGRAM Project: Cosia SAGD TemplatesCase: Base Case: WLS - OTSG
GJ/h GJ/h Natural Gas Author Mike Armstrong Checked: EKTracing & Utility Heat Input (HHV) Date:
Building Heat Coolers GJ/h Revision: Rev E18-Dec-14
1690
2,19135.0 328
2,519 480.1
1.8 11.4
15,133
LP SteamFlash
ENERGY FLOW DIAGRAMBase Case: WLS - OTSG
128.22.4
Preflash Vessel
Vapor Recovery C
H
C
H
C
H C
H
H
H
H
C
Skim Tank C
C
H
C
H
C
H C
H
H
H
H
C
Skim Tank C
COSIA SAGD Reference Facilities
Candor Engineering Ltd.
Page 22 of 60
The WLS process consists of three steps. Firstly, calcium or magnesium oxide is added to the WLS unit to convert calcium or magnesium ions to the less soluble calcium carbonate or magnesium carbonate. The carbonates will flocculate to form larger flocs, which would sink to the bottom of the WLS vessel and are removed and disposed of as wastes. Secondly, the WLS overflow enters filters to remove suspended solids and then thirdly, to WAC units to remove the remaining hardness.(11) The WAC units contain resins with ion exchange sites where the hardness forming ions, typically, Ca2+ and Mg2+ attach themselves to, and are replaced with other ions, typically Na+, that would not form any hardness. WAC units operate in a batch mode with regenerated units treating the BFW while the remaining units undergo regeneration with hydrochloric acid.
5.4. Steam Generation
The on-spec BFW is sent to the OTSG to generate 77 wt% HP steam of about 9.9 MPa which is the best quality steam consistent with the BFW quality treated with WLS. OTSG are simple commercial boilers that have been used in oil and gas operations for a long time. They are fitted with low NOx or ultra-low NOx burners for NOx emission control. The main reason that 100 wt% steam is not generated in the OTSG is to avoid fouling of the boiler tubes in the OTSG. Premature fouling will necessitate OTSG maintenance that would reduce bitumen production and loss of revenue as a result. The 9.9 MPa HP wet steam is sent to a HP steam separator where 100 wt% HP steam emerges from its top while the bottom liquid steam is sent to a LP steam flash operating at about 1.1 MPa. The LP flash will produce utility steam for the SAGD CPF while the bottom is a liquid stream called blow-down, containing all the dissolved and suspended solids. The blow-down is sent to deep underground wells for disposal.
Note that current oil sands regulations forbid the use of fresh water makeup, and 90% of the produced water must be recycled and re-used. As shown in the water balance in the PFD, the two major water losses are to the reservoir (about 10 wt% of steam injection (CWE)) and blow-down disposal in deep wells (about 10 wt%). To make up for these losses, saline water is brought into the CPF to replenish them. According to the water balance, the make-up is about 23 wt% of SAGD steam requirement (CWE).
5.5. Energy Flow
Figure 6 depicts the energy balance of the 5,247 m3 per day (m3/d) SAGD production facility. The two major energy inputs are natural gas mainly for steam generation in the OTSG and electricity imported from the Grid.
The 5,247 m3/d SAGD project imports 1,696 GJ (HHV) per hour (GJ/h) of pipeline natural gas. A small amount of 36 GJ/h is used in glycol heaters to provide combustion air pre-heat and other minor site demands. Supplemented by 68 GJ/h of produced LPG, a total of 1,728 GJ/h is used in the OTSGs. This facility imports 17.9 MW of electricity from the Grid or 117 GJ/h. The major consumers are HP BFW pumps (26.5%), direct forced draft fan to deliver OTSG combustion air (20.5%), ML (14.5%), and VRU compressors (11.7%).
5.6. Overview of Process and Heat Integration
The primary operational objectives of SAGD CPF are to:
• Produced clean dilbit that is blended with additional diluent to meet pipeline specifications of vapour pressure, density, viscosity and basic sediment and water (BS&W) contents;
• Recover the maximum amount of produced water in order to minimize water make up and to comply with AER regulation of water recycle. Treat the produced water to meet BFW specification; and
• Generate HP Steam for SAGD operation.
COSIA SAGD Reference Facilities
Candor Engineering Ltd.
Page 23 of 60
From the PFD, it is evident that the three processes are intimately linked. For example, upset in emulsion treating will reduce produced water supply for BFW and would necessitate more make-up water import to generate the same amount of steam. When water treatment process is not performing to design specification of BFW quality, premature fouling of the OTSG boiler tubes may occur. Consequently, OTSG will have to undergo unplanned maintenance, resulting in insufficient steam production and adversely affecting SAGD bitumen production.
The energy flow diagram (EFD) provides several examples of waste heat utilization;
• BFW is pre-heated from water treatment outlet at 82 oC to 170 oC before entering the OTSG economizers via a series of heat exchangers, absorbing sensible heat contents in treated oil, inlet emulsion, and then from the HP steam separator blow-down;
• BFW is further pre-heated by OTSG stack gas economizers; and
• Recovery of utility steam from the HP steam separator blow-down for use in bitumen or water treatments;
5.7. GHG Emissions
Each SAGD project emits significant amounts of GHG. Total GHG emissions are 2,519 tonnes per day (t/d) consisting of 2,191 t/d directly from natural gas combustion and 328 t/d indirectly from imported Grid electricity.
In the latter case, the Grid intensity is calculated to be 763 kg per MWh, which is high as the Alberta grid is dominated by coal fired power generation. The SAGD GHG intensity (consisting of CO2 only) is therefore about 480 kg per m3 (kg/m3) or 76 kg per barrel (kg/bbl), of bitumen production, which is 2 to 4 times conventional crude production.(6)
Any means to reduce this intensity should be considered. In the subsequent sections, some of them are described, including: using Evaporators to produce higher quality BFW to eliminate blow down and reduce fossil fuel consumption, deploying GL instead of ML to reduce electricity use, or implementing cogeneration on site to partially or completely replace OTSG and eliminate power import.
COSIA SAGD Reference Facilities
Candor Engineering Ltd.
Page 24 of 60
6. Central Processing Facility #2 (ML-Evap-OTSG)
The process flow Diagram (PFD) and Energy Flow Diagram (EFD) for this CPF#2 are provided in Figures 7 and 8, respectively.
The only change in CPF#2 over CPF#1 is to use Evaporators to replace WLS in water treatment. The ML, oil treatment and steam generation will be similar to those described in Sections 5.1, 5.2 and 5.4.
6.1. Using Evaporators instead of Warm Lime Softening (WLS)
The limitation of WLS in water treatment is that the BFW quality is not good enough to make 100 wt% HP steam in the OTSG. As a result, 77 wt% HP steam is produced in order to avoid pre-mature fouling of the boiler tubes and to make sure that the dissolved solids are contained in the 23 wt% liquid fraction. This means the BFW flow rate is 30% more that the steam requirement (CWE basis) resulting in higher fuel and electricity demands.
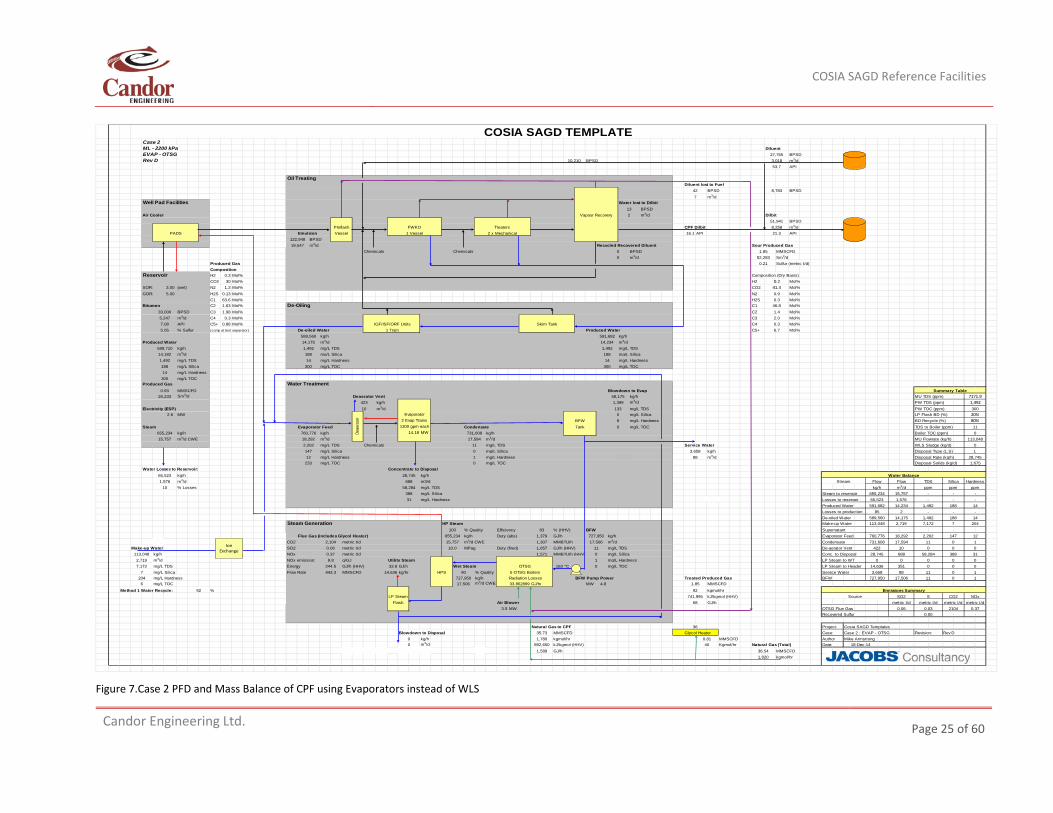
One alternative to improving BFW so that much higher quality HP steam can be produced directly is to use Evaporators (12) to replace WLS as shown in Figure 7 below.
The Evaporators replace WLS, filters and WAC pursuant to the de-oiling process units. The de-oiled produced water, liquid stream from the LP flash and softened make-up saline water are combined and fed into a de-aerator to remove non-condensable gas and oxygen. The de-aerated water is then fed into the Evaporators. Good quality BFW is produced from the condensed vapour stream while all the solids are contained in the liquid underflow which is disposed of as waste off the SAGD site. The remaining hardness is close to zero, achieved in both WLS or Evaporators (see Table 6). The improvements over WLS are in the reductions of total dissolved solids (TDS), silica, and total organic carbon (TOC) contents, respectively from 6,059 to 11 mg per litre (mg/l) for TDS, 34 to 0 mg/l for silica and 515 to 0 mg/l for TOC.
This high quality BFW from Evaporators will allow the direct production of higher HP steam quality than 77 wt%. In this version, 90 wt% is produced from OTSG and sent to the HP steam separator. 100 wt% HP steam emerges from its top and is sent to SAGD wells, while the 10 wt% liquid stream is sent to the LP flash in order to make the required utility steam for site use. The liquid stream from the flash is recycled to the de-aerator as mentioned above.
There are many types of Evaporators. One embodiment uses mechanical vapour compression to provide the heat to vaporize the de-aerated water.(12) Vapour is condensed as high quality BFW while all the solids, silica and hardness are contained in the liquid under-flow stream.
6.2. Overview of Process and Heat Integration
The direct result of using Evaporators is the improved reliability of steam generation resulting from the higher BFW quality. Also, using Evaporators achieves a 15% reduction of BFW requirement, dropping form 851,624 kg per hour (kg/h) in the Base Case using WLS to 727,950 kg/h in Case 2 using Evaporators. Water conservation is improved by 24% per unit of bitumen production (see Table 5). As BFW requirement is reduced, so is the number of OTSGs reduced from 6 to 5. Further the disposal in deep underground wells of high-solid content blow down is replaced with handling of evaporator wastes for off-site disposal. This obviates the application of deep disposal well permit and allays the concern of underground water contamination by the blow-down waste stream.
COSIA SAGD Reference Facilities
Candor Engineering Ltd.
Page 25 of 60
Figure 7.Case 2 PFD and Mass Balance of CPF using Evaporators instead of WLS
COSIA SAGD TEMPLATECase 2 ML - 2200 kPa DiluentEVAP - OTSG 27,765 BPSDRev D BPSD 3,018 m3/d
API
Oil TreatingDiluent lost to Fuel
42 BPSD BPSD7 m3/d
Well Pad Facilities Water lost to Dilbit13 BPSD
Air Cooler Vapour Recovery 2 m3/d Dilbit51,941 BPSD
FWKO Treaters CPF Dilbit 8,258 m3/dPADS Emulsion 1 Vessel 2 x Mechanical 16.1 API API
122,948 BPSD19,547 m3/d Recycled Recovered Diluent Sour Produced Gas
Chemicals Chemicals 0 BPSD 1.85 MMSCFD0 m3/d 52,283 Sm3/d
Produced Gas 0.21 Sulfur (metric t/d)Composition
Reservoir H2 0.3 Mol% Composition (Dry Basis)CO2 30 Mol% H2 Mol%
SOR: 3.00 (wet) N2 1.3 Mol% CO2 Mol%GOR: 5.00 H2S 0.13 Mol% N2 Mol%
C1 63.6 Mol% H2S Mol%Bitumen C2 1.63 Mol% De-Oiling C1 Mol%
33,000 BPSD C3 1.98 Mol% C2 Mol%5,247 m3/d C4 0.3 Mol% C3 Mol%7.08 API C5+ 0.88 Mol% IGF/ISF/ORF Units Skim Tank C4 Mol%5.05 % Sulfur (comp at test separator) De-oiled Water 1 Train Produced Water C5+ Mol%
589,560 kg/h 591,682 kg/hProduced Water 14,175 m3/d 14,234 m3/d
589,710 kg/h 1,492 mg/L TDS 1,492 mg/L TDS14,182 m3/d 188 mg/L Silica 188 mg/L Silica1,492 mg/L TDS 14 mg/L Hardness 14 mg/L Hardness188 mg/L Silica mg/L TOC mg/L TOC14 mg/L Hardness
mg/L TOCProduced Gas Water Treatment
0.93 MMSCFD Blowdown to Evap Summary Table26,233 Sm3/d Deaerator Vent 58,175 kg/h MU TDS (ppm) 7171.9
423 kg/h 1,399 m3/d PW TDS (ppm) 1,492Electricity (ESP) 10 m3/d 133 mg/L TDS PW TOC (ppm) 300
2.6 MW 0 mg/L Silica LP Flash BD (%) 20%BFW 8 mg/L Hardness BD Recycle (%) 80%
Steam Evaporator Feed 1300 gpm each Condensate Tank mg/L TOC TDS to Boiler (ppm) 11655,234 kg/h kg/h MW 731,608 kg/h Boiler TOC (ppm) 015,757 m3/d CWE 18,292 m3/d 17,594 m3/d MU Flowrate (kg/h) 113,048
2,202 mg/L TDS Chemicals 11 mg/L TDS Service Water WLS Sludge (kg/d) 0147 mg/L Silica 0 mg/L Silica 3,658 kg/h Disposal Type (L,S) L12 mg/L Hardness 1 mg/L Hardness 88 m3/d Disposal Rate (kg/h) 28,745
mg/L TOC mg/L TOC Disposal Solids (kg/d) 1,675Water Losses to Reservoir: Concentrate to Disposal
65,523 kg/h 28,745 kg/h Water Balance1,576 m3/d 688 m3/d Stream Flow Flow TDS Silica Hardness
10 % Losses 58,284 mg/L TDS kg/h m3/d ppm ppm ppm388 mg/L Silica Steam to reservoir 655,234 15,757 - - -31 mg/L Hardness Losses to reservoir 65,523 1,576 - - -
Produced Water 591,682 14,234 1,492 188 14Losses to production 85 2 - - -De-oiled Water 589,560 14,175 1,492 188 14
Steam Generation HP Steam Make-up Water 113,048 2,719 7,172 7 204100 % Quality Efficiency % (HHV) BFW Supernatant
Flue Gas (includes Glycol Heater) 655,234 kg/h Duty (abs) GJ/h 727,950 kg/h Evaporator Feed 18,292 2,202 147 12CO2 2,104 metric t/d 15,757 m3/d CWE MMBTU/h 17,506 m3/d Condensate 731,608 17,594 11 0 1
Make-up Water SO2 0.06 metric t/d MPag Duty (fired) GJ/h (HHV) 11 mg/L TDS De-aerator Vent 423 10 0 0113,048 kg/h NOx 0.37 metric t/d MMBTU/h (HHV) 0 mg/L Silica Conc. to Disposal 28,745 688 58,284 388 312,719 m3/d NOx emission: 8.8 g/GJ Utility Steam 1 mg/L Hardness LP Steam to WT 0 0 0 0 07,172 mg/L TDS Energy 244.5 GJ/h (HHV) GJ/h Wet Steam OTSG 163 °C mg/L TOC LP Steam to Header 14,636 351 0 0 0
7 mg/L Silica Flow Rate 443.3 MMSCFD kg/hr HPS 90 % Quality 5 OTSG Boilers Service Water 3,658 88 11 0 1204 mg/L Hardness 727,950 kg/h Radiation Losses BFW Pump Power Treated Produced Gas BFW 727,950 17,506 11 0 1
mg/L TOC 17,506 m3/d CWE 33.862899 GJ/hr MW 4.8 1.85 MMSCFDMethod 1 Water Recycle: 92 % kgmol/hr Emissions Summary
kJ/kgmol (HHV) Source SO2 S CO2 NOxAir Blower GJ/h metric t/d metric t/d metric t/d metric t/d
3.5 MW OTSG Flue Gas 0.06 0.03 2104 0.37Recovered Sulfur - 0.00 - -
Natural Gas to CPF Project: Cosia SAGD TemplatesBlowdown to Disposal 35.73 MMSCFD Glycol Heater Case: Case 2 : EVAP - OTSG Revision: Rev D
0 kg/h kgmol/hr MMSCFD Author Mike Armstrong0 m3/d kJ/kgmol (HHV) Kgmol/hr Natural Gas (Total) Date:
GJ/h 36.54 MMSCFD1,820 kgmol/hr
1,589
36
1,780 0.81892,650 40
01,571
18-Dec-14
14,636
692
LP Steam 741,995Flash 68
33.8 0
233 0
831,3791,307
10.0 1,657
760,776
Deae
rato
r
Evaporator2 Evap Trains
0760,776 14.18
300
0.241.30.90.3
46.81.42.00.36.7
300 300
10,21053.7
8,783
PreflashVessel 21.3
Ion Exchange
COSIA SAGD Reference Facilities
Candor Engineering Ltd.
Page 26 of 60
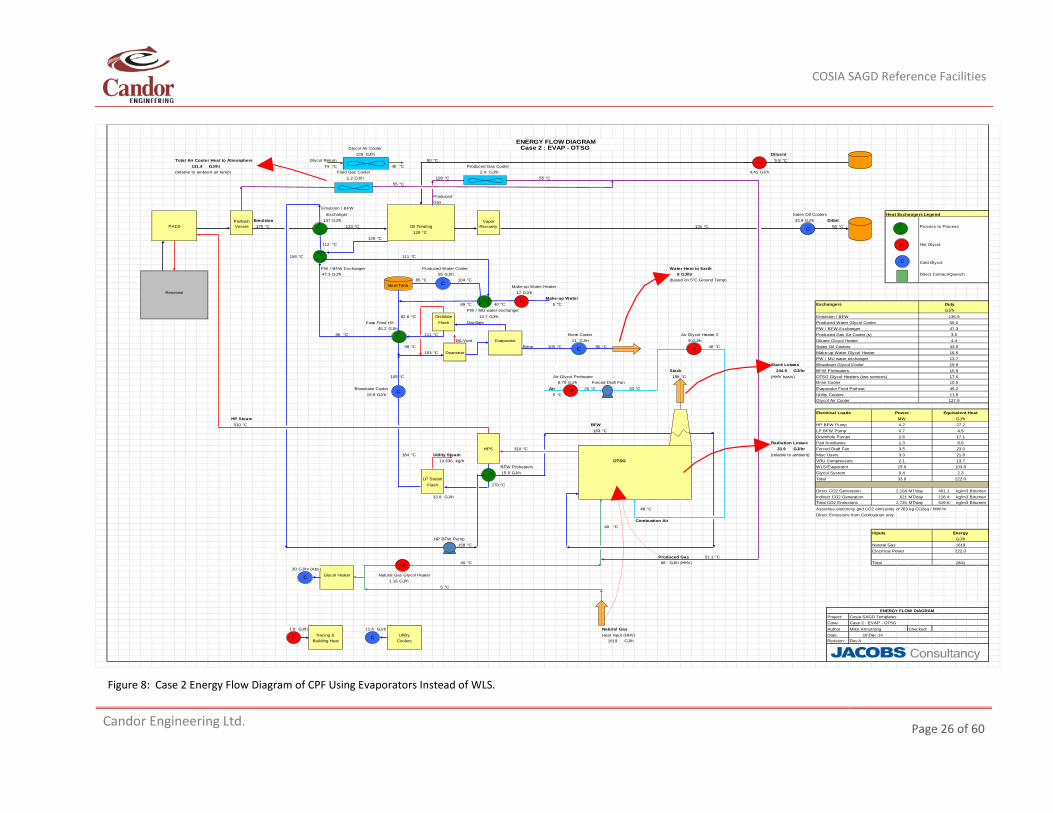
Figure 8: Case 2 Energy Flow Diagram of CPF Using Evaporators Instead of WLS.
Glycol Air Cooler128 GJ/h Diluent
Total Air Cooler Heat to Atmosphere Glycol Return 50 °C 5.8 °CGJ/hr 74 °C 40 °C Produced Gas Cooler
(relative to ambient air temp) Field Gas Cooler GJ/h 4.41 GJ/h1.2 GJ/h 128 °C 55 °C
55 °C
ProducedGas
Emulsion / BFWExchanger Sales Oil Coolers Heat Exchangers Legend
Emulsion 137 GJ/h 43.9 GJ/h DilbitPADS 175 °C 133 °C Oil Treating 131 °C 50 °C Process to Process
129 °C129 °C
112 °C Hot Glycol
156 °C 111 °CCold Glycol
PW / BFW Exchanger Produced Water Cooler Water Heat to Earth47.3 GJ/h 55 GJ/h 9 GJ/hr Direct Contact/Quench
85 °C 104 °C (based on 5°C Ground Temp)Make-up Water Heater
Reservoir 17 GJ/hMake-up Water
69 °C 40 °C 5 °C Exchangers DutyPW / MU water exchanger GJ/h
82.6 °C Distillate 13.7 GJ/h Emulsion / BFW 136.9Evap Feed HX Flash Distillate Produced Water Glycol Cooler 55.0
45.2 GJ/h PW / BFW Exchanger 47.396 °C 111 °C Brine Cooler Air Glycol Heater 2 Produced Gas Air Cooler (s) 3.5
DA Vent Evaporator 11 GJ/h 9 GJ/h Diluent Glcyol Heater 4.498 °C Brine 105 °C 80 °C 48 °C Sales Oil Coolers 43.9
103 °C Deaerator Make-up Water Glycol Heater 16.5PW / MU water exchanger 13.7
Stack Losses Blowdown Glycol Cooler 19.9Stack GJ/hr BFW Preheaters 15.9
105 °C Air Glycol Preheater 188 °C (HHV basis) OTSG Glycol Heaters (two services) 17.68.79 GJ/h Forced Draft Fan Brine Cooler 10.5
Blowdown Cooler Air 20 °C Fan 33 °C Evaporator Feed Preheat 45.219.9 GJ/h 5 °C Utility Coolers 11.6
Glycol Air Cooler 127.9
Electrical Loads Power Equivalent HeatHP Steam MW GJ/h310 °C BFW HP BFW Pump 4.2 27.2
163 °C LP BFW Pump 0.7 4.5Downhole Pumps 2.6 17.1
Radiation Losses Pad Auxiliaries 1.3 8.6HPS 310 °C GJ/hr Forced Draft Fan 3.5 23.0
184 °C Utility Steam (relative to ambient) Misc Users 3.3 21.8kg/h OTSG VRU Compressors 2.1 13.7
BFW Preheaters WLS/Evaporator 15.9 103.815.9 GJ/h Glycol System 0.4 2.3
Total 33.9 222.0270 °C
Direct CO2 Generation MT/day 401.1 kg/m3 BitumenGJ/h Indirect CO2 Generation MT/day 118.4 kg/m3 Bitumen
Total CO2 Emissions MT/day kg/m3 Bitumen48 °C Assumes electricity grid CO2 emissivity of 763 kg CO2eq / MW-hr
Direct Emissions from Combustion onlyCombustion Air
40 °CInputs Energy
HP BFW Pump GJ/h158 °C Natural Gas 1619
Electrical Power 222.0Produced Gas 51.1 °C
40 °C 68 GJ/h (HHV) Total 184130 GJ/hr (Abs)
Glycol Heater Natural Gas Glycol Heater1.16 GJ/h
5 °C
ENERGY FLOW DIAGRAM Project: Cosia SAGD TemplatesCase: Case 2 : EVAP - OTSG
GJ/h GJ/h Natural Gas Author Mike Armstrong Checked:Tracing & Utility Heat Input (HHV) Date:
Building Heat Coolers GJ/h Revision: Rev A
519.5
1.8 11.6 18-Dec-14
1619
2,725
LP SteamFlash
2,10433.8 621
244.5
33.9
14,636
ENERGY FLOW DIAGRAMCase 2 : EVAP - OTSG
131.42.4
Preflash Vessel
Vapor Recovery C
H
C
H
C
H C
H
H
H
C
Skim Tank C
C H
COSIA SAGD Reference Facilities
Candor Engineering Ltd.
Page 27 of 60
The attendant impacts of using Evaporators are the minor reduction of fuel requirement but a significant increase of electricity use. In the former, per unit of bitumen production, fuel requirement drops 2% from 8.7 GJ per m3 bitumen (GJ/m3) to 8.6 GJ/m3 (see Table 5). Power requirement escalates from 17.9 MW to 33.9 MW, an increase of 89%. This results directly from using mechanical vapour compression as a means to provide heat to vapourize BFW.
There is no significant change in process integration vis-à-vis the Base Case.
Figure 8 shows the energy flow of CPF#2. As the Evaporators use electricity to make high quality BFW, there is little chance of integrating with or extracting waste heat from, the other parts of SAGD CPF as they are entirely thermal.
6.3. GHG Emissions
As electricity is imported from the GHG intensive Grid which is dominated by coal fired power generation, the GHG emissions increase by 8% from 480 to 519 kg/m3 (76 to 83 kg/bbl) of bitumen produced. The reduction in direct emissions from fossil fuel consumption cannot entirely offset the increase from the indirect emissions of Grid electricity import.
COSIA SAGD Reference Facilities
Candor Engineering Ltd.
Page 28 of 60
7. Central Processing Facility #3 (GL-WLS-OTSG)
The process flow Diagram (PFD) and Energy Flow Diagram (EFD) for this CPF#3 are provided in Figures 9 and 10, respectively.
The only change in CPF#3 over CPF#1 is to use gas lift (GL) to replace mechanical lift (ML) or electrical submersible pumps (ESPs) for oil production. The oil and water treatments, and steam generation will be similar to those described in Sections 5.2, 5.3 and 5.4.
7.1. Gas Lift (GL) Replacing Mechanical Lift (ML)
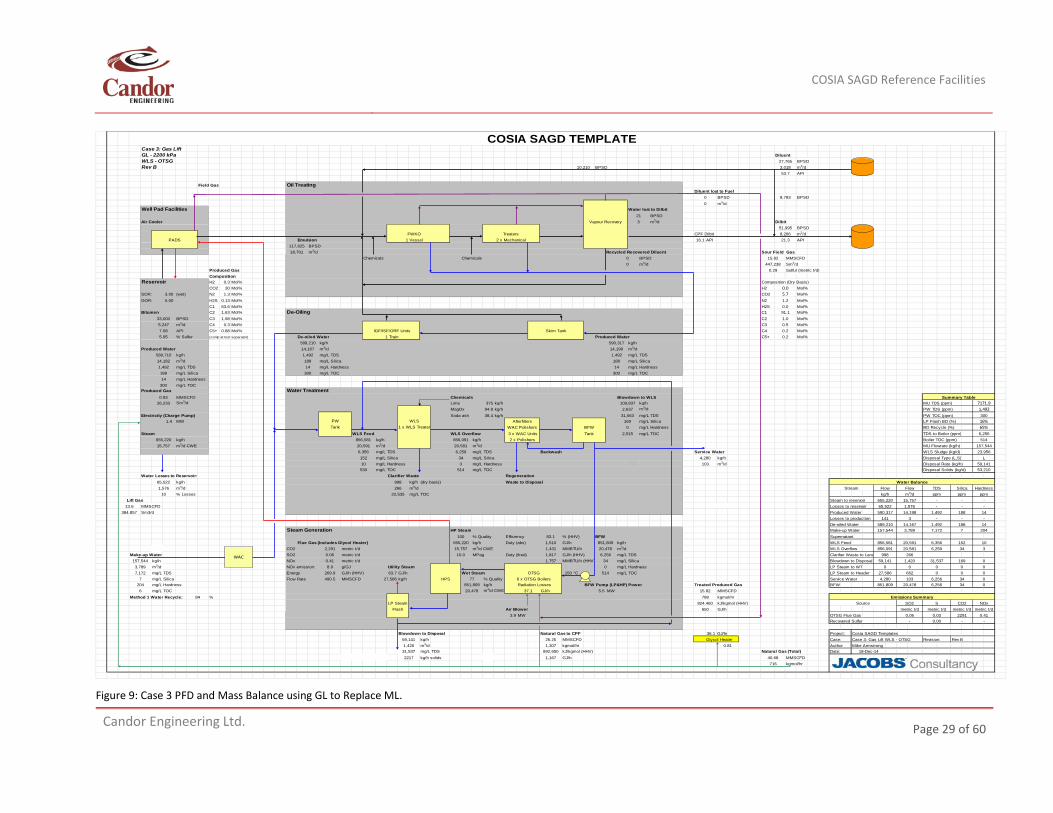
The majority of SAGD production design employs electrical submersible pumps (ESP) to pump emulsion from the Producers to the surface. Before ESPs have become as reliable as they are now, GL was employed to push emulsion to the surface. Figure 9 depicting the PFD and mass balance of this case where GL replaces ESP. It shows essentially the same processes as those of the Base Case. The exception is the elimination of a pre-Flash vessel (PFV). In the current configuration, the natural gas used in the GL, after it is separated from the emulsion, joins the LPG recovered from the VRU for use in the OTSG.
In the GL design, HP pipeline natural gas is injected into the annulus of the producer.(13) At the bottom of the Producer annulus, it enters its tubing through gas lift valves to aerate the collected emulsion, thus reducing its density and the hydrostatic head of the emulsion in the tubing. The natural gas pressure must be high enough to overcome this hydrostatic head and push the emulsion to the surface. For deeper oil sands reservoirs, the natural gas pressure may not be high enough and GL cannot be deployed. Other negative effects of GL vis-à-vis ML have already been described in Section 1.
GL accomplishes two objectives. The first is to produce emulsion to the surface without any mechanical devices and electricity consumption. The second is the de-pressurization of HP pipeline natural gas. The burners of the OTSG require much lower pressure than is supplied directly from the pipeline. Without GL to reduce its pressure in the Producers, the HP natural gas has to be de-pressurized through a letdown valve or small gas turbine.
7.2. Overview of Process and Heat Integration
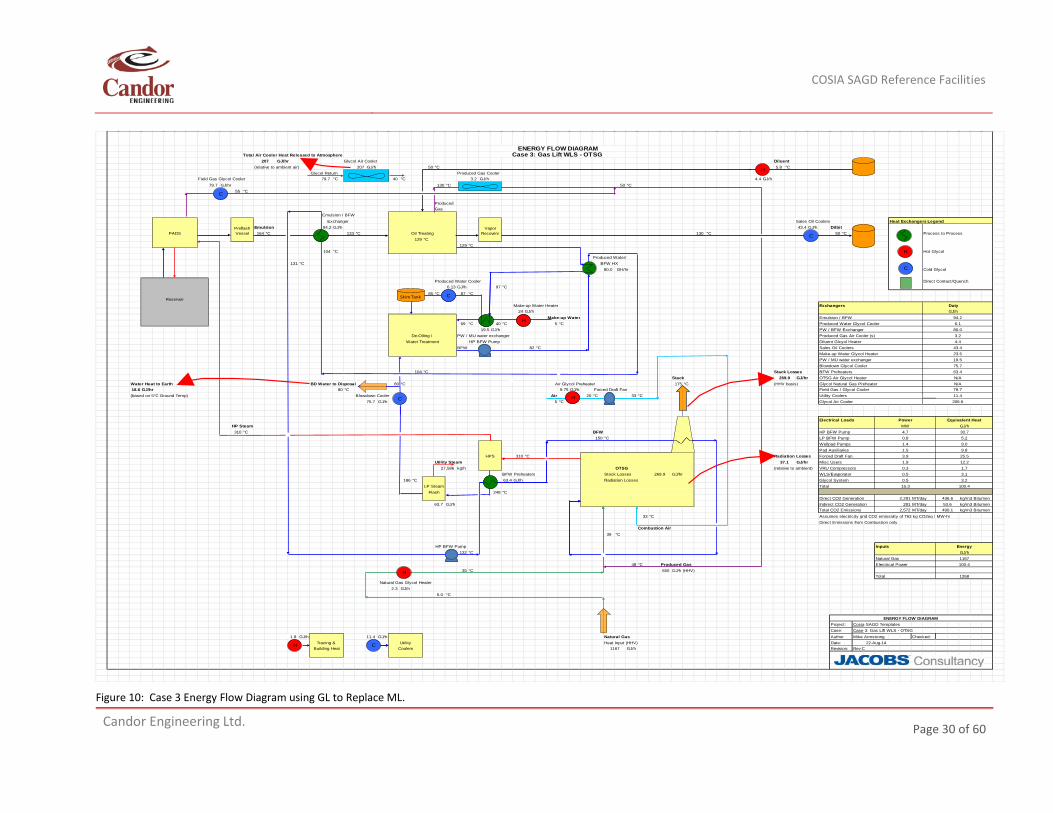
In the Case 3 design, 36% of the total natural gas fuel requirement of 1,817 GJ/h is used in the GL. After pushing the emulsion to the surface, the lifting gas joins up with the remaining natural gas for steam generation in the OTSG. Relative to the Base Case, fuel requirement is increased slightly by 6% (See Table 5). The higher fuel requirement is offset by the 16% lower demand of power, reducing from 17.9 MW to 15.1 MW, relative to the Base Case (see Figure 10). Make-up water demand has increased by 6% according to this design.
As seen in Figure 10, there is virtually no change in terms of process and heat integration vis-à-vis the Base Case when GL is used instead of ESP.
7.3. GHG Emissions
GHG emission intensity (as represented by CO2) increases slightly by 2% to 490 kg/m3 (78 kg/bbl) of bitumen production.
COSIA SAGD Reference Facilities
Candor Engineering Ltd.
Page 29 of 60
Figure 9: Case 3 PFD and Mass Balance using GL to Replace ML.
COSIA SAGD TEMPLATECase 3: Gas LiftGL - 2200 kPa DiluentWLS - OTSG 27,765 BPSDRev B BPSD 3,018 m3/d
API
Field Gas Oil TreatingDiluent lost to Fuel
0 BPSD BPSD0 m3/d
Well Pad Facilities Water lost to Dilbit21 BPSD
Air Cooler Vapour Recovery 3 m3/d Dilbit51,995 BPSD
FWKO Treaters CPF Dilbit 8,266 m3/dPADS Emulsion 1 Vessel 2 x Mechanical 16.1 API API
117,625 BPSD18,701 m3/d Recycled Recovered Diluent Sour Field Gas
Chemicals Chemicals 0 BPSD 15.82 MMSCFD0 m3/d 447,238 Sm3/d
Produced Gas 0.29 Sulfur (metric t/d)Composition
Reservoir H2 0.3 Mol% Composition (Dry Basis)CO2 30 Mol% H2 Mol%
SOR: 3.00 (wet) N2 1.3 Mol% CO2 Mol%GOR: 5.00 H2S 0.13 Mol% N2 Mol%
C1 63.6 Mol% H2S Mol%Bitumen C2 1.63 Mol% De-Oiling C1 Mol%
33,000 BPSD C3 1.98 Mol% C2 Mol%5,247 m3/d C4 0.3 Mol% C3 Mol%7.08 API C5+ 0.88 Mol% IGF/ISF/ORF Units Skim Tank C4 Mol%5.05 % Sulfur (comp at test separator) De-oiled Water 1 Train Produced Water C5+ Mol%
589,210 kg/h 590,317 kg/hProduced Water 14,167 m3/d 14,198 m3/d
589,710 kg/h 1,492 mg/L TDS 1,492 mg/L TDS14,182 m3/d 188 mg/L Silica 188 mg/L Silica1,492 mg/L TDS 14 mg/L Hardness 14 mg/L Hardness188 mg/L Silica mg/L TOC mg/L TOC14 mg/L Hardness
mg/L TOCProduced Gas Water Treatment
0.93 MMSCFD Chemicals Blowdown to WLS Summary Table26,233 Sm3/d Lime 375 kg/h 109,837 kg/h MU TDS (ppm) 7171.9
MagOx 94.8 kg/h 2,637 m3/d PW TDS (ppm) 1,492Electricity (Charge Pump) Soda ash 38.4 kg/h 31,563 mg/L TDS PW TOC (ppm) 300
1.4 MW PW WLS Afterfilters 169 mg/L Silica LP Flash BD (%) 16%Tank 1 x WLS Treater WAC Polishers BFW 0 mg/L Hardness BD Recycle (%) 65%
Steam WLS Feed WLS Overflow 3 x WAC Units Tank mg/L TOC TDS to Boiler (ppm) 6,256655,220 kg/h kg/h 856,091 kg/h 2 x Polishers Boiler TOC (ppm) 51415,757 m3/d CWE 20,591 m3/d 20,581 m3/d MU Flowrate (kg/h) 157,544
6,356 mg/L TDS 6,259 mg/L TDS Backwash Service Water WLS Sludge (kg/d) 23,956152 mg/L Silica 34 mg/L Silica 4,280 kg/h Disposal Type (L,S) L10 mg/L Hardness 3 mg/L Hardness 103 m3/d Disposal Rate (kg/h) 59,141
mg/L TOC mg/L TOC Disposal Solids (kg/d) 53,210Water Losses to Reservoir: Clarifier Waste Regeneration
65,522 kg/h 998 kg/h (dry basis) Waste to Disposal Water Balance1,576 m3/d 266 m3/d Stream Flow Flow TDS Silica Hardness
10 % Losses mg/L TOC kg/h m3/d ppm ppm ppmLift Gas Steam to reservoir 655,220 15,757 - - -
MMSCFD Losses to reservoir 65,522 1,576 - - -Sm3/d Produced Water 590,317 14,198 1,492 188 14
Losses to production 141 3 - - -De-oiled Water 589,210 14,167 1,492 188 14
Steam Generation HP Steam Make-up Water 157,544 3,789 7,172 7 204100 % Quality Efficiency % (HHV) BFW Supernatant
Flue Gas (Includes Glycol Heater) 655,220 kg/h Duty (abs) GJ/h 851,809 kg/h WLS Feed 20,591 6,356 152 10CO2 2,291 metric t/d 15,757 m3/d CWE MMBTU/h 20,478 m3/d WLS Overflow 856,091 20,581 6,259 34 3
Make-up Water SO2 0.06 metric t/d MPag Duty (fired) GJ/h (HHV) 6,256 mg/L TDS Clarifier Waste to Land 998 266157,544 kg/h NOx 0.41 metric t/d MMBTU/h (HHV) 34 mg/L Silica Blowdown to Disposal 59,141 1,420 31,537 169 03,789 m3/d NOx emission: 8.9 g/GJ Utility Steam 0 mg/L Hardness LP Steam to WT 0 0 0 0 07,172 mg/L TDS Energy 269.9 GJ/h (HHV) GJ/h Wet Steam OTSG 150 °C mg/L TOC LP Steam to Header 27,586 662 0 0 0
7 mg/L Silica Flow Rate 490.5 MMSCFD kg/h HPS 77 % Quality 6 x OTSG Boilers Service Water 4,280 103 6,256 34 0204 mg/L Hardness 851,809 kg/h Radiation Losses BFW Pump (LP&HP) Power Treated Produced Gas BFW 851,809 20,478 6,256 34 0
mg/L TOC 20,478 m3/d CWE 37.1 GJ/h 5.5 MW 15.82 MMSCFDMethod 1 Water Recycle: 84 % kgmol/hr Emissions Summary
kJ/kgmol (HHV) Source SO2 S CO2 NOxAir Blower GJ/h metric t/d metric t/d metric t/d metric t/d
3.9 MW OTSG Flue Gas 0.06 0.03 2291 0.41Recovered Sulfur - 0.00 - -
Blowdown to Disposal Natural Gas to CPF 36.1 GJ/hr Project: Cosia SAGD Templateskg/h 26.25 MMSCFD Glycol Heater Case: Case 3: Gas Lift WLS - OTSG Revision: Rev Bm3/d kgmol/hr Author Mike Armstrongmg/L TDS kJ/kgmol (HHV) Natural Gas (Total) Date:kg/h solids GJ/h 40.68 MMSCFD
716 kgmol/hr2217 1,167
1,420 1,30718-Dec-14
788LP Steam 824,460
Flash 650
59,141
51427,586
0.8131,537 892,650
856,5811,431
10.0 1,817
13.6
6
384,857
83.11,510
1,757
63.7
0.2
300 300
300
2,515856,581
530 514
22,535
0.2
10,21053.7
8,783
21.3
0.05.71.20.091.11.00.5
WAC
COSIA SAGD Reference Facilities
Candor Engineering Ltd.
Page 30 of 60
Figure 10: Case 3 Energy Flow Diagram using GL to Replace ML.
Total Air Cooler Heat Released to AtmosphereGJ/hr Glycol Air Cooler Diluent
(relative to ambient air) 207 GJ/h 50 °C 5.8 °CGlycol Return Produced Gas Cooler
Field Gas Glycol Cooler 79.7 °C 40 °C 3.2 GJ/h 4.4 GJ/h79.7 GJ/hr 130 °C 50 °C
55 °C
ProducedGas
Emulsion / BFWExchanger Sales Oil Coolers Heat Exchangers Legend
Emulsion 94.2 GJ/h 43.4 GJ/h DilbitPADS 164 °C 133 °C Oil Treating 130 °C 50 °C Process to Process
129 °C129 °C
104 °C Hot GlycolProduced Water/
131 °C BFW HXGH/hr Cold Glycol
Produced Water Cooler Direct Contact/Quench6.13 GJ/h 97 °C
85 °C °CReservoir
Make-up Water Heater Exchangers Duty24 GJ/h GJ/h
Make-up Water Emulsion / BFW 94.269 °C 40 °C 5 °C Produced Water Glycol Cooler 6.1
19.5 GJ/h PW / BFW Exchanger 80.0De-Oiling / PW / MU water exchanger Produced Gas Air Cooler (s) 3.2
Water Treatment HP BFW Pump Diluent Glcyol Heater 4.4BFW 82 °C Sales Oil Coolers 43.4
Make-up Water Glycol Heater 23.5PW / MU water exchanger 19.5Blowdown Glycol Cooler 75.7
104 °C Stack Losses BFW Preheaters 63.4Stack GJ/hr OTSG Air Glycol Heater N/A
Water Heat to Earth BD Water to Disposal 80 °C Air Glycol Preheater 175 °C (HHV basis) Glycol Natural Gas Preheater N/A18.6 GJ/hr 80 °C 9.75 GJ/h Forced Draft Fan Field Gas / Glycol Cooler 79.7(based on 5°C Ground Temp) Blowdown Cooler Air 20 °C Fan 33 °C Utility Coolers 11.4
75.7 GJ/h 5 °C Glycol Air Cooler 206.6
Electrical Loads Power Equivalent HeatHP Steam MW GJ/h310 °C BFW HP BFW Pump 4.7 30.7
150 °C LP BFW Pump 0.8 5.2Wellpad Pumps 1.4 9.0Pad Auxiliaries 1.5 9.8
HPS 310 °C Radiation Losses Forced Draft Fan 3.9 25.5Utility Steam GJ/hr Misc Users 1.9 12.2
kg/h OTSG (relative to ambient) VRU Compressors 0.3 1.7BFW Preheaters Stock Losses GJ/hr WLS/Evaporator 0.5 3.1
186 °C 63.4 GJ/h Radiation Losses Glycol System 0.5 3.2Total 15.3 100.4
248 °CDirect CO2 Generation MT/day 436.6 kg/m3 Bitumen
GJ/h Indirect CO2 Generation MT/day 53.6 kg/m3 BitumenTotal CO2 Emissions MT/day kg/m3 Bitumen
33 °C Assumes electricity grid CO2 emissivity of 763 kg CO2eq / MW-hrDirect Emissions from Combustion only
Combustion Air39 °C
HP BFW Pump Inputs Energy132 °C GJ/h
Natural Gas 116748 °C Produced Gas Electrical Power 100.4
35 °C 650 GJ/h (HHV)Total 1268
Natural Gas Glycol Heater2.3 GJ/h
5.0 °C
ENERGY FLOW DIAGRAM Project: Cosia SAGD TemplatesCase: Case 3: Gas Lift WLS - OTSG
GJ/h GJ/h Natural Gas Author Mike Armstrong Checked:Tracing & Utility Heat Input (HHV) Date:
Building Heat Coolers GJ/h Revision: Rev C
2,572 490.1
1.8 11.4 22-Aug-14
LP SteamFlash
2,29163.7 281
269.9
37.1
1167
269.927,586
ENERGY FLOW DIAGRAMCase 3: Gas Lift WLS - OTSG
207
Preflash Vessel
Vapor Recovery
80.0
87
H
C
H
C
H C
H
C
H
H
Skim Tank
C
C
H
H
C
COSIA SAGD Reference Facilities
Candor Engineering Ltd.
Page 31 of 60
8. Central Processing Facility #4 (ML-WLS-OTSG-Cogen)
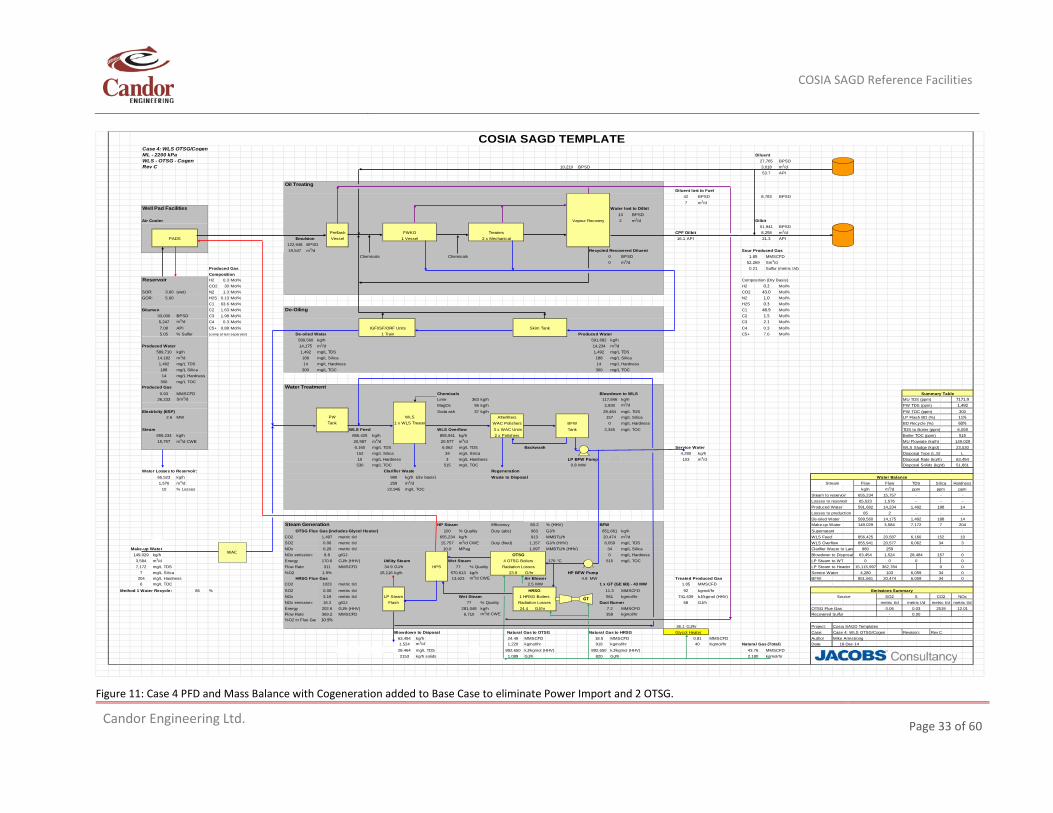
The process flow Diagram (PFD) and Energy Flow Diagram (EFD) for this CPF#4 are provided in Figures 11 and 12, respectively.
The only change in CPF#4 over CPF#1 is to add cogeneration to eliminate power import and augment OTSG steam generation. The ML, oil and water treatments, and OTSG steam generation will be similar to those described in Sections 5.1, 5.2 and 5.4.
8.1. Using Cogeneration + OTSG instead of just OTSG
Cogeneration in oil sands is a commercial practice in SAGD CPF. It consists of using gas turbine (GT) for electricity production and heat recovery steam generator (HRSG) for HP steam production.(6) Both GT and HRSG are commercial technologies. In this design, a 43 MW cogeneration plant is implemented in a SAGD CPF with the same water treatment by WLS and emulsion production by ML as the Base Case (see Figure 11).
Candor is not privy to the reasons for selecting the size of the GT or HRSG. The 43 MW GE 6B GT is available commercially. Once the GT is selected, the amount of sensible heat in the GT exhaust will be provided by its vendor. The HRSG design provides flexibility with respect to the amount of duct burning (DB) or force-air duct burning (FADB) or both, to augment the sensible heat in the GT exhaust.(6) The sizing of the HRSG is therefore contingent on the apportionment of the total HP steam generation to the HRSG and OTSG. The higher the HRSG share, the higher requirement of DB or FADB, and the fewer number of remaining OTSG. In this design, 4 OTSG are deployed to produce 67% of total HP steam requirement of 851,661 kg/h. As a result, a HRSG that incorporates 320 GJ/h DB is selected to produce the remaining 33% of HP steam. In other words, the HRSG supplants 2 OTSGs. After supplying on site electricity requirement, 26 MW of excess power is available for export.
In HRSG DB, the combustion of the added natural gas does not require additional combustion air as there is sufficient oxygen left in the GT exhaust to satisfy the combustion need. As a result, the size of the forced draft air blowers will be reduced. In choosing DB, the HRSG combustion chamber volume must be properly designed to achieve high combustion efficiency.(6)
The total fuel consumption has increased by 5% vis-à-vis the Base Case to 1,909 GJ/h. 43% of this total is needed for cogeneration. The GT needs about 500 GJ/h of natural gas in order to produce 43 MW at a heat rate of 11.6 GJ per MWh or at a generation efficient of 31%, which is typical of single cycle gas turbine efficiency.
Case 4 does not affect the water consumption vis-à-vis the Base Case as it uses WLS to make BFW.
8.2. Overview of Process and Heat Integration
Case 4’s process flow is similar to the Base Case; the exception is the addition of a 43 MW GT and the associated HRSG. With the replacement of 2 OTSG by one HRSG, there will be some minor changes in the BFW and HP steam distribution systems in the SAGD CPF. As DB relies on the oxygen in the GT exhaust for combustion, Case 4’s power demand is reduced slightly from the Base Case’s 17.9 MW to 16.6 MW. Case 4’s EFD depicts two separate flue gas sources, one for the OTSGs and the other from the HRSG, at the same exit temperature of 195 oC vis-à-vis the single source from the OTSG’s in the Base Case.
8.3. GHG Emissions
Alberta’s Specified Gas Emitters Regulations (SGER) provide a method to allocate emissions to cogeneration electricity and steam. It deems the cogeneration electricity exported to the Grid at GHG intensity equal to an efficient natural gas combined cycle, and steam generation efficient of 80% (HHV basis). For the former, it is assumed to be 390 kg per MWh (kg/MWh) for Alberta. In applying the SGER allocation, the emissions from the 26 MW power export at 390 kg/MWh is subtracted from the total cogeneration emissions and the balance is allocated to the steam.(6) Using the SGER allocation methodology, an offset of 247 t/d or 47.1 kg/m3 (7.5 kg/bbl)
COSIA SAGD Reference Facilities
Candor Engineering Ltd.
Page 32 of 60
of bitumen produced from the 26 MW power export would result in a net intensity of 433 kg/m3 (69 kg/bbl). If, however, the export power output of 26 MW is allowed an offset at the Grid intensity of 763 kg/MWh, the offset credits would be 92 kg/m3 (14.6 kg/bbl), which would lower the SAGD intensity further to 388 kg/m3 (61.7 kg/bbl) as shown in Table 5.
COSIA SAGD Reference Facilities
Candor Engineering Ltd.
Page 33 of 60
Figure 11: Case 4 PFD and Mass Balance with Cogeneration added to Base Case to eliminate Power Import and 2 OTSG.
COSIA SAGD TEMPLATECase 4: WLS OTSG/CogenML - 2200 kPa DiluentWLS - OTSG - Cogen 27,765 BPSDRev C BPSD 3,018 m3/d
API
Oil TreatingDiluent lost to Fuel
42 BPSD BPSD7 m3/d
Well Pad Facilities Water lost to Dilbit13 BPSD
Air Cooler Vapour Recovery 2 m3/d Dilbit51,941 BPSD
FWKO Treaters CPF Dilbit 8,258 m3/dPADS Emulsion 1 Vessel 2 x Mechanical 16.1 API API
122,948 BPSD19,547 m3/d Recycled Recovered Diluent Sour Produced Gas
Chemicals Chemicals 0 BPSD 1.85 MMSCFD0 m3/d 52,269 Sm3/d
Produced Gas 0.21 Sulfur (metric t/d)Composition
Reservoir H2 0.3 Mol% Composition (Dry Basis)CO2 30 Mol% H2 Mol%
SOR: 3.00 (wet) N2 1.3 Mol% CO2 Mol%GOR: 5.00 H2S 0.13 Mol% N2 Mol%
C1 63.6 Mol% H2S Mol%Bitumen C2 1.63 Mol% De-Oiling C1 Mol%
33,000 BPSD C3 1.98 Mol% C2 Mol%5,247 m3/d C4 0.3 Mol% C3 Mol%7.08 API C5+ 0.88 Mol% IGF/ISF/ORF Units Skim Tank C4 Mol%5.05 % Sulfur (comp at test separator) De-oiled Water 1 Train Produced Water C5+ Mol%
589,560 kg/h 591,682 kg/hProduced Water 14,175 m3/d 14,234 m3/d
589,710 kg/h 1,492 mg/L TDS 1,492 mg/L TDS14,182 m3/d 188 mg/L Silica 188 mg/L Silica1,492 mg/L TDS 14 mg/L Hardness 14 mg/L Hardness188 mg/L Silica mg/L TOC mg/L TOC14 mg/L Hardness
mg/L TOCProduced Gas Water Treatment
0.93 MMSCFD Chemicals Blowdown to WLS Summary Table26,233 Sm3/d Lime 363 kg/h 117,846 kg/h MU TDS (ppm) 7171.9
MagOx 96 kg/h 2,830 m3/d PW TDS (ppm) 1,492Electricity (ESP) Soda ash 37 kg/h 28,484 mg/L TDS PW TOC (ppm) 300
2.6 MW PW WLS Afterfilters 157 mg/L Silica LP Flash BD (%) 11%Tank 1 x WLS Treater WAC Polishers BFW 0 mg/L Hardness BD Recycle (%) 60%
Steam WLS Feed WLS Overflow 3 x WAC Units Tank mg/L TOC TDS to Boiler (ppm) 6,059655,234 kg/h kg/h 855,941 kg/h 2 x Polishers Boiler TOC (ppm) 51515,757 m3/d CWE 20,587 m3/d 20,577 m3/d MU Flowrate (kg/h) 149,029
6,160 mg/L TDS 6,062 mg/L TDS Backwash Service Water WLS Sludge (kg/d) 23,530152 mg/L Silica 34 mg/L Silica 4,280 kg/h Disposal Type (L,S) L10 mg/L Hardness 3 mg/L Hardness LP BFW Pump 103 m3/d Disposal Rate (kg/h) 63,454
mg/L TOC mg/L TOC 0.8 MW 51,661Water Losses to Reservoir: Clarifier Waste Regeneration
65,523 kg/h 980 kg/h (dry basis) Waste to Disposal Water Balance1,576 m3/d 259 m3/d Stream Flow Flow TDS Silica Hardness
10 % Losses mg/L TOC kg/h m3/d ppm ppm ppmSteam to reservoir 655,234 15,757 - - -Losses to reservoir 65,523 1,576 - - -Produced Water 591,682 14,234 1,492 188 14Losses to production 85 2 - - -De-oiled Water 589,560 14,175 1,492 188 14
Steam Generation HP Steam Efficiency % (HHV) BFW Make-up Water 149,029 3,584 7,172 7 204OTSG Flue Gas (includes Glycol Heater) 100 % Quality Duty (abs) GJ/h kg/h Supernatant
CO2 metric t/d 655,234 kg/h MMBTU/h m3/d WLS Feed 20,587 6,160 152 10SO2 metric t/d 15,757 m3/d CWE Duty (fired) GJ/h (HHV) mg/L TDS WLS Overflow 855,941 20,577 6,062 34 3
Make-up Water NOx metric t/d MPag MMBTU/h (HHV) mg/L Silica Clarifier Waste to Land 980 259149,029 kg/h NOx emission: g/GJ OTSG mg/L Hardness Blowdown to Disposal 63,454 1,524 28,484 157 03,584 m3/d Energy GJ/h (HHV) Utility Steam Wet Steam 4 OTSG Boilers 170 °C mg/L TOC LP Steam to WT 0 0 0 07,172 mg/L TDS Flow Rate MMSCFD GJ/h HPS 77 % Quality Radiation Losses LP Steam to Header 15,115,997 362,784 0 0
7 mg/L Silica %O2 kg/h 570,613 kg/h 23.9 G/hr HP BFW Pump Service Water 4,280 103 6,059 34 0204 mg/L Hardness HRSG Flue Gas 13,623 m3/d CWE Air Blower 4.8 MW Treated Produced Gas BFW 851,661 20,474 6,059 34 0
mg/L TOC CO2 metric t/d 2.5 MW 1 x GT (GE 6B) - 43 MW 1.85 MMSCFDMethod 1 Water Recycle: 86 % SO2 metric t/d HRSG MMSCFD kgmol/hr Emissions Summary
NOx metric t/d Wet Steam 1 HRSG Boilers kgmol/hr kJ/kgmol (HHV) Source SO2 S CO2 NOxNOx emission: 16.2 g/GJ 77 % Quality Radiation Losses Duct Burner GJ/h metric t/d metric t/d metric t/d metric t/dEnergy 202.6 GJ/h (HHV) 281,048 kg/h 24.4 GJ/hr MMSCFD OTSG Flue Gas 0.06 0.03 2519 12.01Flow Rate 369.2 MMSCFD 6,710 m3/d CWE kgmol/hr Recovered Sulfur - 0.00 - -%O2 in Flue Gas
36.1 GJ/hr Project: Cosia SAGD TemplatesBlowdown to Disposal Natural Gas to OTSG Natural Gas to HRSG Glycol Heater Case: Case 4: WLS OTSG/Cogen Revision: Rev C
63,454 kg/h MMSCFD MMSCFD MMSCFD Author Mike Armstrong1,524 m3/d kgmol/hr 919 kgmol/hr Kgmol/hr Natural Gas (Total) Date:
mg/L TDS kJ/kgmol (HHV) kJ/kgmol (HHV) 43.76 MMSCFD2153 kg/h solids GJ/h GJ/h 2,180 kgmol/hr1,089 820
1,220 40 18-Dec-1428,464 892,650 892,650
7.2358
10.9%
24.49 18.5 0.81
923.19 LP Steam 561 741,639
Flash 68
11.3
1.9% 15,116
6 10230.00
8.8 0170.6 515311 34.9
856,4250.06 1,157 6,0590.26 10.0 1,097 34
1,497 913 20,474
Disposal Solids (kg/d)
83.2963 851,661
22,945
2.10.37.0
300 300
2,345856,425
530 515
300
1.5
10,21053.7
8,783
PreflashVessel 21.3
0.243.01.00.3
48.9
GT
WAC
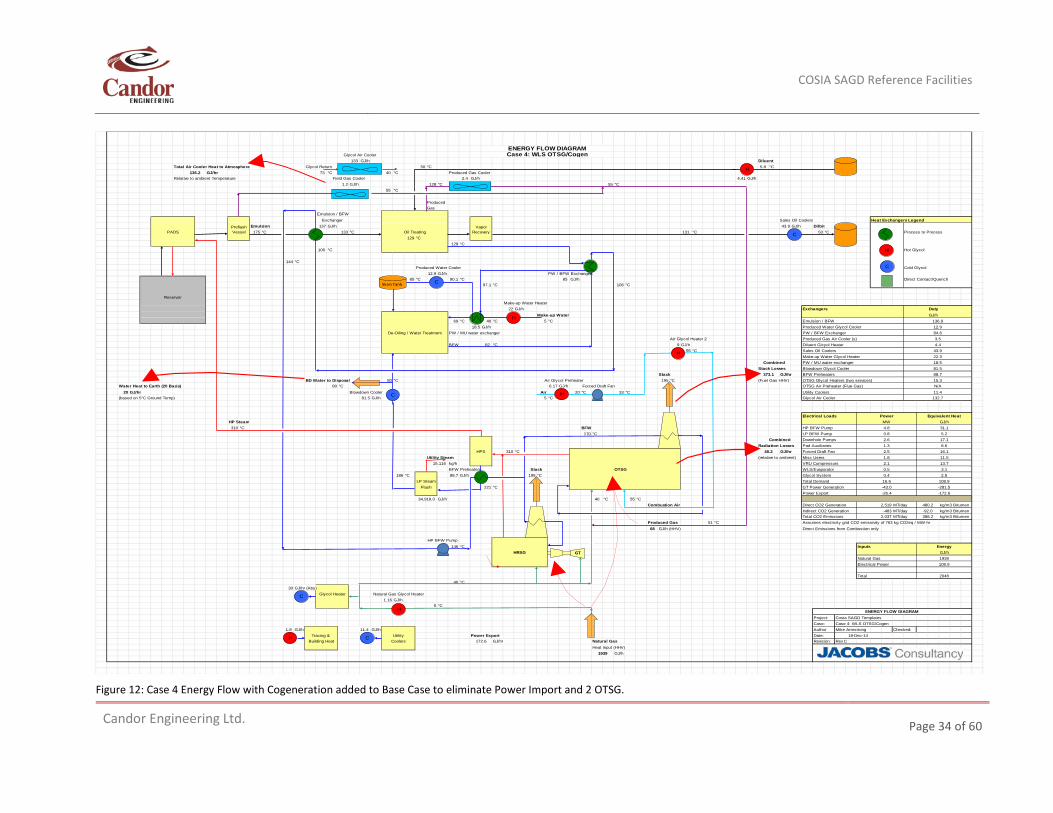
COSIA SAGD Reference Facilities
Candor Engineering Ltd.
Page 34 of 60
Figure 12: Case 4 Energy Flow with Cogeneration added to Base Case to eliminate Power Import and 2 OTSG.
Glycol Air Cooler133 GJ/h Diluent
Total Air Cooler Heat to Atmosphere Glycol Return 50 °C 5.8 °CGJ/hr 73 °C 40 °C Produced Gas Cooler
Relative to ambient Temperature Field Gas Cooler GJ/h 4.41 GJ/h1.2 GJ/h 128 °C 55 °C
55 °C
ProducedGas
Emulsion / BFWExchanger Sales Oil Coolers Heat Exchangers Legend
Emulsion 137 GJ/h 43.9 GJ/h DilbitPADS 175 °C 133 °C Oil Treating 131 °C 50 °C Process to Process
129 °C129 °C
106 °C Hot Glycol
144 °CProduced Water Cooler Cold Glycol
12.9 GJ/h PW / BFW Exchanger85 °C 90.1 °C 85 GJ/h Direct Contact/Quench
97.1 °C 106 °C
ReservoirMake-up Water Heater
22 GJ/h Exchangers DutyMake-up Water GJ/h
69 °C 40 °C 5 °C Emulsion / BFW 136.918.5 GJ/h Produced Water Glycol Cooler 12.9
De-Oiling / Water Treatment PW / MU water exchanger PW / BFW Exchanger 84.6Air Glycol Heater 2 Produced Gas Air Cooler (s) 3.5
BFW 82 °C 9 GJ/h Diluent Glcyol Heater 4.455 °C Sales Oil Coolers 43.9
Make-up Water Glycol Heater 22.3Combined PW / MU water exchanger 18.5
Stack Losses Blowdown Glycol Cooler 81.5Stack GJ/hr BFW Preheaters 88.7
BD Water to Disposal 80 °C Air Glycol Preheater 195 °C (Fuel Gas HHV) OTSG Glycol Heaters (two services) 15.3Water Heat to Earth (20 Basis) 80 °C 6.17 GJ/h Forced Draft Fan OTSG Air Preheater (Flue Gas) N/A
20 GJ/hr Blowdown Cooler Air 20 °C Fan 33 °C Utility Coolers 11.4(based on 5°C Ground Temp) 81.5 GJ/h 5 °C Glycol Air Cooler 132.7
Electrical Loads Power Equivalent HeatHP Steam MW GJ/h310 °C BFW HP BFW Pump 4.8 31.1
170 °C LP BFW Pump 0.8 5.2Combined Downhole Pumps 2.6 17.1
Radiation Losses Pad Auxiliaries 1.3 8.6HPS 310 °C GJ/hr Forced Draft Fan 2.5 16.1
Utility Steam (relative to ambient) Misc Users 1.8 11.5kg/h VRU Compressors 2.1 13.7BFW Preheaters Stack OTSG WLS/Evaporator 0.5 3.1
186 °C 88.7 GJ/h 195 °C Glycol System 0.4 2.5Total Demand 16.6 108.9
221 °C GT Power Generation -43.0 -281.5Power Export -26.4 -172.6
GJ/h 40 °C 55 °CCombustion Air Direct CO2 Generation MT/day 480.2 kg/m3 Bitumen
Indirect CO2 Generation MT/day kg/m3 BitumenTotal CO2 Emissions MT/day kg/m3 Bitumen
Produced Gas 51 °C Assumes electricity grid CO2 emissivity of 763 kg CO2eq / MW-hr68 GJ/h (HHV) Direct Emissions from Combustion only
HP BFW Pump146 °C Inputs Energy
HRSG GJ/hNatural Gas 1939Electrical Power 108.9
Total 204840 °C
30 GJ/hr (Abs)Glycol Heater Natural Gas Glycol Heater
1.16 GJ/h5 °C
ENERGY FLOW DIAGRAM Project: Cosia SAGD TemplatesCase: Case 4: WLS OTSG/Cogen
GJ/h GJ/h Author Mike Armstrong Checked:Tracing & Utility Power Export Date:
Building Heat Coolers GJ/hr Natural Gas Revision: Rev CHeat Input (HHV)
GJ/h1939
2,037 388.2
1.8 11.4 18-Dec-14
172.6
LP SteamFlash
34,918.0 2,519-483 -92.0
373.1
48.2
15,116
ENERGY FLOW DIAGRAMCase 4: WLS OTSG/Cogen
136.22.4
Preflash Vessel
Vapor Recovery C
H
C
H
C
H C
H
C
H
H
H
C
Skim Tank
GT
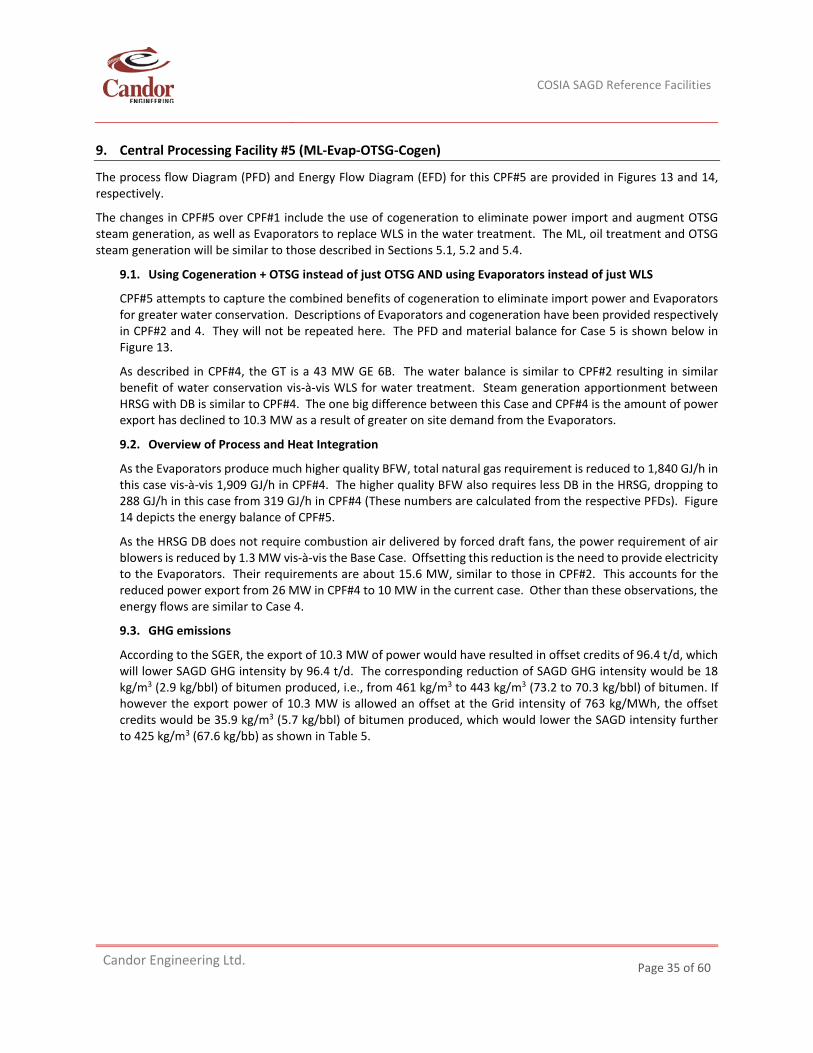
COSIA SAGD Reference Facilities
Candor Engineering Ltd.
Page 35 of 60
9. Central Processing Facility #5 (ML-Evap-OTSG-Cogen)
The process flow Diagram (PFD) and Energy Flow Diagram (EFD) for this CPF#5 are provided in Figures 13 and 14, respectively.
The changes in CPF#5 over CPF#1 include the use of cogeneration to eliminate power import and augment OTSG steam generation, as well as Evaporators to replace WLS in the water treatment. The ML, oil treatment and OTSG steam generation will be similar to those described in Sections 5.1, 5.2 and 5.4.
9.1. Using Cogeneration + OTSG instead of just OTSG AND using Evaporators instead of just WLS
CPF#5 attempts to capture the combined benefits of cogeneration to eliminate import power and Evaporators for greater water conservation. Descriptions of Evaporators and cogeneration have been provided respectively in CPF#2 and 4. They will not be repeated here. The PFD and material balance for Case 5 is shown below in Figure 13.
As described in CPF#4, the GT is a 43 MW GE 6B. The water balance is similar to CPF#2 resulting in similar benefit of water conservation vis-à-vis WLS for water treatment. Steam generation apportionment between HRSG with DB is similar to CPF#4. The one big difference between this Case and CPF#4 is the amount of power export has declined to 10.3 MW as a result of greater on site demand from the Evaporators.
9.2. Overview of Process and Heat Integration
As the Evaporators produce much higher quality BFW, total natural gas requirement is reduced to 1,840 GJ/h in this case vis-à-vis 1,909 GJ/h in CPF#4. The higher quality BFW also requires less DB in the HRSG, dropping to 288 GJ/h in this case from 319 GJ/h in CPF#4 (These numbers are calculated from the respective PFDs). Figure 14 depicts the energy balance of CPF#5.
As the HRSG DB does not require combustion air delivered by forced draft fans, the power requirement of air blowers is reduced by 1.3 MW vis-à-vis the Base Case. Offsetting this reduction is the need to provide electricity to the Evaporators. Their requirements are about 15.6 MW, similar to those in CPF#2. This accounts for the reduced power export from 26 MW in CPF#4 to 10 MW in the current case. Other than these observations, the energy flows are similar to Case 4.
9.3. GHG emissions
According to the SGER, the export of 10.3 MW of power would have resulted in offset credits of 96.4 t/d, which will lower SAGD GHG intensity by 96.4 t/d. The corresponding reduction of SAGD GHG intensity would be 18 kg/m3 (2.9 kg/bbl) of bitumen produced, i.e., from 461 kg/m3 to 443 kg/m3 (73.2 to 70.3 kg/bbl) of bitumen. If however the export power of 10.3 MW is allowed an offset at the Grid intensity of 763 kg/MWh, the offset credits would be 35.9 kg/m3 (5.7 kg/bbl) of bitumen produced, which would lower the SAGD intensity further to 425 kg/m3 (67.6 kg/bb) as shown in Table 5.
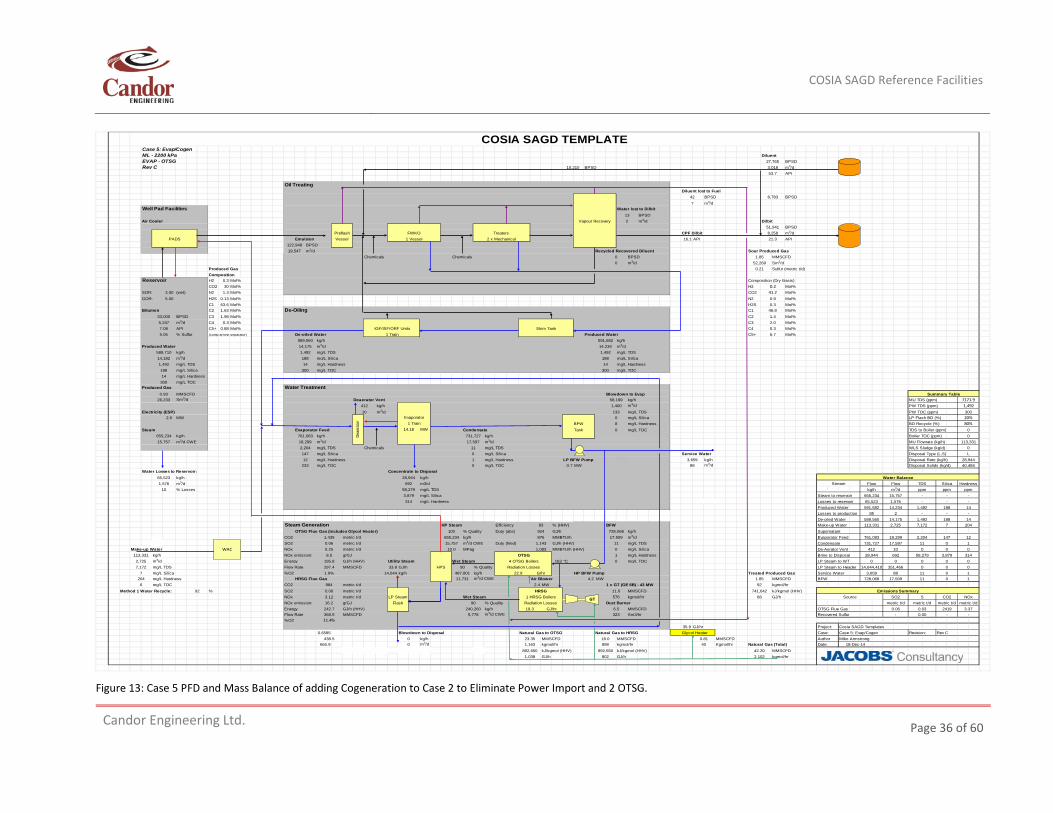
COSIA SAGD Reference Facilities
Candor Engineering Ltd.
Page 36 of 60
Figure 13: Case 5 PFD and Mass Balance of adding Cogeneration to Case 2 to Eliminate Power Import and 2 OTSG.
COSIA SAGD TEMPLATECase 5: Evap/Cogen ML - 2200 kPa DiluentEVAP - OTSG 27,765 BPSDRev C BPSD 3,018 m3/d
API
Oil TreatingDiluent lost to Fuel
42 BPSD BPSD7 m3/d
Well Pad Facilities Water lost to Dilbit13 BPSD
Air Cooler Vapour Recovery 2 m3/d Dilbit51,941 BPSD
FWKO Treaters CPF Dilbit 8,258 m3/dPADS Emulsion 1 Vessel 2 x Mechanical 16.1 API API
122,948 BPSD19,547 m3/d Recycled Recovered Diluent Sour Produced Gas
Chemicals Chemicals 0 BPSD 1.85 MMSCFD0 m3/d 52,269 Sm3/d
Produced Gas 0.21 Sulfur (metric t/d)Composition
Reservoir H2 0.3 Mol% Composition (Dry Basis)CO2 30 Mol% H2 Mol%
SOR: 3.00 (wet) N2 1.3 Mol% CO2 Mol%GOR: 5.00 H2S 0.13 Mol% N2 Mol%
C1 63.6 Mol% H2S Mol%Bitumen C2 1.63 Mol% De-Oiling C1 Mol%
33,000 BPSD C3 1.98 Mol% C2 Mol%5,247 m3/d C4 0.3 Mol% C3 Mol%7.08 API C5+ 0.88 Mol% IGF/ISF/ORF Units Skim Tank C4 Mol%5.05 % Sulfur (comp at test separator) De-oiled Water 1 Train Produced Water C5+ Mol%
589,560 kg/h 591,682 kg/hProduced Water 14,175 m3/d 14,234 m3/d
589,710 kg/h 1,492 mg/L TDS 1,492 mg/L TDS14,182 m3/d 188 mg/L Silica 188 mg/L Silica1,492 mg/L TDS 14 mg/L Hardness 14 mg/L Hardness188 mg/L Silica mg/L TOC mg/L TOC14 mg/L Hardness
mg/L TOCProduced Gas Water Treatment
0.93 MMSCFD Blowdown to Evap Summary Table26,233 Sm3/d Deaerator Vent 58,199 kg/h MU TDS (ppm) 7171.9
412 kg/h 1,400 m3/d PW TDS (ppm) 1,492Electricity (ESP) 10 m3/d 133 mg/L TDS PW TOC (ppm) 300
2.6 MW 0 mg/L Silica LP Flash BD (%) 20%BFW 8 mg/L Hardness BD Recycle (%) 80%
Steam Evaporator Feed MW Condensate Tank mg/L TOC TDS to Boiler (ppm) 0655,234 kg/h kg/h 731,727 kg/h Boiler TOC (ppm) 015,757 m3/d CWE 18,299 m3/d 17,597 m3/d MU Flowrate (kg/h) 113,331
2,204 mg/L TDS Chemicals 11 mg/L TDS WLS Sludge (kg/d) 0147 mg/L Silica 0 mg/L Silica Service Water Disposal Type (L,S) L12 mg/L Hardness 1 mg/L Hardness LP BFW Pump 3,659 kg/h Disposal Rate (kg/h) 28,944
mg/L TOC mg/L TOC 0.7 MW 88 m3/d Disposal Solids (kg/d) 40,484Water Losses to Reservoir: Concentrate to Disposal
65,523 kg/h 28,944 kg/h Water Balance1,576 m3/d 692 m3/d Stream Flow Flow TDS Silica Hardness
10 % Losses 58,279 mg/L TDS kg/h m3/d ppm ppm ppm3,879 mg/L Silica Steam to reservoir 655,234 15,757 - - -314 mg/L Hardness Losses to reservoir 65,523 1,576 - - -
Produced Water 591,682 14,234 1,492 188 14Losses to production 85 2 - - -De-oiled Water 589,560 14,175 1,492 188 14
Steam Generation HP Steam Efficiency % (HHV) BFW Make-up Water 113,331 2,725 7,172 7 204OTSG Flue Gas (includes Glycol Heater) 100 % Quality Duty (abs) GJ/h kg/h Supernatant
CO2 metric t/d 655,234 kg/h MMBTU/h m3/d Evaporator Feed 18,299 2,204 147 12SO2 metric t/d 15,757 m3/d CWE Duty (fired) GJ/h (HHV) mg/L TDS Condensate 731,727 17,597 11 0 1
Make-up Water NOx metric t/d MPag MMBTU/h (HHV) mg/L Silica De-Aerator Vent 412 10 0 0113,331 kg/h NOx emission: g/GJ OTSG mg/L Hardness Brine to Disposal 28,944 692 58,279 3,879 3142,725 m3/d Energy GJ/h (HHV) Wet Steam 4 OTSG Boilers 163 °C mg/L TOC LP Steam to WT 0 0 0 0 07,172 mg/L TDS Flow Rate MMSCFD GJ/h HPS 90 % Quality Radiation Losses LP Steam to Header 14,644,410 351,466 0 0 0
7 mg/L Silica %O2 kg/h 487,801 kg/h 22.9 G/hr HP BFW Pump Treated Produced Gas Service Water 3,659 88 11 0 1204 mg/L Hardness HRSG Flue Gas 11,731 m3/d CWE Air Blower 4.2 MW 1.85 MMSCFD BFW 728,068 17,509 11 0 1
mg/L TOC CO2 metric t/d 2.4 MW 1 x GT (GE 6B) - 43 MW kgmol/hrMethod 1 Water Recycle: 92 % SO2 metric t/d HRSG MMSCFD kJ/kgmol (HHV) Emissions Summary
NOx metric t/d Wet Steam 1 HRSG Boilers kgmol/hr GJ/h Source SO2 S CO2 NOxNOx emission: 16.2 g/GJ 90 % Quality Radiation Losses Duct Burner metric t/d metric t/d metric t/d metric t/dEnergy 242.7 GJ/h (HHV) 240,260 kg/h 19.3 GJ/hr MMSCFD OTSG Flue Gas 0.06 0.03 2419 3.37Flow Rate 368.5 MMSCFD 5,778 m3/d CWE Sm3/hr Recovered Sulfur - 0.00 - -%O2
35.9 GJ/hr Project: Cosia SAGD Templates0.6585 Blowdown to Disposal Natural Gas to OTSG Natural Gas to HRSG Glycol Heater Case: Case 5: Evap/Cogen Revision: Rev C
0 kg/h 23.35 MMSCFD MMSCFD MMSCFD Author Mike Armstrong665.9 0 m3/d 1,163 kgmol/hr 898 kgmol/hr Kgmol/hr Natural Gas (Total) Date:
892,650 kJ/kgmol (HHV) kJ/kgmol (HHV) 42.20 MMSCFD1,038 GJ/h GJ/h 2,102 kgmol/hr
892,650802
32311.4%
18.0 0.8140 18-Dec-14
438.5
920.00 11.6 741,6423.12 LP Steam 576 68
6.5
6 984
Flash
1.9% 14,644
195.8 Utility Steam 0297.4 33.8
0 08.5 1
1,435 876 17,509 761,0830.06 1,143 110.25 10.0 1,083
233 0
83924 728,068
761,083
2.00.36.7
300 300
Deae
rato
r
Evaporator1 Train
14.18 0
300
0.241.20.90.3
46.81.4
10,21053.7
8,783
PreflashVessel 21.3
WAC
GT
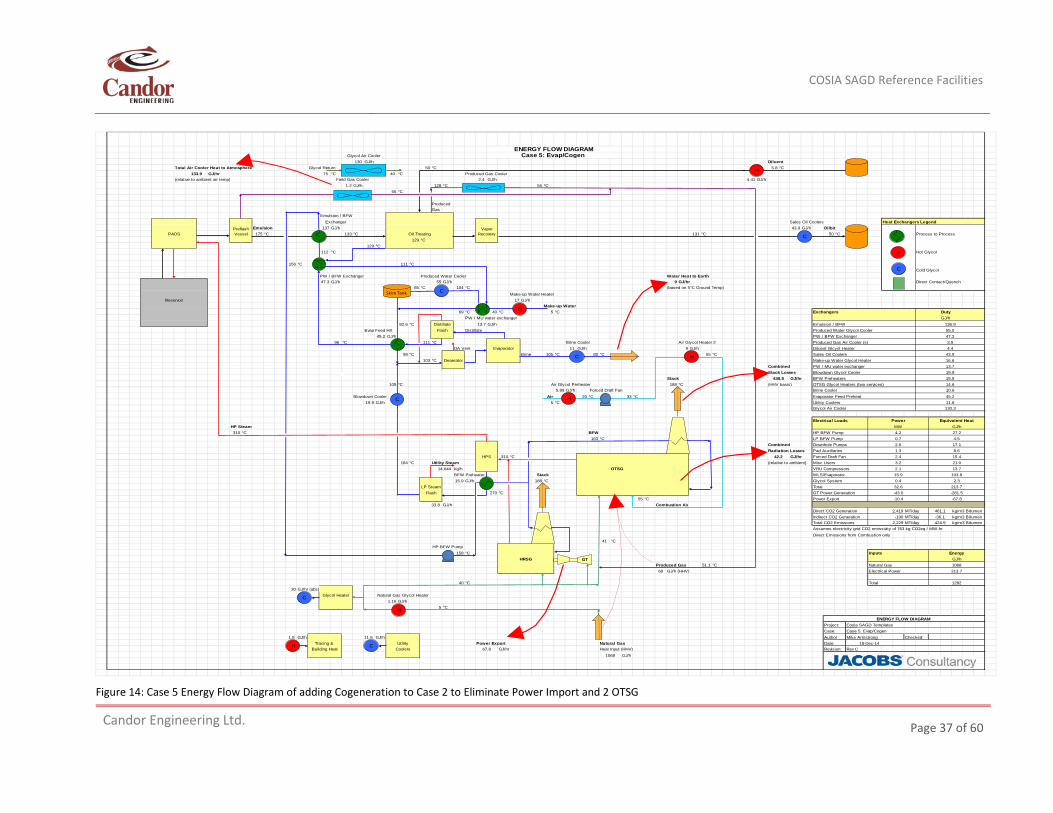
COSIA SAGD Reference Facilities
Candor Engineering Ltd.
Page 37 of 60
Figure 14: Case 5 Energy Flow Diagram of adding Cogeneration to Case 2 to Eliminate Power Import and 2 OTSG
Glycol Air Cooler130 GJ/h Diluent
Total Air Cooler Heat to Atmosphere Glycol Return 50 °C 5.8 °CGJ/hr 75 °C 40 °C Produced Gas Cooler
(relative to ambient air temp) Field Gas Cooler GJ/h 4.41 GJ/h1.2 GJ/h 128 °C 55 °C
55 °C
ProducedGas
Emulsion / BFWExchanger Sales Oil Coolers Heat Exchangers Legend
Emulsion 137 GJ/h 43.9 GJ/h DilbitPADS 175 °C 133 °C Oil Treating 131 °C 50 °C Process to Process
129 °C129 °C
112 °C Hot Glycol
156 °C 111 °CCold Glycol
PW / BFW Exchanger Produced Water Cooler Water Heat to Earth47.3 GJ/h 55 GJ/h 9 GJ/hr Direct Contact/Quench
85 °C 104 °C (based on 5°C Ground Temp)Make-up Water Heater
Reservoir 17 GJ/hMake-up Water
69 °C 40 °C 5 °C Exchangers DutyPW / MU water exchanger GJ/h
82.6 °C Distillate 13.7 GJ/h Emulsion / BFW 136.9Evap Feed HX Flash Distillate Produced Water Glycol Cooler 55.0
45.2 GJ/h PW / BFW Exchanger 47.396 °C 111 °C Brine Cooler Air Glycol Heater 2 Produced Gas Air Cooler (s) 3.5
DA Vent Evaporator 11 GJ/h 9 GJ/h Diluent Glcyol Heater 4.498 °C Brine 105 °C 80 °C 55 °C Sales Oil Coolers 43.9
103 °C Deaerator Make-up Water Glycol Heater 16.6Combined PW / MU water exchanger 13.7Stack Losses Blowdown Glycol Cooler 19.9
Stack GJ/hr BFW Preheaters 15.9105 °C Air Glycol Preheater 188 °C (HHV basis) OTSG Glycol Heaters (two services) 14.6
5.89 GJ/h Forced Draft Fan Brine Cooler 10.6Blowdown Cooler Air 20 °C Fan 33 °C Evaporator Feed Preheat 45.2
19.9 GJ/h 5 °C Utility Coolers 11.6Glycol Air Cooler 130.3
Electrical Loads Power Equivalent HeatHP Steam MW GJ/h310 °C BFW HP BFW Pump 4.2 27.2
163 °C LP BFW Pump 0.7 4.5Combined Downhole Pumps 2.6 17.1Radiation Losses Pad Auxiliaries 1.3 8.6
HPS 310 °C GJ/hr Forced Draft Fan 2.4 15.4184 °C Utility Steam (relative to ambient) Misc Users 3.2 21.0
kg/h OTSG VRU Compressors 2.1 13.7BFW Preheater Stack WLS/Evaporator 15.9 103.815.9 GJ/h 188 °C Glycol System 0.4 2.3
Total 32.6 213.7270 °C GT Power Generation -43.0 -281.5
55 °C Power Export -10.4 -67.8GJ/h Combustion Air
Direct CO2 Generation MT/day 461.1 kg/m3 BitumenIndirect CO2 Generation MT/day -36.1 kg/m3 BitumenTotal CO2 Emissions MT/day 424.9 kg/m3 BitumenAssumes electricity grid CO2 emissivity of 763 kg CO2eq / MW-hrDirect Emissions from Combustion only
41 °CHP BFW Pump
158 °C Inputs EnergyHRSG GJ/h
Produced Gas 51.1 °C Natural Gas 106868 GJ/h (HHV) Electrical Power 213.7
40 °C Total 128230 GJ/hr (abs)
Glycol Heater Natural Gas Glycol Heater1.16 GJ/h
5 °C
ENERGY FLOW DIAGRAM Project: Cosia SAGD TemplatesCase: Case 5: Evap/Cogen
GJ/h GJ/h Author Mike Armstrong Checked:Tracing & Utility Power Export Natural Gas Date:
Building Heat Coolers GJ/hr Heat Input (HHV) Revision: Rev C1068 GJ/h
2,229
1.8 11.6 18-Dec-14
67.8
LP SteamFlash
33.8 2,419-190
438.5
42.2
14,644
ENERGY FLOW DIAGRAMCase 5: Evap/Cogen
133.92.4
Preflash Vessel
Vapor Recovery C
H
C
H
C
H C
H
H
H
C
Skim Tank C
C H
GT
COSIA SAGD Reference Facilities
Candor Engineering Ltd.
Page 38 of 60
10. Central Processing Facility #6 (ML-WLS-Cogen)
The process flow Diagram (PFD) and Energy Flow Diagram (EFD) for this CPF#6 are provided in Figures 15 and 16, respectively.
The only change in CPF#6 over CPF#1 is to use cogeneration to eliminate power import and OTSG steam generation. The ML, oil and water treatments will be similar to those described in Sections 5.1, 5.2 and 5.3.
10.1. Using Cogeneration to replace OTSG
In the CPF#6 design, the objective is to meet the total HP steam and site power requirements using cogeneration. As described elsewhere (6), cogeneration in SAGD is an established practice commercially. It typically employs heat recovery steam generator (HRSG) for HP steam production replacing OTSG, and gas turbine (GT) to produce electricity concurrently, eliminating power import from the Grid. As WLS is continued to be used for water treatment, the BFW quality is only good enough to generate wet steam of 77 wt% quality from the HRSG. The process flow diagram and material balance is shown in Figure 15 below:
In CPF#6, the HRSG has to meet the entire steam requirement for bitumen production. This is the main distinction from Case 4 or 5 where HP steam requirement is jointly met by HRSG and OTSG.
Candor is not privy to the design of this cogeneration. An 88 MW GE 7E plus HRSG was chosen. The GT vendor will provide the available GT exhaust sensible heat to the HRSG. In order to generate the 851,624 kg/h of 77 wt% HP steam requirements by HRSG alone, DB will be deployed to augment the 88 MW GT exhaust to produce the required steam. As shown in Figure 15, the total natural gas requirement is 2,165 GJ/h, split almost equally between GT (1,048 GJ/h) and HRSG DB (1,117 GJ/h). The latter is augmented with 68 GJ/h of recovered LPG for a total of 1,185 GJ/h.
With the exception of cogeneration (GT+HRSG) replacing the OTSG and power import, the remainder of the process flow and the entire material balance are identical to the Base Case. In terms of natural gas requirement, CPF#6 requires 23% more than the Base Case per unit of production, mainly due to higher power generation.
10.2. Overview of Process and Energy Integration
The process integration is identical to the Base Case, although as there are only two HRSGs instead of six OTSG, the BFW and steam distribution systems in the CPF#6 will be different than the Base Case. CPF#6’s energy flows are shown in Figure 16.
The major difference in energy integration vis-à-vis the Base Case is the source of electricity. In the Base Case, power is imported from the Grid. In the current case, it is generated on site from the GT. Part of its output is used to satisfy the various requirements in CPF#6. The one major change in power demand vis-à-vis the Base Case is that forced draft air blowers to deliver combustion air to the OTSG are no longer required as the DB in the HRSG does not required combustion air, relying on the oxygen in the GT exhaust instead. As a result, site power demand drops from 17.9 MW to 13.9 MW. The net power export from the 88 MW GT is therefore 74 MW.
10.3. GHG Emissions
The direct emission intensity is calculated to be 539 kg/m3 of bitumen produced. According to the SGER allocation methodology for cogeneration electricity, the offset credit from exporting 74 MW power is equivalent to 132 kg/m3 (21 kg/bbl) of produced bitumen. Therefore, the net SAGD emission intensity is 407 kg/m3 (64.7 kg/bbl) of produced bitumen. If the export electricity would get offset credit at the Grid intensity of 763 kg/MWh, the net SAGD emission intensity would be 281 kg/m3 (44.7 kg/bbl) of produced bitumen as shown in Table 5. Relative to the Base Case, this would be 42% improvement if the offset credits are set at the Grid GHG intensity.
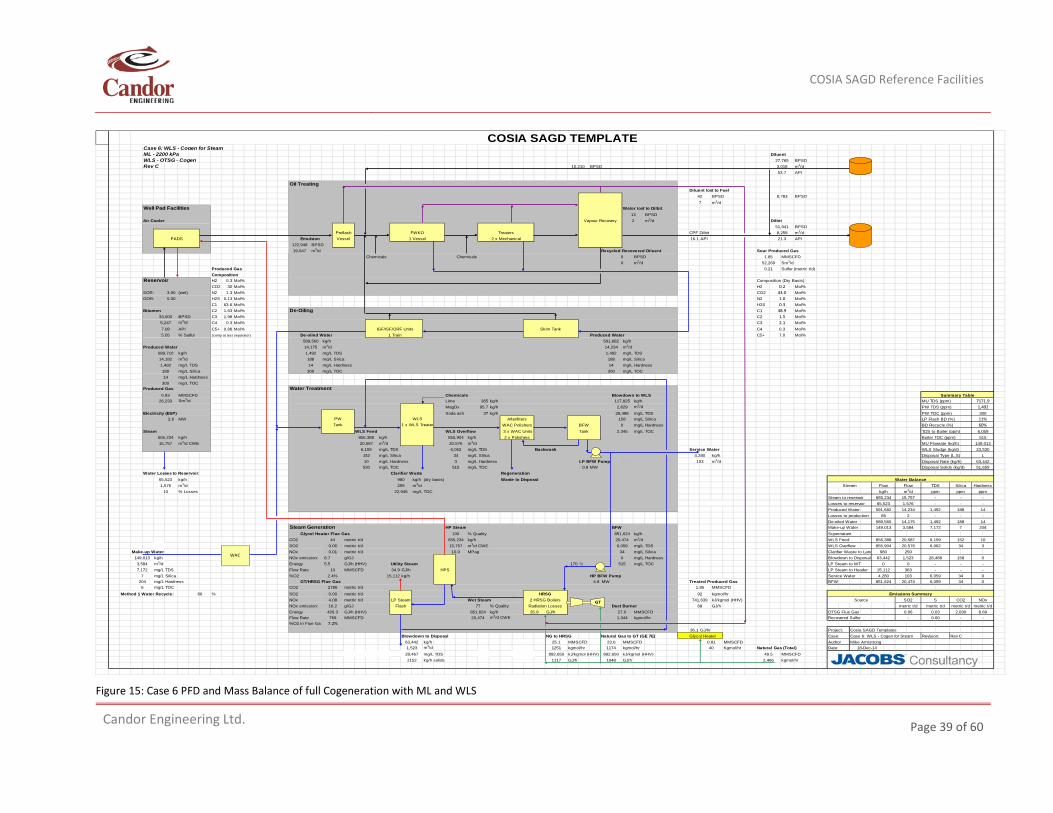
COSIA SAGD Reference Facilities
Candor Engineering Ltd.
Page 39 of 60
Figure 15: Case 6 PFD and Mass Balance of full Cogeneration with ML and WLS
COSIA SAGD TEMPLATECase 6: WLS - Cogen for SteamML - 2200 kPa DiluentWLS - OTSG - Cogen 27,765 BPSDRev C BPSD 3,018 m3/d
API
Oil TreatingDiluent lost to Fuel
42 BPSD BPSD7 m3/d
Well Pad Facilities Water lost to Dilbit13 BPSD
Air Cooler Vapour Recovery 2 m3/d Dilbit51,941 BPSD
FWKO Treaters CPF Dilbit 8,258 m3/dPADS Emulsion 1 Vessel 2 x Mechanical 16.1 API API
122,948 BPSD19,547 m3/d Recycled Recovered Diluent Sour Produced Gas
Chemicals Chemicals 0 BPSD 1.85 MMSCFD0 m3/d 52,269 Sm3/d
Produced Gas 0.21 Sulfur (metric t/d)Composition
Reservoir H2 0.3 Mol% Composition (Dry Basis)CO2 30 Mol% H2 Mol%
SOR: 3.00 (wet) N2 1.3 Mol% CO2 Mol%GOR: 5.00 H2S 0.13 Mol% N2 Mol%
C1 63.6 Mol% H2S Mol%Bitumen C2 1.63 Mol% De-Oiling C1 Mol%
33,000 BPSD C3 1.98 Mol% C2 Mol%5,247 m3/d C4 0.3 Mol% C3 Mol%7.08 API C5+ 0.88 Mol% IGF/ISF/ORF Units Skim Tank C4 Mol%5.05 % Sulfur (comp at test separator) De-oiled Water 1 Train Produced Water C5+ Mol%
589,560 kg/h 591,682 kg/hProduced Water 14,175 m3/d 14,234 m3/d
589,710 kg/h 1,492 mg/L TDS 1,492 mg/L TDS14,182 m3/d 188 mg/L Silica 188 mg/L Silica1,492 mg/L TDS 14 mg/L Hardness 14 mg/L Hardness188 mg/L Silica mg/L TOC mg/L TOC14 mg/L Hardness
mg/L TOCProduced Gas Water Treatment
0.93 MMSCFD Chemicals Blowdown to WLS Summary Table26,233 Sm3/d Lime 365 kg/h 117,825 kg/h MU TDS (ppm) 7171.9
MagOx 95.7 kg/h 2,829 m3/d PW TDS (ppm) 1,492Electricity (ESP) Soda ash 37 kg/h 28,488 mg/L TDS PW TOC (ppm) 300
2.6 MW PW WLS Afterfilters 158 mg/L Silica LP Flash BD (%) 11%Tank 1 x WLS Treater WAC Polishers BFW 0 mg/L Hardness BD Recycle (%) 60%
Steam WLS Feed WLS Overflow 3 x WAC Units Tank mg/L TOC TDS to Boiler (ppm) 6,059655,234 kg/h kg/h 855,904 kg/h 2 x Polishers Boiler TOC (ppm) 51515,757 m3/d CWE 20,587 m3/d 20,576 m3/d MU Flowrate (kg/h) 149,013
6,159 mg/L TDS 6,062 mg/L TDS Backwash Service Water WLS Sludge (kg/d) 23,530152 mg/L Silica 34 mg/L Silica 4,280 kg/h Disposal Type (L,S) L10 mg/L Hardness 3 mg/L Hardness LP BFW Pump 103 m3/d Disposal Rate (kg/h) 63,442
mg/L TOC mg/L TOC 0.8 MW Disposal Solids (kg/d) 51,659Water Losses to Reservoir: Clarifier Waste Regeneration
65,523 kg/h 980 kg/h (dry basis) Waste to Disposal Water Balance1,576 m3/d 259 m3/d Stream Flow Flow TDS Silica Hardness
10 % Losses mg/L TOC kg/h m3/d ppm ppm ppmSteam to reservoir 655,234 15,757 - - -Losses to reservoir 65,523 1,576 - - -Produced Water 591,682 14,234 1,492 188 14Losses to production 85 2 - - -De-oiled Water 589,560 14,175 1,492 188 14
Steam Generation HP Steam BFW Make-up Water 149,013 3,584 7,172 7 204Glycol Heater Flue Gas 100 % Quality kg/h Supernatant
CO2 metric t/d 655,234 kg/h m3/d WLS Feed 20,587 6,159 152 10SO2 metric t/d 15,757 m3/d CWE mg/L TDS WLS Overflow 855,904 20,576 6,062 34 3
Make-up Water NOx metric t/d MPag mg/L Silica Clarifier Waste to Land 980 259149,013 kg/h NOx emission: 8.7 g/GJ mg/L Hardness Blowdown to Disposal 63,442 1,523 28,488 158 03,584 m3/d Energy 5.5 GJ/h (HHV) Utility Steam 170 °C mg/L TOC LP Steam to WT 0 0 - - -7,172 mg/L TDS Flow Rate MMSCFD GJ/h HPS LP Steam to Header 15,112 363 - - -
7 mg/L Silica %O2 kg/h HP BFW Pump Service Water 4,280 103 6,059 34 0204 mg/L Hardness GT/HRSG Flue Gas 4.8 MW Treated Produced Gas BFW 851,624 20,474 6,059 34 0
mg/L TOC CO2 metric t/d 1.85 MMSCFDMethod 1 Water Recycle: 86 % SO2 metric t/d HRSG kgmol/hr Emissions Summary
NOx metric t/d Wet Steam 2 HRSG Boilers kJ/kgmol (HHV) Source SO2 S CO2 NOxNOx emission: 16.2 g/GJ 77 % Quality Radiation Losses Duct Burner GJ/h metric t/d metric t/d metric t/d metric t/dEnergy 426.3 GJ/h (HHV) 851,624 kg/h 35.9 GJ/h MMSCFD OTSG Flue Gas 0.06 0.03 2,830 8.69Flow Rate MMSCFD 20,474 m3/d CWE kgmol/hr Recovered Sulfur - 0.00 - -%O2 in Flue Gas
36.1 GJ/hr Project: Cosia SAGD TemplatesBlowdown to Disposal NG to HRSG Natural Gas to GT (GE 7E) Glycol Heater Case: Case 6: WLS - Cogen for Steam Revision: Rev C
63,442 kg/h 25.1 MMSCFD MMSCFD MMSCFD Author Mike Armstrong1,523 m3/d 1251 kgmol/hr 1174 kgmol/hr Kgmol/hr Natural Gas (Total) Date:
mg/L TDS 892,650 kJ/kgmol (HHV) kJ/kgmol (HHV) 49.5 MMSCFD2152 kg/h solids 1117 GJ/h GJ/h 2,466 kgmol/hr
28,467 892,6501048
23.6 0.8140 18-Dec-14
Flash 6827.0
769 1,3447.2%
924.08 LP Steam 741,6390.00
2.4% 15,112
6 2786
0515
10 34.9
856,3880.06 6,0590.01 10.0 34
851,62444 20,474
2.10.37.0
300 300
2,345856,388
530 515
22,946
300
0.243.01.00.3
48.91.5
10,21053.7
8,783
PreflashVessel 21.3
GT
WAC
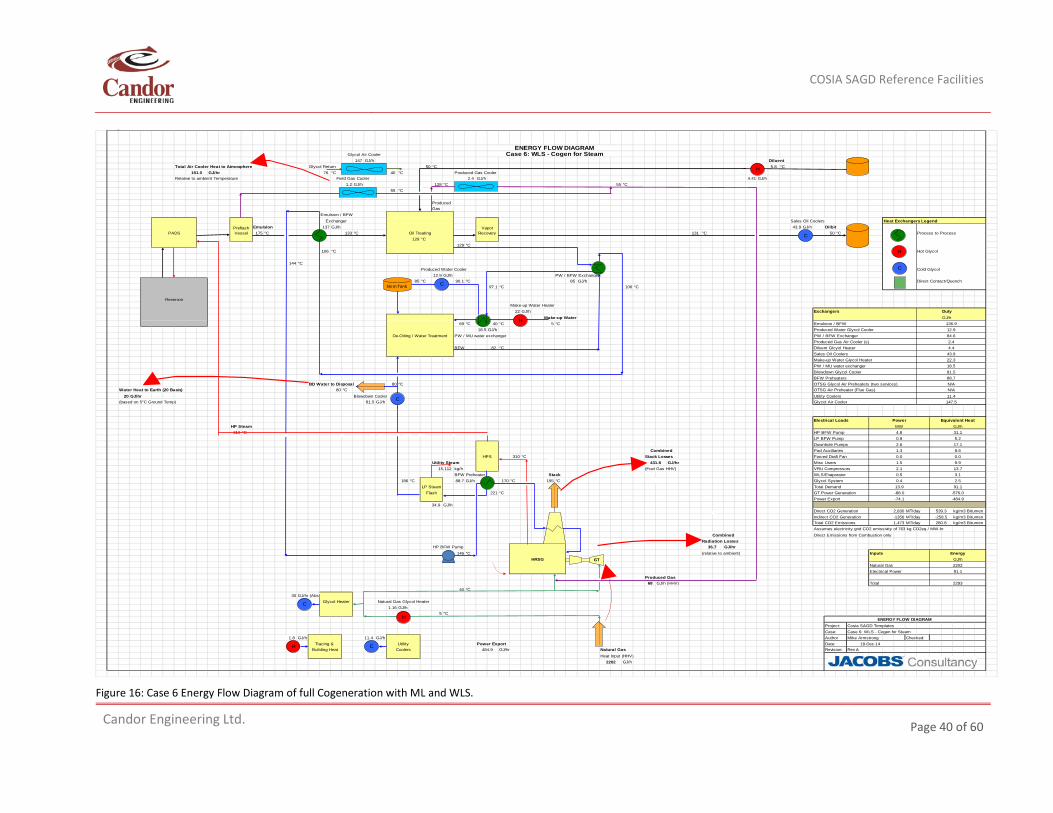
COSIA SAGD Reference Facilities
Candor Engineering Ltd.
Page 40 of 60
Figure 16: Case 6 Energy Flow Diagram of full Cogeneration with ML and WLS.
Glycol Air Cooler147 GJ/h Diluent
Total Air Cooler Heat to Atmosphere Glycol Return 50 °C 5.8 °CGJ/hr 76 °C 40 °C Produced Gas Cooler
Relative to ambient Temperature Field Gas Cooler GJ/h 4.41 GJ/h1.2 GJ/h 128 °C 55 °C
55 °C
ProducedGas
Emulsion / BFWExchanger Sales Oil Coolers Heat Exchangers Legend
Emulsion 137 GJ/h 43.9 GJ/h DilbitPADS 175 °C 133 °C Oil Treating 131 °C 50 °C Process to Process
129 °C129 °C
106 °C Hot Glycol
144 °CProduced Water Cooler Cold Glycol
12.9 GJ/h PW / BFW Exchanger85 °C 90.1 °C 85 GJ/h Direct Contact/Quench
97.1 °C 106 °C
ReservoirMake-up Water Heater
22 GJ/h Exchangers DutyMake-up Water GJ/h
69 °C 40 °C 5 °C Emulsion / BFW 136.918.5 GJ/h Produced Water Glycol Cooler 12.9
De-Oiling / Water Treatment PW / MU water exchanger PW / BFW Exchanger 84.6Produced Gas Air Cooler (s) 2.4
BFW 82 °C Diluent Glcyol Heater 4.4Sales Oil Coolers 43.9Make-up Water Glycol Heater 22.3PW / MU water exchanger 18.5Blowdown Glycol Cooler 81.5BFW Preheaters 88.7
BD Water to Disposal 80 °C OTSG Glycol Air Preheaters (two services) N/AWater Heat to Earth (20 Basis) 80 °C OTSG Air Preheater (Flue Gas) N/A
20 GJ/hr Blowdown Cooler Utility Coolers 11.4(based on 5°C Ground Temp) 81.5 GJ/h Glycol Air Cooler 147.5
Electrical Loads Power Equivalent HeatHP Steam MW GJ/h310 °C HP BFW Pump 4.8 31.1
LP BFW Pump 0.8 5.2Downhole Pumps 2.6 17.1
Combined Pad Auxiliaries 1.3 8.6HPS 310 °C Stack Losses Forced Draft Fan 0.0 0.0
Utility Steam GJ/hr Misc Users 1.5 9.9kg/h (Fuel Gas HHV) VRU Compressors 2.1 13.7BFW Preheater Stack WLS/Evaporator 0.5 3.1
186 °C 88.7 GJ/h 170 °C 195 °C Glycol System 0.4 2.5Total Demand 13.9 91.1
221 °C GT Power Generation -88.0 -576.0Power Export -74.1 -484.9
GJ/hDirect CO2 Generation MT/day 539.3 kg/m3 BitumenIndirect CO2 Generation MT/day kg/m3 BitumenTotal CO2 Emissions MT/day kg/m3 BitumenAssumes electricity grid CO2 emissivity of 763 kg CO2eq / MW-hr
Combined Direct Emissions from Combustion onlyRadiation Losses
HP BFW Pump GJ/hr146 °C (relative to ambient) Inputs Energy
HRSG GJ/hNatural Gas 2202Electrical Power 91.1
Produced Gas68 GJ/h (HHV) Total 2293
40 °C30 GJ/hr (Abs)
Glycol Heater Natural Gas Glycol Heater1.16 GJ/h
5 °CENERGY FLOW DIAGRAM
Project: Cosia SAGD TemplatesCase: Case 6: WLS - Cogen for Steam
GJ/h GJ/h Author Mike Armstrong Checked:Tracing & Utility Power Export Date:
Building Heat Coolers GJ/hr Natural Gas Revision: Rev AHeat Input (HHV)
GJ/h
1.8 11.4 18-Dec-14
484.9
2202
Flash
34.9 2,830-1356
36.7
-258.51,473 280.8
15,112
LP Steam
ENERGY FLOW DIAGRAMCase 6: WLS - Cogen for Steam
151.02.4
Preflash Vessel
Vapor Recovery
431.8
C
H
C
H
C
H C
H
C
H
C
Skim Tank
GT
COSIA SAGD Reference Facilities
Candor Engineering Ltd.
Page 41 of 60
11. References
1. http://www.mining.com/wp-content/uploads/2013/09/Alberta-oil-sands-map1.png
2. http://www.energy.alberta.ca/OilSands/pdfs/FS_SAGD.pdf
3. https://www.albertacanada.com/mexico/documents/P2.HeavyOil.pdfOlm
4. http://www.cnrl.com/operations/north-america/north-american-crude-oil-and-ngls/thermal-insitu-oilsands/
5. COSIA oil Sands Production Overview
6. http://www.cesarnet.ca/publications/cesar-scenarios/cogeneration-options-33000-bpd-sagd-facility-greenhouse-gas-and#read
7. http://www.oilsandsmagazine.com/technical/in-situ
8. https://en.wikipedia.org/wiki/Submersible_pumpwer
9. http://www.exterran.com/Content/Docs/Products/Induced-Gas-Flotation-within-an-API-Skim-Tank-Design-Approach-and-Results-English-Letter.pdf
10. http://www.nalco.com/documents/Published-Articles/R-1014_-_Scale_and_Deposit_Formation_in_SAGD_Facilities.pdf657
11. http://dowac.custhelp.com/app/answers/detail/a_id/4299/~/dow-ion-exchange-resins---dealkalization-and-softening-with-weak-acid-cation
12. http://www.tundrasolutions.ca/files/Evaporators%20in%20SAGD%20DP.pdf
13. https://en.wikipedia.org/wiki/Gas_lift
12. Appendices: Process Flow Diagrams, Mass Balances, Utilities and Energy Flow Diagrams provided by COSIA
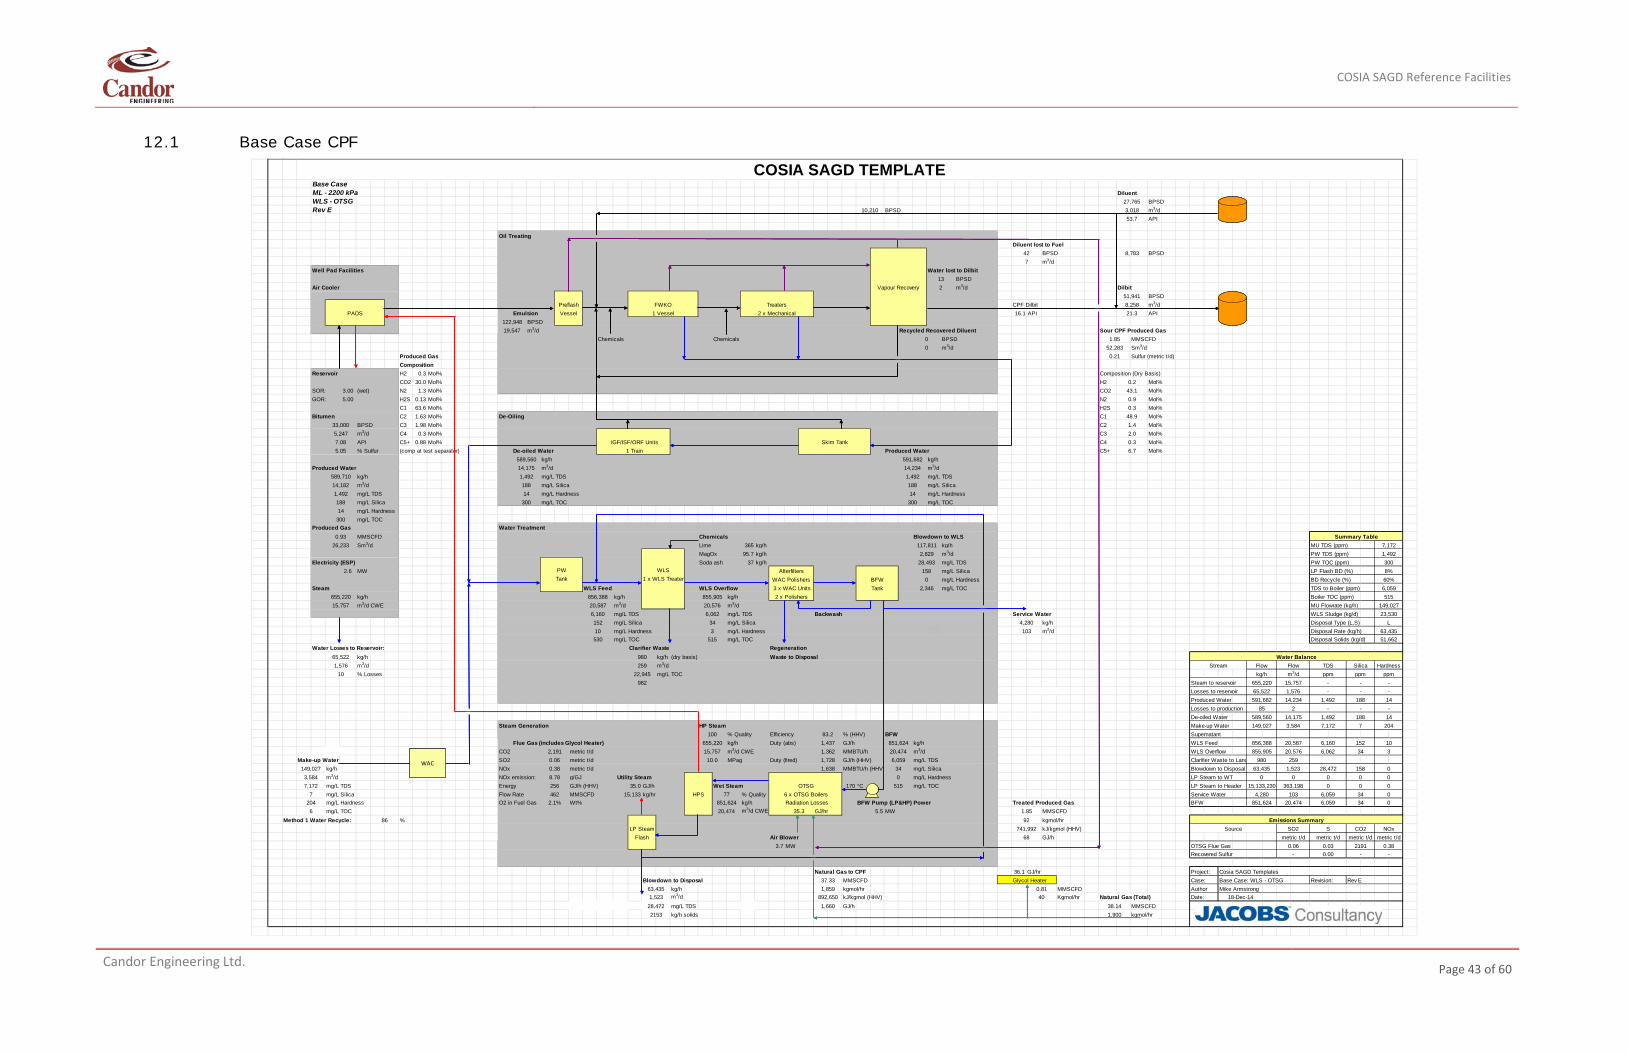
COSIA SAGD Reference Facilities
Candor Engineering Ltd.
Page 43 of 60
12.1 Base Case CPF
COSIA SAGD TEMPLATEBase CaseML - 2200 kPa DiluentWLS - OTSG 27,765 BPSDRev E BPSD 3,018 m3/d
API
Oil TreatingDiluent lost to Fuel
42 BPSD BPSD7 m3/d
Well Pad Facilities Water lost to Dilbit13 BPSD
Air Cooler Vapour Recovery 2 m3/d Dilbit51,941 BPSD
FWKO Treaters CPF Dilbit 8,258 m3/dPADS Emulsion 1 Vessel 2 x Mechanical 16.1 API API
122,948 BPSD19,547 m3/d Recycled Recovered Diluent Sour CPF Produced Gas
Chemicals Chemicals 0 BPSD 1.85 MMSCFD0 m3/d 52,283 Sm3/d
Produced Gas 0.21 Sulfur (metric t/d)Composition
Reservoir H2 0.3 Mol% Composition (Dry Basis)CO2 30.0 Mol% H2 Mol%
SOR: 3.00 (wet) N2 1.3 Mol% CO2 Mol%GOR: 5.00 H2S 0.13 Mol% N2 Mol%
C1 63.6 Mol% H2S Mol%Bitumen C2 1.63 Mol% De-Oiling C1 Mol%
33,000 BPSD C3 1.98 Mol% C2 Mol%5,247 m3/d C4 0.3 Mol% C3 Mol%7.08 API C5+ 0.88 Mol% IGF/ISF/ORF Units Skim Tank C4 Mol%5.05 % Sulfur (comp at test separator) De-oiled Water 1 Train Produced Water C5+ Mol%
589,560 kg/h 591,682 kg/hProduced Water 14,175 m3/d 14,234 m3/d
589,710 kg/h 1,492 mg/L TDS 1,492 mg/L TDS14,182 m3/d 188 mg/L Silica 188 mg/L Silica1,492 mg/L TDS 14 mg/L Hardness 14 mg/L Hardness188 mg/L Silica mg/L TOC mg/L TOC14 mg/L Hardness
mg/L TOCProduced Gas Water Treatment
0.93 MMSCFD Chemicals Blowdown to WLS Summary Table26,233 Sm3/d Lime 365 kg/h 117,811 kg/h MU TDS (ppm) 7,172
MagOx 95.7 kg/h 2,829 m3/d PW TDS (ppm) 1,492Electricity (ESP) Soda ash 37 kg/h 28,493 mg/L TDS PW TOC (ppm) 300
2.6 MW PW WLS Afterfilters 158 mg/L Silica LP Flash BD (%) 8%Tank 1 x WLS Treater WAC Polishers BFW 0 mg/L Hardness BD Recycle (%) 60%
Steam WLS Feed WLS Overflow 3 x WAC Units Tank mg/L TOC TDS to Boiler (ppm) 6,059655,220 kg/h kg/h 855,905 kg/h 2 x Polishers Boiler TOC (ppm) 51515,757 m3/d CWE 20,587 m3/d 20,576 m3/d MU Flowrate (kg/h) 149,027
6,160 mg/L TDS 6,062 mg/L TDS Backwash Service Water WLS Sludge (kg/d) 23,530152 mg/L Silica 34 mg/L Silica 4,280 kg/h Disposal Type (L,S) L10 mg/L Hardness 3 mg/L Hardness 103 m3/d Disposal Rate (kg/h) 63,435
mg/L TOC mg/L TOC Disposal Solids (kg/d) 51,662Water Losses to Reservoir: Clarifier Waste Regeneration
65,522 kg/h 980 kg/h (dry basis) Waste to Disposal Water Balance1,576 m3/d 259 m3/d Stream Flow Flow TDS Silica Hardness
10 % Losses mg/L TOC kg/h m3/d ppm ppm ppmSteam to reservoir 655,220 15,757 - - -Losses to reservoir 65,522 1,576 - - -Produced Water 591,682 14,234 1,492 188 14Losses to production 85 2 - - -De-oiled Water 589,560 14,175 1,492 188 14
Steam Generation HP Steam Make-up Water 149,027 3,584 7,172 7 204100 % Quality Efficiency % (HHV) BFW Supernatant
Flue Gas (includes Glycol Heater) 655,220 kg/h Duty (abs) GJ/h 851,624 kg/h WLS Feed 20,587 6,160 152 10CO2 2,191 metric t/d 15,757 m3/d CWE MMBTU/h 20,474 m3/d WLS Overflow 855,905 20,576 6,062 34 3
Make-up Water SO2 0.06 metric t/d MPag Duty (fired) GJ/h (HHV) 6,059 mg/L TDS Clarifier Waste to Land 980 259149,027 kg/h NOx 0.38 metric t/d MMBTU/h (HHV) 34 mg/L Silica Blowdown to Disposal 63,435 1,523 28,472 158 03,584 m3/d NOx emission: 8.78 g/GJ 0 mg/L Hardness LP Steam to WT 0 0 0 0 07,172 mg/L TDS Energy GJ/h (HHV) GJ/h Wet Steam OTSG 170 °C mg/L TOC LP Steam to Header 15,133,230 363,198 0 0 0
7 mg/L Silica Flow Rate MMSCFD kg/hr HPS 77 % Quality 6 x OTSG Boilers Service Water 4,280 103 6,059 34 0204 mg/L Hardness O2 in Fuel Gas Wt% 851,624 kg/h Radiation Losses BFW Pump (LP&HP) Power Treated Produced Gas BFW 851,624 20,474 6,059 34 0
mg/L TOC 20,474 m3/d CWE 35.3 GJ/hr 5.5 MW 1.85 MMSCFDMethod 1 Water Recycle: 86 % kgmol/hr Emissions Summary
kJ/kgmol (HHV) Source SO2 S CO2 NOxAir Blower GJ/h metric t/d metric t/d metric t/d metric t/d
3.7 MW OTSG Flue Gas 0.06 0.03 2191 0.38Recovered Sulfur - 0.00 - -
Natural Gas to CPF 36.1 GJ/hr Project: Cosia SAGD TemplatesBlowdown to Disposal 37.33 MMSCFD Glycol Heater Case: Base Case: WLS - OTSG Revision: Rev E
63,435 kg/h kgmol/hr MMSCFD Author Mike Armstrong1,523 m3/d kJ/kgmol (HHV) Kgmol/hr Natural Gas (Total) Date:
mg/L TDS GJ/h 38.14 MMSCFD2153 kg/h solids kgmol/hr
10,21053.7
8,783
PreflashVessel 21.3
300
0.243.10.90.3
48.91.42.00.36.7
300 300
856,388
530 515
22,945982
856,3881,362
10.0 1,728
2,346
256 35.0 515
83.21,437
LP Steam 741,992
1,638Utility Steam
462 15,1332.1%
692
Flash 68
1,859 0.81892,650 40 18-Dec-14
28,472 1,6601,900
WACWAC
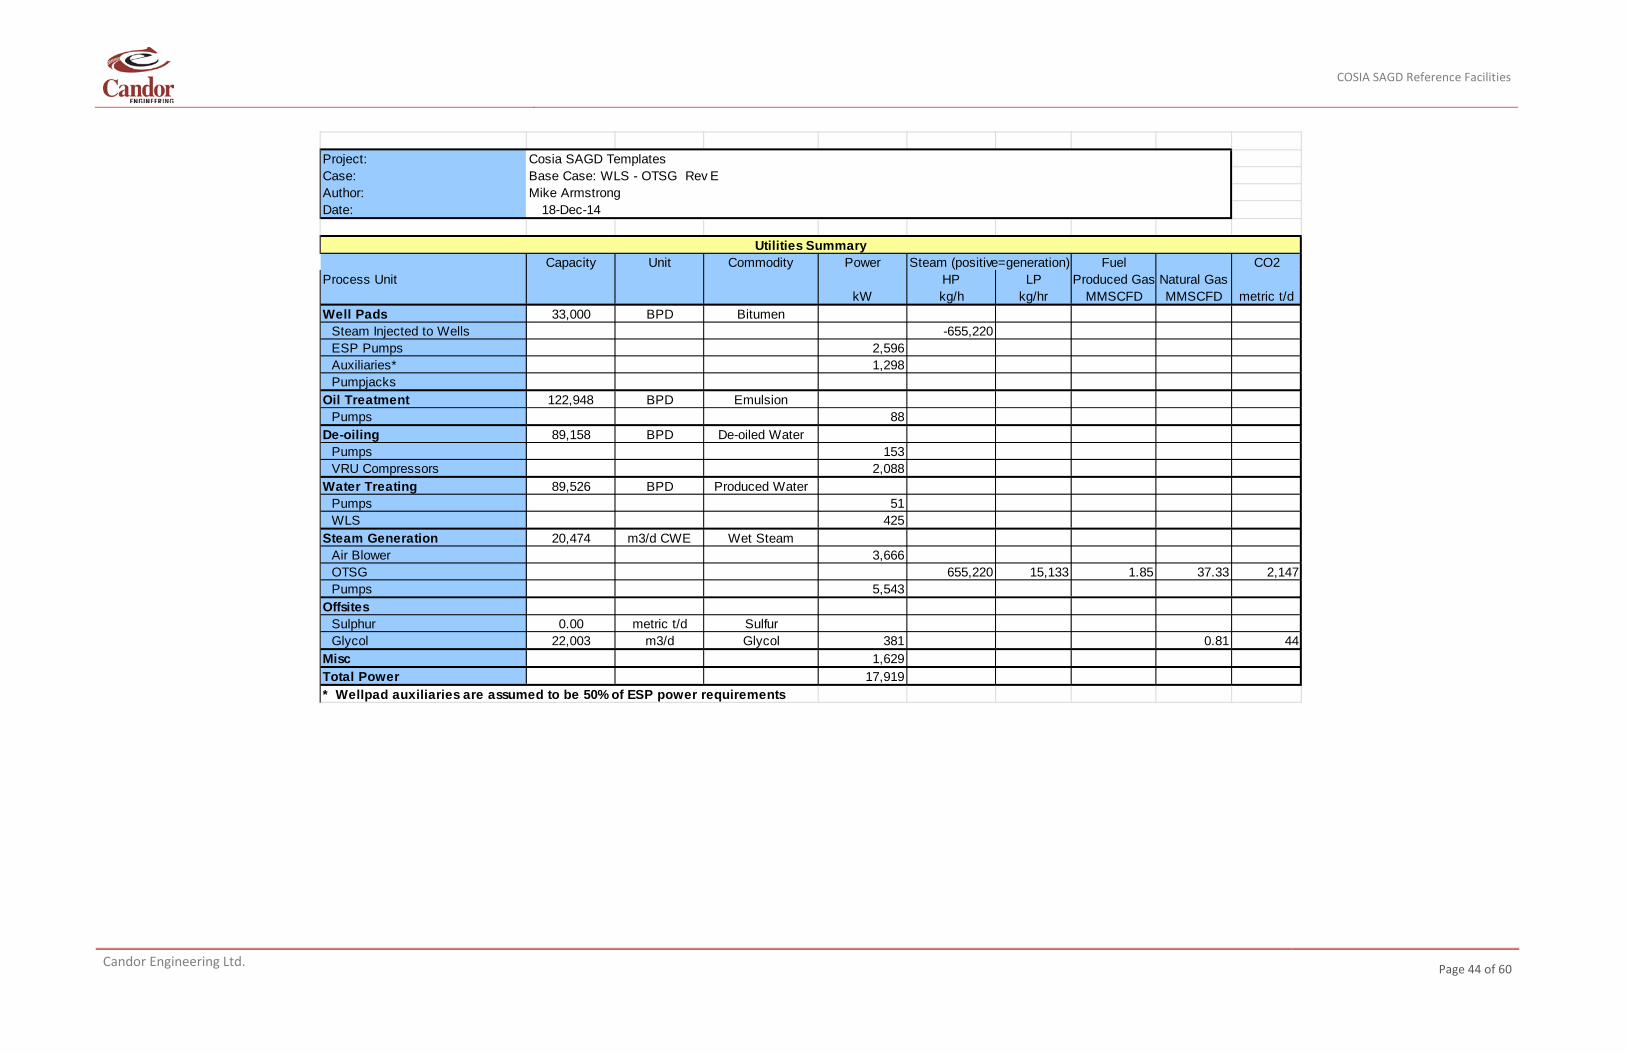
COSIA SAGD Reference Facilities
Candor Engineering Ltd.
Page 44 of 60
Project: Cosia SAGD TemplatesCase: Base Case: WLS - OTSG Rev EAuthor: Mike ArmstrongDate: 18-Dec-14
Utilities SummaryCapacity Unit Commodity Power Steam (positive=generation) Fuel CO2
Process Unit HP LP Produced Gas Natural GaskW kg/h kg/hr MMSCFD MMSCFD metric t/d
Well Pads 33,000 BPD BitumenSteam Injected to Wells -655,220ESP Pumps 2,596Auxiliaries* 1,298Pumpjacks
Oil Treatment 122,948 BPD EmulsionPumps 88
De-oiling 89,158 BPD De-oiled WaterPumps 153VRU Compressors 2,088
Water Treating 89,526 BPD Produced WaterPumps 51WLS 425
Steam Generation 20,474 m3/d CWE Wet SteamAir Blower 3,666OTSG 655,220 15,133 1.85 37.33 2,147Pumps 5,543
OffsitesSulphur 0.00 metric t/d SulfurGlycol 22,003 m3/d Glycol 381 0.81 44
Misc 1,629Total Power 17,919* Wellpad auxiliaries are assumed to be 50% of ESP power requirements
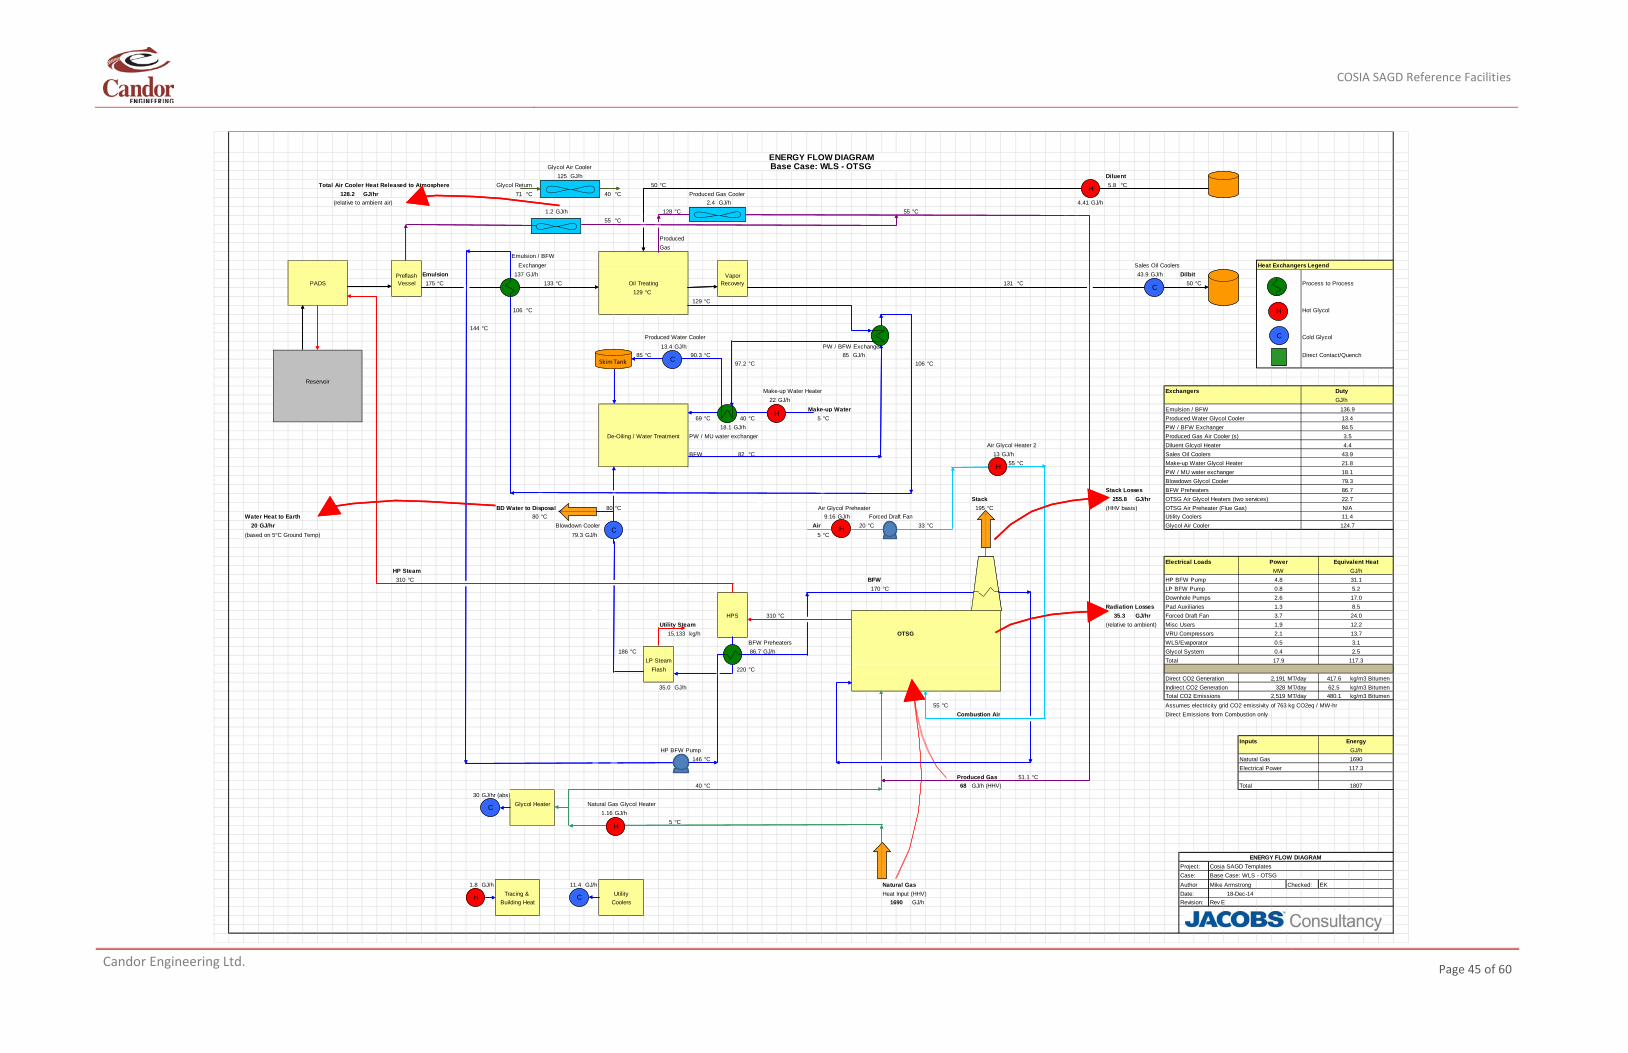
COSIA SAGD Reference Facilities
Candor Engineering Ltd.
Page 45 of 60
Glycol Air Cooler125 GJ/h Diluent
Total Air Cooler Heat Released to Atmosphere Glycol Return 50 °C 5.8 °CGJ/hr 71 °C 40 °C Produced Gas Cooler
(relative to ambient air) GJ/h 4.41 GJ/h1.2 GJ/h 128 °C 55 °C
55 °C
ProducedGas
Emulsion / BFWExchanger Sales Oil Coolers Heat Exchangers Legend
Emulsion 137 GJ/h 43.9 GJ/h DilbitPADS 175 °C 133 °C Oil Treating 131 °C 50 °C Process to Process
129 °C129 °C
106 °C Hot Glycol
144 °CProduced Water Cooler Cold Glycol
13.4 GJ/h PW / BFW Exchanger85 °C 90.3 °C 85 GJ/h Direct Contact/Quench
97.2 °C 106 °C
ReservoirMake-up Water Heater Exchangers Duty
22 GJ/h GJ/hMake-up Water Emulsion / BFW 136.9
69 °C 40 °C 5 °C Produced Water Glycol Cooler 13.418.1 GJ/h PW / BFW Exchanger 84.5
De-Oiling / Water Treatment PW / MU water exchanger Produced Gas Air Cooler (s) 3.5Air Glycol Heater 2 Diluent Glcyol Heater 4.4
BFW 82 °C 13 GJ/h Sales Oil Coolers 43.955 °C Make-up Water Glycol Heater 21.8
PW / MU water exchanger 18.1Blowdown Glycol Cooler 79.3
Stack Losses BFW Preheaters 86.7Stack 255.8 GJ/hr OTSG Air Glycol Heaters (two services) 22.7
BD Water to Disposal 80 °C Air Glycol Preheater 195 °C (HHV basis) OTSG Air Preheater (Flue Gas) N/AWater Heat to Earth 80 °C 9.16 GJ/h Forced Draft Fan Utility Coolers 11.4
20 GJ/hr Blowdown Cooler Air 20 °C Fan 33 °C Glycol Air Cooler 124.7(based on 5°C Ground Temp) 79.3 GJ/h 5 °C
Electrical Loads Power Equivalent HeatHP Steam MW GJ/h310 °C BFW HP BFW Pump 4.8 31.1
170 °C LP BFW Pump 0.8 5.2Downhole Pumps 2.6 17.0
Radiation Losses Pad Auxiliaries 1.3 8.5HPS 310 °C 35.3 GJ/hr Forced Draft Fan 3.7 24.0
Utility Steam (relative to ambient) Misc Users 1.9 12.2kg/h OTSG VRU Compressors 2.1 13.7
BFW Preheaters WLS/Evaporator 0.5 3.1186 °C 86.7 GJ/h Glycol System 0.4 2.5
Total 17.9 117.3220 °C
Direct CO2 Generation MT/day 417.6 kg/m3 BitumenGJ/h Indirect CO2 Generation MT/day 62.5 kg/m3 Bitumen
Total CO2 Emissions MT/day kg/m3 Bitumen55 °C Assumes electricity grid CO2 emissivity of 763 kg CO2eq / MW-hr
Combustion Air Direct Emissions from Combustion only
Inputs EnergyHP BFW Pump GJ/h
146 °C Natural Gas 1690Electrical Power 117.3
Produced Gas 51.1 °C40 °C 68 GJ/h (HHV) Total 1807
30 GJ/hr (abs)Glycol Heater Natural Gas Glycol Heater
1.16 GJ/h5 °C
ENERGY FLOW DIAGRAM Project: Cosia SAGD TemplatesCase: Base Case: WLS - OTSG
GJ/h GJ/h Natural Gas Author Mike Armstrong Checked: EKTracing & Utility Heat Input (HHV) Date:
Building Heat Coolers GJ/h Revision: Rev E18-Dec-14
1690
2,19135.0 328
2,519 480.1
1.8 11.4
15,133
LP SteamFlash
ENERGY FLOW DIAGRAMBase Case: WLS - OTSG
128.22.4
Preflash Vessel
Vapor Recovery C
H
C
H
C
H C
H
H
H
H
C
Skim Tank C
C
H
C
H
C
H C
H
H
H
H
C
Skim Tank C
COSIA SAGD Reference Facilities
Candor Engineering Ltd.
Page 46 of 60
12.2 CPF#2: ML-Evap-OTSG
COSIA SAGD TEMPLATECase 2 ML - 2200 kPa DiluentEVAP - OTSG 27,765 BPSDRev D BPSD 3,018 m3/d
API
Oil TreatingDiluent lost to Fuel
42 BPSD BPSD7 m3/d
Well Pad Facilities Water lost to Dilbit13 BPSD
Air Cooler Vapour Recovery 2 m3/d Dilbit51,941 BPSD
FWKO Treaters CPF Dilbit 8,258 m3/dPADS Emulsion 1 Vessel 2 x Mechanical 16.1 API API
122,948 BPSD19,547 m3/d Recycled Recovered Diluent Sour Produced Gas
Chemicals Chemicals 0 BPSD 1.85 MMSCFD0 m3/d 52,283 Sm3/d
Produced Gas 0.21 Sulfur (metric t/d)Composition
Reservoir H2 0.3 Mol% Composition (Dry Basis)CO2 30 Mol% H2 Mol%
SOR: 3.00 (wet) N2 1.3 Mol% CO2 Mol%GOR: 5.00 H2S 0.13 Mol% N2 Mol%
C1 63.6 Mol% H2S Mol%Bitumen C2 1.63 Mol% De-Oiling C1 Mol%
33,000 BPSD C3 1.98 Mol% C2 Mol%5,247 m3/d C4 0.3 Mol% C3 Mol%7.08 API C5+ 0.88 Mol% IGF/ISF/ORF Units Skim Tank C4 Mol%5.05 % Sulfur (comp at test separator) De-oiled Water 1 Train Produced Water C5+ Mol%
589,560 kg/h 591,682 kg/hProduced Water 14,175 m3/d 14,234 m3/d
589,710 kg/h 1,492 mg/L TDS 1,492 mg/L TDS14,182 m3/d 188 mg/L Silica 188 mg/L Silica1,492 mg/L TDS 14 mg/L Hardness 14 mg/L Hardness188 mg/L Silica mg/L TOC mg/L TOC14 mg/L Hardness
mg/L TOCProduced Gas Water Treatment
0.93 MMSCFD Blowdown to Evap Summary Table26,233 Sm3/d Deaerator Vent 58,175 kg/h MU TDS (ppm) 7171.9
423 kg/h 1,399 m3/d PW TDS (ppm) 1,492Electricity (ESP) 10 m3/d 133 mg/L TDS PW TOC (ppm) 300
2.6 MW 0 mg/L Silica LP Flash BD (%) 20%BFW 8 mg/L Hardness BD Recycle (%) 80%
Steam Evaporator Feed 1300 gpm each Condensate Tank mg/L TOC TDS to Boiler (ppm) 11655,234 kg/h kg/h MW 731,608 kg/h Boiler TOC (ppm) 015,757 m3/d CWE 18,292 m3/d 17,594 m3/d MU Flowrate (kg/h) 113,048
2,202 mg/L TDS Chemicals 11 mg/L TDS Service Water WLS Sludge (kg/d) 0147 mg/L Silica 0 mg/L Silica 3,658 kg/h Disposal Type (L,S) L12 mg/L Hardness 1 mg/L Hardness 88 m3/d Disposal Rate (kg/h) 28,745
mg/L TOC mg/L TOC Disposal Solids (kg/d) 1,675Water Losses to Reservoir: Concentrate to Disposal
65,523 kg/h 28,745 kg/h Water Balance1,576 m3/d 688 m3/d Stream Flow Flow TDS Silica Hardness
10 % Losses 58,284 mg/L TDS kg/h m3/d ppm ppm ppm388 mg/L Silica Steam to reservoir 655,234 15,757 - - -31 mg/L Hardness Losses to reservoir 65,523 1,576 - - -
Produced Water 591,682 14,234 1,492 188 14Losses to production 85 2 - - -De-oiled Water 589,560 14,175 1,492 188 14
Steam Generation HP Steam Make-up Water 113,048 2,719 7,172 7 204100 % Quality Efficiency % (HHV) BFW Supernatant
Flue Gas (includes Glycol Heater) 655,234 kg/h Duty (abs) GJ/h 727,950 kg/h Evaporator Feed 18,292 2,202 147 12CO2 2,104 metric t/d 15,757 m3/d CWE MMBTU/h 17,506 m3/d Condensate 731,608 17,594 11 0 1
Make-up Water SO2 0.06 metric t/d MPag Duty (fired) GJ/h (HHV) 11 mg/L TDS De-aerator Vent 423 10 0 0113,048 kg/h NOx 0.37 metric t/d MMBTU/h (HHV) 0 mg/L Silica Conc. to Disposal 28,745 688 58,284 388 312,719 m3/d NOx emission: 8.8 g/GJ Utility Steam 1 mg/L Hardness LP Steam to WT 0 0 0 0 07,172 mg/L TDS Energy 244.5 GJ/h (HHV) GJ/h Wet Steam OTSG 163 °C mg/L TOC LP Steam to Header 14,636 351 0 0 0
7 mg/L Silica Flow Rate 443.3 MMSCFD kg/hr HPS 90 % Quality 5 OTSG Boilers Service Water 3,658 88 11 0 1204 mg/L Hardness 727,950 kg/h Radiation Losses BFW Pump Power Treated Produced Gas BFW 727,950 17,506 11 0 1
mg/L TOC 17,506 m3/d CWE 33.862899 GJ/hr MW 4.8 1.85 MMSCFDMethod 1 Water Recycle: 92 % kgmol/hr Emissions Summary
kJ/kgmol (HHV) Source SO2 S CO2 NOxAir Blower GJ/h metric t/d metric t/d metric t/d metric t/d
3.5 MW OTSG Flue Gas 0.06 0.03 2104 0.37Recovered Sulfur - 0.00 - -
Natural Gas to CPF Project: Cosia SAGD TemplatesBlowdown to Disposal 35.73 MMSCFD Glycol Heater Case: Case 2 : EVAP - OTSG Revision: Rev D
0 kg/h kgmol/hr MMSCFD Author Mike Armstrong0 m3/d kJ/kgmol (HHV) Kgmol/hr Natural Gas (Total) Date:
GJ/h 36.54 MMSCFD1,820 kgmol/hr
1,589
36
1,780 0.81892,650 40
01,571
18-Dec-14
14,636
692
LP Steam 741,995Flash 68
33.8 0
233 0
831,3791,307
10.0 1,657
760,776
Dea
erat
or
Evaporator2 Evap Trains
0760,776 14.18
300
0.241.30.90.3
46.81.42.00.36.7
300 300
10,21053.7
8,783
PreflashVessel 21.3
Ion Exchange
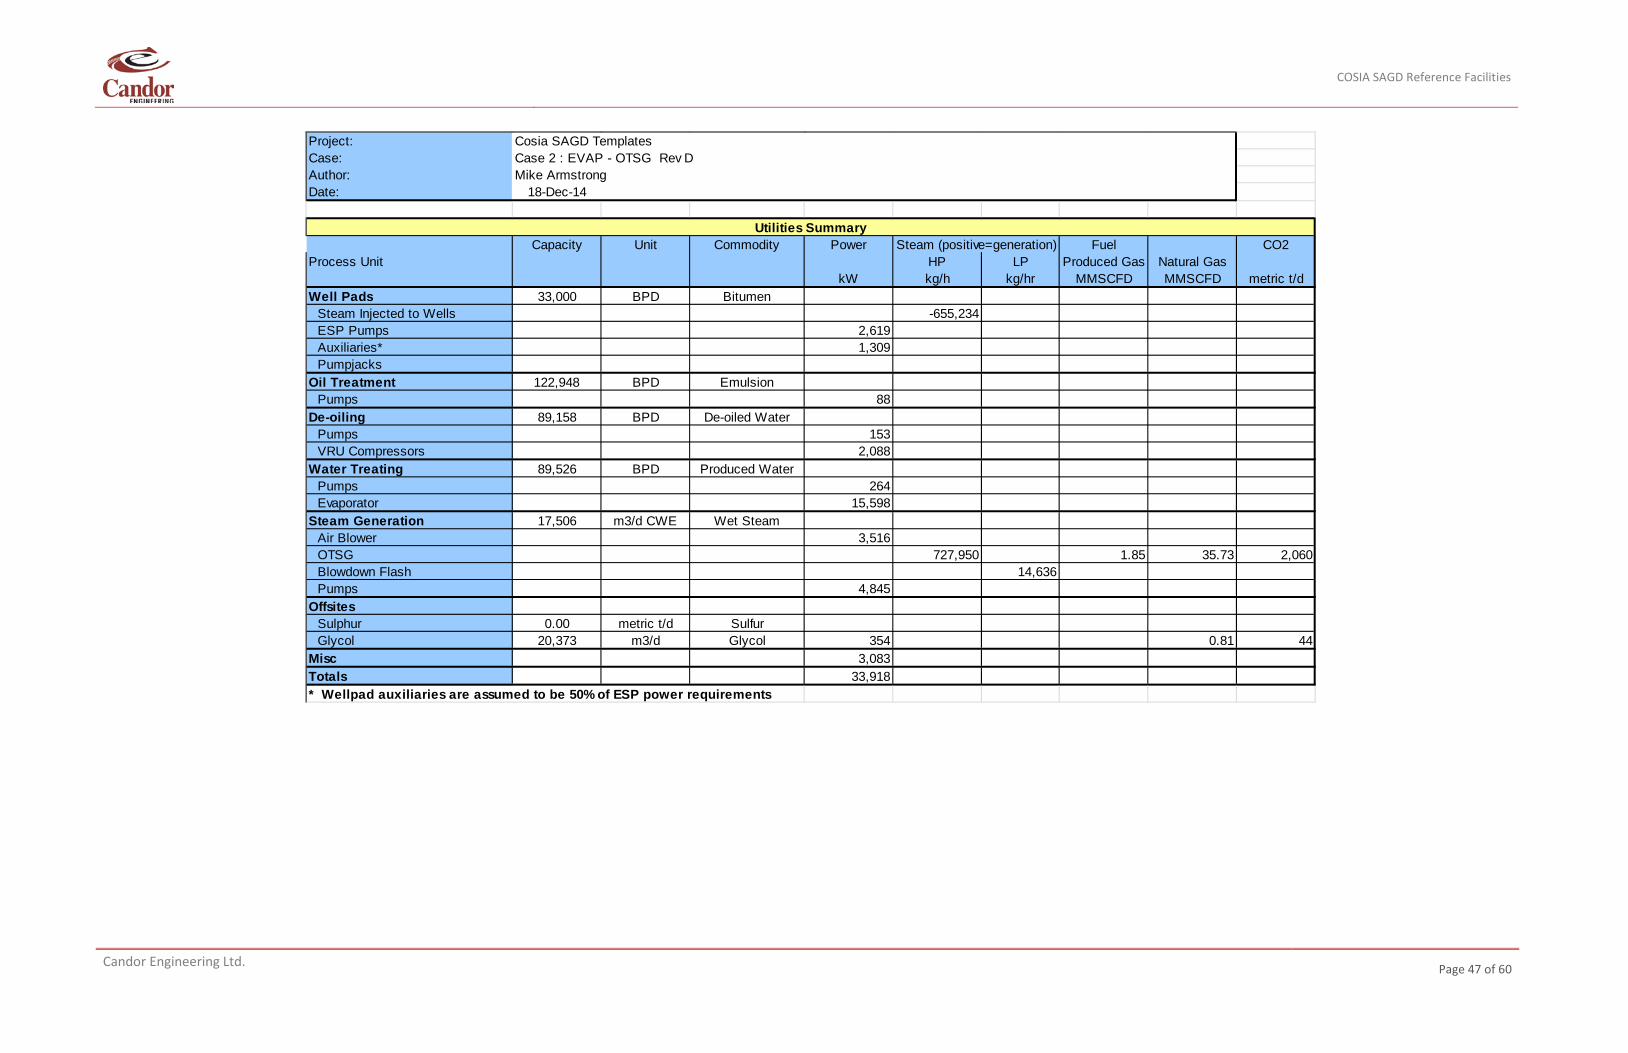
COSIA SAGD Reference Facilities
Candor Engineering Ltd.
Page 47 of 60
Project: Cosia SAGD TemplatesCase: Case 2 : EVAP - OTSG Rev DAuthor: Mike ArmstrongDate: 18-Dec-14
Utilities SummaryCapacity Unit Commodity Power Steam (positive=generation) Fuel CO2
Process Unit HP LP Produced Gas Natural GaskW kg/h kg/hr MMSCFD MMSCFD metric t/d
Well Pads 33,000 BPD BitumenSteam Injected to Wells -655,234ESP Pumps 2,619Auxiliaries* 1,309Pumpjacks
Oil Treatment 122,948 BPD EmulsionPumps 88
De-oiling 89,158 BPD De-oiled WaterPumps 153VRU Compressors 2,088
Water Treating 89,526 BPD Produced WaterPumps 264Evaporator 15,598
Steam Generation 17,506 m3/d CWE Wet SteamAir Blower 3,516OTSG 727,950 1.85 35.73 2,060Blowdown Flash 14,636Pumps 4,845
OffsitesSulphur 0.00 metric t/d SulfurGlycol 20,373 m3/d Glycol 354 0.81 44
Misc 3,083Totals 33,918* Wellpad auxiliaries are assumed to be 50% of ESP power requirements
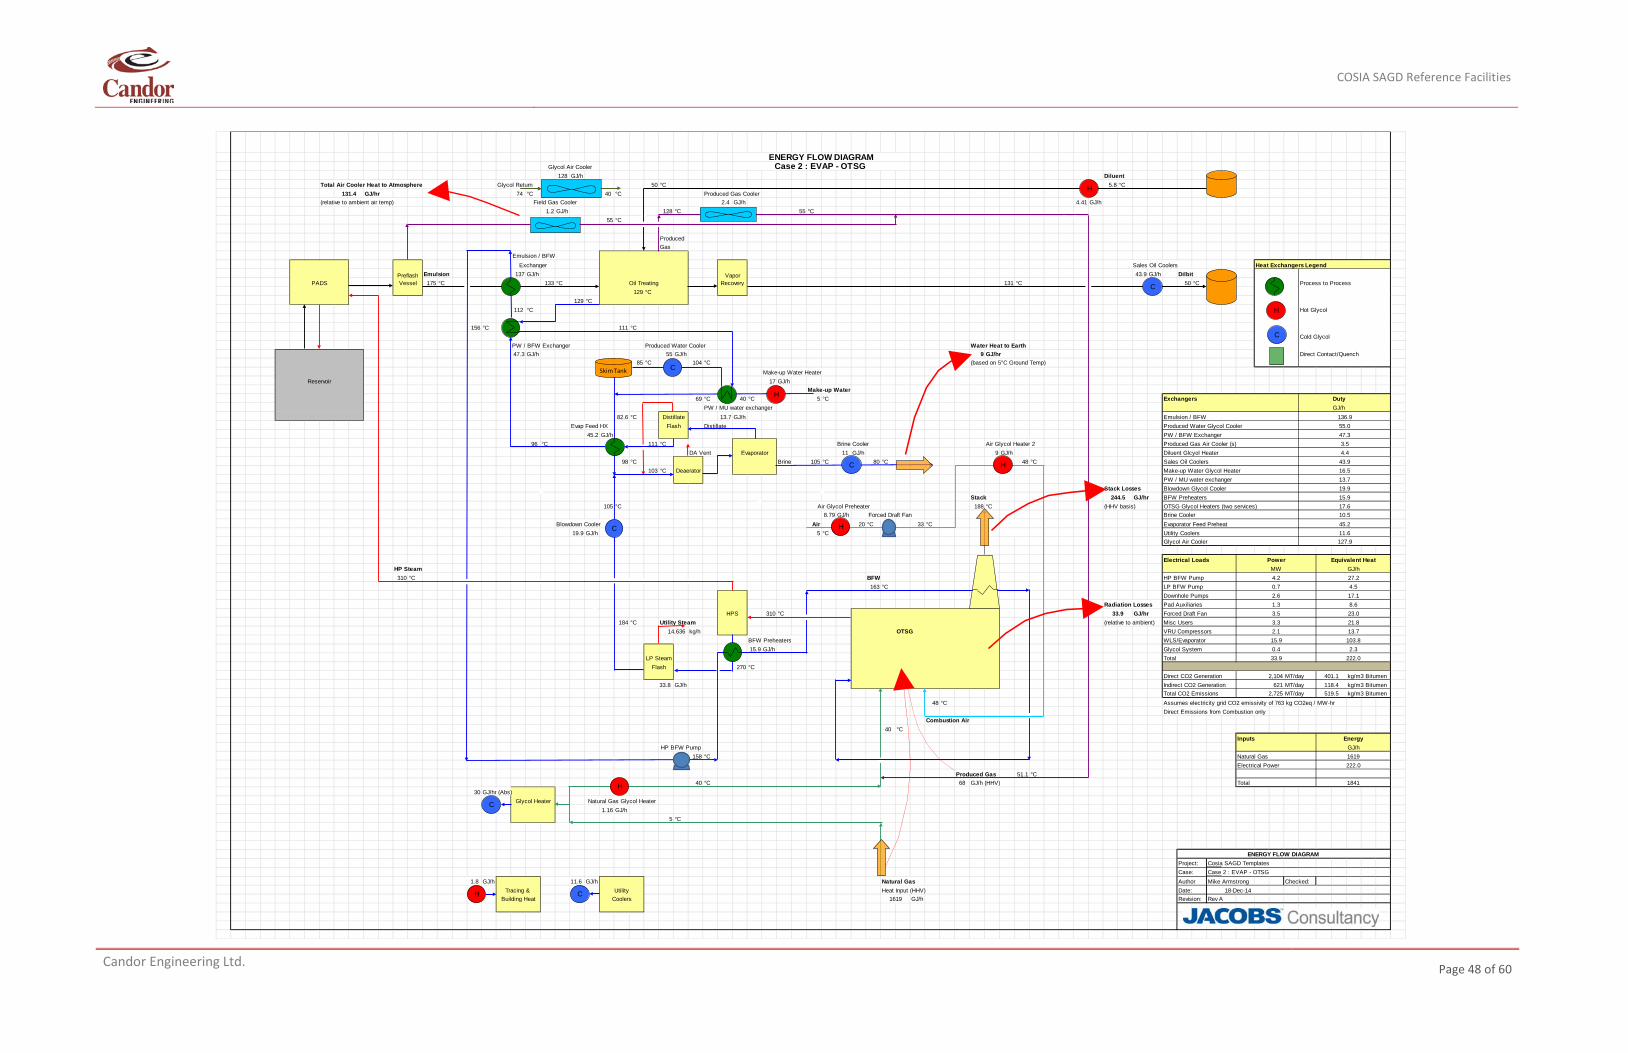
COSIA SAGD Reference Facilities
Candor Engineering Ltd.
Page 48 of 60
Glycol Air Cooler128 GJ/h Diluent
Total Air Cooler Heat to Atmosphere Glycol Return 50 °C 5.8 °CGJ/hr 74 °C 40 °C Produced Gas Cooler
(relative to ambient air temp) Field Gas Cooler GJ/h 4.41 GJ/h1.2 GJ/h 128 °C 55 °C
55 °C
ProducedGas
Emulsion / BFWExchanger Sales Oil Coolers Heat Exchangers Legend
Emulsion 137 GJ/h 43.9 GJ/h DilbitPADS 175 °C 133 °C Oil Treating 131 °C 50 °C Process to Process
129 °C129 °C
112 °C Hot Glycol
156 °C 111 °CCold Glycol
PW / BFW Exchanger Produced Water Cooler Water Heat to Earth47.3 GJ/h 55 GJ/h 9 GJ/hr Direct Contact/Quench
85 °C 104 °C (based on 5°C Ground Temp)Make-up Water Heater
Reservoir 17 GJ/hMake-up Water
69 °C 40 °C 5 °C Exchangers DutyPW / MU water exchanger GJ/h
82.6 °C Distillate 13.7 GJ/h Emulsion / BFW 136.9Evap Feed HX Flash Distillate Produced Water Glycol Cooler 55.0
45.2 GJ/h PW / BFW Exchanger 47.396 °C 111 °C Brine Cooler Air Glycol Heater 2 Produced Gas Air Cooler (s) 3.5
DA Vent Evaporator 11 GJ/h 9 GJ/h Diluent Glcyol Heater 4.498 °C Brine 105 °C 80 °C 48 °C Sales Oil Coolers 43.9
103 °C Deaerator Make-up Water Glycol Heater 16.5PW / MU water exchanger 13.7
Stack Losses Blowdown Glycol Cooler 19.9Stack GJ/hr BFW Preheaters 15.9
105 °C Air Glycol Preheater 188 °C (HHV basis) OTSG Glycol Heaters (two services) 17.68.79 GJ/h Forced Draft Fan Brine Cooler 10.5
Blowdown Cooler Air 20 °C Fan 33 °C Evaporator Feed Preheat 45.219.9 GJ/h 5 °C Utility Coolers 11.6
Glycol Air Cooler 127.9
Electrical Loads Power Equivalent HeatHP Steam MW GJ/h310 °C BFW HP BFW Pump 4.2 27.2
163 °C LP BFW Pump 0.7 4.5Downhole Pumps 2.6 17.1
Radiation Losses Pad Auxiliaries 1.3 8.6HPS 310 °C GJ/hr Forced Draft Fan 3.5 23.0
184 °C Utility Steam (relative to ambient) Misc Users 3.3 21.8kg/h OTSG VRU Compressors 2.1 13.7
BFW Preheaters WLS/Evaporator 15.9 103.815.9 GJ/h Glycol System 0.4 2.3
Total 33.9 222.0270 °C
Direct CO2 Generation MT/day 401.1 kg/m3 BitumenGJ/h Indirect CO2 Generation MT/day 118.4 kg/m3 Bitumen
Total CO2 Emissions MT/day kg/m3 Bitumen48 °C Assumes electricity grid CO2 emissivity of 763 kg CO2eq / MW-hr
Direct Emissions from Combustion onlyCombustion Air
40 °CInputs Energy
HP BFW Pump GJ/h158 °C Natural Gas 1619
Electrical Power 222.0Produced Gas 51.1 °C
40 °C 68 GJ/h (HHV) Total 184130 GJ/hr (Abs)
Glycol Heater Natural Gas Glycol Heater1.16 GJ/h
5 °C
ENERGY FLOW DIAGRAM Project: Cosia SAGD TemplatesCase: Case 2 : EVAP - OTSG
GJ/h GJ/h Natural Gas Author Mike Armstrong Checked:Tracing & Utility Heat Input (HHV) Date:
Building Heat Coolers GJ/h Revision: Rev A
519.5
1.8 11.6 18-Dec-14
1619
2,725
LP SteamFlash
2,10433.8 621
244.5
33.9
14,636
ENERGY FLOW DIAGRAMCase 2 : EVAP - OTSG
131.42.4
Preflash Vessel
Vapor Recovery C
H
C
H
C
H C
H
H
H
C
Skim Tank C
C H
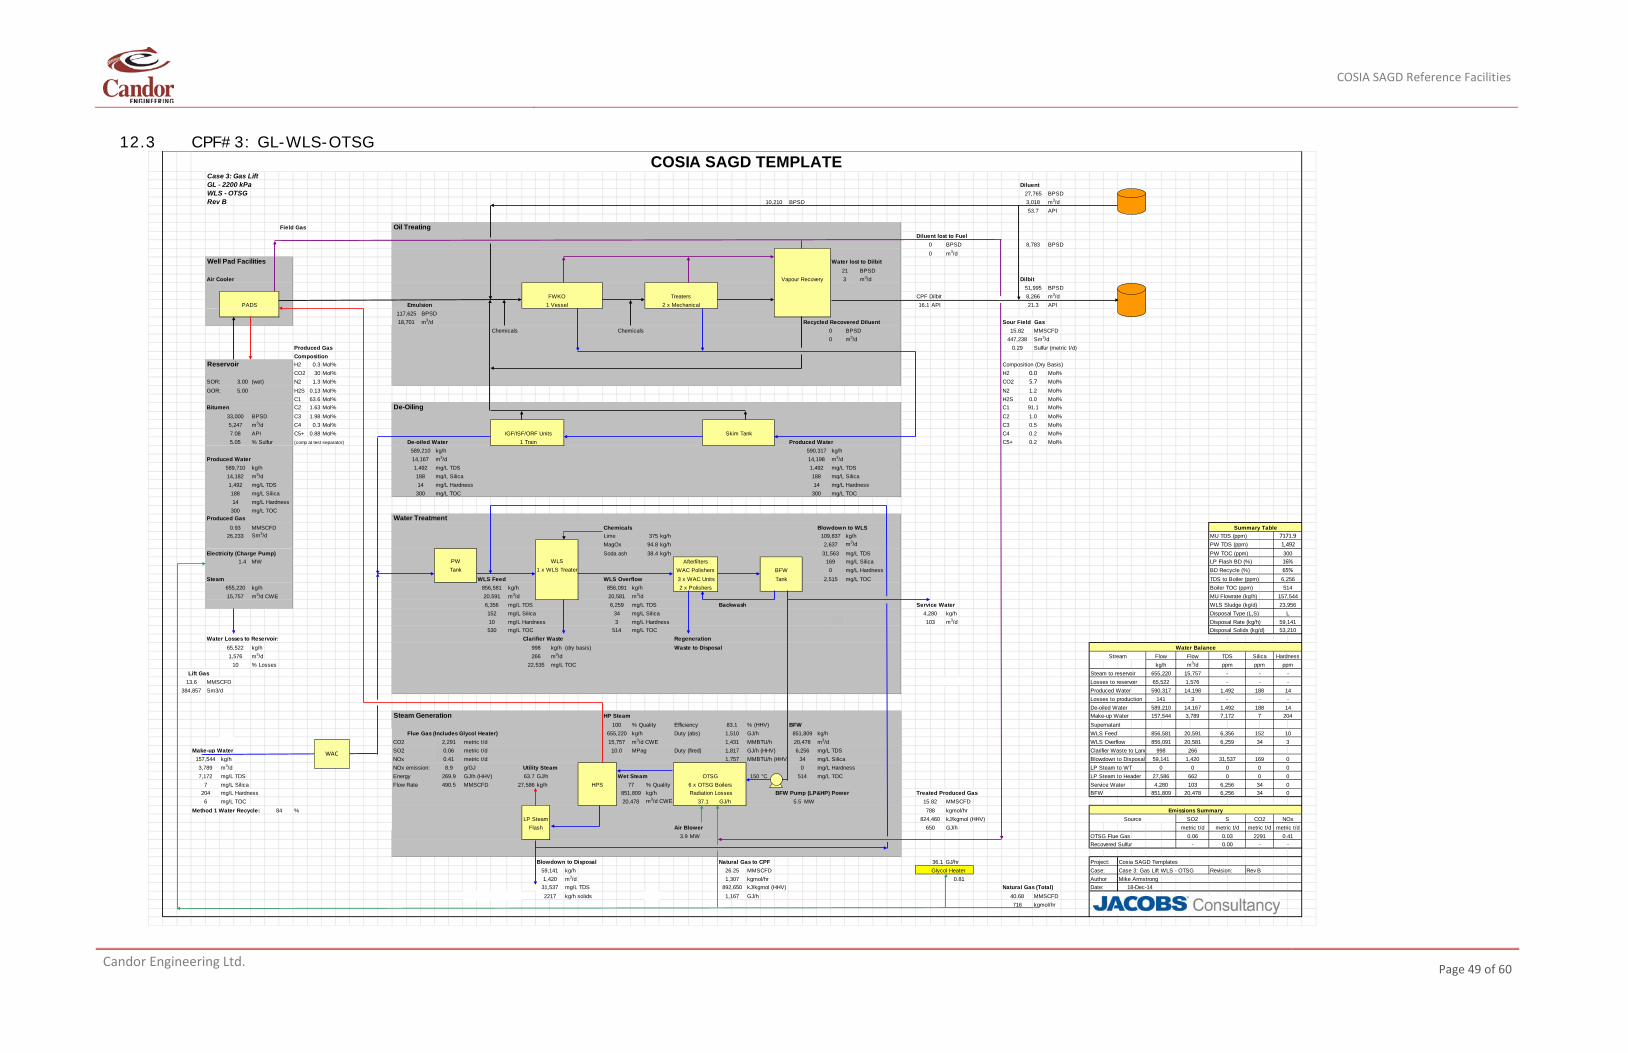
COSIA SAGD Reference Facilities
Candor Engineering Ltd.
Page 49 of 60
12.3 CPF#3: GL-WLS-OTSG
COSIA SAGD TEMPLATECase 3: Gas LiftGL - 2200 kPa DiluentWLS - OTSG 27,765 BPSDRev B BPSD 3,018 m3/d
API
Field Gas Oil TreatingDiluent lost to Fuel
0 BPSD BPSD0 m3/d
Well Pad Facilities Water lost to Dilbit21 BPSD
Air Cooler Vapour Recovery 3 m3/d Dilbit51,995 BPSD
FWKO Treaters CPF Dilbit 8,266 m3/dPADS Emulsion 1 Vessel 2 x Mechanical 16.1 API API
117,625 BPSD18,701 m3/d Recycled Recovered Diluent Sour Field Gas
Chemicals Chemicals 0 BPSD 15.82 MMSCFD0 m3/d 447,238 Sm3/d
Produced Gas 0.29 Sulfur (metric t/d)Composition
Reservoir H2 0.3 Mol% Composition (Dry Basis)CO2 30 Mol% H2 Mol%
SOR: 3.00 (wet) N2 1.3 Mol% CO2 Mol%GOR: 5.00 H2S 0.13 Mol% N2 Mol%
C1 63.6 Mol% H2S Mol%Bitumen C2 1.63 Mol% De-Oiling C1 Mol%
33,000 BPSD C3 1.98 Mol% C2 Mol%5,247 m3/d C4 0.3 Mol% C3 Mol%7.08 API C5+ 0.88 Mol% IGF/ISF/ORF Units Skim Tank C4 Mol%5.05 % Sulfur (comp at test separator) De-oiled Water 1 Train Produced Water C5+ Mol%
589,210 kg/h 590,317 kg/hProduced Water 14,167 m3/d 14,198 m3/d
589,710 kg/h 1,492 mg/L TDS 1,492 mg/L TDS14,182 m3/d 188 mg/L Silica 188 mg/L Silica1,492 mg/L TDS 14 mg/L Hardness 14 mg/L Hardness188 mg/L Silica mg/L TOC mg/L TOC14 mg/L Hardness
mg/L TOCProduced Gas Water Treatment
0.93 MMSCFD Chemicals Blowdown to WLS Summary Table26,233 Sm3/d Lime 375 kg/h 109,837 kg/h MU TDS (ppm) 7171.9
MagOx 94.8 kg/h 2,637 m3/d PW TDS (ppm) 1,492Electricity (Charge Pump) Soda ash 38.4 kg/h 31,563 mg/L TDS PW TOC (ppm) 300
1.4 MW PW WLS Afterfilters 169 mg/L Silica LP Flash BD (%) 16%Tank 1 x WLS Treater WAC Polishers BFW 0 mg/L Hardness BD Recycle (%) 65%
Steam WLS Feed WLS Overflow 3 x WAC Units Tank mg/L TOC TDS to Boiler (ppm) 6,256655,220 kg/h kg/h 856,091 kg/h 2 x Polishers Boiler TOC (ppm) 51415,757 m3/d CWE 20,591 m3/d 20,581 m3/d MU Flowrate (kg/h) 157,544
6,356 mg/L TDS 6,259 mg/L TDS Backwash Service Water WLS Sludge (kg/d) 23,956152 mg/L Silica 34 mg/L Silica 4,280 kg/h Disposal Type (L,S) L10 mg/L Hardness 3 mg/L Hardness 103 m3/d Disposal Rate (kg/h) 59,141
mg/L TOC mg/L TOC Disposal Solids (kg/d) 53,210Water Losses to Reservoir: Clarifier Waste Regeneration
65,522 kg/h 998 kg/h (dry basis) Waste to Disposal Water Balance1,576 m3/d 266 m3/d Stream Flow Flow TDS Silica Hardness
10 % Losses mg/L TOC kg/h m3/d ppm ppm ppmLift Gas Steam to reservoir 655,220 15,757 - - -
MMSCFD Losses to reservoir 65,522 1,576 - - -Sm3/d Produced Water 590,317 14,198 1,492 188 14
Losses to production 141 3 - - -De-oiled Water 589,210 14,167 1,492 188 14
Steam Generation HP Steam Make-up Water 157,544 3,789 7,172 7 204100 % Quality Efficiency % (HHV) BFW Supernatant
Flue Gas (Includes Glycol Heater) 655,220 kg/h Duty (abs) GJ/h 851,809 kg/h WLS Feed 20,591 6,356 152 10CO2 2,291 metric t/d 15,757 m3/d CWE MMBTU/h 20,478 m3/d WLS Overflow 856,091 20,581 6,259 34 3
Make-up Water SO2 0.06 metric t/d MPag Duty (fired) GJ/h (HHV) 6,256 mg/L TDS Clarifier Waste to Land 998 266157,544 kg/h NOx 0.41 metric t/d MMBTU/h (HHV) 34 mg/L Silica Blowdown to Disposal 59,141 1,420 31,537 169 03,789 m3/d NOx emission: 8.9 g/GJ Utility Steam 0 mg/L Hardness LP Steam to WT 0 0 0 0 07,172 mg/L TDS Energy 269.9 GJ/h (HHV) GJ/h Wet Steam OTSG 150 °C mg/L TOC LP Steam to Header 27,586 662 0 0 0
7 mg/L Silica Flow Rate 490.5 MMSCFD kg/h HPS 77 % Quality 6 x OTSG Boilers Service Water 4,280 103 6,256 34 0204 mg/L Hardness 851,809 kg/h Radiation Losses BFW Pump (LP&HP) Power Treated Produced Gas BFW 851,809 20,478 6,256 34 0
mg/L TOC 20,478 m3/d CWE 37.1 GJ/h 5.5 MW 15.82 MMSCFDMethod 1 Water Recycle: 84 % kgmol/hr Emissions Summary
kJ/kgmol (HHV) Source SO2 S CO2 NOxAir Blower GJ/h metric t/d metric t/d metric t/d metric t/d
3.9 MW OTSG Flue Gas 0.06 0.03 2291 0.41Recovered Sulfur - 0.00 - -
Blowdown to Disposal Natural Gas to CPF 36.1 GJ/hr Project: Cosia SAGD Templateskg/h 26.25 MMSCFD Glycol Heater Case: Case 3: Gas Lift WLS - OTSG Revision: Rev Bm3/d kgmol/hr Author Mike Armstrongmg/L TDS kJ/kgmol (HHV) Natural Gas (Total) Date:kg/h solids GJ/h 40.68 MMSCFD
716 kgmol/hr2217 1,167
1,420 1,30718-Dec-14
788LP Steam 824,460
Flash 650
59,141
51427,586
0.8131,537 892,650
856,5811,431
10.0 1,817
13.6
6
384,857
83.11,510
1,757
63.7
0.2
300 300
300
2,515856,581
530 514
22,535
0.2
10,21053.7
8,783
21.3
0.05.71.20.091.11.00.5
WAC
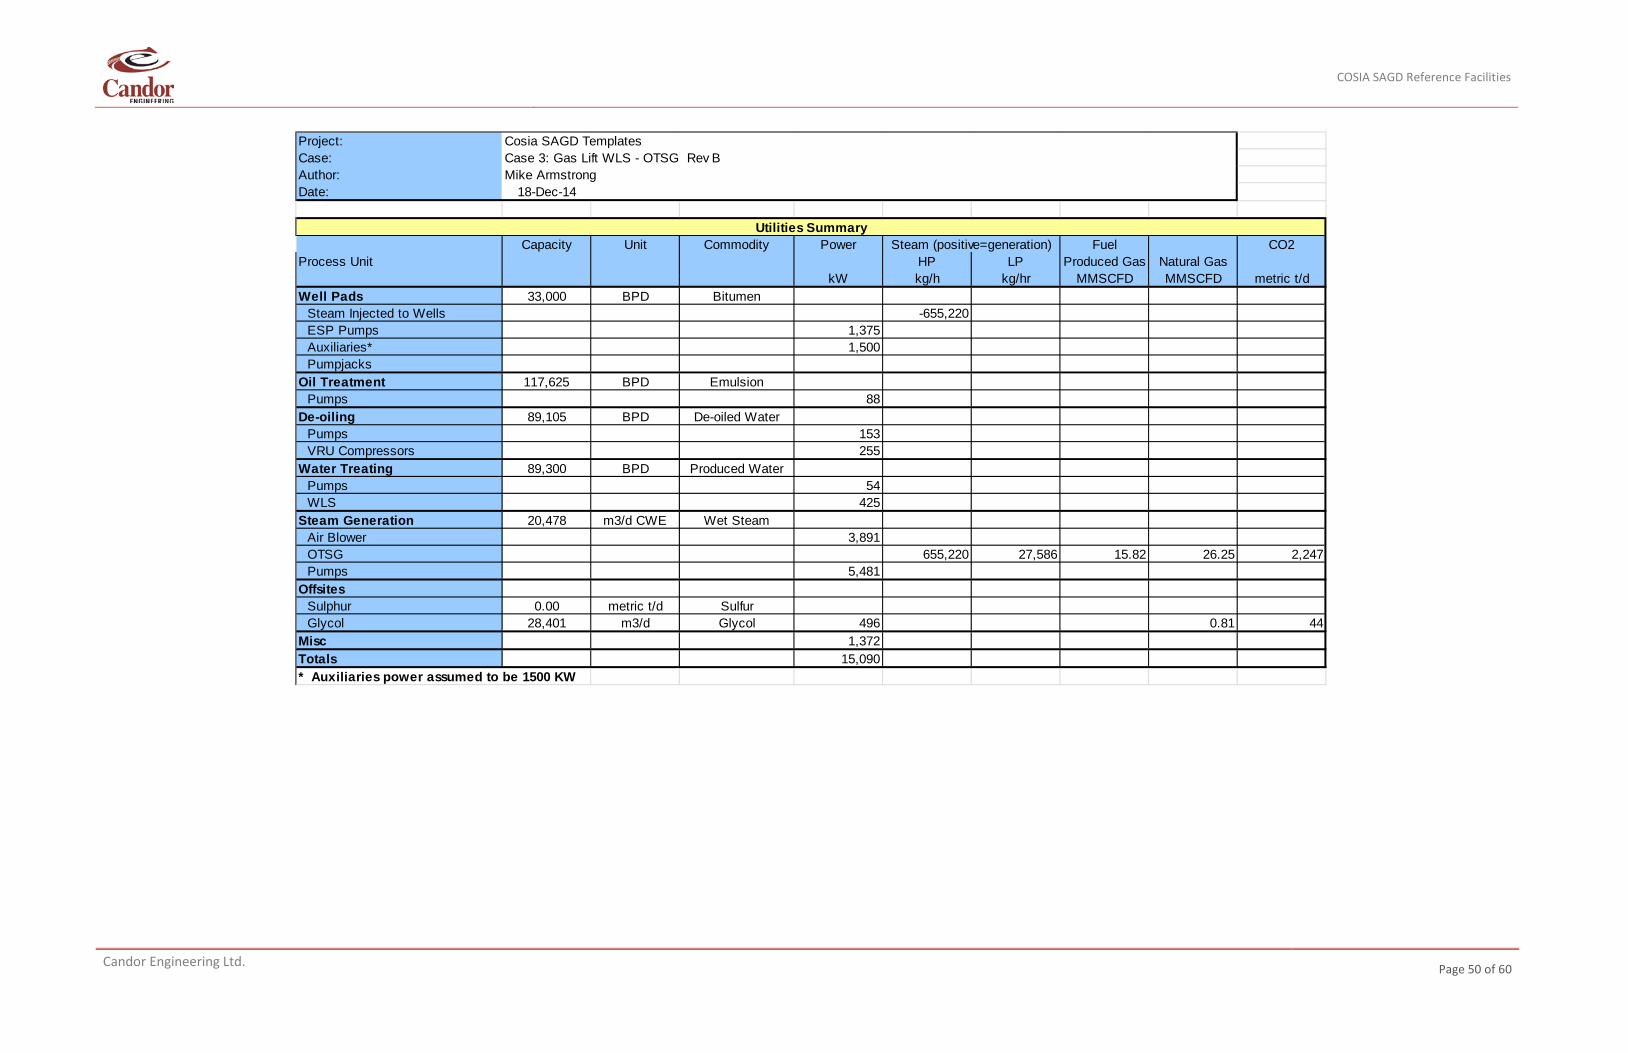
COSIA SAGD Reference Facilities
Candor Engineering Ltd.
Page 50 of 60
Project: Cosia SAGD TemplatesCase: Case 3: Gas Lift WLS - OTSG Rev BAuthor: Mike ArmstrongDate: 18-Dec-14
Utilities SummaryCapacity Unit Commodity Power Steam (positive=generation) Fuel CO2
Process Unit HP LP Produced Gas Natural GaskW kg/h kg/hr MMSCFD MMSCFD metric t/d
Well Pads 33,000 BPD BitumenSteam Injected to Wells -655,220ESP Pumps 1,375Auxiliaries* 1,500Pumpjacks
Oil Treatment 117,625 BPD EmulsionPumps 88
De-oiling 89,105 BPD De-oiled WaterPumps 153VRU Compressors 255
Water Treating 89,300 BPD Produced WaterPumps 54WLS 425
Steam Generation 20,478 m3/d CWE Wet SteamAir Blower 3,891OTSG 655,220 27,586 15.82 26.25 2,247Pumps 5,481
OffsitesSulphur 0.00 metric t/d SulfurGlycol 28,401 m3/d Glycol 496 0.81 44
Misc 1,372Totals 15,090* Auxiliaries power assumed to be 1500 KW
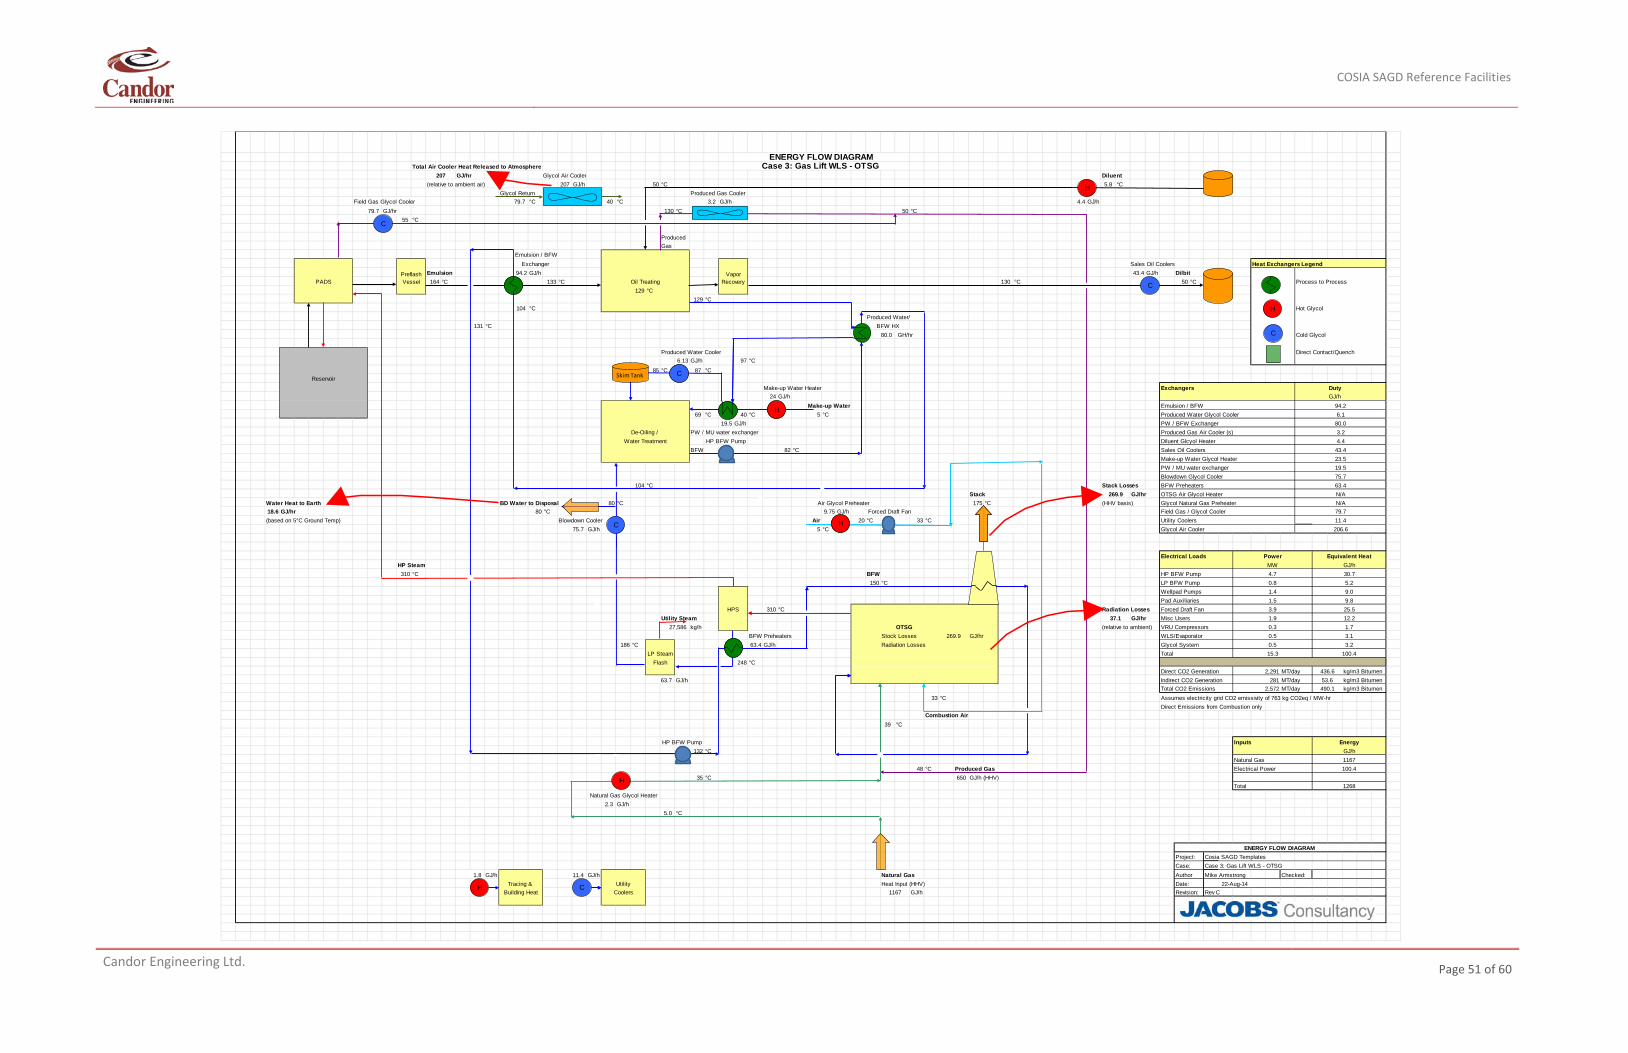
COSIA SAGD Reference Facilities
Candor Engineering Ltd.
Page 51 of 60
Total Air Cooler Heat Released to AtmosphereGJ/hr Glycol Air Cooler Diluent
(relative to ambient air) 207 GJ/h 50 °C 5.8 °CGlycol Return Produced Gas Cooler
Field Gas Glycol Cooler 79.7 °C 40 °C 3.2 GJ/h 4.4 GJ/h79.7 GJ/hr 130 °C 50 °C
55 °C
ProducedGas
Emulsion / BFWExchanger Sales Oil Coolers Heat Exchangers Legend
Emulsion 94.2 GJ/h 43.4 GJ/h DilbitPADS 164 °C 133 °C Oil Treating 130 °C 50 °C Process to Process
129 °C129 °C
104 °C Hot GlycolProduced Water/
131 °C BFW HXGH/hr Cold Glycol
Produced Water Cooler Direct Contact/Quench6.13 GJ/h 97 °C
85 °C °CReservoir
Make-up Water Heater Exchangers Duty24 GJ/h GJ/h
Make-up Water Emulsion / BFW 94.269 °C 40 °C 5 °C Produced Water Glycol Cooler 6.1
19.5 GJ/h PW / BFW Exchanger 80.0De-Oiling / PW / MU water exchanger Produced Gas Air Cooler (s) 3.2
Water Treatment HP BFW Pump Diluent Glcyol Heater 4.4BFW 82 °C Sales Oil Coolers 43.4
Make-up Water Glycol Heater 23.5PW / MU water exchanger 19.5Blowdown Glycol Cooler 75.7
104 °C Stack Losses BFW Preheaters 63.4Stack GJ/hr OTSG Air Glycol Heater N/A
Water Heat to Earth BD Water to Disposal 80 °C Air Glycol Preheater 175 °C (HHV basis) Glycol Natural Gas Preheater N/A18.6 GJ/hr 80 °C 9.75 GJ/h Forced Draft Fan Field Gas / Glycol Cooler 79.7(based on 5°C Ground Temp) Blowdown Cooler Air 20 °C Fan 33 °C Utility Coolers 11.4
75.7 GJ/h 5 °C Glycol Air Cooler 206.6
Electrical Loads Power Equivalent HeatHP Steam MW GJ/h310 °C BFW HP BFW Pump 4.7 30.7
150 °C LP BFW Pump 0.8 5.2Wellpad Pumps 1.4 9.0Pad Auxiliaries 1.5 9.8
HPS 310 °C Radiation Losses Forced Draft Fan 3.9 25.5Utility Steam GJ/hr Misc Users 1.9 12.2
kg/h OTSG (relative to ambient) VRU Compressors 0.3 1.7BFW Preheaters Stock Losses GJ/hr WLS/Evaporator 0.5 3.1
186 °C 63.4 GJ/h Radiation Losses Glycol System 0.5 3.2Total 15.3 100.4
248 °CDirect CO2 Generation MT/day 436.6 kg/m3 Bitumen
GJ/h Indirect CO2 Generation MT/day 53.6 kg/m3 BitumenTotal CO2 Emissions MT/day kg/m3 Bitumen
33 °C Assumes electricity grid CO2 emissivity of 763 kg CO2eq / MW-hrDirect Emissions from Combustion only
Combustion Air39 °C
HP BFW Pump Inputs Energy132 °C GJ/h
Natural Gas 116748 °C Produced Gas Electrical Power 100.4
35 °C 650 GJ/h (HHV)Total 1268
Natural Gas Glycol Heater2.3 GJ/h
5.0 °C
ENERGY FLOW DIAGRAM Project: Cosia SAGD TemplatesCase: Case 3: Gas Lift WLS - OTSG
GJ/h GJ/h Natural Gas Author Mike Armstrong Checked:Tracing & Utility Heat Input (HHV) Date:
Building Heat Coolers GJ/h Revision: Rev C
2,572 490.1
1.8 11.4 22-Aug-14
LP SteamFlash
2,29163.7 281
269.9
37.1
1167
269.927,586
ENERGY FLOW DIAGRAMCase 3: Gas Lift WLS - OTSG
207
Preflash Vessel
Vapor Recovery
80.0
87
H
C
H
C
H C
H
C
H
H
Skim Tank
C
C
H
H
C
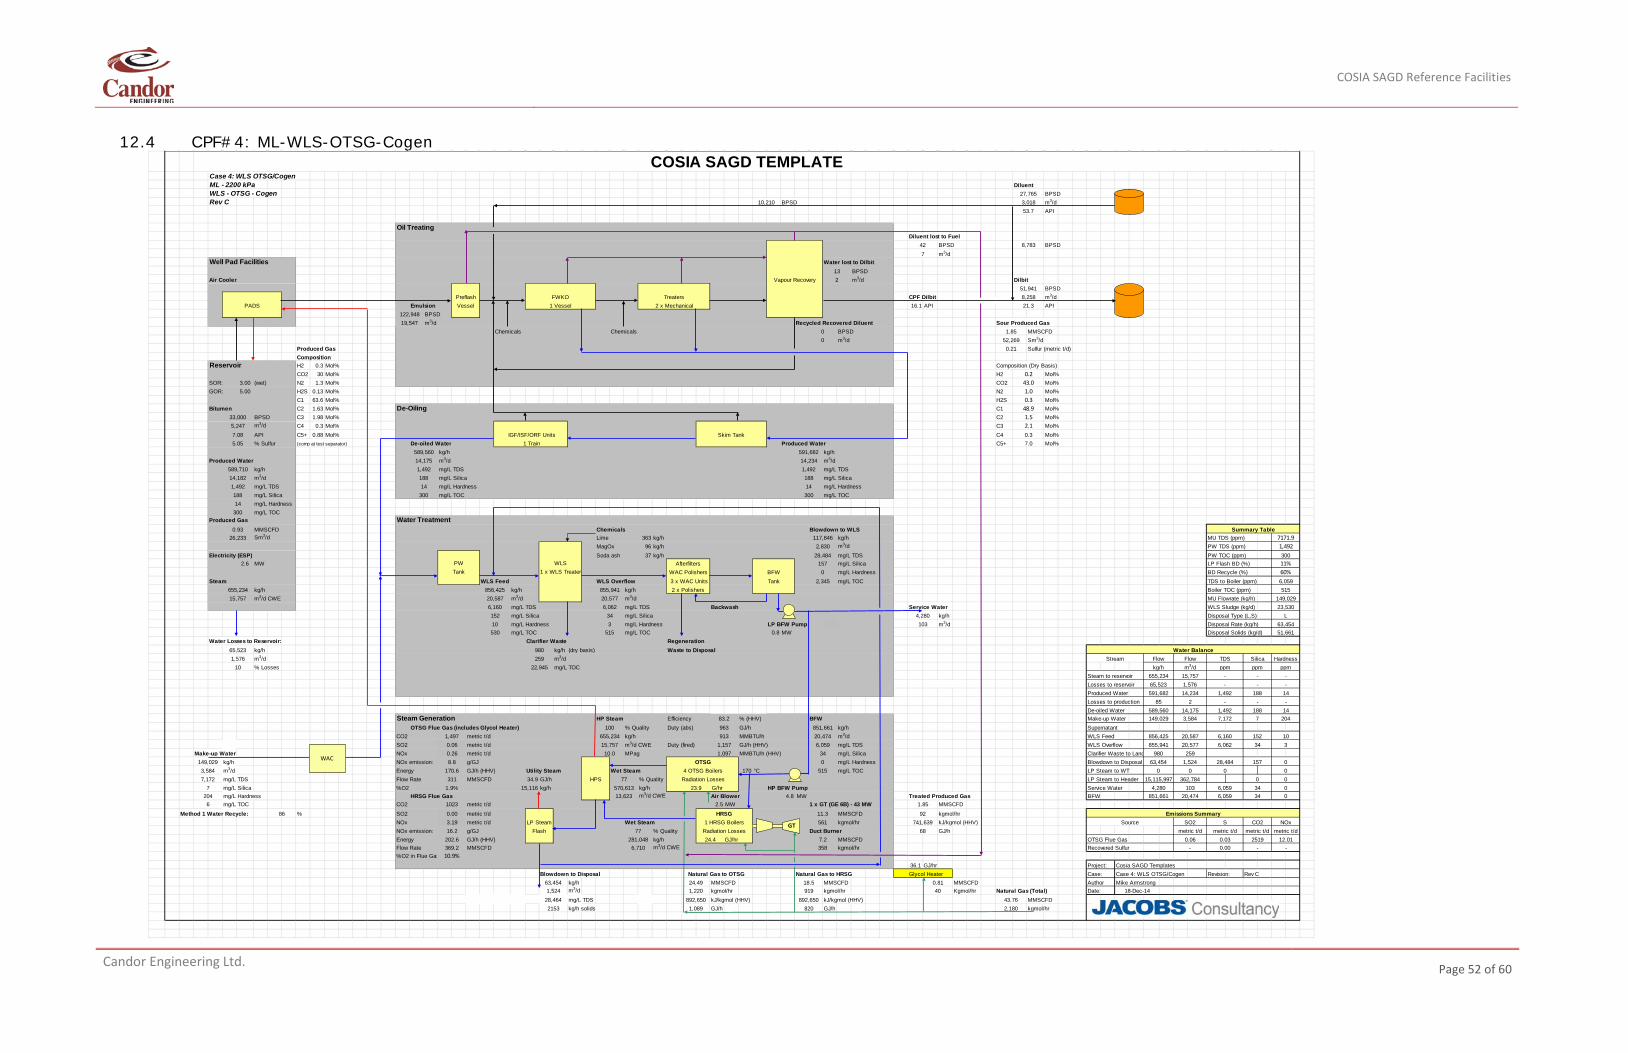
COSIA SAGD Reference Facilities
Candor Engineering Ltd.
Page 52 of 60
12.4 CPF#4: ML-WLS-OTSG-Cogen
COSIA SAGD TEMPLATECase 4: WLS OTSG/CogenML - 2200 kPa DiluentWLS - OTSG - Cogen 27,765 BPSDRev C BPSD 3,018 m3/d
API
Oil TreatingDiluent lost to Fuel
42 BPSD BPSD7 m3/d
Well Pad Facilities Water lost to Dilbit13 BPSD
Air Cooler Vapour Recovery 2 m3/d Dilbit51,941 BPSD
FWKO Treaters CPF Dilbit 8,258 m3/dPADS Emulsion 1 Vessel 2 x Mechanical 16.1 API API
122,948 BPSD19,547 m3/d Recycled Recovered Diluent Sour Produced Gas
Chemicals Chemicals 0 BPSD 1.85 MMSCFD0 m3/d 52,269 Sm3/d
Produced Gas 0.21 Sulfur (metric t/d)Composition
Reservoir H2 0.3 Mol% Composition (Dry Basis)CO2 30 Mol% H2 Mol%
SOR: 3.00 (wet) N2 1.3 Mol% CO2 Mol%GOR: 5.00 H2S 0.13 Mol% N2 Mol%
C1 63.6 Mol% H2S Mol%Bitumen C2 1.63 Mol% De-Oiling C1 Mol%
33,000 BPSD C3 1.98 Mol% C2 Mol%5,247 m3/d C4 0.3 Mol% C3 Mol%7.08 API C5+ 0.88 Mol% IGF/ISF/ORF Units Skim Tank C4 Mol%5.05 % Sulfur (comp at test separator) De-oiled Water 1 Train Produced Water C5+ Mol%
589,560 kg/h 591,682 kg/hProduced Water 14,175 m3/d 14,234 m3/d
589,710 kg/h 1,492 mg/L TDS 1,492 mg/L TDS14,182 m3/d 188 mg/L Silica 188 mg/L Silica1,492 mg/L TDS 14 mg/L Hardness 14 mg/L Hardness188 mg/L Silica mg/L TOC mg/L TOC14 mg/L Hardness
mg/L TOCProduced Gas Water Treatment
0.93 MMSCFD Chemicals Blowdown to WLS Summary Table26,233 Sm3/d Lime 363 kg/h 117,846 kg/h MU TDS (ppm) 7171.9
MagOx 96 kg/h 2,830 m3/d PW TDS (ppm) 1,492Electricity (ESP) Soda ash 37 kg/h 28,484 mg/L TDS PW TOC (ppm) 300
2.6 MW PW WLS Afterfilters 157 mg/L Silica LP Flash BD (%) 11%Tank 1 x WLS Treater WAC Polishers BFW 0 mg/L Hardness BD Recycle (%) 60%
Steam WLS Feed WLS Overflow 3 x WAC Units Tank mg/L TOC TDS to Boiler (ppm) 6,059655,234 kg/h kg/h 855,941 kg/h 2 x Polishers Boiler TOC (ppm) 51515,757 m3/d CWE 20,587 m3/d 20,577 m3/d MU Flowrate (kg/h) 149,029
6,160 mg/L TDS 6,062 mg/L TDS Backwash Service Water WLS Sludge (kg/d) 23,530152 mg/L Silica 34 mg/L Silica 4,280 kg/h Disposal Type (L,S) L10 mg/L Hardness 3 mg/L Hardness LP BFW Pump 103 m3/d Disposal Rate (kg/h) 63,454
mg/L TOC mg/L TOC 0.8 MW 51,661Water Losses to Reservoir: Clarifier Waste Regeneration
65,523 kg/h 980 kg/h (dry basis) Waste to Disposal Water Balance1,576 m3/d 259 m3/d Stream Flow Flow TDS Silica Hardness
10 % Losses mg/L TOC kg/h m3/d ppm ppm ppmSteam to reservoir 655,234 15,757 - - -Losses to reservoir 65,523 1,576 - - -Produced Water 591,682 14,234 1,492 188 14Losses to production 85 2 - - -De-oiled Water 589,560 14,175 1,492 188 14
Steam Generation HP Steam Efficiency % (HHV) BFW Make-up Water 149,029 3,584 7,172 7 204OTSG Flue Gas (includes Glycol Heater) 100 % Quality Duty (abs) GJ/h kg/h Supernatant
CO2 metric t/d 655,234 kg/h MMBTU/h m3/d WLS Feed 20,587 6,160 152 10SO2 metric t/d 15,757 m3/d CWE Duty (fired) GJ/h (HHV) mg/L TDS WLS Overflow 855,941 20,577 6,062 34 3
Make-up Water NOx metric t/d MPag MMBTU/h (HHV) mg/L Silica Clarifier Waste to Land 980 259149,029 kg/h NOx emission: g/GJ OTSG mg/L Hardness Blowdown to Disposal 63,454 1,524 28,484 157 03,584 m3/d Energy GJ/h (HHV) Utility Steam Wet Steam 4 OTSG Boilers 170 °C mg/L TOC LP Steam to WT 0 0 0 07,172 mg/L TDS Flow Rate MMSCFD GJ/h HPS 77 % Quality Radiation Losses LP Steam to Header 15,115,997 362,784 0 0
7 mg/L Silica %O2 kg/h 570,613 kg/h 23.9 G/hr HP BFW Pump Service Water 4,280 103 6,059 34 0204 mg/L Hardness HRSG Flue Gas 13,623 m3/d CWE Air Blower 4.8 MW Treated Produced Gas BFW 851,661 20,474 6,059 34 0
mg/L TOC CO2 metric t/d 2.5 MW 1 x GT (GE 6B) - 43 MW 1.85 MMSCFDMethod 1 Water Recycle: 86 % SO2 metric t/d HRSG MMSCFD kgmol/hr Emissions Summary
NOx metric t/d Wet Steam 1 HRSG Boilers kgmol/hr kJ/kgmol (HHV) Source SO2 S CO2 NOxNOx emission: 16.2 g/GJ 77 % Quality Radiation Losses Duct Burner GJ/h metric t/d metric t/d metric t/d metric t/dEnergy 202.6 GJ/h (HHV) 281,048 kg/h 24.4 GJ/hr MMSCFD OTSG Flue Gas 0.06 0.03 2519 12.01Flow Rate 369.2 MMSCFD 6,710 m3/d CWE kgmol/hr Recovered Sulfur - 0.00 - -%O2 in Flue Gas
36.1 GJ/hr Project: Cosia SAGD TemplatesBlowdown to Disposal Natural Gas to OTSG Natural Gas to HRSG Glycol Heater Case: Case 4: WLS OTSG/Cogen Revision: Rev C
63,454 kg/h MMSCFD MMSCFD MMSCFD Author Mike Armstrong1,524 m3/d kgmol/hr 919 kgmol/hr Kgmol/hr Natural Gas (Total) Date:
mg/L TDS kJ/kgmol (HHV) kJ/kgmol (HHV) 43.76 MMSCFD2153 kg/h solids GJ/h GJ/h 2,180 kgmol/hr1,089 820
1,220 40 18-Dec-1428,464 892,650 892,650
7.2358
10.9%
24.49 18.5 0.81
923.19 LP Steam 561 741,639
Flash 68
11.3
1.9% 15,116
6 10230.00
8.8 0170.6 515311 34.9
856,4250.06 1,157 6,0590.26 10.0 1,097 34
1,497 913 20,474
Disposal Solids (kg/d)
83.2963 851,661
22,945
2.10.37.0
300 300
2,345856,425
530 515
300
1.5
10,21053.7
8,783
PreflashVessel 21.3
0.243.01.00.3
48.9
GT
WAC
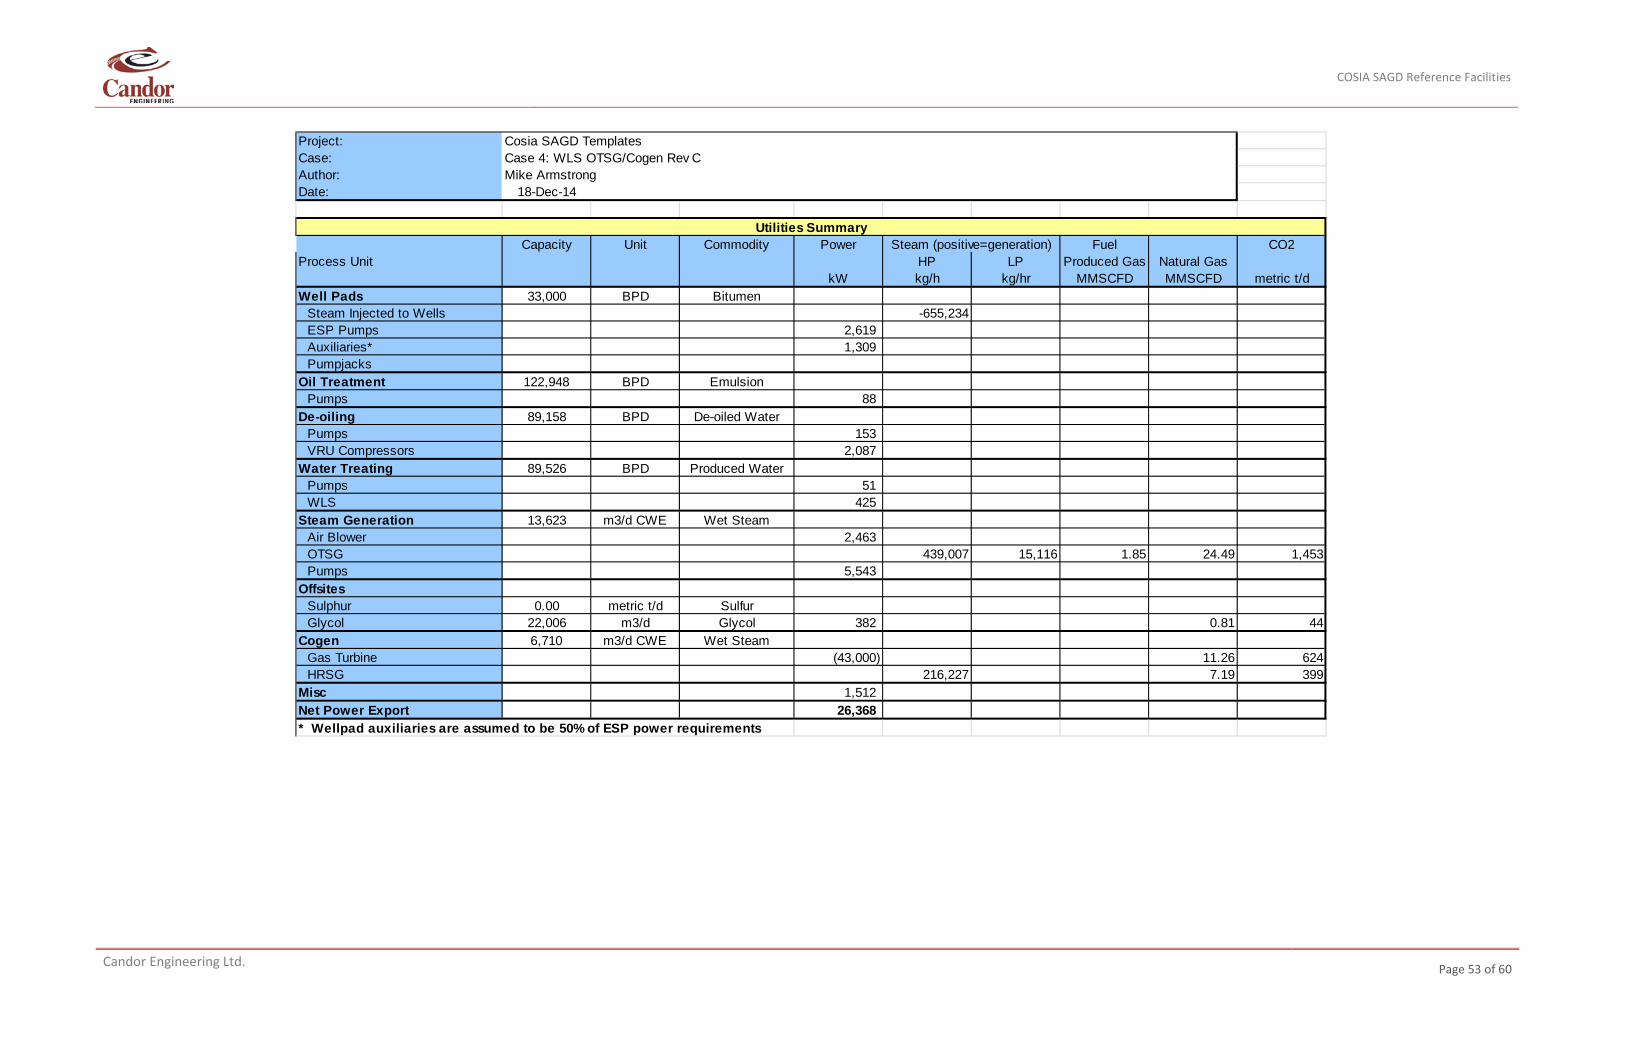
COSIA SAGD Reference Facilities
Candor Engineering Ltd.
Page 53 of 60
Project: Cosia SAGD TemplatesCase: Case 4: WLS OTSG/Cogen Rev CAuthor: Mike ArmstrongDate: 18-Dec-14
Utilities SummaryCapacity Unit Commodity Power Steam (positive=generation) Fuel CO2
Process Unit HP LP Produced Gas Natural GaskW kg/h kg/hr MMSCFD MMSCFD metric t/d
Well Pads 33,000 BPD BitumenSteam Injected to Wells -655,234ESP Pumps 2,619Auxiliaries* 1,309Pumpjacks
Oil Treatment 122,948 BPD EmulsionPumps 88
De-oiling 89,158 BPD De-oiled WaterPumps 153VRU Compressors 2,087
Water Treating 89,526 BPD Produced WaterPumps 51WLS 425
Steam Generation 13,623 m3/d CWE Wet SteamAir Blower 2,463OTSG 439,007 15,116 1.85 24.49 1,453Pumps 5,543
OffsitesSulphur 0.00 metric t/d SulfurGlycol 22,006 m3/d Glycol 382 0.81 44
Cogen 6,710 m3/d CWE Wet SteamGas Turbine (43,000) 11.26 624HRSG 216,227 7.19 399
Misc 1,512Net Power Export 26,368* Wellpad auxiliaries are assumed to be 50% of ESP power requirements
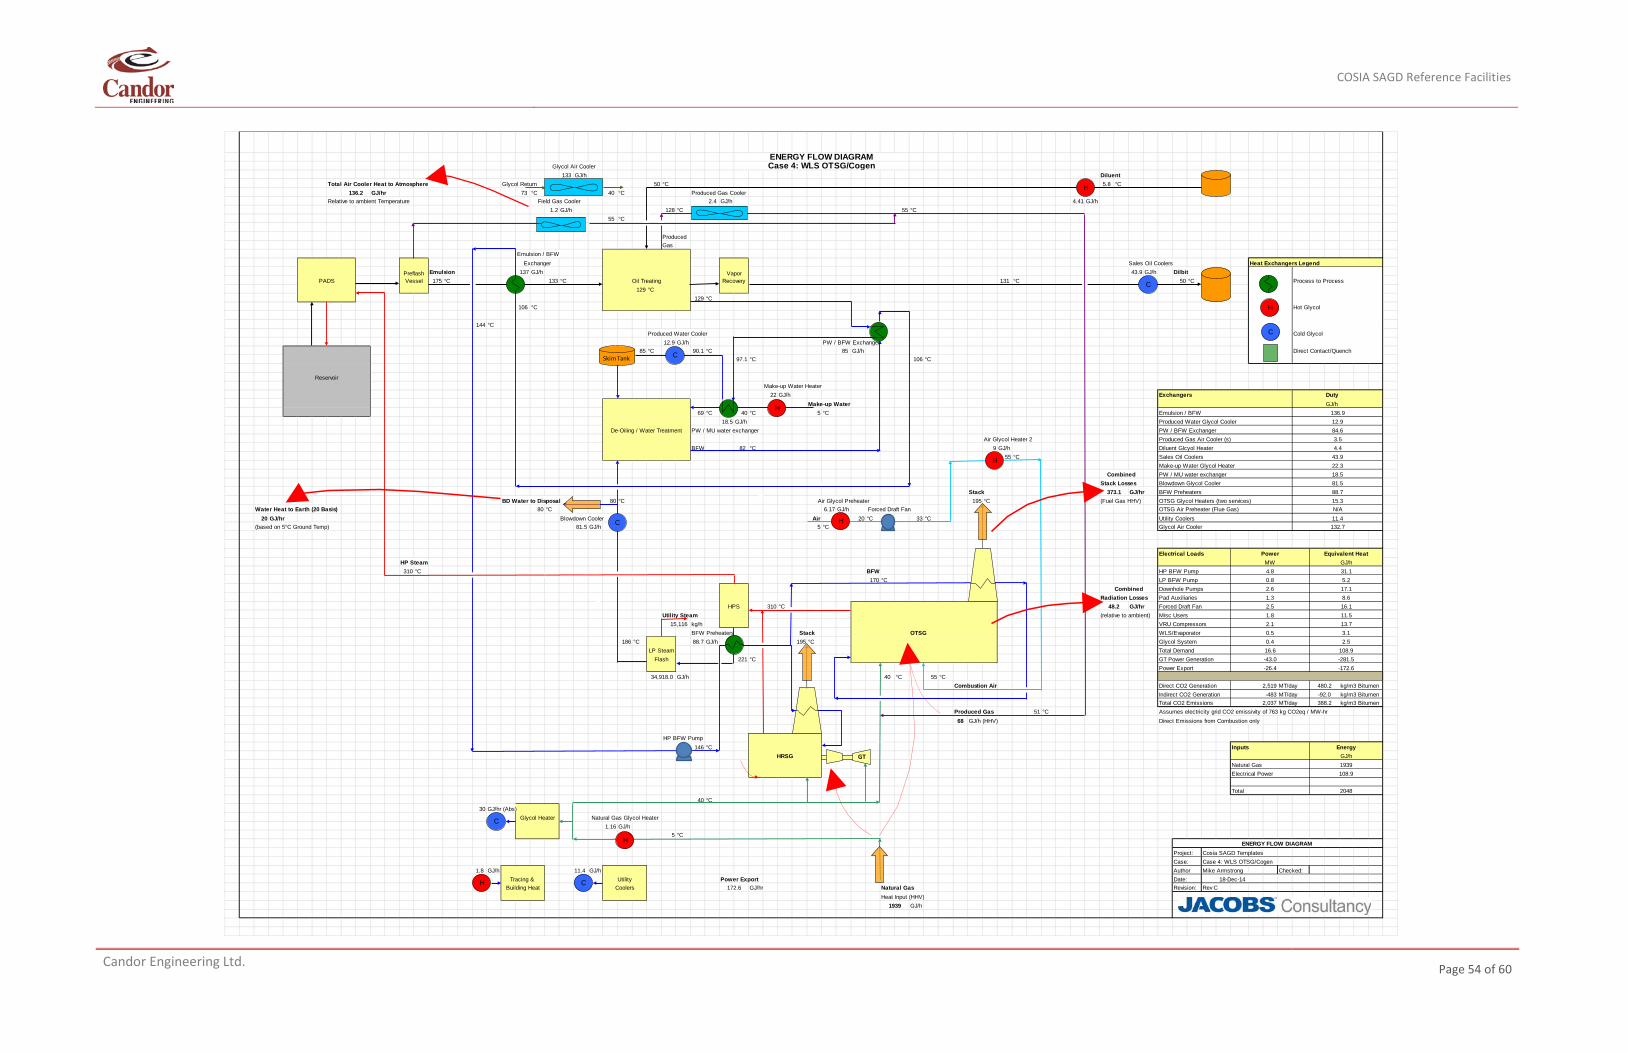
COSIA SAGD Reference Facilities
Candor Engineering Ltd.
Page 54 of 60
Glycol Air Cooler133 GJ/h Diluent
Total Air Cooler Heat to Atmosphere Glycol Return 50 °C 5.8 °CGJ/hr 73 °C 40 °C Produced Gas Cooler
Relative to ambient Temperature Field Gas Cooler GJ/h 4.41 GJ/h1.2 GJ/h 128 °C 55 °C
55 °C
ProducedGas
Emulsion / BFWExchanger Sales Oil Coolers Heat Exchangers Legend
Emulsion 137 GJ/h 43.9 GJ/h DilbitPADS 175 °C 133 °C Oil Treating 131 °C 50 °C Process to Process
129 °C129 °C
106 °C Hot Glycol
144 °CProduced Water Cooler Cold Glycol
12.9 GJ/h PW / BFW Exchanger85 °C 90.1 °C 85 GJ/h Direct Contact/Quench
97.1 °C 106 °C
ReservoirMake-up Water Heater
22 GJ/h Exchangers DutyMake-up Water GJ/h
69 °C 40 °C 5 °C Emulsion / BFW 136.918.5 GJ/h Produced Water Glycol Cooler 12.9
De-Oiling / Water Treatment PW / MU water exchanger PW / BFW Exchanger 84.6Air Glycol Heater 2 Produced Gas Air Cooler (s) 3.5
BFW 82 °C 9 GJ/h Diluent Glcyol Heater 4.455 °C Sales Oil Coolers 43.9
Make-up Water Glycol Heater 22.3Combined PW / MU water exchanger 18.5
Stack Losses Blowdown Glycol Cooler 81.5Stack GJ/hr BFW Preheaters 88.7
BD Water to Disposal 80 °C Air Glycol Preheater 195 °C (Fuel Gas HHV) OTSG Glycol Heaters (two services) 15.3Water Heat to Earth (20 Basis) 80 °C 6.17 GJ/h Forced Draft Fan OTSG Air Preheater (Flue Gas) N/A
20 GJ/hr Blowdown Cooler Air 20 °C Fan 33 °C Utility Coolers 11.4(based on 5°C Ground Temp) 81.5 GJ/h 5 °C Glycol Air Cooler 132.7
Electrical Loads Power Equivalent HeatHP Steam MW GJ/h310 °C BFW HP BFW Pump 4.8 31.1
170 °C LP BFW Pump 0.8 5.2Combined Downhole Pumps 2.6 17.1
Radiation Losses Pad Auxiliaries 1.3 8.6HPS 310 °C GJ/hr Forced Draft Fan 2.5 16.1
Utility Steam (relative to ambient) Misc Users 1.8 11.5kg/h VRU Compressors 2.1 13.7BFW Preheaters Stack OTSG WLS/Evaporator 0.5 3.1
186 °C 88.7 GJ/h 195 °C Glycol System 0.4 2.5Total Demand 16.6 108.9
221 °C GT Power Generation -43.0 -281.5Power Export -26.4 -172.6
GJ/h 40 °C 55 °CCombustion Air Direct CO2 Generation MT/day 480.2 kg/m3 Bitumen
Indirect CO2 Generation MT/day kg/m3 BitumenTotal CO2 Emissions MT/day kg/m3 Bitumen
Produced Gas 51 °C Assumes electricity grid CO2 emissivity of 763 kg CO2eq / MW-hr68 GJ/h (HHV) Direct Emissions from Combustion only
HP BFW Pump146 °C Inputs Energy
HRSG GJ/hNatural Gas 1939Electrical Power 108.9
Total 204840 °C
30 GJ/hr (Abs)Glycol Heater Natural Gas Glycol Heater
1.16 GJ/h5 °C
ENERGY FLOW DIAGRAM Project: Cosia SAGD TemplatesCase: Case 4: WLS OTSG/Cogen
GJ/h GJ/h Author Mike Armstrong Checked:Tracing & Utility Power Export Date:
Building Heat Coolers GJ/hr Natural Gas Revision: Rev CHeat Input (HHV)
GJ/h1939
2,037 388.2
1.8 11.4 18-Dec-14
172.6
LP SteamFlash
34,918.0 2,519-483 -92.0
373.1
48.2
15,116
ENERGY FLOW DIAGRAMCase 4: WLS OTSG/Cogen
136.22.4
Preflash Vessel
Vapor Recovery C
H
C
H
C
H C
H
C
H
H
H
C
Skim Tank
GT
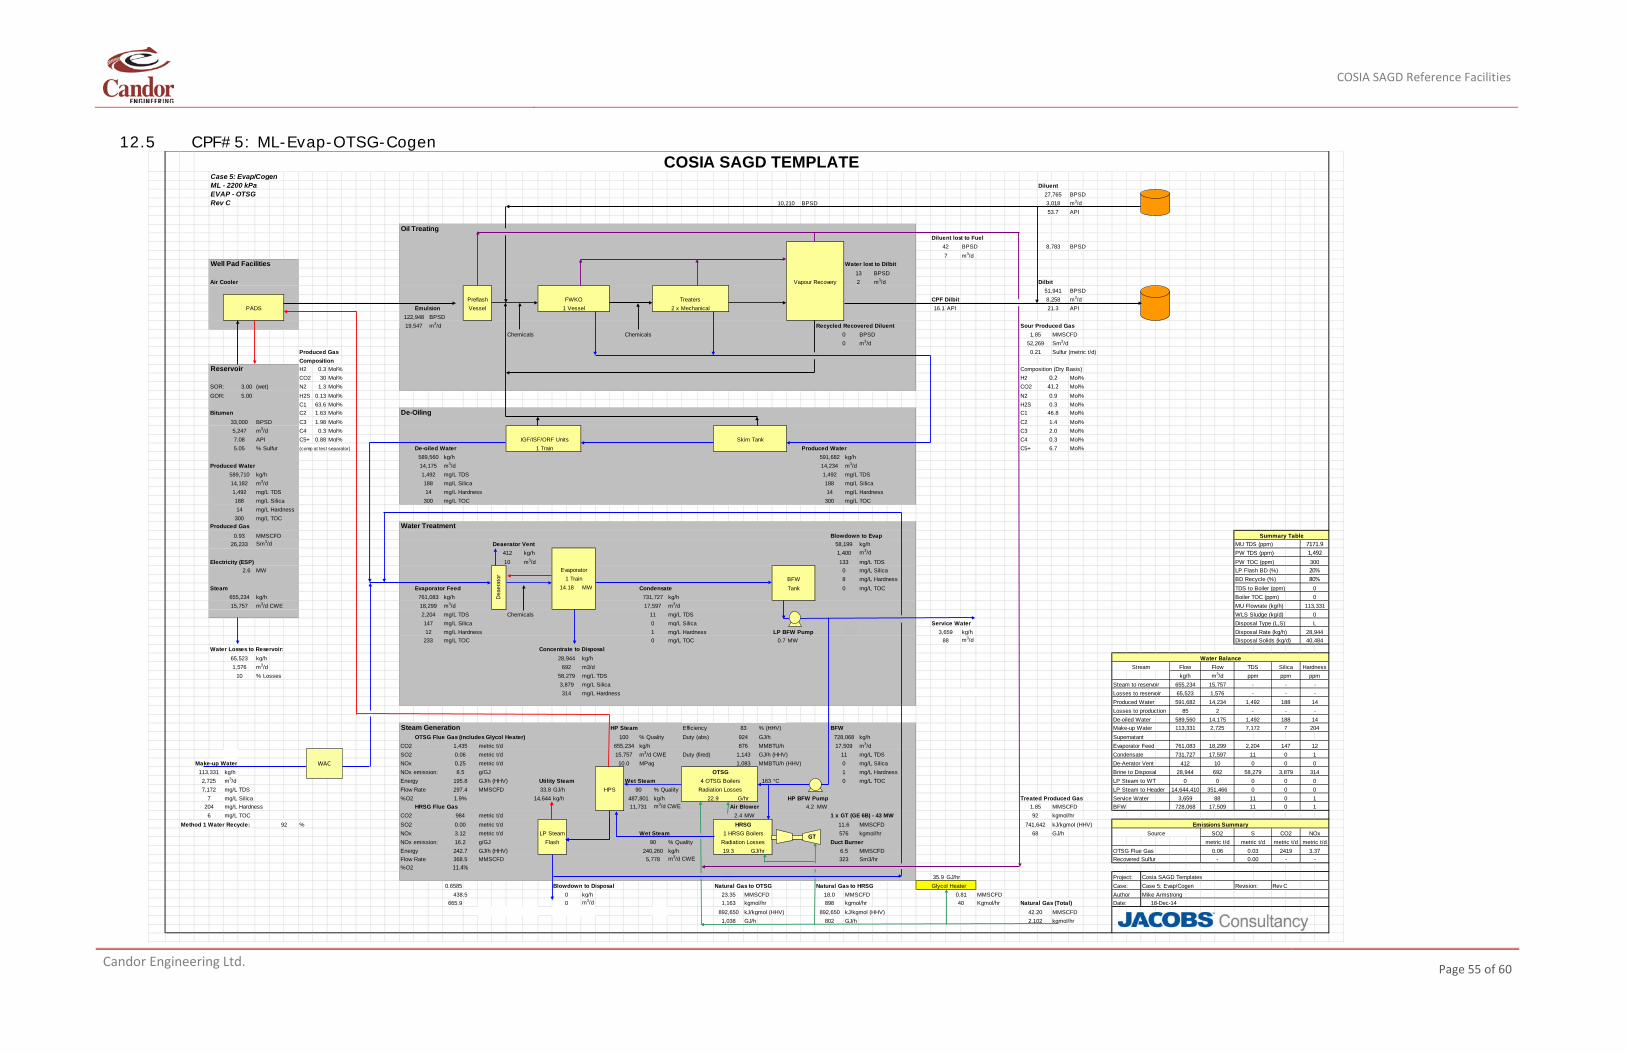
COSIA SAGD Reference Facilities
Candor Engineering Ltd.
Page 55 of 60
12.5 CPF#5: ML-Evap-OTSG-Cogen
COSIA SAGD TEMPLATECase 5: Evap/Cogen ML - 2200 kPa DiluentEVAP - OTSG 27,765 BPSDRev C BPSD 3,018 m3/d
API
Oil TreatingDiluent lost to Fuel
42 BPSD BPSD7 m3/d
Well Pad Facilities Water lost to Dilbit13 BPSD
Air Cooler Vapour Recovery 2 m3/d Dilbit51,941 BPSD
FWKO Treaters CPF Dilbit 8,258 m3/dPADS Emulsion 1 Vessel 2 x Mechanical 16.1 API API
122,948 BPSD19,547 m3/d Recycled Recovered Diluent Sour Produced Gas
Chemicals Chemicals 0 BPSD 1.85 MMSCFD0 m3/d 52,269 Sm3/d
Produced Gas 0.21 Sulfur (metric t/d)Composition
Reservoir H2 0.3 Mol% Composition (Dry Basis)CO2 30 Mol% H2 Mol%
SOR: 3.00 (wet) N2 1.3 Mol% CO2 Mol%GOR: 5.00 H2S 0.13 Mol% N2 Mol%
C1 63.6 Mol% H2S Mol%Bitumen C2 1.63 Mol% De-Oiling C1 Mol%
33,000 BPSD C3 1.98 Mol% C2 Mol%5,247 m3/d C4 0.3 Mol% C3 Mol%7.08 API C5+ 0.88 Mol% IGF/ISF/ORF Units Skim Tank C4 Mol%5.05 % Sulfur (comp at test separator) De-oiled Water 1 Train Produced Water C5+ Mol%
589,560 kg/h 591,682 kg/hProduced Water 14,175 m3/d 14,234 m3/d
589,710 kg/h 1,492 mg/L TDS 1,492 mg/L TDS14,182 m3/d 188 mg/L Silica 188 mg/L Silica1,492 mg/L TDS 14 mg/L Hardness 14 mg/L Hardness188 mg/L Silica mg/L TOC mg/L TOC14 mg/L Hardness
mg/L TOCProduced Gas Water Treatment
0.93 MMSCFD Blowdown to Evap Summary Table26,233 Sm3/d Deaerator Vent 58,199 kg/h MU TDS (ppm) 7171.9
412 kg/h 1,400 m3/d PW TDS (ppm) 1,492Electricity (ESP) 10 m3/d 133 mg/L TDS PW TOC (ppm) 300
2.6 MW 0 mg/L Silica LP Flash BD (%) 20%BFW 8 mg/L Hardness BD Recycle (%) 80%
Steam Evaporator Feed MW Condensate Tank mg/L TOC TDS to Boiler (ppm) 0655,234 kg/h kg/h 731,727 kg/h Boiler TOC (ppm) 015,757 m3/d CWE 18,299 m3/d 17,597 m3/d MU Flowrate (kg/h) 113,331
2,204 mg/L TDS Chemicals 11 mg/L TDS WLS Sludge (kg/d) 0147 mg/L Silica 0 mg/L Silica Service Water Disposal Type (L,S) L12 mg/L Hardness 1 mg/L Hardness LP BFW Pump 3,659 kg/h Disposal Rate (kg/h) 28,944
mg/L TOC mg/L TOC 0.7 MW 88 m3/d Disposal Solids (kg/d) 40,484Water Losses to Reservoir: Concentrate to Disposal
65,523 kg/h 28,944 kg/h Water Balance1,576 m3/d 692 m3/d Stream Flow Flow TDS Silica Hardness
10 % Losses 58,279 mg/L TDS kg/h m3/d ppm ppm ppm3,879 mg/L Silica Steam to reservoir 655,234 15,757 - - -314 mg/L Hardness Losses to reservoir 65,523 1,576 - - -
Produced Water 591,682 14,234 1,492 188 14Losses to production 85 2 - - -De-oiled Water 589,560 14,175 1,492 188 14
Steam Generation HP Steam Efficiency % (HHV) BFW Make-up Water 113,331 2,725 7,172 7 204OTSG Flue Gas (includes Glycol Heater) 100 % Quality Duty (abs) GJ/h kg/h Supernatant
CO2 metric t/d 655,234 kg/h MMBTU/h m3/d Evaporator Feed 18,299 2,204 147 12SO2 metric t/d 15,757 m3/d CWE Duty (fired) GJ/h (HHV) mg/L TDS Condensate 731,727 17,597 11 0 1
Make-up Water NOx metric t/d MPag MMBTU/h (HHV) mg/L Silica De-Aerator Vent 412 10 0 0113,331 kg/h NOx emission: g/GJ OTSG mg/L Hardness Brine to Disposal 28,944 692 58,279 3,879 3142,725 m3/d Energy GJ/h (HHV) Wet Steam 4 OTSG Boilers 163 °C mg/L TOC LP Steam to WT 0 0 0 0 07,172 mg/L TDS Flow Rate MMSCFD GJ/h HPS 90 % Quality Radiation Losses LP Steam to Header 14,644,410 351,466 0 0 0
7 mg/L Silica %O2 kg/h 487,801 kg/h 22.9 G/hr HP BFW Pump Treated Produced Gas Service Water 3,659 88 11 0 1204 mg/L Hardness HRSG Flue Gas 11,731 m3/d CWE Air Blower 4.2 MW 1.85 MMSCFD BFW 728,068 17,509 11 0 1
mg/L TOC CO2 metric t/d 2.4 MW 1 x GT (GE 6B) - 43 MW kgmol/hrMethod 1 Water Recycle: 92 % SO2 metric t/d HRSG MMSCFD kJ/kgmol (HHV) Emissions Summary
NOx metric t/d Wet Steam 1 HRSG Boilers kgmol/hr GJ/h Source SO2 S CO2 NOxNOx emission: 16.2 g/GJ 90 % Quality Radiation Losses Duct Burner metric t/d metric t/d metric t/d metric t/dEnergy 242.7 GJ/h (HHV) 240,260 kg/h 19.3 GJ/hr MMSCFD OTSG Flue Gas 0.06 0.03 2419 3.37Flow Rate 368.5 MMSCFD 5,778 m3/d CWE Sm3/hr Recovered Sulfur - 0.00 - -%O2
35.9 GJ/hr Project: Cosia SAGD Templates0.6585 Blowdown to Disposal Natural Gas to OTSG Natural Gas to HRSG Glycol Heater Case: Case 5: Evap/Cogen Revision: Rev C
0 kg/h 23.35 MMSCFD MMSCFD MMSCFD Author Mike Armstrong665.9 0 m3/d 1,163 kgmol/hr 898 kgmol/hr Kgmol/hr Natural Gas (Total) Date:
892,650 kJ/kgmol (HHV) kJ/kgmol (HHV) 42.20 MMSCFD1,038 GJ/h GJ/h 2,102 kgmol/hr
892,650802
32311.4%
18.0 0.8140 18-Dec-14
438.5
920.00 11.6 741,6423.12 LP Steam 576 68
6.5
6 984
Flash
1.9% 14,644
195.8 Utility Steam 0297.4 33.8
0 08.5 1
1,435 876 17,509 761,0830.06 1,143 110.25 10.0 1,083
233 0
83924 728,068
761,083
2.00.36.7
300 300D
eaer
ator
Evaporator1 Train
14.18 0
300
0.241.20.90.3
46.81.4
10,21053.7
8,783
PreflashVessel 21.3
WAC
GT
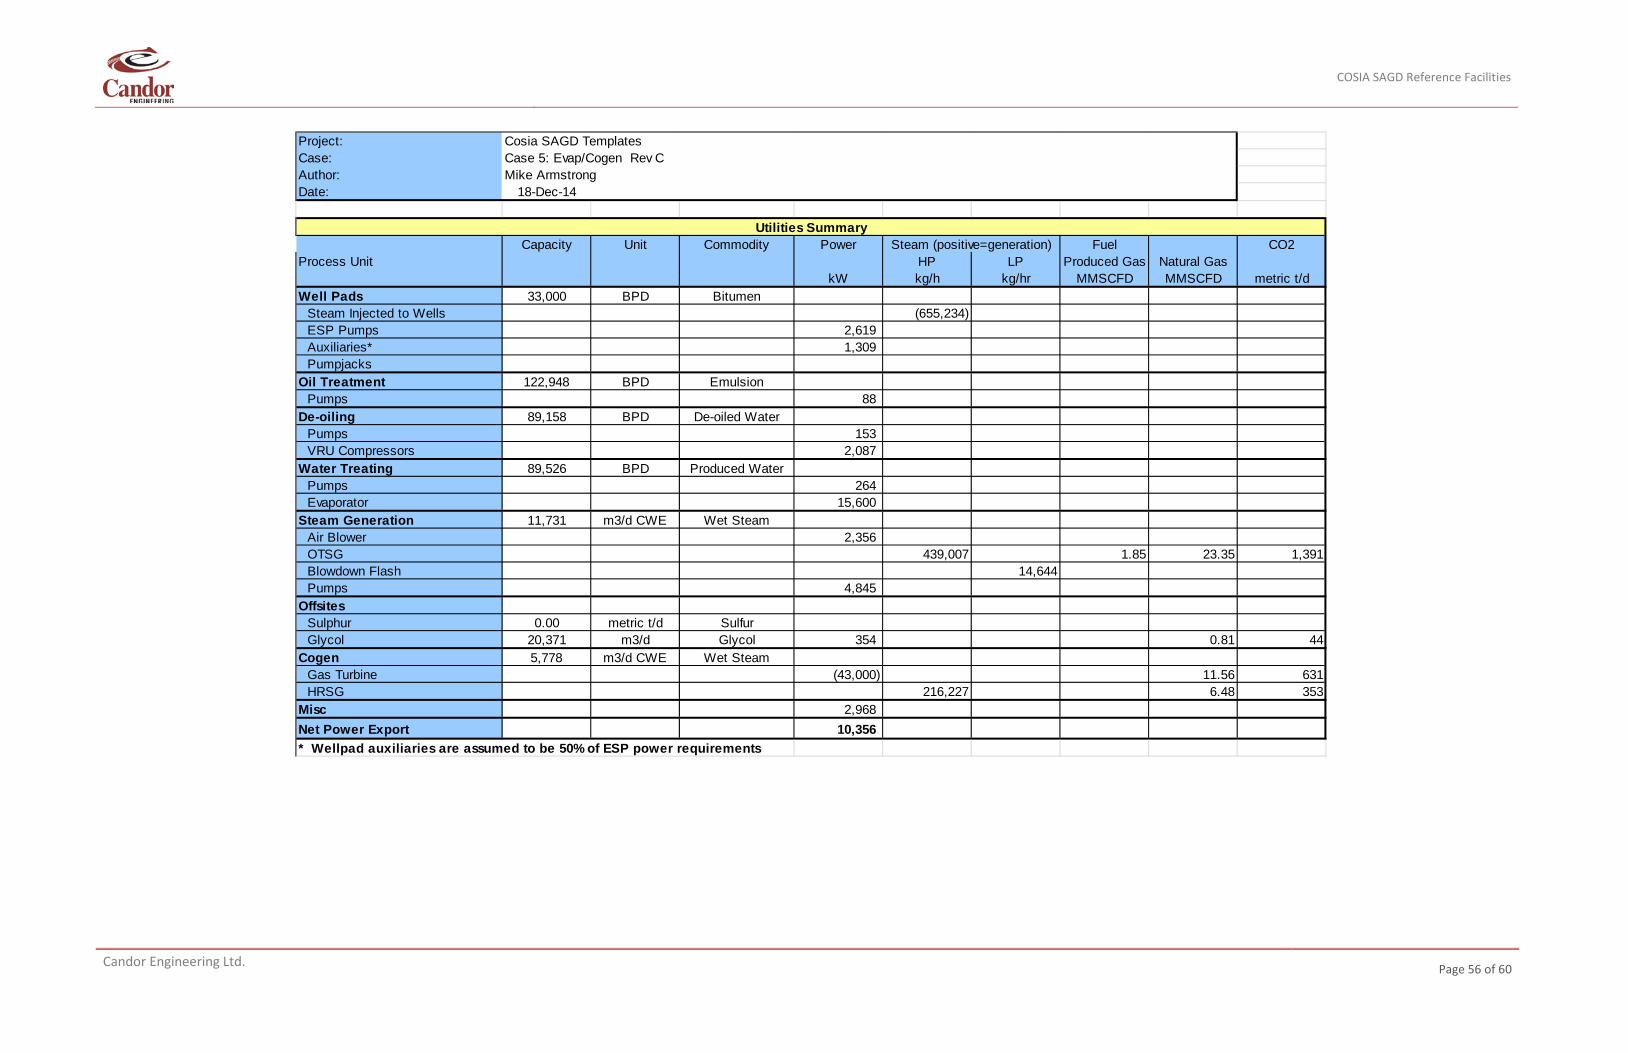
COSIA SAGD Reference Facilities
Candor Engineering Ltd.
Page 56 of 60
Project: Cosia SAGD TemplatesCase: Case 5: Evap/Cogen Rev CAuthor: Mike ArmstrongDate: 18-Dec-14
Utilities SummaryCapacity Unit Commodity Power Steam (positive=generation) Fuel CO2
Process Unit HP LP Produced Gas Natural GaskW kg/h kg/hr MMSCFD MMSCFD metric t/d
Well Pads 33,000 BPD BitumenSteam Injected to Wells (655,234)ESP Pumps 2,619Auxiliaries* 1,309Pumpjacks
Oil Treatment 122,948 BPD EmulsionPumps 88
De-oiling 89,158 BPD De-oiled WaterPumps 153VRU Compressors 2,087
Water Treating 89,526 BPD Produced WaterPumps 264Evaporator 15,600
Steam Generation 11,731 m3/d CWE Wet SteamAir Blower 2,356OTSG 439,007 1.85 23.35 1,391Blowdown Flash 14,644Pumps 4,845
OffsitesSulphur 0.00 metric t/d SulfurGlycol 20,371 m3/d Glycol 354 0.81 44
Cogen 5,778 m3/d CWE Wet SteamGas Turbine (43,000) 11.56 631HRSG 216,227 6.48 353
Misc 2,968Net Power Export 10,356* Wellpad auxiliaries are assumed to be 50% of ESP power requirements
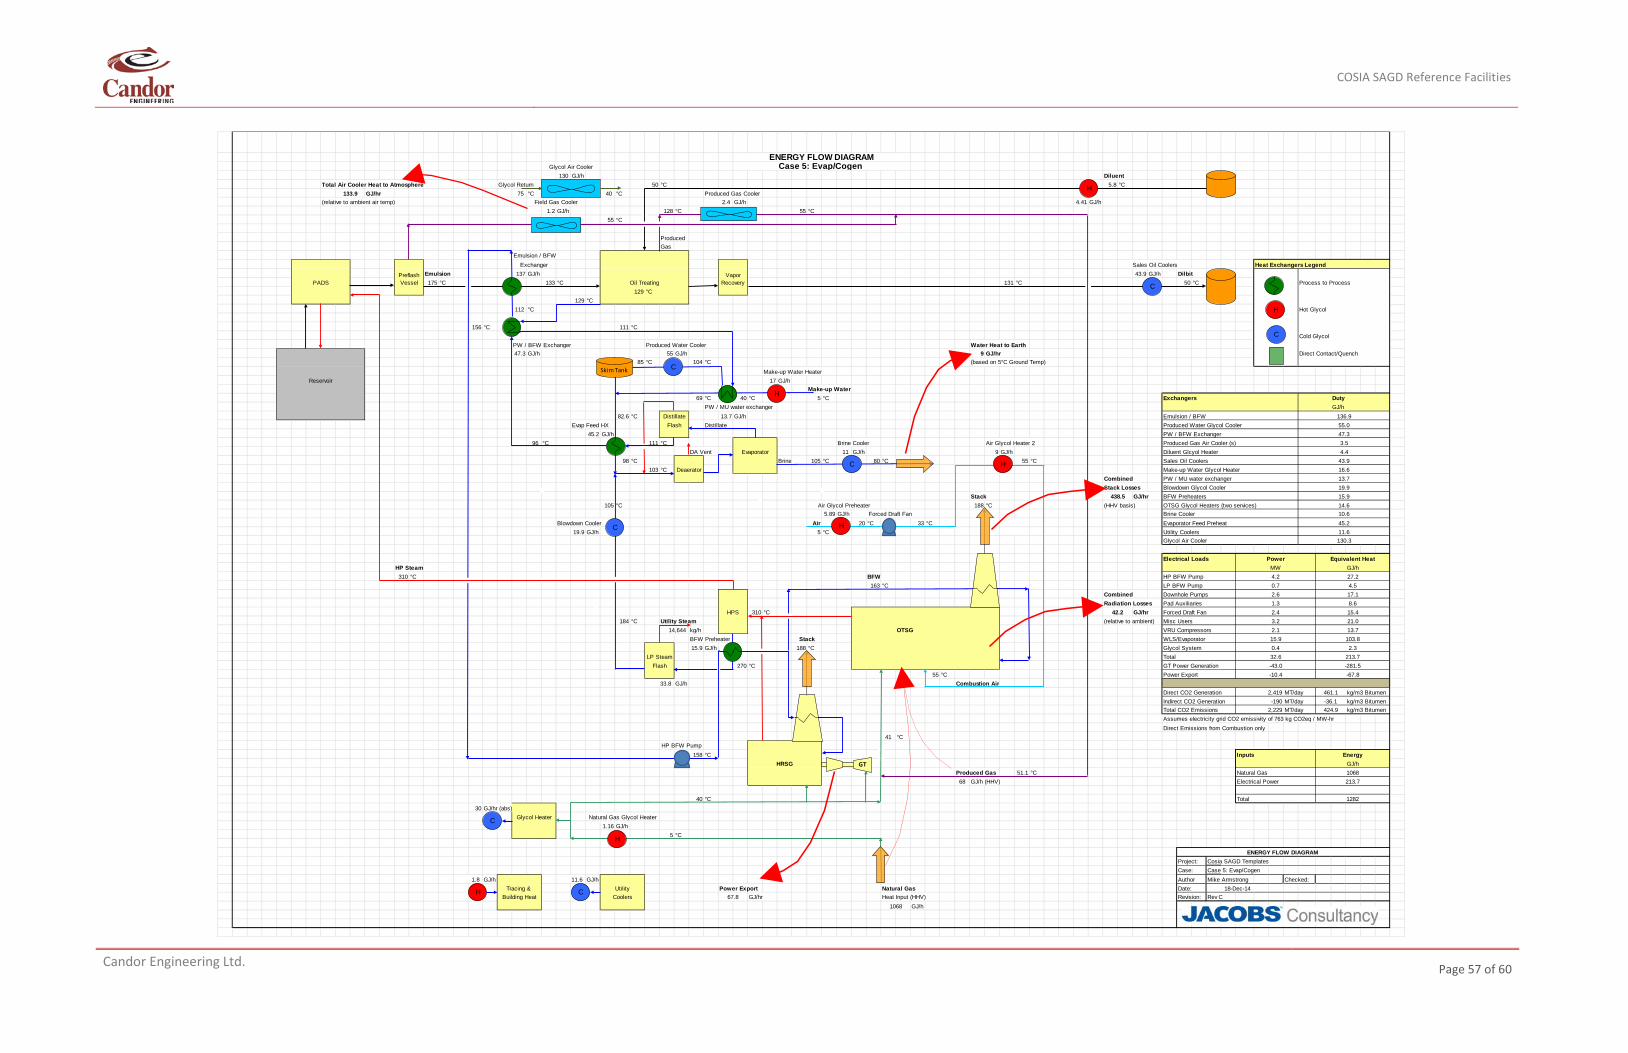
COSIA SAGD Reference Facilities
Candor Engineering Ltd.
Page 57 of 60
Glycol Air Cooler130 GJ/h Diluent
Total Air Cooler Heat to Atmosphere Glycol Return 50 °C 5.8 °CGJ/hr 75 °C 40 °C Produced Gas Cooler
(relative to ambient air temp) Field Gas Cooler GJ/h 4.41 GJ/h1.2 GJ/h 128 °C 55 °C
55 °C
ProducedGas
Emulsion / BFWExchanger Sales Oil Coolers Heat Exchangers Legend
Emulsion 137 GJ/h 43.9 GJ/h DilbitPADS 175 °C 133 °C Oil Treating 131 °C 50 °C Process to Process
129 °C129 °C
112 °C Hot Glycol
156 °C 111 °CCold Glycol
PW / BFW Exchanger Produced Water Cooler Water Heat to Earth47.3 GJ/h 55 GJ/h 9 GJ/hr Direct Contact/Quench
85 °C 104 °C (based on 5°C Ground Temp)Make-up Water Heater
Reservoir 17 GJ/hMake-up Water
69 °C 40 °C 5 °C Exchangers DutyPW / MU water exchanger GJ/h
82.6 °C Distillate 13.7 GJ/h Emulsion / BFW 136.9Evap Feed HX Flash Distillate Produced Water Glycol Cooler 55.0
45.2 GJ/h PW / BFW Exchanger 47.396 °C 111 °C Brine Cooler Air Glycol Heater 2 Produced Gas Air Cooler (s) 3.5
DA Vent Evaporator 11 GJ/h 9 GJ/h Diluent Glcyol Heater 4.498 °C Brine 105 °C 80 °C 55 °C Sales Oil Coolers 43.9
103 °C Deaerator Make-up Water Glycol Heater 16.6Combined PW / MU water exchanger 13.7Stack Losses Blowdown Glycol Cooler 19.9
Stack GJ/hr BFW Preheaters 15.9105 °C Air Glycol Preheater 188 °C (HHV basis) OTSG Glycol Heaters (two services) 14.6
5.89 GJ/h Forced Draft Fan Brine Cooler 10.6Blowdown Cooler Air 20 °C Fan 33 °C Evaporator Feed Preheat 45.2
19.9 GJ/h 5 °C Utility Coolers 11.6Glycol Air Cooler 130.3
Electrical Loads Power Equivalent HeatHP Steam MW GJ/h310 °C BFW HP BFW Pump 4.2 27.2
163 °C LP BFW Pump 0.7 4.5Combined Downhole Pumps 2.6 17.1Radiation Losses Pad Auxiliaries 1.3 8.6
HPS 310 °C GJ/hr Forced Draft Fan 2.4 15.4184 °C Utility Steam (relative to ambient) Misc Users 3.2 21.0
kg/h OTSG VRU Compressors 2.1 13.7BFW Preheater Stack WLS/Evaporator 15.9 103.815.9 GJ/h 188 °C Glycol System 0.4 2.3
Total 32.6 213.7270 °C GT Power Generation -43.0 -281.5
55 °C Power Export -10.4 -67.8GJ/h Combustion Air
Direct CO2 Generation MT/day 461.1 kg/m3 BitumenIndirect CO2 Generation MT/day -36.1 kg/m3 BitumenTotal CO2 Emissions MT/day 424.9 kg/m3 BitumenAssumes electricity grid CO2 emissivity of 763 kg CO2eq / MW-hrDirect Emissions from Combustion only
41 °CHP BFW Pump
158 °C Inputs EnergyHRSG GJ/h
Produced Gas 51.1 °C Natural Gas 106868 GJ/h (HHV) Electrical Power 213.7
40 °C Total 128230 GJ/hr (abs)
Glycol Heater Natural Gas Glycol Heater1.16 GJ/h
5 °C
ENERGY FLOW DIAGRAM Project: Cosia SAGD TemplatesCase: Case 5: Evap/Cogen
GJ/h GJ/h Author Mike Armstrong Checked:Tracing & Utility Power Export Natural Gas Date:
Building Heat Coolers GJ/hr Heat Input (HHV) Revision: Rev C1068 GJ/h
2,229
1.8 11.6 18-Dec-14
67.8
LP SteamFlash
33.8 2,419-190
438.5
42.2
14,644
ENERGY FLOW DIAGRAMCase 5: Evap/Cogen
133.92.4
Preflash Vessel
Vapor Recovery C
H
C
H
C
H C
H
H
H
C
Skim Tank C
C H
GT
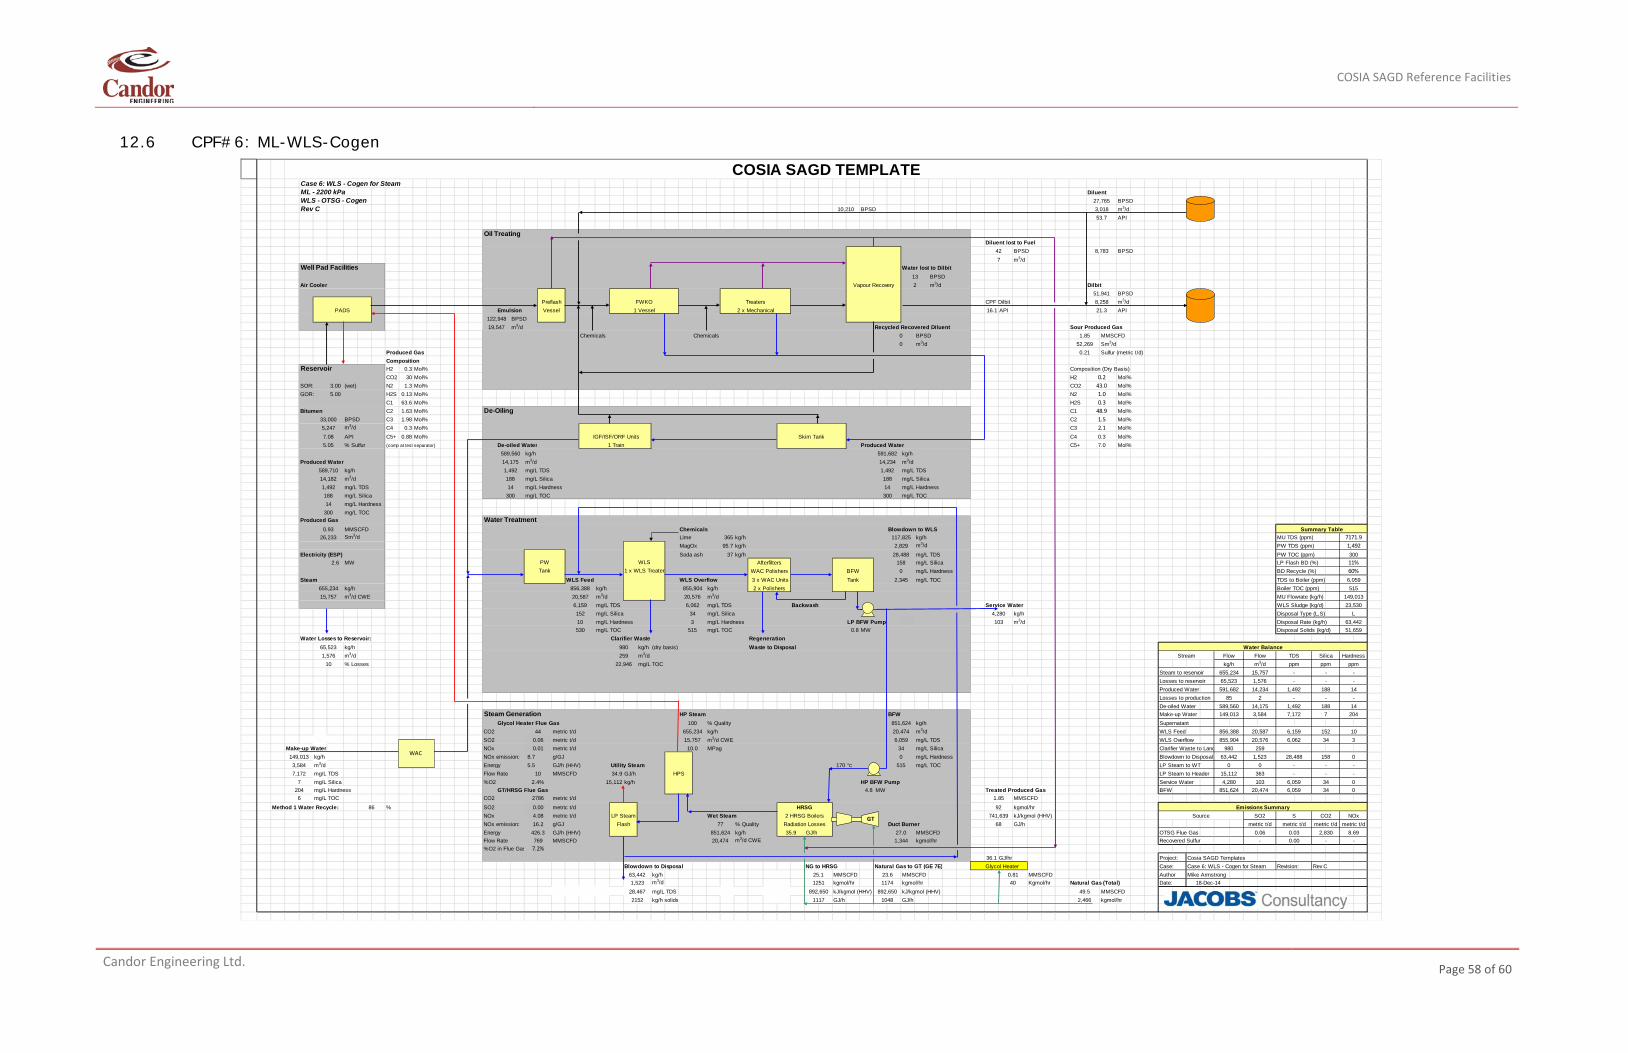
COSIA SAGD Reference Facilities
Candor Engineering Ltd.
Page 58 of 60
12.6 CPF#6: ML-WLS-Cogen
COSIA SAGD TEMPLATECase 6: WLS - Cogen for SteamML - 2200 kPa DiluentWLS - OTSG - Cogen 27,765 BPSDRev C BPSD 3,018 m3/d
API
Oil TreatingDiluent lost to Fuel
42 BPSD BPSD7 m3/d
Well Pad Facilities Water lost to Dilbit13 BPSD
Air Cooler Vapour Recovery 2 m3/d Dilbit51,941 BPSD
FWKO Treaters CPF Dilbit 8,258 m3/dPADS Emulsion 1 Vessel 2 x Mechanical 16.1 API API
122,948 BPSD19,547 m3/d Recycled Recovered Diluent Sour Produced Gas
Chemicals Chemicals 0 BPSD 1.85 MMSCFD0 m3/d 52,269 Sm3/d
Produced Gas 0.21 Sulfur (metric t/d)Composition
Reservoir H2 0.3 Mol% Composition (Dry Basis)CO2 30 Mol% H2 Mol%
SOR: 3.00 (wet) N2 1.3 Mol% CO2 Mol%GOR: 5.00 H2S 0.13 Mol% N2 Mol%
C1 63.6 Mol% H2S Mol%Bitumen C2 1.63 Mol% De-Oiling C1 Mol%
33,000 BPSD C3 1.98 Mol% C2 Mol%5,247 m3/d C4 0.3 Mol% C3 Mol%7.08 API C5+ 0.88 Mol% IGF/ISF/ORF Units Skim Tank C4 Mol%5.05 % Sulfur (comp at test separator) De-oiled Water 1 Train Produced Water C5+ Mol%
589,560 kg/h 591,682 kg/hProduced Water 14,175 m3/d 14,234 m3/d
589,710 kg/h 1,492 mg/L TDS 1,492 mg/L TDS14,182 m3/d 188 mg/L Silica 188 mg/L Silica1,492 mg/L TDS 14 mg/L Hardness 14 mg/L Hardness188 mg/L Silica mg/L TOC mg/L TOC14 mg/L Hardness
mg/L TOCProduced Gas Water Treatment
0.93 MMSCFD Chemicals Blowdown to WLS Summary Table26,233 Sm3/d Lime 365 kg/h 117,825 kg/h MU TDS (ppm) 7171.9
MagOx 95.7 kg/h 2,829 m3/d PW TDS (ppm) 1,492Electricity (ESP) Soda ash 37 kg/h 28,488 mg/L TDS PW TOC (ppm) 300
2.6 MW PW WLS Afterfilters 158 mg/L Silica LP Flash BD (%) 11%Tank 1 x WLS Treater WAC Polishers BFW 0 mg/L Hardness BD Recycle (%) 60%
Steam WLS Feed WLS Overflow 3 x WAC Units Tank mg/L TOC TDS to Boiler (ppm) 6,059655,234 kg/h kg/h 855,904 kg/h 2 x Polishers Boiler TOC (ppm) 51515,757 m3/d CWE 20,587 m3/d 20,576 m3/d MU Flowrate (kg/h) 149,013
6,159 mg/L TDS 6,062 mg/L TDS Backwash Service Water WLS Sludge (kg/d) 23,530152 mg/L Silica 34 mg/L Silica 4,280 kg/h Disposal Type (L,S) L10 mg/L Hardness 3 mg/L Hardness LP BFW Pump 103 m3/d Disposal Rate (kg/h) 63,442
mg/L TOC mg/L TOC 0.8 MW Disposal Solids (kg/d) 51,659Water Losses to Reservoir: Clarifier Waste Regeneration
65,523 kg/h 980 kg/h (dry basis) Waste to Disposal Water Balance1,576 m3/d 259 m3/d Stream Flow Flow TDS Silica Hardness
10 % Losses mg/L TOC kg/h m3/d ppm ppm ppmSteam to reservoir 655,234 15,757 - - -Losses to reservoir 65,523 1,576 - - -Produced Water 591,682 14,234 1,492 188 14Losses to production 85 2 - - -De-oiled Water 589,560 14,175 1,492 188 14
Steam Generation HP Steam BFW Make-up Water 149,013 3,584 7,172 7 204Glycol Heater Flue Gas 100 % Quality kg/h Supernatant
CO2 metric t/d 655,234 kg/h m3/d WLS Feed 20,587 6,159 152 10SO2 metric t/d 15,757 m3/d CWE mg/L TDS WLS Overflow 855,904 20,576 6,062 34 3
Make-up Water NOx metric t/d MPag mg/L Silica Clarifier Waste to Land 980 259149,013 kg/h NOx emission: 8.7 g/GJ mg/L Hardness Blowdown to Disposal 63,442 1,523 28,488 158 03,584 m3/d Energy 5.5 GJ/h (HHV) Utility Steam 170 °C mg/L TOC LP Steam to WT 0 0 - - -7,172 mg/L TDS Flow Rate MMSCFD GJ/h HPS LP Steam to Header 15,112 363 - - -
7 mg/L Silica %O2 kg/h HP BFW Pump Service Water 4,280 103 6,059 34 0204 mg/L Hardness GT/HRSG Flue Gas 4.8 MW Treated Produced Gas BFW 851,624 20,474 6,059 34 0
mg/L TOC CO2 metric t/d 1.85 MMSCFDMethod 1 Water Recycle: 86 % SO2 metric t/d HRSG kgmol/hr Emissions Summary
NOx metric t/d Wet Steam 2 HRSG Boilers kJ/kgmol (HHV) Source SO2 S CO2 NOxNOx emission: 16.2 g/GJ 77 % Quality Radiation Losses Duct Burner GJ/h metric t/d metric t/d metric t/d metric t/dEnergy 426.3 GJ/h (HHV) 851,624 kg/h 35.9 GJ/h MMSCFD OTSG Flue Gas 0.06 0.03 2,830 8.69Flow Rate MMSCFD 20,474 m3/d CWE kgmol/hr Recovered Sulfur - 0.00 - -%O2 in Flue Gas
36.1 GJ/hr Project: Cosia SAGD TemplatesBlowdown to Disposal NG to HRSG Natural Gas to GT (GE 7E) Glycol Heater Case: Case 6: WLS - Cogen for Steam Revision: Rev C
63,442 kg/h 25.1 MMSCFD MMSCFD MMSCFD Author Mike Armstrong1,523 m3/d 1251 kgmol/hr 1174 kgmol/hr Kgmol/hr Natural Gas (Total) Date:
mg/L TDS 892,650 kJ/kgmol (HHV) kJ/kgmol (HHV) 49.5 MMSCFD2152 kg/h solids 1117 GJ/h GJ/h 2,466 kgmol/hr
28,467 892,6501048
23.6 0.8140 18-Dec-14
Flash 6827.0
769 1,3447.2%
924.08 LP Steam 741,6390.00
2.4% 15,112
6 2786
0515
10 34.9
856,3880.06 6,0590.01 10.0 34
851,62444 20,474
2.10.37.0
300 300
2,345856,388
530 515
22,946
300
0.243.01.00.3
48.91.5
10,21053.7
8,783
PreflashVessel 21.3
GT
WAC

COSIA SAGD Reference Facilities
Candor Engineering Ltd.
Page 59 of 60
Project: Cosia SAGD TemplatesCase: Case 6: WLS - Cogen for Steam Rev CAuthor: Mike ArmstrongDate: 18-Dec-14
Utilities SummaryCapacity Unit Commodity Power Steam (positive=generation) Fuel CO2
Process Unit HP LP Produced Gas Natural GaskW kg/h kg/hr MMSCFD MMSCFD metric t/d
Well Pads 33,000 BPD BitumenSteam Injected to Wells -655,234ESP Pumps 2,619Auxiliaries* 1,309Pumpjacks
Oil Treatment 122,948 BPD EmulsionPumps 88
De-oiling 89,158 BPD De-oiled WaterPumps 153VRU Compressors 2,087
Water Treating 89,526 BPD Produced WaterPumps 51WLS 425
Steam Generation 0 m3/d CWE Wet SteamAir BlowerOTSG 15,111,565Pumps 5,543
OffsitesSulphur 0.00 metric t/d SulfurGlycol 22,005 m3/d Glycol 383 0.81 44
Cogen 20,474 m3/d CWE Wet SteamGas Turbine -88,000 23.58 1,299HRSG 655,234 1.85 26.98 1,486
Misc 1,266Net Power Export 74,076* Wellpad auxiliaries are assumed to be 50% of ESP power requirements
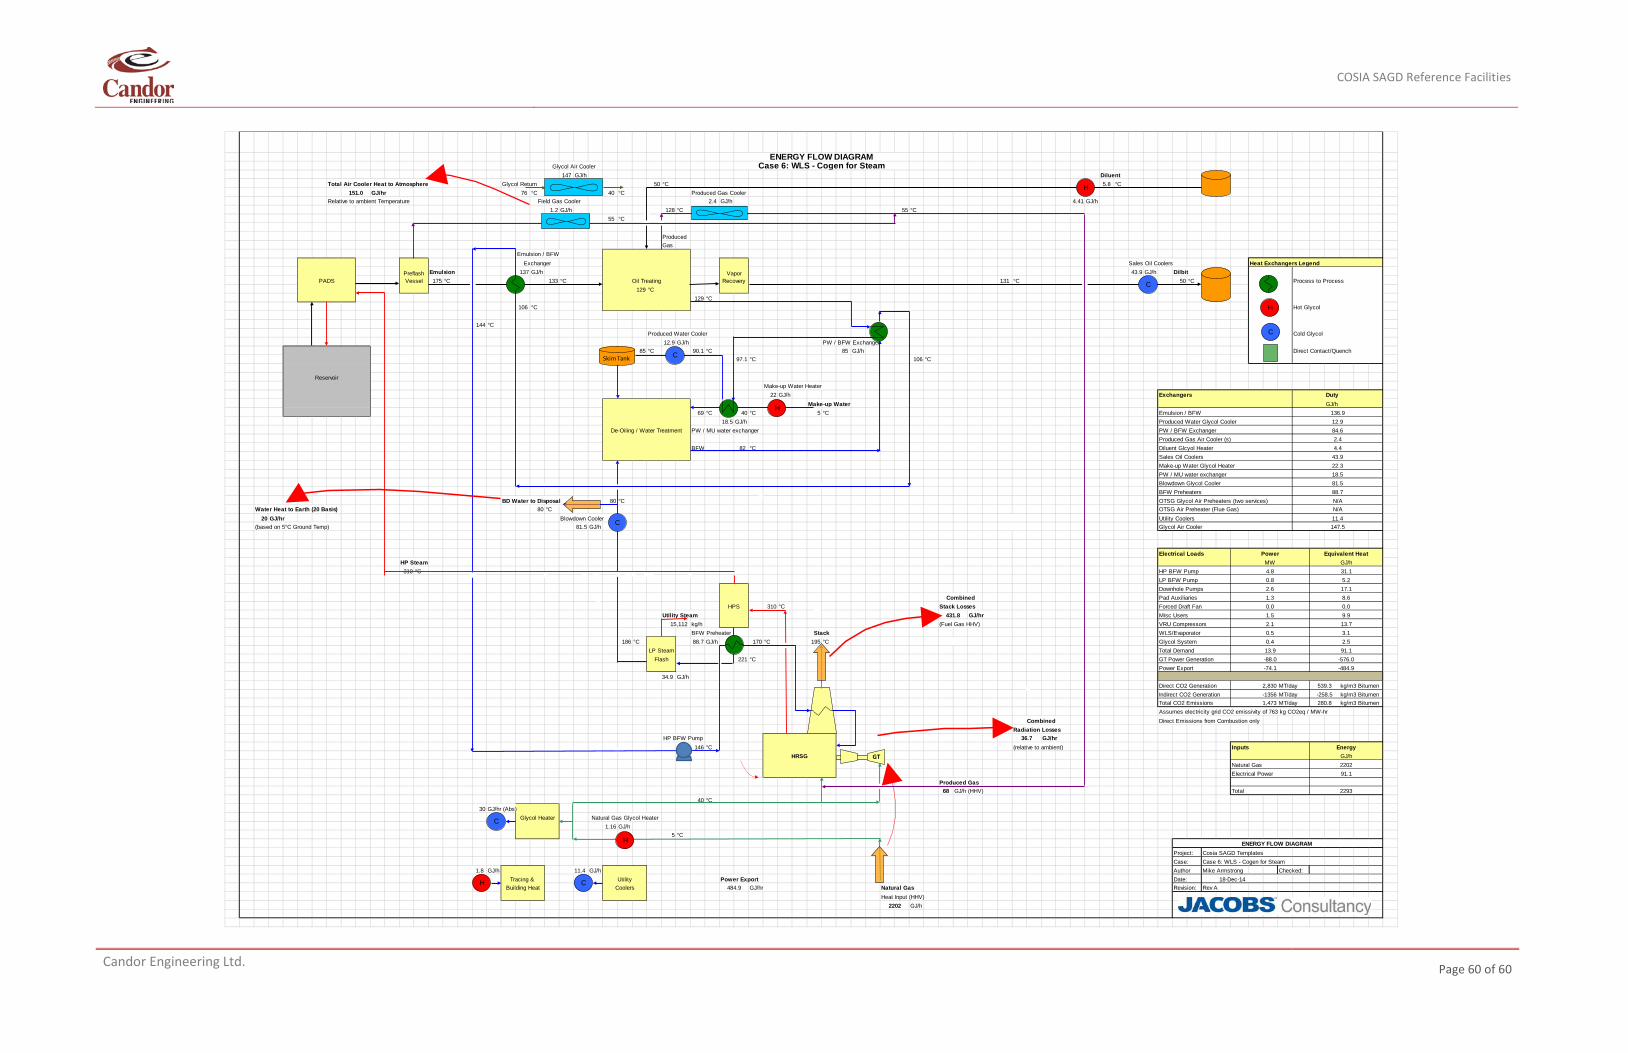
COSIA SAGD Reference Facilities
Candor Engineering Ltd.
Page 60 of 60
Glycol Air Cooler147 GJ/h Diluent
Total Air Cooler Heat to Atmosphere Glycol Return 50 °C 5.8 °CGJ/hr 76 °C 40 °C Produced Gas Cooler
Relative to ambient Temperature Field Gas Cooler GJ/h 4.41 GJ/h1.2 GJ/h 128 °C 55 °C
55 °C
ProducedGas
Emulsion / BFWExchanger Sales Oil Coolers Heat Exchangers Legend
Emulsion 137 GJ/h 43.9 GJ/h DilbitPADS 175 °C 133 °C Oil Treating 131 °C 50 °C Process to Process
129 °C129 °C
106 °C Hot Glycol
144 °CProduced Water Cooler Cold Glycol
12.9 GJ/h PW / BFW Exchanger85 °C 90.1 °C 85 GJ/h Direct Contact/Quench
97.1 °C 106 °C
ReservoirMake-up Water Heater
22 GJ/h Exchangers DutyMake-up Water GJ/h
69 °C 40 °C 5 °C Emulsion / BFW 136.918.5 GJ/h Produced Water Glycol Cooler 12.9
De-Oiling / Water Treatment PW / MU water exchanger PW / BFW Exchanger 84.6Produced Gas Air Cooler (s) 2.4
BFW 82 °C Diluent Glcyol Heater 4.4Sales Oil Coolers 43.9Make-up Water Glycol Heater 22.3PW / MU water exchanger 18.5Blowdown Glycol Cooler 81.5BFW Preheaters 88.7
BD Water to Disposal 80 °C OTSG Glycol Air Preheaters (two services) N/AWater Heat to Earth (20 Basis) 80 °C OTSG Air Preheater (Flue Gas) N/A
20 GJ/hr Blowdown Cooler Utility Coolers 11.4(based on 5°C Ground Temp) 81.5 GJ/h Glycol Air Cooler 147.5
Electrical Loads Power Equivalent HeatHP Steam MW GJ/h310 °C HP BFW Pump 4.8 31.1
LP BFW Pump 0.8 5.2Downhole Pumps 2.6 17.1
Combined Pad Auxiliaries 1.3 8.6HPS 310 °C Stack Losses Forced Draft Fan 0.0 0.0
Utility Steam GJ/hr Misc Users 1.5 9.9kg/h (Fuel Gas HHV) VRU Compressors 2.1 13.7BFW Preheater Stack WLS/Evaporator 0.5 3.1
186 °C 88.7 GJ/h 170 °C 195 °C Glycol System 0.4 2.5Total Demand 13.9 91.1
221 °C GT Power Generation -88.0 -576.0Power Export -74.1 -484.9
GJ/hDirect CO2 Generation MT/day 539.3 kg/m3 BitumenIndirect CO2 Generation MT/day kg/m3 BitumenTotal CO2 Emissions MT/day kg/m3 BitumenAssumes electricity grid CO2 emissivity of 763 kg CO2eq / MW-hr
Combined Direct Emissions from Combustion onlyRadiation Losses
HP BFW Pump GJ/hr146 °C (relative to ambient) Inputs Energy
HRSG GJ/hNatural Gas 2202Electrical Power 91.1
Produced Gas68 GJ/h (HHV) Total 2293
40 °C30 GJ/hr (Abs)
Glycol Heater Natural Gas Glycol Heater1.16 GJ/h
5 °CENERGY FLOW DIAGRAM
Project: Cosia SAGD TemplatesCase: Case 6: WLS - Cogen for Steam
GJ/h GJ/h Author Mike Armstrong Checked:Tracing & Utility Power Export Date:
Building Heat Coolers GJ/hr Natural Gas Revision: Rev AHeat Input (HHV)
GJ/h
1.8 11.4 18-Dec-14
484.9
2202
Flash
34.9 2,830-1356
36.7
-258.51,473 280.8
15,112
LP Steam
ENERGY FLOW DIAGRAMCase 6: WLS - Cogen for Steam
151.02.4
Preflash Vessel
Vapor Recovery
431.8
C
H
C
H
C
H C
H
C
H
C
Skim Tank
GT