Embed Size (px)
Citation preview

1
Candidate Number POL 1340
David K Lawes
Fitzwilliam College, University of Cambridge
Supervisor Dr Geoff Barnes
Thesis Title
Targeting Traffic Enforcement with a Collision Harm Index: A Descriptive Study in the City
Of London
Word Count: 17,944
Submitted in part fulfilment of the requirements for the Master’s Degree in Applied
Criminology and Police Management
December 2014

2
Abstract
Years of research has sought to examine the causes for road collisions, their frequency,
magnitude and costs to victims, families and to society. Existing literature examines the effects
of enforcement on collisions and whether intervention, in its many different guises, can make
a difference with collision reduction. Enforcement remains a component part of a three pronged
national strategy in the United Kingdom (UK), working hand in glove with engineering and
education, all of which are designed to proactively reduce collisions and casualties. This
research posits the view that more often than not police agencies respond to events making
subjective decisions regarding targeting resources.
Quantitative injury collision data from the City of London Police is analysed, applying a
CoLCHI (City of London Collision Harm Index) score to injury events, summed at existing
enforcement locations and then ranked. The resultant analysis shows that, despite the best
efforts of an increasingly stretched resource, intuitive tasking decisions are common place often
missing the areas containing the greatest harm.
Policy makers will need to be cognisant of all available evidence, including harm, in order to
target road users at high risk locations, avoiding the immense amount of ‘wasted enforcement
effort’ and continual cycle of response to tragic and arguably preventable events.

3
Acknowledgements
I would firstly like to thank the City of London Police for their support and sponsorship during
this Masters programme, for the use of the relevant data sets and access to analytical support,
particularly Alan Rickwood, Sona Patel, Rachel Jackman and Carl Ward.
Dr Geoff Barnes has provided sage advice for this descriptive analysis, helping to develop a
new idea with patience, humour and fortitude.
Finally thanks to my wife and daughter for their own patience whilst I have juggled work, home
and a demanding and challenging academic programme.
4
Contents
Abstract ........................................................................................................................................................................ 2
Acknowledgements ................................................................................................................................................. 3
List of Tables and Figures .................................................................................................................................... 6
Research Question ................................................................................................................................................ 11
Literature Review ................................................................................................................................................. 12
Introduction .......................................................................................................................... 12
Collisions and the Vulnerable Road User. Extent of the problem ....................................... 13
Forecasting, Placing a Value on Collisions and Casualties ................................................. 17
Collision Harm ..................................................................................................................... 19
Criminological Theory ......................................................................................................... 25
Deterrence Theory ............................................................................................................ 25
Routine Activity Theory .................................................................................................... 27
Research Methods ................................................................................................................................................ 30
Introduction .......................................................................................................................... 30
City of London ...................................................................................................................... 32
Collision reporting ............................................................................................................... 32
Data Collection, Assessment and Cleansing ........................................................................ 33
Analysis Methodology – City of London Collision Harm Index (CoLCHI) ......................... 37
Time and Distance Collision Harm Calculation .................................................................. 42
Geographic distance coefficient: ...................................................................................... 42
Temporal distance coefficient: ......................................................................................... 44
Proximal calculations and graduated symbol mapping ................................................... 45
Introduction .......................................................................................................................... 48
Base Value Only Collison Harm Index Scoring and Ranking ............................................. 51
Correlation of enforcement activity to collision harm ......................................................... 56
Collision and Enforcement Time Analysis ........................................................................... 61
Time and distance (proximal) collision harm index............................................................. 64
Discussion ................................................................................................................................................................ 71
Enforcement Locations ......................................................................................................... 71
Injury Collisions and Prevention Costs ............................................................................... 72
Creation of the City of London Collision Harm Index ......................................................... 72
Enforcement Location Ranking ............................................................................................ 73
Correlation of Enforcement Activity to Collision Harm ...................................................... 74

5
Thesis Context with Existing Literature and Research ........................................................ 75
Limitations of Research ........................................................................................................ 76
Strengths of Research ........................................................................................................... 78
Conclusion ............................................................................................................................................................... 79
Implications for Future Research ........................................................................................ 80
Policy Implications ............................................................................................................... 81
Application ........................................................................................................................... 82
Bibliography ........................................................................................................................................................... 83
Appendices .............................................................................................................................................................. 89
Appendix A Collision Report Booklet and guidance ......................................................... 89
................................................................................................................................................................................... 100
Appendix B Example of Injury Collision Data Capture .................................................... 108
Appendix C Key to Enforcement Locations ...................................................................... 109
Appendix D Example of Proximal CoLCHI formula in Excel Enforcement site A .......... 110
Glossary ................................................................................................................................................................. 111

6
List of Tables and Figures
Table 1 Valuation of injury accident prevention ..................................................................... 18
Table 2 Indication of Enforcement activity recorded July 2010.............................................. 36
Table 3 Snapshot of CoLCHI Scoring 6 Sites 16 Months ....................................................... 40
Table 4 Base Value CoLCHI Scores All Locations 2010/11 .................................................. 52
Table 5 Base Value CoLCHI Scores All Enforcement Locations 2011/12 ............................. 53
Table 6 Enforcement Sites in Rank Order by Month 2010/11 .............................................. 54
Table 7 Sites Selected for Enforcement 2010/11 ..................................................................... 57
Table 8 Sites Selected for Enforcement 2011/12 ..................................................................... 58
Table 9 Comparison of Base Value and Proximal CoLCHI Rankings 2010/11 ..................... 69
Figure 1 Enforcement Locations and Personal Injury Collisions 2010 to 2012 ...................... 39
Figure 2 Geographic Distance Coefficient at an Enforcement Location ................................. 43
Figure 3 Time Envelopes and CoLCHI Scoring ...................................................................... 44
Figure 4 Graduated Symbol Mapping at Ludgate Circus ........................................................ 46
Figure 5 Two Year Enforcement Site CoLCHI Ranking ......................................................... 55
Figure 6 Enforcement Correlation Scatterplot 2010/11 ........................................................... 59
Figure 7 Enforcement Correlation Scatterplot 2011/12 ........................................................... 60
Figure 8 Enforcement Correlation Scatterplot 2011/12 (2) ..................................................... 61
Figure 9 Injury Collisions by Time of Day 2010 to 2012........................................................ 62
Figure 10 Traffic Enforcement by Time of Day 2010/11 ........................................................ 63
Figure 11 Traffic Enforcement by Time of Day 2011/12 ........................................................ 63
Figure 12 All Enforcement Locations Showing Harm Graduation ......................................... 66
Figure 13 Cannon Street Showing Proximal CoLCHI Graduated Symbol Mapping .............. 67
Figure 14 Proximal CoLCHI Scoring and Ranking April 2011 .............................................. 68
Figure 15 Proximal Harm Index Heatmap ............................................................................... 70

7
Introduction
This thesis sets out a descriptive study around targeted traffic enforcement and collision
harm in the City of London, in order to explore whether evidence of harm has been considered
when selecting locations for traffic enforcement. 300,000 people commute into the square mile
every day, placing significant pressure on the highways and contributing to inevitable
congestion, cited as a factor leading to collisions (Corporation of London 2012). There are
between 300 and 400 injury collisions per annum (overall n =800 injury and non-injury
collisions annually) with averages of 50 being serious, including up to 3 fatalities (City of
London Police 2013b). Whilst the City is a small geographic area within Greater London, the
concentration of motor vehicles and increased use of pedal cycles is at such a high density that
collisions inevitably occur (Corporation of London 2012).
The casualty rate for Vulnerable Road Users (VRU’s) - defined as cyclists, pedestrians
and motorcyclists - is disproportionately high when compared against inner London boroughs
(Everett 2013), pedestrians accounting for 26% of all casualties within the City of London set
against a figure of 20% for inner London. The cyclist casualty rate is higher again, 28% of the
total for the City, compared with 12% for Inner London. This study discusses injury collisions
in London and their direct and indirect financial costs, documented by the Department for
Transport (DfT) and used within this paper to articulate the extent of the harm caused.
Cyclists have attracted extensive press coverage, following a succession of fatal
collisions immediately prior to Christmas 2013 (Myers 2013; Harvey, 2013). The resulting
frenzy of media interest focused attention on the extent of the problem and the harm it causes
to victims, their families, the health service and other agencies. There is, however, a tendency
to kneejerk into enforcement action following such high profile interest, exactly what happened
here. Hundreds of police officers were deployed London wide, engaged in ‘high profile re-

8
assurance’ at major junctions under the banner of ‘Operation Safeway’. This type of activity,
whilst probably being inevitable, is certainly unsustainable and doesn’t focus activity based on
evidence of harm. There is some scepticism that the claims of cyclist casualty reductions under
‘Operation Safeway’ were wildly unfounded (Road Danger Reduction Forum 2013),
demonstrating a problem with drawing any conclusions, particularly success stories, from
enforcement campaigns that haven’t used an evidence base to define effective targeting.
The Department for Transport introduced a new metric of calculating the harm of road
collisions based on the Value in Preventing a Fatality (VPF). Underpinned by a consistent
Willingness To Pay (WTP) approach, endorsed by the Home Office (Select Committee on
economic affairs 2006; Department for Transport 2012a; Department for Transport 2012b), it
includes all aspects of the valuation of casualties comprising human costs, identifying pain,
grief and suffering, emergency healthcare, policing, insurance, damage and future lost outputs
(Department for Transport 2012). Average values for the prevention of road casualties are
assigned combined costs for each element and linked to the appropriate level of severity (slight,
serious and fatal). These values are used by this study to define a financial level of harm for
each individual collision:
Slight Injury £14,760
Serious Injury £191,462
Fatal Injury £1,703,822
This study cites two criminological theories which underpin the thesis. Firstly Routine
Activity Theory (Akers & Sellers 2009; Cohen & Felson 1979; Felson 1998): suggesting its
application with a more flexible approach where offenders move about in place and time and
where potential collision victims could also be offenders. This suggestion has some resonance
when applied to the issue of collisions, considering that ‘offenders’ may not set out to commit
any offences or cause harm. Instead offences (in this case collisions) become more likely as a

9
result of their underlying behaviour. Deterrence theory is also discussed as a possible premise
which may prevent offending behaviour, with this paper discussing the elements primarily for
general deterrence (Stafford & Warr 2006; Homel 1988).
In order to answer the question of whether enforcement locations (for operations) have
been selected in line with evidence of harm, secondary data- submitted to the Department for
Transport by the City of London Police- was analysed, covering 948 City of London injury
collision events ranging from April 2010 through to March 2012. The period during the London
Olympics was excluded as a result of the extra ordinary policing measures in place at that time.
Traffic enforcement data was available for the same period, likewise collected and analysed.
Once the data was cleansed, a City of London Collision Harm Index (CoLCHI) value
was awarded to each injury collision record and mapped to each of the 23 enforcement
locations currently used for targeted traffic enforcement by the City of London Police (22 being
subsequently used for the study). Each location summed the collision harm scores for all events
captured within a 200 metre radius of the chosen location on a monthly (and then yearly) basis.
Ranking of enforcement locations can then be seen, using the summed CoLCHI scores before
being compared with the actual sites where enforcement was delivered. With some fairly
compelling results demonstrating that harm was not a factor for targeting decisions
Based on monetary values for harm, set by the DfT (Department for Transport 2012a;
Department for Transport 2012b), fatal collisions are 8 times more harmful than serious injuries
and 115 times more harmful than slight injury collisions. Meaning that a fatal collision will
effectively act as an extreme ‘outlier’, pushing a location’s scoring to exceptionally high levels
and potentially skewing a targeting decision if viewed in isolation. A collision harm index
formula multiplying time and distance variables is also explored to help establish a more time
sensitive harm analysis, in order that events happening more recently carry more importance

10
and weight for tasking decisions; softening some of the extreme spikes evident with the base
value only calculation.
This study’s approach, using a collision harm index, has indicated that targeting during
the period of analysis was not carried out in line with evidence of harm. The comparison
between base value, followed by time and distance modelling show that both concentrate on
harm scoring; the latter arguably offering a more accurate method to consider the elements of
time and distance. The CoLCHI and its application demonstrate that collision events should
not be treated equally, and that cognisance of the appropriate evidence should shape decision
making in relation to targeting decisions.

11
Research Question
TFL have set out six clear commitments in order to improve the safety of the Streets of
London. Alongside an ambitious 40% overall reduction in KSI rates, there is commitment to
tackle road users who put people at risk, by way of enforcement (Transport for London, 2014).
This issue has been pivotal, developing research questions for this thesis, in order to ensure
both social importance and scientific relevance (Bachman & Schutt 2010, p.38), the former
because the findings may help to shape public policy, preventing death and injury, and the latter
because there appears to be a gap in relation to research involving traffic enforcement
programmes in central London, specifically the City of London.
The research question:
“Have enforcement locations (for operations) been selected in line with evidence of harm?”

12
Literature Review
Introduction
This literature review explores the extent and context of police traffic enforcement and
injury collisions, examining both government papers and reports alongside empirical research.
The problem is manifest worldwide, with an estimated 1.2 million people being fatally injured
annually as result of traffic collisions. A further 50 million are estimated to be injured in
collisions globally (World Health Organisation 2004), and whilst the demographic of some
nations, notably third world countries, is not directly comparable to the UK, context for the
United Kingdom (UK) is important.
This section examines national, regional and local figures for collisions, reviewing recent
reductions in their numbers alongside predictions for the future. It may be helpful at this stage
to explain that this study refers to ‘collisions’ as opposed to ‘accidents’: a commonly used
parlance, because these events do not happen ‘by accident’ suggesting there will always be a
contributory factor for the coming together of road users (Crown Prosecution Service 2014).
Collisions are classified into three categories, described as slight, serious and fatal, with the
extent of the casualties’ injuries dictating the relevant grouping. The reporting itself is
completed by the police using the information available at or shortly after the collision (UK
Government 2012):
1. Slight Injuries are defined as sprains bruises or cuts, generally not necessitating
medical treatment
2. Serious Injuries will include severe cuts, fractures , burns, concussion and other
injuries which would require medical treatment at hospital as an “in patient”
3. Fatal Injuries speak for themselves, but a fatal collision is one involving at least
one fatality

13
Once the collisions are reported, the harm inflicted to the road user can be calculated and
this chapter examines the extent of that harm, reviewing the Cambridge Crime Harm Index
(CHI) (Sherman et al 2013) and whether its basis for weighting incidents based upon a numeric
base value can be applied to test traffic enforcement locations. This chapter explores whether
the Department for Transport (DfT) baseline casualty figures, assigning a monetary value to
the three levels of injury, might serve as the basis for a City of London Collision Harm Index
(CoLCHI).
Collisions and the Vulnerable Road User. Extent of the problem
The DfT annual statistics demonstrate the extent of the problem for collisions and road
deaths nationally, articulating that the UK has around 1,700 deaths per annum resulting from
traffic collisions (Department for Transport 2014). Whilst the numbers have reduced, indeed
they have been cut by half since 2000 (Department for Transport 2014a), the latest figures
actually show a 3% rise with fatal collisions nationally (Department for Transport 2014b).
Serious Injury collisions, generally necessitating hospital treatment as an ‘in patient’, likewise
have reduced dramatically nationally since 2000, falling by 43% (Department for Transport
2014). Whilst the overall numbers of casualties have reduced in the City of London over the
same period; down from 458 in 2000 to 409 in 2011 (Everett 2013), those seriously injured in
the City have seen recent increases (Rickwood 2014).
The worrying headline here, sees a disproportionate number of vulnerable road users
(VRUs) being injured, when compared against other inner London boroughs. Vulnerable road
users (VRUs) are described as being pedal cyclists, pedestrians and motorcyclists (Transport
for London 2012a; Rickwood 2014); reported in 2013 as being as high as 79% of the overall

14
injury totals for that year (Everett 2013; City of London Police 2013a; City of London Police
2013b). Pedestrians account for 26% of all casualties within the City of London, set against a
figure of 20% for inner London. The cyclist casualty rate is higher again at 28% of the total for
the City, compared with 12% for Inner London (Everett 2013).
There is recognition on an International scale for VRUs, with the problem in lower
income counties appearing to be much worse: “because of the variety and intensity of traffic
mix and the lack of separation from other road users” (World Health Organisation 2004, p.41).
According to the European Transport Safety Council, the risk of death for every 100 million
kilometres travelled is 13.8 for two wheelers, 6.4 for pedestrians and 5.4 for cyclists in Europe.
Compare this to the figure of 0.7 for motor cars and 0.07 for buses and coaches (World Health
Organisation, 2004) and the problem is fairly clear, replicated and supported by recent reports
in the City of London.
This thesis is interested, amongst other things, in the movement and flow of road users,
notably VRU’s, in the City of London. It will signpost the extent of the problem London wide,
noting that the City of London only accounts for 1% (n=380) of all casualties in Greater
London, using 2010 figures, (Stansfield et al. 2012) and whilst some of the travelling trends
appear to be similar for London as a whole, the City of London has a disproportionate number
of VRU casualties (Everett 2013; Rickwood 2014).
Decisions around traffic enforcement sites, along with the density and frequency of
activity is currently driven quantitatively and intuitively, where intervention is introduced
either because of sheer volume, or headline grabbing events. The autumn of 2013 saw an
immense amount of effort being expended with traffic enforcement across London as a whole,
following half the annual London count of cyclist fatalities (n=6) occurring in just two weeks.
The adverse headlines prompted a so called ‘police crackdown’ in the run up to the festive

15
season, under the banner of ‘Operation Safeway’. Whilst the subsequent casualty reduction
was welcomed and celebrated by the Mayor of London (Greater London Authority 2014),
some commentators were sceptical of its success, questioning the effectiveness of the
enforcement (Road Danger Reduction Forum, 2013; Sutton 2014; Payne 2014; London
Cycling Campaign, 2014) and its focus on relatively minor traffic infringements by cyclists.
The City of London Local Implementation Plan (LIP) contains proposals to increase
both pedestrian and cyclist numbers (10% and 46% respectively) in the City (Stansfield et al.
2012; Corporation of London 2012; Everett 2013). These increases, if realised, will present
weighty challenges, as the area already sees overcrowding of footways and narrow streets at
peak times. There is, however, a school of thought that collision rates could actually decrease
at specific intersections where there are increases in people walking or cycling; apparently
brought about by self-regulation and adjustment by motorists linked to the prevailing
conditions (Jacobsen, 2003).
The increase in cycling numbers is supported by DfT statistics which show a threefold
increase in cyclist movements, tracked over 39 points in the City, since 2000 (DfT, 2013). This
increase contrasts with reductions in car and motorcycle movements, conversely seeing
increases in buses and coaches and a small reduction in Heavy Goods Vehicles (HGVs). There
will always, however, be spikes which are linked to periods of greater demand: for example,
the last year has seen an increased volume of HGVs, linked to the Pan London Cross rail
development, using the City streets(Buck 2014).
HGVs were examined as part of a British study into cyclist collisions in 2009, examining
430 fatal cyclist collisions occurring between 2005 and 2007. That particular study concludes
that 18% of these fatalities (n=78) were involved in a collision with an HGV (Knowles et al,
2009). Whilst this figure is lower than the 50% stemming from collisions with cars (n=215), it

16
appears to be a disproportionate number of fatalities, considering the lower number of HGVs
on Britain’s’ roads when compared to cars (Knowles et al. 2009). This assertion is supported
in London by a study for TFL in 2012, examining 197 fatal pedestrian collisions showing that
14% of cyclist collisions (n=27) involved HGV’s (Knowles et al. 2012, p.19).
Whilst these examples relate to a small number of incidents, collisions between HGVs
and vulnerable road users are far more harmful than nearly all other forms of traffic collisions
(Knowles et al. 2009, p.vii; Knowles et al. 2012); meaning that these vulnerable road users are
more likely to be killed when in collision with an HGV. There are well documented
contributory factors for these collisions involving pedestrians and cyclists, and inattention, for
all of these road users, is well cited as a primary reason (Knowles et al. 2009; Knowles et al.
2012; World Health Organisation 2013).
STATS 19 is the name of a form used by all police agencies in the UK, to report injury
collision data for collation by the DfT. Police Officers input a number of variables recorded
for each collision, including contributory factor data. The data are generally submitted after the
event and usually very subjective, suggesting an intuitive rather than a deliberate careful
assessment of hard facts. This intuitive approach probably seems the most logical application,
given a traffic police officers’ subject matter expertise. Arguably engendering stereotypical
lazy conclusions, based on known existing patterns rather than a logical assessment of all the
facts which may throw up different explanations (Kahneman 2011). This is in addition to the
problem faced by underreporting, where non- fatal pedestrian and cyclist injuries may be vastly
underestimated (World Health Organisation 2004), particularly if injury or severity could not
be established at the scene of collisions or indeed the collision itself was not reported (Tranter
& McGrath 2007).

17
Forecasting, Placing a Value on Collisions and Casualties
Rigorous forecasting around the reductions we could expect to see by the year 2030
(Mitchell & Allsop 2014), posits the suggestion that the national headline fatal collision figure
could reduce by 44% (750). This reduction is based on the examination of previous years’
statistics and likely trends. The Mitchell and Allsop study re-enforces the importance of
forecasting. Firstly to target those road users who will need extra effort in order to reduce
casualties, predominantly VRUs, secondly to highlight the spending required over the course
of time, and thirdly to post targets which are based on evidence and challenging. Even if we
accept confidence with this forecasting and celebrate the apparent good news, the reality
remains that there will still be a third of a million Killed or Seriously Injured (KSI) casualties
between now and 2030, with a prevention value of £110 billion (Mitchell & Allsop 2014, p.3).
The financial figures used in the Mitchell and Allsop report have been developed by
the DfT, who have introduced a Value in Preventing a Fatality (VPF), derived from a Risk Cost
Benefit Analysis, underpinned with a consistent willingness to pay approach supported by the
Home Office (Select Committee on economic affairs 2006; Department for Transport 2012a;
Department for Transport 2012b).
Values are calculated for the three categories of slight, serious and fatal injuries,
comprising loss of output, emergency services, coupled with hospital and human costs. The
latter based on amounts people say they would be willing to pay to prevent the collisions from
happening; which would include the avoidance of grief, suffering and pain for the victim, their
family and friends as well as the loss of life enjoyment. The amounts are set out in Table 1,
which shows the costs of individual casualties, along with costs ‘per accident’. These amounts
will form the ‘base value’ for the City of London Collision Harm Index (CoLCHI). The costs
per ‘accident’ have been averaged out taking into consideration a number of collisions that will

18
have multiple casualties. The CoLCHI uses the cost ‘per casualty’ figures, as the vast majority
of City of London injury collisions involve single casualties.
TABLE 1 VALUATION OF INJURY ACCIDENT PREVENTION
Accident/casualty type Cost per casualty Cost per accident
£2012
Fatal Serious Slight Average for all severities Damage Only
1,703,822
191,462
14,760
50,698
1,917,766
219,043
23,336
72,739
2048
Source: Department for Transport (2012b)
The Parliamentary Advisory Council for Transport Safety (PACTS) and DfT have used
these figures to calculate the total cost of prevention of road casualties and accidents
(collisions), PACTS to forecast the projected numbers of casualties in 2030, and the DfT to
provide yearly prevention values based on reported collision data (Mitchell & Allsop 2014;
Department for Transport 2012a; Department for Transport 2012b). The forecasting is
particularly important for the City of London Police, as it receives £1.2 million per annum from
TFL, in order to deliver traffic enforcement. This figure should be compared to the value placed
upon preventing injury collisions, and this study will also argue that it needs to be compared
with the CoLCHI enforcement location scores.

19
There are manifold reasons why collisions happen in the first place, including driver
behaviour, vehicle construction, weather, speed, road layout and traffic density to name but a
few. Driver behaviour and the environment can play an enormous part in defining where, when
and how collisions take place, so it is right to highlight that whilst this study is looking at the
issues surrounding enforcement, we shouldn’t forget the important part played by other areas.
In London the current TFL action plan references activity to be carried out across all of the
three ‘e’s’ of enforcement education and engineering (Transport for London 2014d; Transport
for London 2014b; Transport for London 2014c; Department for Transport 2011). Whilst the
City of London Police is committed to work across all three areas, this study concentrates on
the specific area of traffic enforcement.
Collision Harm
Levi (1997) articulates the understandable focus placed on those killed as a result of
careless or dangerous driving, despite the far greater numbers of citizens killed as a result of
collisions during every day business. This particular issue is specifically examined for this
study, where the paper suggests that those killed or seriously injured represent substantial harm
for themselves, family and friends, regardless of whether it was the result of a criminal act.
Whilst the numbers of injury collisions in the City of London may seem quite small, there
would be substantial preventative costs attached to them, if the DfT casualty valuation figures
were apportioned (Department for Transport, 2012b). If these costs were applied to the 2013
City of London injury collision figures, they would amount to:
300 (slight) x £14,760 = £4,428,000
50 (serious) x £191,462 = £9,573,100
3 (fatal) x £1,703,802 =£5,111,466
=£19,112,566

20
TFL provide £1.2 million per annum for the City of London Police to deliver
enforcement activity to help prevent injury collisions. This funding represents only 6.2% of the
total preventative costs, illustrated above, using the raw base values provided by the DfT. These
raw values, as illustrated, don’t take into consideration the spread of harm linked to specific
locations, as it merely sets out the overall sum, without an indication as to where the harm is
greatest. The process of summing collisions at specific relevant sites should also be undertaken
in order to inform and ensure specific targeted enforcement activity is focused.
The development of the Cambridge Crime Harm Index (CHI), by Sherman et al, has
provided some thought and direction as to whether the same principles could and should be
applied to injury collision harm. A simple count of collisions on their own could be a very
misleading statistic, particularly if an overall numeric rise or fall is lauded as a success, without
reference to the context surrounding incidents involving the most harm, and especially where
these incidents have remained the same or increased within the overall headline figure
(Sherman et al, 2013). Sherman et als’ paper describes how high volume minor crimes hold a
disproportionate amount of weight within the overall crime counts; the same could be argued
for the large number of slight injury collisions which seemingly drive targeting decisions for
traffic enforcement.
The CHI proposes that each reported crime is multiplied by the amount of prison days
that a previously un-convicted offender could expect to receive upon sentencing. This approach
would see far greater scores for increased harm, lower instance offences of murder and rape
for example (Sherman et al. 2013). In turn, this could influence targeted police activity (and
funding for the same), based on concentrating effort and scarce resources to where the greatest
harm is present. “Targeting and Testing require highly reliable measures of crime and harm”
(Sherman 2013, p.384). It would therefore seem reasonable to apply these principles to injury
collisions, in order to target funded City of London Police assets to the areas where the evidence
tells us the greatest harm exists.

21
Collisions have been assessed by TFL, analysing data from the STATS 19 database,
resulting in information being made available including collision type, classification of road
user as well as location analysis, resulting in a more risk based approach to future preventative
work (Transport for London 2014d, p.24,26). This approach, as a minimum, will be helpful if
TFL are to achieve anything like the “40 per cent reduction in KSI casualties by 2020, from a
baseline of the 2005-2009 average” (Transport for London 2014d, p.29). What appear to be
missing from the literature reviewed thus far are calculations of harm associated and
attributable to geographic locations.
The City of London Police, like their Metropolitan neighbours, receives funding from
TFL in order to deliver a range of activity, primarily against the education and enforcement
strands of their action plan. Outputs, such as penalty notices, arrests, vehicle seizures and
reports for issue of summons, are recorded and submitted to TFL, but there is currently no
causal analysis carried out comparing enforcement operations alongside the City of London
collision data. This means that if the collision rates drop, as they have in the City over the last
couple of years (City of London Police 2013b; City of London Police 2013c) there could be an
inaccurate assumption that the drop has been attributable to the levels of enforcement. There is
no evidence to support this claim.
A decade ago TFL commissioned a systematic review (Broughton & Elliott 2004),
looking at how methods and levels of enforcement affect road casualty rates. Within which is
an early assumption that if no enforcement is delivered, then collision rates are expected to be
at their highest (Broughton & Elliott 2004). They summarise that an introduction of
enforcement activity doesn’t net any tangible results until drivers are aware of policing
presence and adjust their driving accordingly. This suggestion will only be effective to a certain
point before any deterrence will start to decay. Both Rothengatter and Kahneman caution that
any reductions should always be analysed, taking into account the rate of collisions before the
enforcement started (Kahneman 2011, p.424; Rothengatter 1982, p.350). Any above average

22
collision area may see reductions as a result of regression to the mean, where spurious
explanations provide ‘reasons’ for success as suggested earlier with the Metropolitan Police
‘Operation Safeway’.
Meta-analysis carried out and cited in another study by Elvik, suggests that collisions
are reduced with a physical police presence (Elvik 2001, pp.13–19) recording reductions up to
an impressive 45% in fatality reduction where red light enforcement cameras were deployed.
If these percentages were applied to the harm values set by the DfT for injuries sustained in
collisions, and multiplied by the number of collisions that were prevented, it is clear that big
savings could be made.
Another aspect of police traffic enforcement concerns the focus on locations and types
of offences to be targeted. Elvik (2001) goes on to say that Norway has historically delivered
enforcement at selected locations, essentially only because they always have. The locations
may have previously featured as being particularly busy for violations and collisions (Elvik
2001, p.62) and this approach was institutionalised. This behaviour has resonance in the City
of London, where largely intuitive responses have seen the selection of a fairly small number
of repeatedly used enforcement sites. Elvik has listed the Norwegian traffic violations which
research has shown to be the major contributory factor with fatal collisions, with a proposal
that Police agencies target their planned enforcement on those issues (Elvik 2001). Whilst the
Norwegian approach may be eminently sensible in a large geographical area where there could
be a delineation of offending, district to district, it may not be practical in the City of London,
a small densely packed area where violations such as speed and intoxication are rarely factors
with injury collisions.
There appears to be a link between risky driving, breaking traffic law and collisions
(Parker et al. 1995), and offending type is underlined again in a Israeli study where speeding,
driving under the influence of drink and drugs, failure to wear seat belts and running red lights
are all cited as having “significant associations with the prevalence and severity of crashes”

23
(Factor 2014, p.87). The London context is important for this study, as road user behaviour is
markedly different between busy urban areas and rural locations (Broughton & Elliott, 2004).
Previous studies examining enforcement and collision reduction will not necessarily be
‘generalisable’ and consequently applicable to the City of London. Specific relevance is
important for this thesis; hence any studies carried out in the London area are of interest.
Research undertaken in South London (Walter et al, 2011), looked at the effects of
increased enforcement along the A23 in Croydon. That study followed previous work
completed for the Transport Research Laboratory (Broughton & Elliott, 2004), the former
broadly concluding that enforcement did see improvements with driver compliance and
subsequent casualty reduction. The 2011 study saw a large volume of vehicles stopped, with
the police issuing a high number of fixed penalty notices. Interestingly there would also appear
to have a been a ‘halo’ effect in surrounding areas, where the more serious road traffic offences
were reduced, possibly as a result of the sustained interventions over a four week period (Walter
et al. 2011). This finding is useful to consider for any enforcement location where diffusion of
benefits, resulting in collision reductions, would be welcomed.
Davey and Freeman (2011) suggest that layered approaches using a number of varying
components are the best method to alter driving behaviour rather than rely on single solutions
in isolation, such as speed cameras. Well publicised road safety campaigns, education, and
enforcement, automatic solutions could all arguably see some deterrence from driving
behaviour which either leads to collisions or is unlawful per se. The challenge involves
coordination of the most appropriate component parts which can maximise deterrent effects:
underpinned by an evidence based carefully targeted approach to “increase the likelihood of
identifying and apprehending motorists engaging illegal behaviours” (Davey & Freeman 2011,
p.34).
Data driven approaches to crime, congestion and traffic safety (DDACCTS) is a new
approach for TFL, imported from the United States, involving robust data collection,

24
evaluation, management and response (Bruce, 2013). The initiative concentrates on outcomes
and an ability to deliver successful outcomes across manifold problem areas, such as crime,
collisions and congestion; effectively single tasking in problem areas dealing with multiple
problems with the same activity.
The ability to synthesise analytical products in order to brigade responses to social
harms is of particular interest for this study, where a targeted response to the areas of highest
risk could reduce serious injuries from collisions, whilst also delivering multiple outcomes for
other problems, using the same resource expenditure (U.S. Department of Justice 2012). This
approach could reap benefit for the City of London where policing problems are often overlaid
across multiple locations. The DDACCTS approach could see multiple crime and road safety
issues being addressed at the same location with no discernible difference in the intervention
itself, but potentially deterring criminal behaviour across multiple problem areas. Deterrence
from one course of offending would be welcomed, but it would appear that this may be possible
for many, and welcomed by any public body facing cuts in spending, where intelligent choices
around enforcement will be essential for the future.

25
Criminological Theory
Deterrence Theory
This study examines the effect of traffic interventions upon collision reduction, thereby
suggesting that road users who break the law, as a component part of their driving, would
refrain from it when presented with the risk, or direct prospect, of legal punishment. When the
efficacy of road safety intervention is considered, its effect on deterring road users from
engaging in illegal behaviour should be nailed down to perceptions about certainty, severity
and celerity of sanctions (Davey & Freeman 2011). The area of road safety depends heavily
upon altered behaviour resulting from the perceived threats of being caught and being punished
quickly (Homel 1988; Davey & Freeman 2011). Homels’ work in relation to random breath
testing (Homel 1988) mentions the value of both formal and informal sanctions. The latter
suggesting a driver could be socially stigmatised, potentially just as effective as a drink drive
ban. On the basis that cultural and social norms can affect societal behaviour, informal non-
legal sanctions could actually be just as powerful if not more so, than the formal legal factors
(Von Hirsch et al. 1999).
This suggestion is in contrast to the apparent lack of deterrence demonstrated by some
road users for offences which are not seen as serious, or are so widespread that they are almost
accepted as the social norm. One such offence is the use of mobile phones whilst driving. The
law in the UK changed in 2007, introducing penalty points and a £60 fine for the offence, which
saw a big drop in offending. Since then, offending has slowly risen again (Novis 2010), this
fact was noted by the Walter et al (2011) study in South London, prior to commencement of
their study, examining the effects of ‘Operation Radar’, a four week intensive traffic
enforcement operation. The operation hardly noticed any reduction in mobile phone offending

26
(or indeed seat belt infringements) during a prolonged enforcement campaign which saw some
marked reductions in speeding offences. ‘Operation Radar’ was well publicised, with some
noticeable effects, but it would appear that driving behaviour didn’t alter for the more minor
offences. This point has resonance for the City of London where regular enforcement activity
routinely targets the more minor offences. If planned campaigns in the future aim to target the
less serious infringements, altered driver behaviour and subsequent collision reduction may
not live up to the aspirations of policy makers.
Deterrence can be separated into the general and specific forms, the former relating to
the treatment of the public at large, the latter relating to the impact of penalties on those who
have endured them (Homel 1988). The question for the City of London is whether general
deterrence by virtue of overarching statute and laws can prevent offending, or whether
continued targeted enforcement with severe penalties has contributed towards any casualty
reduction by way of specific deterrence. It could be argued of course that a person may be pre-
disposed to certain behaviour which leads to collisions occurring, but additionally as a result
of their own direct and indirect experience with punishment (Stafford & Warr, 2006), in this
case road traffic sanctions. This study does not have any data in relation to driver behaviour,
post-intervention, hence whilst it remains an important point, it cannot be explored further in
this thesis.
Drivers, particularly speeding drivers, often do so regarding offending as an
‘occupational hazard’, without any real comprehension of the risks of being caught and
punished or the risks in causing or being involved with collisions (Scottish Office Central
Research Unit 1997). The Scottish study goes on to set out where confusion lies over
permissible levels of alcohol, belief that speed limits will only be enforced when a driver is a
certain percentage above the limit and confusion around the reasons for setting speed limits at
particular locations. This paper has already cited the importance of layering intervention

27
activity, including publicity and media as important component parts of successful targeting,
and this point is underlined in the Scottish paper, recommending a “range of complementary
measures to promote road safety”(Scottish Office Central Research Unit 1997, p.ix).
Transport for London alongside the City of London Corporation have recently
undertaken an extensive publicity campaign in the City, introducing a new 20mph speed limit,
to deter road users from unlawful excessive speeding. This statutory provision coupled with
the ‘Stop, Think, Live campaign’ has sought to ensure that the issue is at the forefront of road
users minds, by explaining the offence and setting out the penalties for infringements, before
they even start a journey (City of London Corporation 2014). The purpose being to drive home
the message that offending behaviour will be dealt with swiftly. An interesting take around this
idea has been explored in China where traffic infringements are stored against a drivers details,
only becoming punishable when the vehicle is taken in for annual checks (Lu et al. 2012). A
randomised control trial saw traffic violations drop by 14% in the treatment group when
offenders received a text regarding their traffic violations, the analysis supporting the notion
that offending behaviour can change if the transgressors are aware of it.
Routine Activity Theory
Offending behaviour can lead to the commission of crime when accompanied by
suitable targets and in the absence of capable guardianship (Cohen & Felson 1979), these
crimes could easily contribute towards collisions, highlighting those ending with serious or
fatal injuries. Routine activity theory requires three necessary conditions to be in place in order
for a crime to be commissioned (Akers & Sellers 2009; Cohen & Felson 1979) . The theory is
reliant upon the convergence of a motivated offender, a suitable target or victim along with the
absence of capable guardians of persons or property. One may assume that these component
parts would sit together exclusively in matters relating to conventional crime, but it could be
28
suggested that the theory will equally apply to traffic collisions, where motivated offenders
could also be victims.
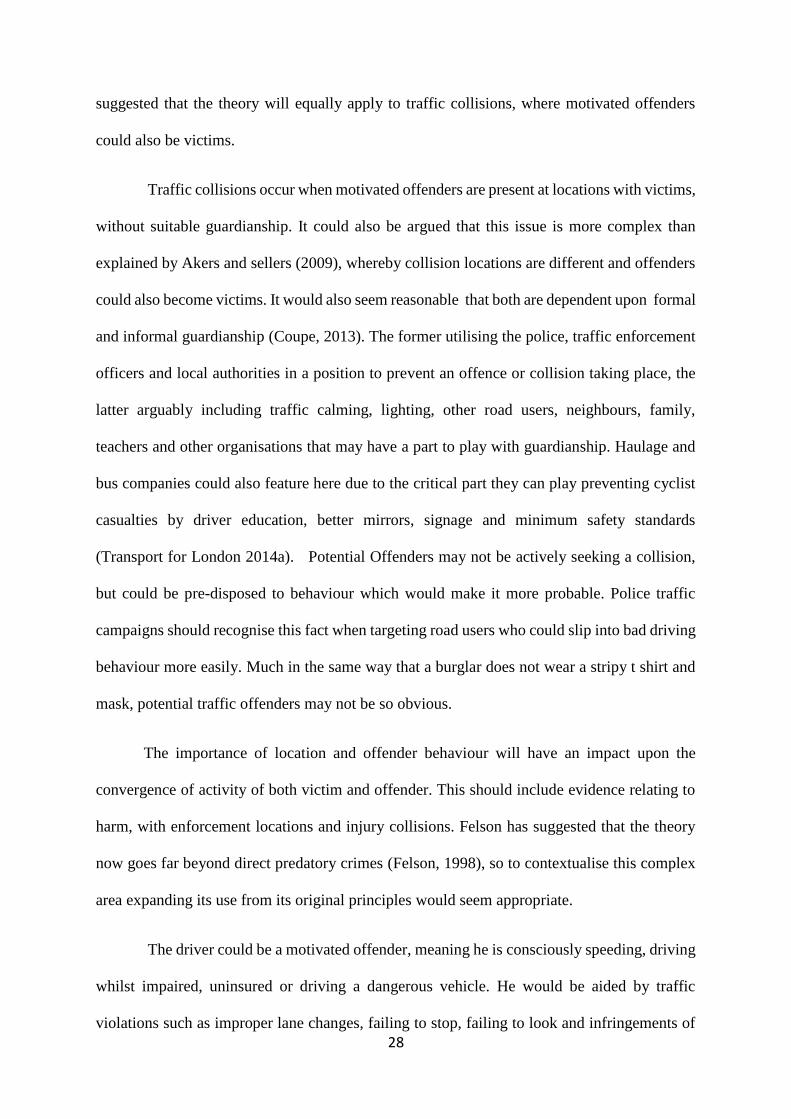
Traffic collisions occur when motivated offenders are present at locations with victims,
without suitable guardianship. It could also be argued that this issue is more complex than
explained by Akers and sellers (2009), whereby collision locations are different and offenders
could also become victims. It would also seem reasonable that both are dependent upon formal
and informal guardianship (Coupe, 2013). The former utilising the police, traffic enforcement
officers and local authorities in a position to prevent an offence or collision taking place, the
latter arguably including traffic calming, lighting, other road users, neighbours, family,
teachers and other organisations that may have a part to play with guardianship. Haulage and
bus companies could also feature here due to the critical part they can play preventing cyclist
casualties by driver education, better mirrors, signage and minimum safety standards
(Transport for London 2014a). Potential Offenders may not be actively seeking a collision,
but could be pre-disposed to behaviour which would make it more probable. Police traffic
campaigns should recognise this fact when targeting road users who could slip into bad driving
behaviour more easily. Much in the same way that a burglar does not wear a stripy t shirt and
mask, potential traffic offenders may not be so obvious.
The importance of location and offender behaviour will have an impact upon the
convergence of activity of both victim and offender. This should include evidence relating to
harm, with enforcement locations and injury collisions. Felson has suggested that the theory
now goes far beyond direct predatory crimes (Felson, 1998), so to contextualise this complex
area expanding its use from its original principles would seem appropriate.
The driver could be a motivated offender, meaning he is consciously speeding, driving
whilst impaired, uninsured or driving a dangerous vehicle. He would be aided by traffic
violations such as improper lane changes, failing to stop, failing to look and infringements of

29
protocols such as maintaining speed limits. Riskier behaviour could be fuelled by impairment,
tiredness, inattention, complacency or bad habits. Likewise this could also extend to vulnerable
road users: the pedestrian failing to look, stepping out from behind parked vehicles, jaywalking
or texting; or the Cyclist who doesn’t obey the same law as other road users by shooting through
red lights, failing to signal, cycling on the pavement and failing to wear high visibility clothing.
Conversely, all three could also switch to become suitable targets or victims, particularly the
latter two who would be more vulnerable than drivers of motor vehicles in this particular urban
setting.

30
Research Methods
Introduction
The method for the research is descriptive analysis. In order to answer the question of
whether enforcement locations (for operations) have been selected in line with evidence of
harm, secondary data was obtained from existing sources to explore any relationship between
targeted enforcement activity and collision harm. The bulk of the data in relation to injury
collisions was available through the STATS 19 information, submitted to the DfT by the City
of London Police.
Collision data was collected, ranging from April 2010 through to March 2012, with a
sample size of n=948 separate collisions. Enforcement data for the same time frame was
available and has been collected. There are no ethical reasons why the information could not
be collected and analysed. Once the data was cleansed and re-arranged; a City of London
Collision Harm Index (CoLCHI) score was attributed to each collision record and mapped to
each of the 22 enforcement locations, using a geo location tool within the ESRI mapping
system, where the sum of the collision harm was calculated for a 200 metre zone around each
enforcement site. It was then possible to map collision harm by location and by financial year,
using the year totals to rank the enforcement sites in descending order of CoLCHI, and
comparing them with enforcement locations that were selected for policing activity.
The initial round of CoLCHI scoring was completed by attributing the base value cost
for a collision (as set by the DfT and agreed by Government), by severity type, to the relevant
collision, and then summing the total for all collisions within a 200 metre radius of the centre
of the enforcement site. This initial analysis, whilst attributing a ‘harm’ score to the collision,
didn’t take into account how long ago the incident happened. This study seeks to test whether
current targeting practices are placing police resources in the right place to prevent collisions

31
from occurring. The temporal considerations, in particular, are a concern, because fatal
collisions attract a very high score: 8 times more harmful than collisions which cause serious
injury and 115 times more harmful than slight injury collisions. If no allowance is made in
relation to when a fatal collision occurred, a location could be shown as ‘red’ or ‘hot’ for some
time, which in turn could skew a targeting decision.
Given the concerns regarding the time factor, a further round of analysis was undertaken
using the relevant DfT base value for a collision, multiplied by time and distance variables, to
establish a more accurate and time sensitive harm analysis. This proximal collision harm index
approach looks back 12 months from a control month of April 2011, to compare the sites
selected for enforcement against those with the greatest proximal CoLCHI score. For example
two fatal collisions occurring in the last fortnight, should probably influence a targeting
decision tomorrow, while those which happened eleven months ago should be weighted
differently. The new time and distance calculated figures reflect the harm of the collision in
relation to its geographical distance from the centre of an enforcement location and in relation
to how long ago the collision occurred, before enforcement started at that relevant site.
The CoLCHI approach, firstly using base values in isolation, then base values
multiplied by time and distance variables, has allowed the study to signpost whether current
targeting was carried out in line with evidence of harm. The comparison between base value
calculations only, followed by time and distance modelling has been useful to demonstrate that
both concentrate on harm scoring; the latter arguably offers a more accurate method with which
to consider the elements of time and distance

32
City of London
The City of London is the most historic part of London, established in around AD50. It
remains the world’s leading financial centre with office workers outnumbering residents by 33
times. The residential population currently numbers a little under 10,000, with over 300,000
people coming into the City of London each day to work. Despite being only 1.1 square miles,
the City is served by 48 miles of road, which is tightly packed into a street system which has
changed little, in terms of size and layout, in hundreds of years. This ancient City presents
challenges when faced with a huge influx of vehicular and pedestrian traffic each day, co
habiting a limited space. Vehicle flow has reduced a little over the last five years in the City of
London but the current figures confirm over 62 million motor vehicle movements per annum
in the square mile and nearly 7 million pedal cycle movements (Department for Transport
2013b).
Collision reporting
All injury collisions are required by law to be reported to the Police (Anon 1988) under
section 170 of the Road Traffic Act 1988. Practically, this reporting can either be carried out
at the scene of a collision, by a police officer, or to a Constable at a police Station within 24
hours. The Standing Committee on Road Accident Statistics (SCRAS) provides the governance
for data collection nationally in the UK, overseeing the information recorded on the STATS 19
forms related to injury collisions. There are benefits with a common national standard, allowing
government bodies such as the DfT to prepare statistics and carry out research into road safety
matters. It additionally provides a tool for the police to inform tasking decisions assisting with
collision reduction targeting (Administrative Data Liaison Service 2014). The system is not
perfect and relies on accurate inputting of data, coupled with an objective view. In general
terms information stored directly by the relevant agency, in this case the STATS 19 data
submitted to the DfT by the City of London Police, will be higher in quality than peripheral

33
items (Robson 2011, p.361), however potential recording errors needed to be assessed during
data cleansing process.
The City of London Police will normally attend all reported injury collisions in their
jurisdiction. Police officers complete a collision report booklet, an example of which is shown
at appendix A. This booklet is the first port of call for reporting errors to be made, and hence a
supervisor has to examine the booklet for accuracy prior to its submission to the Criminal
Justice Unit (CJU). More problems could be initiated by the CJU clerk, who then transfers the
information onto the Collision Reporting System (CRS) system. The City of London road
safety manager then transfers all this information onto an MS Access database, prior to the
information being used to produce local statistics. Monthly data is then sent to the Metropolitan
Police, who report the figures to the Department for Transport (DfT).
DfT are then able to compile national statistics (STATS 19), however one can see that
there are potential hazards with accuracy, when using so many layers of reporting. The DfT
make specific comment around the strengths and weaknesses of the data in their latest quarterly
provisional estimates release : “ police data on road accidents (STATS 19), whilst not perfect,
remain the most detailed, complete and reliable single source of information on road casualties
covering the whole of Great Britain, in particular for monitoring trends over time” (Department
for Transport 2014b, p.8)
Data Collection, Assessment and Cleansing
All injury collision data for the two (financial) year period of April 2010 to March 2012
has been reviewed. These data have been overlaid across the 22 enforcement locations. The
data are quantitative and are able to be defined and delineated unambiguously, which will help
with any efforts to establish any correlation coefficient (Jupp, 1989).
Statistical data are available for a two (financial) year period, for both collisions and
enforcement, including the variables of known enforcement locations, time, day, casualty

34
type, mode of transport, ‘causation’ factors (in this case a road traffic not scientific term), along
with Global Positioning System (GPS) eastings and northings for both collisions and
enforcement locations. The latter were missing from a small number of collision records and
have been manually corrected. An example of the Excel data capture sheet is shown at appendix
B. Some of the 948 records examined were missing GPS coordinates, these records were
adjusted manually, and likewise a small number of collisions were categorised incorrectly
(slight, serious and fatal). These collisions were cross referenced with the CRS system,
applying a secondary check of examining the ‘comments’ field to ensure that the mistakes were
rectified. Once the data had been cleansed it was ready for further analysis.
In an attempt to measure enforcement outputs the number of fixed penalty notices
(traffic tickets) issued during enforcements were collected to establish the amount of activity
at each enforcement location. The TFL funded interventions are split broadly into the two areas:
education and enforcement. This study has concentrated primarily on those operations where
enforcement was delivered and fixed penalty notices issued. The selection of enforcement
locations, for analysis and the accuracy of their comparable data sets has been undertaken in
order to reflect ‘daily business’ as best as possible, in order for there to be sufficient confidence
around the internal validity of the study (Robson 2011, p.88).
A total of 23 enforcement locations were used for traffic interventions by the City of
London Police during the two year period of analysis. GPS eastings and northings were
obtained for all 23. This study has decided to omit one of these locations from the results:
Cheapside/Bank Junction, due to an analytical error which saw this site omitted from the
proximal CoLCHI calculations. Any comparison between base value and proximal models of
collision harm would therefore have been unequal in terms of enforcement site numbers; hence
the location has been disregarded.

35
Road safety tasking is decided on a monthly basis, and the resourcing requirement is
driven through the force tasking group, locations for activity and bids for officers are made for
educational and enforcement activity. In a typical month up to 8 locations are selected for
enforcement, along with a suggested period of days and times to deliver the interventions.
Between five and seven days are identified and selected each month. Enforcement officers then
record a master sheet detailing all outputs generated from these operations (primarily fixed
penalty notices), which is then submitted and recorded by the STOT team. Monthly
spreadsheets are prepared from the information provided by the STOT team. The data are
cleansed, by manual corrections, and the outputs verified as having been completed and
submitted for the days and dates and times in question.
Initial examination of the enforcement data showed that interventions were not
consistently delivered at each of the 8 monthly selected sites, with the majority of months
seeing verified enforcement activity across only a selection of the locations. Any location
without any measurable enforcement outputs recorded against it has an assumption that no
intervention was delivered there that month. Other categories for this study include: site not
selected for enforcement that month and site selected with measurable outputs. Table 2 shows
5 of the selected 8 enforcement locations for the month of July 2010. The grey shaded area
represents the days selected by the STOT team to deliver enforcement for that particular month.
The numbers within the table relate to numbers of tickets issued at the relevant time and day:

36
TABLE 2 INDICATION OF ENFORCEMENT ACTIVITY RECORDED JULY 2010
It is clear, as a result of the initial analysis that some high harm collision locations were
not subject to any enforcement. 11 of the 22 enforcement locations didn’t receive any
intervention activity at all in 2010/11, and 7 of those 11 received limited enforcement during
2011/12. Data are examined from April 2010 up to and including March 2012, after which
policing activity was heavily influenced by the London Olympics. The enforcement activity
during this former timeframe was delivered exclusively by roads policing personnel, as
opposed to officers from a variety of frontline units, reducing the chance of inconsistency and
providing confidence for this thesis around dependable operational delivery (Bachman &
Schutt 2010, p.107).
Jul-10
07
:00
-10
:00
07
:00
-14
:00
07
:30
-09
:30
08
:00
- 1
0:0
0
14
:00
-20
:00
15
:00
- 1
7:0
0
18
:00
-20
:00
07
:00
-10
:00
07
:00
-14
:00
07
:30
-09
:30
08
:00
- 1
0:0
0
14
:00
-20
:00
15
:00
- 1
7:0
0
18
:00
-20
:00
07
:00
-10
:00
07
:00
-14
:00
07
:30
-09
:30
08
:00
- 1
0:0
0
14
:00
-20
:00
15
:00
- 1
7:0
0
18
:00
-20
:00
07
:00
-10
:00
07
:00
-14
:00
07
:30
-09
:30
08
:00
- 1
0:0
0
14
:00
-20
:00
15
:00
- 1
7:0
0
18
:00
-20
:00
07
:00
-10
:00
07
:00
-14
:00
07
:30
-09
:30
08
:00
- 1
0:0
0
14
:00
-20
:00
15
:00
- 1
7:0
0
18
:00
-20
:00
1st2nd
3rd
4th
5th 4 3 1 3 5 1 2 1 1 1 1
6th 2 1 1 2 2 2 1 2 3 1
7th 2 3 1 2 1 2 1 2 3
8th 3 1 1 1 1 1 3
9th 2 1 1 2 2 1 1 1 1
10th
11th 1
12th 2 3 1 1 3 1 1 1 1 3 1
13th 3 2 2 1 1 1 2 2 1
14th
15th
16th
17th
18th
19th
20th
21st
22nd
23rd
24th
25th
26th
27th
28th
29th
30th
31st
1. North area Bishopsgate
Middlesex Street
2. West area Fleet St J/W Ludgate Circus 3. West area Holborn Circus 4. South Area, Upper Thames Street
Southwark Bridge cycle super highway
5. West Area Fleet Street J/W Fetter
Lane
37
Analysis Methodology – City of London Collision Harm Index (CoLCHI)
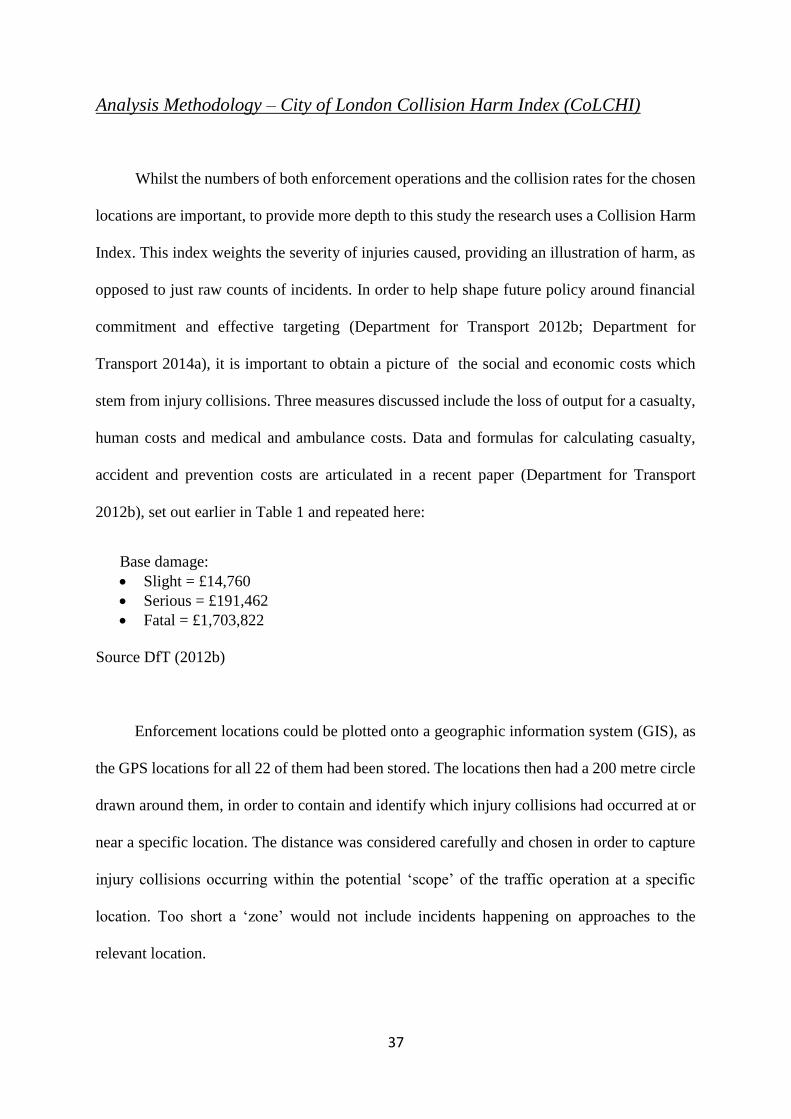
Whilst the numbers of both enforcement operations and the collision rates for the chosen
locations are important, to provide more depth to this study the research uses a Collision Harm
Index. This index weights the severity of injuries caused, providing an illustration of harm, as
opposed to just raw counts of incidents. In order to help shape future policy around financial
commitment and effective targeting (Department for Transport 2012b; Department for
Transport 2014a), it is important to obtain a picture of the social and economic costs which
stem from injury collisions. Three measures discussed include the loss of output for a casualty,
human costs and medical and ambulance costs. Data and formulas for calculating casualty,
accident and prevention costs are articulated in a recent paper (Department for Transport
2012b), set out earlier in Table 1 and repeated here:
Base damage:
Slight = £14,760
Serious = £191,462
Fatal = £1,703,822
Source DfT (2012b)
Enforcement locations could be plotted onto a geographic information system (GIS), as
the GPS locations for all 22 of them had been stored. The locations then had a 200 metre circle
drawn around them, in order to contain and identify which injury collisions had occurred at or
near a specific location. The distance was considered carefully and chosen in order to capture
injury collisions occurring within the potential ‘scope’ of the traffic operation at a specific
location. Too short a ‘zone’ would not include incidents happening on approaches to the
relevant location.

38
A GIS ‘near’ tool was used, calculating the GPS locations for each collision and
compiling a list of collisions occurring within a 200 metre distance, for each of the 22
enforcement locations. A number of options were considered with which to capture collision
information, relative to specific enforcement sites, including grid sectorisation or manual
selection of streets surrounding the relevant sites. This thesis suggests that a consistent
methodology be used for each enforcement site, so that each location can be awarded a CoLCHI
score, being the sum of all collisions and their harm rating. In order to compare the sites, the
geographic footprint should be exactly the same for all 22.
Crime mapping has been used extensively for a number of years, concentric circles
being used to ‘zone’ activity, which in turn highlights spatial distribution of crime, alongside
any social indicators (Bachman & Schutt 2010, p.340). This study seeks to identify a similar
distribution of collision harm: the geographic context with proximity to enforcement locations
is important in order to test whether the locations chosen for enforcement are also those with
the greatest harm scores. These circular zones appear to be a suitable method with which to
map the spatial distribution of collisions, relative to the centre of the site.
There are currently 23 traffic enforcement locations which are regularly used in the
City of London (22 of which are examined in this study). Figure 1 below illustrates the
locations and interconnectivity of these locations within the City of London. The centre of each
location is depicted by the police car surrounded by concentric circles; the outer circle of each
represents the 200m zone. Personal Injury data from April 2010 through to March 2012 has
been overlaid onto the map in order to demonstrate the spread of these events across the City.

39
FIGURE 1 ENFORCEMENT LOCATIONS AND PERSONAL INJURY COLLISIONS 2010 TO 2012
Each of the 22 enforcement sites has been analysed for the months from April 2010 to
March 2012. Base values have been applied (Department for Transport 2012b) to each injury
collision within each locations 200 metre enforcement zone. Where a collision is shown within
the 200m zone of more than one site, its score has been attributed to each one, on the basis that
its presence is relevant to each of the areas when weighting the collision harm score for
individual sites. The sum of all injury collisions within the zone provides a CoLCHI score for
that enforcement location for that month, which can then be summed for the year. Each site
examined on this basis for month to month comparison, additionally using the sum of all
months to determine the yearly CoLCHI score for the relevant site. A snapshot example is
displayed at Table 3 below, showing the scoring for 6 of the enforcement sites for a selected
period of 16 months. The blue graduated data bars indicate where the scoring is highest.

40
TABLE 3 SNAPSHOT OF COLCHI SCORING 6 SITES 16 MONTHS
The 22 enforcement locations are ranked in order of highest to lowest CoLCHI score
for each month. The top 8 sites in terms of collision harm will then be compared to the actual
8 sites chosen that month for enforcement, to establish whether the targeting decisions were
made in line with actual collision harm. A percentage calculation will show where the greatest
percentage of harm sits on a yearly basis. A yearly sum of each site score can be used to provide
a more meaningful total going forwards, whereby on the first of each month the sum of the
previous twelve months ranked scores can be assessed to enable targeting decisions to be made.
Further analysis will show which of the chosen enforcement locations actually delivered
intervention by issuing fixed penalty notices, and whether these sites were amongst those with
the greatest collision harm. This part of the analysis will be depicted on a scatter plot.
Bis
ho
psg
ateB
etw
een
Cam
om
ileSo
uth
East
Are
aAld
gate
Hig
hSt
reet
East
Are
aAld
gate
Hig
hSt
reet
Fen
chu
rch
StA
nd
Lead
enh
allS
t
East
Are
aEas
tch
eap
_JW
_Lo
nd
on
Bri
dge
Gra
cech
urc
hSt
reet
Bis
ho
psg
ate
Kin
gStC
hea
psi
deP
ou
ltry
A B C D E F
2010 April 0 0 14760 14760 0 14760
2010 May 220982 0 220982 44280 44280 220982
2010 June 14760 29520 29520 14760 14760 235742
2010 July 44280 0 29520 14760 0 0
2010 August 206222 0 0 59040 206222 14760
2010 September 0 0 0 29520 0 14760
2010 October 14760 29520 29520 29520 44280 29520
2010 November 29520 29520 14760 206222 29520 14760
2010 December 0 29520 29520 14760 0 191462
2011 January 29520 14760 14760 206222 14760 14760
2011 February 44280 29520 29520 14760 0 0
2011 March 0 0 14760 44280 382924 44280
2011 April 0 14760 29520 0 0 220982
2011 May 29520 0 29520 235742 0 220982
2011 June 0 29520 14760 44280 0 0
2011 July 412444 191462 603906 0 14760 412444

41
Fatal collisions involve enormous costs that are orders of magnitude larger than other
collisions, including those which involve serious injury. These fatal collisions, will inevitably,
push the scoring to an exceptionally high level, resulting in an enforcement location remaining
‘hot’ over the course of a twelve month rolling analysis. Targeting decisions could
subsequently be adversely affected. Consideration was given during this study to classifying
fatal collisions as serious (in terms of a CoLCHI score), in order that the enormous spikes in
collision harm, attributed as a result of these events, can be evened out whilst still capturing
the seriousness of the event. This consideration, however, would ignore the figures and
methodology set out in the literature, used to calculate the financial cost of these traumatic
events, hence this musing has been discounted.
Targeting decisions made tomorrow arguably need to give increased weight to events
that have occurred in the recent past. A fatal collision happening 11 months ago will keep an
enforcement location ‘glowing red’ throughout the year, with its relevance (for tasking)
arguably dissipating with the passage of time. It is for this reason that this thesis will argue that
a CoLCHI should include a reference to when the collision occurred. Collisions happening in
the recent past should attract a higher weighting than those occurring in the more distant past.
In order to test whether our enforcement locations are the right ones, each collision should also
be weighted in relation to its proximity to the centre of the chosen location: reducing in
weighting the further out from the centre it is recorded. This study therefore additionally
examines a 12 month period, pre April 2011, in order to establish whether a 12 month time and
distance formula will provide a more meaningful collision harm scoring with which to inform
targeting decisions.

42
Time and Distance Collision Harm Calculation
The time and distance CoLCHI is calculated using the following formula:
CoLCHI = ∑ base damage x geographic distance coefficient x temporal distance coefficient
Base damage: (Source DfT, 2012b)
Geographic distance coefficient:
Collision’s distance from centre of enforcement location:
0-50m = 1.0
50-100m = 0.75
100-150m = 0.50
150-200m = 0.25
These distances are a straight line distance from a given centre point (the enforcement
location). As all injury collisions and enforcement locations contain accurate mapping
coordinates, geometry based analysis selects and classifies collision events appropriately.
Figure 2, below, shows how a geometry based selection was used to select four casualty events
that are between 150-200 metres from the enforcement location (centre point).The inner ring
of the ‘target’ represents the centre of the enforcement location. The graduated dots represent
collisions. These selected points are then given a ‘geographic distance’ classification of ‘0.25’.
The same process is conducted for events at 150-100, 100-50 and 50-0 metres and classified
0.50, 0.75 and 1.00 respectively. Figure 2 shows 5 slight injury collisions; four sit in the 150-

43
200 metre zone with one in the 50-100 metre zone at Gresham Street. This particular collision
attracts a higher score as it is closer to the centre of the enforcement location:
∑ £14,760 x 0.75 (geographic score) x 0.2 (temporal score) = £2214. By way of comparison
the slight injury collision at Ironmonger Lane attracts a lower score as it is further away from
the centre:
∑ £14,760 x 0.25 (geographic score) x 0.3 (temporal score) = £1107
FIGURE 2 GEOGRAPHIC DISTANCE COEFFICIENT AT AN ENFORCEMENT LOCATION

44
Temporal distance coefficient:
Every injury collision contains a date record, used to generate a date score for each event. The
date scores are based around a control date (01 April 2011), being the point succeeding twelve
months analysis, and key for indicating which locations would have been optimal for targeting
in April 11. As the injury collision date increases further away in time (prior to April 2011)
from the control date the temporal distance score decreases. For simplicity, the sample data
represents 12 months pre control date (total 12 month sample). Also to aid the calculation
process, the 12 month sample was divided into 10 time envelopes, each of 36 days, with each
time envelope diminishing by 0.1 as it moves further from the control date. Figure 3 below
illustrates the time envelopes and associated scores:
FIGURE 3 TIME ENVELOPES AND COLCHI SCORING
The ESRI arc mapping Global Information System (GIS) tool was used in order to
calculate the CoLCHI score for each injury collision at each enforcement location. The
mapping platform used location scores calculated for geographic distance, and then a date score
for temporal distance, subsequently multiplied by the base damage figure, resulting in a
collision harm index total score for each event, summed to provide a total for the site. Whilst
the sum of scores for the relevant site provides a measure of harm, when compared against her

45
locations, visual symbols are used to demonstrate not only the location of the collision but the
magnitude of harm.
Proximal calculations and graduated symbol mapping
Example Using the Control Point of 1/4/11 and displayed in Figure 4:
Serious Collision 30/09/10 at Ludgate Circus. This particular collision is centred in the middle
of the enforcement site thereby attracting a full geographic score of 1. It occurred in September
some seven months before April 2011, thus attracts a temporal multiplier of 0.5:
∑ £191,462 x 1.0 (geographic score) x 0.5 (temporal Score) = £95,731
Compare this to the serious injury collision displayed as a red dot which is away from the
centre of the enforcement location but occurs on 28/10/10, a more recent collision, and the
reduction in harm score because of distance is clear.
∑ £191,462 x 0.25 (geographic score) x 0.6 (temporal score) = £28,719

46
FIGURE 4 GRADUATED SYMBOL MAPPING AT LUDGATE CIRCUS
Each of the 22 sites has a sum of all incidents CoLCHI score displayed within the
individual mapping for the relevant enforcement location, a small number of maps will be used
to depict location scoring and the spread of harm. Mapping visually demonstrates, through
graduated symbols, exactly where the greatest harm occurs within the 200 metre zone of that
site for the twelve month period. The bigger the symbol, the greater the harm score.
Sites will be ranked from 1 to 22 in relation to their CoLCHI score and can then be
compared against the sites which were actually chosen for enforcement in April 2011.
Additional analysis will compare the non-proximal CoLCHI scores with the time and distance
CoLCHI scores for the same year, in order to establish whether there would have been any
change in targeting decisions between both approaches. It should be noted that the theory of
applying temporal and geographic decay to accurately articulate collision harm, is new and
previously untested. This study provides an opportunity within which to test this approach,

47
comparing the new proximal theory and formula to raw collision counting and un-decayed
CoLCHI values.
Enforcement data will be compared against the highest scoring sites in order to examine
whether fixed penalty tickets were issued at the sites with the greatest harm.

48
Findings
Introduction
In order to answer the research question: “Have enforcement locations (for operations)
been selected in line with evidence of harm”? Careful selection and subsequent analysis of the
relevant data have been essential, providing results which are tangibly linked to this study. All
injury collisions recorded between April 2010 and March 2012 were subject of analysis. A GIS
tool was able to identify the injury collisions within a 200 metre radius of each of the 22
enforcement sites. The total number included in the dataset was n=948. Relevant Department
for Transport harm values, for injury prevention (Department for Transport 2012a; Department
for Transport 2012b), were applied to each injury collision. This allocation of ‘injury value’
provides the basis of the City of London Collision Harm Index (CoLCHI):
Slight = £14,760
Serious = £191,462
Fatal = £1,703,822
Source DfT (2012b)
The CoLCHI scores for each enforcement site were summed providing monthly and
yearly totals which were ranked, providing an ‘at a glance’ indication of high scoring sites.
This showed, for example, that enforcement site ‘O’ was ranked as the number 1 site for three
monthly occasions during 2010/11 and three times again in 11/12. Despite exhibiting such high
levels of collision harm, this particular site was chosen to deliver enforcement only once during
the entire two year period of analysis. Percentage analysis shows this particular site carried
14% of the total collision harm for the year 2010/11, the highest for any site, and 7.42% of the
total value in 2011/12.

49
Whilst useful to provide a monthly snapshot of collision harm scoring, it is evident that
using just the base value for fatal collisions (£1.7m) will elevate the CoLCHI scoring to
extremely high levels. February 2012 saw enforcement site ‘M’ record two fatal collisions in
one month, attracting a monthly CoLCHI score of £3,451,924: 87.63% of the total collision
harm for all 22 sites that month. Whilst the high score should arguably inform traffic
enforcement targeting decisions, in this case the location was not chosen the following month
for targeted enforcement. However it was chosen 9 times prior to February 2012 for
enforcement activity when the scoring was much lower.
High CoLCHI scoring in one month will not necessarily take account of previous
monthly scores for the same location, if each month is analysed in isolation. Using this
example, site ‘M’ recorded three months with a CoLCHI score of 0, immediately prior to
February 2012. Analysis examining only the base-CoLCHI suggests that sites were selected
for enforcement seemingly on the basis of convenience for the police, as opposed to being
correlated to where the collision harm is greatest. Base value collision harm calculations
demonstrate the extent of collision harm within the 200 metre zone of an enforcement location
by displaying a numeric ‘cost’ value for each injury collision. These values are then summed
providing a total for that location for the given time period, in this case by month then year.
This study has additionally analysed 12 months collision data pre April 2011, using a base
value multiplied by time and distance variables. The calculation used for this proximal
modelling is:
CoLCHI=∑ base damage x geographic distance coefficient x temporal distance coefficient
The enforcement locations were then ranked using these CoLCHI scores: monthly and
yearly for the base value model, and yearly totals for the proximal. The yearly rankings provide
an opportunity to compare the two differing models. Each enforcement site has a sum of
collision harm value against it for the year, taking into account the time and distance

50
calculations for each injury collision event. A fairly clear picture became apparent, utilising the
ESRI GIS tool graduated symbol mapping, where scores were grouped into ordered classes,
each class assigned a graduated symbol and displayed smallest to largest. Simply put, the larger
the circle on the map, the greater the collision harm score; illustrated in Figure 6 later in this
section.
12 months analysis, using the proximal CoLCHI model, showed yearly scores ranging
from £5,904 up to over £371,304. The time and distance scoring saw lower totals than the ‘raw’
base value calculations alone, due to the decaying effects of the time and distance variables.
These adjustments to the formula effectively provided a reduction to the base value score,
dependent upon the injury collisions’ proximity in time and space relative to the control date
of April 1st 2011.
The 8 sites selected for enforcement in April 2011 had 48% less collision harm scoring
than the actual top 8. The latter having on average 2.9 times more CoLCHI scoring than the
average location in the bottom 14 ranked locations. This difference is demonstrated later in this
section in Figure 14. The analysis shows if the proximal CoLCHI was averaged across all 22
sites ,using the time and distance modelling, each site would receive 1/22 of total harm; any 8
having 8/22 or 36%, as opposed to the 33.7% the selected 8 sites actually carried. Thus even a
random selection of enforcement sites, whilst not being evidence based, would have
represented slightly better targeting than the system actually used.

51
Base Value Only Collison Harm Index Scoring and Ranking
Two years secondary data was analysed from April 2010 through to March 2012,
including n=948 injury collision events which were used to establish CoLCHI scores for the
collisions themselves, along with scores for the 22 enforcement sites. The GIS ‘near tool’
selected every injury collision within the 200 metre zone of each of the 22 enforcement
locations. The key for these locations is attached at Appendix C. Each collision was then
allocated a base value, based upon the Department for Transport (DfT) figures for collision
prevention costs.
Table 4, below, shows the financial year 2010/11 (April 2010 through to March 2011).
Each enforcement site is indicated by an alpha symbol. The blue graduated data bars visually
demonstrate the extent of scoring for the year, with site ‘O’ showing the highest CoLCHI score
for the year 2010/11 with £1,930,216: 14.01% of the total collision harm score for the year, as
opposed to the 4.5% (i.e., 1/22) that would occur if collision harm were distributed evenly
across all locations. Noticeably a number of enforcement sites recorded duplicate figures,
highlighted particularly in April 2010, where 7 of the 22 sites recorded slight injury collisions
(base value= £14,760).

52
TABLE 4 BASE VALUE COLCHI SCORES ALL LOCATIONS 2010/11
The number of duplicate entries means that certain sites will be ranked alongside each
other for monthly comparison. The figures naturally begin to separate as the year progresses
and more collisions are added. The ends of year totals demonstrate this separation, where there
is a far clearer picture of collision harm by site over a 12 month period. Individual events at
serious and particularly fatal categorisation pushed monthly and yearly totals up markedly.
Arguably, this situation is exactly the purpose of the index; demonstrating peaks of harm to
inform targeting decisions.
Further high scoring can be seen in Table 5, demonstrating the prominence of fatal
collision scoring in February 2012, where two fatal injury collisions within the scope of
enforcement site ’M’ elevated the monthly CoLCHI score to £3,451,924 (highlighted in red):
87.63% of the total collision harm scoring across all 22 sites and contributing to the greatest
CoLCHI score for the year with 22.05% of the total collision harm.

53
TABLE 5 BASE VALUE COLCHI SCORES ALL ENFORCEMENT LOCATIONS 2011/12
The yearly totals have not seen duplicated rankings in the same way as the monthly
analysis, with monthly variation producing more accurate results which have less variability
from sample to sample (Rumsey 2011, p.267). The monthly totals have been ranked for both
years of analysis, demonstrating those enforcement sites that appear regularly near the top of
the classification tables. Table 6 confirms the amount of duplication with monthly scores,
represented by tied ranking values in this 2010/11 analysis. This table includes those sites
ranked first, actually being duplicated for 3 of the 12 months shown. The horizontal columns
help to show the sites graded as highest on more than one month throughout the year (‘A’, ‘H’
and ‘O’).

54
TABLE 6 ENFORCEMENT SITES IN RANK ORDER BY MONTH 2010/11
Yearly CoLCHI figures will, arguably, provide a more accurate method of analysing
collision harm hot spots. Trends over time can be analysed, taking into consideration traffic
flow and engineering changes which can, in turn, be compared with previous years’ statistics
and context (Department for Transport 2013a). The second year analysis (2011/12) saw a rise
in the overall CoLCHI score for all 22 locations summed for the year:
2010/11 = £13,781,372
2011/12 = £20,665,688
This rise represents a 49% increase in overall CoLCHI score for 2011/12, when
compared to 2010/11, best displayed in Figure 5, where the effect of 2 fatal collisions, in
February 2012, at location ‘M’ is clearly visible. It should be noted, however, that 15 of the 22
enforcement locations, depicted on the x axis, saw increases when compared to the previous
year, so it would be wrong to assume the yearly upsurge emanated exclusively from these fatal
events. Such a marked rise in collision harm over the year 2011/12 raises the question as to the
April May June July August SeptemberOctober NovemberDecemberJanuary February March
A 14 1 12 6 1 14 14 7 15 6 3 15
B 14 16 7 14 17 14 8 7 9 11 6 15
C 7 1 7 9 17 14 8 11 9 11 6 12
D 7 4 12 11 4 6 8 1 11 4 9 5
E 14 4 12 14 1 14 4 7 15 11 15 1
F 7 1 3 14 12 9 8 11 2 11 15 5
G 14 16 20 14 17 14 19 14 15 6 15 15
H 7 16 6 1 17 9 14 14 1 19 9 15
I 7 16 20 14 17 4 19 14 15 11 15 9
J 3 4 7 4 12 14 19 14 15 5 1 12
K 14 11 12 14 12 9 14 14 15 19 15 15
L 14 16 12 1 17 9 14 14 15 19 15 15
M 4 4 7 5 12 5 14 11 8 6 2 9
N 1 9 2 14 7 6 8 3 2 11 3 3
O 2 4 1 6 6 1 4 7 2 1 9 4
P 14 11 20 9 12 14 8 14 2 6 15 12
Q 7 11 4 11 7 14 4 5 2 2 9 9
R 14 16 12 11 7 6 4 14 2 2 15 2
S 7 9 12 14 4 2 2 3 11 11 9 15
T 4 11 12 14 7 2 1 2 11 6 6 5
U 14 11 4 6 3 14 19 14 15 19 9 15
V 4 16 7 1 7 9 3 5 11 11 3 5
FY 2010/11

55
effectiveness of targeting decisions for police intervention as it would appear, from the
analysis, that traffic enforcement was not focused where the collision harm was greatest.
FIGURE 5 TWO YEAR ENFORCEMENT SITE COLCHI RANKING
Yearly totals, therefore, seem to provide a more holistic view of the enforcement
locations’ ‘harm’ rating and certainly see less duplication, which is present when conducting
monthly stand-alone analysis. The financial value attributed by fatal collisions can push an
enforcement locations CoLCHI scoring to very high levels, which should be kept in mind when
making subsequent targeting decisions. The ranking described previously in Table 6
demonstrates stand-alone monthly snapshots, showing that enforcement locations are rarely
ranked as highest scoring consistently throughout the year. Rolling years data would provide a
more accurate and contextual figure with which to make targeting choices. The next section
will examine targeting decisions, in order to establish whether there was any correlation
between collision harm and intervention delivery.
13
5
1918
17
9
1111
9
8
6
3
22 21
9
2020
15
4
13
21 19
15
22
16
1
2
2
1
4
18 16
4
17
712
12
7
8
10
14 14
3
6
0
500000
1000000
1500000
2000000
2500000
3000000
3500000
4000000
4500000
5000000
Co
llisi
on
Har
m S
core
Financial Year CoLCHI Value Ranked
A B C D E F G H I J K L M N O P Q R S T U V

56
Correlation of enforcement activity to collision harm
This study examined traffic enforcement data over the two financial year period from
April 2010 to March 2012. A total number of 2620 fixed penalty notices (traffic tickets) were
issued to road users during enforcement operations funded by Transport for London. 1033
tickets were issued during 2010/11 and 1587 during 2011/12, the latter year showing a 56.6%
increase. The monthly occasions and locations selected for enforcement activity was not linked
to where the collision harm was the greatest. The highest ranking CoLCHI location was
selected for enforcement only four times in the 24 month analysis, twice in each year.
The values in Table 7 provide the harm ranking of each enforcement site, also
demonstrating the position of a number of sites never being selected for enforcement, despite
them ranking as the highest monthly CoLCHI location, indicated by the unshaded cells of the
table. Notably sites: ‘C’, ‘D’, ‘E’, ‘F’, and ‘H’, ‘N’ and ‘O’. Sites: ‘A’, ‘Q’, ‘R’ and ‘S’,
likewise were ranked at either position 1 or 2, for individual months, but received little or no
targeted traffic intervention activity throughout the year. The green shaded boxes in Tables 8
and 9 show that some enforcement locations were selected but failed to deliver any intervention
at all. This lack of activity occurred 25 times throughout the year 2010/11 and 37 times in
2011/12, an increase of 48%.

57
TABLE 7 SITES SELECTED FOR ENFORCEMENT 2010/11
Targeting decisions during the second year are spread more equitably, as per Table 8,
but despite this change, it is clear that enforcement locations with the highest CoLCHI score
are still not being selected for focused traffic enforcement in line with collision harm scoring.
Notably, site ‘M’ recorded an exceptionally (caused by the rare occurrence of two fatal
collisions) high score in February 2012 (£3,451,924), but was not selected for traffic
enforcement the following month. Conversely, this site did receive enforcement activity for 9
of the months prior to February 2012, when the scoring was considerably lower. December
was not chosen for traffic enforcement in either year, due to the competing policing demands
of the Christmas crime campaigns.
April May June July August SeptemberOctober NovemberDecemberJanuary February March
A 14 1 12 6 1 14 14 7 15 6 3 15
B 14 16 7 14 17 14 8 7 9 11 6 15
C 7 1 7 9 17 14 8 11 9 11 6 12
D 7 4 12 11 4 6 8 1 11 4 9 5
E 14 4 12 14 1 14 4 7 15 11 15 1
F 7 1 3 14 12 9 8 11 2 11 15 5
G 14 16 20 14 17 14 19 14 15 6 15 15
H 7 16 6 1 17 9 14 14 1 19 9 15
I 7 16 20 14 17 4 19 14 15 11 15 9
J 3 4 7 4 12 14 19 14 15 5 1 12
K 14 11 12 14 12 9 14 14 15 19 15 15
L 14 16 12 1 17 9 14 14 15 19 15 15
M 4 4 7 5 12 5 14 11 8 6 2 9
N 1 9 2 14 7 6 8 3 2 11 3 3
O 2 4 1 6 6 1 4 7 2 1 9 4
P 14 11 20 9 12 14 8 14 2 6 15 12
Q 7 11 4 11 7 14 4 5 2 2 9 9
R 14 16 12 11 7 6 4 14 2 2 15 2
S 7 9 12 14 4 2 2 3 11 11 9 15
T 4 11 12 14 7 2 1 2 11 6 6 5
U 14 11 4 6 3 14 19 14 15 19 9 15
V 4 16 7 1 7 9 3 5 11 11 3 5
Location Chosen and FPN Issued
Location Chosen and No FPN Issued
FY 2010/11

58
TABLE 8 SITES SELECTED FOR ENFORCEMENT 2011/12
Tables 7 and 8 demonstrate that current targeting is at best sporadic, particularly evident
for 2010/11. The highest scoring enforcement locations were only selected for targeting during
the subsequent month on 2 occasions in 2010/11 (‘L’ in July and ‘T’ in October). It was slightly
higher in 2011/12, when top scoring sites were selected for enforcement 3 times, although on
2 of these occasions no enforcement was actually delivered (‘U’ in June [no enforcement], ‘A’
in December and ‘D’ in January [no enforcement]). Enforcement was, however, delivered to
selected sites 58 times in 2010/11, and 54 times in 2011/12.
Location April May June July August SeptemberOctober NovemberDecemberJanuary February March
A 14 6 11 6 2 4 5 3 1 5 11 8
B 10 15 5 10 9 11 13 18 15 11 14 8
C 7 6 7 1 14 16 16 5 9 8 11 12
D 14 1 3 16 4 8 10 8 2 1 14 4
E 14 15 11 12 1 4 2 12 3 8 14 6
F 3 2 11 6 9 11 3 3 5 8 3 12
G 14 9 11 16 14 16 18 18 15 11 14 8
H 14 15 5 12 14 8 21 14 15 11 14 12
I 14 15 7 16 7 16 8 14 5 3 6 12
J 14 9 11 12 14 8 8 8 15 11 6 3
K 5 15 11 11 20 16 18 18 9 11 11 12
L 14 15 7 16 20 11 21 14 15 11 14 12
M 14 6 3 4 5 2 5 18 15 11 1 5
N 4 2 7 4 5 11 3 2 5 3 3 12
O 1 4 11 12 9 1 1 8 3 11 6 12
P 10 9 11 16 9 16 16 1 15 11 14 7
Q 5 5 11 16 14 11 10 6 9 2 9 12
R 10 9 11 9 7 16 5 6 9 11 14 12
S 7 9 2 3 14 3 10 14 5 5 2 2
T 7 9 11 6 9 7 13 12 9 5 3 1
U 10 15 1 16 20 16 18 18 15 11 9 12
V 2 15 11 2 3 6 13 8 9 11 14 8
Location Chosen and FPN Issued
Location Chosen and No FPN Issued
FY 2011/12

59
The scatter plots shown at Figures 6, 7 and 8 show at a glance where there was a
correlation between enforcement activity and high collision harm scores. Each month has 22
symbols, representing the relevant enforcement location. If enforcement was commensurate
with (high) CoLCHI scoring the scatter plots would show the red diamonds higher up the
charts. These red diamonds indicate where a location was selected for enforcement which was
subsequently delivered. In Figure 6, June ‘10 and January ‘11 show this to be the case, but a
large number of blue crosses, i.e. sites that were not selected for intervention are evident across
the chart. The green crosses indicate the locations chosen where enforcement was not delivered
and notably the vast majority of these sit below the CoLCHI score of £100,000, demonstrating
that, regardless of whether enforcement was delivered or not, targeting decisions have not been
made in relation to collision harm.
FIGURE 6 ENFORCEMENT CORRELATION SCATTERPLOT 2010/11

60
The previous subsection identified the effect that a fatal injury collision can have upon collision
harm scoring. Figure 7 demonstrates this extreme high outlier score in February ’12, and shows
this location was not chosen for enforcement activity.
FIGURE 7 ENFORCEMENT CORRELATION SCATTERPLOT 2011/12

61
Figure 8, below, has redacted these events in order that a clearer picture of the spread of
enforcement activity compared against collision harm scores, can be seen.
FIGURE 8 ENFORCEMENT CORRELATION SCATTERPLOT 2011/12 (2)
Collision and Enforcement Time Analysis
Time analysis was conducted in order to establish whether enforcement is being
delivered commensurate with injury collision events. Two years’ injury collision data appear
in Figure 9 showing that peak times are (probably unsurprisingly for a city centre) mornings
and evenings. This study will not delve further into the breakdown of which vulnerable road
user groups are being injured at specific times, but suffice to say that enforcement should
ideally correlate to not just the correct location at the right time, but should also identify which
road users are more at risk at that particular time. This thesis has already identified that collision
harm scores and traffic enforcement activity (by output) for 2011/12 increased by 49% and
56% respectively when compared to 2010/11.

62
FIGURE 9 INJURY COLLISIONS BY TIME OF DAY 2010 TO 2012
Figures 10 and 11 show the majority of this traffic enforcement activity took place at
the right time, when compared to injury collisions in Figure 9. Whilst enforcement outputs
increased during 2011/12, the collision harm also increased, by a similar percentage. It should
be noted that the three fatal events over the two year period all occurred during the lunchtime
hours.
0
20
40
60
80
100
1200
0:0
0
01
:00
02
:00
03
:00
04
:00
05
:00
06
:00
07
:00
08
:00
09
:00
10
:00
11
:00
12
:00
13
:00
14
:00
15
:00
16
:00
17
:00
18
:00
19
:00
20
:00
21
:00
22
:00
23
:00
Personal injury collisions from April 2010 to March 2012 by time and severity.
Slight
Serious
Fatal

63
FIGURE 10 TRAFFIC ENFORCEMENT BY TIME OF DAY 2010/11
FIGURE 11 TRAFFIC ENFORCEMENT BY TIME OF DAY 2011/12
Current targeting practice is not cognisant of collision harm: whilst enforcement is
delivered at the right times, the wrong selection of location has meant that the 56% increase in
enforcement outputs, for 2011/12, appears to be wasted effort when the 49% ascent of collision
harm for that year is considered. It may be that enforcement is effective at reducing harm, but
0
20
40
60
80
100
120
140
160
1800
0:0
0
01
:00
02
:00
03
:00
04
:00
05
:00
06
:00
07
:00
08
:00
09
:00
10
:00
11
:00
12
:00
13
:00
14
:00
15
:00
16
:00
17
:00
18
:00
19
:00
20
:00
21
:00
22
:00
23
:00
Enforcement tickets issued by time of day in enforcement campaigns April 2010 to March 2011.
0
50
100
150
200
250
300
350
400
450
00:0
0
01:0
0
02:0
0
03:0
0
04:0
0
05:0
0
06:0
0
07:0
0
08:0
0
09:0
0
10:0
0
11:0
0
12:0
0
13:0
0
14:0
0
15:0
0
16:0
0
17:0
0
18:0
0
19:0
0
20:0
0
21:0
0
22:0
0
23:0
0
Enforcement tickets issued by time of day in enforcement campaigns April 2011 to March 2012.

64
was deployed to the wrong location; it may also be that enforcement has no impact on harm,
regardless of its deployment location.
The base-value only CoLCHI scoring provides a platform with which to weight injury
collision events. Analysis shows that monthly scoring will disgorge a number of duplicate
results across the 22 sites, demonstrating yearly, or 12 month rolling totals provide a more
meaningful frequency distribution, which better inform targeting decisions. Due consideration
still needs to be given, however, of the presence of fatal events which can heavily skew scoring.
Targeting choices need to be informed by the most valid and relevant information
available. This should include not only ranking of data, but comparisons of harm levels
experienced at various times and places (Sherman 2013, p.377). This study goes on to explore
a new theory that more recent events and patterns should inform police intervention tomorrow,
in this case by introducing time and distance variables to the collision harm index formula.
Time and distance (proximal) collision harm index
In order to address ‘outlier’ concerns with fatal injury values, and to develop a new idea
to test targeting; time and distance values were considered and evaluated. The 22 traffic
enforcement locations, already used to analyse the ‘base value only’ City of London collision
harm index (CoLCHI), were used again to depict injury collision locations within their
boundaries. Each injury collision event is awarded the same raw base value that was used
earlier, dependent upon its severity (Department for Transport 2012b), mirroring the first part
of the analysis. A control point of April 1st 2011 was selected, in order to collate injury collision
data for the previous financial year (2010/11). These collision events were plotted using Global
Positioning System (GPS) coordinates within the 200 metre zone of each site. Each
enforcement location additionally introduced concentric circles, delineating zones from the

65
centre, at 0-50m, 50-100m, 100-150, and 150-200m. Individual collisions were attributed with
a geographic coefficient, dependent upon its proximity to the centre of the enforcement site:
Geographic distance coefficient:
0-50m = 1.0
50-100m = 0.75
100-150m = 0.50
150-200m = 0.25
The 12 month analysis period was split into 10 equal time envelopes, preceding
and built around the control date of 1st April 2011. Every injury collision contains a date record,
as each event date increases further away in time from the control point, the temporal
coefficient score decreases. The time parcels are split into 36 day blocks, the block closest in
time to the control date attracts a score of 1.0; each time parcel diminishes by 0.1 as it moves
further away in time:
Temporal distance coefficient:
The CoLCHI score for each injury collision event was thus calculated:
CoLCHI=∑ base damage x geographic distance coefficient x temporal distance coefficient.

66
The CoLCHI proximal formula was applied using Excel to generate a score for every individual
injury collision at each of the 22 enforcement locations. This data was then visualised on each
relevant enforcement location using graduated symbol mapping: the higher the collision harm
score, the bigger the circle. By way of an example, all 22 enforcement sites are shown in Figure
12 with graduated symbol mapping visually highlighting the extent of harm, displayed as
varying sizes of injury collision events.
FIGURE 12 ALL ENFORCEMENT LOCATIONS SHOWING HARM GRADUATION
The Cannon Street enforcement site is shown in Figure 13 below. This particular site
generated the 3rd highest proximal CoLCHI score for 2010/11. Amongst the 35 individual
injury events within this location are 8 serious injury collisions with CoLCHI scores ranging

67
from £4,786.55 up to £71,798. The latter being the highest scoring injury event for this site in
the 12 month period of analysis. This serious injury collision, occurring on 1/9/2010, attracted
a time coefficient of 0.5 (decaying by six months), indicated by the red arrow and being the
larger of the two circles. In contrast, the lowest scoring slight injury collision which took place
more than 11 months before the control date, attracted a time coefficient of 0.1 resulting in a
CoLCHI score of just £369, indicated by the yellow arrow, its low number depicted by a much
smaller circle.
FIGURE 13 CANNON STREET SHOWING PROXIMAL COLCHI GRADUATED SYMBOL MAPPING
The yearly sum of all injury collision scores was calculated for each location, allowing the
sites to be ranked in proximal CoLCHI score order. Figure 14 shows the enforcement sites in
rank order of proximal CoLCHI score, ranging from £371,304 down to £5904. The top 8
sites can be seen towards the left hand side of the x axis. Despite the top 8 carrying 62.2% of

68
the CoLCHI total for the year, the sites displayed in red (‘Q’, ‘T’, ‘V’, ‘M’, ‘L’, ‘A’, ‘C’ and
B’) were those selected for enforcement in April 2011.These locations carried only 33.7% of
the yearly proximal CoLCHI scoring, just under half the harm scoring of the actual top 8.
FIGURE 14 PROXIMAL COLCHI SCORING AND RANKING APRIL 2011
The proximal CoLCHI scores are lower than the base value only calculations because
of the added coefficient multipliers for time and distance, which have reduced the high scoring
seen during the base value analysis. The time and distance multipliers have effectively reduced
the initial base value amounts, which for the most serious of injury collisions has the effect of
dampening the spikes seen with pure base value allocation of collision harm values. The figures
for both methods of calculation are best viewed in Table 17 below, where the rankings for both
can be examined. Two methods of CoLCHI calculation cannot be compared directly. It is
possible, however to review the ranking of the enforcement locations, given that differing
formulas were used to align them into an order at the conclusion of 12 months analysis.
0
50,000
100,000
150,000
200,000
250,000
300,000
350,000
400,000
22/G21K20/I19/B18/C17/P16/U15/A14/L13/M12/F11/H10/S9/V8/N7/T6/D5/E4/R3/O2/Q1/J
Co
llisi
on
Har
m In
dex
Sco
re

69
Interestingly, the bottom four locations are identically ranked, with the majority of other
enforcement sites being within four rank places of their counterpart, a wider difference is seen
towards the top of the table where the bigger scores of the base value CoLCHI show a greater
difference between rankings than the proximal model scores.
TABLE 9 COMPARISON OF BASE VALUE AND PROXIMAL COLCHI RANKINGS 2010/11
Base Value CoLCHI Location Location Proximal CoLCHI Rank
1,930,216.00 O J 371,304 1
972,906.00 N Q 336,743 2
913,866.00 V O 334,118 3
840,066.00 Q R 328,890 4
840,066.00 J E 314,920 5
795,786.00 F D 277,459 6
751,506.00 R T 262,825 7
737,164.00 T N 242,140 8
736,746.00 H V 241,075 9
736,746.00 E S 225,103 10
692,884.00 D H 164,650 11
663,364.00 S F 157,733 12
604,324.00 A M 154,611 13
486,244.00 U L 131,482 14
471,484.00 L A 93,262 15
457,560.00 M U 72,947 16
427,622.00 C P 72,240 17
324,302.00 P C 61,233 18
162,360.00 B B 56,457 19
132,840.00 I I 50,922 20
73,800.00 K K 8,856 21
29,520.00 G G 5,904 22
Key Identical Rank
Within 1 place
Within 2 places
Within 3 places
Within 4 places

70
Proximal CoLCHI scores were used in order to create a heat map which reflects the
collision harm, as opposed to raw quantitative figures. ESRI mapping, created an interpolated
surface, using the sampled point values of individual injury collision events and their attributed
harm scores. Figure 15 shows the extent of collision harm across the City of London for the 12
months preceding April 2011. Targeting choices appear clear, given this visual representation
of the year (2010/11) analysis of injury collisions. The next section discusses the lack of
targeting, in line with collision harm scores, at accepted enforcement locations, however it
appears that the fixed locations themselves may have been poorly selected to begin with.
FIGURE 15 PROXIMAL HARM INDEX HEATMAP

71
Discussion
This study set out by asking the research question:
“Have enforcement locations (for operations) been selected in line with evidence of harm?”
The findings section suggests this is not the case, as a result of descriptive analysis, which has
examined multiple layered elements. This thesis exploring injury collisions, their seriousness,
prevalence and harm rating; alongside traffic enforcement and its correlation to collision harm
in the City of London. Whilst enforcement was delivered at the right times, the analysis
indicates it was at the wrong locations.
Enforcement Locations
22 enforcement sites, currently used by the City of London Police were ‘cocooned’
within their own 200 metres zones, capturing all injury collision events therein, utilising a GIS
‘near’ tool to map the data. Whilst these locations offer a good spread of options for traffic
intervention across the City of London, they have been used for some time and don’t
necessarily capture all current micro locations where harm is prevalent. The sites are most
likely chosen (and continue to be used) for police convenience. This is particularly apparent
by the occurrence of a fatal injury collision in Moorgate in August 2010, just outside the 200
metre zone for an enforcement location, meaning its value and relevance was not included in
this study. However, having looked at the data for this fatal event, this nearest enforcement
location in question was still not selected for intervention the following month, thus
demonstrating a lack of harm consideration when making tasking decisions.

72
Injury Collisions and Prevention Costs
Injury collision events are usually referred to in quantitative terms, when analysing data
for policing purposes, excepting the Killed or Seriously Injured (KSI) category. This category
is subject of a reduction target with the City of London Corporation, TFL and the Mayor of
London, and sees fatal and serious events grouped together for the purposes of a performance
target. This thesis saw an opportunity to attribute the DfT prevention costs (Department for
Transport 2012b) to all injury collisions within the analysis envelope, in a policing jurisdiction.
Given the disproportionate number of vulnerable road users (VRU’s) injured in the City
of London (Everett 2013; Talbot et al. 2014), allocation of a preventative cost for all such injury
incidents is not only appropriate but has focused attention towards the harm as opposed to just
raw numbers. As far as the author is aware, this process has not been undertaken before,
particularly in relation to creating a collision harm index.
Creation of the City of London Collision Harm Index
The Cambridge Crime Harm Index (CHI) (Sherman et al. 2013; Sherman 2013) was
instrumental in sparking an idea that injury collisions could be weighted commensurate with
the harm they caused. The City of London Collision Harm Index (CoLCHI) adapted the
concepts used in the CHI replacing sentencing guidelines for crimes, with collision
preventative values, documented in the literature and introduced by the Department for
Transport (Department for Transport 2012a; Department for Transport 2012b).
Each injury collision was awarded a value in line with its seriousness (slight, serious or
fatal) and in its most basic form, these ‘raw’ values can paint an instant picture of harm
distribution and frequency, especially when plotted on a map. The fatal values (£1.7m), in

73
particular, are instantly recognisable, which is partly the point of the index. However,
depending on how the CoLCHI is interpreted, a fatal occurring in April could leave its location
glowing red for up to a full year afterwards, even though it’s immediate importance for
targeting will wane over time. The addition of time and distance coefficients, creating a formula
rather than a single value, helped to soften the spikes caused by the raw values alone; presenting
a more meaningful method of testing targeting decisions. The additional proximal 12 months
analysis was helpful to compare the two models.
Enforcement Location Ranking
The CoLCHI provided each individual event with a financial harm value, summed for
all incidents within each enforcement zone, thus providing a score and subsequent ranking
against the other sites. Stand-alone monthly ranking (base value only) proved problematic
because of the prevalence of duplicate entries, a challenging situation for realistic and
meaningful targeting decisions to be made. The yearly totals realised greater separation
between enforcement site harm scoring, demonstrating better patterns and context of harm over
time.
Again, the fatal preventative values had enormous impact, particularly with the base
value only CoLCHI model, but a comparison of both approaches demonstrated similarities with
site ranking using the 12 month pre April 11 analysis. Both methods were effective in
recognising and ranking locations by harm value, although the proximal model is the only
method to take account of the decaying effects of time and distance.
74
Correlation of Enforcement Activity to Collision Harm
Once the sites were ranked in collision harm order, the enforcement activity was
measured to establish when and where it occurred and whether any tickets were issued. The
two financial years of 2010/11 and 2011/12 provided 24 months activity to scrutinise. These
years were chosen as they weren’t affected by the extra ordinary policing measures in place for
the London Olympics. The results, whilst probably not unforeseen were startling: some high
harm collision locations received no enforcement activity, with 11 of the 22 not seeing any
intervention activity at all in 2010/11, and 7 of those 11 received limited enforcement during
2011/12. Traffic intervention was rarely delivered at the relevant location at or around the point
in the year when the harm was greatest: only twice in 2010/11 and three times the following
year. This finding, coupled with the discovery that many sites were selected for enforcement
and didn’t see any at all (25 times in 2010/11 and 37 times in 2011/12), indicates that harm is
not being considered during targeting deliberations.
The proximal CoLCHI model was used to analyse 12 months injury data pre April 2011.
Given that 12 months data should provide a better picture of patterns and context for targeting
decisions, it is noted that the sites selected for enforcement in April 11 carried only 33.7% of
the yearly proximal CoLCHI value. The actual top 8 had nearly double that amount of harm at
62.2%. In other words, the locations that were selected for enforcement precluded any
consideration of evidence, resulting in a scatter gun approach which missed most of the high
harm locations.
Current targeting decisions are made on a monthly basis, but that shouldn’t mean that
these choices should be restricted to the previous month’s collision data in isolation. The
findings tend to show that yearly analysis provides more breadth and depth to the data, which
if used on a rolling basis (with either base value or proximal CoLCHI scores) could far better
inform where police traffic enforcement assets are tasked.

75
Roads Policing Unit (RPU) officers were gainfully employed with traffic enforcement
during the analysis period, actually showing a 56.6% increase in productivity in the second
year (tickets n= 1083 2010/11 1587 2011/12), unfortunately, the collision harm score also rose
for the same period by 49% (CoLCHI ∑ = £13,781,372 2010/11 £20,665,688 2011/12)
demonstrating that the interventions were probably in the wrong place. Outputs alone should
not be an indication of success; they need to be tangibly linked to an outcome which in this
case is a reduction in collision harm. If we accept that enforcement can have an impact on
driving behaviour (Walter et al. 2011; Broughton & Elliott 2004), then it is essential that it is
targeted in the most effective way.
Thesis Context with Existing Literature and Research
Vulnerable road users continue to be fatally and seriously injured on the City of
London’s ancient road network. Recent figures underlining that whilst the headline figure of
injury collisions has reduced, the serious casualties continue to increase (Rickwood 2014;
Talbot et al. 2014). There are, of course, many and varied reasons for this phenomenon, and
enforcement has but a part to play in a picture including education and engineering initiatives
(Transport for London 2014d). But at a time when the harm levels have increased, it is logical
to define its presence, frequency and context with an index (or measure) of this harm. Such a
method would follow the principles and ideas of the Cambridge Crime Harm Index (Sherman
2013; Sherman et al. 2013), to focus targeted enforcement where its impact will be of greatest
benefit.
This thesis has identified intuitive tasking decisions, made over at least a 24 month
analysis period, which have seen sporadic tasking choices made for either convenience or
driven by subjective views, reaching conclusions on the basis of limited evidence (Kahneman
2011). The ideas posited in this study encourage future tasking choices to consider facts which

76
are unknown, having a wider view and considering, amongst other information, the scores
generated by a collision harm index.
Studies show that transgression of traffic legislation and hazardous driving behaviours
are linked to collisions (Factor 2014; Parker et al. 1995). Previous academic studies have also
suggested that focused traffic intervention has an impact on reducing offending behaviour
(Walter et al. 2011; Broughton & Elliott 2004; Elvik & Christensen 2007; Scottish Office
Central Research Unit 1997; Davis et al. 2006). These studies, however, typically examined
road safety by simply counting collisions, and did not attempt to provide any summary
measures of changing levels of harm.
This study actually saw an increase in collision harm scores over 2011/12 when
compared to the previous year of analysis, despite a similar increase in enforcement outputs,
suggesting that targeting was in the wrong place. Road safety depends heavily upon altered
(lawful) behaviour, resulting from the perceived threats of being caught and being punished
quickly (Homel 1988; Davey & Freeman 2011). The increase in collision harm during the
period of analysis for this thesis unfortunately indicates that there is no evidence of altered
behaviour as a result of traffic enforcement activity. This may be because the intervention was
delivered in the wrong place, or indeed that it is simply not effective. Further research may
indicate some changes in trends between differing road user groups, perhaps using more
optimal data which has not been possible to explore for this study.
Limitations of Research
The concentric zones placed around each enforcement location certainly captured
relevant injury collision data for the central site location and its approaches. However some
collisions inevitably fell outside the boundaries of these sites, resulting in a number of events
which were not included in the analysis. Most notably, a high harm fatal collision was left

77
uncounted for this very reason. One high scoring location was omitted from the analysis due
to an analytical error, which was unfortunate as this location would have added extra breadth
and depth to the study. With the benefit of hindsight, a grid system would capture every square
inch of a police areas jurisdiction, although the number of sites or the geographic area around
each location would almost certainly increase.
The CoLCHI was approached using two different models. The base-value only
calculations provided a clear indication of harm across 24 months, with the yearly analysis
arguably offering a more accurate presentation of patterns and context. It wasn’t possible to
run an extensive analysis using the proximal CoLCHI formula, which meant that monthly
analysis was not carried for all 24 months of the analysis period, which would have mirrored
the base value only model. The single month analysis for April 2011 was, however, useful to
compare against the base value calculations demonstrating that the harsh spikes, caused by the
high fatal values, were somewhat softened in the proximal system by the introduction of time
and distance coefficients. More extensive proximal CoLCHI research over at least two years,
with monthly figures would have provided greater confidence with this new idea. However the
initial findings of the proximal model indicate a promising way forward, recognising the effects
of time and distance decay and their relevance for targeting, the added breadth and depth
outweighing the benefits of the base-value only system.
It wasn’t possible, within the scope of this thesis, to additionally examine those slight
injury collisions which could cross the line becoming serious or fatal events. Often, this results
from a “matter of chance, depending upon the simultaneous occurrence of a number of
additional random factors” (Factor 2014, p.90). Further research into the complexities of road
layouts, vulnerable road users and collision ‘causation’ factors specific to the City of London
will add value to the future assessment of collision harm.

78
Strengths of Research
Whilst the proximal model of CoLCHI calculation partly ventured into unchartered
territory, the base value model provided a strong footing for this study, derived from existing
literature and research by the DfT (Department for Transport 2012a; Department for Transport
2012b). Both models, however, took direction and influence from the extensive research into
a Crime Harm Index model (Sherman 2013; Sherman et al. 2013) and its importance with
recognising the extent of harm caused by individual events. The base value model, whilst prone
to giving fatal events excessive weight as potential outliers, managed to articulate a clear
picture of collision harm within the enforcement site zones in the City of London, especially
using the yearly figures. The resultant analysis clearly indicates that previous targeting
decisions took virtually no account of collision harm.
The new theory in utilising additional time and distance coefficients shows promise as
a basis for future research, developing benefits for targeting practices. The time and distance
elements of the formula should help with ensuring our police officers are deployed in the right
place, recognising the importance of more recent traumatic injury events.
Despite the limitations set out within this chapter, this is the first time that a piece of
research has addressed the issue of the harm caused by collision events, recommending the use
of an index with which to effectively target police traffic enforcement.

79
Conclusion
The research carried out for this thesis, based within a small territorial policing district,
may be viewed by some to provide limited generalisability. However, the extent of road deaths
and serious injuries is a worldwide problem. It is particularly prevalent in busy urban settings
like the City of London, where vulnerable road users are far more likely to be killed or injured
than in surrounding boroughs (Everett 2013). Road deaths increased by 3% nationally this year
(Department for Transport 2014b) and the City of London has seen an increase in serious injury
collisions, despite the figure for all injury collisions reducing slightly (Rickwood 2014).
This study set out to examine whether enforcement locations had been selected in line
with evidence of harm. In spite of the recent increase in KSI incidents, findings for this thesis
demonstrate that traffic enforcement targeting decisions have not considered the issue of
collision harm which, in light of the uplift in casualties, is striking. Police resources should not
be squandered delivering enforcement in a haphazard fashion.
Traffic enforcement has a key part to play, alongside education and engineering
activity, increasing road safety by altering driving behaviour (Factor 2014; Transport for
London 2014b; Transport for London 2012c). Whilst TFL are now starting to take a far more
risk-based approach to analysing road user behaviour in London (Transport for London 2012a),
harm itself has not been considered, save for the preventative values placed on injury collisions
by the Department for Transport (Department for Transport 2012a; Department for Transport
2012b). The City of London Collision Harm Index is a method with which to help identify
locations and patterns of harm, providing far better evidence based choices for traffic
enforcement targeting.

80
Implications for Future Research
The CoLCHI is a new idea, particularly when incorporated with the time and distance
coefficients; as such, this descriptive analysis serves as an effective starting point articulating
the presence and seriousness of a phenomenon. This study has gone on to demonstrate, by
applying the CoLCHI that current targeting practices do not take into consideration the
evidence of harm. The theoretical case for applying a collision harm index should be explored
further by conducting further research, ideally using the most recent post Olympics data in
order that targeting decisions using the CoLCHI results may have improved confidence.
A scientific trial would be the most effective method with which to carry research
forward, at least at level 3 on the Maryland Scale of Scientific Methods, where a before and
after experiment, with control group, could test the effectiveness of the harm index as an
outcome variable (Sherman et al. 1998; Sherman et al. 2013). The CoLCHI could be used to
target interventions, whilst existing methods of selection would be deployed to control areas.
A level 5 randomised controlled trial would additionally add value by eliminating the risk of
‘chance happenings’ and selection bias. Any subsequent reductions in collision harm at
selected intervention sites could be scientifically assessed for a causal relationship, which has
not been possible within the scope of this study. There may also be value in re-examining some
old experiments which test the effectiveness of enforcement, by re-analysing, using a collision
harm index as an outcome measure, as opposed to straight collision counts. Harm indexing
should also be used in the future to identify the best and most needed locations for enforcement.
This study was limited to 22 locations which are currently used; harm indexing would
demonstrate any shift away from existing spots, defining new locations for targeted activity.

81
Policy Implications
Whilst this new theoretical approach will benefit from the increased rigour of scientific
experiments going forwards, there is a case to start work immediately on the basis of this
descriptive study. Targeting decisions are already being made using the subjective intuitive
view of ‘subject matter experts’ and at best on the basis of numbers alone. These decisions
could be extended to include consideration of the harm factor. The base value only CoLCHI
model can be very swiftly added to internal data cleansing processes as each new collision is
recorded, prior to submission for inclusion in STATS 19 figures, providing a monthly score
for all enforcement locations (which of course could be adapted to incorporate a grid or junction
system). If the data was used on a 12 month rolling basis, collision harm could be effectively
assessed as part of the force tasking mechanism. Its value could have wider implications for
traffic enforcement policy pan London, where TFL funded enforcement could be delivered
consistently, cognisant of harm avoiding ‘knee jerking’ into activity predicated upon the
emotion of traumatic events in isolation.
The proximal model of harm analysis is the only model for calculating collision harm,
which takes into consideration the time decay issues affecting injury collisions. The model used
for this study relied upon a 360 day window of decaying effect, but this is just one possible
variant. The question of how long a collision event should have an impact on police tasking
remains an open one. Further analysis exploring this idea will allow greater assessment of the
local dimensions of this idea.

82
Application
Achieving more with less has become a phrase all too familiar with police agencies
facing policing challenges with decreasing budgets. The collision harm index developed and
demonstrated within this study provides a method with which to identify areas and patterns of
harm in order to conduct pre-emptive interventions which can prevent or change the shape of
events, reducing the likelihood of a collision and the harm subsequently caused (Crawford &
Evans 2012, p.769).
The application of road safety enforcement can be driven ahead as part of the data
driven approaches to crime, congestion and traffic safety (DDACCTS) model (Bruce, 2013),
effectively single tasking in locations affected by manifold problems. Targeting our responses
to the areas of highest risk can, in central London particularly, often see benefit at the same
location because of other policing problems. Synthesising analytical products effectively, such
as using the CoLCHI, could see a dramatic increase in the efficiency and effectiveness of police
enforcement, especially considering the absence of any correlation of previous enforcement to
harm articulated in this study. The CoLCHI along with its inspiration the Cambridge CHI
provides a new metric, where collisions are not treated equally, where public safety can be
analysed and police resources allocated more accurately. The CoLCHI has great potential to
shape the future of evidence based policing.

83
Bibliography
Administrative Data Liaison Service, 2014. ADLS - Administrative Data Liaison Service »
STATS19 Road Accident dataset. ADLS. Available at:
http://www.adls.ac.uk/department-for-transport/stats19-road-accident-dataset/?detail
[Accessed September 18, 2014].
Akers, R. & Sellers, C., 2009. Routine Activities Theory. In Criminological
Theories:Introduction, Evaluation and Application. New York: Open University Press,
pp. 35–44.
Anon, 1988. Road Traffic Act 1988, United Kingdom: legislation.gov.uk.
Bachman, R. & Schutt, R.K., 2010. The Practice of Research in Criminology and Criminal
Justice Third., London: Sage.
Broughton, J. & Elliott, M., 2004. How Methods and Levels of Policing Affect Road Casualty
Rates,
Bruce, C., 2013. Data Driven Approaches to Crime, Congestion, and Traffic Safety,
Buck, D., 2014. Crossrail Works in London.
City of London Corporation, 2014. Stop, Think, Live Road safety campaign.
City of London Police, 2013a. Cyclist Casualties In the City of London in 2013, London.
City of London Police, 2013b. July 2013 Public Report of: Commissioner of Police, London.
Available at: http://democracy.cityoflondon.gov.uk/documents/s22694/Pol_31-
13_Road_Safety_update_July_2013_final.pdf.
City of London Police, 2013c. Reported Personal Injury Collisions in 2012,
Cohen, L.E. & Felson, M., 1979. Social Change and Crime Rate Trends: A Routine Activity
Approach. American Sociological Review, 44(4), p.588.
Corporation of London, 2012. Road Danger Reduction Plan,
Coupe, T., 2013. Routine Activity Theory, Including Crime Prevention. Lecture at cambridge
University 15th April 2013.
Crawford, A. & Evans, K., 2012. Crime Prevention and Community Safety. In M. Maguire,
R. Morgan, & R. Reiner, eds. The Oxford Handbook of Criminology. Oxford: Oxford
University Press, pp. 769–800.

84
Crown Prosecution Service, 2014. Road Traffic Offences Guidance on Prosecuting Cases of
Bad Driving Legal Guidance The Crown Prosecution Service. Prosecution Policy and
Guidance. Available at:
http://www.cps.gov.uk/legal/p_to_r/road_traffic_offences_guidance_on_prosecuting_ca
ses_of_bad_driving/#a08.
Davey, J.D. & Freeman, J.E., 2011. Improving Road Safety through Deterrence-Based
Initiatives A review of research. , 11(February), pp.29–37.
Davis, J.W. et al., 2006. Aggressive traffic enforcement: a simple and effective injury
prevention program. The Journal of trauma, 60(5), pp.972–976; discussion 976–977.
Department for Transport, 2011. Strategic Framework for Road Safety, London Crown
Copyright.
Department for Transport, 2012a. A valuation of road accidents and casualties in Great
Britain : Methodology note, London. Available at:
https://www.gov.uk/government/uploads/system/uploads/attachment_data/file/254720/rr
cgb-valuation-methodology.pdf.
Department for Transport, 2012b. Reported Road Casualties in Great Britain : 2012 Annual
Report A valuation of road accidents and casualties in Great Britain in 2012, London.
Available at:
https://www.gov.uk/government/uploads/system/uploads/attachment_data/file/244913/rr
cgb2012-02.pdf.
Department for Transport, 2013a. Road accidents and safety statistics - GOV_UK. Road
Accidents and Safety Statistics. Available at:
https://www.gov.uk/government/collections/road-accidents-and-safety-statistics
[Accessed November 1, 2014].
Department for Transport, 2013b. Traffic counts - Transport statistics - Department for
Transport. Traffic Counts. Available at: http://www.dft.gov.uk/traffic-
counts/area.php?region=London&la=City+of+London [Accessed August 29, 2014].
Department for Transport, 2014a. Reported Road Casualties in Great Britain : Main Results
2013, London.
Department for Transport, 2014b. Reported Road Casualties in Great Britain : Quarterly
Provisional Estimates Q2 2014 .Statistical Release, London. Available at:
https://www.gov.uk/government/uploads/system/uploads/attachment_data/file/370826/q
uarterly-estimates-apr-to-jun-2014.pdf.
Elvik, R., 2001. Cost-Benefit Analysis of Police Enforcement,
Elvik, R. & Christensen, P., 2007. The deterrent effect of increasing fixed penalties for traffic
offences: The Norwegian experience. Journal of Safety Research, 38(6), pp.689–695.
Everett, P., 2013. The City of London ’ s Road Danger Reduction Plan. , (January), pp.1–27.

85
Factor, R., 2014. The effect of traffic tickets on road traffic crashes. Accident; analysis and
prevention, 64, pp.86–91. Available at: http://www.ncbi.nlm.nih.gov/pubmed/24342150
[Accessed March 19, 2014].
Felson, M., 1998. The Routine Activity Approach as a General Crime Theory. In E.
McLaughlin, J. Muncie, & G. Hughes, eds. Criminological Perspectives. London: Sage,
p. p165.
Greater London Authority, 2014. Mayor backs police road safety operation as serious cyclist
injuries fall by 28 per cent Greater London Authority. London Assembly. Available at:
https://www.london.gov.uk/media/mayor-press-releases/2014/05/mayor-backs-police-
road-safety-operation-as-serious-cyclist [Accessed September 10, 2014].
Harvey, C., 2013. London Cycling Deaths: We need action not talk. Daily Telegraph.
Available at: http://www.telegraph.co.uk/men/active/recreational-
cycling/10453143/London-cycling-deaths-we-need-action-not-talk.html.
Von Hirsch, A. et al., 1999. Criminal Deterrence and Sentence Severity:an Analysis of
Recent Research, Oregon: Hart Publishing.
Homel, R., 1988. Policing and Punishing the Drinking Driver, New York: Springer-Verlag.
Jacobsen, P.L., 2003. Safety in numbers: more walkers and bicyclists, safer walking and
bicycling. Injury prevention : journal of the International Society for Child and
Adolescent Injury Prevention, 9(3), pp.205–9. Available at:
http://www.pubmedcentral.nih.gov/articlerender.fcgi?artid=1731007&tool=pmcentrez&
rendertype=abstract.
Jupp, V., 1989. Methods of Criminological Research First., New York: Routledge.
Kahneman, D., 2011. Thinking , Fast and Slow first., London: Penguin.
Knowles, J. et al., 2012. Analysis of Police Collision Files for Pedestrian Fatalities, London.
Available at: http://www.tfl.gov.uk/cdn/static/cms/documents/pedestrian-fatalities-in-
london.pdf.
Knowles, J. et al., 2009. Collisions involving pedal cyclists on Britains roads : establishing
the causes, London.
Levi, M., 1997. Violent Crime. In M. Maguire, R. Morgan, & R. Reiner, eds. The Oxford
Handbook of Criminology. Oxford: Oxford University Press, pp. 841–842.
London Cycling Campaign, 2014. London Cycling Campaign Forum, rides and local Forum.
London Cycling Campaign Blog. Available at: http://lcc.org.uk/discussions/operation-
safeway-nets-13-800-drivers-and-cyclists [Accessed September 10, 2014].
Lu, F., Zhang, J. & Perloff, J., 2012. Deterring Traffic Violations : Evidence from a
Randomized Experiment. , (71203226).

86
Mitchell, C.G.B.K. & Allsop, R.E., 2014. Projections of road casualties in Great Britain to
2030, London.
Myers, R., 2013. London cyclist deaths: SIXTH person killed in collision with HGVs on
capital’s roads in TWO weeks. Daily Mirror. Available at:
http://www.mirror.co.uk/news/uk-news/london-cyclist-deaths-sixth-person-2804857.
Novis, K., 2010. Mobile Phone and Seat Belt Usage Rates in London 2009 Overview,
London. Available at: http://www.tfl.gov.uk/cdn/static/cms/documents/mobile-phones-
and-seat-belt-usage-rates-in-london-2009-summary.pdf.
Parker, D. et al., 1995. Behavioural characteristics and involvement in different types of
traffic accident. Accident Analysis and Prevention, 27, pp.571–581.
Payne, S., 2014. Operation Safeway the Met are on the look out for rogue cyclists » Spectator
Blogs. The Spectator. Available at:
http://blogs.spectator.co.uk/coffeehouse/2013/11/operation-safeway-the-met-are-on-the-
look-out-for-rogue-cyclists/.
Rickwood, A., 2014. Proposal for Improving Road Safety in the City of London, London.
Road Danger Reduction Forum, 2013. Is there a real “cycle safety crackdown” in London
Road Danger Reduction Forum. Safer Roads For All. Available at:
http://rdrf.org.uk/2014/05/28/is-there-a-real-cycle-safety-crackdown-in-london/
[Accessed September 9, 2014].
Robson, C., 2011. Real world research: a resource for Users of Social Research Methods in
Applied Settings Third., Wiley. Available at:
http://books.google.com/books?id=DkplMcAysFQC\nhttp://media.matthewsbooks.com.
s3.amazonaws.com/documents/tocwork/063/9780631213055.pdf.
Rothengatter, T., 1982. The Effects of Police Surveillance and Law Enforcement on Driver
Behaviour. Current Psychological reviews, pp.349–358. Available at:
http://download.springer.com/static/pdf/81/art%253A10.1007%252FBF02684467.pdf?a
uth66=1410529172_1eeb96267f5f9ea71b4d4d66910d4305&ext=.pdf.
Rumsey, D.J., 2011. Statistics for Dummies 2nd ed., Indianapolis: Wiley Publishing.
Scottish Office Central Research Unit, 1997. The Deterrent Effect of Enforcement in Road
Safety,
Select Committee on economic affairs, 2006. House of Lords - Economic Affairs - Fifth
Report. www.parliament.co.uk. Available at:
http://www.publications.parliament.uk/pa/ld200506/ldselect/ldeconaf/183/18309.htm
[Accessed September 9, 2014].
Sherman, L.W., 2013. Crime and Justice in America 1975-2025 M. Tonry, ed., Chicago:
University of Chicago.

87
Sherman, L.W. et al., 1998. National Institute of Justice. National Institute of Justice
Research in Brief, pp.1–19.
Sherman, L.W., Neyroud, P.W. & Neyroud, E.C., 2013. The Cambridge Crime Harm Index
(CHI) Measuring total harm from crime based on sentencing guidelines, Cambridge.
Stafford, M. & Warr, M., 2006. Reconceptualising Deterrence Theory. In F. Cullen & R.
Agnew, eds. Crimnological Theory Past to Present. New York: Oxford University
Press, pp. 415–420.
Stansfield, C., Johnson, D. & Morris, C., 2012. City of London Road Safety Workshop V1
161.
Sutton, M., 2014. MET reveals “Operation Safeway” stats Bicycle Business BikeBiz. Bike
Biz. Available at: http://www.bikebiz.com/news/read/met-reveals-operation-safeway-
stats/015846 [Accessed September 10, 2014].
Talbot, R. et al., 2014. Pedal Cyclist Fatalities in London : Analysis of Police Collision Files
( 2007-2011 ), Loughborough.
Transport for London, 2012a. Road Risk and Vulnerable Road User Working Paper, London.
Available at: http://www.tfl.gov.uk/cdn/static/cms/documents/road-risk-and-vulnerable-
road-user-working-paper.pdf.
Transport for London, 2012b. Surface Transport on London ’ s roads : Collisions and
Casualties on London ’ s roads : Annual report, London.
Transport for London, 2014a. Construction Logistics Safer Lorry Scheme The Way Forward,
London. Available at: http://www.tfl.gov.uk/cdn/static/cms/documents/safer-lorry-
scheme-the-way-forward-report.pdf.
Transport for London, 2014b. Pedestrian Safety Action Plan,
Transport for London, 2014c. Safe London streets: Our six road safety commitments,
London. Available at: http://tfl.gov.uk/corporate/safety-and-security/road-safety/safe-
streets-for-london?intcmp=6624.
Transport for London, 2014d. Safe Streets for London The Road Safety Action Plan for
London 2020, London. Available at: http://tfl.gov.uk/corporate/safety-and-security/road-
safety/safe-streets-for-london?intcmp=6624.
Tranter, M. & McGrath, K., 2007. The use of Hospital Data on Road Accidents,
U.S. Department of Justice, 2012. Evaluability Assessment of Law Enforcement Agencies
Using the Data-Driven Approaches to Crime and Traffic Safety ( DDACTS ) Eligibility.
, (1121), pp.1–21.
UK Government, 2012. Reported Road Casualties in Great Britain : notes , definitions ,
symbols and conventions Notes,

88
Walter, L., Broughton, J. & Knowles, J., 2011. The effects of increased police enforcement
along a route in London. Accident; analysis and prevention, 43(3), pp.1219–27.
Available at: http://www.sciencedirect.com/science/article/pii/S0001457511000042
[Accessed March 19, 2014].
World Health Organisation, 2013. Pedestrian Safety, Geneva: WHO Press.
World Health Organisation, 2004. World report on road traffic injury prevention. , p.244.
Available at: http://whqlibdoc.who.int/publications/2004/9241562609.pdf?ua=1.

89
Appendices
Appendix A Collision Report Booklet and guidance
The Force introduced the current Collision Report Booklets in March 2005. They are in two formats, the existing A6 pocket size and an A4 size for use when convenient. Both are National MG Forms that should be used by every Force and Training School in the Country and contain identical information, but in a different layout. The books were designed to create a standard national format ahead of the provision of an electronic version running on a PDA that should have be available by the end of 2006 and is still promised for some future date. The books must be used to report all recordable collisions. Recordable collisions are those that are reportable as per Section 170 Road Traffic Act 1988 (Police National Legal Database ref D3050 refers) and any collision involving a horse or cyclist irrespective of whether a motor vehicle was involved. Appendix B lists which collisions should be recorded. The information in the booklet is supplied to the Department of Transport and Transport for London who both produce statistics and reports that are used by the Government and Highway Authorities to identify trends, support new or existing legislation, create targets, support the allocation of funds and the implementation of engineering measures. A study for the London area is carried out by ‘The London Accident Analysis Unit’ who publish detailed reports on particular road safety problems such as the use of mobile phones and HGV interaction with Cyclists. The City of London Corporation, and Transport for London as the two Highway Authorities in the City of London use that information to allocate funding and resources for Road Safety initiatives and highway engineering improvements. The information is also used by this Force as intelligence with regard to identifying the appropriate times and locations for Educational and Enforcement Casualty Reduction and Road Safety initiatives.
The Department for Transport have a web page that gives advice on the completion of collision reports at www.collisionreporting.gov.uk This will take you to a log in page where you will be asked
to fill in two boxes. Police / Constabulary is City of London, and the Police Force /Constabulary PNC Code is 48.
Guidance for Fatal/Life changing injury collisions can be found in the Force public S drive /procedures + guidance/Road Death Investigation/Road Death Investigation Manual. This document is intended to assist with the completion of the booklet. Most sections are self-explanatory, with advise being added where it is thought that some technical or other advise might be useful.

90
N.B. Reference in the booklets to the term ‘Accident’ have been at the request of the Department of Transport in relation to the wording in current legislation, but the term ‘crash ‘or ‘collision’ should be used by all officers when completing any paperwork or communicating with others.
Page 1. The front page of the booklet contains a number of sections that require basic information relevant to when, where, and who attended. CAD Reference Number – as a national form there is no place allocated for a CAD number – suggest it is written on the top left hand side of the form. URN – (Unique Reference Number) the collision report book reference, such as V0423/12 is allocated by the CJU and therefore cannot be entered by the reporting officer. FATAL/SERIOUS/SLIGHT/NON INJURY – please circle appropriate word by reference to definition on page 38 sect 3. 1st & 2nd Road Class & No. – List of all Classified Roads attached at the end of this document at Appendix A – remaining roads not classified and should be written as such. O/S House or MP No. - E.g. 182
County or Boor is ‘City of London’ Parish No. or Name does not need to be filled in. Grid Reference is important to identify exact location, should be the point of initial impact, and is obtained from the Force Control Room.
Page 2. Contains the details of the drivers/riders and their vehicles, and is repeated at page 5 for a second vehicle.

91
Non Stop (Contributory) – To be ticked where vehicle is involved but did not collide with another vehicle or person. Other ID are things that may assist identification such as a Taxi Drivers badge number or the service number of Military personnel. Test Cert. – Ministry Of Transport Test Certificate. LGV / PCV Plate No. – The number on the Ministry Plating Certificate which is required by all Large Goods and Passenger Carrying Vehicles. Issued within 14 days of registration or re-issued after testing when vehicle has been modified. Must be displayed inside the cab on a LGV, can be displayed anywhere on a PCV.

92
Page 3. Contains the initial comments made by the driver, and information as to any injuries sustained and damage to the vehicle, and is repeated at page 6 for a second vehicle. Casualty Driver /Rider – Details of Injury. The Severity of a casualty is determined from the observations of the officer at the scene. As our medical training is normally limited to an occasional First Aid Course, a plain language comment of what you can see would be most appropriate unless advised otherwise by a doctor or Ambulance staff in attendance. Assumptions should not be made as to nature of injuries. Include comment made by casualty if appropriate. Page 38 of the booklet gives guidance on what type of injury is to be recorded as Fatal, Serious, or Slight.

93
Page 4. This page is used to record driver/rider and vehicle information, and is repeated at page 7 for a second vehicle. Preliminary Impairment Test All drivers should be requested to give a breath test at the scene. No power of arrest for failing to provide if alcohol not suspected. Eyesight Test The prescribed "requirement as to eyesight" is to be found in the Motor Vehicles (Driving Licences) Regulations 1999. A driver is required to be able to read a car's number plate at a distance of 20.5 metres in good daylight where the letters or figures are 79 mm in height. For pedestrian controlled vehicles the distance is 12.3 metres. A test can be conducted during the hours of darkness, which if they are unable to read the number plate can be conducted at a later suitable time in daylight. MGW – Maximum Gross Weight (or Maximum Authorised Mass) as found on Manufacturers Plate or Ministry Plate on Commercial Vehicles. Tacho / Records of work correct – Drivers should have the last 28 days records with them. Drivers hours on vehicles registered pre 2006 will being recorded onto Tachograph charts. Post 2006 are recorded electronically, and I suggest calling for the assistance of a Traffic Officer. Goods Vehicle Test Certificate– Required annually after 1st year. This does not have to be in the possession of the driver and production should be requested by HORT/1. Trailer Test Certificate correct– This does not have to be in the possession of the driver and production should be requested by HORT/1. However the trailer must be displaying a Trailer Test Date Disc (same size as Vehicle Excise Licence) which gives the Trailer Test expiry date. Operators Licence Disc Correct – This should be displayed on the vehicle. Operators Licence No. – The number is on the Operators Licence Identity Disc. LGV/PCV Plate No. – (A repeat request that is also on page 2, but this part of the National Form and cannot be altered locally). The number on the Ministry Plating Certificate which is required by all Large Goods and Passenger Carrying Vehicles. Issued within 14 days of registration or re-issued after testing when vehicle has been modified. Must be displayed inside the cab on a LGV, can be displayed anywhere on a PCV.
Page 8.

94
This page should be completed by the reporting officer explaining in his/her own words how, in their opinion (at the time of initial completion of the report), the collision occurred. Should include information about: Position of vehicles, Marks on the road, Removal of vehicles Offences alleged/apparent Whether Names and Addresses exchanged.

95
Page 9. This and the next 12 pages are to be completed for statistical purposes as required by the Department of Transport. The data is used for a variety of reasons by the Dept. of Transport, and locally by the Highway Engineers and Planners at the Corporation of London and TfL. From the information provided it is possible to identify collision patterns and trends. The majority of the information required is self-explanatory. Careful completion of these pages will provide information that will enable Highway Engineers, the manufacturers of vehicles, and others, to reduce the incidence of collisions and casualties in the future.
This front sheet need not be completed unless it is intended to separate these pages from the rest of the book, which at present is not Force Policy. All other greyed – out boxes in the ‘Accident Statistics’ pages need not be completed as this Force does not separate the Stats from the remainder of the book. Local Authority Number for the City is 570.

96
Page 10. 1.5 Number of vehicles and 1.6 Number of casualties - need not be completed unless these pages are to be separated from the rest of the book. Speed Limit (Permanent) All the streets in the City of London are subject to a 30 MPH speed limit with the exception of Watling Street and Tower Bridge which have a 20 mph speed limit.

97
Pages 11 & 12. Stats continued.

98
Pages 13 & 14. Stats continued.

99
Pages 15 & 16. Stats continued.

100
Page 17, 18 & 19. Page 17 requests information that is completed from the list on the following two pages. Do not complete purely on the comments made by the reporting/involved persons, but on your opinion.

101
Page 20. This page is used to collect Local Stats that are not collected nationally but are particularly relevant to the City of London. The lack of use of seatbelts, particularly by passengers and delivery drivers, has resulted in casualties that could be avoided. This information is used to justify enforcement and educational campaigns and to bring the matter to the attention of relevant bodies and organisations. Taxis and Private Hire Vehicles make up a high proportion of the traffic in the City of London, and issues about the safety of them are passed to the Public Carriage Office and other organisations. Cyclists now make up the largest single group of those that are killed or seriously injured on the City’s roads. Numerous cycle lane facilities have been placed across the City as part of the London Cycle Network and other initiatives, and whilst supported by most, some have been a major contributor towards creating the circumstances where collisions will occur. This box is intended to provide information to identify those cycle facilities that promote safer cycling in the City, and those that do not.

102
Pages 21/22/23. These pages, including a continuation page, are to record an interview at the scene. Another book should be used if a second driver interview is required.

103
Pages 24 &25, repeated on pages 26-31. These pages are for the recording of casualty details other than the drivers or riders of motor vehicles who are recorded earlier in at pages 2-7. Section C is for recording damage to property other than motor vehicles.
ID Code and 16+1 ethnicity codes can be found on page 37.

104
Pages 32& 33. A simple sketch map showing the road layout, road names, and apparent point of impact, position and direction of the vehicles is required for all collisions resulting in personal injury. It is important to record any marks left on the road as a result of the collision.
e.g.
N QUEEN ST PLACE
X Point of Impact
V1
V2
UPPER THAMES STREET

105
Page 34 & 35. The pages for additional notes should include details of: This needs to be only known facts and not opinions. Ambulance arrival time, Ambulance departure time, Ambulance Station and running number, Any follow up enquiries with Hospitals, relatives etc. Include confirmation of injuries when ascertained. Hackney Carriage driver badge and vehicle plate numbers. Private Hire driver badge and vehicle Plate Numbers. PCV running number. It is also the place to record any additional information not relevant to any other section of the book.

106
Page 36. This page is to be used by reporting and supervising officer to make comments with regard to suggested further action to be taken.

107
Page 37 & 38. These two pages provide information to assist with the completion of the booklet. All reports should be checked and signed by a Supervisor.

108
Appendix B Example of Injury Collision Data Capture
VAR No Date Time Day Location 1 Location 2 Type of Accident LAAU Record CP No Transport Mode Casualty Nos Severity of Injury Causation Factor By Self reporting form Taxi or PHV Grid Reference Easting Grid Reference North Summary
0/0191/11 03/04/2011 23:50 Sunday GREAT TOWER STREET BYWARD STREET Slight Injury Slight 111/11 Bicycle 1 Slight Opening door of a vehicle Car FALSE 533300 180710 VEHICLE 1 TRAVELLING TOWARDS TOWER HILL, DRIVER OF VEHICLE 2 OPENED DOOR KNOCKING RIDER OF VEHICLE 1.
0/0169/11 04/04/2011 07:35 Monday UPPER THAMES STREET LAMBETH HILL Slight Injury Not recorded / 0 Motor Cycle 1 Slight Changing Lane Bicycle FALSE 532190 180850
VEHICLES 1 AND 2 TRAVELLING WEST BOUND IN LANE 1. VEHICLE 1 IN TRAFFIC WENT TO OVERTAKE VEHICLE 2 AT
FAIRLY SLOW SPEED. VEHICLE 2 MOVED INTO VEHICLE 1'S PATH, CAUSING RIDER OF VEHICLE 1 TO CATCH RIDER OF
VEHICLE 2, CAUSING RIDER TO FALL OFF.
0/0169/11 04/04/2011 07:35 Monday UPPER THAMES STREET LAMBETH HILL Slight Injury Not recorded / 0 Bicycle 1 Slight Changing Lane Bicycle FALSE 532190 180850
VEHICLES 1 AND 2 TRAVELLING WEST BOUND IN LANE 1. VEHICLE 1 IN TRAFFIC WENT TO OVERTAKE VEHICLE 2 AT
FAIRLY SLOW SPEED. VEHICLE 2 MOVED INTO VEHICLE 1'S PATH, CAUSING RIDER OF VEHICLE 1 TO CATCH RIDER OF
VEHICLE 2, CAUSING RIDER TO FALL OFF.
0/0204/11 04/04/2011 07:15 Monday HOLBORN CIRCUS NEW FETTER LANE Serious Injury Serious 113/11 Bicycle 1 Serious Turning Right Bicycle FALSE 531390 181550
VEHICLE 1 STOPPED TO WAIT FOR GREEN LIGHT, THEN HEADED TOWARDS HIGH HOLBORN, SAW VEHICLE 2 ENTER FROM
NEW FETTER LANE, VEHICLE 2 THEN COLLIDED WITH VEHICLE 1 CAUSING RIDER TO FALL OFF AND SUSTAIN INJURY.
DRIVER OF VEHICLE 2 FAILED TO STOP
0/0230/11 06/04/2011 17:40 Wednesday AVE MARIA LANE LUDGATE HILL Slight Injury Slight 123/11 Bicycle 1 Slight Overtaking Motor Cycle FALSE 531880 181130
VEHICLE 1 CYCLING ALONG AVA MARIA LANE, TOWARDS THE JUNCTION WITH LUDGATE HILL. VEHICLE 1 INTENDED TO
TURN RIGHT, VEHICLE 2 OVERTOOK STATIONARY BUS AND COLLIDED WITH VEHICLE 1.
0/0167/11 06/04/2011 09:50 Wednesday NEW CHANGE CHEAPSIDE Slight Injury Not recorded / 0 Overtaking - Nearside Bicycle FALSE 532130 181230
VEHICLE 1 TRAVELLING WEST ON CHEAPSIDE, INDICATING TO TO TURN SOUTH INTO NEW CHANGE. AS IT TURNED
VEHICLE 2 -ALSO TRAVELLING WEST ON CHEAPSIDE BUT INTENDING TO CONTINUE STRAIGHT ON - PASSED BY THE
NEARSIDE OF VEHICLE 1. CONTACT BETWEEN THE 2 VEHICLES WAS
0/0180/11 08/04/2011 09:25 Friday TOWER HILL TRINITY SQUARE Serious Injury Not recorded / 0 Motor Cycle 1 Serious Turning Right Car FALSE 533450 180750
VEHICLE 1 TRAVELLING WEST IN TOWER HILL IN LANE 1, VEHICLE 2 TRAVELLING WEST IN LANE 2 (OUTSIDE). VEHICLE 1
TURNED RIGHT INTO TRINITY SQUARE ACROSS THE PATH OF VEHICLE 2. DAMAGE CAUSED TO BOTH VEHICLES AND
RIDER OF VEHICLE 2 SUSTAINED SERIOUS INJURY
0/0184/11 09/04/2011 12:16 Saturday
BLACKFRIARS
UNDERPASS VICTORIA EMBANKMENT Slight Injury Slight 109/11 Bicycle 1 Slight Changing Lane Goods/HGV FALSE 531680 180820
VEHICLE 2 WAS TRAVELLING EASTBOUND IN LANE 1 OF 2 ON VICTORIA EMBANKMENT ENTERING BLACKFRIARS
UNDERPASS. VEHICLE 1 WAS ALSO IN LANE 1 OF 2 TRAVELLING BEHIND VEHICLE 2. VEHICLE 1 OVERTAKES VEHICLE 2,
AND ON RETURNING TO LANE 1, VEHICLE 1 CLIPS VEHICLE 2 CA
0/0223/11 10/04/2011 22:05 Sunday LEADENHALL STREET FENCHURCH STREET Slight Injury Slight 121/11 Pedestrian 1 Slight Drink Pedestrian FALSE 533450 181120
CASUALTY 1 CROSSED ROAD FROM SOUTH TO NORTH. VEHICLE 1 TRAVELLING WEST TO EAST IN LEADENHALL
STREET, AND COLLIDED WITH CASUALTY 1 IN MIDDLE OF ROAD
0/0223/11 10/04/2011 22:05 Sunday LEADENHALL STREET FENCHURCH STREET Slight Injury Slight 121/11 Car 1 Slight Drink Pedestrian FALSE 533450 181120
CASUALTY 1 CROSSED ROAD FROM SOUTH TO NORTH. VEHICLE 1 TRAVELLING WEST TO EAST IN LEADENHALL
STREET, AND COLLIDED WITH CASUALTY 1 IN MIDDLE OF ROAD
0/0176/11 10/04/2011 05:25 Sunday MINORIES GOODMANS YARD Serious Injury Serious 104/11 Car 1 Serious Loss of control Car FALSE 533670 180890
VEHICLE 1 TRAVELLING NORTH ON MINORIES TOWARDS JUNCTION WITH GOODMANS YARD, FAILS TO NEGOTIATE
RIGHT HAND BEND, LEAVING THE ROAD TO THE NEARSIDE AND COLLIDES HEAVILY WITH CCTV POLE AND TRAFFIC
LIGHT. DRIVER RECEIVES SERIOUS LEG AND CHEST INJURIES. FAILS B

109
Appendix C Key to Enforcement Locations
Location by Intersection Alpha
Bishopsgate Between Camomile South A
East Area Aldgate High Street B
East Area Aldgate High Street Fenchurch St And Leadenhall St C
East Area East cheap_ JW _London Bridge D
Gracechurch Street Bishopsgate E
King St Cheapside Poultry F
Millennium Bridge G
Moorgate Monitoring Road Works H
North Area Beech Street _JW_ Aldersgate Street I
North Area Bishopsgate Middlesex Street J
North area Gresham Street _JW King Street K
North Area South Place _JW _Moorgate L
North Area Wormwood Street _JW _Bishopsgate M
Poultry N
South Area Cannon Street Monitoring Road Works O South Area Upper Thames Street Between Broken Wharf And Southwark Bridge P
South Area Upper Thames Street Southwark Bridge Q
St Pauls Cathedral Public High walks R
West Area Farringdon Street S
West Area Fleet St _JW_ Ludgate Circus T
West Area Fleet Street _JW _Fetter Lane U
West Area Holborn Circus V

110
Appendix D Example of Proximal CoLCHI formula in Excel Enforcement site A
Grid_Reference_EastingGrid_Reference_NorthSummary LAAU_Rec_CodeNear_Enforcement_LocLocation_ScoreDate_ScoreLAAU_CostTotal_Score
533250 181130 VEH 1 (HGV) PARKED AND PASSENGERS OPENS THEIR DOOR WHICH COLLIDES WITH CAS 1 HEAD. 2 North area Bishopsgate, Great St Helen’s0.5 0.2 191462 19146.2
533300 181130 VEH 1 (CAR) E/B ON LEADENALL LETS A CAR EXIT SECOND STREET AND WHILE TURNING INTO THE SECOND STREET COLLIDIES WITH VEH 2 (P/C) HEAD ON.1 East Area Aldgate High Street, Fenchurch St and Leadenhall St0.5 0.2 14760 1476
533040 181110 VEH 1 (P/C) S/B AND STATIONARY AT RED ATS WHEN LIGHTS CHANGE VEH 1 MOVES OFF SLOWLY AND VEH 2 (BUS) SOUND ITS HORN AND THEN OVER TAKES VEH 1. AFTER OVER TAKING VEH 1, VEH 2 MOVES OVER TO THE LEFT CAUSING VEH 1 TO GO INTO THE WALL. THERE IS SOME COMMUNICA1 Gracechurch Street, Bishopsgate0.25 0.2 14760 738
533130 181320 LORRY PARKED AND OPENED DRIVERS DOOR INTO CARRIAGEWAY AS CYCLIST WAS PASSING CAUSING HIM TO FALL By St Helens Place. 1 North area Bishopsgate, Great St Helen’s0.5 0.3 14760 2214
533330 181340 VEH 1 (BUS) TRAVELLING W/B WHEN VEH 2 (CAR) PULLS OUT OF ST MARY AXE, HEADING WRONG WAY DOWN ONE WAY STREET. VEH2 PULLS TO SIDE OF ROAD BUT VEH 1 UNABLE TO STOP IN TIME1 North area Wormwood Street J/W Bishopsgate0.25 0.3 14760 1107
533330 181340 VEHICLE 1 PULLED UP TO JUNCTION, WAS THEN HIT BY BEHIND BY VEHICLE 2 1 North area Wormwood Street J/W Bishopsgate0.25 0.4 14760 1476
533140 181340 VEHICLE 1 BRAKED SUDDENLY - REASON UNKNOWN. SELF REPORT FORM 1 North area Wormwood Street J/W Bishopsgate0.5 0.4 14760 2952
533080 181240 VEHICLE 1 FRONT WHEEL WENT INTO 10INCH DEEP POTHOLE IN BISHOPSGATE, CAUSING RIDER TO FALL OFF. 1 Gracechurch Street, Bishopsgate0.5 0.4 14760 2952
533070 181130 VEHICLE 1 TRAVELLING EAST ON LEADENHALL STREET, CASUALTY 1 STEPPED OUT INTO THE ROAD WITHOUT CHECKING 2 Gracechurch Street, Bishopsgate0.25 0.5 191462 23932.75
533020 181120 VEHICLE 1 TRAVELLING ALONG CORNHILL , PEDESTRIAN STEPPED OUT IN FRONT OF THE VEHICLE CAUSING IT TO BRAKE SUDDENLY, THIS CAUSED THE 2 PASSENGERS IN THE REAR TO FALL FORWARD, NEITHER WEARING SEAT BELTS, CASUALTY 1 HIT FACE ON DIVIDING GLASS.1 Gracechurch Street, Bishopsgate0.25 0.6 14760 2214
533050 181210 CASUALTY 1 RAN ACROSS ROAD AND COLLIDED WITH VEHICLE 1. VEHICLE 2 BRAKED HEAVY AND VEHICLE 3 BRAKED BUT COLLIDED WITH REAR OF VEHICLE 2.1 Gracechurch Street, Bishopsgate0.5 0.7 14760 5166
533050 181210 CASUALTY 1 RAN ACROSS ROAD AND COLLIDED WITH VEHICLE 1. VEHICLE 2 BRAKED HEAVY AND VEHICLE 3 BRAKED BUT COLLIDED WITH REAR OF VEHICLE 2.1 Gracechurch Street, Bishopsgate0.5 0.7 14760 5166
533050 181210 VEHICLE 1 TRAVELLING SOUTH IN BISHOPSGATE. CROSSED THE TRAFFIC LIGHTS ON GREEN AT THE JUNCTION WITH THREADNEEDLE STREET. DRIVER BELIEVED TO HAVE HAD A FIT AND LOST CONTROL OF THE VEHICLE. VEHICLE VEERED ACROSS THE NORTHBOUND CARRIAGEWAY AND COLLIDED WITH 1 Gracechurch Street, Bishopsgate0.5 0.8 14760 5904
533220 181140 VEHICLE 1 TRAVELLING EAST IN LEADENHALL STREET. VEHICLE 3 WAITING TO TURN RIGHT INTO ST MARYS AXE. AS VEHICLE 1 TRAVELLED PAST VEHICLE 2, VEHICLE 2 TURNED, CAUSING VEHICLE 1 TO SWERVE. IT WOULD SEEM THAT VEHICLE 2 ALSO TURNED AT THE SAME TIME, HITTING VEH1 North area Bishopsgate, Great St Helen’s0.75 0.8 14760 8856

111
Glossary
ACCSTATS Accident Statistics database (online reporting)
ANPR Automatic Number Plate Recognition
CHI Crime Harm Index
CJU Criminal Justice Unit
CoLCHI City of London Collision Harm Index
CoLP City of London Police
CRS Collision Reporting System
DDACTS Data Driven Approaches to Crime, Congestion and Traffic Safety
DfT Department for Transport
ESRI Environmental Systems Research Institute (Mapping Software)
GIS Geographic Information System
GPS Global Positioning System
HGV Heavy Goods Vehicle
KSI Killed or Seriously Injured
LIP Local Implementation Plan
PACTS Parliamentary Advisory Council for Transport Safety
RPU Roads Policing Unit
SCRAS Standing Committee on Road Accident Statistics
STATS19 National Collision Database
STOT Safer Transport Operations Team
TFL Transport for London
UK United Kingdom
US United States
VPF Value in Preventing a Fatality
VRU Vulnerable Road User
WTF Willingness to Pay