Embed Size (px)
Citation preview

CANDIDATE FFS METHODS: Results of SCEC BBP Validation Evaluation: Overview of the validation process – Part A and B
Validation Group: N. Abrahamson, P. Somerville, F. Silva, P. Maechling, R. Archuleta, J. Anderson, K. Assatourians, G. Atkinson, J. Bayless, J. Crempien, C. Di Alessandro, R. Graves, T. Hyun, R. Kamai, K. Olsen, W. Silva, R. Takedatsu, F. Wang, K. Wooddell,, D. Dreger, G. Beroza, S. Day, T. Jordan, P. Spudich, J. Stewart and their collaborators…

Menu du jour
Introduction Validation framework and schemes Methods and input Results and evaluation tools Evaluation process
2
Large collaborative validation of simulations using the SCEC BroadBand Platform
Driven by need of seismic hazard projects to supplement recorded datasets South-Western U.S. utilities (SWUS) PEER NGA-East project (new CENA hazard model) PEER NGA-West projects
Southern California Earthquake Center (SCEC)
BroadBand Platform Set of computational tools for ground motion
simulations, including post-processing
Collaboration of SWUS-SCEC-PEER critical to success.
3

Past validations…
Source: Graves and Pitarka (2010)
4

Objectives Quantitative validation for forward
simulations in engineering problems Short term goal: supplement recorded data for
development of GMPEs and hazard analyses Long term goal: develop acceptance of
simulations for engineering design Key focus: 5% damped elastic “average”
PSA (f=0.1-100 Hz/ T=0.01-10 s)
5

Key lessons learned – past validations Need more transparency... Need to validate against many events Need clear documentation of fixed and optimized
parameters from modelers for each region Need source description that is consistent
between methods Use unique crustal structure (V, Q) for all models Consider multiple source realizations Run simulations for reference site conditions –
correct data with empirical site factors Make all validation metrics computation and plots
in uniform units/format – implement post-processing pipeline on BBP
Need to tie-in to specific code/BBP version 6

Validation schemes A. Validation against recorded earthquake
ground motions
B. Validation against GMPE for generic scenarios Validation allows for development of region-specific rules (source scaling, path)
7
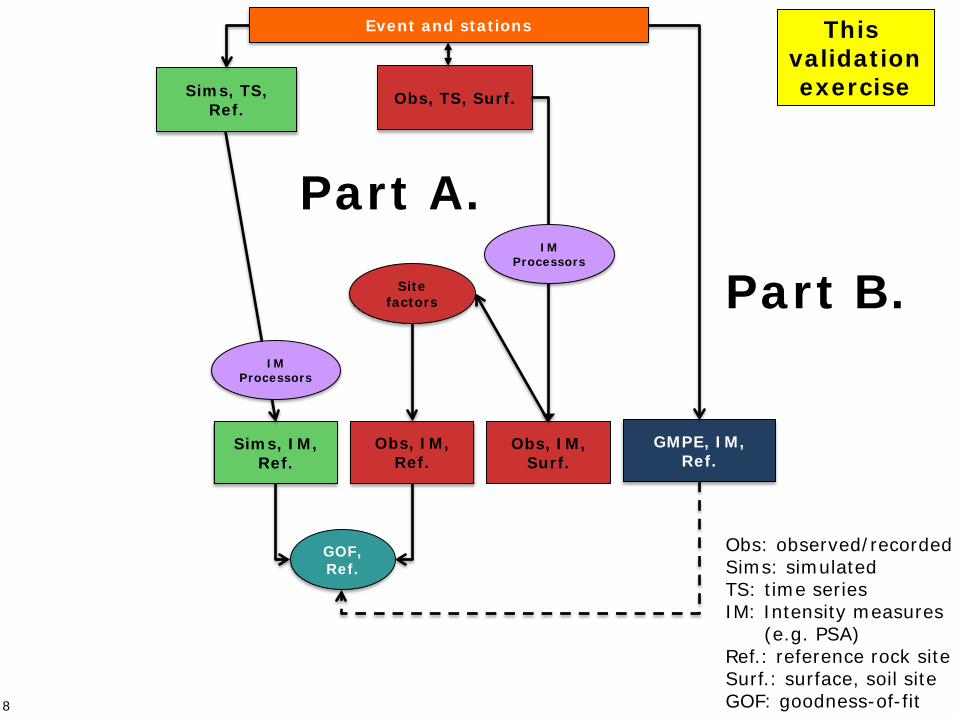
Obs, TS, Surf. Sims, TS, Ref.
Site factors
Obs, IM, Ref.
GOF, Ref.
GMPE, IM, Ref.
Sims, IM, Ref.
IM Processors
Obs, IM, Surf.
IM Processors
Event and stations
Obs: observed/recorded Sims: simulated TS: time series IM: Intensity measures (e.g. PSA) Ref.: reference rock site Surf.: surface, soil site GOF: goodness-of-fit
This validation exercise
Part A.
Part B.
8

Selection of events and stations Part A (comparison with recordings)
Large dataset (>20 EQs)
Many regions & tectonic environments
Span wide magnitude range (Mw 4.64 to 7.62)
Variety of mechanisms
Well-recorded (17 EQs with> 40 records)
Select a large subset of
stations (~40) that are consistent with mean and standard deviation PSa of the full dataset.
EQ NAME REGION
# RECORDS <200km
(*<1000km)
Mag. (Mw) Type
# SELECTED RECORDS
El Mayor Cucapah WUS 134 7.20 SS 40 Northridge WUS 124 6.72 REV 40
Hector Mine WUS 103 7.13 SS 40 Landers WUS 69 7.22 SS 40
Whittier Narrows WUS 95 5.89 REV OBL 40 Big Bear WUS 42 6.46 SS 28 Parkfield WUS 78 6.00 SS 40
Loma Prieta WUS 59 6.94 REV OBL 40 North Palm Springs WUS 32 6.21 REV OBL 32
Coalinga WUS 27 6.36 REV 27 San Simeon WUS 21 6.50 REV 21 Saguenay CENA 14* 5.90 REV OBL 14
Riviere-du-Loup CENA 98* 4.64 REV 40 Mineral, VA CENA 94* 5.70 REV 40
Tottori JAPAN 171 6.86 SS 40 Chuetsu-Oki JAPAN 286 6.80 REV 40
Niigata JAPAN 246 6.65 REV 40 Iwate JAPAN 186 6.90 REV 40
Kocaeli TURKEY 14 7.51 SS 14 Chi-Chi TAIWAN 257 7.62 REV OBL 40
L' Aquila ITALY 40 6.30 NML 40 Christchurch NEW ZEALAND 26 6.20 REV OBL 26
Darfield NEW ZEALAND 24 7.00 SS 24
9

Simulation Methodologies Broadband using Green’s functions
U. Nevada Reno Composite Source Model (CSM)
U. California Santa Barbara (UCSB) Stochastic methods (e.g. Brune spectrum)
SMSIM (point source) – not formally evaluated EXSIM
Hybrid - Green’s functions LF, Stochastic HF Graves and Pitarka (G&P) – sub-fault source
spectra San Diego State University (SDSU) –
scattering functions
Methods and Input
10

Input – Path (region-specific) For Green’s functions
LF: 1D velocity structures: Vs, Vp, rho, Qs, Qp
UCSB & UNR: Modified “equivalent” profile to account for Q(f)
All use a standard shallow velocity profile with Vs30 = 863 m/s
Stochastic methods Use region-specific empirical
models for Q(f), geometrical spreading and duration
Methods and Input
11

Process and nomenclature For each scenario, specification of: Source: Mw, geometry, location, hypocenter Path: consistent with 1D velocity model Site (as-recorded to reference): empirical site
correction factors from Boore et al. 2013 NGA-West2
For each scenario, seismograms generated for: 50 source realizations ~ 40 stations 2 horizontal dir.
Part A (comparison with recordings)
12
4,000 time series

Evaluation products Qualitative evaluation of velocity time series and
Husid plot based on Arias intensity
Part A (comparison with recordings)
SIMULATED Vs30 = 863 m/s
RECORDED Vs30 = 822 m/s
13

Evaluation products Part A (comparison with recordings)
14

Evaluation products Goodness-of-fit
measures for PSA and PGA Average GOF with
T for all stations within an event
Part A (comparison with recordings)
15

Evaluation products Goodness-of-fit
measures for PSa and PGA Average GOF with
T for all stations within an event
Average GOF for all realizations (all stations)
Part A (comparison with recordings)
Period (s)
16

Evaluation products Goodness-of-fit
measures for PSa and PGA Average GOF with
T for all stations within an event
Average GOF for all realizations (all stations)
Average GOF with distance (all realizations)
Part A (comparison with recordings)
17

Goodness-of-fit measures for PSa and PGA Average GOF with
T for all stations within an event
Average GOF for all realizations (all stations)
Average GOF with distance (all realizations)
Map of GOF (all relizations)
Part A (comparison with recordings)
Evaluation products
18

GOF plots also developed for NGA-West1
(2008) GMPEs SMSIM
Allows to see trends/event terms
Part A (comparison with recordings)
19
Evaluation products

Evaluation products Part A (comparison with recordings)
Summary table for GOF T bins R bins Events/M bins Mechanism
20

Scenario selection Selected 3 scenarios for which NGA-
West1&2 GMPEs are well constrained by data: M6.2 SS, 20 and 50 km M6.6 SS, 20 and 50 km M6.6 REV, 20 and 50 km
50 realizations of the source, WITH randomized hypocenter location for each
Simulations for two velocity models: NorCal and SoCal
Part B (comparison with GMPEs)
21

Evaluation criteria Part B (comparison with GMPEs)
22

Summary of Simulated Events
Tottori
Niigata
Whittier
Landers
Loma Prieta
Northridge
North Palm Springs
GMPEs 3 scenarios
Summary - Parts A and B

Evaluation 1. Documentation and self-assessment from Modelers – where is the method expected to work based on technical basis behind method
Evaluation
24

Evaluation 2. Evaluation committee Evaluate the method developer’s self-
assessments, request justification Evaluate the GOF for part A and B
PSA controlling factor in evaluation Various numerical criteria for bins of M, R, T:
(e.g. improvement relative to GMPEs, trends with distance)
“Verdict” for each methodology Applicable NOW for a given region, distance,
bandwidth? Limitations (close R, large M, etc.)? Method needs refinement?
Evaluation
25

References Atkinson, G. M., D. M. Boore, K. Assatourians, K. Campbell and D. Motazedian (2009). A guide to differences between stochastic
point-source and stochastic finite-fault simulations, Bull. Seism. Soc. Am. 99, 3192-3201. Beresnev, I., and G. Atkinson (1998a).FINSIM: a FORTRAN program for simulating stochastic acceleration time histories from finite
faults, Seism. Res. Lett. 69, 27–32. Boore, D. M, Stewart, J. P., Seyhan, E and Atkinson, G. M. (2013) “NGA-West2 Equations for Predicting Response Spectral
Accelerations for Shallow Crustal Earthquakes,” Pacific Earthquake Engineering Research Center report 2013/05. Boore, D. M. (2009). Comparing stochastic point-source and finite-source ground-motion simulations: SMSIM and EXSIM, Bull.
Seism. Soc. Am. 99, 3202-3216. Boore, D. M. (2005). SMSIM--Fortran Programs for Simulating Ground Motions from Earthquakes: Version 2.3--A Revision of OFR
96-80-A , U.S. Geological Survey Open-File Report Brune, J. N. (1970). Tectonic stress and the spectra of seismic shear waves from earthquakes, J. Geophys. Res., 76, 5002. Graves, R. A. Pitarka (2010). Broadband ground motion simulation using hybrid approach, Bulletin of Seismological Society of
America. Bull. Seism. Soc. Am., 100, 5A, 2095-2123. Irikura, K. and H. Miyake (2010). Recipe for Predicting Strong Ground Motion from Crustal Earthquake Scenarios, Pure and Applied
Geophysics, DOI 10.1007/s00024-010-0150-9. Liu, P., R. J. Archuleta and S. H. Hartzell (2006). Prediction of broadband ground-motion time histories: Hybrid low/high-frequency
method with correlated random source parameters, Bull. Seismol. Soc. Am., 96, 2118-2130, doi: 10.1785/0120060036. Mai, P.M., Imperatori, W., Olsen, K.B. (2010), Hybrid Broadband Ground-Motion Simulations: Combining Long-Period Deterministic
Synthetics with High-Frequency Multiple S-to-S Backscattering, BSSA, 100(5A), pp. 2124-2142. Mena, B. and Mai, P. M., Olsen, K. B., Purvance, M. D. and Brune, J. N. (2010). Hybrid Broadband Ground-Motion Simulation Using
Scattering Green's Functions: Application to Large-Magnitude Events, Bull. Seism. Soc. Am. 100, 2143-2162. Motazedian, D., and G. M. Atkinson (2005). Stochastic finite-fault modeling based on a dynamic corner frequency, Bull. Seismol.
Soc. Am. 95, 995 – 1010. Dreger, D. S., Beroza, G. C., Day, S. M., Goulet, C. A., Jordan, T. H., Spudich, P. A and Stewart, J. P. (2013) Evaluation of SCEC
Broadband Platform Phase 1 Ground Motion Simulation Results. SCEC internal report, Aug. 1 2013. Schmedes, J., R. J. Archuleta, and D. Lavallée, (2012). A kinematic rupture model generator incorporating spatial interdependency
of earthquake source parameters, Geophys. J. Int., doi: 10.1093/gji/ggs021 Schmedes, J., R. J. Archuleta, and D. Lavallée (2010). Correlation of earthquake source parameters inferred from dynamic rupture
simulations, J. Geophys. Res., 115, B03304, doi:10.1029/2009JB006689. Schmedes, J., R. J. Archuleta, and D. Lavallée (2010). Dependency of supershear transition and ground motion on the
autocorrelation of initial stress, Tectonophysics, 493, 222-235, doi: 10.1016/j.tecto.2010.05.013 Somerville, P. G., Callaghan, S., Maechling, P., Graves, R. W., Collins, N., Olsen, K. B., Imperatori, W., Jones, M., Archuleta, R.,
Schmedes, J., And Jordan, T.H. (2011). The SCEC Broadband Ground Motion Simulation Platform, SRL, 82(2), p. 275, 10.1785/gssrl.82.2.273.
Zeng, Y., J. G. Anderson and G. Yu (1994). A composite source model for computing realistic synthetic strong ground motions, Geophysical Research Letters 21, 725-728.
Zhu, L. & Rivera, L. A. (2002) A note on the dynamic and static displacements from a point source in multilayered media, Geophysical Journal International, Volume 148, Issue 3, pp. 619-627.