Embed Size (px)
Citation preview
Telemark University College
Faculty of Technology Kjølnes 3914 Porsgrunn Norway Lower Degree Programmes – M.Sc. Programmes – Ph.D. Programmes TFver. 0.9
Master’s Thesis 2013
Candidate: Ahmed Gurhan
Title: Design and Development of
Windows Store Application for
Measurements and Monitoring
2
Telemark University College Faculty of Technology
M.Sc. Programme
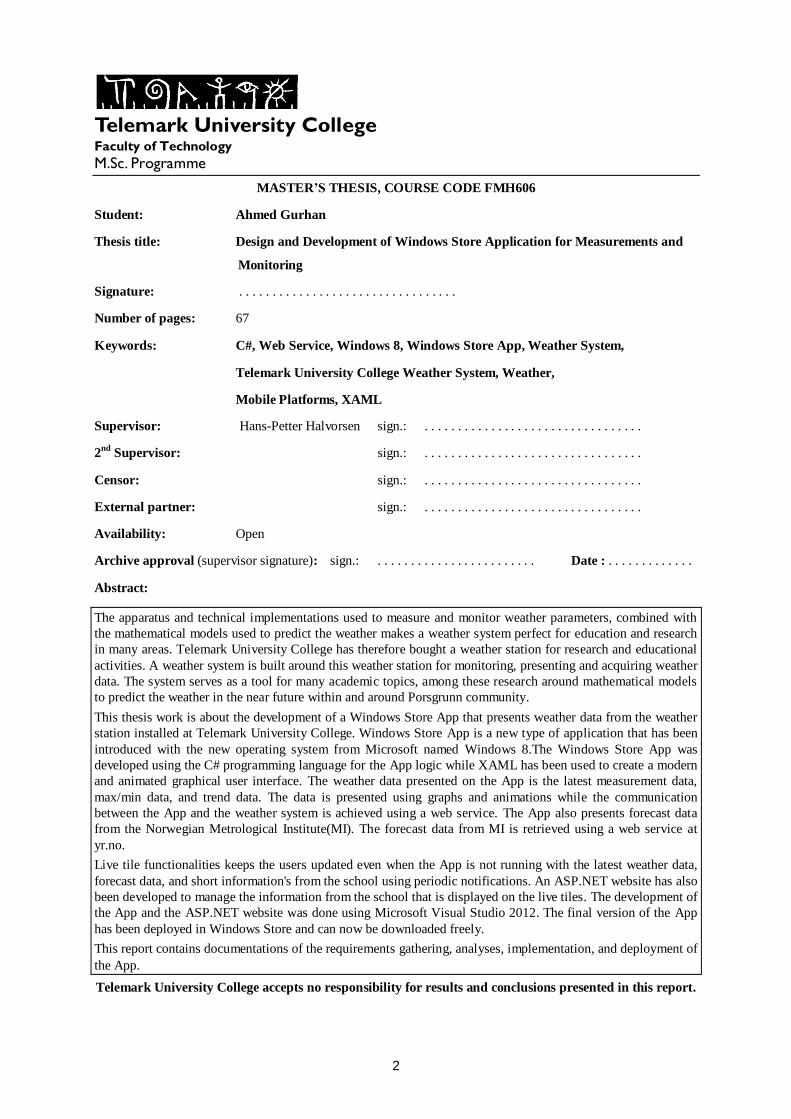
MASTER’S THESIS, COURSE CODE FMH606
Student: Ahmed Gurhan
Thesis title: Design and Development of Windows Store Application for Measurements and
. Monitoring
Signature: . . . . . . . . . . . . . . . . . . . . . . . . . . . . . . . . .
Number of pages: 67
Keywords: C#, Web Service, Windows 8, Windows Store App, Weather System,
Telemark University College Weather System, Weather,
Mobile Platforms, XAML
Supervisor: Hans-Petter Halvorsen sign.: . . . . . . . . . . . . . . . . . . . . . . . . . . . . . . . . .
2nd
Supervisor: sign.: . . . . . . . . . . . . . . . . . . . . . . . . . . . . . . . . .
Censor: sign.: . . . . . . . . . . . . . . . . . . . . . . . . . . . . . . . . .
External partner: sign.: . . . . . . . . . . . . . . . . . . . . . . . . . . . . . . . . .
Availability: Open
Archive approval (supervisor signature): sign.: . . . . . . . . . . . . . . . . . . . . . . . . Date : . . . . . . . . . . . . .
Abstract:
The apparatus and technical implementations used to measure and monitor weather parameters, combined with
the mathematical models used to predict the weather makes a weather system perfect for education and research
in many areas. Telemark University College has therefore bought a weather station for research and educational
activities. A weather system is built around this weather station for monitoring, presenting and acquiring weather
data. The system serves as a tool for many academic topics, among these research around mathematical models
to predict the weather in the near future within and around Porsgrunn community.
This thesis work is about the development of a Windows Store App that presents weather data from the weather
station installed at Telemark University College. Windows Store App is a new type of application that has been
introduced with the new operating system from Microsoft named Windows 8.The Windows Store App was
developed using the C# programming language for the App logic while XAML has been used to create a modern
and animated graphical user interface. The weather data presented on the App is the latest measurement data,
max/min data, and trend data. The data is presented using graphs and animations while the communication
between the App and the weather system is achieved using a web service. The App also presents forecast data
from the Norwegian Metrological Institute(MI). The forecast data from MI is retrieved using a web service at
yr.no.
Live tile functionalities keeps the users updated even when the App is not running with the latest weather data,
forecast data, and short information's from the school using periodic notifications. An ASP.NET website has also
been developed to manage the information from the school that is displayed on the live tiles. The development of
the App and the ASP.NET website was done using Microsoft Visual Studio 2012. The final version of the App
has been deployed in Windows Store and can now be downloaded freely.
This report contains documentations of the requirements gathering, analyses, implementation, and deployment of
the App.
Telemark University College accepts no responsibility for results and conclusions presented in this report.
3
Table of Contents
PREFACE .............................................................................................................................................................. 5
NOMENCLATURE .............................................................................................................................................. 6
PART I: OVERVIEW ....................................................................................................................................... 7
1 INTRODUCTION .......................................................................................................................................... 8
1.1 Previous Work ...................................................................................................................................... 9
1.2 Objective ............................................................................................................................................ 10
1.3 Report Structure ................................................................................................................................. 11
2 SYSTEM DESCRIPTION ............................................................................................................................. 12
2.1 Weather Station System ...................................................................................................................... 12
2.1.1 The Control Module ......................................................................................................................................... 13 2.1.2 Sensors .............................................................................................................................................................. 13 2.1.3 Weather Microserver™ .................................................................................................................................... 14
3 WEATHER SYSTEM PROJECT ................................................................................................................... 15
3.1 System Server ..................................................................................................................................... 15
3.2 Weather Modbus Service.................................................................................................................... 15
3.3 Weather System Database .................................................................................................................. 16
3.3.1 E/R Diagram ..................................................................................................................................................... 17 3.3.2 SQL - Structure Query Language .................................................................................................................... 18 3.3.3 Stored Procedures ............................................................................................................................................. 19
3.4 Weather SDK...................................................................................................................................... 20
3.4.1 Weather System Web Service.......................................................................................................................... 22
PART II: THEORY ..................................................................................................................................... 24
4 MOBILE PLATFORMS ............................................................................................................................... 25
4.1 Overview ............................................................................................................................................ 25
4.2 iOS ..................................................................................................................................................... 26
4.3 Android .............................................................................................................................................. 27
4.4 Windows 8 .......................................................................................................................................... 28
4.5 Apps for Engineers ............................................................................................................................. 29
4.5.1 Data Dashboard for LabVIEW ........................................................................................................................ 30 4.5.2 NI cDAQ-9191 Data Display .......................................................................................................................... 31
5 WINDOWS STORE APPS ........................................................................................................................... 32
5.1 Live Tiles ............................................................................................................................................ 33
5.2 Local, Periodic, Scheduled and Push Notifications ........................................................................... 33
5.2.1 Local Notifications ........................................................................................................................................... 34 5.2.2 Scheduled Notifications ................................................................................................................................... 34 5.2.3 Periodic Notifications ....................................................................................................................................... 35 5.2.4 Push Notifications............................................................................................................................................. 35
5.3 App Pages and Navigation ................................................................................................................. 36
5.4 App Lifecycle ...................................................................................................................................... 37
5.5 C# ....................................................................................................................................................... 38
5.6 XAML ................................................................................................................................................. 38
5.7 Splash Screen ..................................................................................................................................... 39
5.8 Windows App Store Certification Kit(WACK) ................................................................................... 39
PART III: ANALYSIS AND REQUIREMENTS ....................................................................................... 40
4
6 ANALYSIS AND REQUIREMENTS .............................................................................................................. 41
6.1 Requirements...................................................................................................................................... 41
6.2 Graphical User Interface ................................................................................................................... 42
6.2.1 Live Tile ............................................................................................................................................................ 43 6.2.2 Main Page ......................................................................................................................................................... 44 6.2.3 Trends ................................................................................................................................................................ 44
PART IV: IMPLEMENTATION, TESTING, AND DEPLOYMENT ..................................................... 45
7 IMPLEMENTATION ................................................................................................................................... 46
7.1 App Pages and Navigation ................................................................................................................. 47
7.2 Extended Splash Screen ..................................................................................................................... 48
7.3 Main Page .......................................................................................................................................... 49
7.4 Weather Trends Pages ....................................................................................................................... 52
7.4.1 WinRT XAML Toolkit .................................................................................................................................... 53
7.5 Forecast Page .................................................................................................................................... 53
7.6 Live Tile ............................................................................................................................................. 54
7.7 ASP.NET Website ............................................................................................................................... 55
8 USING DATA DASHBOARD ON WINDOWS 8 ............................................................................................. 58
9 TESTING AND DEPLOYMENT .................................................................................................................... 59
9.1 Windows Store App Certification Kit(WACK) Test ............................................................................ 59
9.2 Deployment ........................................................................................................................................ 60
PART V: SUMMARY ................................................................................................................................. 61
10 DISCUSSIONS ........................................................................................................................................... 62
10.1 Future Work .................................................................................................................................. 62
11 SUMMARY ............................................................................................................................................... 63
12 REFERENCES ............................................................................................................................................ 64
PART VI: APPENDICES ............................................................................................................................. 66
13 APPENDICES ............................................................................................................................................ 67

5
Preface
This master thesis report is written as part of the requirements for the award of a Master of
Science (M.Sc.) degree in Systems and Control Engineering at Telemark University College
(Høgskolen I Telemark). The report covers the process of designing and developing a
Windows Store App for Measurements and Monitoring. The report is aimed at readers with
some programming knowledge, however the level of code details is kept to a minimum and
replaced with flowcharts and figures.
The entire work has been carried out within the campus of Telemark University College.
Some of the necessary data's needed has been acquired from the previous project " Design and
Implementation of Weather System for Acquiring and Monitoring of Weather Data"[3], fall
2012 at Telemark University College.
I would like to thank my supervisor Hans-Petter Halvorsen at the Faculty of Technology, in
Telemark University College, who has always been within reach to provide guidance
throughout the duration of the thesis work.
Porsgrunn
Ahmed Gurhan
6
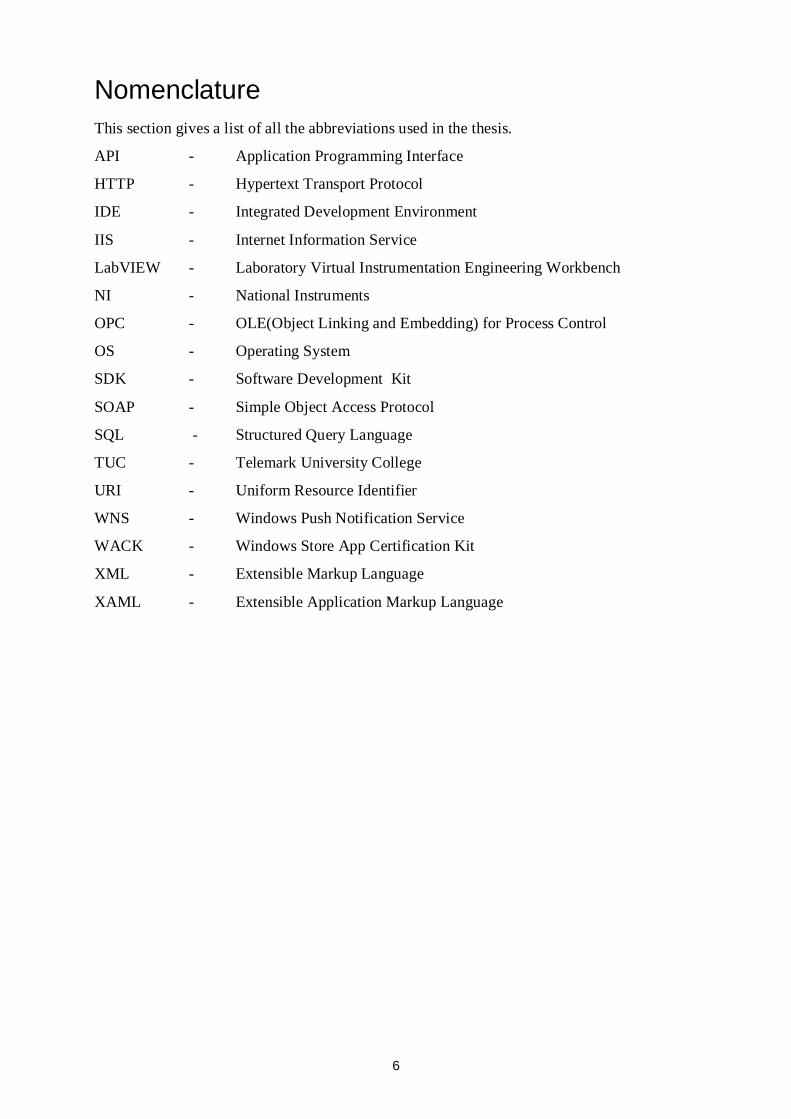
Nomenclature
This section gives a list of all the abbreviations used in the thesis.
API - Application Programming Interface
HTTP - Hypertext Transport Protocol
IDE - Integrated Development Environment
IIS - Internet Information Service
LabVIEW - Laboratory Virtual Instrumentation Engineering Workbench
NI - National Instruments
OPC - OLE(Object Linking and Embedding) for Process Control
OS - Operating System
SDK - Software Development Kit
SOAP - Simple Object Access Protocol
SQL - Structured Query Language
TUC - Telemark University College
URI - Uniform Resource Identifier
WNS - Windows Push Notification Service
WACK - Windows Store App Certification Kit
XML - Extensible Markup Language
XAML - Extensible Application Markup Language

7
Part I: Overview
8
1 Introduction
Weather is a phenomena that plays an important factor in our daily lives, and we often make
our plans based on the current weather or the forecast for the coming days, or even weeks. A
lot of research has been done to improve our knowledge about the weather, and new apparatus
has been developed to measure and monitor weather parameters. Advanced mathematical
models has been developed to predict the weather for short and long term. With the
technological development we are today able to predict the weather with an increasing
accuracy.
The apparatus and technical implementations used to measure and monitor weather
parameters, combined with the mathematical models used to predict the weather makes a
weather system perfect for education and research in many areas.
Telemark University College has therefore bought a weather station for research and
educational activities from Colombia Weather Systems, Inc[4]. The weather station is
installed in building C of the campus in Porsgrunn.
During fall of 2012 a group of students designed and implemented a "weather system"
consisting of a server and various software applications for monitoring, presenting and
acquiring data from this weather station[3]. The implemented system serves as a tool for
many academic topics, among these research around mathematical models to predict the
weather in the near future within and around Porsgrunn community.
The data from the weather system is also of interest for the public in general, to check the
latest observations or the next day's forecast from the local weather station. Therefore it's
important to present the weather data in formats that are consistent with the latest trends in
information technology.
Currently the new big thing is the release of Windows 8 from Microsoft. The new operating
system works both on ordinary computers as well as on tablets. Tablets are today widely used
because of their light weight, size and fast operating system. Their large touch screen makes
them a preferred option in many situations, and a perfect device for content consumption.
However the lack of powerful operating system has limited the possibilities for content
creation on tablets.
The release of Windows 8 changes this. The fact that a full scale operating system now can
run on tablets opens enormous possibilities. This means that a tablet now can do almost
everything an ordinary computer can do. In addition the tablet offers portability and a touch
oriented environment.
Windows 8 also introduced new type of applications called "Windows Store Apps" that runs
on the new user interface, modern UI. This report contains the design and development of a
Windows Store App for measurements and monitoring using the weather system installed in
Telemark University College.
9
1.1 Previous Work
As mentioned earlier a student project was carried out to implement a system for monitoring,
presenting, and acquiring data from the new weather station. The implemented system is built
around a custom made database system for logging weather data. The database system is
installed on a server in building B of the campus in Porsgrunn. The communication between
the database and the weather station in building C is established over the school network.
An important part of the project was to make the weather data available for students and
teachers in various formats. The implemented system therefore contains an OPC server for
live weather data retrieval within the school network.
The systems also contains a Weather SDK allowing external applications access to the stored
weather data. The Weather SDK includes a general web service for data access over the
internet.
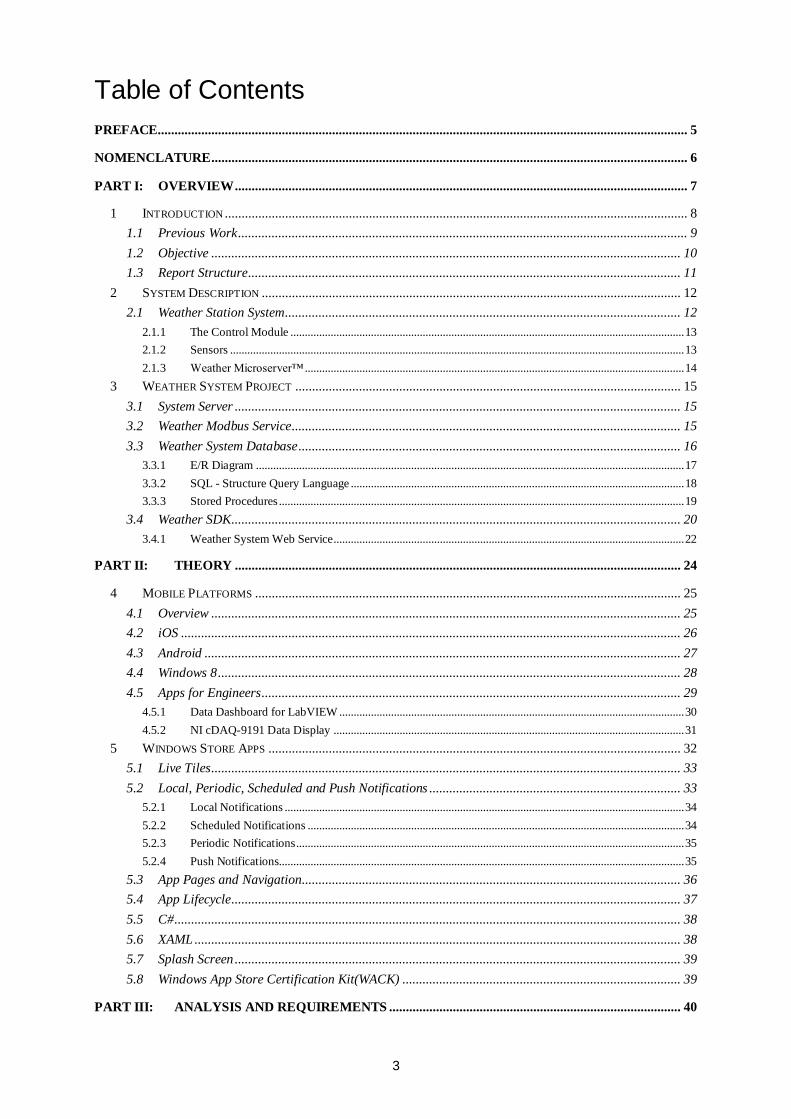
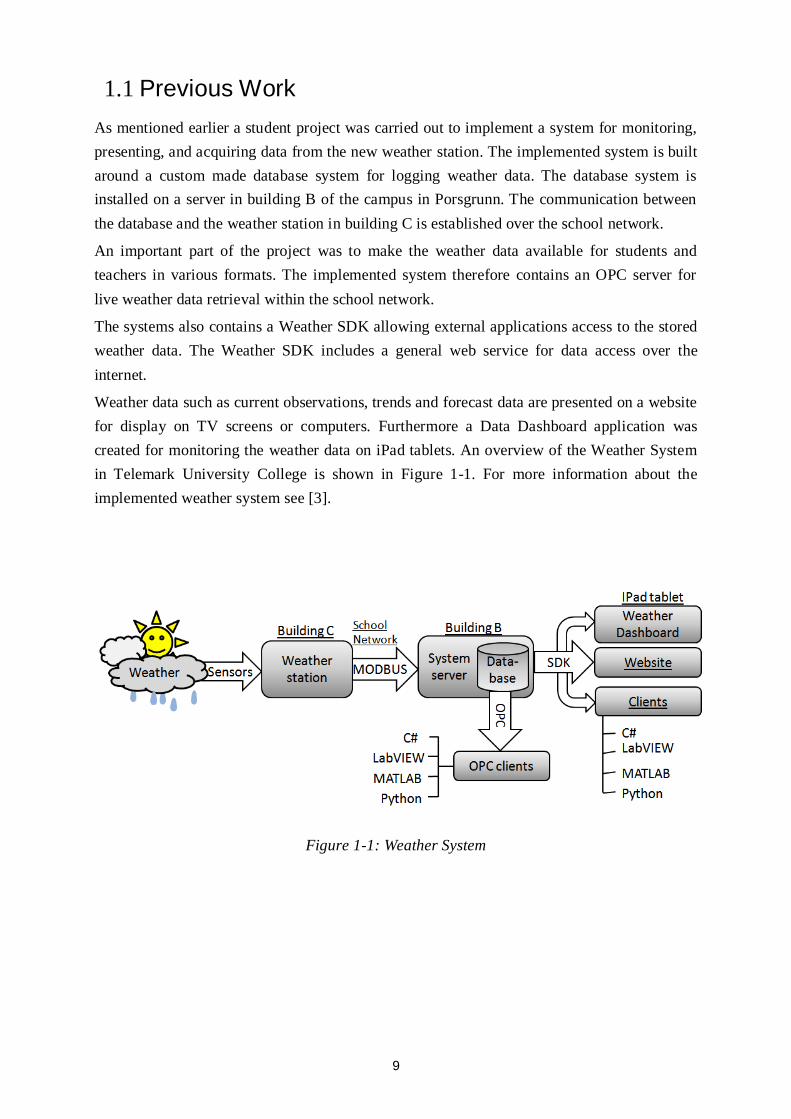
Weather data such as current observations, trends and forecast data are presented on a website
for display on TV screens or computers. Furthermore a Data Dashboard application was
created for monitoring the weather data on iPad tablets. An overview of the Weather System
in Telemark University College is shown in Figure 1-1. For more information about the
implemented weather system see [3].
Figure 1-1: Weather System
10
1.2 Objective
The main objective of this work is to design and develop a Windows Store App for
measurements and monitoring. The work will focus on creating a draft from scratch, and
implement a native application using C# and XAML. The application will retrieve data from
the weather system using a web service in the Weather SDK for communication. Therefore
the installed weather system will be studied, and custom modifications will be implemented.
Current observations, trends and forecast data will be presented on the application. The final
version of the application will be tested and deployed on Windows Store.
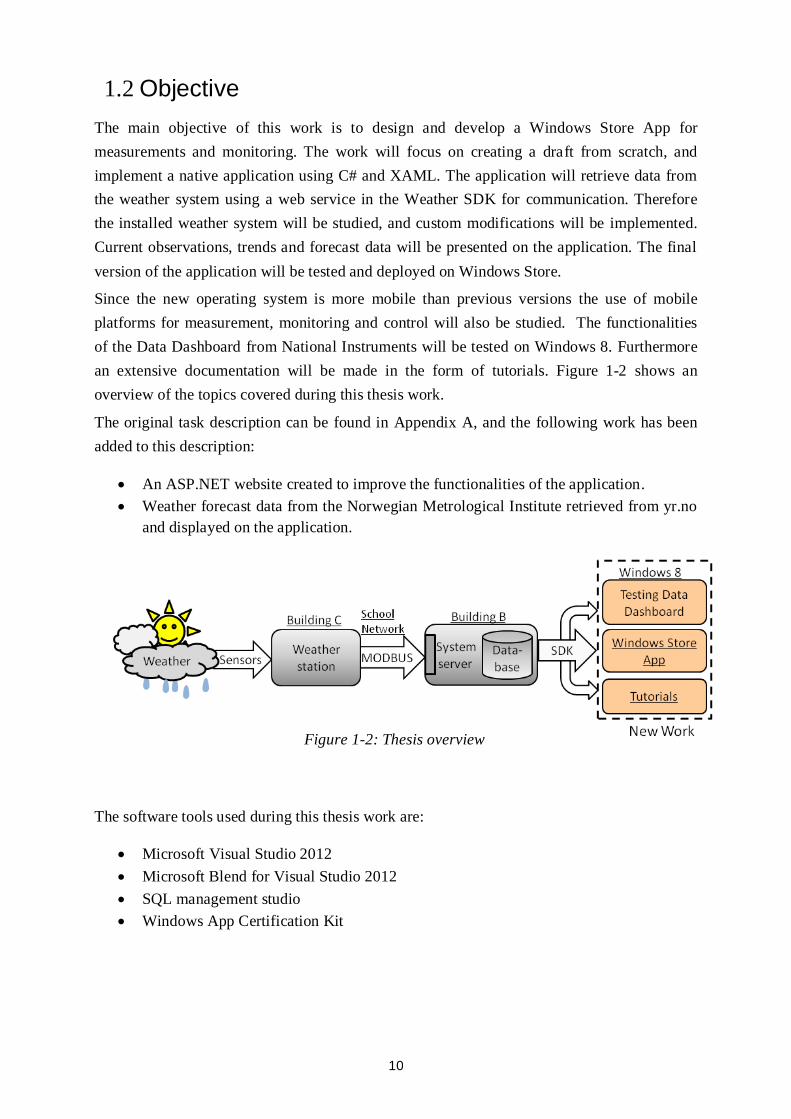
Since the new operating system is more mobile than previous versions the use of mobile
platforms for measurement, monitoring and control will also be studied. The functionalities
of the Data Dashboard from National Instruments will be tested on Windows 8. Furthermore
an extensive documentation will be made in the form of tutorials. Figure 1-2 shows an
overview of the topics covered during this thesis work.
The original task description can be found in Appendix A, and the following work has been
added to this description:
An ASP.NET website created to improve the functionalities of the application.
Weather forecast data from the Norwegian Metrological Institute retrieved from yr.no
and displayed on the application.
The software tools used during this thesis work are:
Microsoft Visual Studio 2012
Microsoft Blend for Visual Studio 2012
SQL management studio
Windows App Certification Kit
Figure 1-2: Thesis overview
11
1.3 Report Structure
Chapter 2: Gives an overview of the different parts in the weather station from Colombia
Weather Systems.
Chapter 3: Discusses the weather system built around the weather station from Colombia
Weather Systems, and how this system has been used during this thesis work.
Chapter 4: Gives an overview of the major mobile platforms and the increasing use of these
platforms for engineering activities
Chapter 5: Gives first an introduction on how Windows Store Apps are different from
ordinary applications. Then important concepts of Windows Store Apps are discussed.
Chapter 6: Discusses the requirement gathering and analyses process prior to the
implementation.
Chapter 7: Discusses the technical implementation of the App and a website created during
this thesis work.
Chapter 8: Discusses how to use the Data Dashboard for LabVIEW App in Windows 8 to
retrieve weather data from the weather system.
Chapter 9: Discusses the testing and deployment of the App created during this thesis work.
Chapter 10: Discussions and future work recommendations.
Chapter 11: Gives a summary of the work done during this thesis work.
12
2 System Description
In order to fully appreciate the work described in this report it is necessary to have a brief
understanding of the weather station from Colombia weather systems. This chapter will
discuss and give an overview of the different parts in the weather station. For a more detailed
information about the weather station see [3].
2.1 Weather Station System
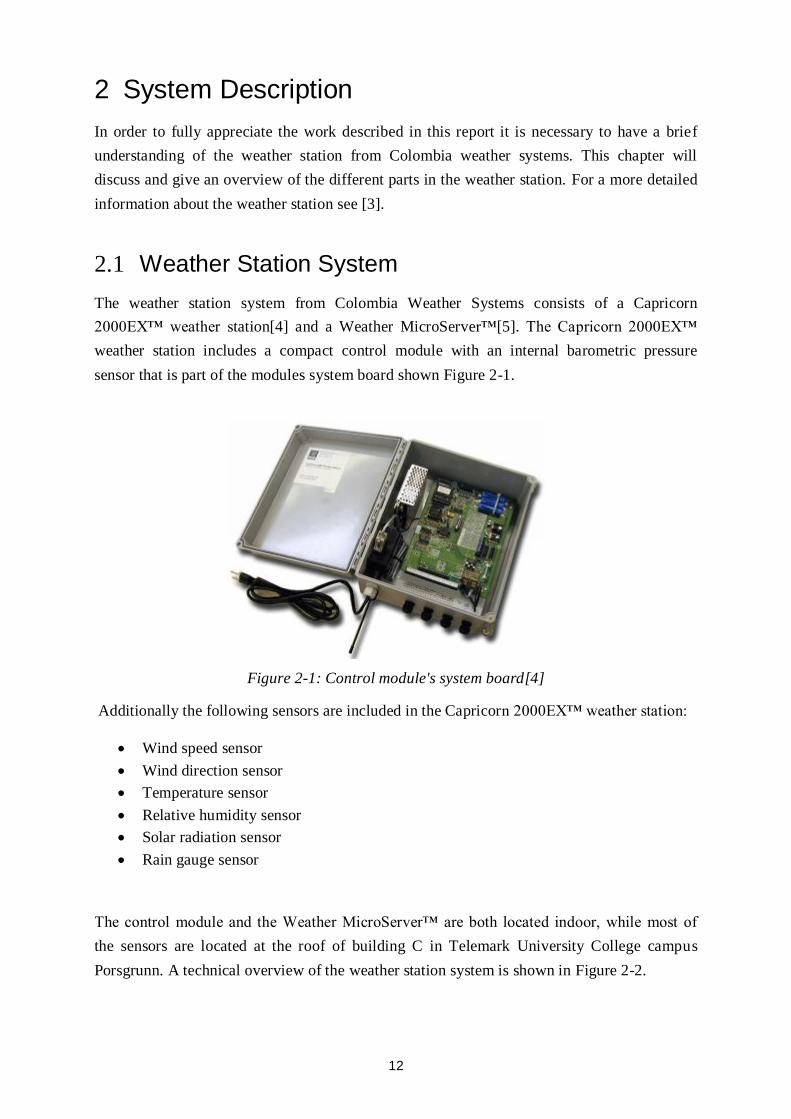
The weather station system from Colombia Weather Systems consists of a Capricorn
2000EX™ weather station[4] and a Weather MicroServer™[5]. The Capricorn 2000EX™
weather station includes a compact control module with an internal barometric pressure
sensor that is part of the modules system board shown Figure 2-1.
Figure 2-1: Control module's system board[4]
Additionally the following sensors are included in the Capricorn 2000EX™ weather station:
Wind speed sensor
Wind direction sensor
Temperature sensor
Relative humidity sensor
Solar radiation sensor
Rain gauge sensor
The control module and the Weather MicroServer™ are both located indoor, while most of
the sensors are located at the roof of building C in Telemark University College campus
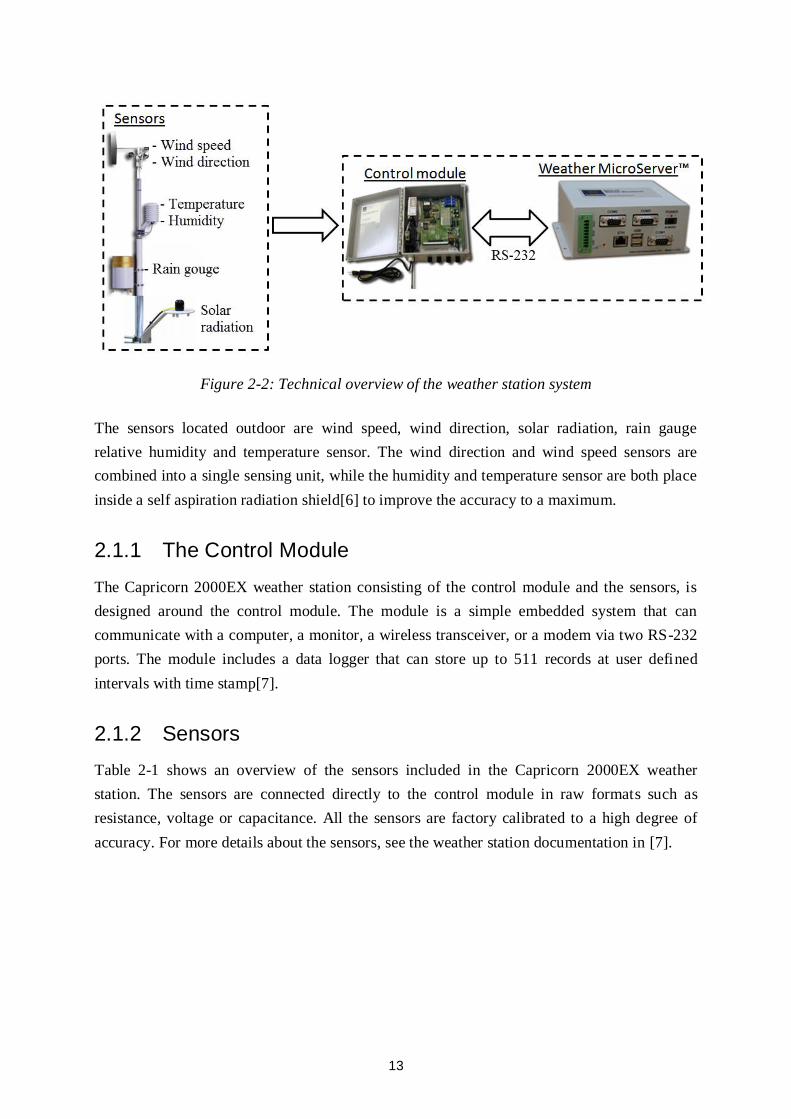
Porsgrunn. A technical overview of the weather station system is shown in Figure 2-2.
13
The sensors located outdoor are wind speed, wind direction, solar radiation, rain gauge
relative humidity and temperature sensor. The wind direction and wind speed sensors are
combined into a single sensing unit, while the humidity and temperature sensor are both place
inside a self aspiration radiation shield[6] to improve the accuracy to a maximum.
2.1.1 The Control Module
The Capricorn 2000EX weather station consisting of the control module and the sensors, is
designed around the control module. The module is a simple embedded system that can
communicate with a computer, a monitor, a wireless transceiver, or a modem via two RS-232
ports. The module includes a data logger that can store up to 511 records at user defined
intervals with time stamp[7].
2.1.2 Sensors
Table 2-1 shows an overview of the sensors included in the Capricorn 2000EX weather
station. The sensors are connected directly to the control module in raw formats such as
resistance, voltage or capacitance. All the sensors are factory calibrated to a high degree of
accuracy. For more details about the sensors, see the weather station documentation in [7].
Figure 2-2: Technical overview of the weather station system
14
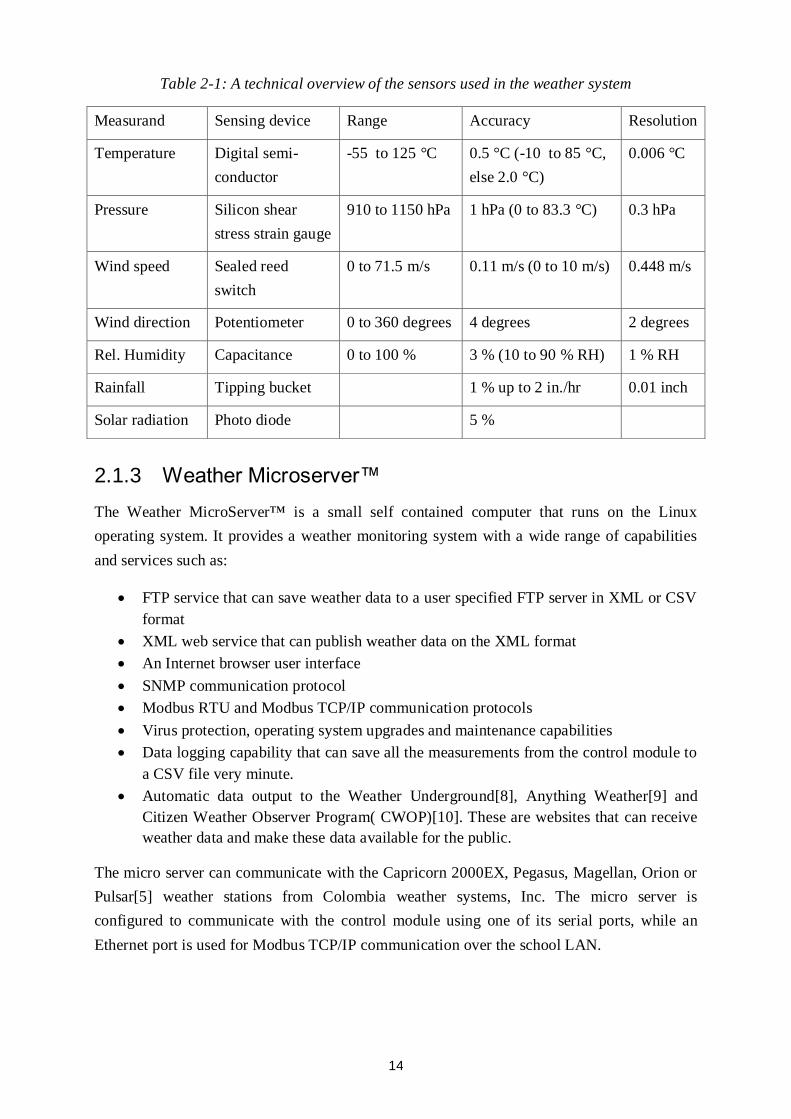
Table 2-1: A technical overview of the sensors used in the weather system
Measurand Sensing device Range Accuracy Resolution
Temperature Digital semi-
conductor
-55 to 125 °C 0.5 °C (-10 to 85 °C,
else 2.0 °C)
0.006 °C
Pressure Silicon shear
stress strain gauge
910 to 1150 hPa 1 hPa (0 to 83.3 °C) 0.3 hPa
Wind speed Sealed reed
switch
0 to 71.5 m/s 0.11 m/s (0 to 10 m/s) 0.448 m/s
Wind direction Potentiometer 0 to 360 degrees 4 degrees 2 degrees
Rel. Humidity Capacitance 0 to 100 % 3 % (10 to 90 % RH) 1 % RH
Rainfall Tipping bucket 1 % up to 2 in./hr 0.01 inch
Solar radiation Photo diode 5 %
2.1.3 Weather Microserver™
The Weather MicroServer™ is a small self contained computer that runs on the Linux
operating system. It provides a weather monitoring system with a wide range of capabilities
and services such as:
FTP service that can save weather data to a user specified FTP server in XML or CSV
format
XML web service that can publish weather data on the XML format
An Internet browser user interface
SNMP communication protocol
Modbus RTU and Modbus TCP/IP communication protocols
Virus protection, operating system upgrades and maintenance capabilities
Data logging capability that can save all the measurements from the control module to
a CSV file very minute.
Automatic data output to the Weather Underground[8], Anything Weather[9] and
Citizen Weather Observer Program( CWOP)[10]. These are websites that can receive
weather data and make these data available for the public.
The micro server can communicate with the Capricorn 2000EX, Pegasus, Magellan, Orion or
Pulsar[5] weather stations from Colombia weather systems, Inc. The micro server is
configured to communicate with the control module using one of its serial ports, while an
Ethernet port is used for Modbus TCP/IP communication over the school LAN.
15
3 Weather System Project
The system implemented around the weather station is used to retrieve weather data for
display on the Windows Store App developed during this thesis work. The system is quite
complex and consists of many parts therefore this chapter will only give an overview of the
most relevant topics for this thesis work. For a more in depth information about the weather
system see [3].
3.1 System Server
The weather system server is an ordinary computer running Windows server 2008[11]
dedicated for saving data from the weather station. The server is located on the ceiling of
Building B and houses the weather system database, web services and a website.
3.2 Weather Modbus Service
A Modbus application is used for the communication between the weather station and the
database running on the system server. The application is created using LabVIEW[12], and
utilises the Modbus TCP/IP protocol for the communication across the school network.
Modbus is a communication protocol positioned at level 7 of the OSI model. It provides a
client/server communication between devices connected on different types of buses or
networks[13]. The protocol is based on request/response methods and offers services
specified by function codes. Modbus is the most widely used network protocol in industrial
manufacturing and can be implemented using Ethernet( Modbus TCP/IP) or serial port
( Modbus RTU & Modbus ASCII)[14].
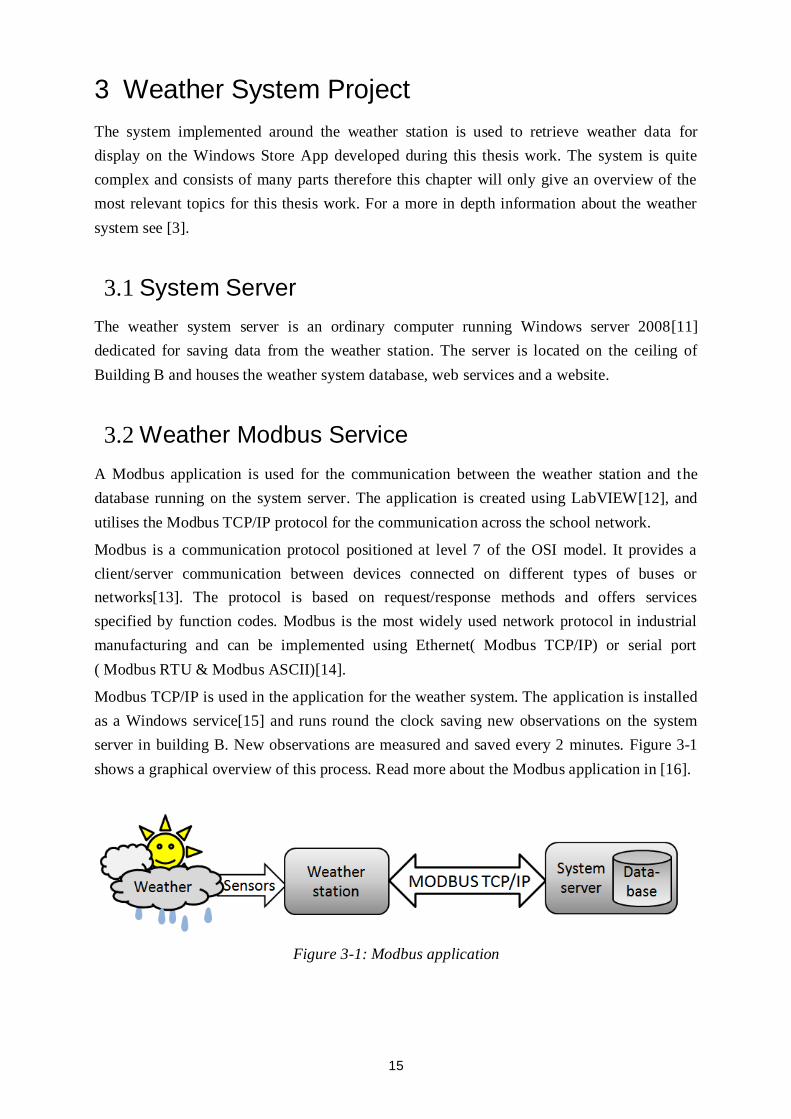
Modbus TCP/IP is used in the application for the weather system. The application is installed
as a Windows service[15] and runs round the clock saving new observations on the system
server in building B. New observations are measured and saved every 2 minutes. Figure 3-1
shows a graphical overview of this process. Read more about the Modbus application in [16].
Figure 3-1: Modbus application
16
3.3 Weather System Database
The weather system database runs 24/7 on the system server storing the incoming data from
the Modbus application, and serving the data to external applications. The database is based
on the relational database model and consists of 11 tables that are used to store current
observations, historical data, trends, and forecast data.
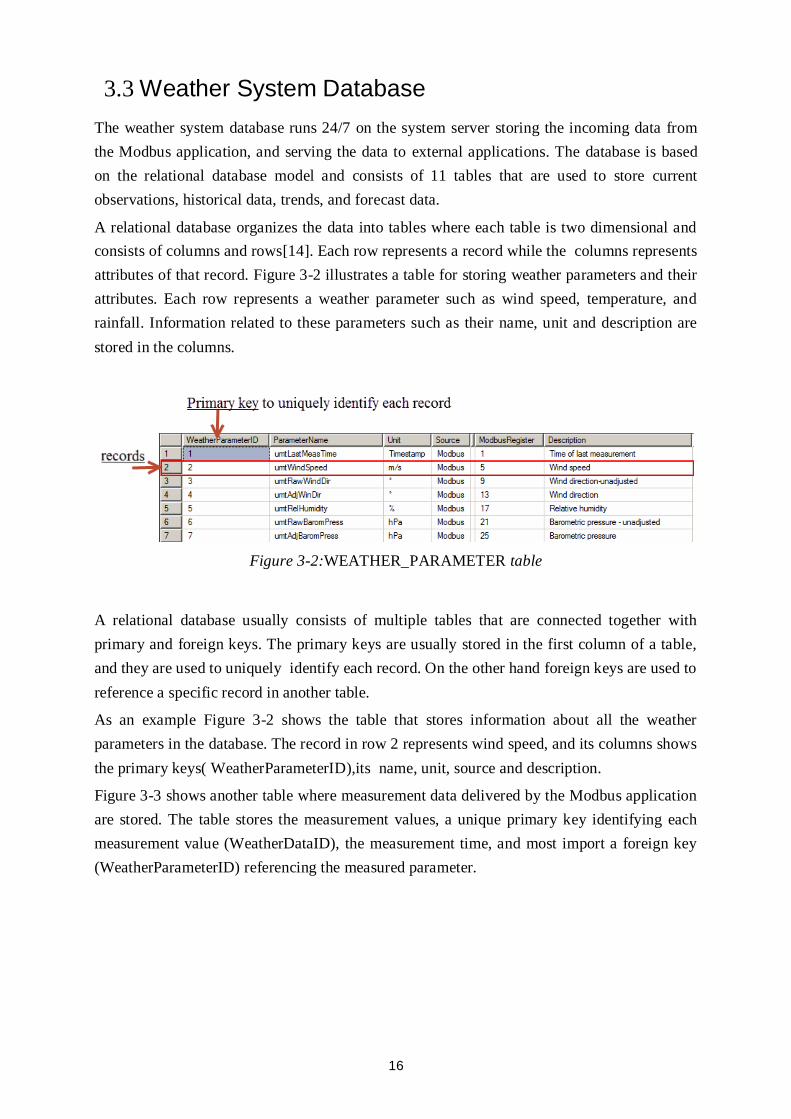
A relational database organizes the data into tables where each table is two dimensional and
consists of columns and rows[14]. Each row represents a record while the columns represents
attributes of that record. Figure 3-2 illustrates a table for storing weather parameters and their
attributes. Each row represents a weather parameter such as wind speed, temperature, and
rainfall. Information related to these parameters such as their name, unit and description are
stored in the columns.
Figure 3-2:WEATHER_PARAMETER table
A relational database usually consists of multiple tables that are connected together with
primary and foreign keys. The primary keys are usually stored in the first column of a table,
and they are used to uniquely identify each record. On the other hand foreign keys are used to
reference a specific record in another table.
As an example Figure 3-2 shows the table that stores information about all the weather
parameters in the database. The record in row 2 represents wind speed, and its columns shows
the primary keys( WeatherParameterID),its name, unit, source and description.
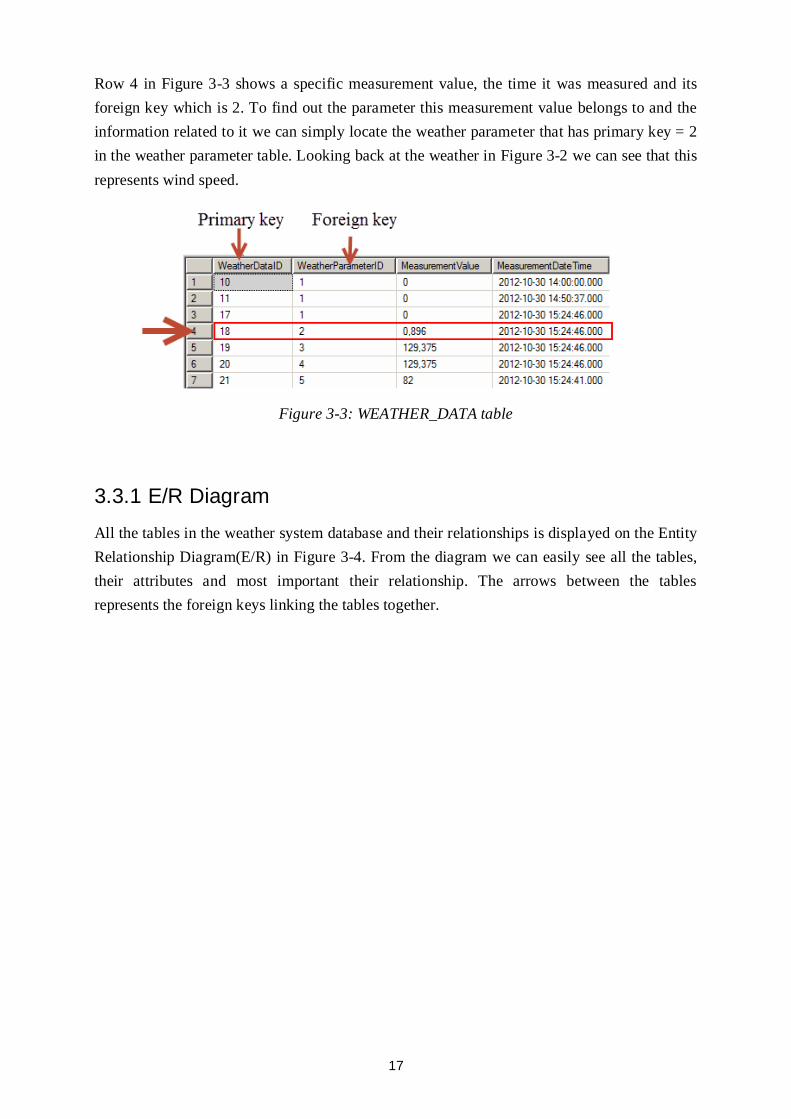
Figure 3-3 shows another table where measurement data delivered by the Modbus application
are stored. The table stores the measurement values, a unique primary key identifying each
measurement value (WeatherDataID), the measurement time, and most import a foreign key
(WeatherParameterID) referencing the measured parameter.
17
Row 4 in Figure 3-3 shows a specific measurement value, the time it was measured and its
foreign key which is 2. To find out the parameter this measurement value belongs to and the
information related to it we can simply locate the weather parameter that has primary key = 2
in the weather parameter table. Looking back at the weather in Figure 3-2 we can see that this
represents wind speed.
Figure 3-3: WEATHER_DATA table
3.3.1 E/R Diagram
All the tables in the weather system database and their relationships is displayed on the Entity
Relationship Diagram(E/R) in Figure 3-4. From the diagram we can easily see all the tables,
their attributes and most important their relationship. The arrows between the tables
represents the foreign keys linking the tables together.

18
CONFIGURATION
PK ConfigurationID
Section Key Value Description
USER_INFO
PK UserInfoID
UserName FirstName LastName EmployeeNumber EmailAddress PhoneNumber Address PostalCode City
WEATHER_MODEL
PK WeatherModelID
ModelName RatingFK1 UserInfoID
MODEL_PARAMETER
PK ModelParameterID
FK1 WeatherModelIDFK2 WeatherParameterID
WEATHER_DATA
PK WeatherDataID
FK1 WeatherParameterID MeasurementValue MeasurementDateTime LocalDateTime
WEATHER_PARAMETER
PK WeatherParameterID
ParameterName Unit Source ItemUrl ModbusRegister ModbusAddress Description Gain Offset
FORECAST
PK ForecastID
FK1 WeatherModelIDFK2 WeatherParameterIDFK3 ModelParameterID
FORECAST_DATA
PK ForecastDataID
FK1 ForecastIDFK2 WeatherParameterID ForecastValue ForecastDateTime
WEATHER SYSTEM (ER diagram)
DEVICE_PARAMETER
PK DeviceParameterID
FK1 WeatherParameterIDFK2 DeviceID
DEVICE
PK DeviceID
DeviceName Description
USER_PASSWORD
PK UserPasswordID
PasswordFK1 UserInfoID
Figure 3-4: E/R diagram for the weather system [3]
3.3.2 SQL - Structure Query Language
The weather data are stored and retrieved from the database using SQL. "SQL is a database
computer language designed for managing data in relational database management
systems"[17]. Users or external applications can communicate with a database to store, view
or retrieve data using SQL queries. Queries are basically a set of statements or commands that
can be executed on a database.
Figure 3-5: SQL
19
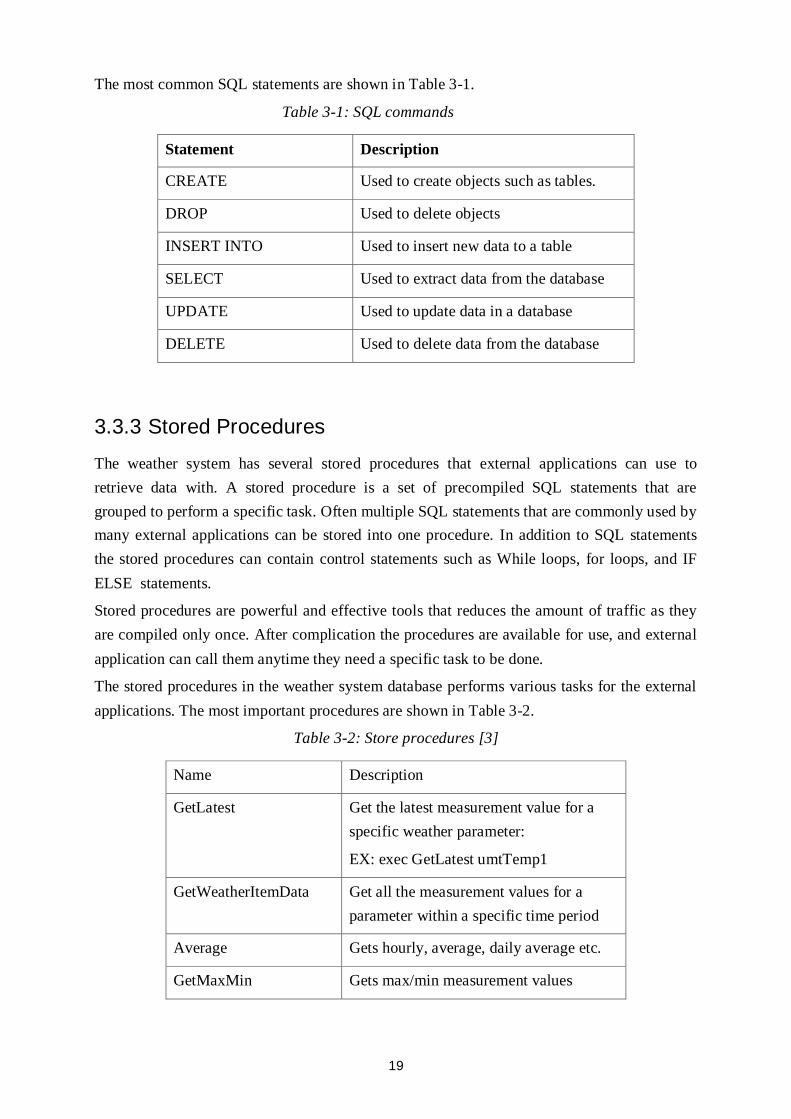
The most common SQL statements are shown in Table 3-1.
Table 3-1: SQL commands
Statement Description
CREATE Used to create objects such as tables.
DROP Used to delete objects
INSERT INTO Used to insert new data to a table
SELECT Used to extract data from the database
UPDATE Used to update data in a database
DELETE Used to delete data from the database
3.3.3 Stored Procedures
The weather system has several stored procedures that external applications can use to
retrieve data with. A stored procedure is a set of precompiled SQL statements that are
grouped to perform a specific task. Often multiple SQL statements that are commonly used by
many external applications can be stored into one procedure. In addition to SQL statements
the stored procedures can contain control statements such as While loops, for loops, and IF
ELSE statements.
Stored procedures are powerful and effective tools that reduces the amount of traffic as they
are compiled only once. After complication the procedures are available for use, and external
application can call them anytime they need a specific task to be done.
The stored procedures in the weather system database performs various tasks for the external
applications. The most important procedures are shown in Table 3-2.
Table 3-2: Store procedures [3]
Name Description
GetLatest Get the latest measurement value for a
specific weather parameter:
EX: exec GetLatest umtTemp1
GetWeatherItemData Get all the measurement values for a
parameter within a specific time period
Average Gets hourly, average, daily average etc.
GetMaxMin Gets max/min measurement values
20
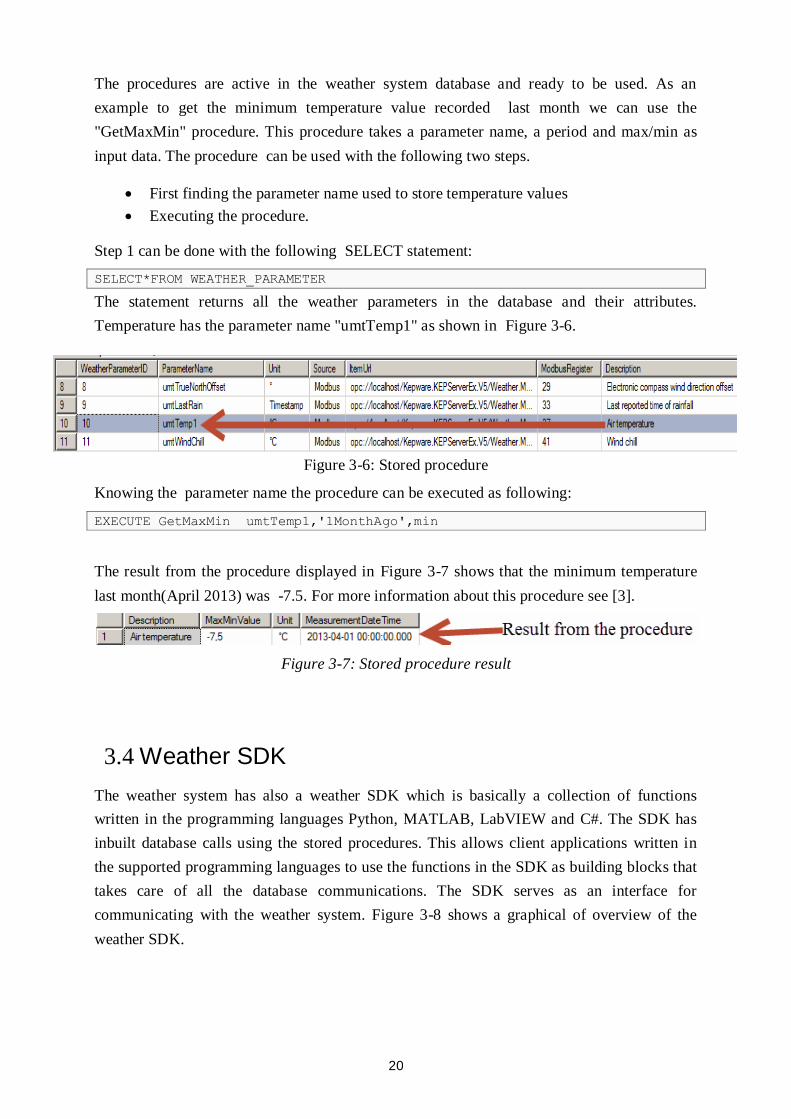
The procedures are active in the weather system database and ready to be used. As an
example to get the minimum temperature value recorded last month we can use the
"GetMaxMin" procedure. This procedure takes a parameter name, a period and max/min as
input data. The procedure can be used with the following two steps.
First finding the parameter name used to store temperature values
Executing the procedure.
Step 1 can be done with the following SELECT statement:
SELECT*FROM WEATHER_PARAMETER
The statement returns all the weather parameters in the database and their attributes.
Temperature has the parameter name "umtTemp1" as shown in Figure 3-6.
Figure 3-6: Stored procedure
Knowing the parameter name the procedure can be executed as following:
EXECUTE GetMaxMin umtTemp1,'1MonthAgo',min
The result from the procedure displayed in Figure 3-7 shows that the minimum temperature
last month(April 2013) was -7.5. For more information about this procedure see [3].
Figure 3-7: Stored procedure result
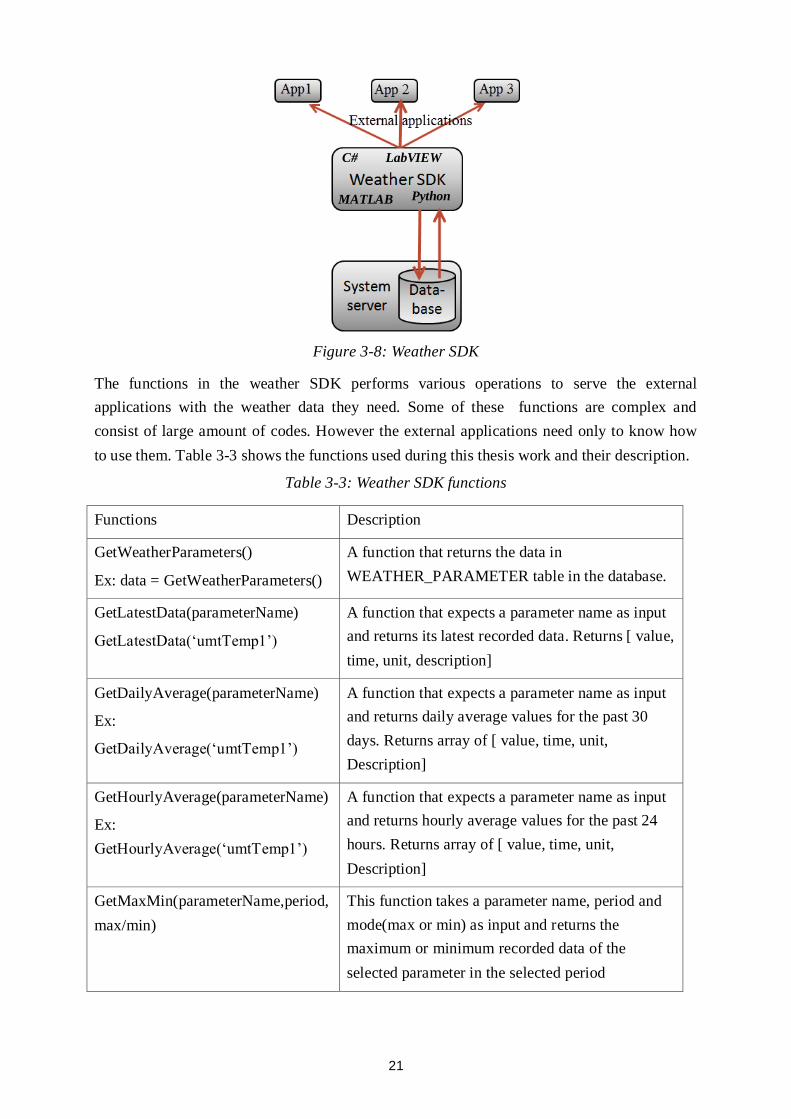
3.4 Weather SDK
The weather system has also a weather SDK which is basically a collection of functions
written in the programming languages Python, MATLAB, LabVIEW and C#. The SDK has
inbuilt database calls using the stored procedures. This allows client applications written in
the supported programming languages to use the functions in the SDK as building blocks that
takes care of all the database communications. The SDK serves as an interface for
communicating with the weather system. Figure 3-8 shows a graphical of overview of the
weather SDK.
21
Figure 3-8: Weather SDK
The functions in the weather SDK performs various operations to serve the external
applications with the weather data they need. Some of these functions are complex and
consist of large amount of codes. However the external applications need only to know how
to use them. Table 3-3 shows the functions used during this thesis work and their description.
Table 3-3: Weather SDK functions
Functions Description
GetWeatherParameters()
Ex: data = GetWeatherParameters()
A function that returns the data in
WEATHER_PARAMETER table in the database.
GetLatestData(parameterName)
GetLatestData(‘umtTemp1’)
A function that expects a parameter name as input
and returns its latest recorded data. Returns [ value,
time, unit, description]
GetDailyAverage(parameterName)
Ex:
GetDailyAverage(‘umtTemp1’)
A function that expects a parameter name as input
and returns daily average values for the past 30
days. Returns array of [ value, time, unit,
Description]
GetHourlyAverage(parameterName)
Ex:
GetHourlyAverage(‘umtTemp1’)
A function that expects a parameter name as input
and returns hourly average values for the past 24
hours. Returns array of [ value, time, unit,
Description]
GetMaxMin(parameterName,period,
max/min)
This function takes a parameter name, period and
mode(max or min) as input and returns the
maximum or minimum recorded data of the
selected parameter in the selected period
C# LabVIEW
MATLAB Python
22
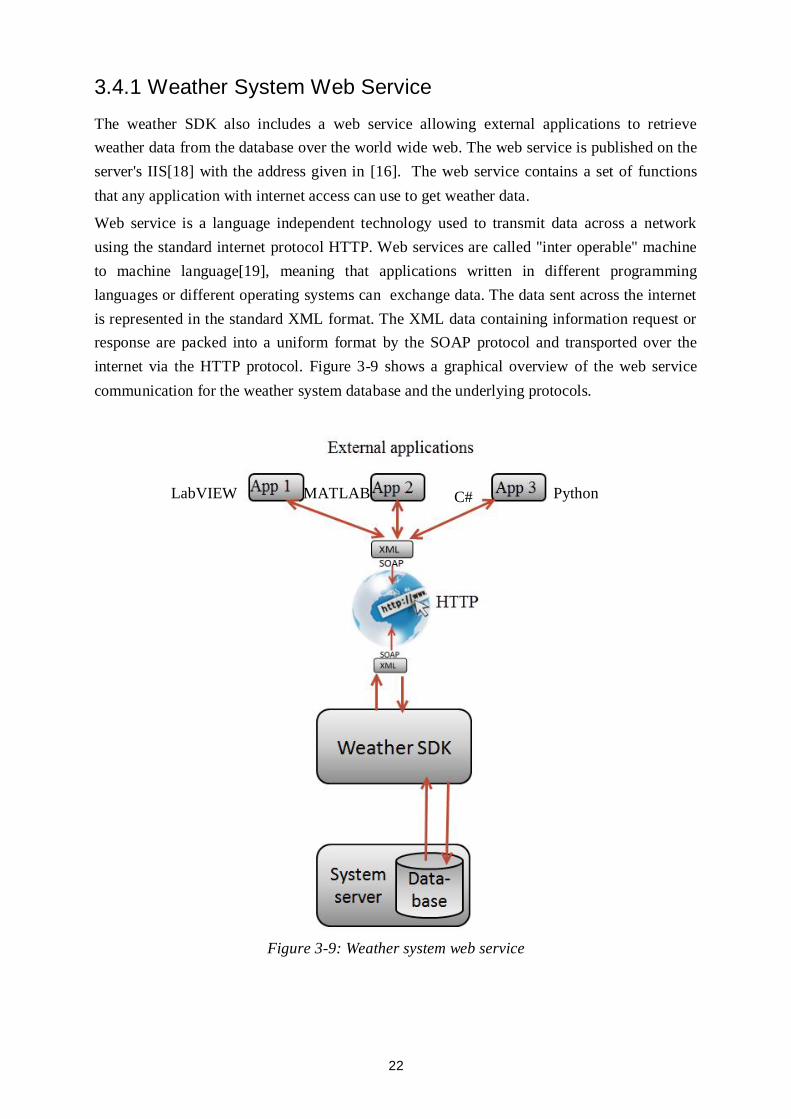
3.4.1 Weather System Web Service
The weather SDK also includes a web service allowing external applications to retrieve
weather data from the database over the world wide web. The web service is published on the
server's IIS[18] with the address given in [16]. The web service contains a set of functions
that any application with internet access can use to get weather data.
Web service is a language independent technology used to transmit data across a network
using the standard internet protocol HTTP. Web services are called "inter operable" machine
to machine language[19], meaning that applications written in different programming
languages or different operating systems can exchange data. The data sent across the internet
is represented in the standard XML format. The XML data containing information request or
response are packed into a uniform format by the SOAP protocol and transported over the
internet via the HTTP protocol. Figure 3-9 shows a graphical overview of the web service
communication for the weather system database and the underlying protocols.
Figure 3-9: Weather system web service
C# Python MATLAB LabVIEW
23
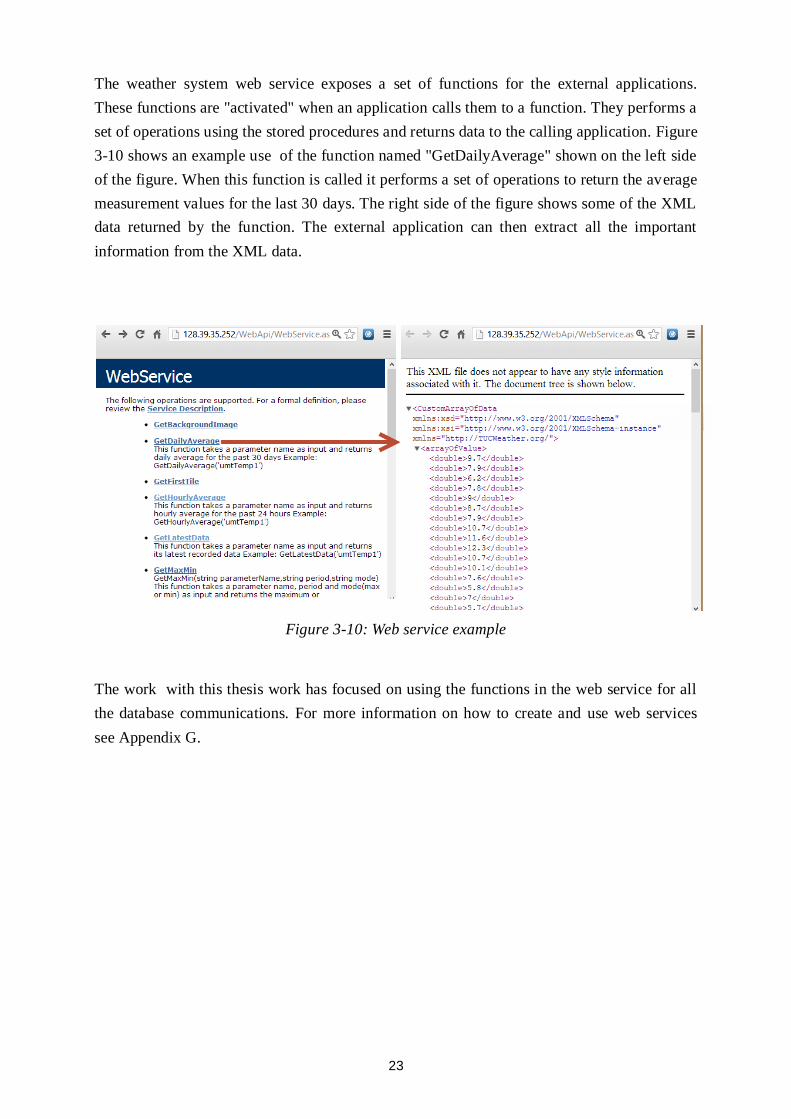
The weather system web service exposes a set of functions for the external applications.
These functions are "activated" when an application calls them to a function. They performs a
set of operations using the stored procedures and returns data to the calling application. Figure
3-10 shows an example use of the function named "GetDailyAverage" shown on the left side
of the figure. When this function is called it performs a set of operations to return the average
measurement values for the last 30 days. The right side of the figure shows some of the XML
data returned by the function. The external application can then extract all the important
information from the XML data.
Figure 3-10: Web service example
The work with this thesis work has focused on using the functions in the web service for all
the database communications. For more information on how to create and use web services
see Appendix G.
24
Part II: Theory
25
4 Mobile Platforms
Since the use of mobile devices and mobile platforms for engineering activities is increasing
this chapter will give an overview of the major platforms available on the market today. For
more details about these platforms see the tutorial "Mobile platforms" in Appendix B.
4.1 Overview
Mobile devices such as smartphones and tablets are today everywhere and they offer a large
range of possibilities for usage in everyday life. These devices are gradually replacing desktop
pc's and laptops for daily activities such as checking email, playing games, streaming videos,
and browsing the internet.
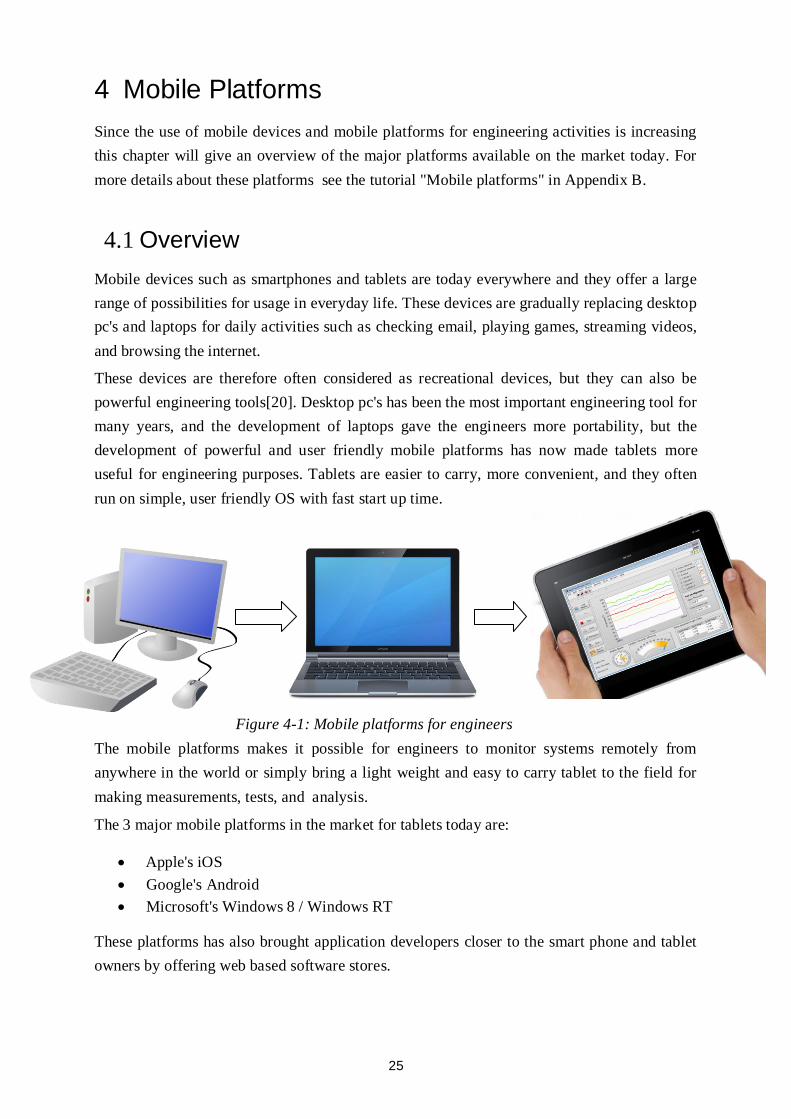
These devices are therefore often considered as recreational devices, but they can also be
powerful engineering tools[20]. Desktop pc's has been the most important engineering tool for
many years, and the development of laptops gave the engineers more portability, but the
development of powerful and user friendly mobile platforms has now made tablets more
useful for engineering purposes. Tablets are easier to carry, more convenient, and they often
run on simple, user friendly OS with fast start up time.
The mobile platforms makes it possible for engineers to monitor systems remotely from
anywhere in the world or simply bring a light weight and easy to carry tablet to the field for
making measurements, tests, and analysis.
The 3 major mobile platforms in the market for tablets today are:
Apple's iOS
Google's Android
Microsoft's Windows 8 / Windows RT
These platforms has also brought application developers closer to the smart phone and tablet
owners by offering web based software stores.
Figure 4-1: Mobile platforms for engineers
26
The developers can publish their applications to App Store, Google play, or Windows Store.
This makes it easier for the users to simply find, buy and install applications directly from
their desktop.
4.2 iOS
The release of Apple's iPhone with iOS operating system(previously iPhone OS) in 2007 was
an instant success, and have since had a great success in the mobile platform market with
other Apple products as well. iOS is now the operating system that runs on iPhone, iPod
touch, Apple TV and iPad Devices[21]. The OS is Apple's mobile version of the OS X
operating system used in Apple computers. Unlike Android and Windows 8 the iOS can only
run on Apple devices.
Initially iOS did not support third party applications(Apps), but the introduction of App Store
,and the release of iOS SDK in 2008 opened a huge market for developers to create and sell
applications. The App Store now contains over 775 000 apps (January 2013)[22] ranging
from simple news apps to advanced engineering apps.
iOS has full support for the programming languages Objective-C,C and C++ [23].Objective-C
is the native programming language for iOS and OS X. Other requirements for developing
iOS Apps are:
A modern Mac: preferably running OS X v 10.7.4 or later.
Xcode: Apple's integrated development environment(IDE). Can be downloaded as a
bundle that includes the IDE, iOS Simulator and the latest iOS SDKs[23].
Apple ID: A developer account for selling apps through App Store costs 99USD/year.
Free App developers can test their Apps on a simulator in the Xcode IDE but cannot
deploy to devices or submit to App Store[24].
Figure 4-2: iOS [1]
27
4.3 Android
The Android operating system was developed by Android Inc, which was bought by Google
in 2005[25]. Android is an open source and free operating system based on the Linux kernel.
The operating system was first released in 2008 for smartphones, and has since had a
remarkable development.
The fact that Android is an open source OS has attracted many mobile device manufacturers
and software developers from the whole world. The manufactures need only to create the
hardware and install the Android OS for free. The developers on the other hand can focus
fully on App development without worrying about the hardware.
The developers can also contribute in the development of the OS by reporting bugs or
participating in open source discussions[26].This has fuelled the innovation and development
of Android, and the number of Apps in Google Play[27] has now passed the number of Apps
in Apple's App Store. The apps are increasing in such ratio that it's predicted the 1 million
milestone will be reached by June 2013[28].
Figure 4-3: Android logo [29]
Android apps are developed in Java and Google provides an ADT bundle for developers[30].
The bundle includes:
Eclipse IDE + ADT plug-in
Android SDK Tools
Android Platform-tools
The latest Android platform
The latest Android system image for the emulator. The emulator is a virtual mobile
device for testing and analysis of apps.
Google has also announced a new IDE name Android Studio that is more powerful than the
ADT bundle. The Android studio is at the writing moment available just as an early version
[31].
28
4.4 Windows 8
In order to catch up with Apple's iOS and Google's Android on the mobile platform market
Microsoft put a lot work in their new operating system named Windows 8. Windows 8
represents the biggest change in Microsoft's operating system since Windows 95[32]. The
new operating system has been designed with high focus on tablets and touch screens.
Microsoft released the following versions of Windows 8:
Windows 8,Windows 8 pro, Windows 8 enterprise
Windows RT
Figure 4-4: Windows 8 logo[33]
All the Windows 8 versions except Windows RT can run on desktop PCs, laptops and tablets.
Windows RT is a new type of operating system that is only available preinstalled on PCs and
tablets that are powered by ARM processors[34]. Windows RT is optimised for these devices
and can only run built in applications or applications downloaded from Windows Store. These
applications are called "Windows Store Apps" or "Windows 8 Apps"[35]. The Windows
Store Apps works on regular Windows 8 versions as well. These Apps will be discussed
further in chapter 5.
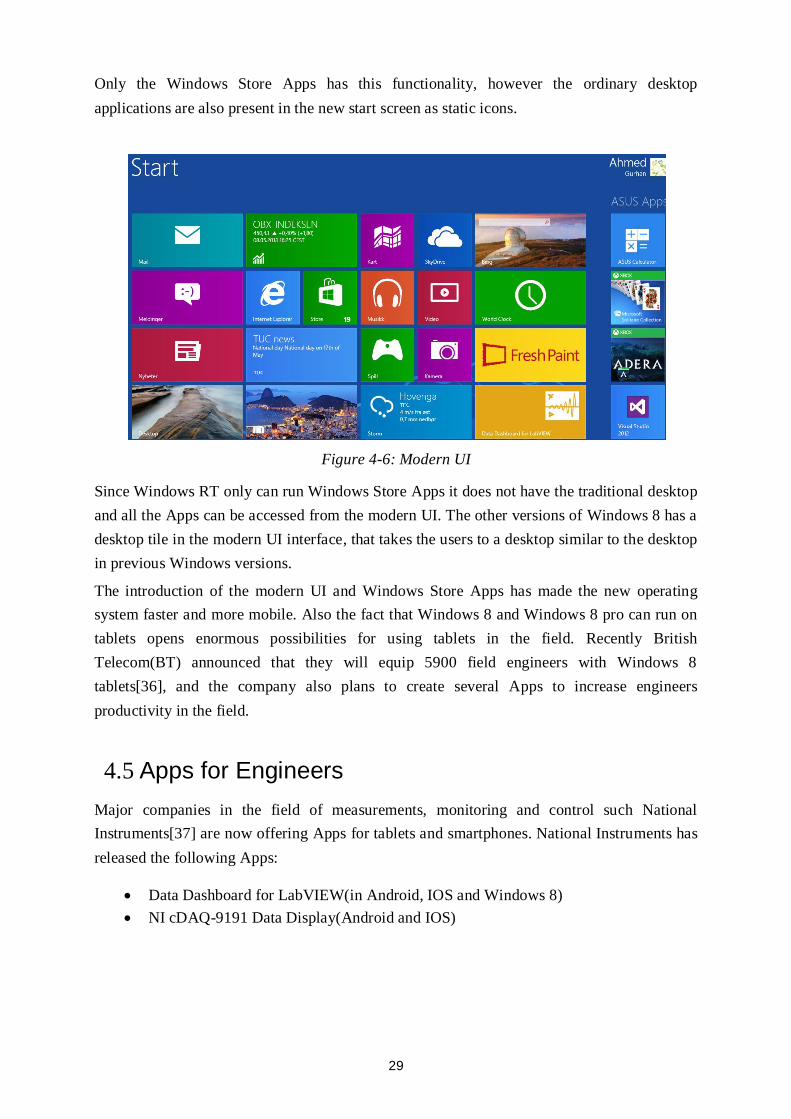
All the Windows 8 versions has the start screen shown in Figure 4-6.The new start screen is
called modern UI, and it contains colourful and dynamic tiles. Tiles are basically the
application icons in Windows 8. The tiles can display short information's from the apps living
behind them, instead of the static icons in previous Windows versions. These tiles are also
called live tiles as the Apps behind them can update their content with the latest updates.
Figure 4-5: Windows 8 on pc, laptop, tablet[2]
29
Only the Windows Store Apps has this functionality, however the ordinary desktop
applications are also present in the new start screen as static icons.
Figure 4-6: Modern UI
Since Windows RT only can run Windows Store Apps it does not have the traditional desktop
and all the Apps can be accessed from the modern UI. The other versions of Windows 8 has a
desktop tile in the modern UI interface, that takes the users to a desktop similar to the desktop
in previous Windows versions.
The introduction of the modern UI and Windows Store Apps has made the new operating
system faster and more mobile. Also the fact that Windows 8 and Windows 8 pro can run on
tablets opens enormous possibilities for using tablets in the field. Recently British
Telecom(BT) announced that they will equip 5900 field engineers with Windows 8
tablets[36], and the company also plans to create several Apps to increase engineers
productivity in the field.
4.5 Apps for Engineers
Major companies in the field of measurements, monitoring and control such National
Instruments[37] are now offering Apps for tablets and smartphones. National Instruments has
released the following Apps:
Data Dashboard for LabVIEW(in Android, IOS and Windows 8)
NI cDAQ-9191 Data Display(Android and IOS)
30
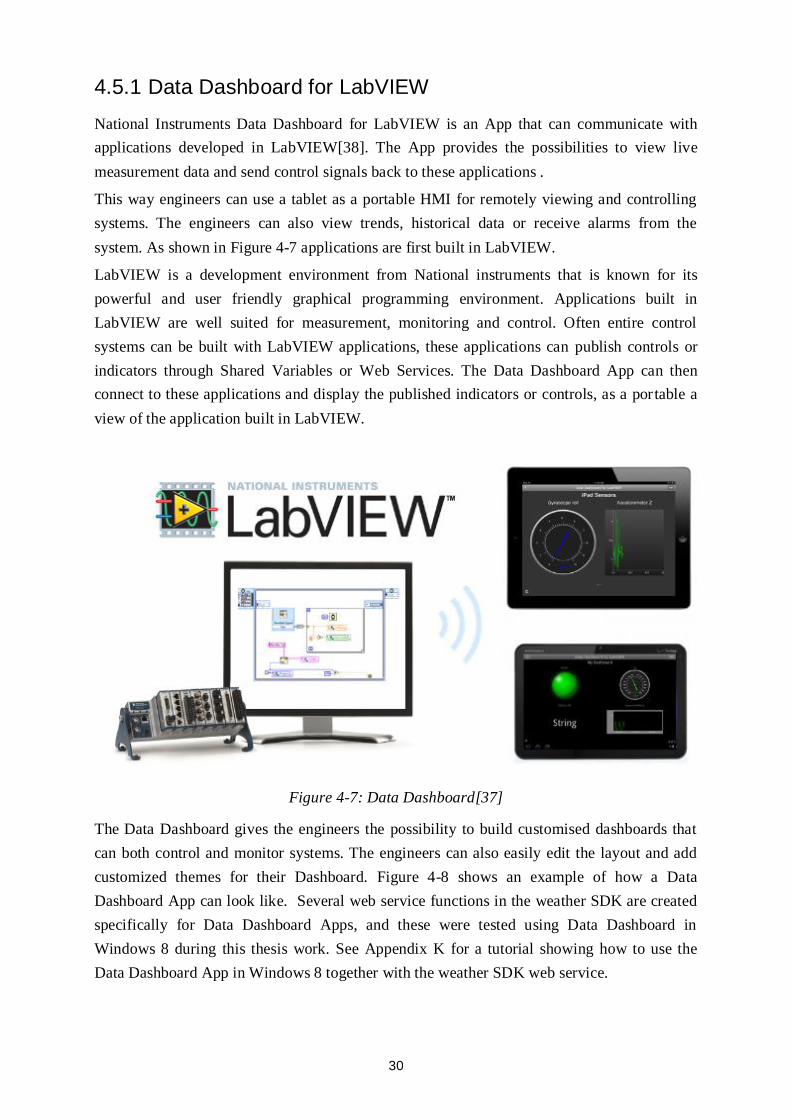
4.5.1 Data Dashboard for LabVIEW
National Instruments Data Dashboard for LabVIEW is an App that can communicate with
applications developed in LabVIEW[38]. The App provides the possibilities to view live
measurement data and send control signals back to these applications .
This way engineers can use a tablet as a portable HMI for remotely viewing and controlling
systems. The engineers can also view trends, historical data or receive alarms from the
system. As shown in Figure 4-7 applications are first built in LabVIEW.
LabVIEW is a development environment from National instruments that is known for its
powerful and user friendly graphical programming environment. Applications built in
LabVIEW are well suited for measurement, monitoring and control. Often entire control
systems can be built with LabVIEW applications, these applications can publish controls or
indicators through Shared Variables or Web Services. The Data Dashboard App can then
connect to these applications and display the published indicators or controls, as a portable a
view of the application built in LabVIEW.
Figure 4-7: Data Dashboard[37]
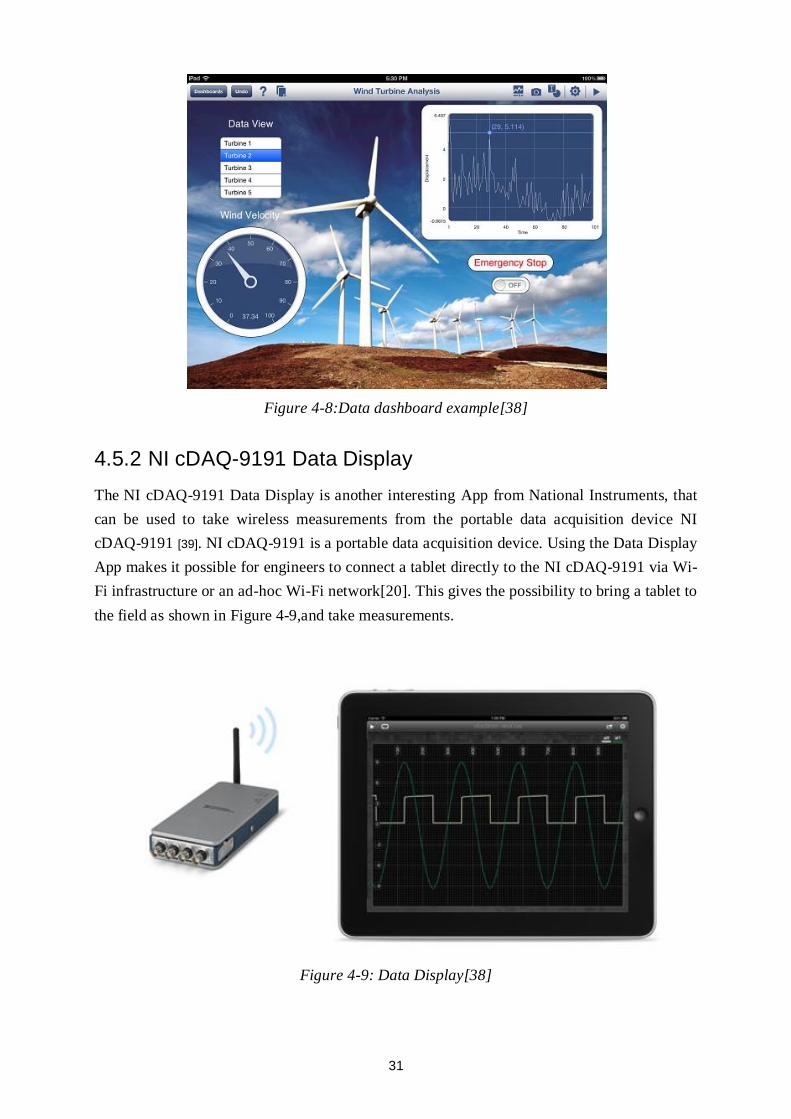
The Data Dashboard gives the engineers the possibility to build customised dashboards that
can both control and monitor systems. The engineers can also easily edit the layout and add
customized themes for their Dashboard. Figure 4-8 shows an example of how a Data
Dashboard App can look like. Several web service functions in the weather SDK are created
specifically for Data Dashboard Apps, and these were tested using Data Dashboard in
Windows 8 during this thesis work. See Appendix K for a tutorial showing how to use the
Data Dashboard App in Windows 8 together with the weather SDK web service.
31
Figure 4-8:Data dashboard example[38]
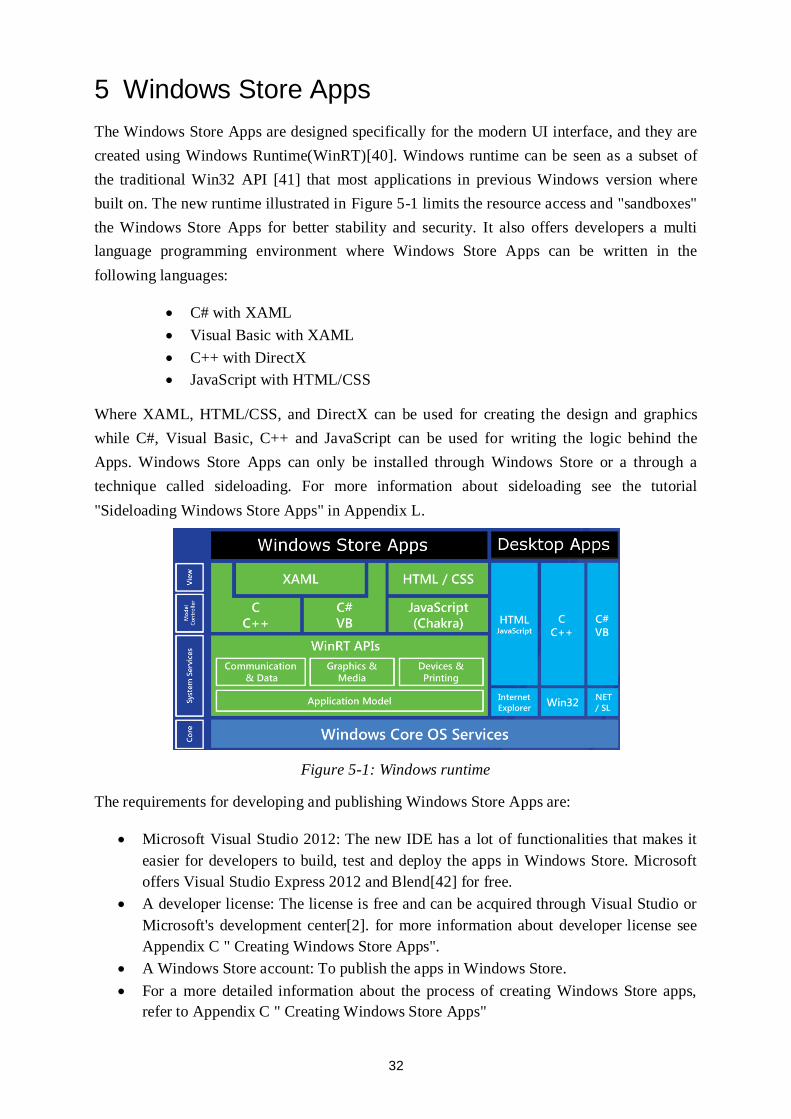
4.5.2 NI cDAQ-9191 Data Display
The NI cDAQ-9191 Data Display is another interesting App from National Instruments, that
can be used to take wireless measurements from the portable data acquisition device NI
cDAQ-9191 [39]. NI cDAQ-9191 is a portable data acquisition device. Using the Data Display
App makes it possible for engineers to connect a tablet directly to the NI cDAQ-9191 via Wi-
Fi infrastructure or an ad-hoc Wi-Fi network[20]. This gives the possibility to bring a tablet to
the field as shown in Figure 4-9,and take measurements.
Figure 4-9: Data Display[38]
32
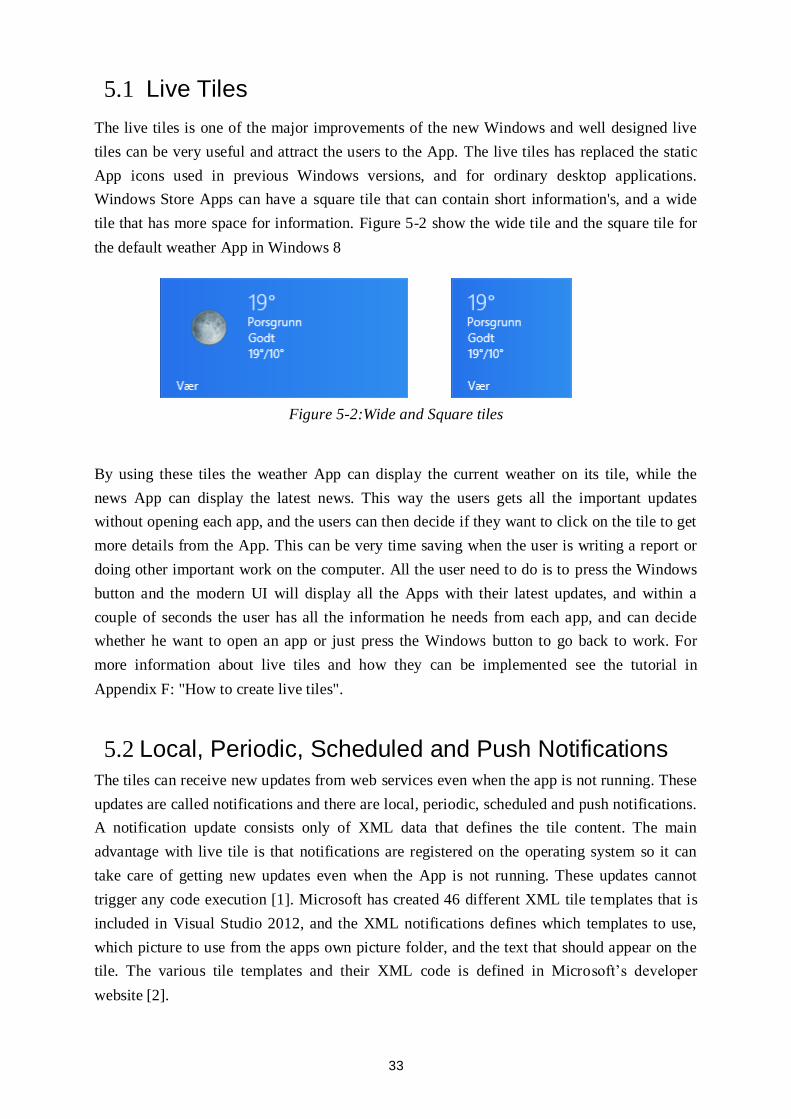
5 Windows Store Apps
The Windows Store Apps are designed specifically for the modern UI interface, and they are
created using Windows Runtime(WinRT)[40]. Windows runtime can be seen as a subset of
the traditional Win32 API [41] that most applications in previous Windows version where
built on. The new runtime illustrated in Figure 5-1 limits the resource access and "sandboxes"
the Windows Store Apps for better stability and security. It also offers developers a multi
language programming environment where Windows Store Apps can be written in the
following languages:
C# with XAML
Visual Basic with XAML
C++ with DirectX
JavaScript with HTML/CSS
Where XAML, HTML/CSS, and DirectX can be used for creating the design and graphics
while C#, Visual Basic, C++ and JavaScript can be used for writing the logic behind the
Apps. Windows Store Apps can only be installed through Windows Store or a through a
technique called sideloading. For more information about sideloading see the tutorial
"Sideloading Windows Store Apps" in Appendix L.
Figure 5-1: Windows runtime
The requirements for developing and publishing Windows Store Apps are:
Microsoft Visual Studio 2012: The new IDE has a lot of functionalities that makes it
easier for developers to build, test and deploy the apps in Windows Store. Microsoft
offers Visual Studio Express 2012 and Blend[42] for free.
A developer license: The license is free and can be acquired through Visual Studio or
Microsoft's development center[2]. for more information about developer license see
Appendix C " Creating Windows Store Apps".
A Windows Store account: To publish the apps in Windows Store.
For a more detailed information about the process of creating Windows Store apps,
refer to Appendix C " Creating Windows Store Apps"
33
5.1 Live Tiles
The live tiles is one of the major improvements of the new Windows and well designed live
tiles can be very useful and attract the users to the App. The live tiles has replaced the static
App icons used in previous Windows versions, and for ordinary desktop applications.
Windows Store Apps can have a square tile that can contain short information's, and a wide
tile that has more space for information. Figure 5-2 show the wide tile and the square tile for
the default weather App in Windows 8
Figure 5-2:Wide and Square tiles
By using these tiles the weather App can display the current weather on its tile, while the
news App can display the latest news. This way the users gets all the important updates
without opening each app, and the users can then decide if they want to click on the tile to get
more details from the App. This can be very time saving when the user is writing a report or
doing other important work on the computer. All the user need to do is to press the Windows
button and the modern UI will display all the Apps with their latest updates, and within a
couple of seconds the user has all the information he needs from each app, and can decide
whether he want to open an app or just press the Windows button to go back to work. For
more information about live tiles and how they can be implemented see the tutorial in
Appendix F: "How to create live tiles".
5.2 Local, Periodic, Scheduled and Push Notifications
The tiles can receive new updates from web services even when the app is not running. These
updates are called notifications and there are local, periodic, scheduled and push notifications.
A notification update consists only of XML data that defines the tile content. The main
advantage with live tile is that notifications are registered on the operating system so it can
take care of getting new updates even when the App is not running. These updates cannot
trigger any code execution [1]. Microsoft has created 46 different XML tile templates that is
included in Visual Studio 2012, and the XML notifications defines which templates to use,
which picture to use from the apps own picture folder, and the text that should appear on the
tile. The various tile templates and their XML code is defined in Microsoft’s developer
website [2].
34
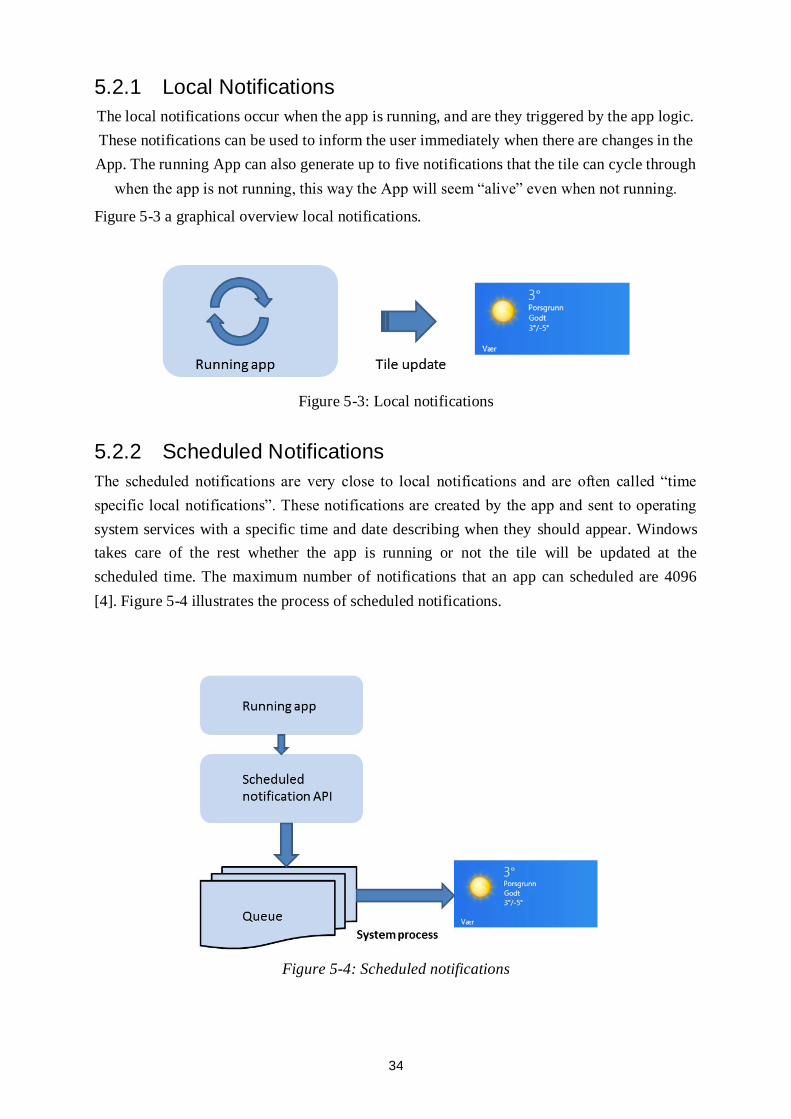
5.2.1 Local Notifications
The local notifications occur when the app is running, and are they triggered by the app logic.
These notifications can be used to inform the user immediately when there are changes in the
App. The running App can also generate up to five notifications that the tile can cycle through
when the app is not running, this way the App will seem “alive” even when not running.
Figure 5-3 a graphical overview local notifications.
Figure 5-3: Local notifications
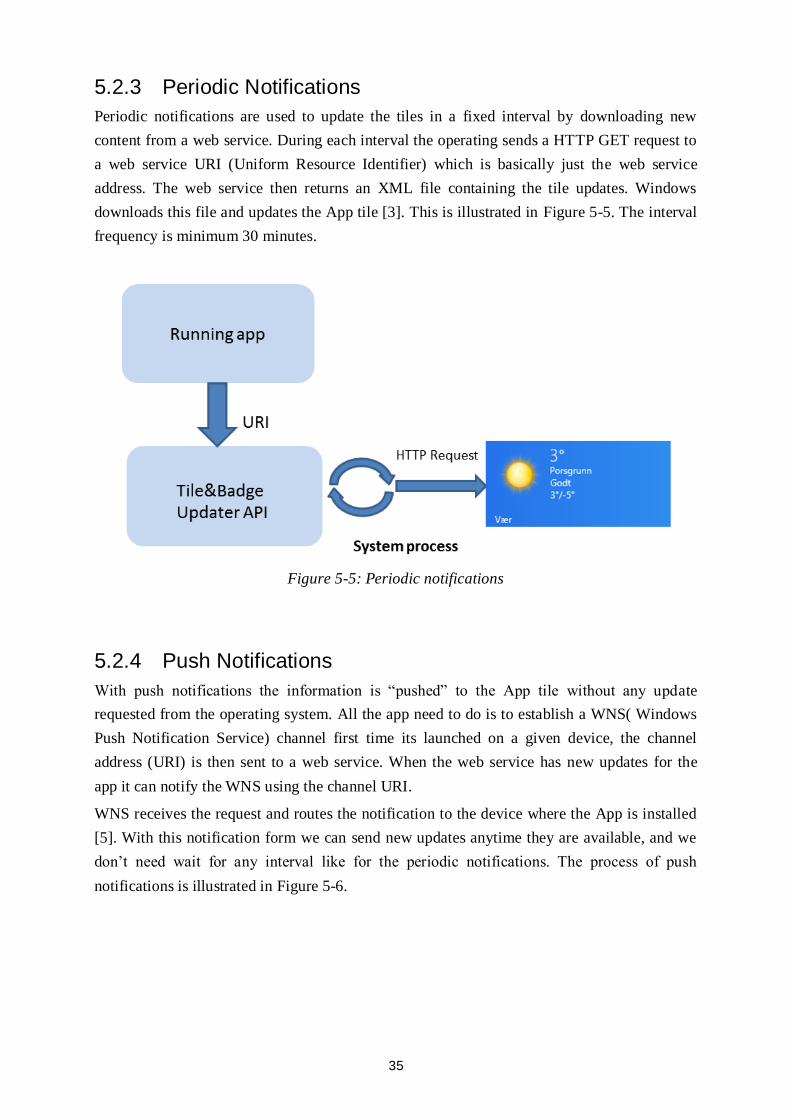
5.2.2 Scheduled Notifications
The scheduled notifications are very close to local notifications and are often called “time
specific local notifications”. These notifications are created by the app and sent to operating
system services with a specific time and date describing when they should appear. Windows
takes care of the rest whether the app is running or not the tile will be updated at the
scheduled time. The maximum number of notifications that an app can scheduled are 4096
[4]. Figure 5-4 illustrates the process of scheduled notifications.
Figure 5-4: Scheduled notifications
35
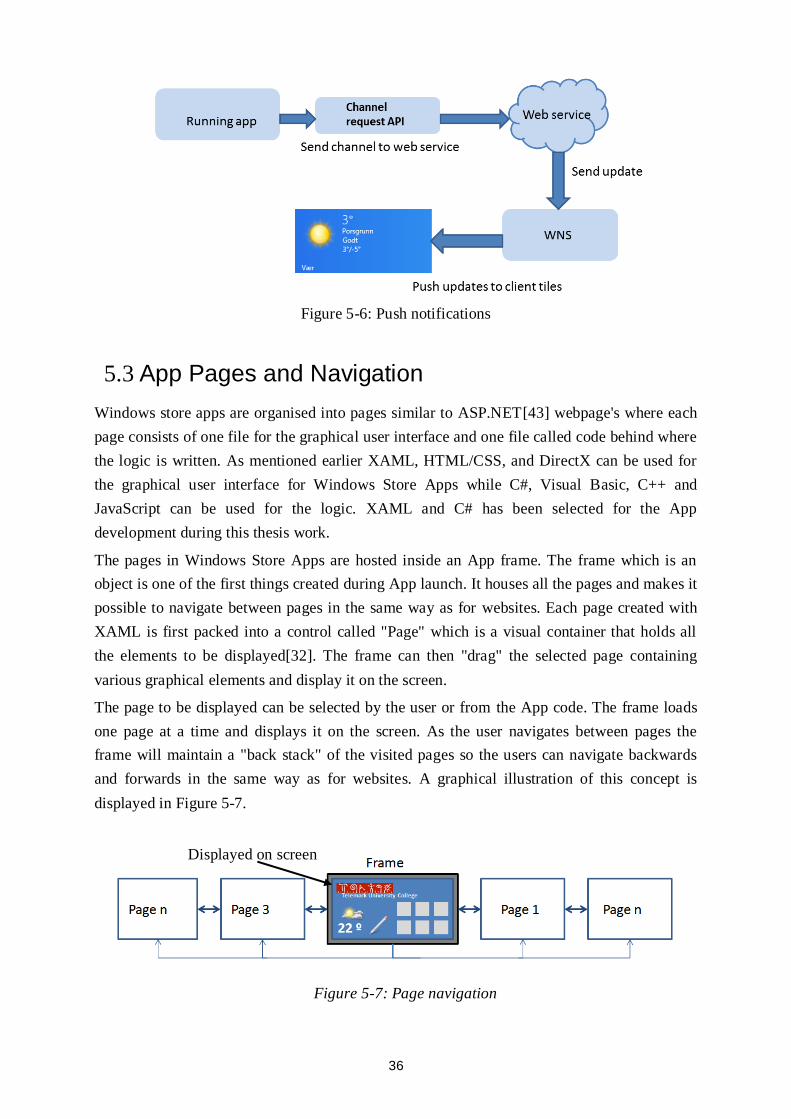
5.2.3 Periodic Notifications
Periodic notifications are used to update the tiles in a fixed interval by downloading new
content from a web service. During each interval the operating sends a HTTP GET request to
a web service URI (Uniform Resource Identifier) which is basically just the web service
address. The web service then returns an XML file containing the tile updates. Windows
downloads this file and updates the App tile [3]. This is illustrated in Figure 5-5. The interval
frequency is minimum 30 minutes.
Figure 5-5: Periodic notifications
5.2.4 Push Notifications
With push notifications the information is “pushed” to the App tile without any update
requested from the operating system. All the app need to do is to establish a WNS( Windows
Push Notification Service) channel first time its launched on a given device, the channel
address (URI) is then sent to a web service. When the web service has new updates for the
app it can notify the WNS using the channel URI.
WNS receives the request and routes the notification to the device where the App is installed
[5]. With this notification form we can send new updates anytime they are available, and we
don’t need wait for any interval like for the periodic notifications. The process of push
notifications is illustrated in Figure 5-6.
36
Figure 5-6: Push notifications
5.3 App Pages and Navigation
Windows store apps are organised into pages similar to ASP.NET[43] webpage's where each
page consists of one file for the graphical user interface and one file called code behind where
the logic is written. As mentioned earlier XAML, HTML/CSS, and DirectX can be used for
the graphical user interface for Windows Store Apps while C#, Visual Basic, C++ and
JavaScript can be used for the logic. XAML and C# has been selected for the App
development during this thesis work.
The pages in Windows Store Apps are hosted inside an App frame. The frame which is an
object is one of the first things created during App launch. It houses all the pages and makes it
possible to navigate between pages in the same way as for websites. Each page created with
XAML is first packed into a control called "Page" which is a visual container that holds all
the elements to be displayed[32]. The frame can then "drag" the selected page containing
various graphical elements and display it on the screen.
The page to be displayed can be selected by the user or from the App code. The frame loads
one page at a time and displays it on the screen. As the user navigates between pages the
frame will maintain a "back stack" of the visited pages so the users can navigate backwards
and forwards in the same way as for websites. A graphical illustration of this concept is
displayed in Figure 5-7.
Figure 5-7: Page navigation
Displayed on screen
37
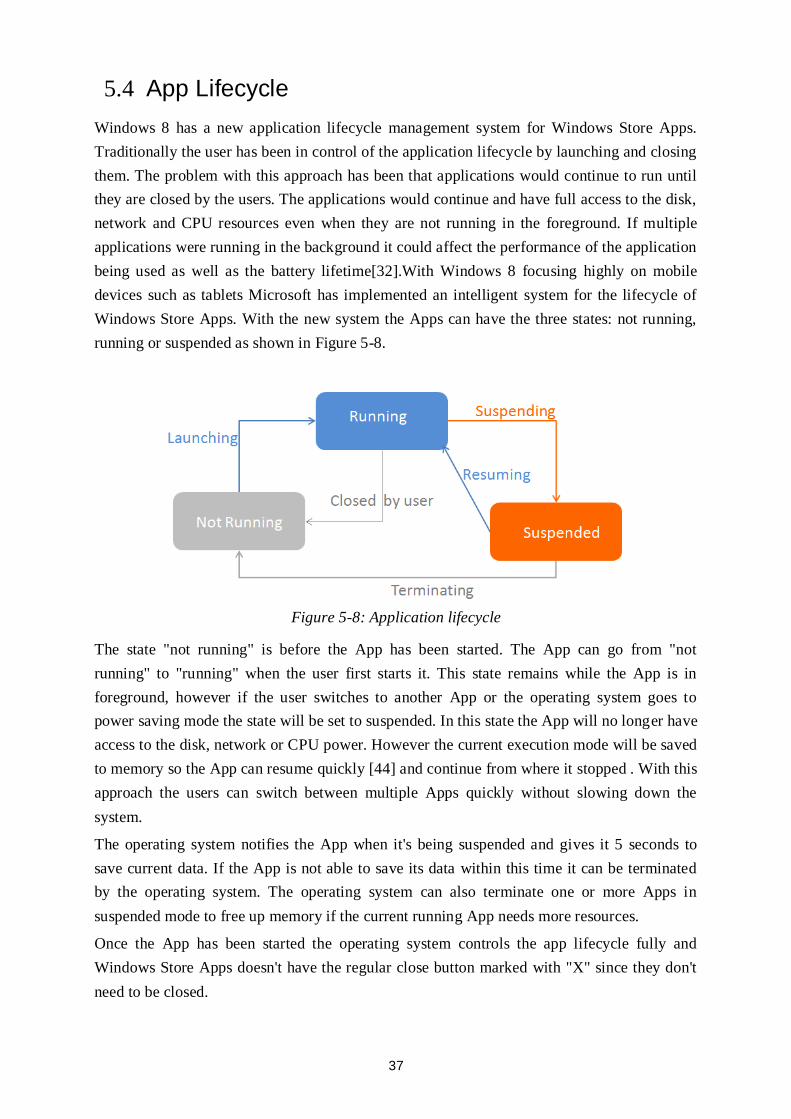
5.4 App Lifecycle
Windows 8 has a new application lifecycle management system for Windows Store Apps.
Traditionally the user has been in control of the application lifecycle by launching and closing
them. The problem with this approach has been that applications would continue to run until
they are closed by the users. The applications would continue and have full access to the disk,
network and CPU resources even when they are not running in the foreground. If multiple
applications were running in the background it could affect the performance of the application
being used as well as the battery lifetime[32].With Windows 8 focusing highly on mobile
devices such as tablets Microsoft has implemented an intelligent system for the lifecycle of
Windows Store Apps. With the new system the Apps can have the three states: not running,
running or suspended as shown in Figure 5-8.
Figure 5-8: Application lifecycle
The state "not running" is before the App has been started. The App can go from "not
running" to "running" when the user first starts it. This state remains while the App is in
foreground, however if the user switches to another App or the operating system goes to
power saving mode the state will be set to suspended. In this state the App will no longer have
access to the disk, network or CPU power. However the current execution mode will be saved
to memory so the App can resume quickly [44] and continue from where it stopped . With this
approach the users can switch between multiple Apps quickly without slowing down the
system.
The operating system notifies the App when it's being suspended and gives it 5 seconds to
save current data. If the App is not able to save its data within this time it can be terminated
by the operating system. The operating system can also terminate one or more Apps in
suspended mode to free up memory if the current running App needs more resources.
Once the App has been started the operating system controls the app lifecycle fully and
Windows Store Apps doesn't have the regular close button marked with "X" since they don't
need to be closed.
38
However the users can still close or terminate the Apps by pressing "ALT +F4" or the new
close gesture where the Apps can be dragged down to the bottom of the screen.
5.5 C#
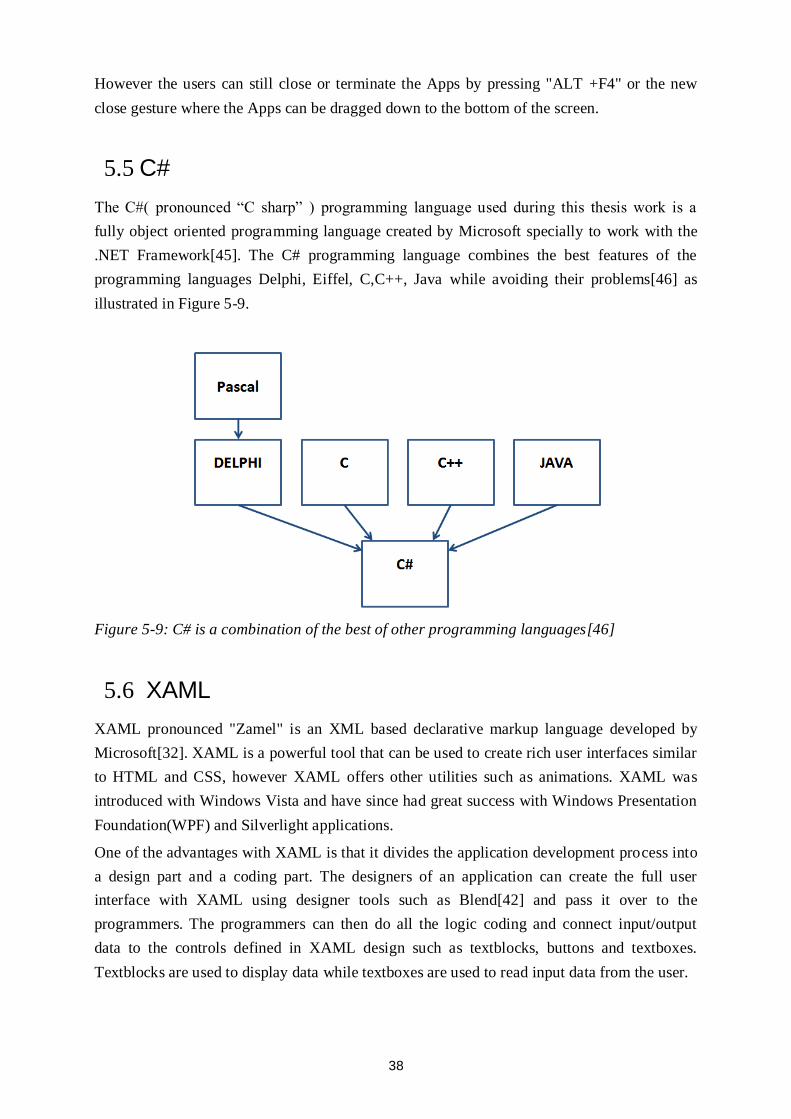
The C#( pronounced “C sharp” ) programming language used during this thesis work is a
fully object oriented programming language created by Microsoft specially to work with the
.NET Framework[45]. The C# programming language combines the best features of the
programming languages Delphi, Eiffel, C,C++, Java while avoiding their problems[46] as
illustrated in Figure 5-9.
Figure 5-9: C# is a combination of the best of other programming languages[46]
5.6 XAML
XAML pronounced "Zamel" is an XML based declarative markup language developed by
Microsoft[32]. XAML is a powerful tool that can be used to create rich user interfaces similar
to HTML and CSS, however XAML offers other utilities such as animations. XAML was
introduced with Windows Vista and have since had great success with Windows Presentation
Foundation(WPF) and Silverlight applications.
One of the advantages with XAML is that it divides the application development process into
a design part and a coding part. The designers of an application can create the full user
interface with XAML using designer tools such as Blend[42] and pass it over to the
programmers. The programmers can then do all the logic coding and connect input/output
data to the controls defined in XAML design such as textblocks, buttons and textboxes.
Textblocks are used to display data while textboxes are used to read input data from the user.
39
5.7 Splash Screen
Windows 8 displays a splash screen when it's starting an App. The splash which is often just a
logo of the App is displayed until the App has been fully loaded and is ready for use. Most
Apps performs some loading of data during the splash screen. The loaded data can then be
displayed immediately when the app has been fully loaded.
The Apps must display the first page within 5 seconds or they will be terminated by the
operating system, and they will fail the store certification[47]. This means that Apps cannot
load large amount of data during the splash screen.
Since most Apps need to load some data during start up this could be problematic. Most
developers goes around this problem by implementing an extended splash screen by creating
a page after the splash screen that imitates as the default splash screen.
The operating system displays the extended splash screen page after the default splash screen
believing that this is the first page of the App, however this is just a page for loading data.
Microsoft recommends that a progress ring or some loading animation is implemented if the
App uses long time to load the data, this way the users will not think that the App has crashed.
5.8 Windows App Store Certification Kit(WACK)
The Windows App Certification Kit(WACK) is a software that can be used to analyse the
Apps before uploading them to Windows Store. The software contains a lot of automated tests
that is also performed by Microsoft when the App is uploaded for deployment. Testing the
App with this software is therefore very important as it reduces the chances for failing the
tests performed by Microsoft. The software returns error reports that guides the users to find
errors or code structure that does not meet the criteria's for a Windows Store App certification
requirements[48].
40
Part III: Analysis and
Requirements
41
6 Analysis and Requirements
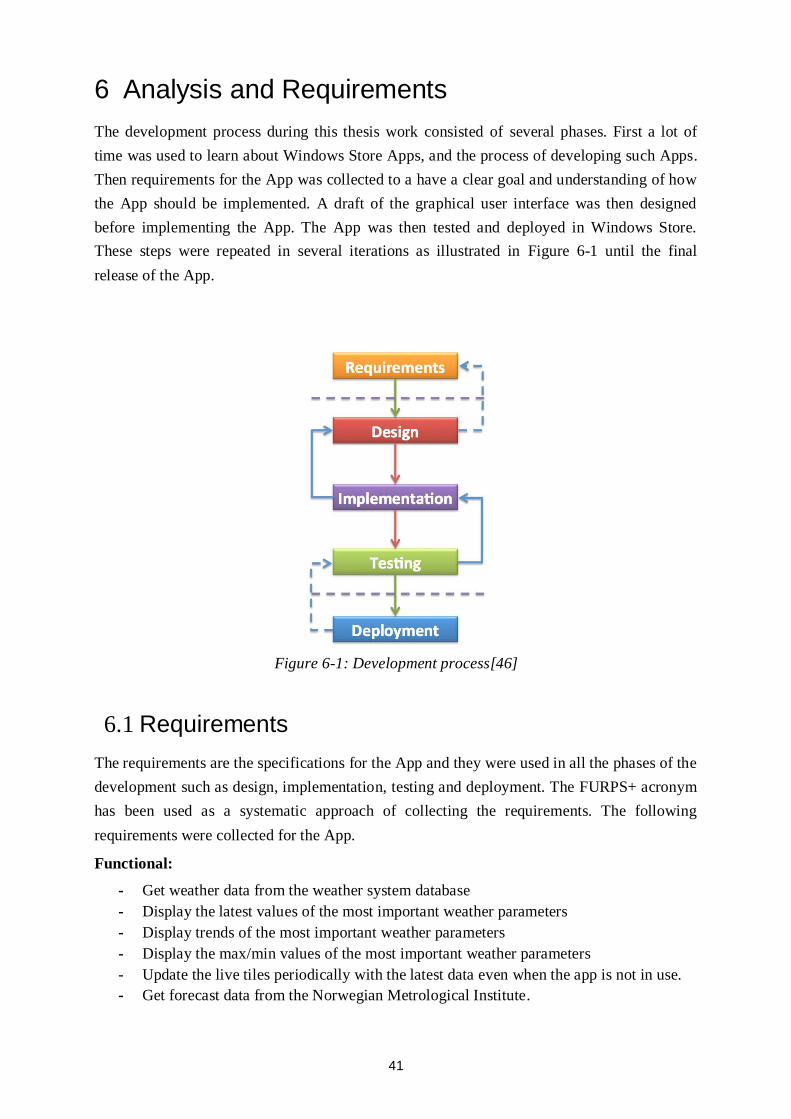
The development process during this thesis work consisted of several phases. First a lot of
time was used to learn about Windows Store Apps, and the process of developing such Apps.
Then requirements for the App was collected to a have a clear goal and understanding of how
the App should be implemented. A draft of the graphical user interface was then designed
before implementing the App. The App was then tested and deployed in Windows Store.
These steps were repeated in several iterations as illustrated in Figure 6-1 until the final
release of the App.
Figure 6-1: Development process[46]
6.1 Requirements
The requirements are the specifications for the App and they were used in all the phases of the
development such as design, implementation, testing and deployment. The FURPS+ acronym
has been used as a systematic approach of collecting the requirements. The following
requirements were collected for the App.
Functional:
- Get weather data from the weather system database
- Display the latest values of the most important weather parameters
- Display trends of the most important weather parameters
- Display the max/min values of the most important weather parameters
- Update the live tiles periodically with the latest data even when the app is not in use.
- Get forecast data from the Norwegian Metrological Institute.
42
Usability:
- The app should be easy to use by everybody.
- The app should be touch screen friendly.
- The data should be displayed in various formats( text, table ,chart, simple animations)
Reliability: No reliability requirements were identified.
Performance:
- The app should respond fast to user interaction and display simple animations during
longer processes.
Supportability:
- The latest version of the weather app should be available in Windows Store.
- The Application should be developed using Visual Studio 2012 using C# and XAML
+: The App should be free.
6.2 Graphical User Interface
In the design phase a draft for the graphical user interface was created using the built in tablet
simulator in Visual Studio and PowerPoint. The draft consisted of several slides where each
represented an App page. The default weather App in Windows 8 was first studied in order
get an a idea of how a good user interface with a consistent look should be designed. Several
screenshots was then taken for each page of a simple blank App running on the tablet
simulator in Visual Studio.
The screenshots was exported to PowerPoint where small pictures, figures and some text was
added so each page looked like a real app page. Click events was then added to simulate the
navigation between the different pages
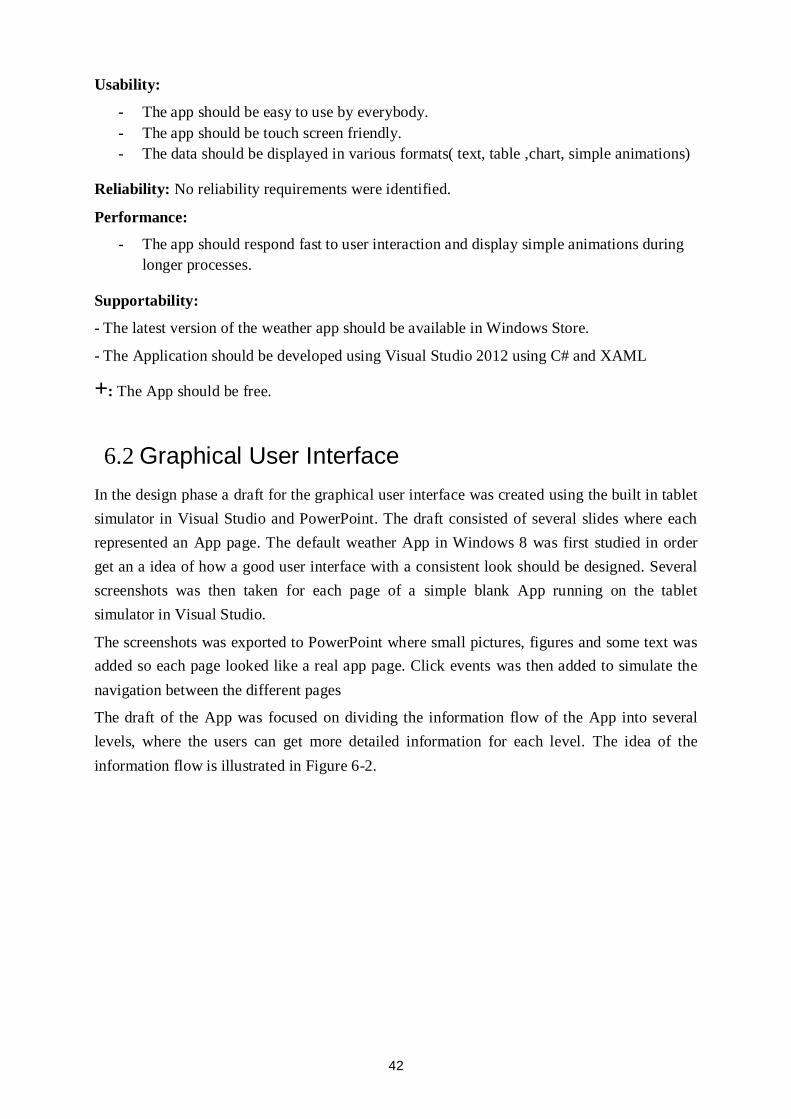
The draft of the App was focused on dividing the information flow of the App into several
levels, where the users can get more detailed information for each level. The idea of the
information flow is illustrated in Figure 6-2.
43
Figure 6-2: App information flow
The draft included design of a live tile, a main page and several pages to display weather
parameter trends. The complete draft of the user interface can be found in Appendix D.
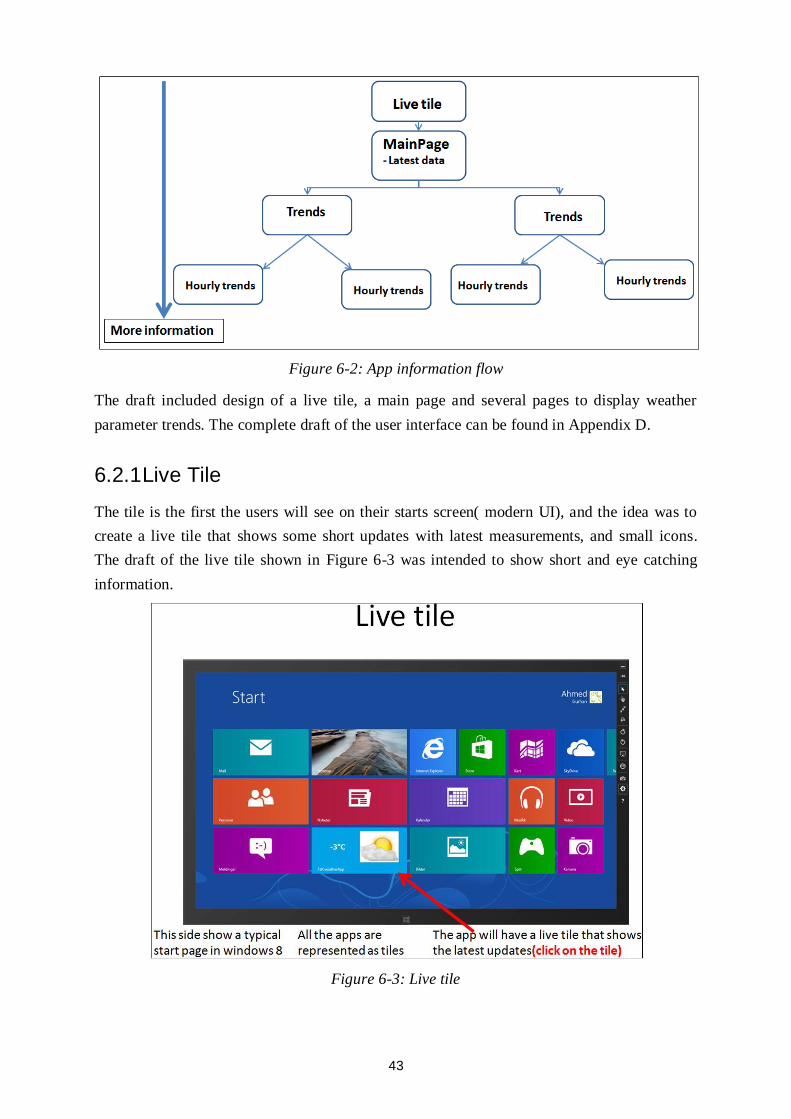
6.2.1 Live Tile
The tile is the first the users will see on their starts screen( modern UI), and the idea was to
create a live tile that shows some short updates with latest measurements, and small icons.
The draft of the live tile shown in Figure 6-3 was intended to show short and eye catching
information.
Figure 6-3: Live tile
44
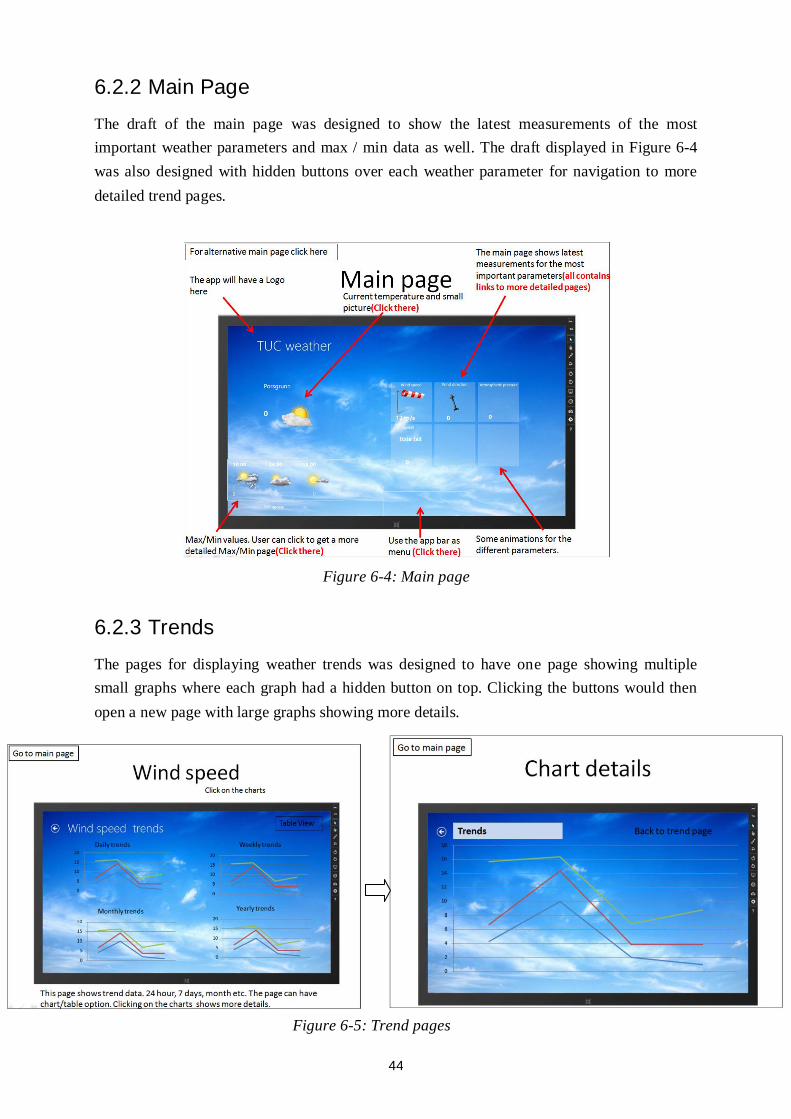
6.2.2 Main Page
The draft of the main page was designed to show the latest measurements of the most
important weather parameters and max / min data as well. The draft displayed in Figure 6-4
was also designed with hidden buttons over each weather parameter for navigation to more
detailed trend pages.
Figure 6-4: Main page
6.2.3 Trends
The pages for displaying weather trends was designed to have one page showing multiple
small graphs where each graph had a hidden button on top. Clicking the buttons would then
open a new page with large graphs showing more details.
Figure 6-5: Trend pages
45
Part IV: Implementation,
Testing, and
Deployment
46
7 Implementation
The Windows Store App was implemented following the work done during the analyses and
requirements gathering process. In addition to this an ASP.NET website was implemented to
manage the information displayed in two of the live tiles. The App and the website uses the
web service in the weather SDK, therefore some modifications was made on this web service
during the implementation. The weather App has also a forecast page for displaying weather
forecast data from the Norwegian Metrological Institute. This forecast data is retrieved from a
web service at yr.no.
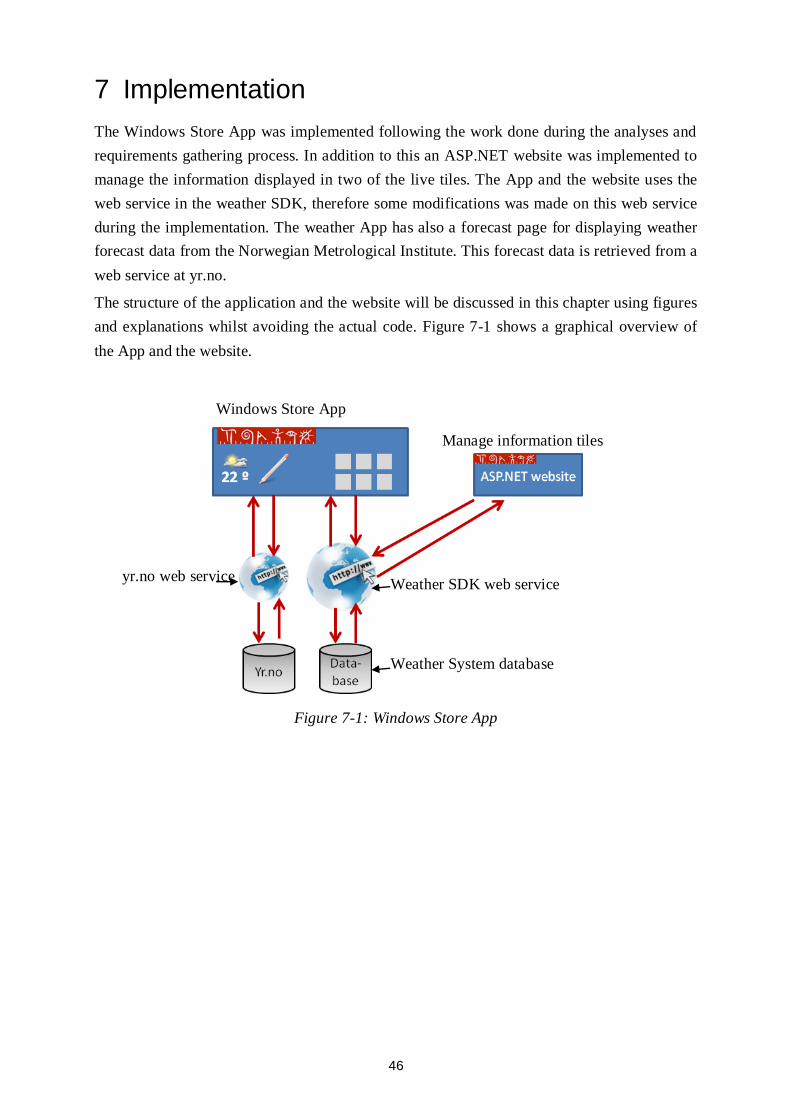
The structure of the application and the website will be discussed in this chapter using figures
and explanations whilst avoiding the actual code. Figure 7-1 shows a graphical overview of
the App and the website.
Figure 7-1: Windows Store App
Windows Store App
Manage information tiles
Weather SDK web service yr.no web service
Weather System database
47
7.1 App Pages and Navigation
The App contains the total number of 23 pages for presenting weather data. These pages are:
A Main page displaying the latest weather data and max/min values.
A forecast page displaying weather forecast data.
21 pages displaying weather trends.
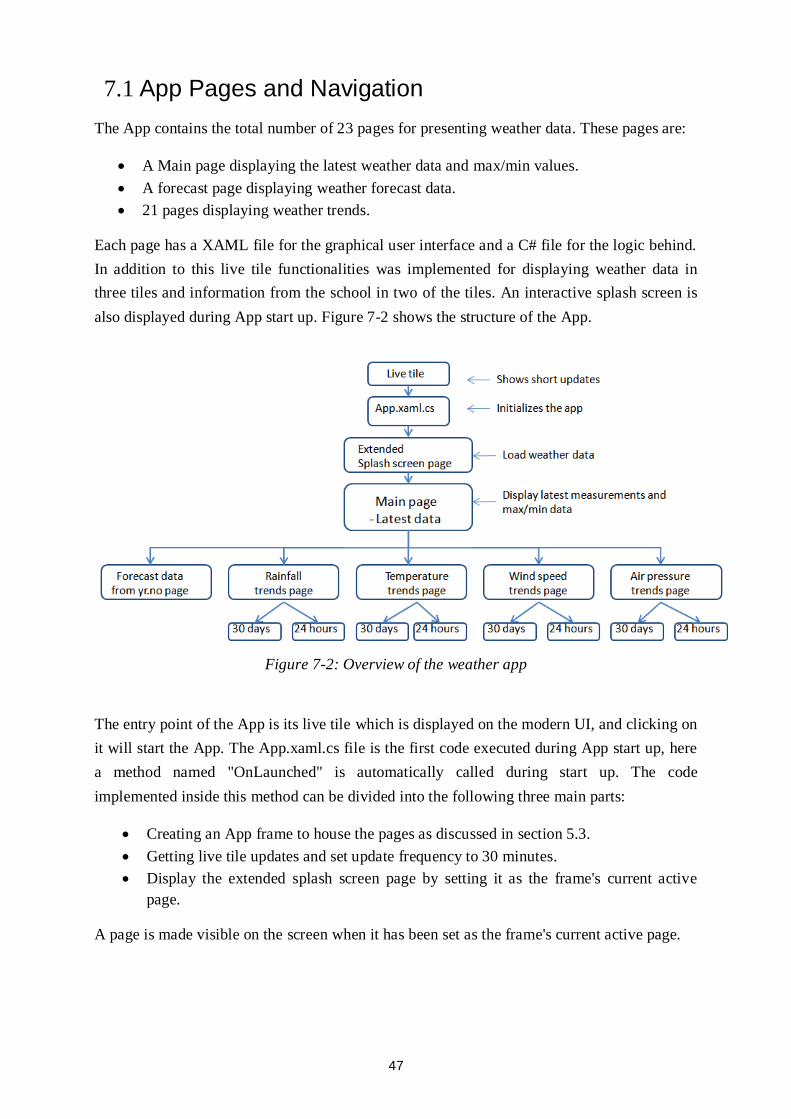
Each page has a XAML file for the graphical user interface and a C# file for the logic behind.
In addition to this live tile functionalities was implemented for displaying weather data in
three tiles and information from the school in two of the tiles. An interactive splash screen is
also displayed during App start up. Figure 7-2 shows the structure of the App.
Figure 7-2: Overview of the weather app
The entry point of the App is its live tile which is displayed on the modern UI, and clicking on
it will start the App. The App.xaml.cs file is the first code executed during App start up, here
a method named "OnLaunched" is automatically called during start up. The code
implemented inside this method can be divided into the following three main parts:
Creating an App frame to house the pages as discussed in section 5.3.
Getting live tile updates and set update frequency to 30 minutes.
Display the extended splash screen page by setting it as the frame's current active
page.
A page is made visible on the screen when it has been set as the frame's current active page.
48
7.2 Extended Splash Screen
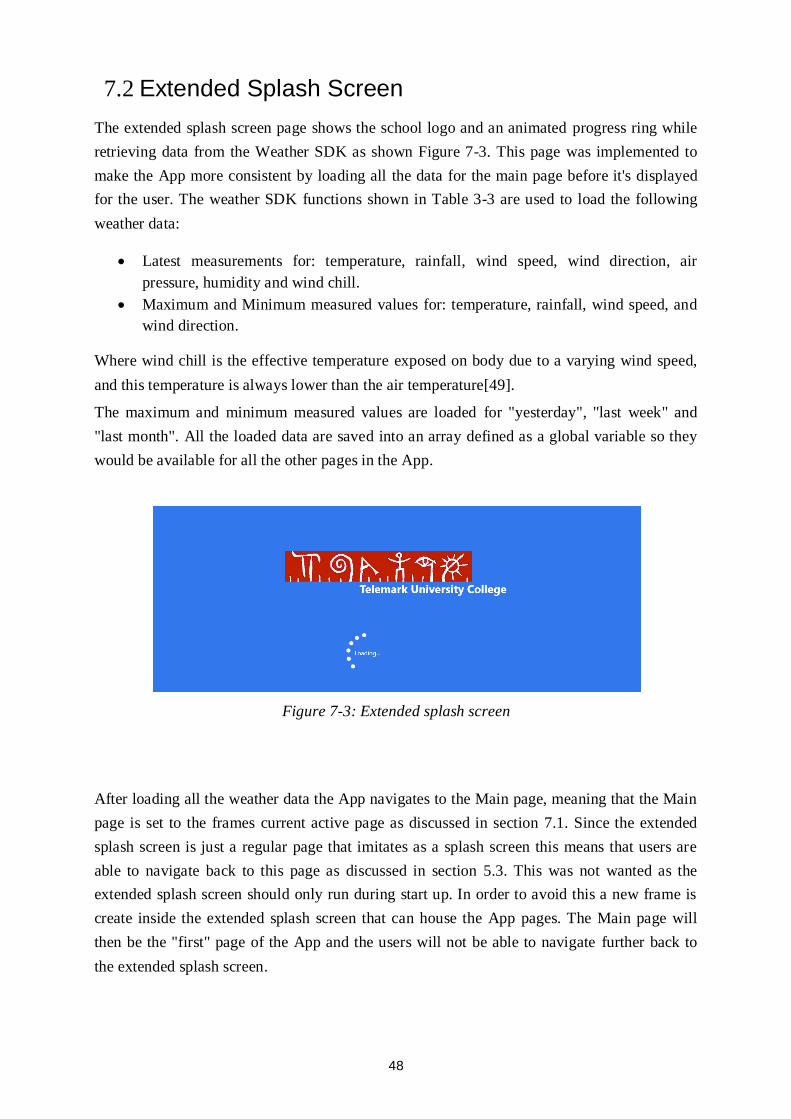
The extended splash screen page shows the school logo and an animated progress ring while
retrieving data from the Weather SDK as shown Figure 7-3. This page was implemented to
make the App more consistent by loading all the data for the main page before it's displayed
for the user. The weather SDK functions shown in Table 3-3 are used to load the following
weather data:
Latest measurements for: temperature, rainfall, wind speed, wind direction, air
pressure, humidity and wind chill.
Maximum and Minimum measured values for: temperature, rainfall, wind speed, and
wind direction.
Where wind chill is the effective temperature exposed on body due to a varying wind speed,
and this temperature is always lower than the air temperature[49].
The maximum and minimum measured values are loaded for "yesterday", "last week" and
"last month". All the loaded data are saved into an array defined as a global variable so they
would be available for all the other pages in the App.
Figure 7-3: Extended splash screen
After loading all the weather data the App navigates to the Main page, meaning that the Main
page is set to the frames current active page as discussed in section 7.1. Since the extended
splash screen is just a regular page that imitates as a splash screen this means that users are
able to navigate back to this page as discussed in section 5.3. This was not wanted as the
extended splash screen should only run during start up. In order to avoid this a new frame is
create inside the extended splash screen that can house the App pages. The Main page will
then be the "first" page of the App and the users will not be able to navigate further back to
the extended splash screen.
49
In addition to loading weather data the extended splash screen is also used to load the
background image for the whole App. The background image is made dynamic so it will
change according to the weather. This has been accomplished by implementing a new
function in the Weather SDK web service named "GetBackgroundImage".
This function uses the latest rain fall and solar radiation data to determine the most proper
background image that describes the current weather best. The function returns the image
name, and the App searches for this image in the App folder. A set of weather images has
been saved in the App folder for this purpose, and the selected image is set as the background
image for the new frame. All the pages therefore will have the same background image.
7.3 Main Page
The implementation of the graphical user interface for the main page was based on the draft
created during the design phase, and the final user interface displayed in Figure 7-4 is very
much like the draft in Figure 6-4. The current weather data is displayed at the center of the
page while the maximum and minimum values are displayed at the bottom of the page. The
data is displayed using textblocks while dynamic pictures and animations has been used to
improve the user experience. The following animations were created using Blend for Visual
studio[42]:
rainfall animation: This animation shows some raindrops falling down from a cloud
when it rains. The latest rainfall data is used to start and stop this animation
Wind direction animation: This animation shows the wind direction using the latest
measured wind direction. The wind direction values are in the range of 0 - 360 º . An
arrow is used to point at this direction.
Air pressure animation: This animation illustrates pressure rise and pressure drop
using a pressure gauge. The animation runs constantly and it's not connected to any
measurement data.
Wind speed animation: This animation shows a wind socket in motion to simulate
wind speed change. The animation runs constantly and it's not connected to any
weather data.
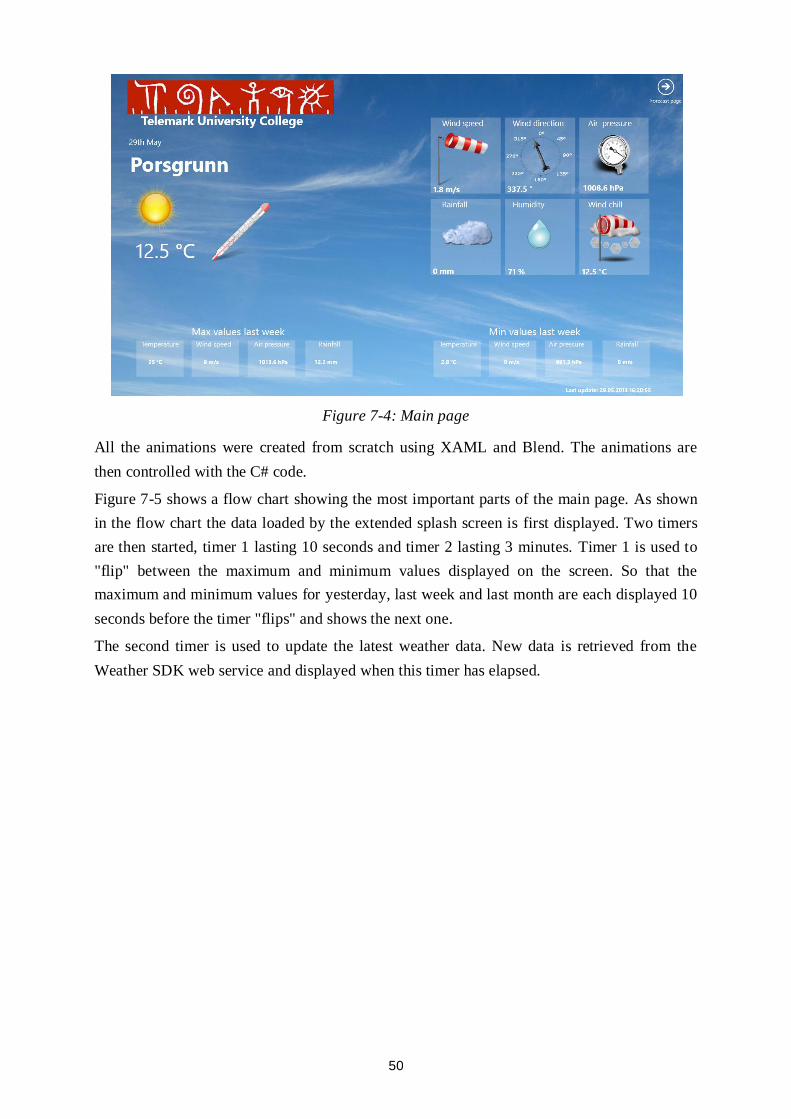
50
Figure 7-4: Main page
All the animations were created from scratch using XAML and Blend. The animations are
then controlled with the C# code.
Figure 7-5 shows a flow chart showing the most important parts of the main page. As shown
in the flow chart the data loaded by the extended splash screen is first displayed. Two timers
are then started, timer 1 lasting 10 seconds and timer 2 lasting 3 minutes. Timer 1 is used to
"flip" between the maximum and minimum values displayed on the screen. So that the
maximum and minimum values for yesterday, last week and last month are each displayed 10
seconds before the timer "flips" and shows the next one.
The second timer is used to update the latest weather data. New data is retrieved from the
Weather SDK web service and displayed when this timer has elapsed.
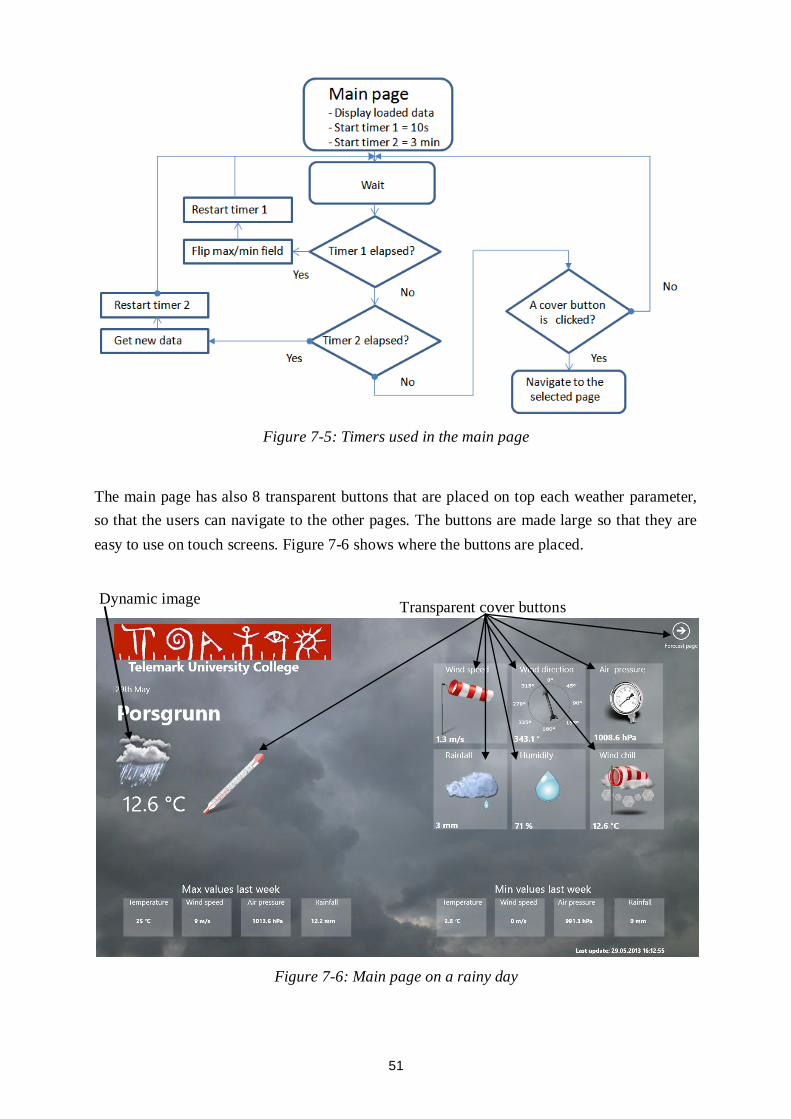
51
Figure 7-5: Timers used in the main page
The main page has also 8 transparent buttons that are placed on top each weather parameter,
so that the users can navigate to the other pages. The buttons are made large so that they are
easy to use on touch screens. Figure 7-6 shows where the buttons are placed.
Figure 7-6: Main page on a rainy day
Dynamic image
Transparent cover buttons
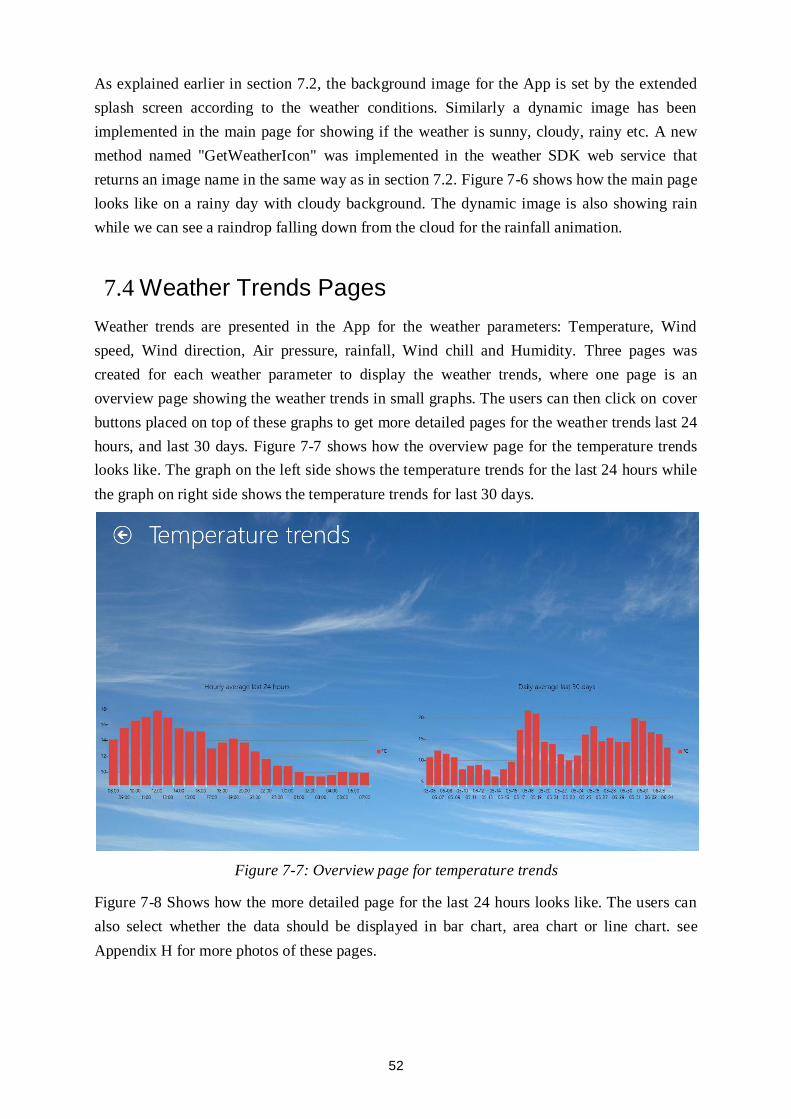
52
As explained earlier in section 7.2, the background image for the App is set by the extended
splash screen according to the weather conditions. Similarly a dynamic image has been
implemented in the main page for showing if the weather is sunny, cloudy, rainy etc. A new
method named "GetWeatherIcon" was implemented in the weather SDK web service that
returns an image name in the same way as in section 7.2. Figure 7-6 shows how the main page
looks like on a rainy day with cloudy background. The dynamic image is also showing rain
while we can see a raindrop falling down from the cloud for the rainfall animation.
7.4 Weather Trends Pages
Weather trends are presented in the App for the weather parameters: Temperature, Wind
speed, Wind direction, Air pressure, rainfall, Wind chill and Humidity. Three pages was
created for each weather parameter to display the weather trends, where one page is an
overview page showing the weather trends in small graphs. The users can then click on cover
buttons placed on top of these graphs to get more detailed pages for the weather trends last 24
hours, and last 30 days. Figure 7-7 shows how the overview page for the temperature trends
looks like. The graph on the left side shows the temperature trends for the last 24 hours while
the graph on right side shows the temperature trends for last 30 days.
Figure 7-7: Overview page for temperature trends
Figure 7-8 Shows how the more detailed page for the last 24 hours looks like. The users can
also select whether the data should be displayed in bar chart, area chart or line chart. see
Appendix H for more photos of these pages.
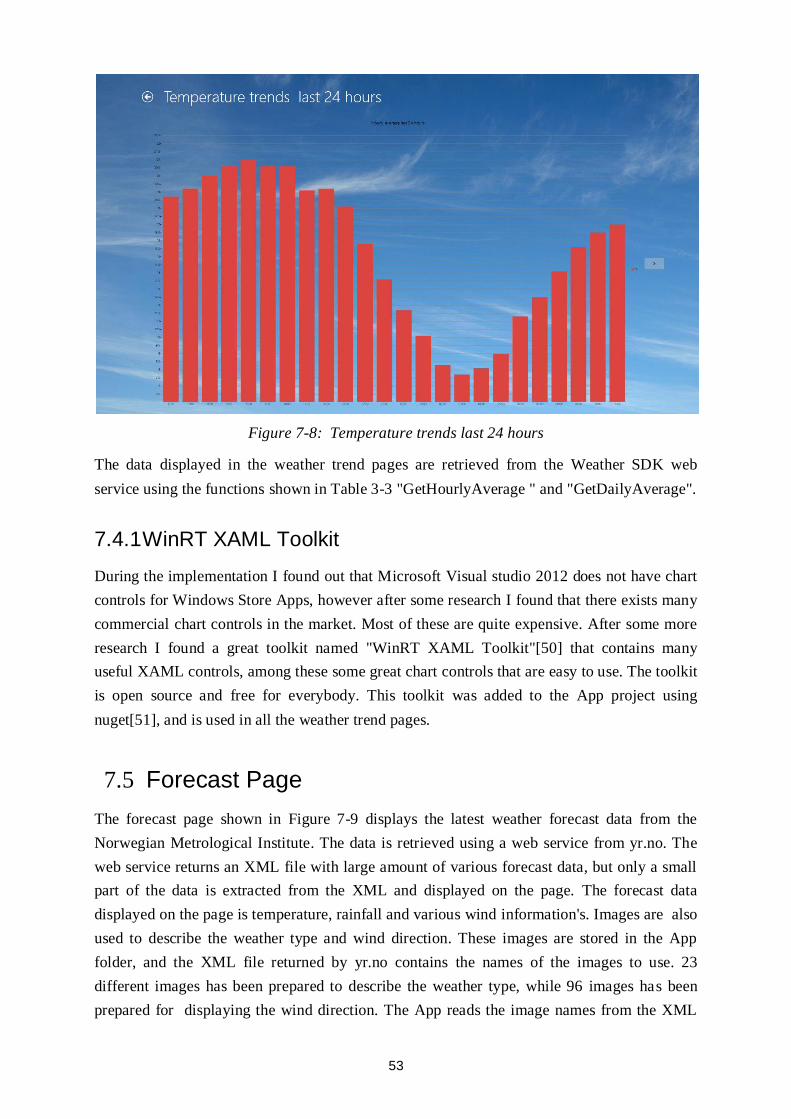
53
Figure 7-8: Temperature trends last 24 hours
The data displayed in the weather trend pages are retrieved from the Weather SDK web
service using the functions shown in Table 3-3 "GetHourlyAverage " and "GetDailyAverage".
7.4.1 WinRT XAML Toolkit
During the implementation I found out that Microsoft Visual studio 2012 does not have chart
controls for Windows Store Apps, however after some research I found that there exists many
commercial chart controls in the market. Most of these are quite expensive. After some more
research I found a great toolkit named "WinRT XAML Toolkit"[50] that contains many
useful XAML controls, among these some great chart controls that are easy to use. The toolkit
is open source and free for everybody. This toolkit was added to the App project using
nuget[51], and is used in all the weather trend pages.
7.5 Forecast Page
The forecast page shown in Figure 7-9 displays the latest weather forecast data from the
Norwegian Metrological Institute. The data is retrieved using a web service from yr.no. The
web service returns an XML file with large amount of various forecast data, but only a small
part of the data is extracted from the XML and displayed on the page. The forecast data
displayed on the page is temperature, rainfall and various wind information's. Images are also
used to describe the weather type and wind direction. These images are stored in the App
folder, and the XML file returned by yr.no contains the names of the images to use. 23
different images has been prepared to describe the weather type, while 96 images has been
prepared for displaying the wind direction. The App reads the image names from the XML
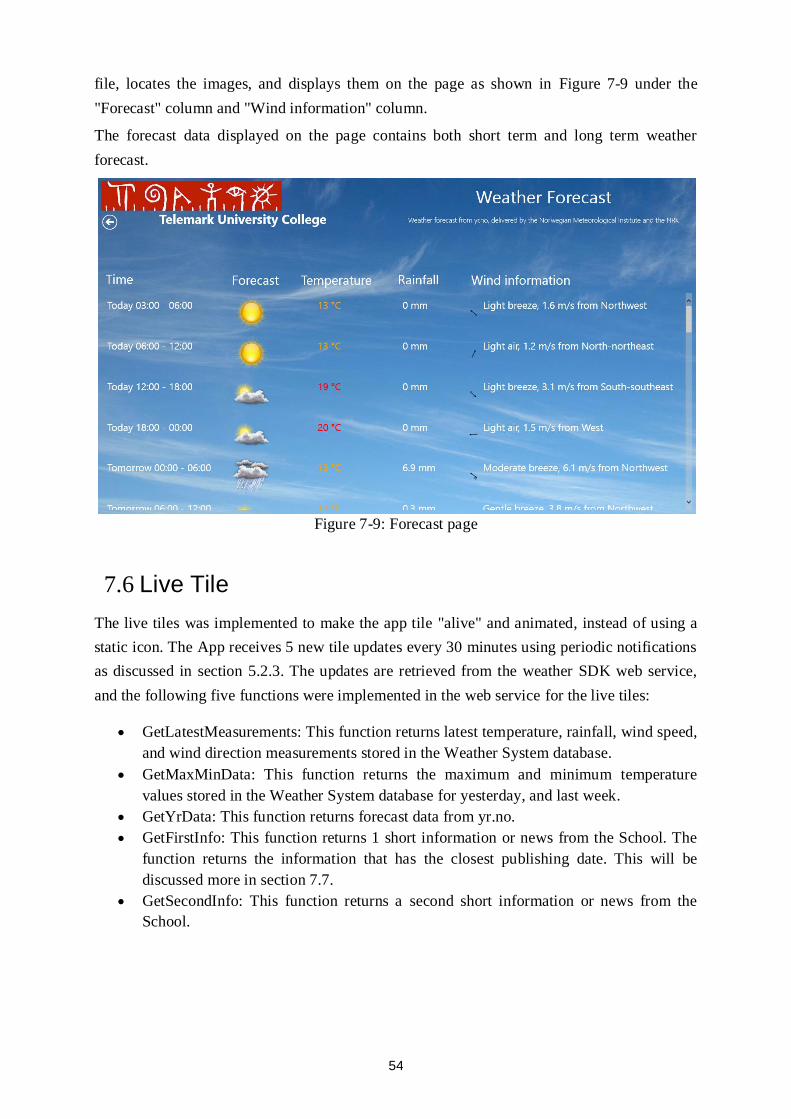
54
file, locates the images, and displays them on the page as shown in Figure 7-9 under the
"Forecast" column and "Wind information" column.
The forecast data displayed on the page contains both short term and long term weather
forecast.
Figure 7-9: Forecast page
7.6 Live Tile
The live tiles was implemented to make the app tile "alive" and animated, instead of using a
static icon. The App receives 5 new tile updates every 30 minutes using periodic notifications
as discussed in section 5.2.3. The updates are retrieved from the weather SDK web service,
and the following five functions were implemented in the web service for the live tiles:
GetLatestMeasurements: This function returns latest temperature, rainfall, wind speed,
and wind direction measurements stored in the Weather System database.
GetMaxMinData: This function returns the maximum and minimum temperature
values stored in the Weather System database for yesterday, and last week.
GetYrData: This function returns forecast data from yr.no.
GetFirstInfo: This function returns 1 short information or news from the School. The
function returns the information that has the closest publishing date. This will be
discussed more in section 7.7.
GetSecondInfo: This function returns a second short information or news from the
School.
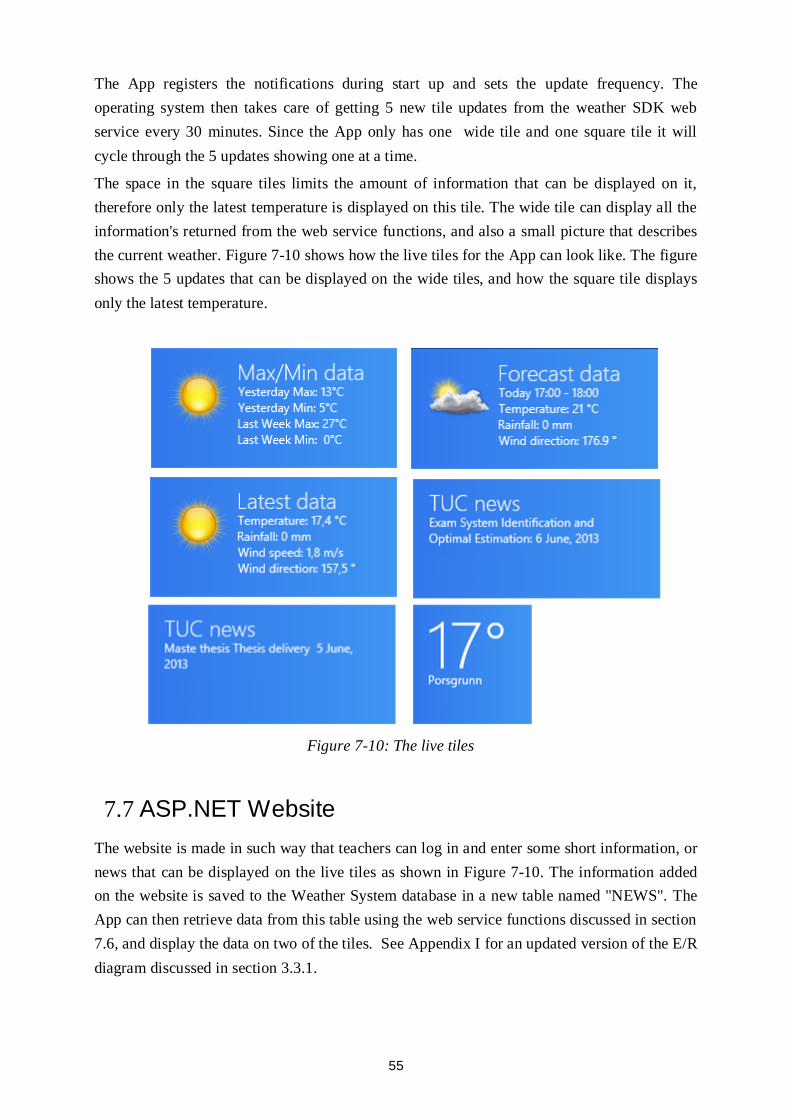
55
The App registers the notifications during start up and sets the update frequency. The
operating system then takes care of getting 5 new tile updates from the weather SDK web
service every 30 minutes. Since the App only has one wide tile and one square tile it will
cycle through the 5 updates showing one at a time.
The space in the square tiles limits the amount of information that can be displayed on it,
therefore only the latest temperature is displayed on this tile. The wide tile can display all the
information's returned from the web service functions, and also a small picture that describes
the current weather. Figure 7-10 shows how the live tiles for the App can look like. The figure
shows the 5 updates that can be displayed on the wide tiles, and how the square tile displays
only the latest temperature.
7.7 ASP.NET Website
The website is made in such way that teachers can log in and enter some short information, or
news that can be displayed on the live tiles as shown in Figure 7-10. The information added
on the website is saved to the Weather System database in a new table named "NEWS". The
App can then retrieve data from this table using the web service functions discussed in section
7.6, and display the data on two of the tiles. See Appendix I for an updated version of the E/R
diagram discussed in section 3.3.1.
Figure 7-10: The live tiles
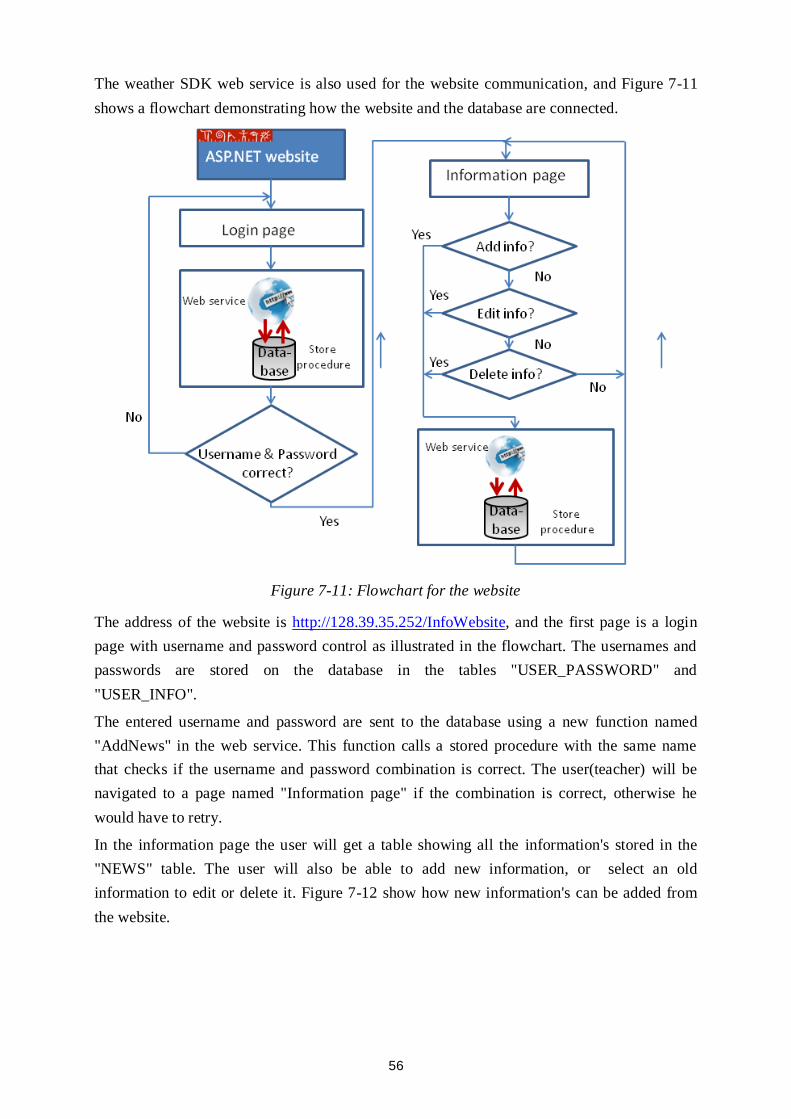
56
The weather SDK web service is also used for the website communication, and Figure 7-11
shows a flowchart demonstrating how the website and the database are connected.
Figure 7-11: Flowchart for the website
The address of the website is http://128.39.35.252/InfoWebsite, and the first page is a login
page with username and password control as illustrated in the flowchart. The usernames and
passwords are stored on the database in the tables "USER_PASSWORD" and
"USER_INFO".
The entered username and password are sent to the database using a new function named
"AddNews" in the web service. This function calls a stored procedure with the same name
that checks if the username and password combination is correct. The user(teacher) will be
navigated to a page named "Information page" if the combination is correct, otherwise he
would have to retry.
In the information page the user will get a table showing all the information's stored in the
"NEWS" table. The user will also be able to add new information, or select an old
information to edit or delete it. Figure 7-12 show how new information's can be added from
the website.
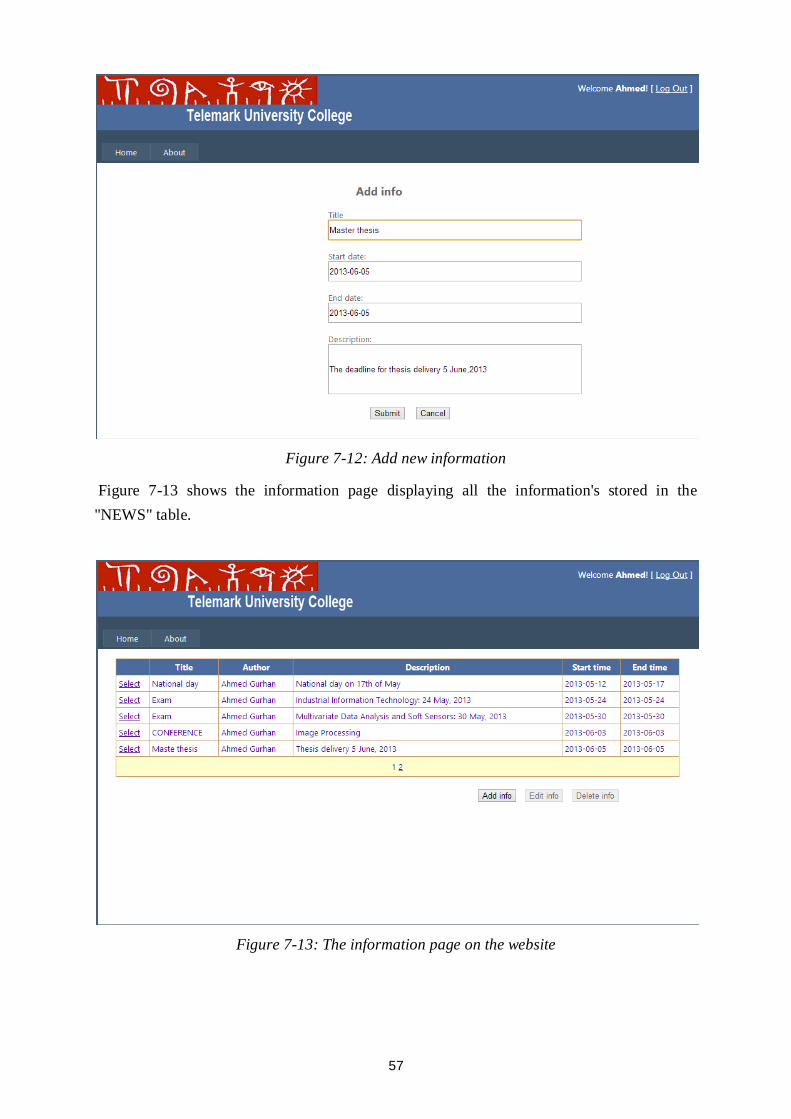
57
Figure 7-12: Add new information
Figure 7-13 shows the information page displaying all the information's stored in the
"NEWS" table.
Figure 7-13: The information page on the website
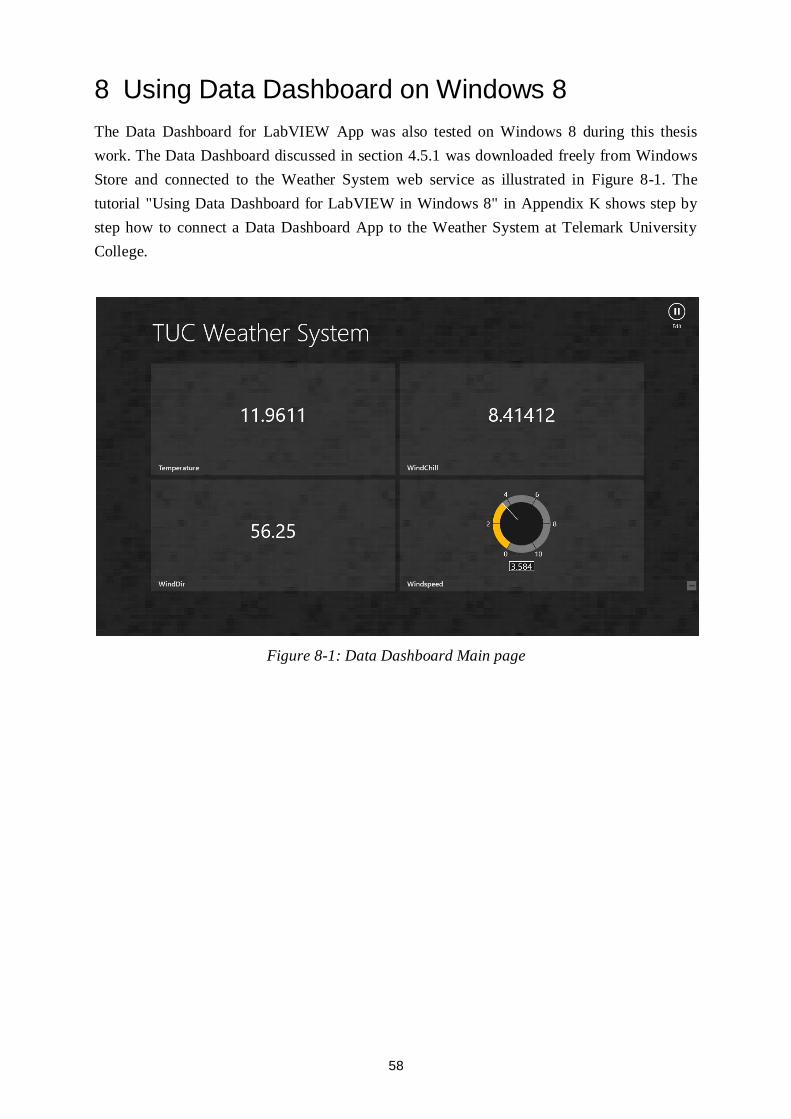
58
8 Using Data Dashboard on Windows 8
The Data Dashboard for LabVIEW App was also tested on Windows 8 during this thesis
work. The Data Dashboard discussed in section 4.5.1 was downloaded freely from Windows
Store and connected to the Weather System web service as illustrated in Figure 8-1. The
tutorial "Using Data Dashboard for LabVIEW in Windows 8" in Appendix K shows step by
step how to connect a Data Dashboard App to the Weather System at Telemark University
College.
Figure 8-1: Data Dashboard Main page
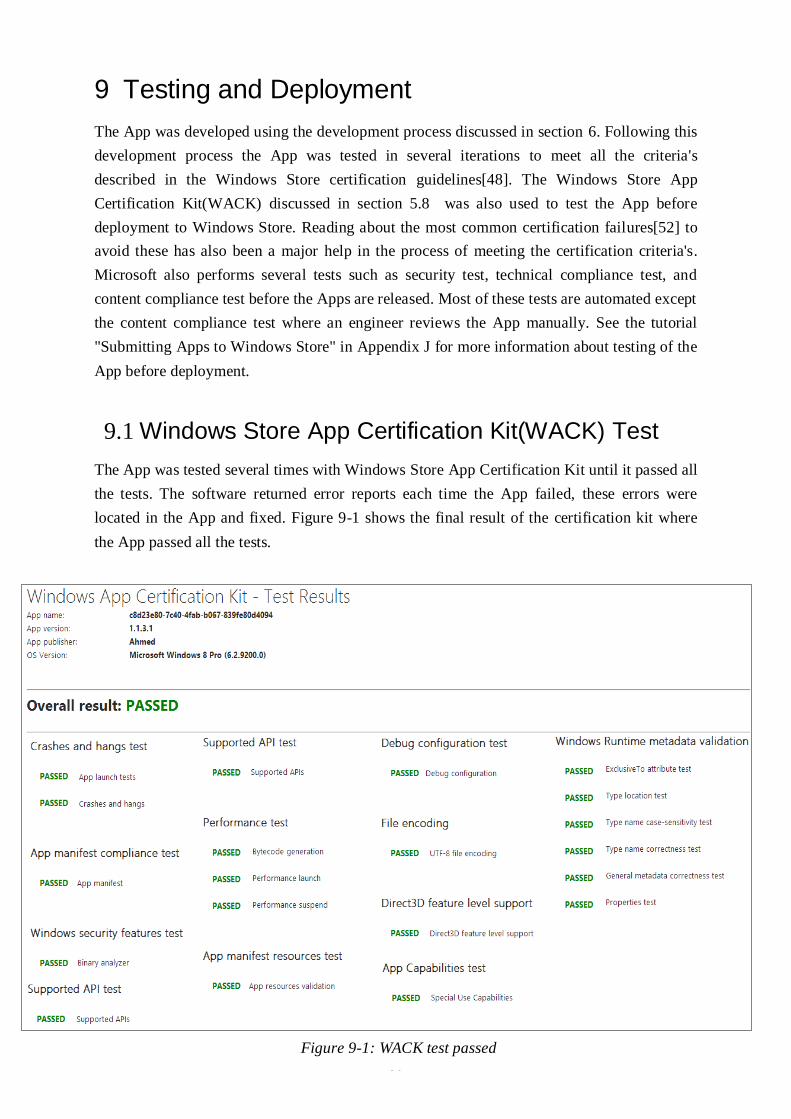
59
9 Testing and Deployment
The App was developed using the development process discussed in section 6. Following this
development process the App was tested in several iterations to meet all the criteria's
described in the Windows Store certification guidelines[48]. The Windows Store App
Certification Kit(WACK) discussed in section 5.8 was also used to test the App before
deployment to Windows Store. Reading about the most common certification failures[52] to
avoid these has also been a major help in the process of meeting the certification criteria's.
Microsoft also performs several tests such as security test, technical compliance test, and
content compliance test before the Apps are released. Most of these tests are automated except
the content compliance test where an engineer reviews the App manually. See the tutorial
"Submitting Apps to Windows Store" in Appendix J for more information about testing of the
App before deployment.
9.1 Windows Store App Certification Kit(WACK) Test
The App was tested several times with Windows Store App Certification Kit until it passed all
the tests. The software returned error reports each time the App failed, these errors were
located in the App and fixed. Figure 9-1 shows the final result of the certification kit where
the App passed all the tests.
Figure 9-1: WACK test passed
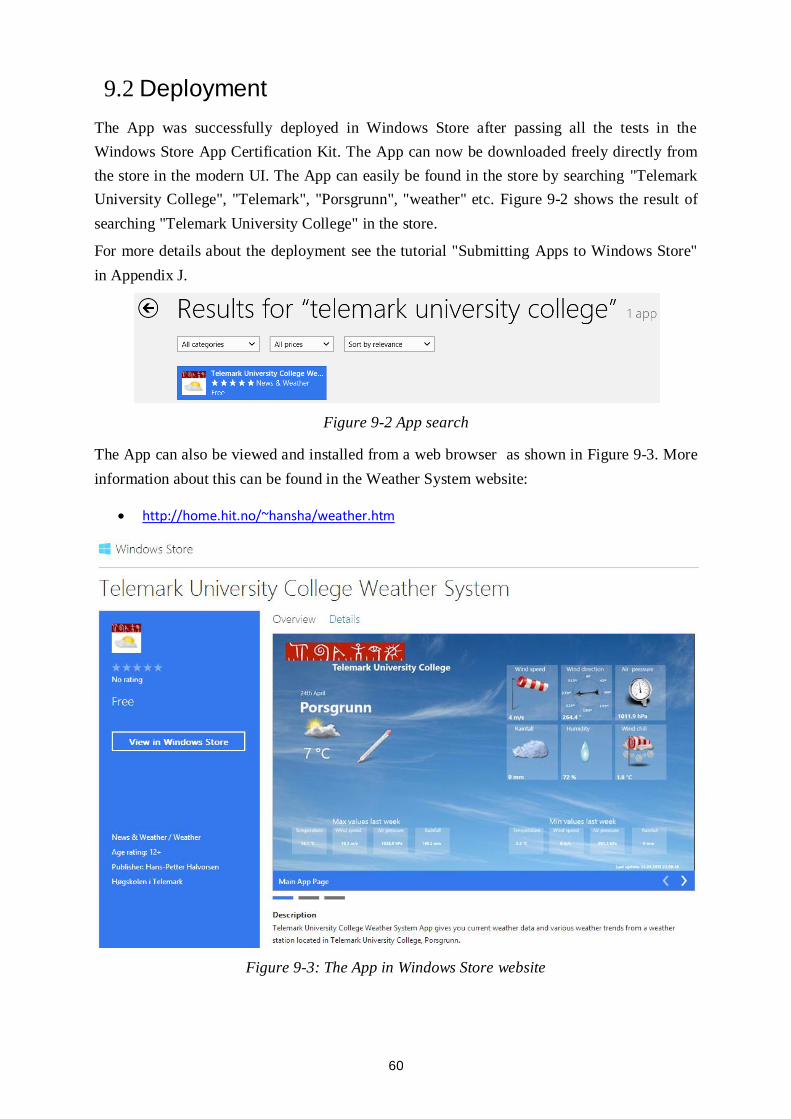
60
9.2 Deployment
The App was successfully deployed in Windows Store after passing all the tests in the
Windows Store App Certification Kit. The App can now be downloaded freely directly from
the store in the modern UI. The App can easily be found in the store by searching "Telemark
University College", "Telemark", "Porsgrunn", "weather" etc. Figure 9-2 shows the result of
searching "Telemark University College" in the store.
For more details about the deployment see the tutorial "Submitting Apps to Windows Store"
in Appendix J.
Figure 9-2 App search
The App can also be viewed and installed from a web browser as shown in Figure 9-3. More
information about this can be found in the Weather System website:
http://home.hit.no/~hansha/weather.htm
Figure 9-3: The App in Windows Store website
61
Part V: Summary
62
10 Discussions
The main focus of this thesis work has been to create a Windows Store App from scratch, and
deploy it so everybody who is interested in the weather from the Weather System can
download and install freely. The development of Windows Store Apps was experienced for
the first time during this thesis work, therefore a lot of time was used in gathering information
and learning about App development. Windows Store Apps are also currently quite new in the
market and the resources available are still limited. Even though these challenges slowed
down the development process a fully functional App was developed, and successfully
deployed in Windows Store. The tests performed with the Windows Store App Certification
Kit and the improvements done thereafter in several iterations has ruled out many problems
and made the App more robust.
10.1 Future Work
All the functionalities requested in the task description for the App were covered, and new
functionalities such as the forecast page and the website were also added. However there are
still room for improvements, and the following recommendations are proposed for future
work to improve the App:
Create a statistics page that shows the most important weather parameters side by side.
A solution could be to display the temperature variations for a specific period in a
graph while highlighting the max/min values, and at the same time show how the
other parameters changes during the same period.
Show the maximum/minimum value records. The highest and lowest values recorded
since the weather system was implemented.
Show how many rain days or snow days for each month and each year.
63
11 Summary
A Windows Store App that presents weather data from the weather system installed at
Telemark University College was created, and deployed in Windows Store. The App uses the
Weather SDK web service to communicate with the weather system database and retrieve
weather data. The latest measurement data, max/min data, and trend data are retrieved and
presented on the App. In addition to this weather forecast data from the Norwegian
Metrological Institute(MI) is presented on a custom forecast page. The data from MI is
retrieved using a web service from yr.no. Live tile functionalities has also been implemented
on the App to display short weather updates and information from the school on the App tile.
A website was also created in ASP.NET to manage the information from school that is
displayed on the live tiles.
New functions has been implemented on the Weather SDK web service for the App and
website. A stored procedure was also implemented in the weather system database to simplify
the data management process for the website, and take care of username and password
checking.
The App was developed using the C# programming language for implementing the App logic
and XAML for the graphical user interface. Microsoft Visual Studio 2012 was used as
development environment for the App, the ASP.NET website and for implementing new
functions on the weather SDK web service.
64
12 References
[1] Apple, "ipad," 2013.
[2] Microsoft. (2013). Windows Store Developer Center. Available:
https://appdev.microsoft.com/StorePortals
[3] Christian Aanning, Ahmed Gurhan, Victor Amaechi Igbokwe, Jishnu Unnikannan
Nair, Cuong Nguyen, and Andre Skare Berg, "Design and Implementation of Weather
System for Acquiring and Monitoring of Weather Data," 2012.
[4] I. Columba Weather Systems, "Capricorn 2000EX™ Weather Station User Manual,"
vol. 1.06, 2011.
[5] I. Columbia Weather Systems. (2013). Weather MicroServer. Available:
http://www.columbiaweather.com/products/weather-monitoring/microserver/
[6] I. Columbia Weather Systems, "Self-Aspirating Radiation Shield," 2010.
[7] I. Columbia Weather Systems. (2013). Capricorn 2000EX Weather Station. Available:
http://www.columbiaweather.com/products/weather-stations/fixed-mount/capricorn-
2000ex-weather-station/
[8] W. Underground, "Weather Underground," 2013.
[9] A. Weather, "Anything Weather " 2013.
[10] C. W. O. Program, "Citizen Weather Observer Program," 2013.
[11] Microsoft. (2012). Windows Server 2008. Available: http://technet.microsoft.com/en-
us/windowsserver/bb310558.aspx
[12] N. Instruments. (2012). LabVIEW. Available:
http://sine.ni.com/np/app/main/p/docid/nav-104/lang/no/
[13] M. Organization. (2013). Modbus Organization. Available:
http://www.modbus.org/specs.php
[14] N.-O. Skeie, Industrial Information Technology, 2012.
[15] Microsoft. (2010). Introduction to Windows Service Applications. Available:
http://msdn.microsoft.com/en-us/library/d56de412(v=vs.80).aspx
[16] W. S. Group. (2013). Web service. Available:
http://128.39.35.252/WebApi/WebService.asmx
[17] H.-P. HALVORSEN, "Structured Query Language," 2012.
[18] Microsoft. (2013). IIS. Available: http://www.iis.net/
[19] Wikipedia. (2013). Web service. Available: http://en.wikipedia.org/wiki/Web_service
[20] N. Instruments. (2013). Smartphones and Tablets for Measurement and Control.
Available: http://zone.ni.com/devzone/cda/pub/p/id/1387
[21] Wikipedia. (2013). IOS. Available: http://en.wikipedia.org/wiki/Ios
[22] Apple. (2013). Apple press info. Available:
http://www.apple.com/pr/library/2013/01/07App-Store-Tops-40-Billion-Downloads-
with-Almost-Half-in-2012.html
[23] Apple. (2013). Xcode. Available: https://developer.apple.com/xcode/index.php
[24] Apple. (2013). Apple ID. Available: https://developer.apple.com/register/index.action
[25] Wikipedia. (2013). Android. Available:
http://en.wikipedia.org/wiki/Android_(operating_system)
[26] Deitel, Android: How to Program, 2013.
[27] Google. (2013). Google Play. Available: https://play.google.com/store
65
[28] sociable. (2013). Google Play will hit one million apps this June. Available:
http://sociable.co/mobile/google-play-will-hit-one-billion-apps-this-june/
[29] Android, "Android," 2013.
[30] Google, "Get the Android SDK," 2013.
[31] Google, "Android Studio," 2013.
[32] J. Likness, "Building Windows 8 apps with C# and XAML," 2012.
[33] S. Moreau, "Redesigning the Windows Logo," ed, 2012.
[34] ARM. (2013). Processors. Available:
http://www.arm.com/products/processors/index.php
[35] Microsoft, "Windows Store Apps," 2013.
[36] ComputerWeekly.com. (2013). BT rolls out toughened Windows 8 OS tablets for
engineers. Available: http://www.computerweekly.com/news/2240171827/BT-rolls-
out-toughened-Windows-8-OS-tablets-for-engineers
[37] N. INstruments. (2013). National Instruments. Available: http://norway.ni.com/
[38] N. Instruments, "Mobile Technology for Measurement and Control," 2013.
[39] N. Instruments. (2013). NI cDAQ-9191. Available:
http://sine.ni.com/nips/cds/view/p/lang/no/nid/210045
[40] Microsoft. (2013). Windows API reference for Windows Store apps. Available:
http://msdn.microsoft.com/en-us/library/windows/apps/br211377.aspx
[41] Microsoft. (2012). Windows API. Available:
http://en.wikipedia.org/wiki/Windows_API
[42] Microsoft. (2013). Blend. Available: http://msdn.microsoft.com/en-
us/library/windows/apps/jj129478.aspx
[43] Microsoft, "ASP.NET," 2013.
[44] Microsoft, "Manage app lifecycle and state " 2013.
[45] Wikipedia. (2012). .NET Framework. Available:
http://en.wikipedia.org/wiki/.NET_Framework
[46] N.-O. Skeie, Object-Oriented Analysis, Design, and Programming using UML and
C#, 2012.
[47] Microsoft. (2013). Windows App Certification Kit. Available:
http://msdn.microsoft.com/en-us/library/windows/apps/hh694081.aspx
[48] Microsoft. (2013). Windows 8 app certification requirements. Available:
http://msdn.microsoft.com/en-us/library/windows/apps/hh694083.aspx
[49] Wikipedia, "Wind chill," 2013
[50] F. Skakun, "WinRT XAML Toolkit," 2012.
[51] Microsoft, "Nuget," 2013.
[52] Microsoft. (2013). common certification failures. Available:
http://msdn.microsoft.com/en-us/library/windows/apps/jj657968.aspx
[53] H.-P. Halvorsen, "Software Development Process," 2013.
66
Part VI: Appendices
67
13 Appendices
The Appendices and the codes can be found in the CD that has been included in this report or
by contacting the author of this report at [email protected].
Appendix A: Task Description
Appendix B: Mobile Platforms
Appendix C: Creating Windows Store Apps
Appendix D: Draft of the App
Appendix E: How to get a Windows Store Developer Account
Appendix F: How to Create Live Tiles
Appendix G: How to create a C# Web Service using Microsoft Visual Studio
Appendix H: Photos of the Implemented App
Appendix I: Updated E/R Diagram
Appendix J: Submitting Apps to Windows Store
Appendix K: Using Data Dashboard for LabVIEW in Windows 8
Appendix L: Sideloading Windows Store Apps