Embed Size (px)
Citation preview
ABSTRACT
Title of Document: THE EFFECTS OF A CONTEXTUALIZED
INSTRUCTIONAL PACKAGE ON THE AREA AND PERIMETER PERFORMANCE OF SECONDARY STUDENTS WITH EMOTIONAL AND BEHAVIORAL DISABILITIES
Candace A. Mulcahy, Ph.D., 2007 Directed By: Professor Peter E. Leone
Associate Professor Paula Maccini Department of Special Education University of Maryland, College Park
The current study examined the effects of an instructional package on the
mathematics performance of secondary students with emotional and behavioral disorders
(EBD) when applied to grade-appropriate area and perimeter objectives. The instructional
package included the following empirically-supported approaches: (a) contextualized
instruction; (b) use of manipulatives; (c) use of a cue card; and (d) self-monitoring
techniques for behavior and academic performance. The intervention also incorporated
pre-requisite skills and was delivered through a set of scripted lessons that employed
explicit instruction balanced with constructivist-based activities. The multiple-probe
design was implemented across two participants, then replicated across two more
participants (Tawney & Gast, 1984). The participants were four middle school students
with EBD in a suburban Maryland public school. Results of the study demonstrated that
participants were able to improve mathematics accuracy on area and perimeter objectives.
Three participants were also, to a limited extent, able to maintain performance over time
and transfer performance to more complex mathematics tasks. Two participants were able
to transfer performance to tasks of similar context to those practiced in the intervention.
The study suggests that, when provided explicit and sustained instruction on pre-requisite
math objectives and grade-appropriate mathematics objectives, students with EBD may
be successful with non-computational mathematics.
THE EFFECTS OF A CONTEXTUALIZED INSTRUCTIONAL PACKAGE ON THE AREA AND PERIMETER PERFORMANCE OF SECONDARY STUDENTS
WITH EMOTIONAL AND BEHAVIORAL DISABILITIES
By
Candace A. Mulcahy
Dissertation submitted to the Faculty of the Graduate School of the University of Maryland, College Park, in partial fulfillment
of the requirements for the degree of Doctor of Philosophy
2007 Advisory Committee: Professor Peter E. Leone, Co-Chair Associate Professor Paula Maccini, Co-Chair Professor Andrew Egel Professor Anna Graeber Professor Margaret McLaughlin

© Copyright by Candace A. Mulcahy
2007
ii
Acknowledgements
I want to thank my Committee Co-Chairs Dr. Peter Leone and Dr. Paula Maccini, for their
time, energy, and encouragement throughout the last four years. I would also like to express
sincere appreciation to Dr. Margaret McLaughlin, for her high expectations and thoughtful
feedback, Dr. Andy Egel, for allowing me “quick” meetings and for reassuring me that I
was on track, and Dr. Anna Graeber, for her consistent reminder to include the general
education perspective, and for her direction to important mathematics resources. Thank you
to my good friend and colleague, Mike Krezmien, for helping me organize and develop the
study, and for bailing me out when I was lost.
To the students, the special education department, and the principal at the middle school
where I conducted the study, you have played a huge role in my career development and the
success of this study.
I would like to acknowledge the Donald D. Hammill Foundation for their generous
financial support to complete this study.
My final thanks go to my husband, Nate, and my parents, for their support and
encouragement throughout this journey.
iii
Table of Contents
LIST OF TABLES ………………………………………………………… vi LIST OF FIGURES ……………………………………………………….. vii Chapter 1: Introduction ……………………………………………………. .1
Developing Mathematics Proficiency ………………………………2 Status of Mathematics Proficiency in the United States…………….3 Policy Reform and Mathematics ……………………………………4
Statement of Purpose ………………………………………………....…9 Research Questions ……………………………………………….…9
Definition of Terms …………………………………………………….10 Chapter 2: Review of the Literature ………………………………………. 13
Organization of the Review of the Literature ………………………17 Overview of Studies ……………………………………………………18 Nature of the Sample ………………………………………………….. 23
Gender ……………………………………………………………...23 EBD Status ………………………………………………………… 23 Demographic Data ………………………………………………… 24 Age, Grade Level, and Setting …………………………………….. 25 Summary: Nature of the Sample …………………………………...25
Instructional Content and Focus ………………………………………..26 Instructional Content ………………………………………………. 27 Instructional Focus ………………………………………………… 28
Procedural knowledge …………………………………………. 29 Conceptual knowledge ………………………………………… 29 Procedural and conceptual knowledge – combined ……………29 Behavior management approaches…………………………….. 30
Summary: Instructional Content and Focus ……………………….. 30 Instructional Activities ………………………………………………… 31
Type of Intervention ………………………………………………. 31 Cognitive ………………………………………………………. 31 Behavioral ……………………………………………………...33 Alternative delivery systems …………………………………... 35
Method of Delivery ………………………………………………... 39 Teacher-based interventions ……………………………………39 Team-teaching ………………………………………………… 40 Student-based interventions …………………………………… 40
Materials ……………………………………………………………41 Manipulatives …………………………………………………. 41 Technology ……………………………………………………. 41 Prompt cards/worksheets ………………………………………42
Summary: Instructional Activities…………………………………. 43 Summary ………………………………………………………………. 47 Conclusion …………………………………………………………….. 48
Area, Perimeter, and Typical Student Learning …………………… 49 Secondary Mathematics Interventions
iv
and Youth with Learning Disabilities…………………………...50 Self-monitoring academic performance and behavior …………...51 Representation: Cue cards and manipulatives ………………… ...51 Contextualized instruction ……………………………………….53
Chapter 3: Methodology …………………………………………………..... 55 Participants ………………………………………………………......55 Pretest ………………………………………………………………..58 Participant Eligibility and Selection ………………………………....58 Informed Consent …………………………………………………....59 Human Subjects Review ……………………………………………..60 Instructor and Setting ………………………………………………...60
Instructional Materials……………………………………………………61 Manipulative materials ....………………………………………...61 Cue cards………………………………………………………… 61 Instructional unit and lesson plans ……………………………….61
Independent Variable…………………………………………………63 Contextualized instruction ...……………………………………..63 Procedural knowledge ……………………………………………64 Conceptual knowledge …………………………………………...64 Self-monitoring …………………………………………………..65
Instructional Procedures ……………………………………………...66 Behavioral Protocol ……………………………………………....67
Dependent Variables and Measurement Procedures ……………………..68 Probes ……………………………………………………………….. 68
Domain probes ………………………………………………...…69 Objective probes…………………………………………………..69 Transfer and maintenance ………………………………………..70
Social Validity Measure ……………………………………………...71 Experimental Design and Study Procedures ………………………....72
Baseline …………………………………………………………..75 Intervention ……………………………………………………....76 Adaptation to intervention during study ………………………....78
Interrater Reliability and Fidelity of Treatment .…………………….79 Interrater reliability ……………………………………………....79 Fidelity of treatment ……………………………………………...79
Data Analysis Procedures ………………………………………….....80 Chapter 4: Results …………………………………………………………….82
Participant Behavior during Instruction ………………………………….83 Carlos ……………………………………………………………….. 83 Grace ………………………………………………………………....84 Steven ………………………………………………………………..85 Riley ………………………………………………………………....85
Results on Academic Outcomes ………………………………………....86 Research Question 1 …………………………………………………87
Carlos ………………………………………………………………90 Grace ……………………………………………………………….90
v
Steven ……………………………………………………………...90 Riley ……………………………………………………………….90
Research Question 2 …………………………………………………95 Research Question 3 …………………………………………………95 Research Question 4 …………………………………………………96
Results on Behavior Outcomes ………………………………………….98 Self-Monitoring ……………………………………………………...98 Social Validity …………………………………………………….....98
Chapter 5: Discussion………………………………………………………102 Summary of the Study Results Relative
to Current Research Literature ……………………………………...102 Emphasis on non-computational math skills and concepts ……..104 Contextualized instruction ………………………………………105 Self-monitoring behavior and academic performance …………. 105 Use of manipulative materials …………………………………. 106 Use of cue cards …………………………………………………106 Explicit teaching model and constructivist-based activities …….106
Interpretation of Findings Relative to Research Questions ……………...107 Research Question 1 …………………………………………………108 Research Question 2 …………………………………………………110 Research Question 3……………………………………………….....112 Research Question 4 …………………………………………………114 Summary …………………………………………………………......115
Limitations of the Current Study ………………………………………..116 Recommendations for Future Research ………………………………….120 Recommendations for Practice…………………………………………...123 Conclusion ……………………………………………………………….124
Appendix A: NCTM Standards, State of Maryland VSC, and Montgomery County Curriculum Indicators for Grades 6-8 Mathematics..126 Appendix B: Teacher Consent Form ………………………………………..128 Appendix C: Parent Permission Form ………………………………………130 Appendix D: Letter to Parents and Students ……………………………...…132 Appendix E: Student Assent Form …………………………………………..133 Appendix F: Cue Card ……………………………………………………….134 Appendix G: Daily Lesson Procedures and Unit Objectives ………………..136 Appendix H: Sample Lesson Plan …………………………………………...138 Appendix I: Self-Monitoring Checklist ……………………………………..143 Appendix J: Behavior Protocol ……………………………………………..144 Appendix K: Domain Probe ………………………………………………...145 Appendix L: Objective Probe ………………………………………………..150 Appendix M: Pilot Interview ………………………………………………...152 Appendix N: Transfer and Maintenance Probe ……………………………..154 Appendix O: Social Validity Measure ……………………………………...156 Appendix P: Booster Session Sample Problems ……………………………158 Appendix Q: Fidelity of Treatment Checklist ………………………………163 References …………………………………………………………………....164
vi
LIST OF TABLES
1. Mathematics Interventions for Secondary Students with EBD 20 2. Mathematics Interventions by Type, Focus, and Materials Used 45
3. Demographic Characteristics of Participants 57
4. Participant Responses on Social Validity Measure 100
vii
LIST OF FIGURES
1. Study Procedures and Timeline 74
2. Percentage of Accurate Responses on Area and Perimeter
Domain Probes: Carlos and Grace 88
3. Percentage of Accurate Responses on Area and Perimeter
Domain Probes: Steven and Riley 89
4. Percentage of Accurate Responses on Area and Perimeter
Objective Probes: Carlos and Grace 92
5. Percentage of Accurate Responses on Area and Perimeter
Objective Probes: Steven and Riley 93
1
Chapter 1: Introduction
Students with emotional and behavioral disorders (EBD) experience deficits in
mathematics achievement when compared to non-disabled peers (Wagner, Kutash,
Duchnowski, Epstein, & Sumi, 2005; Trout, Nordness, Pierce, & Epstein, 2003). In
addition, secondary (middle and high school) students with EBD are more likely than
their peers with other disabilities to receive a poor grade, be retained in a grade, and drop
out of school before graduation (Wagner & Cameto, 2004). Furthermore, in a survey of
secondary general educators and special educators, respondents reported teaching mostly
basic arithmetic skills, rather than non-computational concepts, to secondary students
with EBD and learning disabilities (Maccini & Gagnon, 2002). These points suggest that
secondary students with EBD may have limited access to, or limited success with, non-
computational mathematics.
Non-computational mathematics involves complex skills and concepts related to
topics such as geometry and algebra. Recent reforms in mathematics (i.e., National
Council of Teachers of Mathematics [NCTM] Principles and Standards) and changes in
general and special education regulations (The No Child Left Behind Act of 2001
[NCLB], and the Individuals with Disabilities Education Improvement Act of 2004
[IDEIA]) have illuminated the need for effective mathematics instruction for students
with EBD in the primary, intermediate, and secondary grades. Research on measurement
and geometry demonstrates that many students, both in general education and special
education, have difficulty grasping the concepts of area and perimeter (Barrett &
Clements, 2003; Battista, 1982, 2003; Walter, 1970).
2
Little attention has been paid to developing and implementing effective
mathematics interventions for secondary students with EBD. In a review of the literature
on academic instruction interventions for students with EBD of all ages, Lane (2004)
found that empirical research on effective mathematics interventions at the secondary
level is absent from the research base. In particular, there currently are no published
studies on effective interventions for geometry instruction for secondary students with
EBD. In this chapter, mathematics proficiency will be defined, followed by discussions
of the status of math achievement in the United States and policy reform in mathematics
instruction. I will then discuss the status of mathematics instruction for students with
EBD and the importance of proficiency in measurement and geometry for secondary
students. This chapter concludes with a statement of purpose, the guiding research
questions, and definitions of terminology used.
Developing Mathematics Proficiency
Mathematics proficiency involves success with interwoven strands of
competence, knowledge, and understanding (National Research Council, 2001).
According to the National Research Council, five strands of proficiency include:
(a) conceptual understanding; (b) procedural fluency; (c) strategic competence – the
ability to formulate, represent, and solve problems; (d) adaptive reasoning – the capacity
for logical thought, reflection, explanation, and justification; and (e) productive
disposition – the ability to see mathematics as sensible, useful, and worthwhile. These
strands are similar to the NCTM’s (2000) Process Standards, which refer to the processes
by which students connect, represent, problem solve, and communicate mathematical
knowledge. Both the National Research Council and NCTM contend that mathematics
3
proficiency is dependent on instruction that builds on students’ ability to incorporate
these components of mathematical knowledge. Evidence suggests that many students in
the United States at all grade levels, and particularly, secondary students with EBD, fail
to demonstrate mathematics proficiency (Blackorby, Chorost, Garza, & Guzman, 2003,
2005; Braswell, Dion, Daane, & Jin, 2005; Lemke, et al., 2004; National Center for
Education Statistics, n.d).
Status of Mathematics Proficiency in the United States
Mathematics performance of children in the United States, and internationally,
has been tracked for ten years by the Trends in International Mathematics and Science
Study (TIMSS). In 2003, overall student performance at the eighth grade level was
reported for 48 countries. U.S. eighth-graders outperformed their peers in 25 countries in
mathematics, but lagged behind seven countries, including Japan, Estonia, and Hungary
(National Center for Education Statistics, n.d.). Similar results were evident in 2003
Program for International Student Assessment (PISA) testing (Lemke, et al., 2004).
Unlike TIMSS, which focuses on curricular understanding, PISA targets problem-solving
skills by assessing student ability to apply mathematics knowledge to real-life contexts.
Students in the United States scored below the mean in mathematics literacy, as well as in
each of the content area subscales (space and shape, change and relationships, quantity,
and uncertainty).
Nationally, eighth graders continue to exhibit poor results. The 2003 National
Assessment of Educational Progress (NAEP) results indicated that only 29% of eighth
graders performed at or above the proficient level in math (Braswell, Dion, Daane, & Jin,
2005). Two longitudinal research studies of school-aged children funded by the U.S.
4
Department of Education, Special Education Elementary Longitudinal Study (SEELS)
and National Longitudinal Transition Study-2 (NLTS-2), documented poor math
achievement among children and youth with EBD. The SEELS data indicate that
elementary and middle school students with EBD are more than one grade level behind
their non-disabled peers in mathematics (Blackorby, Chorost, Garza, & Guzman, 2005).
The NLTS-2 data reflect that the gap increases to nearly three grade levels behind for
secondary students with EBD (Blackorby, Chorost, Garza, & Guzman, 2003).
Policy Reform and Mathematics
Academic achievement, including mathematics proficiency, has been a focus of
education policy makers over the last decade. In 1989, NCTM released a seminal
document, Curriculum and Evaluation Standards for School Mathematics, which was the
first document of its kind to have a strong effect on school curriculum. The NCTM
updated the 1989 Curriculum and Evaluation Standards with its release of Principles and
Standards for School Mathematics (2000). The Individuals with Disabilities Education
Act (IDEA) was amended in 1997 to include the provision that students with disabilities
have access to, and make gains in, the general education curriculum. In 2004, IDEA was
reauthorized, with specific language to align the law with NCLB. The reform efforts
supported by the NCTM Standards, alignment of IDEIA to NCLB, and an increased
focus on high standards and accountability for all students under the NCLB (2001) have
put increased pressure on teachers and administrators to deliver high quality academic
instruction to all students, including students with disabilities such as EBD.
Originally developed in 1989, the NCTM Curriculum and Evaluation Standards
for School Mathematics were updated and published in 2000 as Principles and Standards
5
for School Mathematics, to “outline the essential components to a high quality school
mathematics program” (p. 1). The NCTM Standards included content and process
components across grade levels, including problem solving, number operations, and math
concepts such as communicating and representing mathematical ideas, and making
connections between mathematical concepts. The Standards were refined to ensure that
students have a conceptual understanding, rather than strict memorization of algorithms
and rules. Thus, the Standards are based on a constructivist approach to learning, where
students will “construct” their own learning, building meaning from their own
background knowledge and use real-life activities to search for further understanding
(Goldsmith & Mark, 1999; Maccini & Gagnon, 2002; Schloss, Smith, & Schloss, 2001;
Stiff, 2001; Ward, 2001).
Evidence suggests that the constructivist nature of the NCTM Standards may not
be adequate for students with disabilities, who benefit from other effective teaching
strategies such as direct instruction (Baker, Gersten, & Lee, 2002; Landrum, Tankersley,
& Kauffman, 2003; Maccini & Gagnon, 2000). Given the importance of the NCTM
Standards, as well as current knowledge on effective teaching methods for students with
disabilities, a more balanced approach may be necessary (Fuchs & Fuchs, 2001; Hudson
& Miller, 2006). A balanced approach to secondary mathematics instruction for students
with disabilities includes opportunities for students to develop deep understandings of
concepts through embedded meaningful contexts associated with constructivism, while
efficiently processing material through a teacher-directed approach such as direct
instruction (Smith & Geller, 2004). Hudson and Miller (2006) suggested promoting
conceptual understanding through explicit, or direct, instruction by providing a rationale
6
or relevance for the objective, developing a lesson based on a mathematics daily living
skill, functional task, or consumer skill, and incorporating values and cultures of students
in the classroom into math examples and problem-solving activities. When implementing
these practices at the secondary level, special educators must not only use effective
instructional procedures, but must also be familiar with the content they are teaching
(Maccini & Gagnon, 2006).
Special educators may not be properly prepared to teach mathematics at levels
more sophisticated than basic skills instruction. At least one study found that special
educators were not familiar with the NCTM Standards, and may not have appropriate
materials to implement activities supported by the Standards (Maccini & Gagnon, 2002).
Jones and Southern (2003) noted, “Many teachers, particularly in elementary grades and
special education, lack sophisticated knowledge in the area of mathematics” (p. 10).
Students with disabilities often have difficulty with basic computation, and special
educators tend to use drill and practice activities in an effort to improve students’ ability
to conduct accurate computations (Gersten & Chard, 1999). Parmar, Cawley, and Frazita
(1996) found that students with learning disabilities (LD) and students with EBD have
difficulty with word problems with varying structures, including those that involve
reasoning or problems with embedded contexts, where students must look beyond “cue”
words to understand the relationship between the words and the contexts in which they
are used. Parmar and colleagues suggest that teachers of students with LD and students
with EBD fail to address student learning needs and focus heavily on memorization of
“cue” words and practicing basic algorithms, rather than teaching problem-solving skills
and strategies, such as those needed to solve contextualized problems. Although special
7
educators may not be equipped to teach non-computational mathematics, standards
reforms are pushing toward greater accountability in mathematics instruction.
Empirically-supported instructional strategies are necessary to better prepare secondary
level mathematics special educators to teach non-computational mathematics.
The No Child Left Behind Act (2001) includes provisions mandating high teacher
quality and improved mathematics achievement across all student groups, including
students with disabilities. The NCLB lawmakers stressed the importance of teachers well-
versed in a content area; this provision includes teachers of special education, who
historically “are prepared as generalists and do not have great expertise in either the
content or teaching of mathematics” (Jones & Southern, 2003, p. 10). In addition, the law
and accompanying regulations establish the same high academic standards for all
students, regardless of disability status. Consequently, all students are included in high-
stakes testing, despite any learning or behavioral issues they might have. The majority of
students with disabilities may be eligible for testing accommodations for these tests
(Cortiella, 2005). However, even with testing accommodations, students with disabilities
are often ill-equipped to perform well on these tests, and consistently perform lower than
their peers without disabilities on standardized assessments (Stodden, Galloway, &
Stodden, 2003). Improving instruction for students with EBD is a critical step toward
improving their test scores.
Mathematics instruction in special education classrooms “continues to focus on
computation rather than mathematical understanding” (Gersten & Chard, 1999). To that
end, students with disabilities, including students with EBD, do not receive the same
level of academic instruction as their non-disabled counterparts. In a longitudinal study
8
comparing the academic progress of students with learning disabilities and students with
EBD, one group of researchers found that despite five years of full-time special education
services, students with EBD did not significantly improve math achievement scores
(Anderson, Kutash, & Duchnowski ,2001). Nelson, Benner, Lane, and Smith (2004)
found similar results in a study on academic achievement of K-12 students with EBD.
They found that students with EBD experience an increase in mathematics deficits over
their school careers. These findings suggest that current instructional practices for these
youth may not be effective. Similarly, students with EBD have been virtually neglected
in academic intervention research, especially in mathematics (Gunter & Denny, 1998;
Lane, 2004; Mooney, Epstein, Reid, & Nelson, 2003; Mulcahy & Gagnon, 2007).
Specifically, studies of students with EBD that investigate secondary level math content
areas, such as geometry, are absent from the current literature base.
Mastering concepts related to measurement and geometry is critical for secondary
students with EBD. NCTM (2000) promotes excellence in math for all students, IDEIA
(2004) requires these students be afforded access to the general education curriculum,
and NCLB (2001) requires high academic standards for all students. In addition,
geometry is a course typically required for high school graduation, and measurement and
geometry skills are necessary for many daily activities and professions. Situating learning
experiences in contextualized, or authentic, problems can assist secondary students with
EBD in understanding non-computational concepts related to measurement and geometry
(Goldman, Hasselbring, & the Cognition and Technology Group at Vanderbilt, 1997).
Developing and researching the effectiveness of contextualized instruction targeting
measurement and geometry for secondary students with EBD will be a start to a research
9
base that integrates components of the NCTM Principles and Standards and amendments
to IDEIA and NCLB that call for better mathematics outcomes for our nation’s youth,
including those with EBD.
Statement of Purpose
The current study was designed to expand the existing research literature on
effective mathematics interventions for students with EBD in secondary settings. The
study, which was conducted with secondary students with EBD, examined the effects of a
contextualized instructional package on objectives related to area and perimeter. The
instructional design used in the study was created from previous research on effective
instruction for students with EBD, as well as empirically validated instructional
components for students with LD and typically-developing students.
Research Questions
1. Does a contextualized instructional package to teach the geometric concepts of
area and perimeter result in increases in the mathematics accuracy of secondary
students with emotional and behavioral disorders (EBD)?
2. Do secondary students with EBD maintain performance on geometry-related tasks
mastered through the use of a contextualized instructional package over time?
3. Do secondary students with EBD transfer performance on geometry-related tasks
learned through the use of a contextualized instructional package to mathematics
problems with similar contexts?
4. Do secondary students with EBD transfer performance on geometry-related tasks
mastered through the use of a contextualized instructional package to more
complex area and perimeter problems?
10
Definition of Terms
The terms used in this dissertation are defined as follows: Alternative delivery systems are means for delivering instruction through non-traditional
means, including peer-mediated instruction, contextualized instruction, and technology-
based instruction.
Anchored instruction is described as situating learning in problems that are authentic and
meaningful to students to motivate and enhance understanding.
Behavioral interventions are means for delivering instruction through a focus on student
behaviors, including token reinforcements, graduated instructional sequence, and
instructional pauses.
Cognitive interventions are means for delivering instruction through a focus on student
thinking, including self-monitoring academic performance, using mnemonic strategies,
and self- and group-evaluations.
Computation is the skill involved in using algorithms to solve basic mathematic
operations.
Conceptual knowledge refers to the idea that logical relationships are constructed
internally and exist in the mind as a part of a network of ideas.
Contextualized instruction is the practice of linking new material to a student’s existing
knowledge base through examples, scenarios, questions, and practice that is meaningful
to the student.
Cue cards are visual prompts that provide a reminder to students of the process used to
complete a task or activity.
11
Curriculum based measurement (CBM) is defined as a systematic set of measurement
procedures that is taken from the curriculum and attempts to quantify student.
performance by counting items correct. CBM is effective for monitoring performance of
students with disabilities.
Effect size is the measure of the magnitude of a treatment effect.
Emotional and behavioral disorders (EBD) is the term used to describe a group of
heterogeneous disorders that are demonstrated by deviant behaviors that adversely affect
student achievement. The Federal Government refers to the disorders as “emotional
disturbance,” defined as: "a condition exhibiting one or more of the following
characteristics over a long period of time and to a marked degree, which adversely affects
educational performance: --An inability to learn which cannot be explained by
intellectual, sensory, or health factors. --An inability to build or maintain satisfactory
interpersonal relationships with peers and teachers. --Inappropriate types of behavior or
feelings under normal circumstances. --A general pervasive mood of unhappiness or
depression. --A tendency to develop physical symptoms or fears associated with personal
or school problems."
Enhanced anchored instruction is described as using technology to situate learning in
problems that are authentic and meaningful to students to motivate and enhance
understanding.
Objectives refer to the targeted concepts and skills, which were drawn from the State of
Maryland Voluntary State Curriculum, the NCTM Standards, and the district curriculum,
and adapted for use in the investigator-developed instructional unit.
12
Peer assisted learning strategies (PALS) is a teaching strategy based on classwide peer
tutoring, where students reciprocate as tutors and tutees to practice newly learned skills.
PALS is intended to be supplemental to the math curriculum.
Problem solving is the act of applying previously learned information to new and varied
situations.
Procedural knowledge is the knowledge of the rules and the procedures that one uses in
carrying out routine mathematical tasks and also the symbolism that is used to represent
mathematics.
Procedural strategy is a set of sequential steps that lead to solution of a mathematics
problem.
Secondary students are students in middle school and high school, or who are of the
middle school to high school age range (11-21).
Self-monitoring is a student’s self-assessment and recording of behavior.
Token economy is a system in which an individual earns tokens for targeted behaviors.
13
Chapter 2: Review of the Literature
In the age of accountability, standards for curriculum and achievement, and high
stakes testing, effective instructional interventions are necessary to promote academic
achievement, and in particular mathematics achievement, for students with disabilities.
Internationally, despite gains since 1995, the U.S. continues to lag behind its peers in the
math performance of its fourth and eighth graders (Mullis, Martin, Gonzalez, &
Chrostowski, 2004). In particular, results from the PISA assessment indicated that the
U.S. trails other industrialized nations in non-computational math skills and concepts,
including problem-solving and mathematics literacy, or the “ability to apply a range of
knowledge and skills to a variety of problems with real-life contexts” (Lemke, et al.,
2004, p. 5). Results from the 2003 TIMSS study indicate that in the area of geometry,
eighth graders in the U.S. did not perform significantly higher than the international
average, and that geometry is an area of relative weakness for the United States (Mullis,
et al., 2004). Similarly, 2003 National Assessment of Educational Progress (NAEP)
results indicate that 71% of U.S. eighth graders performed below the “Proficient” level in
mathematics (Braswell, et al., 2005). Only 6% of sampled students with disabilities
performed at or above the proficient level in the same year (National Center for
Education Statistics, 2004).
National school-based reform efforts have come on the heels of the dissemination
of information about the math performance of U.S. students. Those reforms include the
2000 release of NCTM’s Principles and Standards for School Mathematics, which
emphasized equity for all students through high expectations for mathematics
performance, despite personal backgrounds and characteristics. In the area of geometry,
14
authors of the NCTM Principles and Standards for School Mathematics stressed the need
for geometry instruction across all grade levels, rather than just at the high school level.
NCTM suggests that learning geometry provides students with tools to “interpret and
reflect on our physical environment and can serve as tools for the study of other topics in
mathematics and science” (NCTM, 2000, ¶ 1). The No Child Left Behind Act of 2001
also emphasizes high expectations for all students, with rigorous performance standards
to be met by specific subgroups, including students with disabilities. Finally, the IDEA
(1997) amendments required that students with disabilities have access to the general
education curriculum, which includes non-computational mathematics content, to the
same extent as their non-disabled peers.
State-level reporting of test scores as a requirement of NCLB indicated that
students with disabilities continue to lag behind their peers in mathematics performance.
Results from the 2002-2003 NCLB state-level reporting of Adequate Yearly Progress
(AYP) demonstrated that students with disabilities disproportionately fail to make AYP
(Thurlow, Moen, & Wiley, 2005). Researchers have also found that students with EBD
lag significantly behind their peers in math performance (Nelson, et al., 2004; Reid, et al.,
2004). Nelson and his colleagues (2004) found that 83% of the adolescents with EBD in
their sample scored below the norm group mean on the Broad Math cluster of the
Woodcock-Johnson III achievement test.
Students with EBD represent approximately 8% of all students with school-
identified disabilities, about 450,000 children and youth (U.S. Department of Education,
2005; Wagner, et al., 2005). By definition, students identified with EBD under the IDEIA
must exhibit academic deficits. According to the Individuals with Disabilities Education
15
Act of 1997 (IDEA), “the term means a condition exhibiting …characteristics over a long
period of time and to a marked degree that adversely affects a child's educational
performance” (300.7(c)(4)). Students with EBD also exhibit a variety of behavioral
characteristics, such as aggression and depression. Despite the heterogeneity of the group,
many similarities exist among children and youth with EBD (Wagner, et al, 2005). Data
from SEELS and NLTS-2 have demonstrated that students identified with EBD are likely
to be male, African-American, and have low socioeconomic status (Wagner & Cameto,
2004; Wagner, et al., 2005). These students characteristically have high rates of
behavioral incidents in school, have poor academic skills and strategies, and often
experience school failure (Wagner & Cameto, 2004). Wagner and colleagues (2005)
reported that students with EBD tend to experience a lengthy gap between initial
identification of problem behaviors and onset of special education service delivery.
Compared to secondary students with disabilities as a whole, secondary students
with EBD are more likely to receive poor grades and less likely experience academic
success in general education classrooms (Wagner & Cameto, 2004). In addition,
postschool outcomes for students with EBD are bleak. Nearly half of students with EBD
are likely to drop out before graduating (Wagner, Newman, Cameto, & Levine, 2005). As
a group, students with EBD are more likely to be unemployed as young adults, and more
likely to be arrested and incarcerated than their peers (Greenbaum & Dedrick, 1996;
Wagner, 1995; Wagner & Cameto, 2004). In an increasingly technological world,
students with EBD need to be proficient in non-computational mathematics skills,
including measurement and geometry, in order to graduate from high school and be
successful in life and work.

16
As a group, students with EBD experience high rates of poor mathematics
achievement. A methodological review of research from 1961 to 2000 (Trout, Nordness,
Pierce, & Epstein, 2003) found that 92% of the studies reported students with EBD had
significant academic deficits in mathematics, similar to those of students with LD and
students with Attention Deficit Hyperactivity Disorder. Despite common knowledge that
students with EBD exhibit math deficits, little research has been conducted to find
effective academic strategies for this population. Several recent reviews (Gunter &
Denny, 1998; Lane, 2004; Trout, et al., 2003) have documented the paucity of research
on academic strategies for children and youth with EBD. A 2003 methodological review
by Mooney and colleagues examined academic intervention research of students with
EBD in elementary, intermediate, and secondary settings between 1975 and 2002. The
authors found that, although math interventions consist of 31% of the academic
intervention research conducted on students with EBD, the studies lacked sophistication
and did not examine student acquisition of non-computational concepts and skills, such
as problem-solving. The majority of the studies (95%) focused on basic math skills,
including computation and basic operations. Moreover, between 1996 and 2002, no
quantitative mathematics intervention studies with students with EBD were published.
Wehby, Lane, and Falk (2003) offered four hypotheses to explain the lack of
focus on academic interventions for students with EBD. Their hypotheses included:
(a) student behavior problems prevent teachers from implementing high-quality
instruction; (b) student behaviors influence and shape inadequate teaching behaviors;
(c) EBD teacher training programs fail to provide teacher preparation in academic
instruction; and (d) limited research in academic instruction is available to guide future
17
research and teacher preparation. In addition to these factors, other researchers have
found that when interventions are supported by research, teachers may not maintain
intervention integrity (Landrum, et al., 2003).The lack of attention to academic
instruction has contributed to poor outcomes for students with EBD, and underscores the
need to identify empirically validated strategies for this population (Wehby, et al., 2003).
While teacher quality is certainly a consideration when investigating reasons for poor
outcomes for students with EBD, the paucity of available research-based mathematics
interventions for students with EBD may interfere with special educators’ ability to
effectively deliver non-computational mathematics instruction to this population. Without
empirically-supported practices to guide mathematics instruction for teachers of
secondary students with EBD, mathematics proficiency may continue to be out of the
reach for this population.
Organization of the Review of the Literature
In this chapter I present a comprehensive review of the current research involving
math interventions for secondary students with EBD. This review serves two purposes:
a) to determine the current status of and need for effective mathematics interventions for
students with EBD in middle and high school; and b) to establish sound procedures for
the current study. A systematic and exhaustive review of the literature was conducted to
identify research studies published between 1990 and August 2005 involving
mathematics interventions for secondary students with EBD. Originally published in
1989 as Curriculum and Evaluation Standards for School Mathematics and revised in
2000, the NCTM Principles and Standards are the cornerstone for mathematics school
curricula and content. I chose to review studies that were published beginning in 1990, to
18
reflect current mathematics education standards and thinking. Due to the scarcity of
research on this topic with this population, the search was expanded to include studies
that included at least one secondary student with EBD in the sample. Studies meeting the
following criteria were included in this review: (a) student(s) identified as having EBD
were in the sample; (b) the dependent variables included measures of mathematics
performance, either computation or problem-solving or both; (c) the students in the
sample were in secondary (middle or high school) settings; (d) the study was published
between 1990 and August 2005; (e) the researchers employed a single-subject or group
design; and (f) the research was conducted in a classroom setting. This review of
literature includes findings from six group design studies and six single-subject design
studies, for a total of 12 studies (Bottge, 1999; Bottge, Heinrichs, Chan, & Serlin, 2001;
Bottge, Heinrichs, Mehta & Hung, 2002; Bottge, Heinrichs, Chan, Mehta, & Watson,
2003; Butler, Miller, Crehan, Babbitt, & Pierce, 2003; Cade & Gunter, 2002; Calhoon &
Fuchs, 2003; Carr & Punzo, 1993; Franca, Kerr, Reitz, & Lambert, 1990; Hawkins,
Brady, Hamilton, Williams, & Taylor, 1994; McQuillan, DuPaul, Shapiro, & Cole, 1996;
Swain & McLaughlin, 1998).
Overview of Studies
A total of 12 studies with data on 456 participants met the criteria for inclusion.
Out of the 456 participants in all of the reviewed studies, only 34 (8%) students with
EBD participated in the studies. Seven of the studies (Bottge, 1999; Bottge, et al., 2001;
Bottge, et al., 2002; Bottge, et al., 2003; Butler, et al., 2003; Calhoon & Fuchs, 2003;
Hawkins, et al., 1994) also included students without disabilities and students with
disabilities other than EBD. Based on reported data, the combined total number of
19
students with EBD in those studies was 13 (3% of the total sample; 38% of students with
EBD). One study (Butler, et al., 2003) did not identify the number of students with EBD,
but indicated that “a few students had attention deficit disorder, emotional disabilities, or
mental retardation” (p. 110). All of the five studies (Cade & Gunter, 2002; Carr & Punzo,
1993; Franca, et al., 1990; McQuillan, et al., 1996; Swain & McLaughlin, 1998) that
included solely students with EBD were single-subject designs, and their samples totaled
21 students (5% of the total sample; 62% of students with EBD).
The following review of the literature is divided into three major sections: (a) the
nature of sample; (b) instructional content and focus; and (c) instructional activities (see
Table 1).
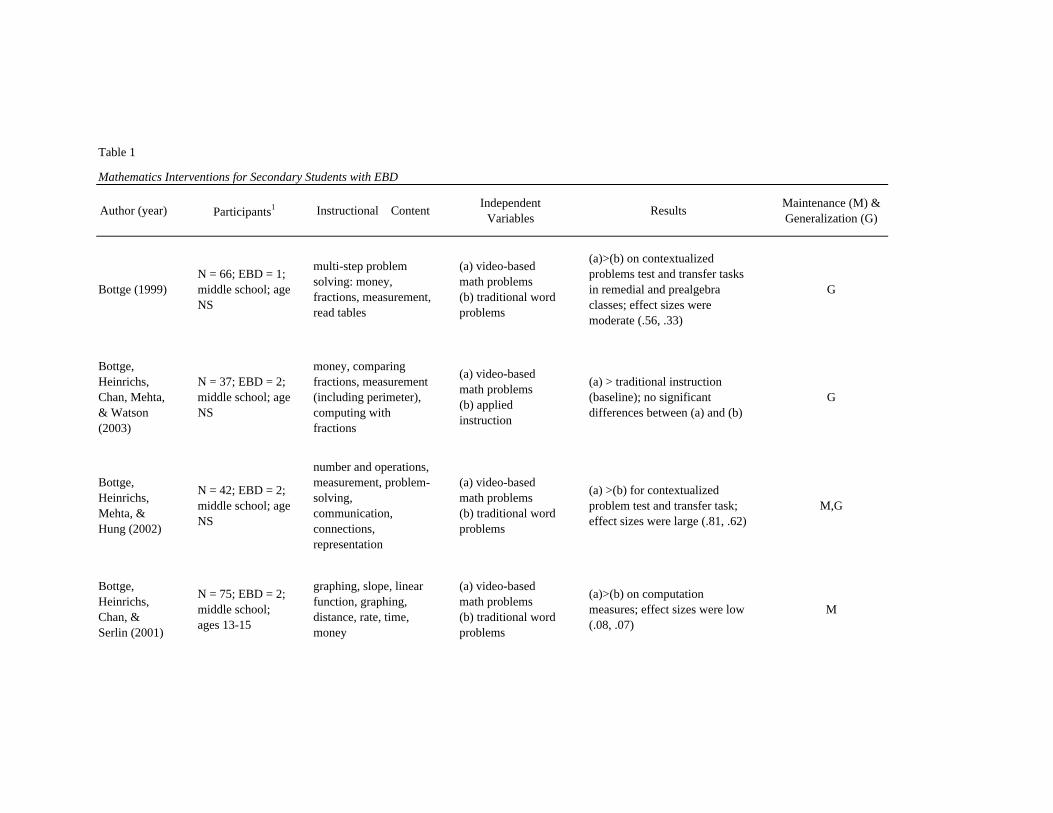
Table 1
Author (year) Participants1 Instructional Content Independent Variables Results Maintenance (M) &
Generalization (G)
Bottge (1999)N = 66; EBD = 1; middle school; age NS
multi-step problem solving: money, fractions, measurement, read tables
(a) video-based math problems (b) traditional word problems
(a)>(b) on contextualized problems test and transfer tasks in remedial and prealgebra classes; effect sizes were moderate (.56, .33)
G
Bottge, Heinrichs, Chan, Mehta, & Watson (2003)
N = 37; EBD = 2; middle school; age NS
money, comparing fractions, measurement (including perimeter), computing with fractions
(a) video-based math problems (b) applied instruction
(a) > traditional instruction (baseline); no significant differences between (a) and (b)
G
Bottge, Heinrichs, Mehta, & Hung (2002)
N = 42; EBD = 2; middle school; age NS
number and operations, measurement, problem-solving, communication, connections, representation
(a) video-based math problems (b) traditional word problems
(a) >(b) for contextualized problem test and transfer task; effect sizes were large (.81, .62)
M,G
Bottge, Heinrichs, Chan, & Serlin (2001)
N = 75; EBD = 2; middle school; ages 13-15
graphing, slope, linear function, graphing, distance, rate, time, money
(a) video-based math problems (b) traditional word problems
(a)>(b) on computation measures; effect sizes were low (.08, .07)
M
Mathematics Interventions for Secondary Students with EBD
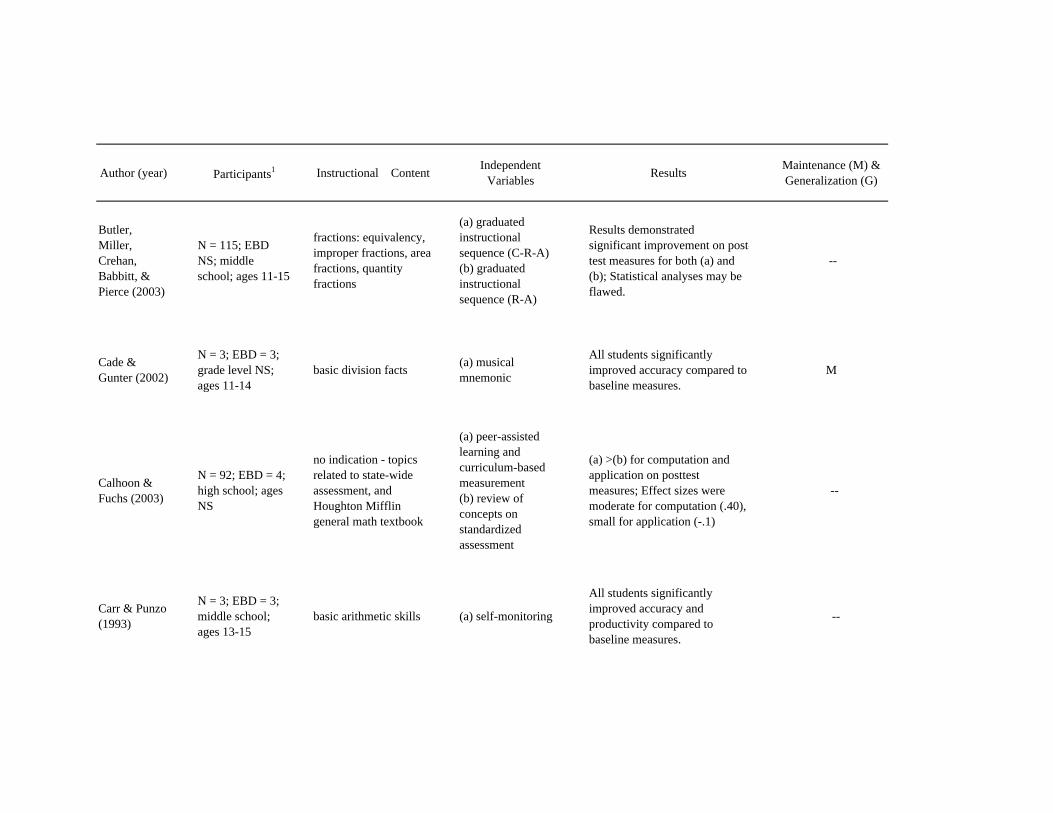
Author (year) Participants1 Instructional Content Independent Variables Results Maintenance (M) &
Generalization (G)
Butler, Miller, Crehan, Babbitt, & Pierce (2003)
N = 115; EBD NS; middle school; ages 11-15
fractions: equivalency, improper fractions, area fractions, quantity fractions
(a) graduated instructional sequence (C-R-A) (b) graduated instructional sequence (R-A)
Results demonstrated significant improvement on post-test measures for both (a) and (b); Statistical analyses may be flawed.
--
Cade & Gunter (2002)
N = 3; EBD = 3; grade level NS; ages 11-14
basic division facts (a) musical mnemonic
All students significantly improved accuracy compared to baseline measures.
M
Calhoon & Fuchs (2003)
N = 92; EBD = 4; high school; ages NS
no indication - topics related to state-wide assessment, and Houghton Mifflin general math textbook
(a) peer-assisted learning and curriculum-based measurement (b) review of concepts on standardized assessment
(a) >(b) for computation and application on posttest measures; Effect sizes were moderate for computation (.40), small for application (-.1)
--
Carr & Punzo (1993)
N = 3; EBD = 3; middle school; ages 13-15
basic arithmetic skills (a) self-monitoring
All students significantly improved accuracy and productivity compared to baseline measures.
--
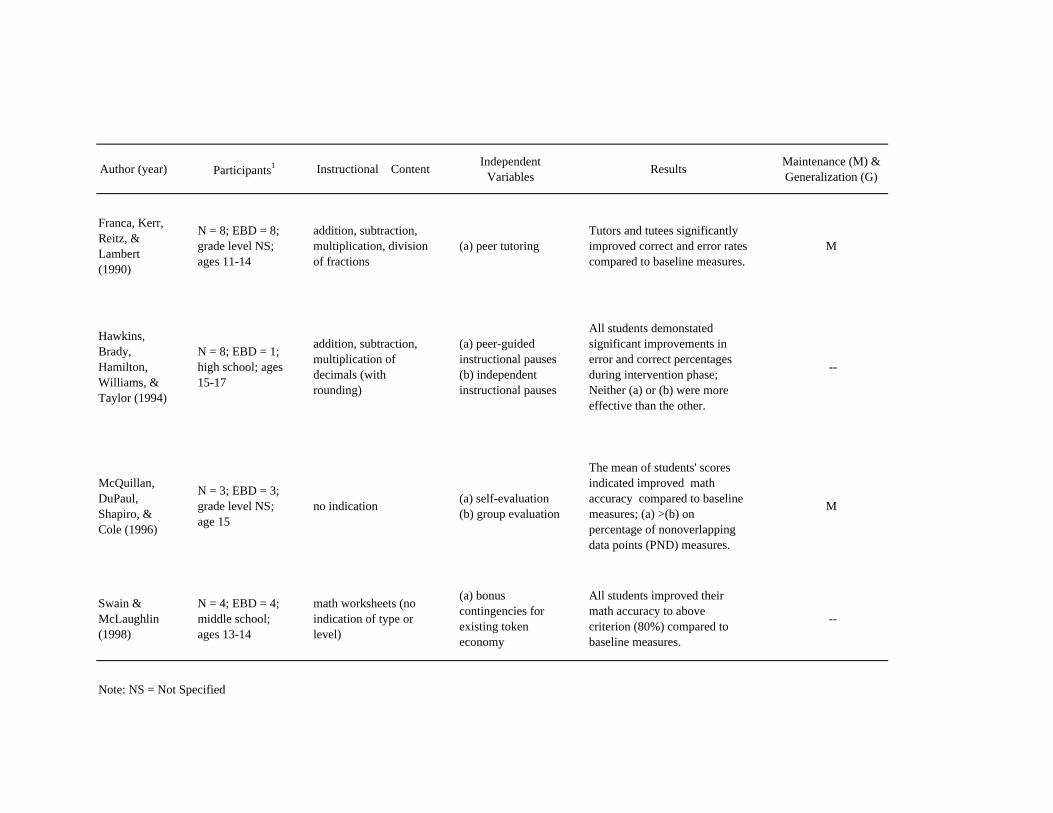
Author (year) Participants1 Instructional Content Independent Variables Results Maintenance (M) &
Generalization (G)
Franca, Kerr, Reitz, & Lambert (1990)
N = 8; EBD = 8; grade level NS; ages 11-14
addition, subtraction, multiplication, division of fractions
(a) peer tutoringTutors and tutees significantly improved correct and error rates compared to baseline measures.
M
Hawkins, Brady, Hamilton, Williams, & Taylor (1994)
N = 8; EBD = 1; high school; ages 15-17
addition, subtraction, multiplication of decimals (with rounding)
(a) peer-guided instructional pauses (b) independent instructional pauses
All students demonstated significant improvements in error and correct percentages during intervention phase; Neither (a) or (b) were more effective than the other.
--
McQuillan, DuPaul, Shapiro, & Cole (1996)
N = 3; EBD = 3; grade level NS; age 15
no indication (a) self-evaluation (b) group evaluation
The mean of students' scores indicated improved math accuracy compared to baseline measures; (a) >(b) on percentage of nonoverlapping data points (PND) measures.
M
Swain & McLaughlin (1998)
N = 4; EBD = 4; middle school; ages 13-14
math worksheets (no indication of type or level)
(a) bonus contingencies for existing token economy
All students improved their math accuracy to above criterion (80%) compared to baseline measures.
--
Note: NS = Not Specified
23
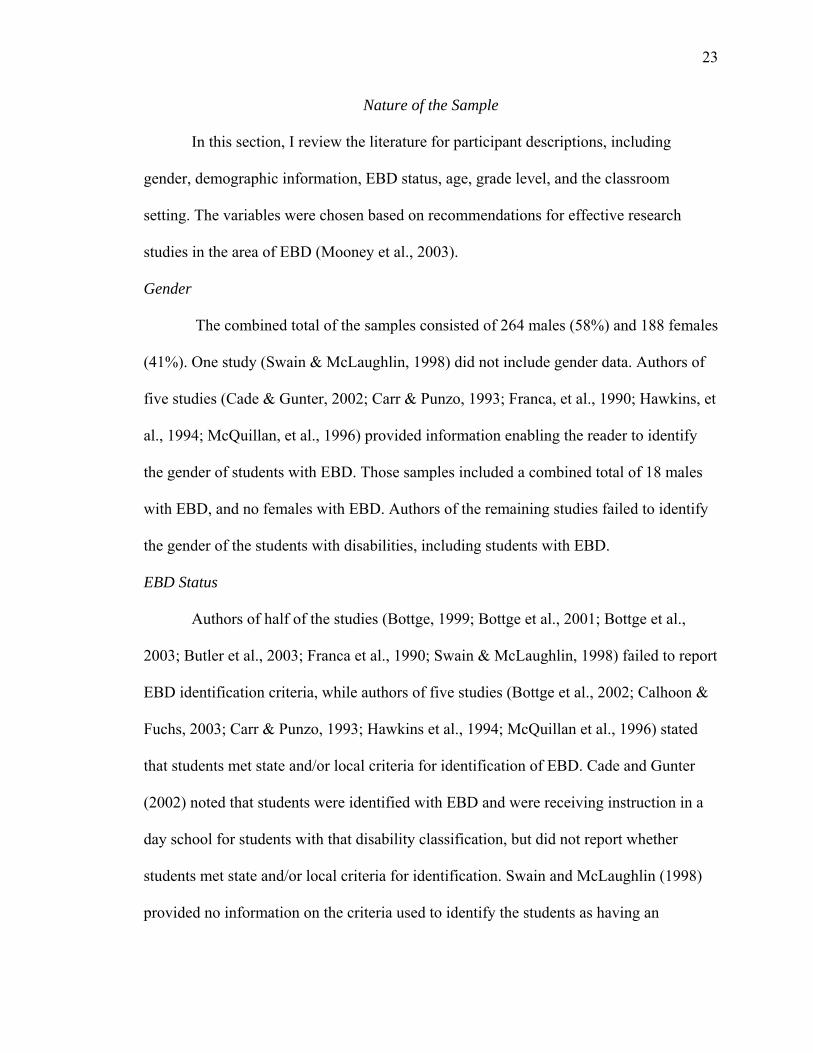
Nature of the Sample
In this section, I review the literature for participant descriptions, including
gender, demographic information, EBD status, age, grade level, and the classroom
setting. The variables were chosen based on recommendations for effective research
studies in the area of EBD (Mooney et al., 2003).
Gender
The combined total of the samples consisted of 264 males (58%) and 188 females
(41%). One study (Swain & McLaughlin, 1998) did not include gender data. Authors of
five studies (Cade & Gunter, 2002; Carr & Punzo, 1993; Franca, et al., 1990; Hawkins, et
al., 1994; McQuillan, et al., 1996) provided information enabling the reader to identify
the gender of students with EBD. Those samples included a combined total of 18 males
with EBD, and no females with EBD. Authors of the remaining studies failed to identify
the gender of the students with disabilities, including students with EBD.
EBD Status
Authors of half of the studies (Bottge, 1999; Bottge et al., 2001; Bottge et al.,
2003; Butler et al., 2003; Franca et al., 1990; Swain & McLaughlin, 1998) failed to report
EBD identification criteria, while authors of five studies (Bottge et al., 2002; Calhoon &
Fuchs, 2003; Carr & Punzo, 1993; Hawkins et al., 1994; McQuillan et al., 1996) stated
that students met state and/or local criteria for identification of EBD. Cade and Gunter
(2002) noted that students were identified with EBD and were receiving instruction in a
day school for students with that disability classification, but did not report whether
students met state and/or local criteria for identification. Swain and McLaughlin (1998)
provided no information on the criteria used to identify the students as having an
24
emotional or behavioral disorder. In two studies (Bottge, 1999; Bottge, et al., 2001), it
was impossible to ascertain whether student(s) with EBD were in the treatment or
comparison groups, and authors of another study (Butler, et al., 2003) did not report the
number of students with EBD in the treatment group; without this information there is no
way to discern whether the treatment was effective for students with EBD. No studies
provided detailed information on the characteristics of participants with EBD, which
limits the reader’s ability to understand with whom the intervention might be effective.
The paucity of students with EBD in the studies demonstrates the critical need for
empirical academic research on this population.
Demographic Data
Authors of six studies identified the race and/or ethnicity of participants. Of those
six studies, five included complete data (Bottge, et al., 2003; Calhoon & Fuchs, 2003;
Carr & Punzo, 1993; Hawkins, et al., 1994; McQuillan, et al., 1996). The combined
number of students in these five studies included 87 Caucasian students, 53 African
American students, 2 Latino American students, and 1 Asian American student. Bottge,
et al., (2002) stated “all but three students were White” (p.188), but the authors provided
no other information about the racial background of those three students. Geographic
location was reported in ten studies (83%) (Bottge, 1999; Bottge, et al., 2001; Bottge, et
al., 2002; Bottge, et al., 2003; Butler, et al., 2003; Cade & Gunter, 2002; Calhoon &
Fuchs, 2003; Carr & Punzo, 1993; Hawkins, et al., 1994; McQuillan, et al., 1996;), with
representation from rural Midwest, southeastern, and southwestern locations of the
United States. Rural (Bottge, 1999; Bottge, et al., 2001; Bottge, et al., 2002; Bottge, et al.,
2003) and urban (Butler, et al., 2003; Calhoon & Fuchs, 2003) areas were also
25
represented among the studies. Socioeconomic status was presented in only one study
(Cade & Gunter), where each of the students was identified as being in a low income
family or being a foster child. Four out of the six group design studies were conducted by
the same lead researcher (ie. Bottge, 1999; Bottge, et al., 2001; Bottge, et al., 2002;
Bottge, et al., 2003). These studies were conducted on similar groups of students (7th to
9th graders in the rural Midwest); therefore, generalization to other populations is limited.
Age, Grade Level, and Setting
The age of students, reported in eight studies (67%), ranged from 11 years to 16
years. Seven studies were conducted in middle school, two studies in high school, and
three studies in non-graded classrooms. The settings ranged from general education
classrooms (n=4) to self-contained separate schools (n=3). Other settings included
remedial math classes (n=3), resource rooms (n=2), and self-contained classrooms (n=3).
Three studies (Bottge, 1999; Bottge et al., 2001; Bottge, Bottge et al., 2003) were
conducted in two settings: prealgebra class and remedial class.
Summary: Nature of the Sample
A majority of the current research on math interventions for students with EBD
has been conducted with Caucasian males in restrictive middle school settings, such as
self-contained classes or schools. Studies in less restrictive environments tended to
include a large majority of students with no disabilities in the samples. The studies also
reflect a variety of ways to describe EBD status among participants. However, inadequate
description of participants is a weakness of the current body of research. Since they lack
detailed descriptions of the students with EBD, these research studies would be difficult
to replicate. These findings are consistent with findings in earlier reviews by Ruhl and
26
Berlinghoff (1992), Mooney and colleagues (2003), and Lane (2004). The majority of
studies lacked data pertinent to replication and adoption of the instructional approaches
by teachers of students with EBD, such as: (a) few students with EBD in the quantitative
study samples; (b) inadequate participant description (e.g. demographic and geographic
information) (Mooney, et al., 2003); and (c) use of restrictive settings (i.e., separate
schools and self-contained classes) (Mooney, et al., 2003), which may be due to fact that
students with EBD are less likely than their peers with other disabilities to be educated in
general education settings (Bradley, Henderson, & Monfore, 2004; Landrum,
Katsiyannis, & Archwamety, 2004; Wagner & Cameto, 2004).
Future research should include more detailed sample descriptions, including
detailed descriptions of EBD identification criteria. Research should also focus on
broadening samples to include females, minority students, and students from a variety of
socioeconomic backgrounds. Although research that focuses on group design with larger
samples of students with EBD is essential, more robust smaller scale studies (including
single-subject design) are needed to validate the effectiveness of interventions before
scaling up to larger group designs (Odom, et al., 2005). Single-subject research studies
should provide clear and comprehensive sample descriptions, and include a sample of
students that is representative of the demographic backgrounds of the population of
students with EBD. These studies can provide necessary groundwork for replication and
large group design studies, as recommended by Odom and colleagues (2005).
Instructional Content and Focus
In this section, interventions are identified by instructional content and by focus
of mathematical knowledge (see Table 2; see Hudson & Miller, 2006; National Research
27
Council, 2001 for detailed descriptions of focus). Instructional content and focus were
classified in a manner similar to previous reviews of the literature on mathematics
interventions for students with disabilities (Maccini & Hughes, 1997; Mastropieri,
Scruggs, & Shiah, 1991; Ruhl & Berlinghoff, 1992).
Instructional Content
The research in this literature review was conducted on basic computation and
arithmetic mathematics skills, as well as non-computational math skills, including
prealgebra and geometry. Basic math skills were defined as fact mastery and
computation, a definition consistent with Van de Walle (2004). Half of the studies (Cade
& Gunter, 2002; Carr & Punzo, 1993; Hawkins, et al., 1994; McQuillan, et al., 1996;
Swain & McLaughlin, 1998) were conducted on basic skill instruction. All of these
studies were single-subject studies and represent the majority of the sample of students
with EBD (n=22).
The authors of the other six studies (Bottge, 1999; Bottge et al., 2001; Bottge et
al., 2002; Bottge et al., 2003; Butler et al., 2003; Calhoon & Fuchs, 2003) examined
student performance on non-computational skills such as prealgebra, content consistent
with middle school and high school grade levels and NCTM Standards. Examples of the
skills targeted in the studies include graphing and linear functions (Bottge et al., 2001),
and fractions equivalency instruction, including converting improper fractions to mixed
numbers and demonstrating graphical representation of the task (Butler et al., 2003).
However, data suggest that these studies included only six students with EBD in the
treatment groups. Three studies (Bottge, 1999; Bottge et al., 2001; Butler et al., 2003) did
not report the number of students with EBD in the treatment group. Half of the studies
28
(Bottge, 1999; Carr & Punzo, 1993; Franca, Kerr, Reitz, & Lambert, 1990; Hawkins et
al., 1994; McQuillan et al., 1996; Swain & McLaughlin, 1998) were conducted before the
most recent NCTM standards (2000) and the 2001 NCLB laws were passed and
regulations were promulgated. Only two studies (Calhoon & Fuchs, 2003; Hawkins et al.,
1994) were conducted with high school students. The remaining studies were conducted
with younger samples (Bottge, 1999; Bottge et al., 2001; Bottge et al., 2002; Bottge et al.,
2003; Butler et al., 2003; Cade & Gunter, 2002; Carr & Punzo, 1993; Franca et al., 1990;
McQuillan et al., 1996; Swain & McLaughlin, 1998), which likely attributed to the lack
of non-computational math instruction.
Instructional Focus
In addition to investigating instructional content covered by interventions,
mathematics interventions can be identified by the instructional focus. In this review, the
instructional focus of a mathematics intervention refers to the type of mathematical
knowledge (or proficiency; see National Research Council, 2001, p. 116) that is targeted
(Maccini & Hughes, 1997). Two types of mathematical knowledge are described as
procedural or conceptual (Hudson & Miller, 2006; Skemp, 1987; National Research
Council, 2001). According to the National Research Council (2001), procedural fluency
consists of the rules and facts one uses to carry out routine mathematics procedures,
whereas conceptual understanding is comprehension of operations, concepts,
relationships and ideas. Behavior and academic achievement are strongly related for
students with EBD (Reid, et al., 2004; Nelson, et al., 2004) and, historically, researchers
in the area of EBD have focused on addressing student behavior as a precursor to
academic instruction (Wehby, et al., 2003). For these reasons, a third category, “behavior
29
management approaches,” is included in this review. This category includes studies that
utilized a behavior management approach (targeting student behavior) to promote
acquisition of academic skills, without using a specific instructional strategy targeting
procedural or conceptual mathematics knowledge.
Procedural knowledge. Authors of four studies (Cade & Gunter, 2002; Carr &
Punzo, 1993; Franca, et al., 1990; Hawkins, et al., 1994) targeted procedural knowledge.
Cade and Gunter developed drill and practice skills by teaching a mnemonic to memorize
division facts. Carr and Punzo taught students to count the number of correct problems,
number of errors, and number of items completed in order to self-monitor accuracy and
productivity in pencil-paper math fact exercises. Hawkins and colleagues trained students
to follow step-by-step procedures for problem-solving during instructional pauses.
Conceptual knowledge. The authors of two studies focused on building
conceptual knowledge. Bottge, et al., (2001) and Bottge, et al., (2003) both focused on
problem-solving through contextualized instruction, where the students were presented
with a problem on videodisc, and collaborated to understand and solve the problem.
Procedural and conceptual knowledge - combined. Some researchers have
suggested that effective math instruction for students with learning problems should
focus on a combination of conceptual and procedural knowledge (Mercer & Pullen, 2005,
p.517; Woodward & Montague, 2002). Authors of four studies (Bottge, 1999; Bottge, et
al., 2002; Butler, et al., 2003; Calhoon & Fuchs, 2003) in this review focused on building
both procedural skills and concept development. For example, Butler and colleagues
(2003) used a graduated instructional sequence (concrete-representational-abstract [C-R-
A]) to teach fraction equivalence concepts. Specifically, students were taught steps to
30
solving tasks related to fractions, first using manipulative devices (concrete phase), and
then advancing to representational drawings (representational phase) to aid in concept
development. Finally, students were introduced to the rules and procedures for solving
fraction problems (abstract phase).
Behavior management approaches. Authors of two studies (McQuillan, et al.,
1996; Swain & McLaughlin, 1998) employed interventions to increase academic
performance through behavior management methods. Swain and McLaughlin used bonus
contingencies, or provided the opportunity for students to earn extra points with the
existing token economy, to encourage academic accuracy and task completion.
McQuillan and colleagues used self-evaluation (students rated their own behavior via a
checklist of individual behaviors and expectations) and group-evaluation (students rated
the behaviors of the group as a whole via a checklist) techniques to teach students to
monitor behavior, and measured the effects on math performance.
Summary- Instructional Content and Focus
The studies reported here targeted a variety of mathematics content areas,
including basic skill instruction, problem-solving, geometric skills, and fractions
instruction (see Table 2). The authors of these studies targeted procedural and conceptual
knowledge, or employed behavior management techniques to further students’
mathematics knowledge. The interventions used in single-subject studies generally
focused on arithmetic skills (i.e., division facts, basic operations with fractions and
decimals) and procedural knowledge (i.e., steps to solve fraction problems, mnemonic
strategy to memorize division facts). Additionally, the authors of only two investigations
targeted both procedural and conceptual knowledge, and none of the authors incorporated
31
procedural and conceptual knowledge along with a behavior management approach. For
students with EBD, interventions that target mathematical knowledge (through
procedural and conceptual knowledge) while providing behavioral management tools to
complete new and difficult mathematics tasks may be crucial components of a
comprehensive and effective intervention structure.
The paucity of research on non-computational math interventions for students
with EBD is evident in this review. Initial investigations should be conducted on a small
scale, employing single-subject interventions that use a combination of procedural,
conceptual, and behavior management foci to teach non-computational mathematics. A
solid base of secondary mathematics interventions empirically validated by sound single-
subject research can provide a springboard for larger scale studies in the future.
Instructional Activities
This section reviews studies based on type of intervention, method of delivery,
and materials used during instruction. The type of intervention is categorized as
cognitive, behavioral, or alternative delivery systems, consistent with previous
mathematics reviews (Mastropieri, Scruggs, & Shiah, 1991; Maccini & Hughes, 1997).
Methods of delivery include teacher-based interventions, team-teaching, and student-
based interventions. Materials used include manipulatives, technology, and prompt
cards/worksheets.
Type of Intervention
Cognitive. Cognitive interventions include learning strategies and strategies that
employ self-monitoring and self-instruction techniques. Learning strategies are
specifically taught to students to assist them in solving problems (Boudah & O’Neill,
32
1999). Self-monitoring and self-instruction include techniques that individual students are
taught in order to regulate their own behavior and learning through self-talk and
recording of behaviors (Graham, Harris, & Reid, 1998). Cade and Gunter (2002)
investigated the effects of a specific mnemonic learning strategy on students’ acquisition
of division-by-sevens facts. In this strategy, students were taught a finger-tapping drill
and a song involving multiples of sevens. The researchers employed a single-subject
multiple baseline across subjects design with multiple probes. The measure consisted of
permanent products (worksheets) containing basic division facts, from which percentage
of correct responses was calculated. Although no treatment fidelity was reported, the
results indicated strong improvements in percentage correct, with students achieving
100% correct during the intervention phase. Students maintained high rates of accuracy
after the intervention phase. However, due to the explicit nature of the intervention,
generalization to other basic facts may be unlikely without direct teaching of songs and
tapping drills for each family of facts.
Carr and Punzo (1993) employed a self-monitoring strategy using a multiple
baseline design, where the teacher instructed three students with EBD on the importance
of academic achievement and improved accuracy and productivity, while demonstrating
how to track correct problems and record them on a self-recording sheet. For example, in
math, students recorded the number of items given on an assignment, the number of items
completed, and the number of items answered correctly. Students self-monitored both
academic accuracy and productivity in reading, math, and spelling. After a criterion of
15% increase over baseline was met in the area of reading, investigators initiated self-
monitoring in mathematics. During eight days of self-monitoring mathematics accuracy,
33
students experienced mean increases of 27 to 62 percentage points. No fidelity of
treatment was reported in this study; however, the researchers reported descriptive
statistics for reading, math, and spelling for each student, a strength in single-subject
research. Improvements in accuracy were demonstrated across three subject areas
(reading, math, and spelling).
Behavioral. Studies were considered behavioral if they utilized behavior
management strategies, teacher modeling and feedback, reinforcement, or manipulative
devices and pictures. Authors of three studies (Butler, et al., 2003; McQuillan, et al.,
1996; Swain & McLaughlin, 1998) used behavioral interventions. In the first behavioral
study, McQuillan and colleagues investigated the effects of group evaluation and self-
evaluation of classroom behaviors on mathematics accuracy. In this alternating
treatments design, students evaluated their own behavior and group behavior using two 6-
point evaluation scales involving adherence to classroom rules. Treatments were
counterbalanced with the baseline condition (teacher evaluation via a token economy
system) and presented over 21 days. After the intervention phase, the most effective
method was presented for five days. Results were similar for group-evaluation and self-
evaluation, and indicated improved academic accuracy scores. Further analysis by the
researchers revealed that the percentage of non-overlapping data points (PND) between
baseline and intervention was higher for self-evaluation, which deems it a more effective
treatment than group evaluation. Treatment integrity data were collected for 18% of the
sessions, and demonstrated 99% accuracy across conditions. The results of this study
should be regarded with caution due to several design flaws. First, individual student data
(in the form of percentages) were reported in the narrative, but were not graphically
34
represented. Instead, the graph displayed the averaged scores, which may disguise
variability in individual data points. Additionally, there was considerable variability in
the baseline data, with several high points, including one point at 100%. Due to the nature
of the existing token economy and the group- and self-evaluation techniques, there is a
high risk of interaction effects. For example, students may have improved performance
due to the presence of more than one treatment.
Swain and McLaughlin (1998) employed a multiple baseline design across
participants to investigate the effects of bonus points contingent on students performing
with 80% accuracy on math workbook activities. The investigators provided the students
with the opportunity to earn 50 bonus points if they scored with 80% or greater accuracy
on math assignments that the students completed independently in a 55 minute period.
Students also earned an additional 20 bonus points for completing the assignment and for
neatness. Their results indicated all students performed above the 80% criterion level
during the bonus contingency phase, with a mean increase of 29 percentage points from
baseline to intervention. These results may be interpreted with caution; for some students,
there was high variability in baseline data, and while the variability decreased during
intervention, there were still several points that were similar in level to the baseline.
While interrater reliability of the assignments was reported (100% agreement), no
treatment integrity data were reported.
Butler and colleagues (2003) used two similar teaching sequences (concrete-
representational-abstract [CRA] vs. representational-abstract [RA]), incorporating both
manipulative devices (concrete) and pictorial representations (representational) to teach
fraction equivalence concepts to two groups of students with disabilities. The researchers
35
used a pretest-posttest design with a non-equivalent control group, where students were
assessed on various aspects of fraction skills, including area fractions, quantity fractions,
abstract fractions, improper fractions, and fraction word problems. The researchers
reported statistical significance and large effect sizes for the results of their comparison
of the C-R-A and R-A graduated instructional strategies. However, the results should be
regarded with caution, as further inspection of the data analysis revealed critical flaws.
Specifically, Butler and colleagues treated the six dependent measures as individual
variables, despite the fact that four of them (Area Fractions, Quantity Fractions, Abstract
Fractions, Word Problems, Improper Fractions) appear to be highly correlated.
Additionally, the researchers paired the groups from the two treatment conditions
together to compare them to a third group that did not take part in the intervention.
Finally, the analyses used by the researchers did not appropriately address the research
question, which was comparing the C-R-A and R-A instructional strategies.
Alternative delivery systems. Authors of seven studies (Bottge, 1999; Bottge, et
al., 2001; Bottge, et al., 2002; Bottge, et al., 2003; Calhoon & Fuchs, 2003; Franca, et al.,
1990; Hawkins,et al., 1994) examined the impact of alternative delivery systems on
mathematics performance. These included peer-mediated interventions (Calhoon &
Fuchs; Franca, et al.), contextualized instruction (Bottge, 1999; Bottge, et al., 2001;
Bottge, et al., 2002; Bottge, et al., 2003), and instructional pauses during lecture
(Hawkins, et al.). Using a pretest-posttest randomized control group design, Calhoon and
Fuchs investigated the effects of peer-assisted learning strategies (PALS) on the
computation, problem-solving application and concept knowledge of secondary students
with disabilities, four of whom were identified with EBD. Students were taught peer-
36
tutoring procedures and specific strategies for computation and understanding math
content related to the statewide assessment. The investigators also incorporated
performance probes using curriculum-based measures (CBM). Results indicated that
PALS and CBM were effective in raising students’ computation scores, with a moderate
effect size (.40) for the treatment. High treatment fidelity was reported for both PALS
(90.3% correct) and CBM (96.2% correct). There were no significant results for problem
application, suggesting that the intervention is effective for building computation skills,
but not as effective for applied problem-solving skills.
Franca and colleagues (1990) also used a peer-mediated strategy, investigating the
effects of peer tutoring on the math performance of middle school students with
behavioral disorders. The researchers employed a multiple baseline across subjects
design, and measured permanent products, from which the rates of problems answered
correctly, as well as error rates, were calculated. Four students with EBD were taught a
four-step peer tutoring procedure, and were matched up with tutees for 15 minute tutoring
sessions. The sessions consisted of tutoring on fractions problems followed by each tutor
and tutee completing probe worksheets based on their own math skill level. Franca, et al.,
found that tutors’ mean rate of correct responses increased from a baseline of .59
responses per minute to 1.67 responses per minute during treatment, whereas tutees mean
rates increased from .24 at baseline to 1.02 during treatment. Visual analysis of the data
demonstrated large improvements for each of the students, with clear changes in level
and trend. No data were reported on the fidelity of the treatment.
Bottge and his colleagues (1999; 2001; 2002; 2003) investigated the effects of
contextualized instruction or enhanced anchor instruction. This intervention involves
37
providing video problems to groups of students, who use clues in the presentation to
solve real-life problems. The students then use their newly gained skills to solve a real-
life problem in their own classroom, often using workshop tools to construct an object.
Bottge (1999) examined the effects of contextualized math instruction on middle school
students in remedial and prealgebra mathematics classes. The pretest-posttest design
measured computation, problem-solving, contextualized tasks, and transfer skills,
including multistep problem solving, and problems involving money, fractions, and
measurement. Results indicated the students receiving enhanced anchored instruction
improved skills on contextualized tasks (r=.33) and transfer tasks (r=.56). No significant
improvements were found for computation or problem-solving tasks.
Bottge and his colleagues (2001) extended previous research to investigate
whether low-achieving students could solve problems intended for general education
using enhanced anchored instruction. This pretest-posttest, non-equivalent group design
study was also conducted with middle school students in pre-algebra and remedial
classes. The researchers found that all groups, regardless of condition, made gains from
pre- to post-test. On the computation measure, students in the prealgebra class
outperformed students in the remedial class in both conditions; however, the effect size
was low (d = .10).
Bottge and colleagues (2002) conducted a mixed methods research study in which
they embedded qualitative research in a non-equivalent control group design with pretest-
posttest measures to examine the effects of enhanced anchored instruction and traditional
instruction on computing, problem-solving, and transfer of knowledge of middle school
students with and without disabilities in the general education setting. Results of this
38
study indicated that contextualized instruction was effective in increasing scores on
contextualized tasks and transfer tasks. The authors noted that for students with
disabilities, many scores actually deteriorated after the intervention, suggesting that the
intervention was not successful for those students.
Bottge and his colleagues (2003) further extended their previous work in
enhanced anchored instruction to examine the effects of the instructional approach on the
computation and problem-solving skills of low-achieving and average-achieving middle
school students. The researchers used a mixed-methods repeated measures design over
three instructional settings: baseline (traditional teacher-directed instruction with
workbook exercises), video instruction (contextualized instruction), and applied problem
solving (using classroom-based hands-on activities, where students constructed a
compost bin). Students were assessed on computation and word problem-solving
involving money, fractions, and measurement with probes across all three conditions. The
researchers found that students performed better during the video-based instruction than
traditional instruction (η2=.56); average-achieving students performed better than low-
achieving students across all conditions. Each of the Bottge studies (1999; 2001; 2002;
2003) reported procedures for treatment integrity; however, the authors neglected to
report percentages reflecting the degree to which appropriate procedures were observed
in any of the studies.
Hawkins, Brady, Hamilton, Williams, and Taylor (1994) used a simultaneous
treatment design to investigate the effects of independent and peer-guided instructional
pauses during math lecture on the frequency of correct digits on pretest, posttest, and
daily math worksheets. During these 4-minute pauses, students either worked
39
independently or with a partner to practice skills taught during lecture. Although visual
analysis did not demonstrate any differences due to treatments, follow-up statistical
analyses indicated gains for all students from pre-test to post-test, but did not favor one
type of intervention (peer-guided or independent pauses). Several flaws were apparent in
this study. First, the authors identified the design as simultaneous treatment, when the
description of the procedures actually reflected an alternating treatments design, as the
students were not able to choose the preferred strategy. Second, the authors did not report
whether the treatments were presented in a counter-balanced or random order, which is
an important component of the alternating treatments design.
Method of Delivery
Teacher-based interventions. The authors of seven studies (Bottge, 1999; Bottge
et al., 2003; Butler et al., 2003; Cade & Gunter, 2002; Carr & Punzo, 1993; Hawkins et
al., 1994; Swain & McLaughlin, 1998) used teacher-based interventions, categorized as
either explicit teacher-directed methods, or teacher-facilitated methods. Authors of three
studies (Butler et al., 2003; Cade & Gunter, 2002; Swain & McLaughlin, 1998) utilized a
teacher-directed method of delivery. Butler, et al., implemented teacher-directed
graduated instructional sequences to teach fraction equivalence concepts. Cade and
Gunter’s teachers taught students to use a musical mnemonic to memorize division facts.
In the third study (Swain & McLaughlin), the authors did not report the method of
instructional delivery; however, available information suggests the intervention was
teacher-based, because bonus points were incorporated into the existing token economy,
which was managed and evaluated by the teacher.
40
The authors of four additional studies (Bottge, 1999; Bottge, et al., 2003; Carr &
Punzo, 1993; Hawkins, et al., 1994) used a teacher-facilitated method of delivery, where
the teacher did not provide explicit instruction for the entire lesson, but either facilitated
by guiding student learning (Bottge, 1999; Bottge, et al., 2003) or provided lecture for at
least part of the intervention (Carr & Punzo, 1993; Hawkins, et al., 1994). For example,
in the research using contextualized instruction led by Bottge (1999; 2003), the teacher
facilitated instruction via use of videodiscs and small group problem-solving. After
introducing and modeling the approach, the teacher provided guidance through clarifying
and paraphrasing student findings, which helped students build conceptual understanding
as they attempted to solve real-world problems as a group. Carr and Punzo provided
direct instruction in self-monitoring techniques followed by student independent practice
in those techniques. Hawkins and colleagues used a teacher-facilitated approach in which
the teacher provided lectures followed by peer-assisted and independent instructional
pauses, where students practiced solving problems related to the lecture topics.
Team-teaching. Bottge and colleagues (2001) employed team teaching in which a
special educator, general educator, and technology teacher shared instructional
responsibilities. In this study, the general educator served as the primary instructor, while
the special educator provided a support role in the classroom. The technology teacher was
responsible for the hands-on portion of the lesson, where students built a vehicle, and
measured its rate of speed and distance traveled on a ramp.
Student-based interventions. Authors of four studies (Bottge et al., 2002; Calhoon
& Fuchs, 2003; Franca et al., 1990; McQuillan et al., 1996) utilized student-based
interventions. Bottge and his colleagues (2002) had students work in pairs to solve
41
contextualized videodisc problems, and construct benches based on knowledge gained
through their contextualized problem solving experience. Calhoon and Fuchs
implemented peer-assisted learning strategies (PALS) with high school students. In this
investigation, students were trained to provide tutoring to a partner to improve
computation and problem-solving skills in preparation for high school statewide testing.
As part of the intervention, students reversed roles, so that each student participated as
both a tutor and tutee. Franca and colleagues used peer tutoring to increase students’
accuracy in computation of fractions. Students were assigned to dyads and tutors were
trained to assist tutees in steps to solving fractions problems. Unlike Calhoon and Fuchs’
study, tutors and tutees did not reverse roles. McQuillan et al., used a student-directed
approach to evaluating classroom behavior in a special education school, where students
evaluated their own behavior, as well as the behavior of the class as a group.
Materials
Manipulatives. Manipulatives, or physical models that can be used to represent
concepts, are often used in mathematics instruction to develop new concepts, connect
symbols and concepts, and assess student understanding (Van de Walle, 2004). One
author (Butler et al., 2003) utilized manipulatives to demonstrate concrete representation
of math concepts. The materials used by Butler and colleagues included commercially-
made fraction circles, dried white beans, and student-made fraction squares of
construction paper.
Technology. NCTM supports the use of technology (including calculators and
computers) in mathematics instruction, and has incorporated a Technology Principle into
its Principles and Standards for School Mathematics (2000). Authors of four studies
42
(Bottge, 1999; Bottge, et al., 2001; Bottge, et al., 2002; Bottge, et al., 2003) used
technology with the use of videodiscs of short, problem-solving vignettes to contextualize
instruction. The videodiscs were either from the Adventures of Jasper Woodbury series
(Learning Technology Center at Vanderbilt University, 1992) or adaptations of that series
(Bottge & Hasselbring, 1993; Bottge, 1999). The videos were operated by students, so
the students could revisit specific parts of the video, and were used to demonstrate real-
life mathematics problems and scenarios.
Prompt cards/worksheets. Use of visual prompts, including prompt or cue cards
and structured worksheets, are an effective means for assisting students in analyzing and
solving problems (Gagnon & Maccini, 2001). Authors of six studies (Butler, et al., 2003;
Cade & Gunter, 2002; Carr & Punzo, 1993; Franca, et al., 1990; Hawkins, et al., 1994;
McQuillan, et al., 1996) used prompt, or cue cards, or worksheets to support instruction.
Butler and colleagues used cue cards to remind students of the rules associated with
fractions problems. The cue cards included definitions and step-by-step procedures for
solving problems. The investigators also used learning sheets to assist students in guided
practice, independent practice, and problem-solving practice. The learning sheets
displayed prompts and directions for solving individual problems. An example of a
prompt on the learning sheet is a box that displays three blocks, and states “Circle 1/3 of
the 3 ■ [blocks].” (p. 103). The boxes are sequenced where the prompts are faded so that
by the end of the boxes on the page, the students must draw in their own boxes, and then
answer two word problems without the assistance of the prompts.
Cade and Gunter (2002) used flash cards of basic “division by 7” facts to train
students to use a musical mnemonic to solve basic division problems. Carr and Punzo
43
(1993) used self-recording worksheets, where students recorded the number of completed
problems, as well as the number of problems correct. Franca and colleagues (1990) used
index cards with step-by-step procedures for completing a variety of math fraction
problems (addition of proper fractions with common denominators, addition of mixed
numbers). Hawkins and colleagues (1994) utilized a prompt worksheet which included
instructions to students for use during the peer-guided pause condition. The steps
included “1. Make sure you and your partner understand;” and “3. Work the problems on
the sheet together and take turns writing the answer” (p.8). McQuillan and colleagues
(1996) used evaluation forms that students used to rate their own behavior as well as the
behavior of the class. The forms included a six-point scale of adherence to classroom
rules. Authors of two studies (Calhoon & Fuchs, 2003; Swain & McLaughlin, 1998) used
no materials beyond those typically used in a classroom.
Summary: Instructional Activities
The authors of the studies reported here used a variety of interventions to improve
mathematics skills (see Table 2). These included graduated instructional sequence, peer-
mediated approaches, contextualized instruction, mnemonic strategies, self-monitoring,
bonus contingencies, and instructional pauses to support instruction. Delivery of
instruction was provided in three primary modes: teacher-based, student-based, and team
teaching. Additionally, a variety of materials were used during the interventions,
including manipulatives, cue cards and structured worksheets, and videodiscs (see Table
2). There are a number of flaws with the current research. Butler et al., (2003) used
inappropriate data analyses, which may affect the reported results. Hawkins et al., (1994)
erroneously reported using a simultaneous treatment design, when they actually used an
44
alternating treatments design. The authors also failed to report whether or not the two
alternating treatments were randomly ordered or counterbalanced. Two of the single-
subject studies (McQuillan et al., 1996; Swain & McLaughlin, 1998) had unstable
baselines when they initiated the treatment phase, a questionable practice in single-
subject research. Future research should further the investigation of the components
found effective here, including contextualized instruction, use of self-monitoring
strategies, use of cue cards and manipulative materials, and teacher- and student-based
methods of delivery.
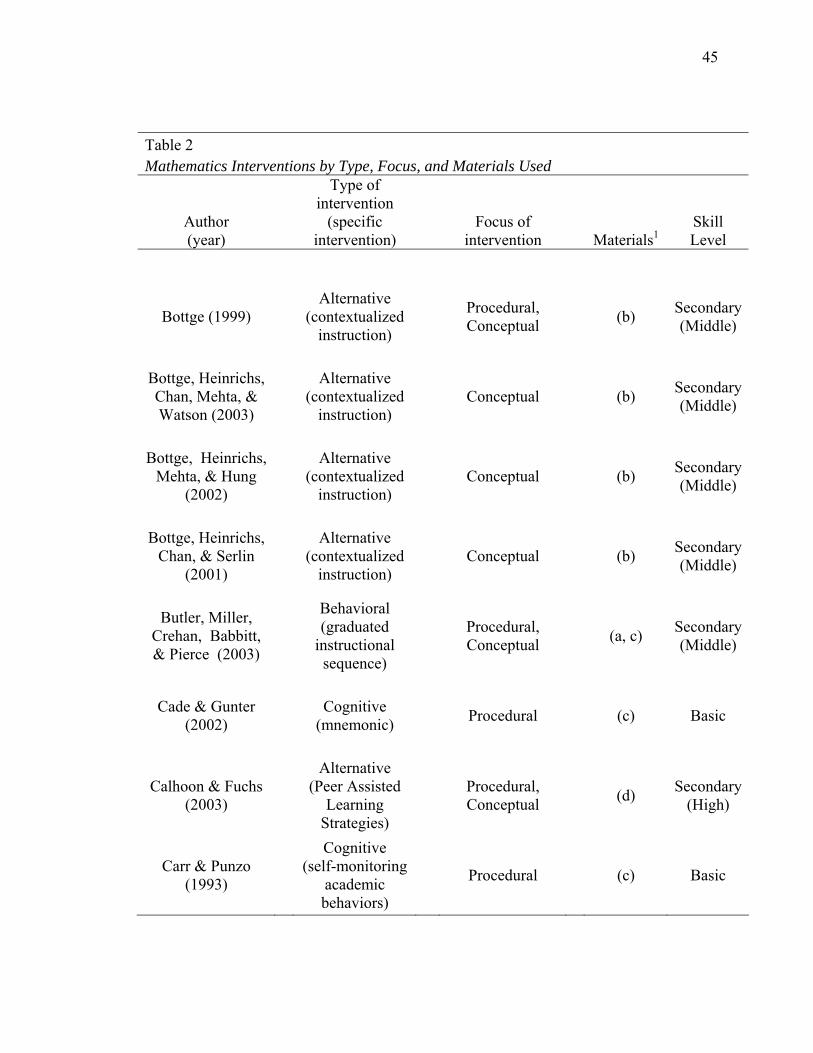
45
Table 2 Mathematics Interventions by Type, Focus, and Materials Used
Author (year)
Type of intervention
(specific intervention)
Focus of intervention Materials1
Skill Level
Bottge (1999) Alternative
(contextualized instruction)
Procedural, Conceptual (b) Secondary
(Middle)
Bottge, Heinrichs, Chan, Mehta, & Watson (2003)
Alternative
(contextualized instruction)
Conceptual (b) Secondary (Middle)
Bottge, Heinrichs, Mehta, & Hung
(2002)
Alternative (contextualized
instruction) Conceptual (b) Secondary
(Middle)
Bottge, Heinrichs, Chan, & Serlin
(2001)
Alternative (contextualized
instruction) Conceptual (b) Secondary
(Middle)
Butler, Miller, Crehan, Babbitt, & Pierce (2003)
Behavioral (graduated
instructional sequence)
Procedural, Conceptual (a, c) Secondary
(Middle)
Cade & Gunter (2002) Cognitive
(mnemonic) Procedural (c) Basic
Calhoon & Fuchs (2003)
Alternative (Peer Assisted
Learning Strategies)
Procedural, Conceptual (d) Secondary
(High)
Carr & Punzo (1993)
Cognitive (self-monitoring
academic behaviors)
Procedural (c) Basic
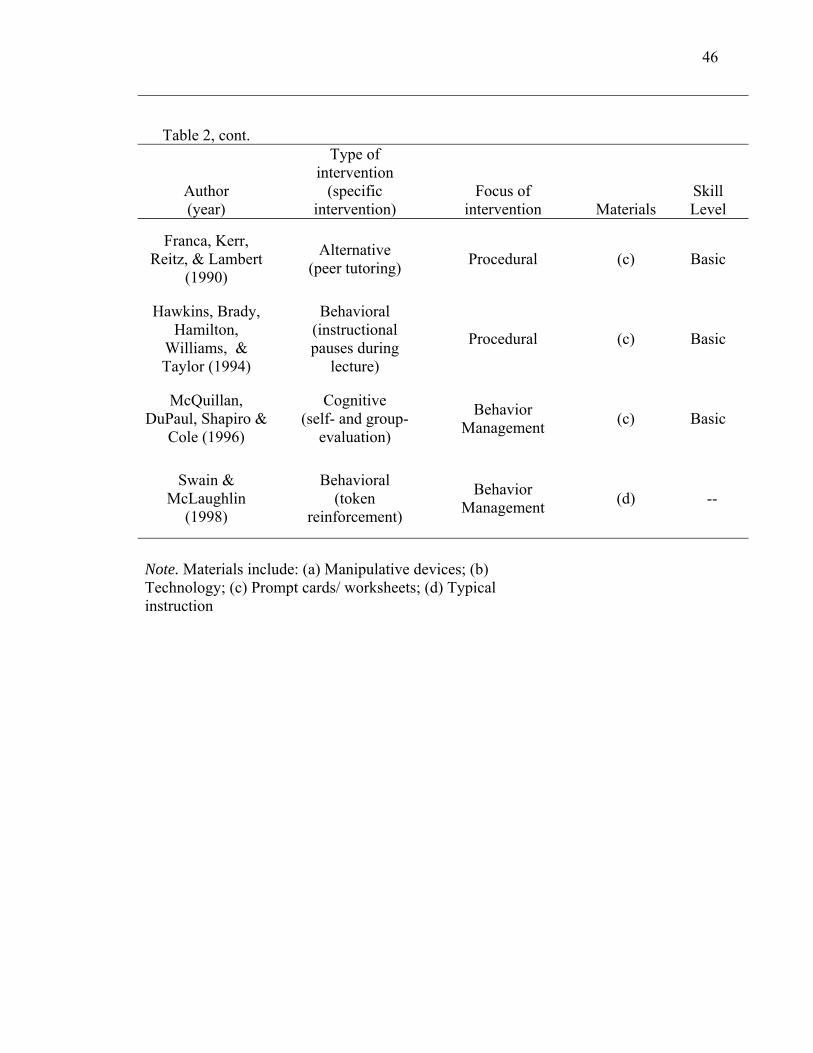
46
Table 2, cont.
Author (year)
Type of intervention
(specific intervention)
Focus of intervention Materials
Skill Level
Franca, Kerr, Reitz, & Lambert
(1990) Alternative
(peer tutoring) Procedural (c) Basic
Hawkins, Brady, Hamilton,
Williams, & Taylor (1994)
Behavioral (instructional pauses during
lecture)
Procedural (c) Basic
McQuillan, DuPaul, Shapiro &
Cole (1996)
Cognitive (self- and group-
evaluation) Behavior
Management (c) Basic
Swain & McLaughlin
(1998)
Behavioral (token
reinforcement) Behavior
Management (d) --
Note. Materials include: (a) Manipulative devices; (b) Technology; (c) Prompt cards/ worksheets; (d) Typical instruction
47
Summary
Current published research reported here suggests the need for more empirically-
based research on effective mathematics interventions for secondary students with EBD.
This review demonstrates that empirically-based practices exist for teaching mathematics
to secondary students with EBD. Since the current research base is limited, future
research should examine the following practices to teach mathematics to secondary
students with EBD:
1) self-monitoring of behavior and academic performance;
2) explicit, direct instruction;
3) peer-mediated instruction;
4) contextualized instruction;
5) instruction that targets procedural and conceptual understanding;
6) instruction that addresses student behavior management;
7) use of manipulative materials; and
8) use of cue cards or visual prompt sheets.
In particular, as displayed in Table 2, the non-computational mathematics
interventions utilized peer-mediated instruction, contextualized instruction, and use of
manipulatives and cue cards. However, those studies did not include a component to
target behavior in an effort to improve academic performance, which is an important
component of instruction for students with EBD (Maccini & Gagnon, 2000). There are
several other limitations to the current research.
1) There are a limited number of non-computational mathematics studies conducted
with students with EBD;
48
2) In the studies that have been conducted exclusively with the EBD population,
there have been eight or fewer students with EBD in the respective samples;
3) Sample descriptions lack pertinent information including gender, ethnicity,
socioeconomic status;
4) There are no studies that incorporated both mathematical knowledge and behavior
management techniques;
5) Studies lack comprehensive descriptions of the mathematics content targeted by
the investigators;
6) Several studies had flaws in data analysis, including single-subject designs with
unstable baselines (McQuillan, et al., 1996; Swain & McLaughlin, 1998),
inappropriate data analysis procedures (Butler, et al., 2003), and inappropriate
reporting of design (Hawkins, et al., 1994).
Conclusion
Developing best practice for students with EBD should be informed by:
(a) current knowledge of typical student understanding of area and perimeter (Battista,
2003); and (b) addressing issues associated with implementation of interventions
currently available to students with learning and behavioral problems (Landrum, et al.,
2003). In that vein, understanding the development of area and perimeter concepts in
typically-developing students, as well as identifying and applying relevant theories of
learning will provide a solid foundation and rationale for the current study. There is also
value to building a research study based on the interventions shown to be effective in this
review, as well as looking at effective interventions for students without disabilities as
49
well as interventions for students with similar learning problems, such as students with
LD.
Area, Perimeter and Typical Student Learning
Typically developing students often have difficulty understanding the abstract
concepts of geometry and measurement, especially area and perimeter (Barrett &
Clements, 2003; Battista, 1982; Strutchens, Martin, & Kenney, 2003; Walter, 1970).
Researchers have suggested that students develop geometry knowledge in a series of
hierarchical stages, from early elementary school through high school (Barrett, Jones,
Thornton, & Dickson, 2003; Malloy, 1999). The van Hiele model of geometric thinking
emphasizes sequential learning through observation, interaction, and contextualized
problem-solving opportunities in early grades, rather than focusing on memorizing
formulae and vocabulary (Crowley, 1987; Woodward, 2006). The idea behind the van
Hiele model is that observation and exploration of geometric principles in early grades
provides a rich foundation for more complex and formal geometry in later grades
(Woodward, 2006). According to the van Hiele model, typically-developing students in
middle school are between concrete and informal deduction levels, where they can
identify and compare geometric figures, but do not understand the structure of the
geometric system, or the concepts underlying terms such as area and perimeter (Malloy,
1999).
Typically-developing students often confuse the concepts of perimeter and area,
and the relationship between the two (Malloy, 1999; Mistretta, 2000). Some additional
problems students encounter with area and perimeter include: (a) the inability to spatially
organize units into composite figures (i.e., visualizing a figure and its units; Battista,
50
2003); (b) applying the incorrect formula to solve a problem (e.g., using the area formula
to solve for perimeter; Malloy, 1999); (c) inappropriately applying numerical procedures
(e.g., counting pegs instead of spaces on a geoboard; Barrett, et al., 2003; Battista, 2003);
and (d) using inappropriate measures (e.g., using yards instead of inches; Chappell &
Thompson, 1999).
Thus, typically-developing students may attempt to solve area and perimeter
problems without understanding the concepts behind the formulae. Students with poor
mathematics computation and problem-solving skills may have even more difficulty with
the multiple tasks involved in solving area and perimeter problems. These students may
not have advanced to the informal deduction phase of the van Hiele model, and may lack
the necessary knowledge to advance with their typically-developing peers. In fact,
students with disabilities may not have even received geometry instruction, as research
has found that math instruction for those students largely focuses on basic computation
(Woodward).
Secondary Mathematics Interventions and Youth with Learning Disabilities
Students with high incidence disabilities, such as EBD and LD, often display
similar learning characteristics. These characteristics include memory deficits, language
deficits, and cognitive development deficits (Benner, Nelson, & Epstein, 2002; Bryant,
Kim, Hartman, & Bryant, 2006; Mattison, Hooper, & Carlson, 2006). Although no
studies have been conducted to understand specific math deficits faced by students with
EBD, research has found that students with math LD use rudimentary and ineffective
strategies to problem-solve, have difficulty maintaining facts or steps in their working
51
memory, take longer to complete problems, and lack conceptual understanding (Geary,
Hoard, Nugent, & Byrd-Craven, 2007).
Given the similar characteristics and academic needs of students with EBD and
students with LD (Trout, et al., 2003), instructional practices found successful for
students with LD may also be effective in mathematics interventions for students with
EBD. Although there are differences between these two populations, students with EBD
and students with LD share many academic characteristics. As Sabornie, Cullinan,
Osborne, and Brock (2005) have aptly stated, “effective instruction is effective
instruction”(p.58). Using the solid foundation developed in research on mathematics
interventions for students with LD can provide a starting point for researching effective
interventions for students with EBD.
Researchers who study instructional interventions for students with LD have
developed a broad base of effective mathematics interventions, including practices
targeted at secondary students. Existing mathematics research with secondary students
with LD supports several empirically-validated practices that may be effective for
secondary students with EBD. Reviews by Mastropieri, Scruggs, and Shiah (1992) and
Maccini and Hughes (1997) found (a) self-monitoring academic behavior; (b) behavioral
reinforcements, (c) prompt cards and cue cards; (d) use of manipulatives; and
(e) contextualized instruction to be among a group of effective interventions for students
with LD. Maccini and Gagnon (2000) conducted a survey of general education math
teachers and special education teachers, who supported using manipulatives and real-
world examples to activate conceptual knowledge. The authors also identified behavior
management techniques as important components of math instruction for secondary
52
students with EBD. The strength of these interventions in research for students with LD,
as well as in the current review of interventions for students with EBD, provides
substantial support for further investigation of these components in non-computational
math for students with EBD.
Self-monitoring academic performance and behavior. Self-monitoring techniques
are supported by researchers for improving social and academic behaviors of students
with disabilities (Graham, Harris, & Reid, 1998; Harris, Friedlander, Saddler, Frizelle, &
Graham, 2005; Reid, 1996; Reid, Trout, & Schartz, 2005). Self-monitoring involves
students first identifying whether a target behavior has occurred or has not occurred, and
then recording the result (Graham, et al., 1998). In the present review of the literature,
Carr and Punzo (1993) taught students to self-monitor academic performance and
productivity. McQuillan, et al., (1996) taught students to self-evaluate classroom
behaviors. In the proposed study, self-monitoring both behavior and academic
productivity, as part of the instructional package, will extend the current research base to
secondary students with EBD.
Representation: Cue cards and manipulatives. Representations come in a variety
of packages: concrete manipulatives, drawings, mental images, models, and visual aids
(Fennell & Rowan, 2001; Hudson & Miller, 2006; Resnick & Ford, 1981). The
theoretical basis for using manipulatives and other representation techniques has a long
history (Resnick & Ford, 1981). Both Bruner (1966) and Dienes (1967) supported use of
representation to enhance concept formation. Bruner argued that children learn in three
modes of representation: first by enactive representation, which is marked by physically
manipulating concepts; second by iconic representation, which involves mental and
53
sensory organization; and finally, by symbolic representation, which involves symbolic
understanding. Dienes suggested that children differ in their abilities to build concepts,
and that “assignment cards” should be available to students to guide learning. In addition
to assignment cards, Dienes also suggested that concrete materials be available to allow
students to develop abstract concepts and form relationships between related concepts in
their minds. More recently, Fennell and Rowan (2001) discussed the importance of
representation as an NCTM process standard. They argued that representation is an
important part of mathematics instruction because: (a) it involves physical manipulation
which makes concepts concrete; and (b) it enables students to link related concepts and
extend understanding. The National Research Council also supports representation as a
strand of mathematics proficiency (2001). Finally, in a meta-analysis of problem-solving
instructional interventions, Xin and Jitendra (1999) found that using representation
techniques such as use of manipulatives in problem-solving instruction to be among
interventions that improved mathematics performance of students with learning
problems.
Contextualized instruction. Researchers in both general mathematics education
and special education agreed that embedding instruction on measurement and geometry
in rich, meaningful contexts is critical for ensuring student understanding (Goldman, et
al., 1997; National Research Council, 2001; Strutchens, Martin, & Kenney, 2003). A
meta-analysis of mathematics interventions for low achieving students by Baker, Gersten,
and Lee (2002) strongly supported explicit, direct instruction, and showed smaller, but
positive, effects of contextualized instruction. The authors of the meta-analysis suggest
combining explicit approaches, such as direct instruction, with real-life (contextualized)
54
examples to reinforce both procedure and concept formation. Hudson and Miller (2006,
p. 19) suggested developing a meaningful context as part of an explicit instructional cycle
through means such as an interactive discussion of the importance of a concept or skill or
providing opportunities for students to experience the need for a particular skill.
The current study examined the effects of a contextualized instructional package
on the measurement and geometry skills of secondary students with EBD. The
intervention involved components of instruction that were found to be effective in this
review including the use of contextualized instruction, self-monitoring of student
academic and social behavior, and the use of manipulative materials and cue cards.
Instruction was teacher-directed, used cue cards and contextualized instruction, focused
on both procedural and conceptual mathematical knowledge, and employed self-
monitoring techniques.
55
Chapter 3: Methodology
This chapter outlines the methodology used in the study on the effects of a
contextualized instructional package on the geometry performance of secondary students
with emotional and behavioral disorders (EBD). The contextualized instructional package
focused on measurement and geometry concepts and skills (i.e., area and perimeter)
adapted from the NCTM Standards (2000), State of Maryland Voluntary State
Curriculum (2004), and Montgomery County Public Schools’ Mathematics Instructional
Guides (2003), for students in sixth, seventh, and eighth grades (see Appendix A). The
instructional package included area and perimeter problem-solving activities embedded
in contextualized, or real-life, scenarios, use of manipulative techniques to reinforce
concepts, and a behavior management component, a critical component to instructional
interventions for students with EBD. A multiple probe design across two participants,
replicated by two participants (Horner & Baer, 1978; Kennedy, 2005; Tawney & Gast,
1984), was used in this study to demonstrate a functional relationship between the
independent and dependent variables. Near and far transfer and maintenance measures
were collected following the intervention. Additionally, social validity data on the value
of the intervention were obtained from students at the end of the study. Descriptions and
justifications of the sample, design, measurement techniques, instrumentation, and data
analysis procedures are described in the sections to follow.
Participants
Four students with EBD at a public middle school in suburban Maryland
participated in this study: Carlos and Grace were participants in the original sample, and
Steven and Riley were participants in the replication. Due to attrition of two participants
56
in the original sample of four students, two additional students (Steven and Riley) were
recruited, and the original study was replicated after the first two participants (Carlos and
Grace) completed the intervention. This was necessary to improve the power of the
original study, as recommended by Tawney and Gast (1984). Carlos and Grace
completed the study during Fall 2006, whereas Steven and Riley completed the
replication during Spring 2007. Table 3 displays information obtained from school
records regarding characteristics of the participants, including gender, race, and age and
grade level at the time of the study. Each participant’s Full Scale IQ score [Wechsler
Intelligence Scale for Children-IV (WISC-IV) for Carlos, Grace, and Riley; Wechsler
Abbreviated Intelligence Scale (WASI) for Steven] and achievement score [Woodcock-
Johnson-III (WJ-III)] are also displayed, which were obtained from school records.
Finally, current math grades and pretest scores are reported for each participant.
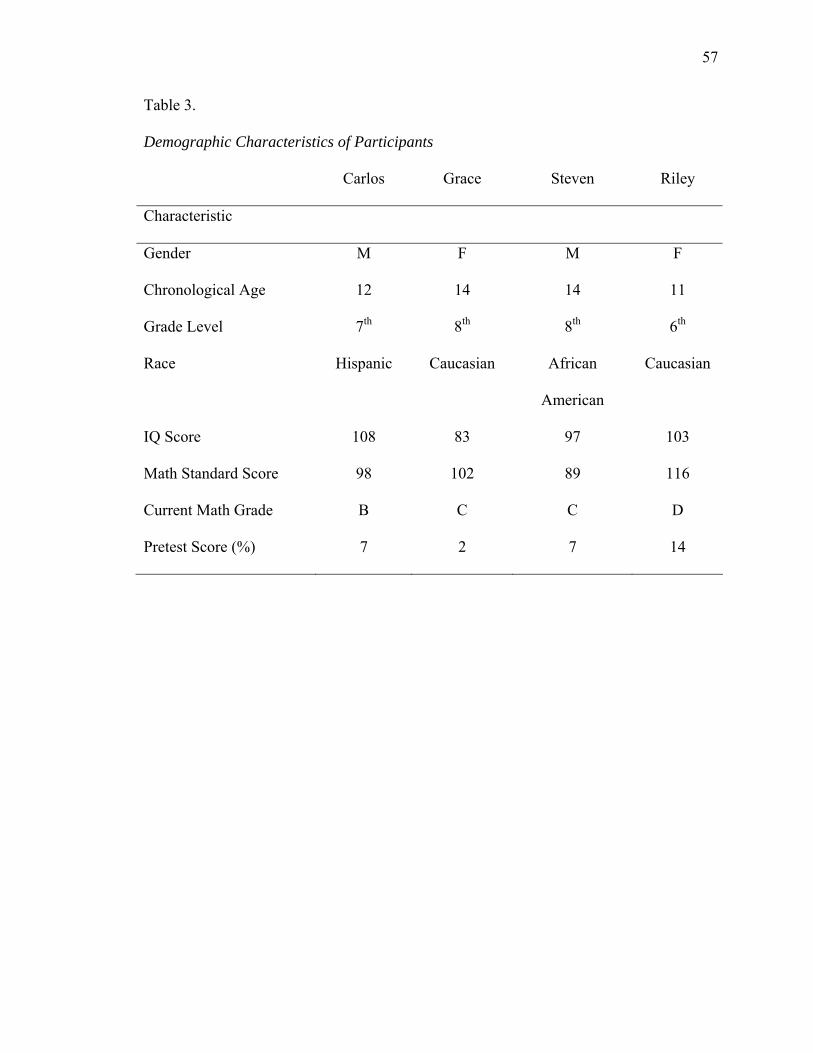
57
Table 3.
Demographic Characteristics of Participants
Carlos Grace Steven Riley
Characteristic
Gender M F M F
Chronological Age 12 14 14 11
Grade Level 7th 8th 8th 6th
Race Hispanic Caucasian African
American
Caucasian
IQ Score 108 83 97 103
Math Standard Score 98 102 89 116
Current Math Grade B C C D
Pretest Score (%) 7 2 7 14
58
Pretest
Eligible students completed a pretest measure to determine their knowledge and
mathematical skills with regard to the perimeter and area objectives covered in the
intervention. Pretest data were collected using an investigator-developed domain probe
based on the targeted measurement and geometry objectives. The probe included
geometry and measurement items directly related to the school district’s curriculum
(MCPS, 2003), Voluntary State Curriculum (State of Maryland, 2004), and NCTM
Standards (2000). The problems measured student performance on prerequisite tasks,
such as ordering shapes by area and perimeter, as well as on tasks derived from the
middle school curriculum, such as exploring the relationship among area, perimeter, and
dimensions of quadrilaterals. Problems on the assessment were restricted to rectangular
regions to be consistent with the instructional unit. The assessments consisted of: (a)
closed-ended questions (e.g., “Which has a greater area, a football field, or a baseball
diamond?”); (b) open-ended questions (e.g., “Draw a square with each side measuring 7
inches”); (c) one-step problems (e.g., “Use the area formula to find the area of a rectangle
with a length of 43 inches, and a width of 16 inches”); and (d) multi-step problems (e.g.,
“Estimate the perimeter of Design A and Design B. Use a ruler to find the dimensions of
each design, in inches. Use the perimeter formula to find the perimeter of each design.
Which has the greater perimeter?” [Balanced Assessment Project Team, 1999; Hudson &
Miller, 2006; Rectanus, 1997]).
Participant Eligibility and Selection
To meet eligibility criteria established prior to the study, eligible participants:
59
(a) were previously school-identified as having an EBD; (b) received instruction in a
self-contained special education math class at the time of the study; and (c) scored below
60% on an investigator-developed pretest targeting objectives related to area and
perimeter of geometric figures.
To select potential participants, the following steps were used. First, I spoke to the
principal and special education supervisor about the purpose and goals of the study. I
obtained informed consent (see Appendix B) from the special education supervisor, who
assisted in recruiting students. Second, with assistance from the special education
supervisor, I sent permission forms (see Appendix C) to the parents/guardians of each of
the students receiving services in the self-contained special education program. The
parent permission forms were accompanied by a letter describing the purpose and goals
of the study (see Appendix D). Several parents contacted me to further discuss the study,
including its purpose, the time commitment involved, and other questions they had
regarding the study, such as from which class students would be pulled. After receiving
parental consent, I discussed the study with each of the potential participants. I then gave
assent forms (see Appendix E) to students who agreed to participate. I reviewed school
records of students who, along with their parents or guardians, agreed to participate to
identify potential participants.
Informed Consent
Written assent was obtained from each participant, and consent was obtained from
their parents or legal guardians prior to initiating the study. Each participant was
informed of their right to withdraw from the study at any time. I contacted parents and
guardians by phone at the beginning, midpoint, and end of the intervention phase.
60
Human Subjects Review
Prior to beginning the investigation, I submitted plans for approval to the Human
Subjects Review Committee at the University of Maryland, College Park. I also
submitted a proposal to the Montgomery County Public Schools Department of Shared
Accountability for approval prior to initiating research.
Instructor and Setting
The intervention was implemented by the investigator. The study took place
during a social skills class for students with EBD in a public middle school in suburban
Maryland. The room used for the intervention was a 5-foot by 8-foot room previously
used as a “transition room,” where students could go following an emotional or
behavioral crisis. There were no chairs, tables, desks, windows, or decorations in the
room prior to the study. The school supplied one student desk, two chairs, and two stools
for the intervention. The length of the intervention was designed to reflect the length of a
typical secondary mathematics unit. It was designed to be implemented for 45 minutes
per day, 5 days per week, over approximately three weeks. The actual intervention
included 45-minute instructional periods, four days per week, over four to five weeks.
The intervention lasted an average of 11.5 sessions (r = 11-13) per participant. The
number of days per week for the intervention varied by student due to a number of
disruptions to the schedule, including student absences, school holidays, snow days, and
instructor absences. Specifically, For Carlos, the intervention lasted 13 days over 5
weeks, while for Grace, the intervention lasted 11 days over 4 weeks. For Steven, the
intervention lasted 11 days over 5 weeks, and for Riley, the intervention lasted 11 days
over 4 weeks.
61
Instructional Materials
The contextualized instructional package incorporated the use of a variety of
manipulative materials and cue cards. In addition, the intervention included an
investigator-developed instructional unit based on scripted lesson plans.
Manipulative materials. Manipulative materials included Post-it notes, rulers,
geoboards and rubber bands. Geoboards are square pin grids designed to hold rubber
bands, and are used to demonstrate shapes and designs as a tool for geometry and
measurement instruction.
Cue cards. Cue cards were provided to each student as a procedural strategy
(Hudson & Miller, 2006) to remind participants of the steps to take to solve area and
perimeter problems (see Appendix F). Cue cards were provided to students on measuring
the length of figures, finding the perimeter, and finding the area.
Instructional unit and lesson plans. The instructional unit, including all lesson
plans and activities, was investigator-developed and adapted from pre-requisite and
grade-appropriate concepts and skills within the NCTM Standards (2000), the Voluntary
State Curriculum (State of Maryland, 2004), and the district curriculum (MCPS, 20003).
Adapting instructional content is often necessary to meet the individual needs of students
with high incidence disabilities such as EBD, teach related pre-requisite skills, and access
grade-appropriate mathematics standards (Bryant et al., 2006). The instructional unit was
developed based on national, state, and district standards for mathematics, but the
instructional content was changed to meet the academic needs of the participants. For
instance, the unit addressed only customary units of inches and feet, the problem
examples focused only on rectangular regions, and involved two-digit by two-digit
62
computation. These adaptations were implemented to ensure that participants would not
experience difficulties with other mathematics skills and concepts that would inhibit their
ability to learn area and perimeter. Appendix A displays the national, state, and district
standards and curriculum from which the instructional unit was developed. The
instructional unit consisted of a total of 11 lessons, including the introduction/self-
monitoring lesson. The remaining 10 lessons covered topics across four objective sets.
The first three objective sets consisted of pre-requisite lessons, starting from
second-grade level concepts and skills through fifth-grade level concepts and skills.
These lessons were necessary to provide the foundation for the fourth objective set,
which consisted of middle school concepts and skills taught during the final three lessons.
Providing adequate instruction on pre-requisite skills was necessary, because students
with EBD often do not possess the pre-requisite skills necessary to master grade-
appropriate concepts and skills. In order to cover the pre-requisites as well as the grade-
level topics in a manageable time frame, all of the lessons focused only on rectangular
regions. See Appendix G for the daily lesson procedures.
I followed investigator-developed scripted lesson plans (Appendix H). Each of
the instructional lessons used components of effective instruction (Rosenshine & Stevens,
1986; Hudson & Miller, 2006), and sequentially targeted the unit objectives. Lessons
incorporated concepts and skills involved in calculating the area and perimeter of
rectangles and squares.
Area and perimeter are traditionally taught through the use of teacher-directed
instruction of formulae, where students do not learn or understand the concept behind the
formula. Understanding the concept behind the formula is important to developing a
63
foundation for more complex geometric skills and is a necessary tool for real-life
activities. One way to develop conceptual understanding is to give students and
opportunity to “construct” their own knowledge through open-ended actvitivies.
Opportunities for constructivist-based activities were infused via demonstration and
guided practice activities throughout the lessons. Participants were asked open-ended
questions and were provided with manipulative materials to assist them in solving those
questions. For example, in Objective 4, Lesson 2, participants were encouraged to
“discover” the relationship between area and perimeter when area stays constant. They
used geoboards and inch blocks to create a variety of quadrilaterals in which the area
remained the same and perimeter changed. Then, they developed a “rule” and wrote the
rule on their cue cards to describe the relationship.
Independent Variable
The independent variable consisted of an instructional package that was applied to
an instructional unit based on measurement and geometry objectives related to area and
perimeter (Appendix G). The objectives were drawn directly from the NCTM Standards
(2000), State of Maryland Voluntary State Curriculum (2004), and the district’s
curriculum (MCPS, 2003).The independent variable combined contextualized problem-
solving opportunities in area and perimeter with self-monitoring techniques. The
instructional package targeted participants’ procedural and conceptual knowledge and
included a self-monitoring behavior management component.
Contextualized instruction. Contextualized instruction was presented in the form
of real-life applications of meaningful area and perimeter problems (Bottge, 1999;
Goldman, et al., 1997). Each lesson included opportunities for students to solve problems
64
related to real-life scenarios. For example, topics were introduced and practice
opportunities were provided related to building patios, designing skate parks, and
building dog pens, and other real-life problems. Each task sheet, domain probe, and
objective probe included contextualized problems.
Procedural knowledge. Procedural knowledge was targeted through the use of cue
cards that identified the process learners use to solve problems (Cade & Gunter, 2002;
Carr & Punzo, 1993; Hawkins, et al., 1994; Hudson & Miller, 2006). Participants were
taught to use the cue cards to assist them in solving problems during the intervention
phase. During the first lesson, I explained what the cue card was, and why it could be
helpful to the student. During each lesson, I referred to the cue card, and directed the
participant to identify information pertinent to that lesson that was already on the cue
card (i.e., reviewing definitions). During sessions where participants learned new
information, they were directed to add the information (i.e., formulae for finding area and
perimeter, rules regarding the relationship between area and perimeter). Each participant
was encouraged throughout each session of the intervention to refer to the cue card if
they had a question about something on the cue card, such as a formula, definition, or
steps to solve a problem.
Conceptual knowledge. Conceptual knowledge was targeted through the use of
concrete applications (manipulatives) and pictorial representations during instruction.
Participants were required to solve problems using manipulative materials, rather than
solely through paper and pencil tasks. Geoboards, Post-it notes, inch cubes, and paper
clips were used as concrete applications to introduce and reinforce the concepts of area
and perimeter. Participants identified a variety of rectangle- and square-shaped objects in
65
the room, measured, and calculated the area and perimeter of those shapes using the
manipulatives. The purpose of using manipulatives was to enable students to develop a
conceptual understanding of the relationships between area and perimeter of similar
geometric figures. Students then used this conceptual understanding gained from practice
with concrete examples to develop and understand the use of formulae at an abstract
level. When formulae were understood through this process, participants were able to
solve area and perimeter problems in a more efficient manner (Hudson & Miller, 2006).
Self-monitoring. Self-monitoring of academic performance and behavior were
included in this study as an additional component of the instructional package.
Participants were presented with a self-monitoring checklist (see Appendix I) and were
taught to self-record the total number of problems completed and the number of problems
completed correctly during independent practice for each session. The self-monitoring
checklist also required students to self-evaluate a set of behavioral expectations.
The self-monitoring checklist and instruction on the use of self–monitoring
strategies were derived from materials and procedures used in prior research on self-
monitoring (Carr & Punzo, 1994; Hallahan, Lloyd, Kosiewicz, Kauffman, & Graves,
1979; Harris, et al., 2005; Reid & Harris, 1993; Uberti, Mastropieri, & Scruggs, 2004).
Instruction on self-monitoring occurred at the beginning of the intervention phase for
each participant. First, I provided each participant with explicit definitions of “academic
achievement” and “on-task behavior.” I used examples from sample student worksheets
to provide a rationale for the importance of monitoring and demonstrating improved
accuracy. Then, behavioral expectations were discussed, including a definition of
“appropriate behavior,” examples and non-examples of the desired behaviors. I referred
66
to each participant’s behavior contract to provide a rationale for self-monitoring behavior.
Each student worked on individual behavioral expectations through use of the contract.
Using those behavioral expectations provided a meaningful context for teaching the self-
monitoring process to students.
Second, I directed each participant to count the number of items given on a task
sheet, the number of items completed, and the number of items completed correctly. Each
participant was directed to record those numbers on the self-monitoring checklist (see
Appendix I). Participants were directed to place a check or a “1” next to each behavioral
expectation they believed were met during the instructional session. Third, I modeled the
procedures, verbalizing each step as I conducted them.
Finally, I asked each participant to define academic achievement and on-task
behavior, and to explain why it is important to monitor academic performance and
appropriate behavior. The participants were asked to model the self-monitoring
procedures. If participants responded incorrectly at any point during instruction, I
followed a three-step correction process. First, I pointed out the incorrect response by
saying “That’s a good response, but not quite right.” I then reviewed with the student the
correct response and the appropriate procedures for self-monitoring. The student then
repeated the correct response, followed by positive feedback from me.
Instructional Procedures
Components of effective instruction (Hudson & Miller, 2006; Rosenshine &
Stevens, 1986) were used in instructional delivery. The components include:
67
1) Advance organizers, which consist of three components: review of prerequisite
knowledge, statement of lesson objective with link to prior knowledge, and
development of relevance to ensure a meaningful context;
2) Demonstration, which consists of teacher presentation of the new concept or
task, modeling thinking and action, maximizing student engagement, and
monitoring student understanding with four to five problem examples;
3) Guided practice involves teacher assistance during student practice of new
tasks with three to four problem examples;
5) Independent practice, where students complete problems without teacher
assistance with 10 problem examples;
6) Review of the day’s lesson and monitoring of student acquisition of the new
material.
Lesson plans were structured to include each component to ensure a systematic
implementation of the lessons. New concepts were presented in short, concrete steps, as
recommended by Hudson and Miller (2006) and Rosenshine and Stevens (1986).
Constructivist-based activities were infused in each lesson during demonstration and
guided practice opportunities throughout the unit. Finally, participant behaviors,
including targeted on-task behaviors, were addressed using the procedures identified in
the behavior protocol.
Behavior protocol. Due to the fact that students with EBD are characterized by
difficulty managing emotions and tend to exhibit problem behaviors, a protocol was
followed to address any possible problem behaviors (Appendix J). The students were on
an existing behavioral level system, where they carried behavior contracts and earned
68
points for positive behaviors. Students earned privileges and rewards by maintaining
appropriate behaviors. In order to maintain consistency, I developed the behavior
protocol based on the school’s existing behavioral level system, and addressed problem
behaviors according to the protocol. The protocol was reviewed by school staff to ensure
that it aligned with their procedures.
Dependent Variables and Measurement Procedures
Probes
Items on the probes were variations of sample problems from the district’s
curriculum guides (MCPS, 2003) and the Voluntary State Curriculum (State of Maryland,
2004), and were directly related to the objectives of the instructional unit. Domain
probes, objective probes, and transfer and maintenance probes were given to participants
in the study. Domain probes provided a pre-test, post-test assessment of student skills
across the entire unit, much like a survey curriculum-based assessment (CBA; Hudson &
Miller, 2006). Objective probes provided a daily progress monitoring of student
performance on individual objectives, much like an untimed focused CBA (Hudson &
Miller). Transfer and maintenance probes assessed participants’ ability to use the skills
and concepts they acquire to solve problems of similar context and more complex
problems, as well as the ability to continue to successfully solve area and perimeter
problems over time (i.e., the day following the termination of the intervention, and again
at 5 and 10 days post-intervention).
Domain, objective, and transfer and maintenance probes were scored for the
percent of accurate responses. The percent of accurate responses included problem
representation (i.e., writing out the appropriate formula, drawing and labeling the shape
69
accurately), and problem solution (i.e., finding the correct answer), and was derived from
the total number of correct responses divided by the total number of problems on an
assignment and multiplied by 100 percent.
Domain probes. The first type of probe, the domain probe, was administered to
students during baseline and after intervention. The domain probes included prerequisite
items as well as items from the district’s middle school curriculum. Each domain probe
consisted of 10 curriculum-based problems on area and perimeter, with items sampled
from each objective, and totaled 42 points. A minimum of two domain probes were given
to students during baseline. A minimum of three domain probes were then given at the
end of the intervention phase, after a participant completed all lessons and reached
criterion (80%) on all objective probes in the intervention. Three parallel versions of the
domain probe were used. See Appendix K for a sample domain probe.
Objective probes. The second type of probe was an objective probe, which
included items related to the objectives covered in a specific lesson. Objective probes
were given only during the intervention phase, at the end of each class session in which
the particular objective was taught. Each objective probe consisted of a variety of
curriculum-based problems on area and perimeter of regular polygons, but only included
concepts and skills covered in a specific lesson. Objective probes totaled 10 - 12 points
each. If a participant met criterion (80%) on the objective probe at the end of the class
period, the next consecutive lesson was administered. If criterion was not met, the same
lesson was administered the following session. Two versions of each objective probe
were used. See Appendix L for a sample objective probe.

70
Prior to the investigation, the domain and objective probes were piloted with a
group of four middle school students with average to above-average academic
achievement. The students involved were from three different middle schools in the same
district. The pilot probes were evaluated for their appropriateness for use with the
district’s middle school population through test-retest reliability measures. Permanent
products (probes) were analyzed as repeated measures of percent of accurate responses
and the percent of items completed on the daily self-monitoring recording sheet. In
addition, each student involved in the pilot was individually interviewed following the
probe administration for feedback on improving the directions, nature of the questions,
and physical layout of the probe. See Appendix M for the pilot interview.
Transfer and maintenance probes. Each participant was assessed on his or her
ability to generalize, or transfer, the knowledge learned on similar mathematics tasks that
involve different story lines than those addressed in the instructional set (near transfer) as
well as more complex and different math problems than those targeted for instruction (far
transfer). Participants were also assessed on their ability to maintain their new skills over
time. A transfer and maintenance probe was administered twice during baseline, and then
three times following the end of the intervention. The first post-intervention transfer and
maintenance probe was administered on the school day immediately following the final
intervention session. The transfer and maintenance probe was administered 5 and 10
school days after the end of the intervention phase (see Appendix M), to establish
participants’ ability to maintain and transfer skills after one school week and again after
two school weeks.
71
Within the transfer and maintenance probe, the maintenance task consisted of an
item taken directly from the Objective 4: Constant Perimeter, Changing Area lesson, an
item used in practice opportunities during the intervention phase. Participants were
required to identify the length, width, and perimeter of a rectangle whose area was the
largest area (196 sq. in.) that could be made for any rectangle with the same perimeter.
The near transfer task was as follows: students were presented with a rectangle
with the length and width labeled. The directions were as follows: “Draw another flag
with the same area, but different lengths and widths.” To complete the task, participants
were expected to find the area, and identify the dimensions of another rectangle with the
same area. This task was similar in nature to the Objective 4: Constant Area, Changing
Perimeter lesson, but was presented in a format unfamiliar to the participants.
The far transfer task consisted of a multi-step problem involving drawing a
rectangular garden with a sidewalk surrounding the garden. The participants were given
the dimensions of the garden, and the width of the sidewalk. Each participant was asked
to calculate the area of the garden, the area of the sidewalk, the perimeter of the garden,
and the perimeter of the garden plus the sidewalk.
Social Validity Measure
Social validity measures ensure that research is considered by consumers to be
useful (Lloyd & Heubusch, 1996). The participants completed a social validity measure
at the end of the study. The investigator-developed instrument asked about the
appropriateness of the intervention, and the perceptions of students and the instructor
about its use (see Appendix O). The instrument was developed from previous research
72
using similar social validity measures (Butler, et al., 2003; Calhoon & Fuchs, 2003;
Maccini, 1998).
The social validity measure was given to each participant with an explanation that
it was the final piece of the project, and its purpose was to find out what each participant
thought of the study. The measure was not read to the participants, but if a participant had
asked for clarification, an explanation was given. Participants responded to 10 questions
on a five-point Likert scale concerning the effectiveness of various aspects of the
intervention. Participants indicated a score of “1” if they strongly disagreed with a
statement, “2” if they disagreed, “3” if they felt neutral, “4” if they agreed, and “5” if
they strongly agreed. All of the questions were positively phrased so that a “1” always
represented a negative opinion of the effectiveness of components of the intervention,
while a “5” always represented a positive opinion. Additionally, participants responded to
six open-ended questions.
Experimental Design and Study Procedures
The current research study employed a single-subject multiple probe across two
participants, replicated by two participants design (Horner & Baer, 1978; Kennedy, 2005;
Tawney & Gast, 1984), to evaluate the effects of teaching secondary students a
contextualized instructional package with self-monitoring techniques to solve geometry
problems. The single-subject design was used given its importance in developing
evidence-based practice in special education. According to Horner and colleagues, single-
subject designs provide an opportunity for researchers to test and identify an educational
or behavioral intervention as evidence-based practice. Using the multiple probe technique
was chosen due to its ability to allow the researcher to conduct infrequent probes of
73
baseline behavior rather than continuous baseline measures in instances when continuous
measurement may be reactive or impractical, or when an assumption of baseline stability
can be made in advance of the study (Horner & Baer, 1978).
In the current study, collecting continuous baseline data was both impractical and
unnecessary. Since students did not receive instruction in area and perimeter during the
baseline phase, if they not demonstrate mastery of the skills at pretest, no threat could be
assumed of an unstable baseline due to exposure to those or similar topics. Additionally,
collecting infrequent probes rather than continuous baseline data allowed me to collect
data on a greater number of participants, and was necessary due to time restrictions
imposed by the school schedule (i.e., I had only one hour per day to work with
participants). The study followed the following order: baseline phase, intervention phase,
post-intervention domain probe administration, and transfer and maintenance probe
administration. See Figure 1 for the study procedures and timeline.
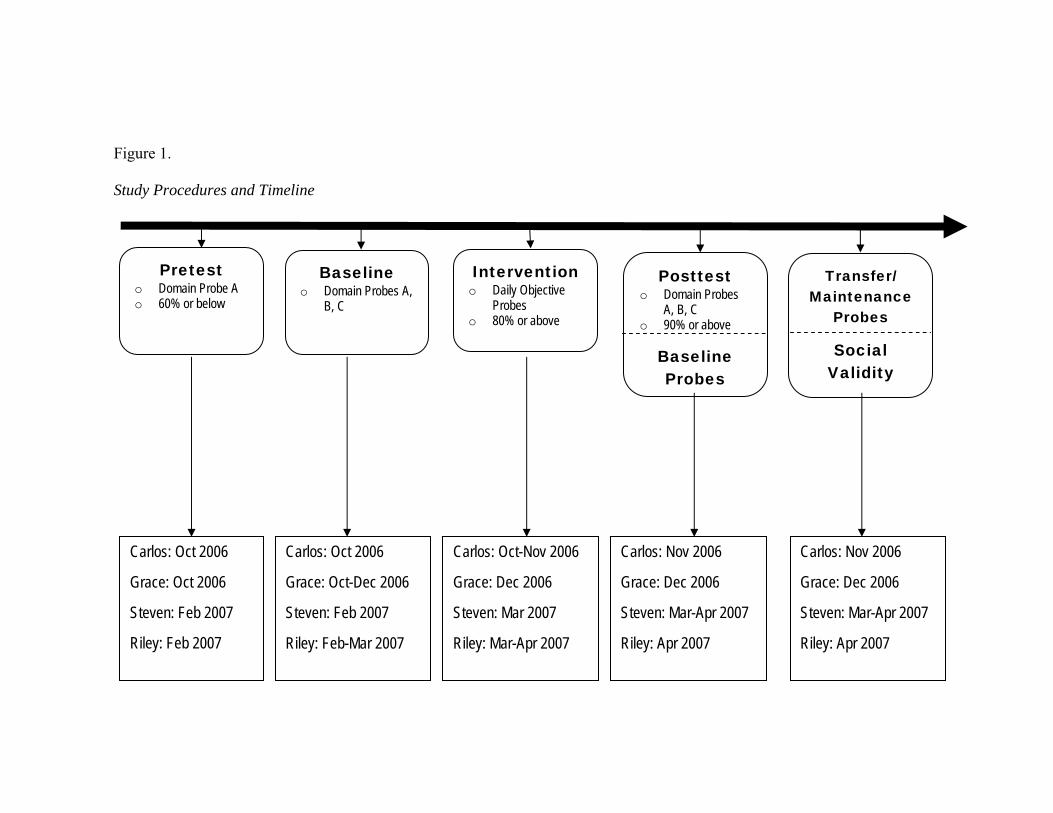
Figure 1. Study Procedures and Timeline
Pretest o Domain Probe A o 60% or below
Baseline o Domain Probes A,
B, C
Intervention o Daily Objective
Probes o 80% or above
Posttest o Domain Probes
A, B, C o 90% or above
Baseline Probes
Transfer/ Maintenance
Probes
Social Validity
Carlos: Oct 2006 Grace: Oct 2006 Steven: Feb 2007 Riley: Feb 2007
Carlos: Nov 2006 Grace: Dec 2006 Steven: Mar-Apr 2007 Riley: Apr 2007
Carlos: Oct-Nov 2006 Grace: Dec 2006 Steven: Mar 2007 Riley: Mar-Apr 2007
Carlos: Oct 2006 Grace: Oct-Dec 2006 Steven: Feb 2007 Riley: Feb-Mar 2007
Carlos: Nov 2006 Grace: Dec 2006 Steven: Mar-Apr 2007 Riley: Apr 2007
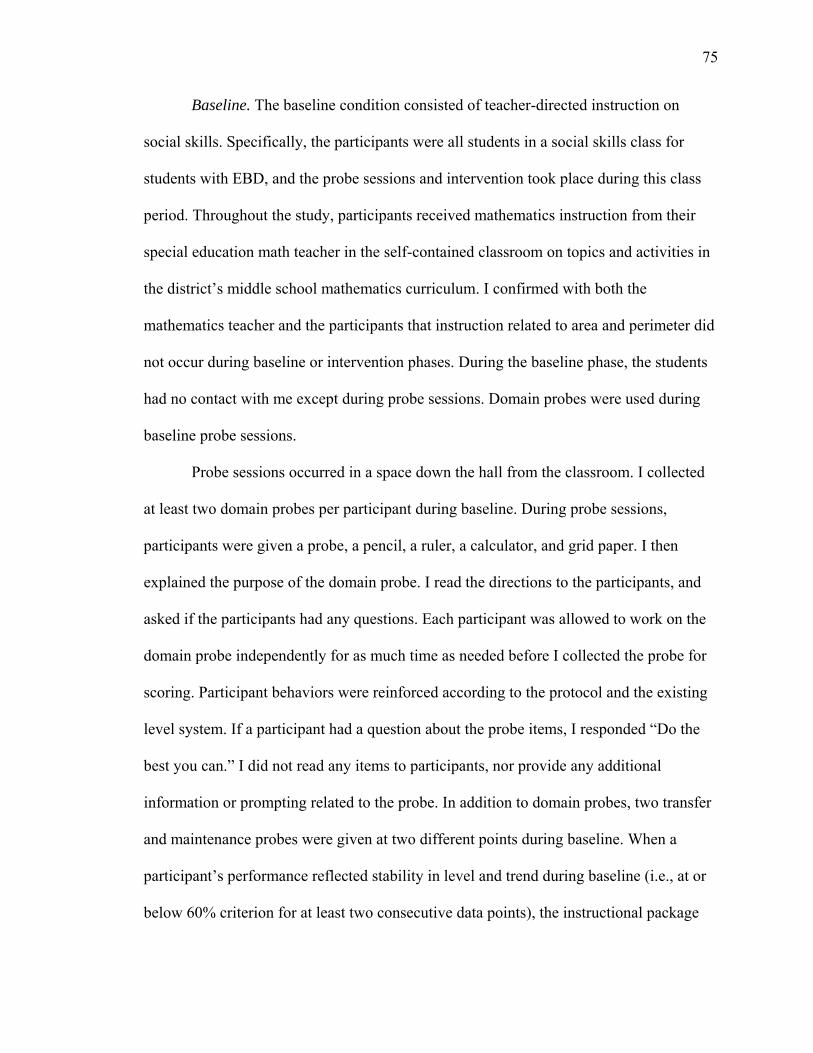
75
Baseline. The baseline condition consisted of teacher-directed instruction on
social skills. Specifically, the participants were all students in a social skills class for
students with EBD, and the probe sessions and intervention took place during this class
period. Throughout the study, participants received mathematics instruction from their
special education math teacher in the self-contained classroom on topics and activities in
the district’s middle school mathematics curriculum. I confirmed with both the
mathematics teacher and the participants that instruction related to area and perimeter did
not occur during baseline or intervention phases. During the baseline phase, the students
had no contact with me except during probe sessions. Domain probes were used during
baseline probe sessions.
Probe sessions occurred in a space down the hall from the classroom. I collected
at least two domain probes per participant during baseline. During probe sessions,
participants were given a probe, a pencil, a ruler, a calculator, and grid paper. I then
explained the purpose of the domain probe. I read the directions to the participants, and
asked if the participants had any questions. Each participant was allowed to work on the
domain probe independently for as much time as needed before I collected the probe for
scoring. Participant behaviors were reinforced according to the protocol and the existing
level system. If a participant had a question about the probe items, I responded “Do the
best you can.” I did not read any items to participants, nor provide any additional
information or prompting related to the probe. In addition to domain probes, two transfer
and maintenance probes were given at two different points during baseline. When a
participant’s performance reflected stability in level and trend during baseline (i.e., at or
below 60% criterion for at least two consecutive data points), the instructional package
76
was introduced to the first participant. Participants in the baseline condition engaged in
social skills activities, and were presented with no math instruction during that period.
Intervention. The introduction of the independent variable was staggered, so that
each participant received the intervention, after the preceding participant completed the
intervention phase. Participants’ out-of-class time was monitored, and sessions were
scheduled so that all participants missed the same amount of the social skills class. Since
instruction took place during the students’ social skills class, no participants missed
regular math instruction.
In keeping with Rosenshine and Stevens’s (1986) recommendations, participants
advanced to the next lesson when they obtained 80% accuracy on an objective probe
during a lesson. Participants advanced to the next objective set when they reached 80%
mastery on all objective probes for an objective set. Due to scheduling issues, a new
participant began the intervention phase when the previous participant completed the
intervention phase.
The intervention was taught to participants in a separate room, while the other
participants continued in the baseline condition. When participants reached criterion of
90% mastery (Rosenshine & Stevens, 1986) on three domain probes (Tawney & Gast,
1984) in the post-intervention phase, the study ended for that participant. Domain probes
were administered once a participant reached criterion of 80% on all objective probes and
completed all objective lessons. Domain probes were administered during the three class
periods following the end of the intervention phase.
The first session of the intervention phase involved an orientation to the
instructional unit. Participants were told that they would spend the next several weeks
77
learning area and perimeter of squares and rectangles. They were also told that they
would learn a self-monitoring technique designed to help them monitor their own
academic progress and behavior. Participants were introduced to cue cards and the use of
manipulatives.
The first lesson involved introducing the participants to the instructional unit and
teaching the self-monitoring procedures. The remaining lessons were based on four
instructional objective sets. The first and second instructional objective sets involved pre-
requisite objectives, including reviewing measuring procedures and finding the perimeter
and area using non-standard units. The third objective set involved pre-requisite
objectives, including measuring perimeter and area using customary units and
implementing formulae to find area and perimeter. The fourth objective set included
sixth, seventh, and eighth grade concepts and skills that involved investigating the
relationships among length, width, area, and perimeter of rectangles and squares.
For each instructional session, I provided an advance organizer, reviewed
participants’ previous knowledge, provided a rationale for the lesson’s objective, and
introduced the lesson’s topic. I then modeled the concept and/or skill being introduced,
and introduced vocabulary related to the topic. Following the demonstration, I provided
participants with guided practice of three to four problem examples. When participants
demonstrated understanding of the concept by correctly completing at least three
problems with minimal assistance from me, I provided participants with objective probes
with 10-12 problems for independent practice. I did not read any questions or provide any
prompting during the objective probe. Following independent practice, I reviewed the

78
day’s lesson with participants, as well as the task sheets and self-monitoring checklists. I
connected the day’s lesson to the next lesson’s objective.
Adaptation to intervention during study. An additional instructional procedure
was added to the intervention after the first two participants completed their first post-
intervention domain probe session. Both Carlos and Grace performed below 90%
criterion on at least one domain probe following the end of the intervention phase. Carlos
did not meet criterion on the domain probe immediately following the intervention. Grace
did not meet criterion on the second domain probe, which was administered after a
weekend and a school holiday. Due to the extended break from school, there was a four-
day lag between the first and second post-intervention domain probe sessions for Grace.
After consulting with committee members, I added a booster session (Montague, 2004) to
the intervention procedures. The booster session was administered after the first post-test
session for Carlos and Grace. Since it became evident that the booster session was
necessary after the first two participants, in the replication (Steven and Riley), the booster
session was administered in the first session following the end of the intervention.
Booster sessions were the same for each student; I reviewed each objective, referring to
the cue card and providing two examples of each objective covered. No objective probe
was administered during the booster session. In addition, the participants were allowed to
ask for clarification or review of any specific topic. Following the booster session, at least
two additional domain probes were administered. See Appendix P for sample problems
practiced during the booster session.
79
Interrater Reliability and Fidelity of Treatment
Interrater reliability. Interrater reliability was obtained on 100 percent of the
domain probes. A trained instructional assistant and I independently scored each probe.
The percentage of scorer agreement was calculated by dividing the number of agreements
of correct responses by the number of disagreements and agreements and multiplying the
result by 100 percent (Kennedy, 2005). I trained the instructional assistant to score the
permanent products to a criterion of 100 percent agreement. Reliability was 100% across
all domain probes for all students.
Fidelity of treatment. Fidelity of treatment observations were conducted by
independent observers via a checklist that incorporated the components of the
intervention (See Appendix O). Prior to the investigation, the observers were trained on
the components of the intervention, and provided the fidelity checklist. Training
consisted of an explanation of the instructional procedures, and review of the components
of the fidelity checklist. Next, I conducted two mock instructional sessions, where I
followed the lesson script and the two observers were instructed to check either a 1 (if the
component is present) or a 0 (if the component is missing) for each component on the
fidelity checklist during the session. I compared the two checklists, and reviewed any
discrepancies. Observers maintained 100% agreement over the mock sessions.
Fidelity observations were conducted for 33% of the instructional and probe
sessions. The independent observer sat in the room with the instructor and the participant.
The observer sat in a location that allowed him to see each component of the intervention,
and did not speak to the child or the instructor during the intervention. The fidelity of
treatment for each session was calculated by dividing the number of components present
80
(as recorded on the checklist) during the observation by the number of total components
on the checklist and multiplying the quotient by 100 percent. The fidelity of treatment for
the study was obtained by adding the percentages for each session and dividing the sum
by the number of observations. Treatment fidelity for the study was 100%.
Interobserver agreement was obtained one time for every three observations of the
first independent observer. During these sessions, a second independent observer
conducted fidelity of treatment (via the checklist) at the same time as the first observer.
The second observer sat in a location that allowed her to see each component of the
intervention, but did not allow her to see how the first observer marked the checklist.
After each observation, the first independent observers added completed checklists to a
notebook, and reported any missing components to me. Interobserver agreement on the
fidelity of treatment was calculated by dividing the number of agreements on the
checklists from each independent observer by the total number of items on the checklist
and multiplying the quotient by 100 percent. Interobserver agreement for the study was
100%.
Data Analysis Procedures
In single-subject research, experimental control is established when visual
analysis of the data demonstrates a functional relationship between independent and
dependent variables. A functional relationship must be established where systematic
manipulation of an independent variable has a consistent effect on a dependent variable
(Kennedy, 2005). In the present study, a functional relationship was determined based on
the improvement of participants’ mathematic performance, and whether the change was
caused by the treatment. Visual analysis of graphed data was used to determine the:
81
(a) stability of the baseline conditions; (b) rapidity of changes in the variables between
conditions (baseline and post-intervention); (c) changes in the mean performance and
changes in pattern of individual data points between conditions; (d) variability in the
level and/or trend within and across conditions; and (e) maintenance of changes across
conditions (Kennedy, 2005).
82
Chapter 4: Results
In this chapter, I report descriptive information on each participant’s behavior
during the intervention, as recommended by Tawney and Gast (1984). I also report the
results relative to each of the research questions posed in Chapter 1. The research
questions included the following:
1. Does a contextualized instructional package to teach the geometric
concepts of area and perimeter result in increases in the mathematics
accuracy of secondary students with emotional and behavioral disorders
(EBD)?
2. Do secondary students with EBD maintain performance on geometry-
related tasks mastered through the use of a contextualized instructional
package over time?
3. Do secondary students with EBD transfer performance on geometry-
related tasks learned through the use of a contextualized instructional
package to mathematics problems with similar contexts?
4. Do secondary students with EBD transfer performance on geometry
related tasks mastered through the use of a contextualized instructional
package to more complex area and perimeter problems?
Finally, I report results from social validity measures across participants.
83
Participant Behavior During Instruction
Tawney and Gast (1984) recommended providing a general description of
participant behavior in the results section. For students with EBD, recognizing and
understanding student behavior is critical to successful instruction. The following section
provides a synopsis of each participant’s disposition and behaviors during instructional
sessions.
Carlos
During the intervention phase, Carlos appeared eager for individual attention. He
came willingly each day, and at the end of the intervention phase, he was visibly upset
about terminating our sessions. Several of his classroom teachers reported improved
behavior during the intervention period, and that his behavior declined after we ended the
intervention.
While Carlos appeared enthusiastic about working with me, his behavior toward
the actual instruction varied over the course of the intervention. During the initial
sessions, Carlos was eager and interested. During the second session, which dealt with
ordering quadrilaterals by perimeter, he exclaimed, “I like doing this!”
In more challenging sessions, Carlos was reluctant to offer his own responses to
math-related questions, and often complained about being tired. During these sessions, he
also engaged in negative self-talk, making statements like, “I’m stupid!” and “I can’t do
this – I forgot!” After encouragement and redirection by me (e.g., I reminded him how
well did throughout all of the sessions to that point), he was able to complete the lessons
and objective probes. He appeared to lack confidence in his own abilities, as evidenced
by his hesitation to attempt new and challenging tasks, and avoidance behaviors he
84
exhibited during challenging activities (i.e., stating that he was tired, putting his head
down on the desk, working slowly, and complaining that he couldn’t do the work).
During demonstration and guided practice activities, which involved interaction with me,
Carlos appeared much more interested in the tasks than during independent practice
activities, when he was required to work on his own. Despite repeated encouragement by
me that the objective and domain probes were not related to his schoolwork, and that he
wouldn’t receive a grade for them, Carlos engaged in negative self-talk and avoidance
behaviors during the probes. Carlos consistently worked slowly on objective and domain
probes. When he demonstrated success on objective probes (i.e., scoring at or above
80%) during an instructional session, he appeared encouraged, and his demeanor quickly
became more upbeat and relaxed. Carlos appeared eager to complete the self-monitoring
checklist at the end of each session.
Grace
Grace came to each session extremely animated and talkative. She was
enthusiastic throughout each session. Grace often became distracted by a variety of
people, occurrences, or thoughts: people walking by the room, a song or thought that
entered her mind, or a problem she read that reminded her of a story about past
experience. Despite these distractions, Grace was very effective at redirecting herself,
generally commenting, “I’m getting off-task,” or “Sorry, I need to refocus.” Grace
worked very quickly during each session, and performed consistently on objective
probes. She was enthusiastic about completing the self-monitoring checklist, and cheered
for herself when she calculated the percentage of correct responses each day.
85
Steven
Steven initially appeared hesitant about working with me. Prior to beginning the
intervention, he remarked, “I’m not good at math, why should I work with you?” After
completing the pretest, he commented, “ ‘Pry-meter’ – I don’t even know what ‘pry-
meter’ is!” During the introductory session, as I did with all participants, I explained that
he would learn about area and perimeter, and that he would have a better understanding
of these concepts by the end of our time working together. After our initial sessions, he
came to each session and appeared enthusiastic and eager to learn. If we were unable to
meet due to the school schedule or another school-related activity, he complained that he
needed to work with me instead. Steven appeared to work hard on all activities and
probes, and seemed fully invested in learning about area and perimeter.
Like Carlos, Steven’s classroom teachers reported that his behaviors improved
during the intervention period. At the end of the intervention period, Steven complained
on several occasions that he didn’t want me to stop working with him. At the conclusion
of the intervention, one of his classroom teachers left school on maternity leave. He
appeared agitated that our sessions were coming to an end, and complained that
“everyone [was] leaving [him].” I explained to him that I would be in the building for
several more weeks and that I would stop by and visit him on occasion. This appeared to
reassure him.
Riley
Riley appeared to have a positive attitude about working with me and appeared
willing to learn throughout each session of the intervention. She appeared to particularly
enjoy working with the manipulative devices, and at the beginning of many sessions, she
86
asked about which manipulatives we would be using. Riley demonstrated strong mental
basic math skills, and often converted her responses from inches to feet, although it
wasn’t a part of the instruction. On one occasion, Riley remarked, “I love math on
Fridays!”
Riley often brought toys and other small objects (pencil sharpener, lip balm) to
sessions, and she occasionally pulled them out and played with them. I reminded her that
she needed to keep the toys and objects in the desk until the session was over. She
complied without complaint each time.
Two of the sessions (Session 8 and 9) were conducted at Riley’s home because
they fell during the school Spring Break. These two sessions were conducted at Riley’s
dining room table, with the same materials and manipulatives used at school. No other
individuals were around, and the space was clear and neat during these sessions. No
changes in behavior or performance were noted during these sessions.
Results on Academic Outcomes
In this section, I report results on academic outcomes as they relate to each
research question. First, I provide the research question, and then I present each
participant’s results, including mean percent accuracy increases from baseline to post-
intervention, and the range of scores for each participant. Results are presented
graphically for each participant for percent accuracy on domain probes, which were
administered during baseline and post-intervention phases, as well as percent accuracy on
daily objective probes, which were administered during the intervention phase.
87
Research Question 1
Research Question 1 was: Does a contextualized instructional package to teach
the geometric concepts of area and perimeter result in increases in the mathematics
accuracy of secondary students with emotional and behavioral disorders (EBD)? As
noted in Chapter 3, increases in mathematics accuracy were measured by performance on
domain and objective probes. All participants improved their mean percent accuracy from
baseline to post-intervention on the domain probes, and each participant met criterion of
90%. Figure 2 displays the results of percent accuracy on domain probes during baseline
and post-intervention phases for the first two participants (i.e., Carlos and Grace). Figure
3 displays the results of percent accuracy on domain probes during baseline and post-
intervention phases for participants in the replication (i.e., Steven and Riley). Visual
analysis of both graphs reveals marked changes in level from baseline to post-
intervention for all participants. Further, there is low variability in data points in both the
baseline and post-intervention phases, reflecting stable data for each participant. Carlos
increased 91 percentage points in mean percent accuracy, Grace increased 72 percentage
points, Steven increased 83 percentage points, and Riley increased 67 percentage points.
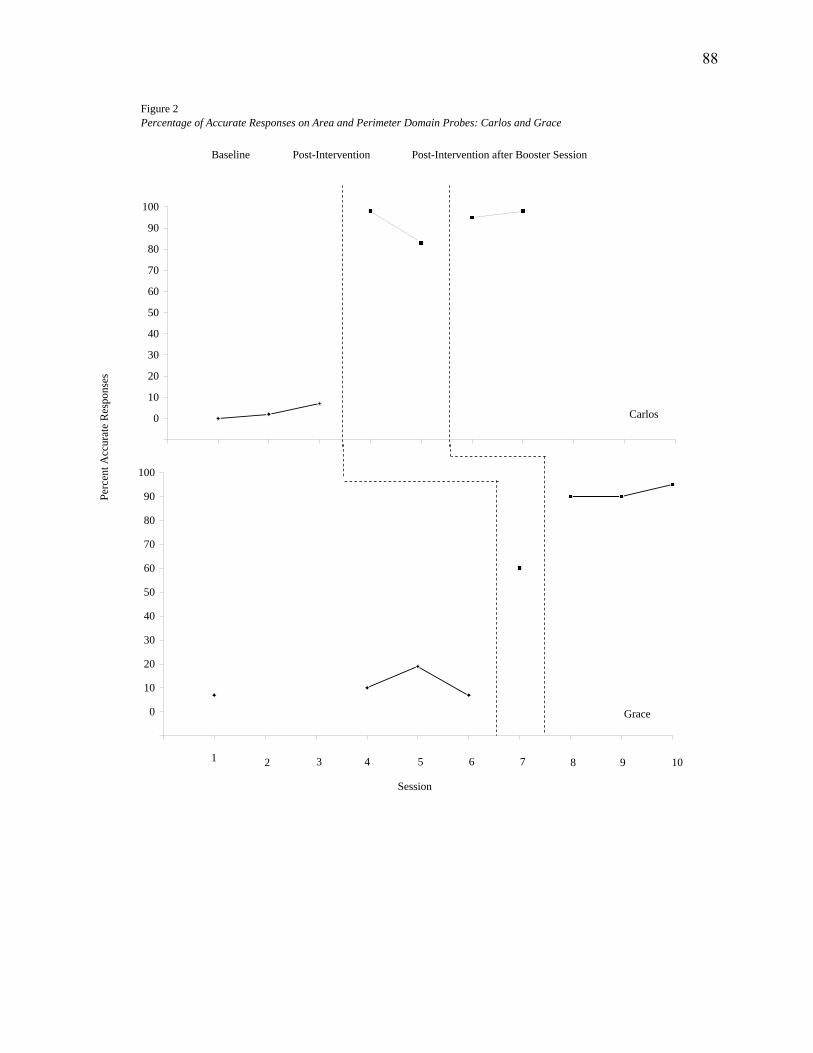
-10
0
10
20
30
40
50
60
70
80
90
100
Post-Intervention
Carlos
Post-Intervention after Booster SessionBaseline
-10
0
10
20
30
40
50
60
70
80
90
100
Grace
Figure 2Percentage of Accurate Responses on Area and Perimeter Domain Probes: Carlos and Grace
Perc
ent A
ccur
ate
Res
pons
es
Session
5 6 8 102 3 41 7 9
88
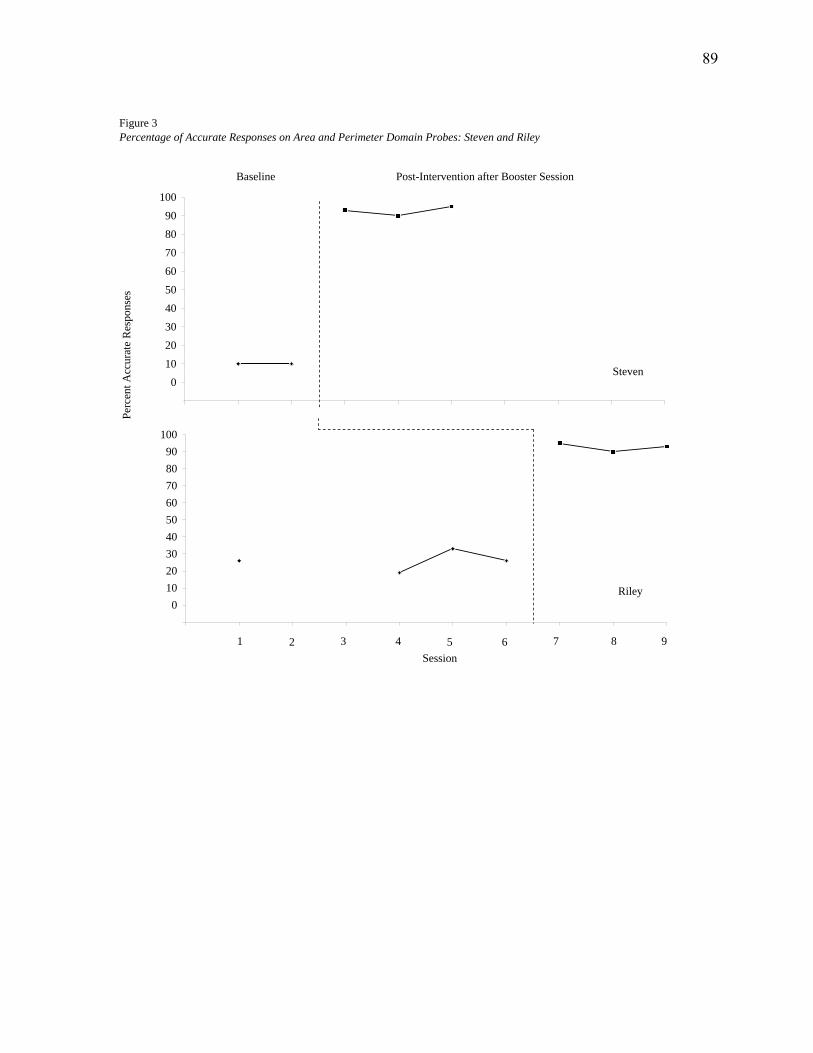
Figure 3 Percentage of Accurate Responses on Area and Perimeter Domain Probes: Steven and Riley
-100
102030405060708090
100
Steven
Baseline Post-Intervention after Booster Session
-100
102030405060708090
100
Session
Riley
2 3 4 5 61 7 8 9
Perc
ent A
ccur
ate
Res
pons
es
89
90
Carlos. During baseline, Carlos earned a mean score of 3% on domain probes, (r=
0% - 7%). Following the intervention, he earned a mean score of 94% (r = 83% (prior to
booster session) - 98%).
Grace. During baseline, Grace earned a mean score of 11% (r = 7% - 19%).
Following the intervention, she earned a mean score of 83% (r = 60% (prior to booster
session) - 95%).
Steven. During baseline, Steven earned a mean score of 10% on domain probes,
with both baseline scores equaling 10%. Following the intervention, he earned a mean
score of 93% (r = 90% - 95%).
Riley. During baseline, Riley earned a mean score of 26% (r =19% - 33%).
Following the intervention, she earned a mean score of 93% (r = 90% - 95%).
An error analysis of the post-intervention domain probes revealed that each
participant earned point deductions for inappropriate or missing labels (i.e. labeling
solution with “inches” or “inches2”). Across four post-intervention domain probes, Carlos
missed 3 points due to mislabeling. Across four post-intervention domain probes, Grace
missed 6 points due to mislabeling. Across three probes, Steven missed 2 points due to
mislabeling. Finally, Riley missed 4 points due to mislabeling on three probes.
Daily objective probes were administered throughout the intervention phase. In
order to advance a lesson, participants were required to earn at least 80% criterion on the
lesson’s objective probe. Figures 4 and 5 display the results of the objective probes for
each participant. Visual analysis of these graphs reveals stability across all data points for
Grace, Steven, and Riley; stability was achieved after two review sessions for Carlos. In
addition, the graphs demonstrate high levels of performance across all participants.
91
Carlos was the only participant that required review sessions to meet 80% criterion on
objective probes. He required one review session following the Objective 1: Ordering by
Area lesson, where he earned 70% initially, then 100% after the review session (see
Figure 4, data points 2 and 3). He also required one review session following Objective 2:
Measuring Perimeter Using Non-Standard Units lesson (63% initially; 100% following
review; see Figure 4, data points 4 and 5). Both of these lessons were prerequisite skills,
and were administered during the first week of the intervention. For the remaining
sessions, Carlos earned a mean score of 96.6% on objective probes (r = 90% - 100%).
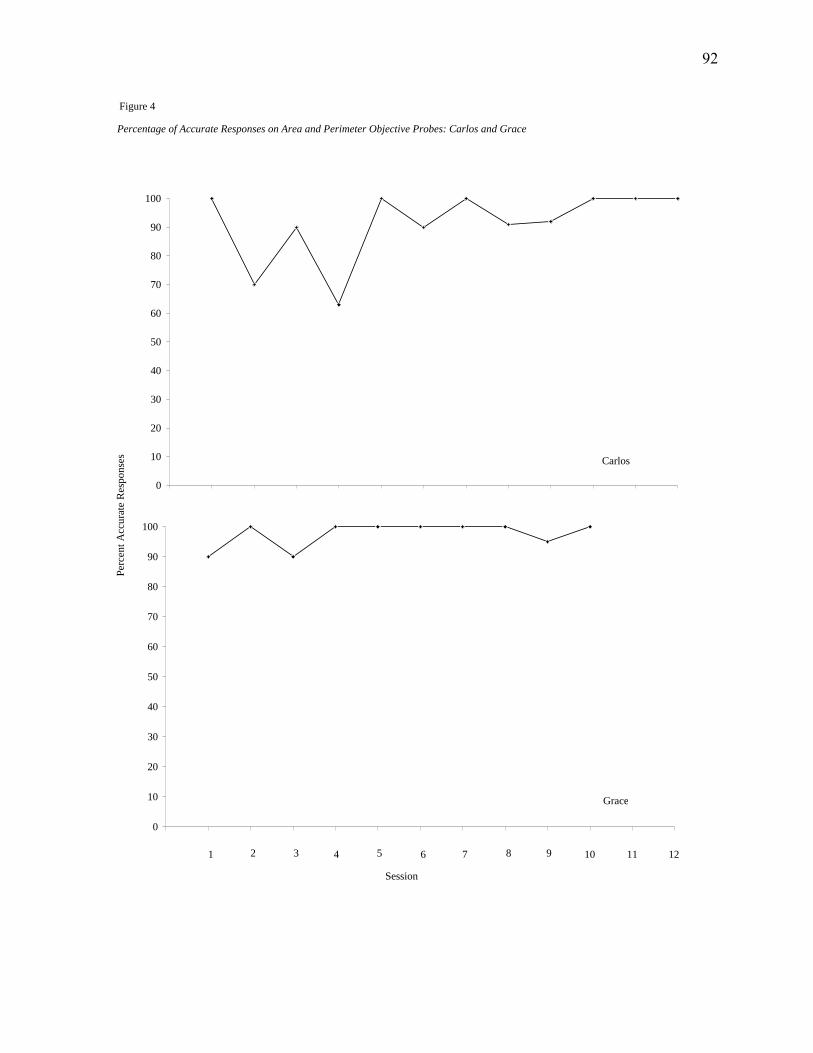
Figure 4
Percentage of Accurate Responses on Area and Perimeter Objective Probes: Carlos and Grace
0
10
20
30
40
50
60
70
80
90
100
Carlos
0
10
20
30
40
50
60
70
80
90
100
Grace
Perc
ent A
ccur
ate
Res
pons
es
2 3 4 5 61 7 8 9
Session
10 11 12
92
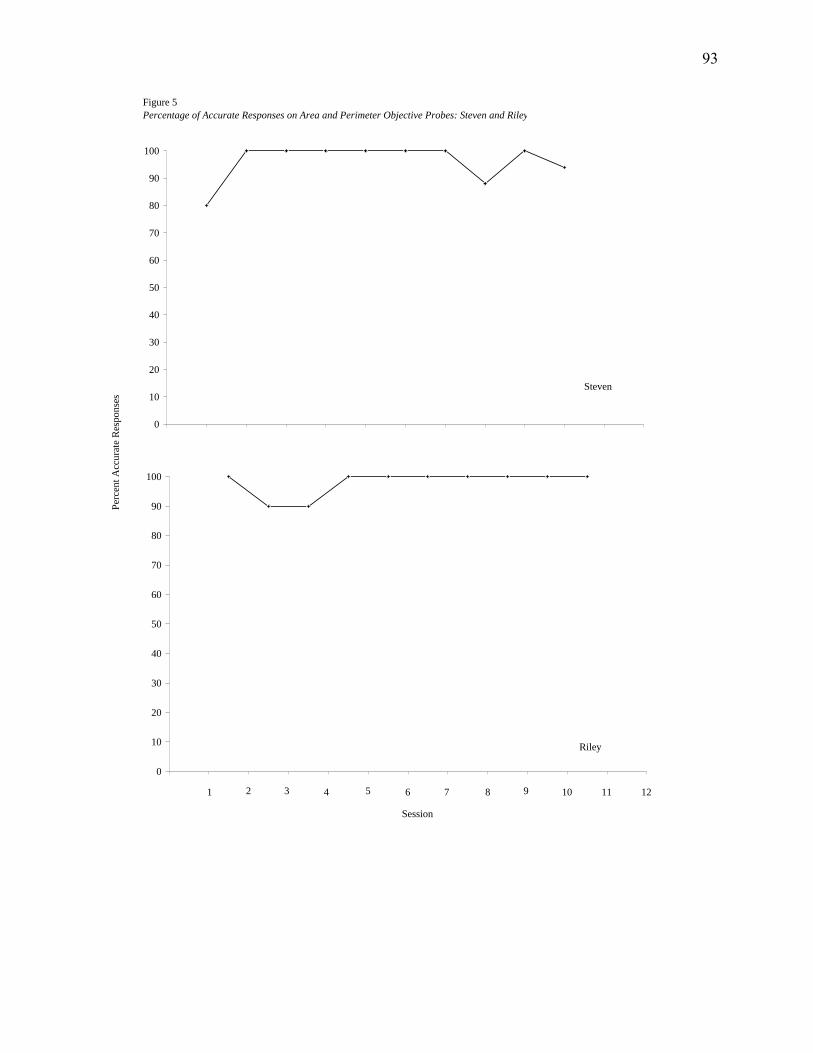
0
10
20
30
40
50
60
70
80
90
100
Steven
0
10
20
30
40
50
60
70
80
90
100
Riley
Perc
ent A
ccur
ate
Res
pons
es
2 3 4 5 61 7 8 9 10 11 12
Session
Figure 5 Percentage of Accurate Responses on Area and Perimeter Objective Probes: Steven and Riley
93
94
The other three participants demonstrated high levels of performance on
objective probes throughout the intervention. Grace earned a mean score of 97.5% on
objective probes (r = 90% - 100%). Steven earned a mean score of 96.2% on objective
probes (r = 80% - 100%). Riley earned a mean score of 98% on objective probes (r =
90% - 100%).
95
Research Question 2
Research Question 2 was: Do secondary students with EBD maintain performance
on geometry-related tasks mastered through the use of a contextualized instructional
package over time? The maintenance task consisted of a problem pulled from Objective
4: Constant Perimeter, Changing Area. Participants were asked to identify the length,
width, and perimeter of a rectangle with a given area, which was the largest area of any
rectangle with the same perimeter. Two participants showed no improvement on the
maintenance measure from baseline to post-intervention. Carlos earned a mean score of
0% on the maintenance task during baseline sessions. No post-intervention results were
available for Carlos because he refused to attempt the maintenance task during each of
the post-intervention transfer and maintenance probe sessions. Grace earned a mean score
of 0% on the maintenance task during baseline sessions. She earned a mean score of 0%
on the maintenance task during post-intervention transfer and maintenance probe
sessions.
Two participants showed improvement on the maintenance measure from baseline
to post-intervention. Steven earned a mean score of 0% on the maintenance task during
baseline sessions. He earned a mean score of 100% on the maintenance task during post-
intervention transfer and maintenance probe sessions. Riley earned a mean score of 0%
on the maintenance task during baseline sessions. She earned a mean score of 67% during
post-intervention transfer and maintenance probe sessions.
Research Question 3
Research Question 3 was: Do secondary students with EBD transfer performance
on geometry-related tasks learned through the use of a contextualized instructional
96
package to mathematics problems with similar contexts? The near transfer task consisted
of using given lengths and widths of a rectangle to determine the area, and identify
another rectangle with the same area, but different lengths and widths. This problem is
similar in nature to tasks completed during the intervention, but participants were not
explicitly taught using the exact wording or steps required to solve this particular
problem. Three participants showed no improvement on the near transfer measure from
baseline to post-intervention. Carlos earned a mean score of 0% on the near transfer task
during baseline sessions. No post-intervention results are available for Carlos because he
refused to attempt the near transfer task during each of the post-intervention transfer and
maintenance probe sessions. Grace and Riley each earned a mean score of 0% on the near
transfer task during baseline sessions. They each earned a mean score 0% on the near
transfer task during post-intervention transfer and maintenance probe sessions.
One participant showed improvement on the near transfer measure from baseline
to post-intervention. Steven earned a mean score of 0% on the near transfer task during
baseline sessions. He earned a mean score of 94% on the post-intervention transfer and
maintenance probe sessions, for an increase of 94 percentage points.
Research Question 4
Research Question 4 was: Do secondary students with EBD transfer performance
on geometry related tasks mastered through the use of a contextualized instructional
package to more complex area and perimeter problems? The far transfer task consisted of
a multi-step problem, which included using grid paper to draw and label the dimensions
of a rectangular garden and sidewalk lining the perimeter of the garden. Participants were
then required to find the area of the garden, the area of the sidewalk, the perimeter of the
97
garden, and the perimeter of the garden plus the sidewalk. One participant showed no
improvement on the far transfer measure. Carlos earned a mean score of 0% on the far
transfer task during baseline sessions. No post-intervention results are available for
Carlos because he refused to attempt the far transfer task during each of the probe
sessions.
Three participants demonstrated improvements on the far transfer measure from
baseline to post-intervention. Grace earned a mean score of 25% on the far transfer task
during baseline sessions. She earned a mean score of 39% during the post-intervention
transfer and maintenance probe sessions, for an increase of 14 percentage points. Grace
was able to accurately draw the garden and the sidewalk and calculate the area and
perimeter of the garden, but was unable to find the area of the sidewalk or find the
perimeter of the garden plus the sidewalk. Steven earned a mean score of 0% during
baseline. He earned a mean score of 56% during post-intervention transfer and
maintenance probe sessions, for an increase of 56 percentage points. Steven was able to
accurately draw and label the dimensions of the garden, but was unable to accurately
draw or label the dimensions of the sidewalk during each probe session. He was able to
accurately find the area and perimeter of the garden, but was unable to find the area of the
sidewalk or the perimeter of the garden plus the sidewalk. Riley earned a mean score of
0% during baseline sessions. She earned a mean score of 50% during post-intervention
transfer and maintenance probe sessions, for an increase of 50 percentage points. Riley
was able to accurately draw and label the garden, but was unable to accurately draw or
label the dimensions of the sidewalk during each probe session. She was able to
98
accurately calculate the area and perimeter of the garden, but was unable to find the
perimeter of the garden plus the sidewalk.
Results on Behavior Outcomes
Two additional measures were administered during the study. As part of the
intervention package, participants self-monitored their academic performance and
behavior. Additionally, as recommended by Kennedy (2005) and Horner and colleagues
(2005), social validity data were collected to document the practicality and social
importance of the data.
Self-Monitoring
As part of the intervention package, each participant was taught to self-monitor
his or her own academic performance and behavior during each instructional session. At
the end of each session, participants recorded the number of problems on the objective
probe, the number of correct responses, and calculated the percent correct. In addition,
participants rated their own behavior on a set of five behavioral expectations. Since it was
one component of an instructional package, only descriptive data are presented on the
self-monitoring component. Each of the participants completed the self-monitoring
checklist at the end of each session without instructor prompting or input. Additionally,
each participant appeared interested and eager to complete the self-monitoring checklist
each day. Participants regularly cheered for themselves when they calculated the percent
correct.
Social Validity
The average scores on the social validity measure ranged from 4 to 5 (M=4.7;
mode=5; see Table 4). Overall, participants responded that they strongly agreed that the
99
intervention package helped them to understand area and perimeter better (M = 5), and
they would recommend the intervention to others (M = 4.75; r = 4 - 5). They also
responded that they strongly agreed that they feel better about measurement and
geometry skills as a result of using the intervention (M = 5). Finally, they each reported
that they strongly agreed that the self-monitoring checklist helped them to solve area and
perimeter problems and they would recommend its use to other students (M = 4.75; r = 4
- 5).
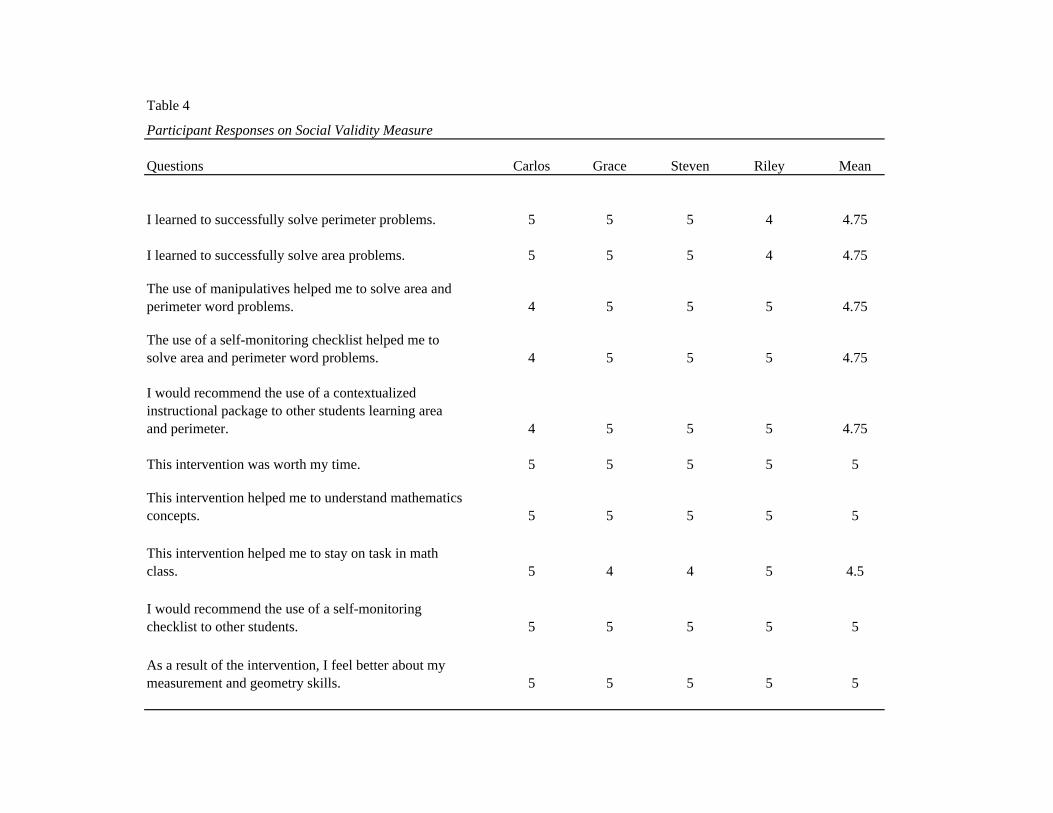
Table 4
Participant Responses on Social Validity Measure
Questions Carlos Grace Steven Riley Mean
5 5 5 4 4.75
5 5 5 4 4.75
4 5 5 5 4.75
4 5 5 5 4.75
4 5 5 5 4.75
5 5 5 5 5
5 5 5 5 5
5 4 4 5 4.5
5 5 5 5 5
5 5 5 5 5
I would recommend the use of a self-monitoring checklist to other students.
As a result of the intervention, I feel better about my measurement and geometry skills.
I would recommend the use of a contextualized instructional package to other students learning area and perimeter.
This intervention was worth my time.
This intervention helped me to understand mathematics concepts.
This intervention helped me to stay on task in math class.
I learned to successfully solve perimeter problems.
I learned to successfully solve area problems.
The use of manipulatives helped me to solve area and perimeter word problems.
The use of a self-monitoring checklist helped me to solve area and perimeter word problems.
101
The participants also responded positively to the intervention in the open-ended
questions. For example, Riley stated she was interested in learning measurement and
geometry skills “…so I could help others, and teach them, too.” Grace reported that
“…this is what I’m best at in math.” Carlos stated, “…if I’m needed, I will be able to
help.” When asked what they liked best about the intervention, participants’ responses
were favorable. Riley reported that she “…I liked using the cubes and the geoboard,” and
Steven reported that he liked the cue card best. When asked what they liked least, the
response was unanimous: the tests.
102
Chapter 5: Discussion
The purpose of this study was to investigate the effectiveness of a contextualized
intervention package on the area and perimeter performance of secondary students with
EBD. Overall, the participants learned to measure and calculate area and perimeter of
squares and rectangles, and demonstrated understanding of the relationship between area
and perimeter. In addition, two of the participants demonstrated some transfer of that
knowledge to solve problems of a similar context and three demonstrated the transfer of
knowledge to problems that were more complex than what they learned during the
intervention.
In the first section of this chapter, I summarize the study and the findings relative
to the importance of the results in relation to current research literature in this area. Next,
I discuss and interpret major findings, as they relate to the original research questions.
Finally, I review limitations of the current study and discuss implications for research and
practice, including the significance of the instructional package for a typical classroom.
Summary of the Study Results Relative to Current Research Literature
To date, few studies have examined mathematics interventions for secondary
students with EBD (Lane, 2004; Mulcahy & Gagnon, 2007; Hodge, Riccomini, Buford,
& Herbst, 2006). Half of the published research that investigated math interventions for
this population included a negligible number of students with EBD, and it was impossible
to determine if the intervention was, in fact, effective for those students (Bottge, 1999;
Bottge, et al., 2001; Bottge, et al., 2002; Bottge, et al., 2003; Butler, et al., 2003; Calhoon
& Fuchs, 2003). Furthermore, previous research on math interventions with secondary
students with EBD focused primarily on basic skills and computation (Cade & Gunter,
103
2002; Carr & Punzo, 1993; Franca, et al., 1990; Hawkins, et al., 1994; McQuillan, et al.,
1996). These earlier investigations did not examine student performance on math skills
and concepts required in middle and high school settings (Lane, 2004) that are essential
to meet national and state standards as required by NCLB (2002), IDEIA (2004), and
NCTM (2000). The current study was designed to address these gaps in the research
literature by applying a package of empirically-based practices to a geometry-related
topic from the middle school curriculum. This study is the first documented investigation
on this topic. It is also unique because half of the participants were female. The paucity of
research on non-computational mathematics interventions for students with EBD is
compounded by the fact that almost no research exists that includes girls in the sample
(Mooney, et al., 2003), and when girls are in the sample, studies do not disaggregate
results on females (Reid, et al., 2004). This fact represents a major shortcoming of the
existing research base.
An exhaustive review of the current literature led to the development of an
instructional package which incorporated the following empirically-based practices:
(a) contextualized instruction (Bottge, 1999; Bottge, et. al., 2001; Bottge, et. al., 2002,
Bottge, et. al., 2003; Hudson & Miller, 2006); (b) self-monitoring of behavior and
academic performance (Carr & Punzo, 1993; Harris, et. al., 2005; McQuillan, et. al.,
1996); (c) the use of manipulative materials (Butler, et. al., 2003; Hudson & Miller,
2006); and (d) the use of a cue card or visual prompt (Butler, et al., 2003; Cade & Gunter,
2002; Carr & Punzo, 1993; Franca, et. al., 1990; Gagnon & Maccini, 2001; Hawkins, et
al., 1994; McQuillan, et. al., 1996). The instructional package was delivered via pre-
requisite and grade-appropriate area and perimeter objectives, which were directly tied to
104
the NCTM Standards, the state curriculum, and the district curriculum. In addition,
instruction was delivered through the explicit teaching model, as recommended by
Rosenshine and Stevens (1986) and Hudson and Miller (2006). Finally, constructivist-
based activities were incorporated throughout the lessons, so participants were afforded
the opportunity to develop their own meanings and understanding of the concepts and
procedures as they proceeded through the lessons.
This study is the first investigation of mathematics for secondary students with
EBD to collect transfer and maintenance data. The studies included in the review of the
literature either did not provide enough information to determine whether the intervention
was transferred or maintained by students with EBD (i.e., Bottge, 1999; Bottge et al.,
2001; Bottge et al., 2002; Bottge et al., 2003; Cade & Gunter, 2002; Franca et al., 1990),
or did not collect transfer or maintenance data at all (i.e., Calhoon & Fuchs, 2003; Butler
et al., 2003; Hawkins et al., 1994).
Emphasis on Non-Computational Math Skills and Concepts
This study was unique because it is the first single-subject study to focus on skills
and concepts related to area and perimeter with a group of secondary students with EBD.
While students with EBD have been involved in group design studies (e.g., Bottge, 1999;
Bottge, et al., 2001; Bottge, et al., 2002; Bottge, et al., 2003) where non-computational
math was taught, disaggregated results were not reported for students with EBD. Non-
computational math skills and concepts are important due to the national push for
instruction in the general education environment (IDEIA, 2004) and high standards and
accountability for all students (NCLB, 2002), and are necessary for daily living and many
professions. Research in this area is critical for developing effective strategies that are
105
accessible by general and special educators. Providing empirically-based practices to
special educators will support their efforts to promote excellence in math among students
with disabilities, particularly students with EBD.
Contextualized Instruction
The instructional package implemented in this study included contextualized
instruction, with activities and examples situated in the context of real-life, meaningful
activities. These activities included measuring and using a formula to calculate the
perimeter and area of a dog pen or skate park, which enabled participants to better
understand the concepts of area and perimeter. The use of contextualized instruction has
previously been demonstrated to be effective on the math performance of remedial
students, typically-developing students, and students with disabilities (Bottge, 1999;
Bottge et al., 2001; Bottge, et. al., 2002; Bottge, et al., 2003).
Self-Monitoring Behavior and Academic Performance
This study was unique because participants self-monitored both their academic
performance as well as their behavior, while engaging in grade-appropriate math tasks.
Previous research (Carr & Punzo, 1993; McQuilla, et al., 1996) included self-monitoring
components, but participants only monitored their academic performance (Carr & Punzo)
or their behavior (McQuillan et al.). This study had participants evaluate both their daily
behavior and their academic performance within the structure of a mathematics
intervention. Participants seemed eager to record and track their own progress; these
results were consistent with Carr and Punzo (1993), who found that students with EBD
were eager to record their scores during a self-monitoring intervention.
106
Use of Manipulative Materials
Similar to research by Butler and colleagues (2003), the present study used
manipulative materials to develop the concepts of area and perimeter. Use of
manipulatives provided opportunities for participants to construct their own meanings as
they worked with the objects. Participants reported enjoying using the manipulatives on
the social validity measure.
Use of Cue Cards
Authors of six previous studies (Butler, et al., 2003; Cade & Gunter, 2002; Carr &
Punzo, 1993; Franca, et al., 1990; Hawkins, et al., 1994; McQuillan, et al., 1996) used
cue cards or worksheets to support instruction. The use of cue cards appeared to be
effective for the participants in the current study, as each referred to the cue cards
regularly to recall a formula, rule, or definition. No frequency data were taken on the use
of cue cards in this study, but one participant responded on the social validity measure
that the thing he liked best about the intervention was using the cue card.
Explicit Teaching Model and Constructivist-based Activities
This study provides a balanced approach to the constructivist-based NCTM
Standards (2000) and a long history of research in special education that supports
teacher-directed instruction for students with disabilities. Constructivist-based activities
were built into the explicit teacher-directed instructional procedures, an empirically-
validated practice for students with disabilities. In this study, the participants used
manipulatives and were provided opportunities to build meaning through the
development of definitions, rules, and formulae as they practiced real-life area and
107
perimeter activities. These constructivist-based activities were incorporated into the
teacher-directed lessons on a daily basis.
The uniqueness of this package is demonstrated in the combination of
empirically-supported components, delivered within a balanced approach integrating
constructivism and explicit instruction (Mulcahy & Gagnon, 2007). The success of the
intervention lies in its ability to address the four research questions.
Interpretation of Findings Relative to Research Questions
The research questions were addressed using a single-case experimental design
with two participants with a replication with two additional participants. This
investigation was able to demonstrate positive results regarding the first research
question, which was related to mathematics accuracy on area and perimeter objectives.
All participants were able to improve accuracy on both domain probes and objective
probes with respect to area and perimeter. The rest of the questions related to transfer and
maintenance, and the results were mixed regarding these questions. The second research
question related to maintenance of performance over time; one participant was able to
consistently maintain performance at 1, 5 and 10 days post-intervention. The third
question related to transferring performance to problems of similar contexts. Two
participants were able to transfer successfully to a task with similar contexts. The fourth
question involved transfer to more complex area and perimeter problems. Three
participants were able to complete some steps of the task, but no participant could
successfully complete the task in its entirety. The results suggest that while participants
were able to demonstrate mastery of mathematics accuracy (90% criterion) on perimeter
and area objectives, their ability to maintain and transfer performance is limited.
108
Research Question 1
Research Question 1 was: Does a contextualized instructional package to teach
the geometric concepts of area and perimeter result in increases in the mathematics
accuracy of secondary students with emotional and behavioral disorders (EBD)? The
success of this intervention on mathematics accuracy is evident in the dramatic changes
each participant experienced from baseline to post-intervention phase on the domain
probes. Carlos, who demonstrated the most significant behavioral concerns throughout
the intervention, increased 90 percentage points from baseline to post-intervention. Grace
increased 72 percentage points from baseline to post-intervention. Steven, whose math
achievement standard score is in the low average range (89), increased 83 percentage
points from baseline to post-intervention. At pretest, Steven was unfamiliar with the word
‘perimeter.’ As noted in Chapter 4, he exclaimed, “I don’t even know what ‘pry-meter’
is!” At post-intervention, Steven scored 95% on two domain probes, which suggests
mastery of assessed skills and concepts (Rosenshine & Stevens, 1986). Riley, the
youngest of the group, had the highest pretest score (14%) and the highest math
achievement standard score (116) of all the participants, yet her current grade was a “D”
in math class. Riley improved 67 percentage points from baseline to post-intervention.
Each of the participants earned above 90% on at least two post-intervention
domain probes. The ability of each of the participants to perform at such high levels both
during instruction and during the post-intervention domain probe sessions suggests that
the instructional package, presented through a balance of explicit instruction and
constructivist activities, positively affected performance on mathematics accuracy.
Furthermore, the consistent changes in outcomes for Carlos and Grace demonstrated the
109
independent variable had a positive impact on the dependent variable, which establishes a
functional relationship (Kennedy, 2005). Replication of these findings with Steven and
Riley demonstrated robustness of the experimental control and generality to other
participants (Kennedy, 2005). The results of this study related to mathematics accuracy
are similar to previous research in which students with EBD demonstrated increased math
accuracy as a result of a teacher-directed intervention (Cade & Gunter, 2002; Carr &
Punzo, 1993; Hawkins et al., 1994; Swain & McLaughlin, 1998).
An error analysis of the post-intervention domain probes revealed many point
deductions due to lack of labeling or mislabeling responses. That is, participants correctly
calculated the solution to a problem, but either neglected to provide a label (i.e., inches),
or wrote an incorrect label. This finding suggests that although the participants were able
to accurately solve the problems, they engaged in what could be characterized as
“careless mistakes,” forgetting to read back through the problems and make sure they had
all the information for their responses, including the correct label. Participants were not
explicitly taught the practice of reviewing problems and checking for labels within this
intervention. Systematic instruction and explicit reinforcement of this practice may be
necessary for students with EBD, and has been documented as a need in previous
research (Mooney, et al., 2003). Perhaps including the steps involved in effective math
problem solution, including reading the problem, showing your work, and labeling your
solution when appropriate, on the cue card would have been beneficial to the participants
in this study (Maccini & Hughes, 2000; Maccini & Ruhl, 2000).
110
Research Question 2
Research Question 2 was: Do secondary students with EBD maintain performance
on geometry-related tasks mastered through the use of a contextualized instructional
package over time? Results of the maintenance measure demonstrate that three
participants were able to maintain some level of performance over time, but for two
participants, the performance did not meet the same level at post-intervention as during
intervention. Steven was able to accurately complete the maintenance task at each of the
transfer and maintenance probe sessions. He appeared to understand and maintain
performance on the relationship between area and perimeter. Steven’s approach to
solving problems on the transfer and maintenance probe was much different than the
approaches of the other participants. He appeared diligent and dedicated to the task, and
displayed determination when confronted with novel and challenging activities. For
example, he stated, “I gotta figure this out!” when he was given the first probe (one day
post-intervention). Although it hasn’t been researched for students with EBD, positive
self-perception and the ability to persist on difficult tasks has been documented to
positively affect academic performance for students with LD (Meltzer et al., 2004).
Steven’s perseverance was different from the approaches displayed by the other
participants, and may have contributed to his ability to problem-solve and complete the
task. Steven’s ability to face new and challenging activities may have been a strength that
was not shared by the other participants.
Grace and Riley were able to maintain performance to some degree. Both Grace
and Riley completed the maintenance task, but made specific errors that did not appear
related to their understanding of the problem. Specifically, both participants identified the
111
dimensions of the rectangle with the smallest area when they were asked to identify the
dimensions of the rectangle with the largest area. This mistake demonstrates an inability
to visualize the rectangle with its given dimensions, a problem often experienced by
typically-developing students (Battista, 2003). The fact that both Grace and Riley were
able to provide a viable solution to the maintenance task demonstrated that they were
familiar with the concept of the relationship between area and perimeter. Despite their
apparent inability to correctly answer this particular problem, Grace and Riley both
accurately completed parts of the far transfer task that involved calculating area and
perimeter of a garden. This was evidence that they could maintain the ability to
accurately calculate area and perimeter over time. With explicit and sustained review of
the objective regarding the relationship between area and perimeter, Grace and Riley may
have experienced increased success with the maintenance measure.
It is unknown whether Carlos could maintain performance over time. Each time
he was given the transfer and maintenance probe, Carlos read the problems and then
refused to attempt to solve them. For example, when presented with the transfer and
maintenance probe at the first session (1 day post-intervention), he studied the paper for
several minutes, and then wrote “I’m stupid by Carlos R” on the probe.
Carlos’ behavior toward the probes was characteristic of his behavior throughout
the intervention, and was confirmed by his classroom teachers. He appeared to lack
confidence in his ability to complete novel and challenging tasks. Failing to complete
difficult tasks is more characteristic of students with EBD (Gunter & Denny, 1998).
Additionally, persistence to task and self-efficacy have strong relationships with
academic achievement for students with LD (Lackaye & Margalit, 2006; Meltzer et al.,
112
2004), and may also be a factor for students with EBD. Carlos may have benefited from a
longer intervention phase with more practice opportunities on a variety of problem types
related to area and perimeter. Explicit and sustained instruction enabled him to
demonstrate mastery of objectives during the intervention, as evidenced by his scores on
the objective probes, and immediately following the intervention phase, as evidenced by
his scores on the domain probes. Providing further explicit and sustained instruction may
have helped to improve Carlos’s self-perception and performance (Meltzer et al., 2004).
Research Question 3
Research Question 3 was: Do secondary students with EBD transfer performance
on geometry-related tasks learned through the use of a contextualized instructional
package to mathematics problems with similar contexts? The near transfer task consisted
of calculating the area of a rectangle with given length and width, then identifying the
dimensions of other rectangles with the same area. Results of the near transfer measure
demonstrate that two participants were able to transfer performance to problems with
similar contexts, while two participants were unable to transfer performance. Steven and
Riley were able to consistently produce unique and accurate responses for the near
transfer task. Steven accurately solved the problem at each probe session. Additionally,
each of his responses was unique, reflecting three different sets of dimensions that equal
the same area (i.e., 18x4, 8x9, 72x1). Riley attempted the problem at 1 day post-
intervention, but was unable to accurately solve it during that probe session. She was able
to accurately solve it at 5 and 10 days post-intervention, and each of her responses was
unique (i.e., 8x9, 36x2).
113
Steven’s and Riley’s persistence to the task may have played a role in their ability
to solve the near transfer task. Steven approached the task with the same determination as
he exhibited toward the maintenance task and all of the other activities related to the
intervention. Riley’s positive attitude toward math and the daily sessions may have
helped her to solve the problem. She attempted every activity throughout the intervention,
and did not appear to be discouraged when she was faced with difficult tasks, even if she
was unable to solve a problem adequately. These behavior characteristics may have
helped the participants to appropriately deal with challenging tasks, even, as in Riley’s
case, they were not totally successful. Lackaye and Margalit (2006) found that students
with LD who believed in themselves put forth greater effort than students who lacked
self-efficacy. Both Steven and Riley appeared to believe that they could solve the
problems, and did not back down in the face of difficult tasks.
Carlos and Grace were unable to transfer their performance to a problem with
similar contexts. Carlos refused to attempt any problems on the transfer and maintenance
probe, and Grace attempted the problem, but was unable to produce an accurate response.
Similar to the maintenance measure, explicit and sustained instruction on a variety of
problem types related to area and perimeter may have led to improved performance on
the near transfer task for Carlos and Grace. Both participants exhibited high levels of
performance on domain and objective probes. Carlos’ performance improved on
objective probes following review sessions, suggesting that he benefited from the
additional instruction. Similarly, both Carlos and Grace required booster sessions after
the intervention phase. Once the booster sessions were administered, each participant
increased their post-intervention domain score to over 90%, providing further evidence
114
that repeated practice and review opportunities are necessary for success among these
students.
Research Question 4
Research Question 4 was: Do secondary students with EBD transfer performance
on geometry related tasks mastered through the use of a contextualized instructional
package to more complex area and perimeter problems? The far transfer task consisted of
a multi-step problem, where several of the steps required accurate information from a
previous step to be accurately completed. The task involved identifying the area and
perimeter of a garden with a surrounding sidewalk with given dimensions. In addition,
participants were required to find the area of the sidewalk, as well as the perimeter of the
garden plus the sidewalk. None of the participants could solve this problem completely.
Each of the three participants who attempted the problem successfully completed some of
the steps.
Although no participants could fully and accurately complete the far transfer task,
the fact that three of the participants were able to accurately solve problems where they
were required to use given dimensions to find area and perimeter, further suggests that
they were able to generalize performance to a degree. The steps that participants were
unable to solve involved problem-solving and critical thinking, typical areas of deficit for
students with disabilities. The participants did not have experience solving the type of
problem presented in the far transfer task, but had experience doing activities similar to
some of the steps. If they had explicit instruction in the type of multi-step problem
presented, as well as critical thinking and problem solving, they may have been more
successful on this task.
115
Summary
This study suggests that a contextualized instructional package for geometry and
measurement can improve the mathematics performance of secondary students with
EBD. Each participant dramatically improved in percent accuracy from baseline to post-
intervention, and each consistently performed at 90% or above on two post-intervention
domain probes, and at 80% or above on objective probe measures throughout the
intervention.
The intervention package yielded mixed results on the transfer and maintenance
measures. The finding suggests that students with EBD require explicit and sustained
instruction of a variety of contexts to be successful in mathematics, which has been
supported by previous research (Mooney, et al., 2003). There are a number of possible
explanations for the limited maintenance and transfer. There is sometimes an assumption
that mastery will lead to maintenance and eventually transfer. This may not be the case
for students with EBD on complex non-computational math tasks. The fear of failure may
prevent students with EBD from attempting an unfamiliar problem, even when they have
the tools to complete it. This point was demonstrated most clearly by Carlos, who refused
to attempt any of the problems because they were unfamiliar. The other participants
attempted the problems, but when a solution did not reflect what they expected, they did
not attempt to find a more accurate solution. Instead, Grace, Steven, and Riley simply
moved on to the next problem.
During instructional sessions, participants in this study experienced many of the
same errors as students without disabilities confront when solving for area and perimeter,
including: (a) confusing perimeter and area (Malloy, 1999); (b) applying the incorrect
116
formula to solve a problem (Malloy); (c) counting pegs instead of spaces on the
geoboard; Barrett, et al., 2003; Battista, 2003); and (d) mislabeling measures such as
labeling feet instead of inches and forgetting to label square inches for area problems
(Chappell & Thompson, 1999).
Perhaps lengthening the intervention phase to spend more time for practice
opportunities and expand the types of problems explicitly taught during the intervention
would have helped improve student performance. In fact, this intervention was much
shorter than typical teacher-mediated interventions for students with EBD, which average
22 days (Pierce, Reid, & Epstein, 2004). Students with EBD require explicit, sustained
instruction and practice with new mathematics concepts and tasks to have lasting success
(Pierce, Reid, & Epstein, 2004). They may be less successful when confronted with
activities that ask them to extend their knowledge to new and challenging tasks, even if
they have the requisite skills to complete those tasks (Gunter & Denny, 1998).
Limitations of the Current Study
A number of limitations exist in the current study, including attrition, design
flaws, history, and the presence of extraneous variables such as the location of the
intervention and instructor bias. First, participant attrition led to a design change. The
original study proposal involved a multiple probe design across four participants.
Although four participants were selected and met eligibility criteria, two of the original
participants left the study during the baseline phase. Both of those participants left due to
emotional or behavioral crises; one of whom was hospitalized. Thus, the study design
needed to be revised. A multiple probe design across two participants, replicated by two
participants was implemented. While the original design was more desirable in terms of
117
power and control, the study demonstrated power and control through replication across
participants within the experiment, and across experiments, with two new participants
(Kennedy, 2005). The second replication demonstrated external validity to a second
group of participants, which was not built into the original design.
Two additional limitations to the design warrant consideration. First, one
additional consecutive data point should have been collected with Grace during baseline.
Although her baseline was consistent and level, Horner and Baer (1978) recommended
collecting at least one additional consecutive, or ‘true,’ baseline session from the previous
participant, to be consistent with multiple baseline design. That is, since three true
baseline sessions were conducted with Carlos, I should have conducted four true baseline
sessions with Grace prior to beginning the intervention. I was concerned about attrition,
since one participant had already begun to waver on completing baseline sessions, and
began the intervention with Grace after three sessions since her baseline was already
stable. In their text, Tawney and Gast (1982) stated that the intervention phase should
begin once a stable baseline is met, and provided examples that did not include an
additional consecutive baseline. Second, during replication, I collected only two true
baseline data points with Steven. Tawney and Gast (1982) recommended at least three
consecutive baselines prior to initiating the intervention. Since both of Steven’s baseline
scores were 10%, I consulted with committee members and made the decision to begin
the intervention with Steven rather than prolong an already stable baseline.
Next, changes to the instructional procedures during the study may have affected
the results. Booster sessions were not a component of the original design, but became
necessary as the first two participants were unable to demonstrate proficiency on their
118
initial post-intervention domain probes, despite performing at consistently high levels on
objective probes throughout the intervention. I believe their difficulty with the initial
domain probes was due, in part, to the fact that they hadn’t practiced many of the
activities in several weeks because of the breaks in the schedule, and the length of the
intervention itself (as an instructional unit). The booster session served as review session
for each participant. This approach was similar to review session a classroom teacher
would implement prior to a unit test (Montague, 2004). Both participants in the original
sample (i.e., Carlos and Grace) increased their performance to 90% or above after the
implementation of the booster session. In the replication (i.e., Steven and Riley), the
booster session was implemented in the first session following the end of the
intervention. Both participants earned 90% or above on all post-intervention domain
probes.
History effects may have influenced the result of the study. Particularly, time
constraints and space issues had an impact on my ability to implement the intervention as
designed. I was granted only one hour per day, four days per week with each participant.
In addition, several restrictions were placed on the intervention schedule. Restrictions
included the inability to implement the study during teacher professional days, early
release days, school closings due to inclement weather, statewide testing days, and class
or grade-level field trips. Thus, the intervention phase lasted an average of four to five
weeks, instead of three weeks, as I had planned. The average 11.5 sessions were scattered
over the four to five weeks for each participant, lengthening the time between sessions,
and lengthening the total study time.
119
Additionally, for the final participant (Riley), the school’s spring break fell in the
middle of the intervention phase. In order to maintain some degree of continuity, two
sessions were conducted in Riley’s home. Even with moving the intervention to her
home, there was a three-day lag between sessions, followed by a four-day lag, before the
intervention was resumed at school. The lack of continuity in the schedule may have
contributed to the first two participants’ low performance on initial post-intervention
domain probes, and may have contributed to the mixed results on maintenance measures.
These breaks in the schedule affected my ability to provide, and further demonstrates the
need for, sustained, explicit instruction.
The only available space to implement the study was a 4-foot by 8-foot room with
no windows, two chairs, and a student desk. I had to change the activities, task sheets,
and objective probes to include measurement of items I could carry into the room. I
removed measurement activities that involved items traditionally found in a classroom,
such as a chalkboard, television, computer, tables, windows, and posters, since a
classroom was unavailable.
In order to establish and maintain rapport with participants, I remained at the
school two days a week during 20-minute block of time scheduled every day for students
to meet with friends or teachers, get a snack from the cafeteria, or prepare for the rest of
the day. Although it wasn’t part of the intervention, during this time I met with
participants and other students to participate in a card game or board game of the
students’ choice. This extra attention may have had an effect on the participants’ desire to
work on the intervention each day and complete the study. Additionally, the intervention
was implemented with one participant at a time, with sole attention on that particular
120
student. For students with emotional and behavioral disorders, merely receiving positive
attention for a sustained period could have had an effect on their performance.
The current study was conducted in an isolated setting, with a 1-1 student-to-
teacher ratio. There were limited opportunities for distractions by other individuals, and
since the room contained only the materials and equipment used for the intervention,
there were no other distracting items in the room. Additionally, the students had the sole
attention of the instructor, which is atypical of a classroom environment. Under these
very controlled conditions, the participants demonstrated success. However, replication in
the classroom is necessary to generalize the results to classroom settings, since numerous
distractions exist in a typical classroom setting, individual students do not receive the
undivided attention of the teacher, and the scripted and explicit lessons may not be
feasible for a group of students with varying abilities. These points are particularly true
when the class involves students with EBD, who are characteristically distractible, and
often demand teacher attention for behavior support.
Another limitation to the study is that the investigator implemented the
intervention. The original study proposal involved employing a certified teacher and
graduate student to serve as instructor, but due to scheduling conflicts, I was unable to
recruit an instructor. My own biases may have influenced the study, but I attempted to
control for those biases through the use of scripted lessons, explicit instructional
procedures, and fidelity of treatment procedures.
Recommendations for Future Research
This intervention was successful for the participants in a one-on-one isolated
setting, when used with geometry and measurement concepts. Replicating the package
121
with different math topics with other students with EBD at the middle and high school
levels would be necessary for generalization, and would strengthen the robustness of the
intervention. Additionally, replication of the instructional package and instructional
procedures should occur with the following changes: (a) in a classroom setting, to more
closely examine the effectiveness of the package in a more typical school environment;
and (b) with small groups of students, to examine its effectiveness in a more typical
group setting.
Another change that should be made for any replication involves including a
booster session as part of the instructional procedures. In addition, since the inconsistent
schedule occurred across all participants and the entire school year, it should be
recognized as an extraneous variable to be expected in future research. Anticipating the
distractions, providing more time for the intervention phase, and providing booster, or
review, sessions after interruptions in the schedule should be included in subsequent
investigations.
Once the effectiveness of the instructional package has been demonstrated
through replications with different populations of students, with a variety of math topics,
and in more typical classroom environments, future research should also focus on the
effectiveness of individual components of this intervention package. Due to the fact that
the intervention was a package involving multiple components, it is impossible to
determine which components represented the true mechanism of change. The
intervention package is a complex set of empirically-supported practices. Prior to the
current study, there was not enough research on any one instructional approach or
component with students with EBD to warrant replicating the procedures. Whether or not
122
all of the practices are necessary to the effectiveness of the package remains unknown. It
may be that some components were effective for particular outcomes, and that other
components are unnecessary and could be eliminated in future research and in practice.
Further investigation should be conducted to clarify the effects of particular components
of the package. At this point, examining the effects of individual components of the
intervention package would be worthwhile, since they have been empirically validated as
effective in other studies where there was little information on the students with EBD, as
well as in this study, which focused solely on secondary students with EBD. I believe that
replication of this intervention package, and further research of the individual
components of the package, can serve as a springboard for building a research base on
effective mathematics interventions for this population of students.
Horner and colleagues (2005) argued that single-subject research is a viable
option for establishing an intervention as an evidence-based practice. Once this
intervention has been established as empirically-supported through replication and further
research on the components as described earlier, the next step would be to apply the
components of the intervention that were supported by the results of the single-subject
studies to a group design investigation. This type of scaling up is recommended by Odom
and colleagues (2005), and would provide further evidence of its effectiveness as an
evidence-based instructional practice (Odom, et al.).
Finally, future research on mathematics interventions for secondary students with
EBD should examine the effectiveness of other empirically-supported interventions not
addressed in this study. Those interventions include: (a) peer-mediated instruction
(Calhoon & Fuchs, 2003); (b) use of mnemonics (Cade & Gunter, 2002); (c) use of
123
technology (Bottge, 1999; Bottge, et al., 2001; Bottge, et al., 2002; Bottge, et al., 2003);
and (d) the graduated instructional sequence (Butler, et al., 2003).
Recommendations for Practice
The current study has implications for teachers of secondary students with EBD.
First, results of this study indicate that students with EBD can master grade-appropriate
objectives when presented through the use of an instructional package including
contextualized instruction. This study found that a packaged instructional program
including the use of manipulatives, cue cards, and self-monitoring techniques for
behavior and academic performance can be effective in assisting students with EBD to be
successful in area and perimeter objectives when implemented in a one-on-one situation.
In addition, this study embedded balanced instruction (constructivist activities
within an explicit teaching cycle) with empirically-based approaches for secondary
students with EBD. Instruction in this study was aligned with NCTM Standards and state
and local curricula. The intervention covered pre-requisite skills and grade-level
objectives, which provided a solid foundation for future instruction of related objectives.
The intervention was delivered through a set of teacher-directed explicit and sustained
lessons, which has previously been proven effective for students with disabilities
(Hudson & Miller, 2006; Rosenshine & Stevens, 1986). Lastly, the intervention was
implemented over a period of time that is reflective of the length of a typical secondary
instructional unit (i.e., 4 weeks or 11 sessions), although much of the unit covered pre-
requisite skills to prepare students for the grade-appropriate objectives. For these reasons,
the instructional package may be effective for inclusive classrooms and special education
resource rooms and self-contained classrooms, when a teacher is able to provide explicit
124
and sustained instruction to individual students; however, the exportability of the package
to groups of students is unknown. Finally, since the intervention included explicitly
prerequisite skills as well as grade-level objectives, it may be impractical for classrooms
where teachers are pressured to cover a vast amount of grade-level material in a limited
amount of time, and may be restricted in the amount of pre-requisite material that can be
covered, such as general education classrooms.
Conclusion
Access to the general education curriculum and high quality instruction are
necessary for improved mathematics performance among students with EBD. Federal
policies support the need to improve mathematics performance for secondary students,
including students with EBD (IDEIA, 2004; NCLB, 2001; NCTM, 2000). The current
study investigated the effects of an instructional package of empirically-supported
instructional interventions, on the mathematics performance of secondary students with
EBD. Prior to this study, research on interventions targeting objectives related to area and
perimeter with secondary students with EBD were absent from the research base. The
results of this study provide initial evidence that these students can improve performance
on grade-appropriate measurement and geometry objectives when instruction is delivered
through the contextualized instructional package. With explicit and sustained instruction,
the participants in this study also had some, albeit limited, success in maintaining
performance over time and transferring performance to novel and more challenging tasks.
Continued research is critical to identify approaches to teaching mathematics to
secondary students with EBD. A set of empirically-supported instructional approaches
for this population of students may contribute to more favorable outcomes, including

125
improved performance in math classes, increased high school completion rates, and better
performance on national and international mathematics assessments.
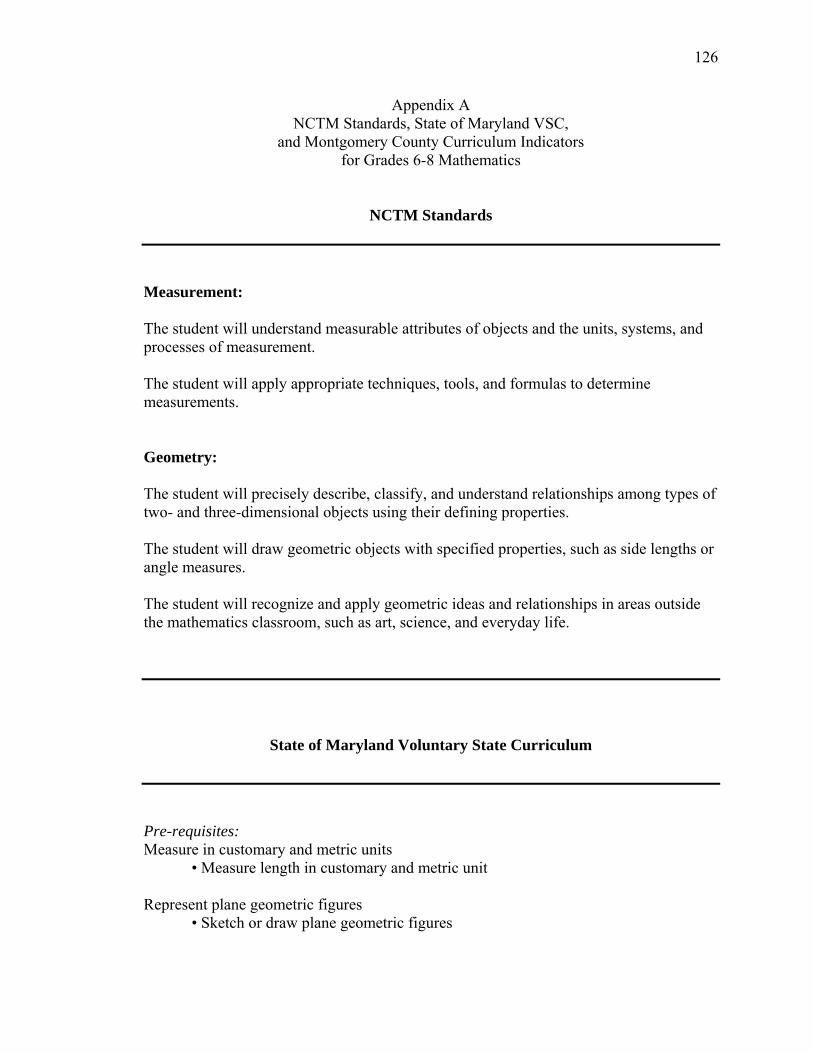
126
Appendix A NCTM Standards, State of Maryland VSC,
and Montgomery County Curriculum Indicators for Grades 6-8 Mathematics
NCTM Standards
Measurement: The student will understand measurable attributes of objects and the units, systems, and processes of measurement. The student will apply appropriate techniques, tools, and formulas to determine measurements. Geometry: The student will precisely describe, classify, and understand relationships among types of two- and three-dimensional objects using their defining properties. The student will draw geometric objects with specified properties, such as side lengths or angle measures. The student will recognize and apply geometric ideas and relationships in areas outside the mathematics classroom, such as art, science, and everyday life.
State of Maryland Voluntary State Curriculum
Pre-requisites: Measure in customary and metric units
• Measure length in customary and metric unit Represent plane geometric figures
• Sketch or draw plane geometric figures
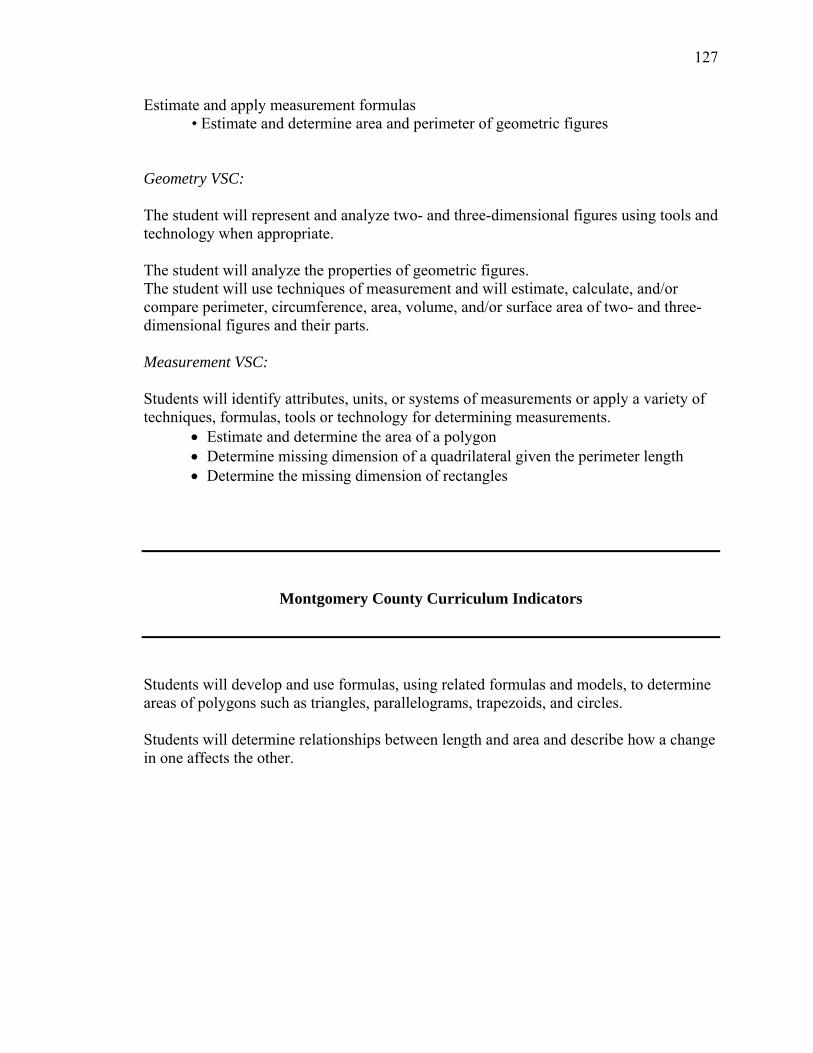
127
Estimate and apply measurement formulas • Estimate and determine area and perimeter of geometric figures
Geometry VSC: The student will represent and analyze two- and three-dimensional figures using tools and technology when appropriate. The student will analyze the properties of geometric figures. The student will use techniques of measurement and will estimate, calculate, and/or compare perimeter, circumference, area, volume, and/or surface area of two- and three-dimensional figures and their parts. Measurement VSC: Students will identify attributes, units, or systems of measurements or apply a variety of techniques, formulas, tools or technology for determining measurements. • Estimate and determine the area of a polygon
• Determine missing dimension of a quadrilateral given the perimeter length • Determine the missing dimension of rectangles
Montgomery County Curriculum Indicators
Students will develop and use formulas, using related formulas and models, to determine areas of polygons such as triangles, parallelograms, trapezoids, and circles. Students will determine relationships between length and area and describe how a change in one affects the other.
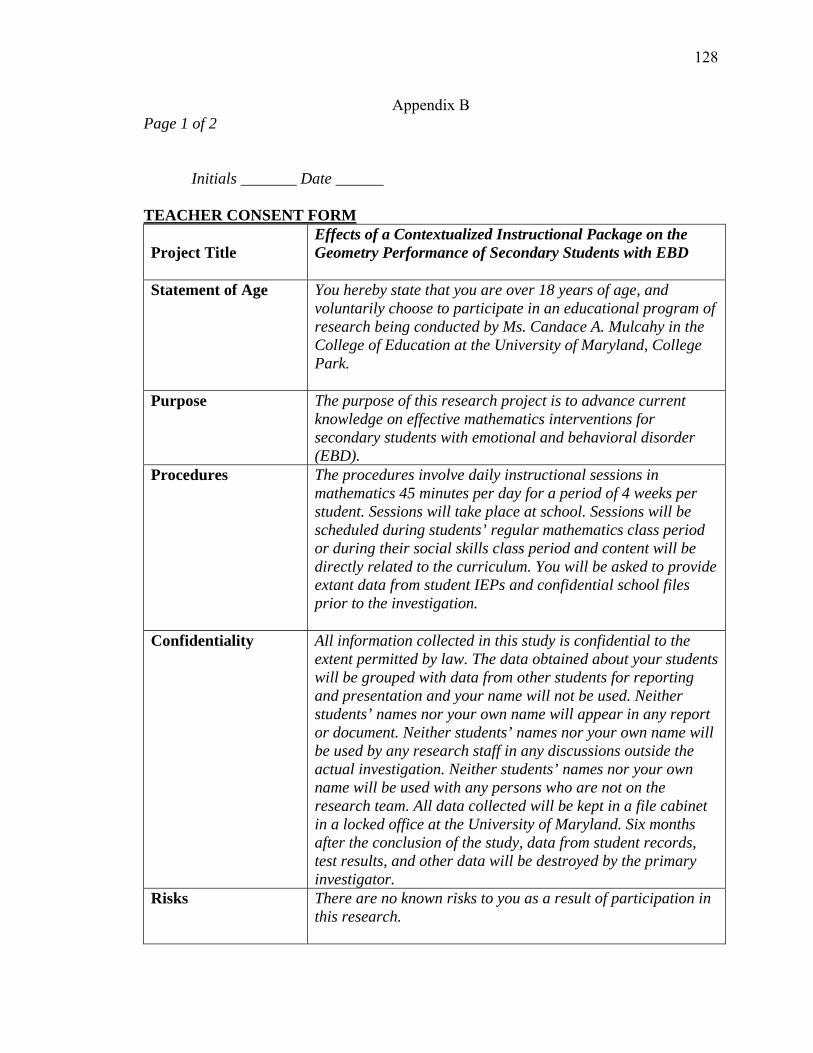
128
Appendix B Page 1 of 2 Initials _______ Date ______ TEACHER CONSENT FORM
Project Title
Effects of a Contextualized Instructional Package on the Geometry Performance of Secondary Students with EBD
Statement of Age
You hereby state that you are over 18 years of age, and voluntarily choose to participate in an educational program of research being conducted by Ms. Candace A. Mulcahy in the College of Education at the University of Maryland, College Park.
Purpose The purpose of this research project is to advance current knowledge on effective mathematics interventions for secondary students with emotional and behavioral disorder (EBD).
Procedures
The procedures involve daily instructional sessions in mathematics 45 minutes per day for a period of 4 weeks per student. Sessions will take place at school. Sessions will be scheduled during students’ regular mathematics class period or during their social skills class period and content will be directly related to the curriculum. You will be asked to provide extant data from student IEPs and confidential school files prior to the investigation.
Confidentiality
All information collected in this study is confidential to the extent permitted by law. The data obtained about your students will be grouped with data from other students for reporting and presentation and your name will not be used. Neither students’ names nor your own name will appear in any report or document. Neither students’ names nor your own name will be used by any research staff in any discussions outside the actual investigation. Neither students’ names nor your own name will be used with any persons who are not on the research team. All data collected will be kept in a file cabinet in a locked office at the University of Maryland. Six months after the conclusion of the study, data from student records, test results, and other data will be destroyed by the primary investigator.
Risks
There are no known risks to you as a result of participation in this research.

129
Benefits, Freedom to Withdraw, & Ability to Ask Questions
The investigation is not designed to help you personally, but to help the investigator learn more about higher level math instruction for students with EBD. You may benefit by participating because the study is designed to improve math accuracy and problem-solving skills of the students you teach. You are free to ask questions about this study at any time. You may refuse to participate or withdraw from this study at any time without penalty or consequence.
Page 2 of 2
Initials
_______ Date ______
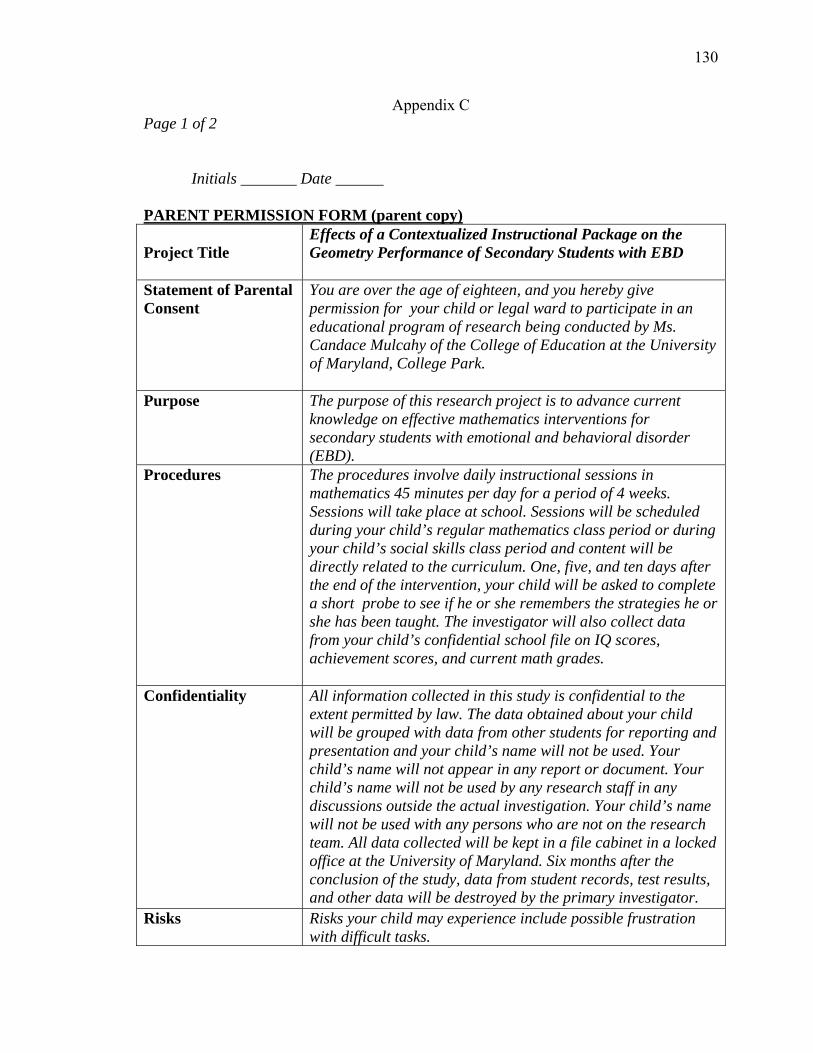
130
Appendix C Page 1 of 2 Initials _______ Date ______ PARENT PERMISSION FORM (parent copy)
Project Title
Effects of a Contextualized Instructional Package on the Geometry Performance of Secondary Students with EBD
Statement of Parental Consent
You are over the age of eighteen, and you hereby give permission for your child or legal ward to participate in an educational program of research being conducted by Ms. Candace Mulcahy of the College of Education at the University of Maryland, College Park.
Purpose The purpose of this research project is to advance current knowledge on effective mathematics interventions for secondary students with emotional and behavioral disorder (EBD).
Procedures
The procedures involve daily instructional sessions in mathematics 45 minutes per day for a period of 4 weeks. Sessions will take place at school. Sessions will be scheduled during your child’s regular mathematics class period or during your child’s social skills class period and content will be directly related to the curriculum. One, five, and ten days after the end of the intervention, your child will be asked to complete a short probe to see if he or she remembers the strategies he or she has been taught. The investigator will also collect data from your child’s confidential school file on IQ scores, achievement scores, and current math grades.
Confidentiality
All information collected in this study is confidential to the extent permitted by law. The data obtained about your child will be grouped with data from other students for reporting and presentation and your child’s name will not be used. Your child’s name will not appear in any report or document. Your child’s name will not be used by any research staff in any discussions outside the actual investigation. Your child’s name will not be used with any persons who are not on the research team. All data collected will be kept in a file cabinet in a locked office at the University of Maryland. Six months after the conclusion of the study, data from student records, test results, and other data will be destroyed by the primary investigator.
Risks
Risks your child may experience include possible frustration with difficult tasks.
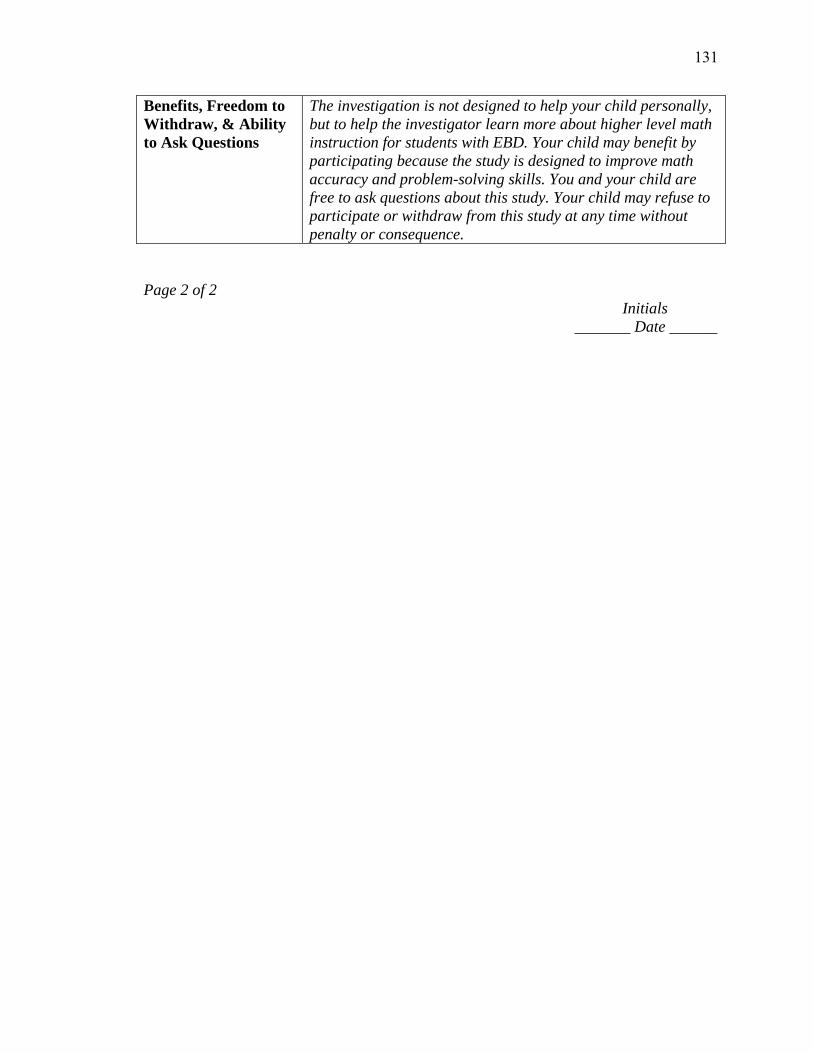
131
Benefits, Freedom to Withdraw, & Ability to Ask Questions
The investigation is not designed to help your child personally, but to help the investigator learn more about higher level math instruction for students with EBD. Your child may benefit by participating because the study is designed to improve math accuracy and problem-solving skills. You and your child are free to ask questions about this study. Your child may refuse to participate or withdraw from this study at any time without penalty or consequence.
Page 2 of 2
Initials _______ Date ______
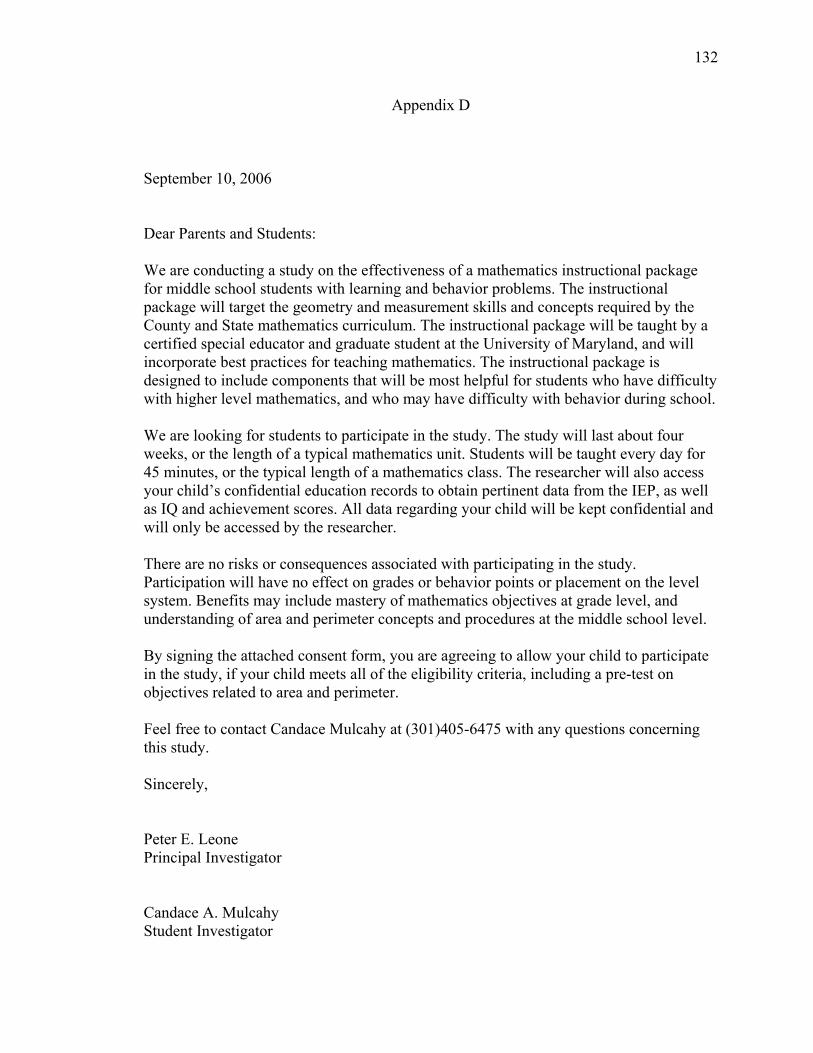
132
Appendix D September 10, 2006 Dear Parents and Students: We are conducting a study on the effectiveness of a mathematics instructional package for middle school students with learning and behavior problems. The instructional package will target the geometry and measurement skills and concepts required by the County and State mathematics curriculum. The instructional package will be taught by a certified special educator and graduate student at the University of Maryland, and will incorporate best practices for teaching mathematics. The instructional package is designed to include components that will be most helpful for students who have difficulty with higher level mathematics, and who may have difficulty with behavior during school. We are looking for students to participate in the study. The study will last about four weeks, or the length of a typical mathematics unit. Students will be taught every day for 45 minutes, or the typical length of a mathematics class. The researcher will also access your child’s confidential education records to obtain pertinent data from the IEP, as well as IQ and achievement scores. All data regarding your child will be kept confidential and will only be accessed by the researcher. There are no risks or consequences associated with participating in the study. Participation will have no effect on grades or behavior points or placement on the level system. Benefits may include mastery of mathematics objectives at grade level, and understanding of area and perimeter concepts and procedures at the middle school level. By signing the attached consent form, you are agreeing to allow your child to participate in the study, if your child meets all of the eligibility criteria, including a pre-test on objectives related to area and perimeter. Feel free to contact Candace Mulcahy at (301)405-6475 with any questions concerning this study. Sincerely, Peter E. Leone Principal Investigator Candace A. Mulcahy Student Investigator

133
Appendix E
STUDENT ASSENT FORM
Effects of a Contextualized Instructional Package on the Geometry Performance of Secondary Students with EBD
You hereby agree to participate in an educational project done by Ms. Candace
Mulcahy from the University of Maryland. You are under 18 years of age, and your parent or legal guardian has agreed that you can participate in this study.
The purpose of this research project is to learn more about good mathematics instruction for middle school students in self-contained classes. You will participate in daily instruction 45 minutes a day for about 4 weeks. Instruction will take place at school, during your regular math class period or during your Teacher/Counselor (TC) class period and will include the same topics as your regular math class. Three times during the weeks after the end of the intervention, you will be asked to complete a short test to see if you remember what you learned. Ms. Mulcahy will also collect information from your confidential school file on IQ scores, achievement scores, and current math grades. Any information collected by Ms. Mulcahy will be confidential, which means it will not be shared with anyone, including your teacher.
Participating in this study will not affect your math grades or your placement on the behavior level system. You might get frustrated with some of the math work. You may benefit by participating because the project is designed to improve your math skills. You are free to ask questions about this study at any time, and you may refuse to participate or withdraw from this study at any time without penalty or consequence. _____________________________ Print Name _____________________________ Signature If you have questions: Candace Mulcahy 1308 Benjamin Building College Park, MD 20742 301-405-6475
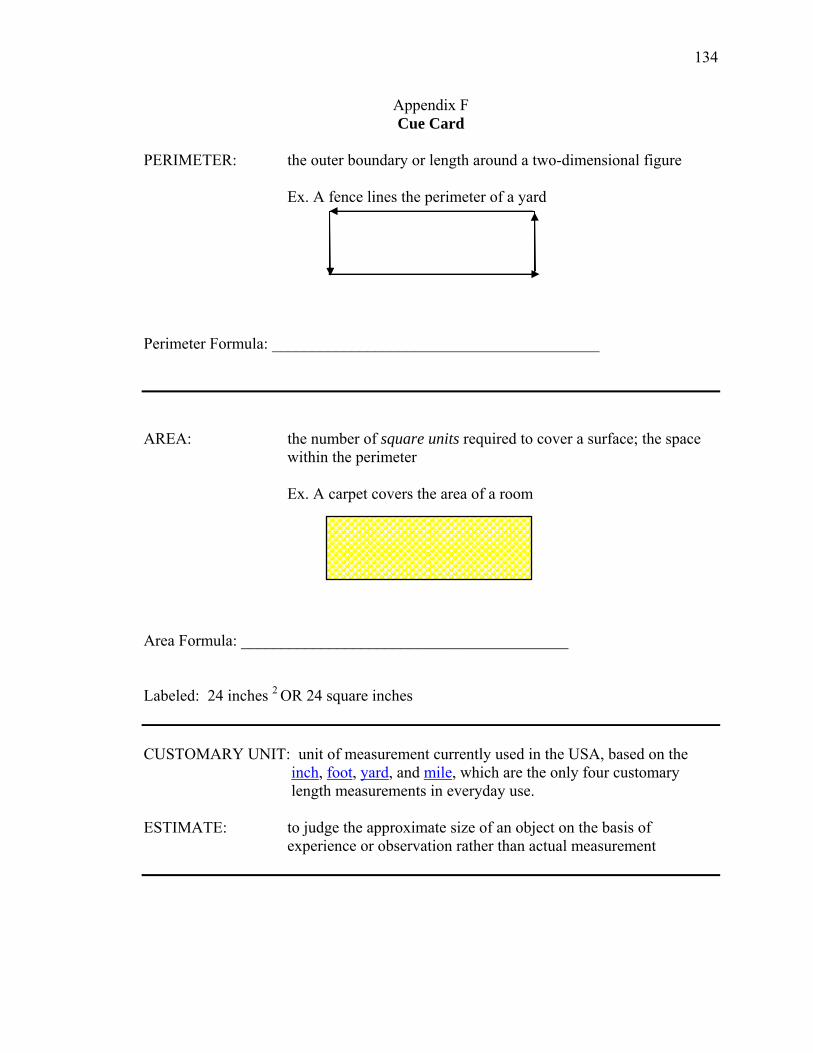
134
Appendix F Cue Card
PERIMETER: the outer boundary or length around a two-dimensional figure Ex. A fence lines the perimeter of a yard Perimeter Formula: _________________________________________ AREA: the number of square units required to cover a surface; the space
within the perimeter Ex. A carpet covers the area of a room
Area Formula: _________________________________________ Labeled: 24 inches 2 OR 24 square inches CUSTOMARY UNIT: unit of measurement currently used in the USA, based on the
inch, foot, yard, and mile, which are the only four customary length measurements in everyday use.
ESTIMATE: to judge the approximate size of an object on the basis of
experience or observation rather than actual measurement
135
Relationship Between Area and Perimeter
Constant area: Constant perimeter:
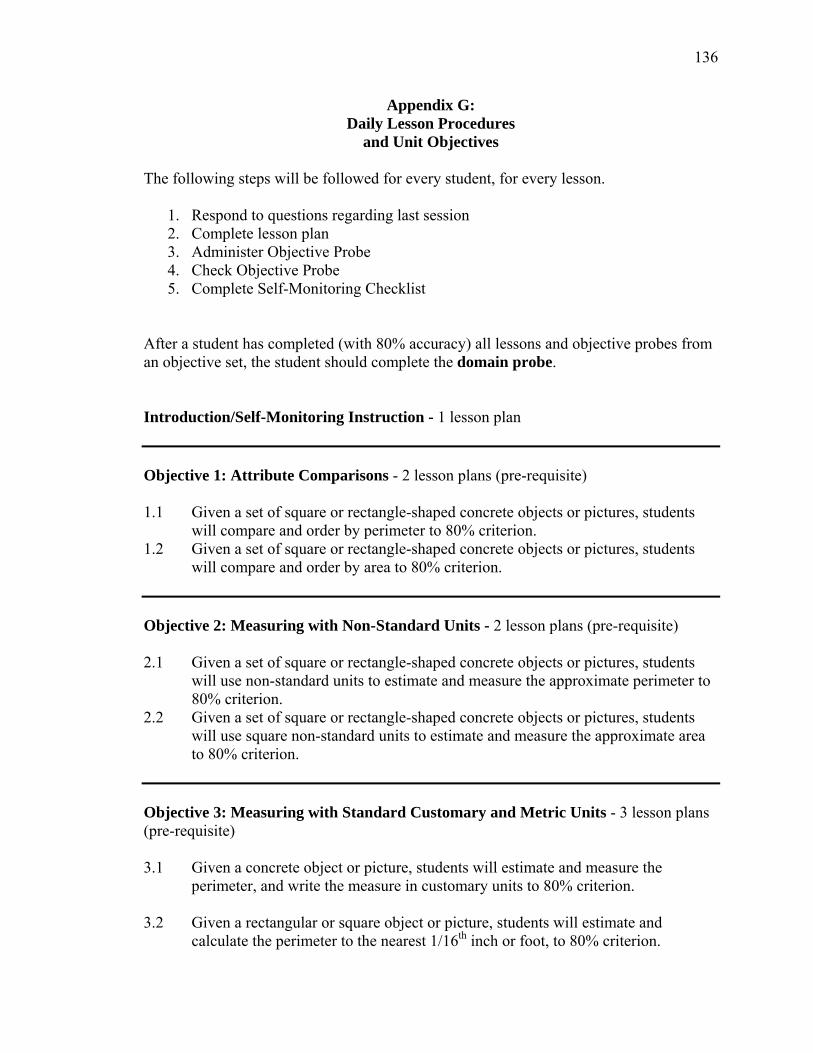
136
Appendix G: Daily Lesson Procedures
and Unit Objectives The following steps will be followed for every student, for every lesson.
1. Respond to questions regarding last session 2. Complete lesson plan 3. Administer Objective Probe 4. Check Objective Probe 5. Complete Self-Monitoring Checklist
After a student has completed (with 80% accuracy) all lessons and objective probes from an objective set, the student should complete the domain probe. Introduction/Self-Monitoring Instruction - 1 lesson plan Objective 1: Attribute Comparisons - 2 lesson plans (pre-requisite) 1.1 Given a set of square or rectangle-shaped concrete objects or pictures, students
will compare and order by perimeter to 80% criterion. 1.2 Given a set of square or rectangle-shaped concrete objects or pictures, students
will compare and order by area to 80% criterion. Objective 2: Measuring with Non-Standard Units - 2 lesson plans (pre-requisite) 2.1 Given a set of square or rectangle-shaped concrete objects or pictures, students
will use non-standard units to estimate and measure the approximate perimeter to 80% criterion.
2.2 Given a set of square or rectangle-shaped concrete objects or pictures, students will use square non-standard units to estimate and measure the approximate area to 80% criterion.
Objective 3: Measuring with Standard Customary and Metric Units - 3 lesson plans (pre-requisite) 3.1 Given a concrete object or picture, students will estimate and measure the
perimeter, and write the measure in customary units to 80% criterion. 3.2 Given a rectangular or square object or picture, students will estimate and
calculate the perimeter to the nearest 1/16th inch or foot, to 80% criterion.
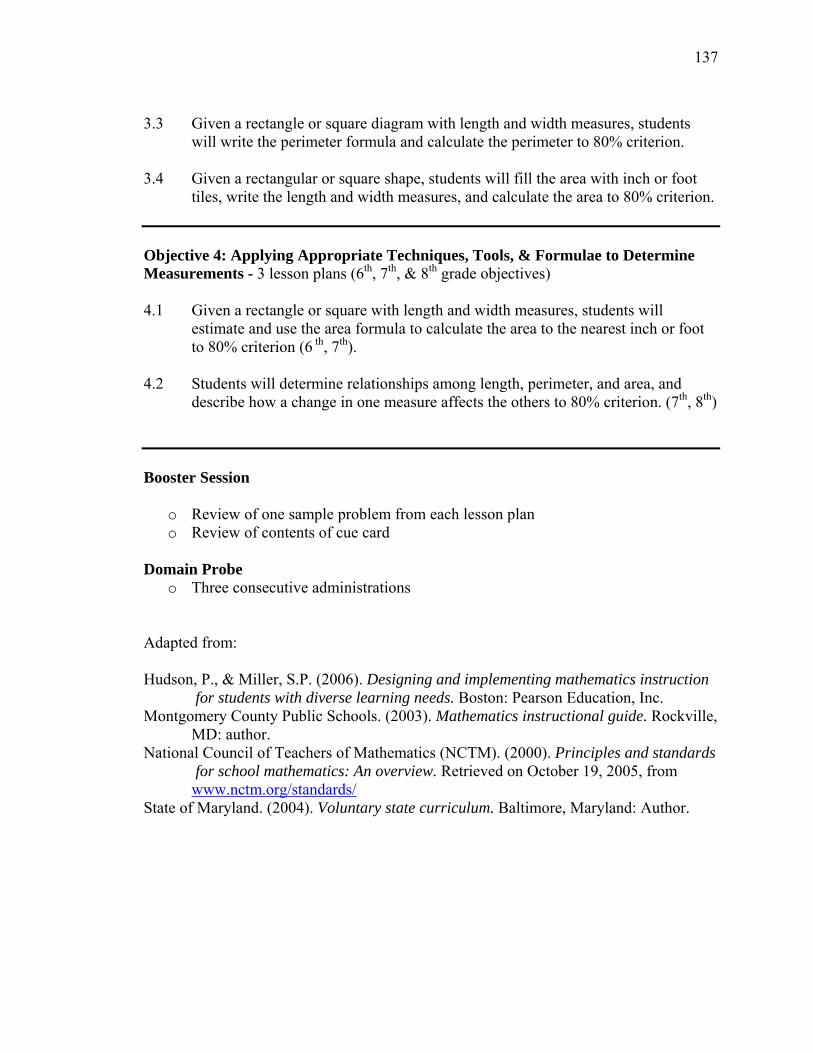
137
3.3 Given a rectangle or square diagram with length and width measures, students
will write the perimeter formula and calculate the perimeter to 80% criterion. 3.4 Given a rectangular or square shape, students will fill the area with inch or foot
tiles, write the length and width measures, and calculate the area to 80% criterion. Objective 4: Applying Appropriate Techniques, Tools, & Formulae to Determine Measurements - 3 lesson plans (6th, 7th, & 8th grade objectives) 4.1 Given a rectangle or square with length and width measures, students will
estimate and use the area formula to calculate the area to the nearest inch or foot to 80% criterion (6 th, 7th).
4.2 Students will determine relationships among length, perimeter, and area, and
describe how a change in one measure affects the others to 80% criterion. (7th, 8th) Booster Session
o Review of one sample problem from each lesson plan o Review of contents of cue card
Domain Probe
o Three consecutive administrations Adapted from: Hudson, P., & Miller, S.P. (2006). Designing and implementing mathematics instruction
for students with diverse learning needs. Boston: Pearson Education, Inc. Montgomery County Public Schools. (2003). Mathematics instructional guide. Rockville,
MD: author. National Council of Teachers of Mathematics (NCTM). (2000). Principles and standards
for school mathematics: An overview. Retrieved on October 19, 2005, from www.nctm.org/standards/
State of Maryland. (2004). Voluntary state curriculum. Baltimore, Maryland: Author.
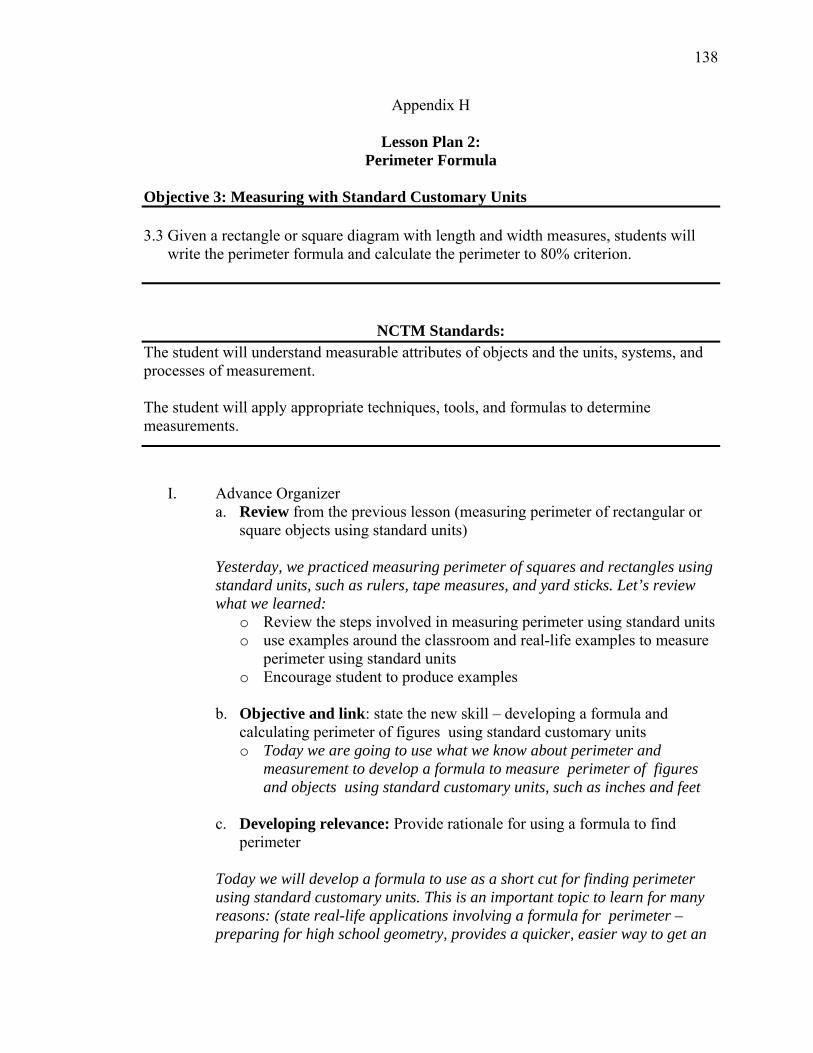
138
Appendix H
Lesson Plan 2: Perimeter Formula
Objective 3: Measuring with Standard Customary Units 3.3 Given a rectangle or square diagram with length and width measures, students will
write the perimeter formula and calculate the perimeter to 80% criterion.
NCTM Standards:
The student will understand measurable attributes of objects and the units, systems, and processes of measurement. The student will apply appropriate techniques, tools, and formulas to determine measurements.
I. Advance Organizer
a. Review from the previous lesson (measuring perimeter of rectangular or square objects using standard units)
Yesterday, we practiced measuring perimeter of squares and rectangles using standard units, such as rulers, tape measures, and yard sticks. Let’s review what we learned:
o Review the steps involved in measuring perimeter using standard units o use examples around the classroom and real-life examples to measure
perimeter using standard units o Encourage student to produce examples
b. Objective and link: state the new skill – developing a formula and
calculating perimeter of figures using standard customary units o Today we are going to use what we know about perimeter and
measurement to develop a formula to measure perimeter of figures and objects using standard customary units, such as inches and feet
c. Developing relevance: Provide rationale for using a formula to find
perimeter Today we will develop a formula to use as a short cut for finding perimeter using standard customary units. This is an important topic to learn for many reasons: (state real-life applications involving a formula for perimeter –preparing for high school geometry, provides a quicker, easier way to get an
139
accurate number for building, buying material for carpentry, homebuilding, gardening, constructing fences, sewing, etc).
II. Materials a. models and drawings of various figures with a variety of perimeters,
geoboards, rubber bands, rulers, yardsticks, tape measures, cue cards, self-monitoring recording sheet, task sheet
III. Demonstration
a. Model several problems by “thinking aloud” using the cue cards, concrete objects in the room, and drawn figures on the chalkboard.
(Let’s review how we find perimeter. We measure the length of each side of a figure. Then we add all of those lengths up to get a total) Refer to the perimeter cue card. What do you think would be a shortcut for adding all the sides of a square up? Remember, all the sides of a square are the same length. If one side is 4 inches, all sides will be 4 inches. Encourage the student to make suggestions for a formula, by asking them to review how they find the perimeter.
Model thinking and action: Demonstrate calculating perimeter using a formula and several examples and using “think aloud” technique and referring to the perimeter cue card
o First, I will estimate the perimeter of the figure. If one side appears to be about 6 inches, (trace your finger along the length of the object) and there are four sides of the same length, I know that a shortcut add 6 four times. 6+6+6+6=24. I estimate the perimeter to be 24 units (inches).
o Next, I will measure the length of a side. Review, “thinking
aloud,” how to measure using a ruler. o Now that I’ve estimated, I am ready to develop a formula. If I
add up all sides, I know that Perimeter = Side 1 + Side 2 + Side 3 + Side 4.
o Continue to calculate the perimeter of squares of several sizes,
writing out each step as you go, and “think aloud” as you calculate the perimeter of each figure.
o Model adding up the sides of rectangles, encouraging student
participation. Acknowledge the fact that rectangles are different from squares – all sides are not the same length, but two opposite sides are the same.

140
o Discuss additional shortcuts (formulae) – for squares, you can multiple the length of one side by 4, since each side is equal in length. For rectangles, you can multiple length by 2, and width by 2, and add those products together. Encourage student to develop these – don’t just tell them.
o Have the student develop their own formula cue card, with
perimeter formulae on it.
Maximize student engagement o Continue the procedure, “thinking aloud” as you provide
several examples o Encourage student to respond chorally with you, and direct
him/her to repeat the next step after you state it. o Ask the student to tell you what to do at various steps of the
process
Monitor student understanding o Demonstrate more problems if the student appears confused, is
hesitant in responding, or does not respond. b. Review the steps you took to calculate the perimeter of the figure. Direct
the student to repeat the steps after you. o Write an equation to show each side of the figure. Side 1 + Side 2 +
Side 3 + Side 4=Perimeter. Refer to the perimeter cue card for the procedures.
o Record the number of units of each side of the figure. o Add all of the numbers together to get the perimeter.
c. Repeat with 4-5 other examples of perimeter, using a variety of objects in
the room, shapes designed on geoboards, and drawings of figures, and using other standard customary measuring tools, such as yardsticks and tape measures
d. Using grid paper, demonstrate how to draw and measure perimeter of 3-4
figures. o Encourage student participation in drawing and measuring perimeter. o Instruct the student that we are using grid paper to represent square
inches or feet, because if we use inch or foot grid paper, the figures would be much larger, and would require much more paper.
o Show the difference between the two grid sizes. If this is confusing to the student, use inch grid paper and tape sheets together, side to side and end to end, if needed.
IV. Guided Practice
141
a. Provide guided practice as the student performs at least three problems (via task sheet) with guidance and support from the instructor as needed; problems will include contextualized word problems
b. Have the student perform the next few problems with less guidance and
support from the instructor
Levels of support: High: Tell the student the step and direct him/her to complete it
Ex. o Estimate the length of one side (or two, if it is a rectangle).
Write an equation, using your formula, to represent how to find perimeter.
Medium: Ask the student to recall the step and state it verbally.
Ex. o What is the next step? (Student responds) Yes, write Side 1+
Side 2 + Side 3 +Side 4 = Perimeter.
Low: Reduce the number of prompts; chunk several steps together. Ex. o What is the first step? (Student responds) What do we do next?
(Student responds) Go ahead and complete the first two steps.
No prompts: Direct the student to complete the whole problem. o Provide no teacher assistance. o Check student work for accuracy as he/she finishes the
problem.
V. Independent Practice a. Provide OBJECTIVE PROBE to perform independently; problems will
include contextualized word problems b. Monitor student performance c. Collect data – review accuracy of completed problems with student d. Direct student to complete self-monitoring recording sheet, based on
completed lesson
VI. Review a. Remind the students of the day’s lesson b. Link the lesson to future lessons (Today we learned to calculate the perimeter of a variety of objects and figures using a formula. You did a nice job developing a formula to calculate perimeter. Tomorrow we will continue to work on area and perimeter by measuring the area of objects and figures with customary units, such as square inch and foot tiles.)

142
VII. Feedback
(See Behavior Management Protocol in Lesson Plan Manual)
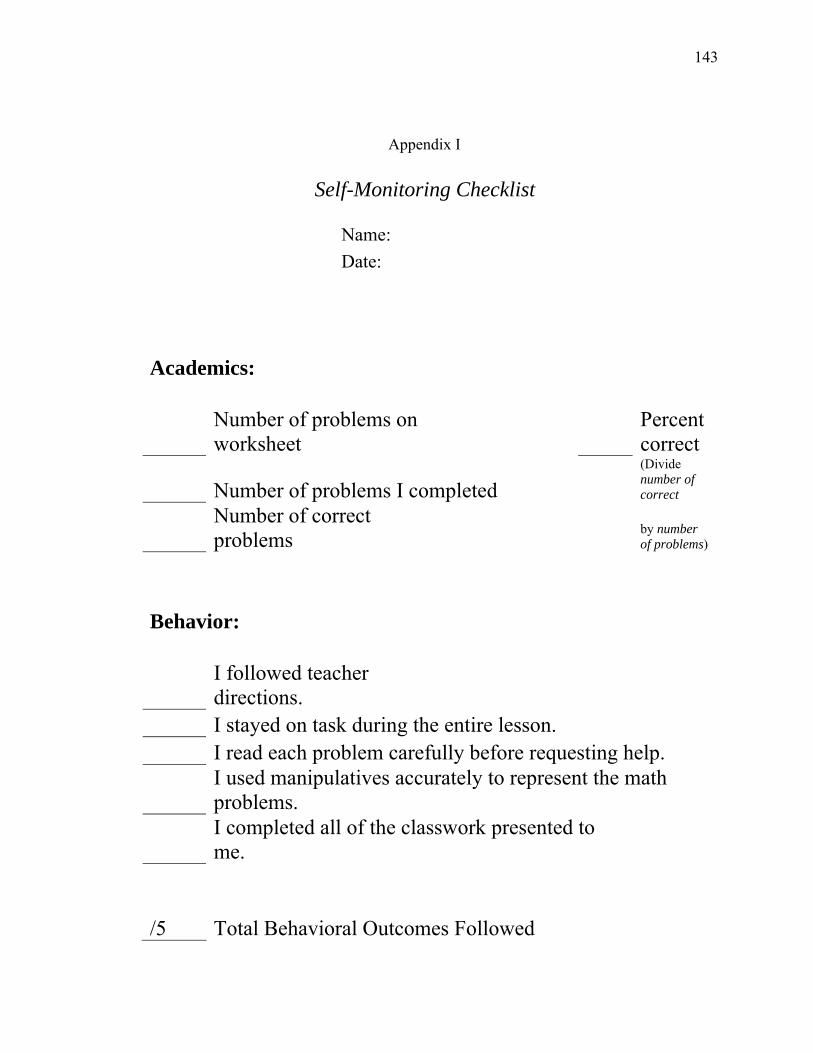
143
Appendix I
Self-Monitoring Checklist
Name:
Date:
Academics:
Number of problems on worksheet
Percent correct
Number of problems I completed
(Divide number of correct
Number of correct problems
by number of problems)
Behavior:
I followed teacher directions.
I stayed on task during the entire lesson.
I read each problem carefully before requesting help.
I used manipulatives accurately to represent the math problems.
I completed all of the classwork presented to me.
/5 Total Behavioral Outcomes Followed
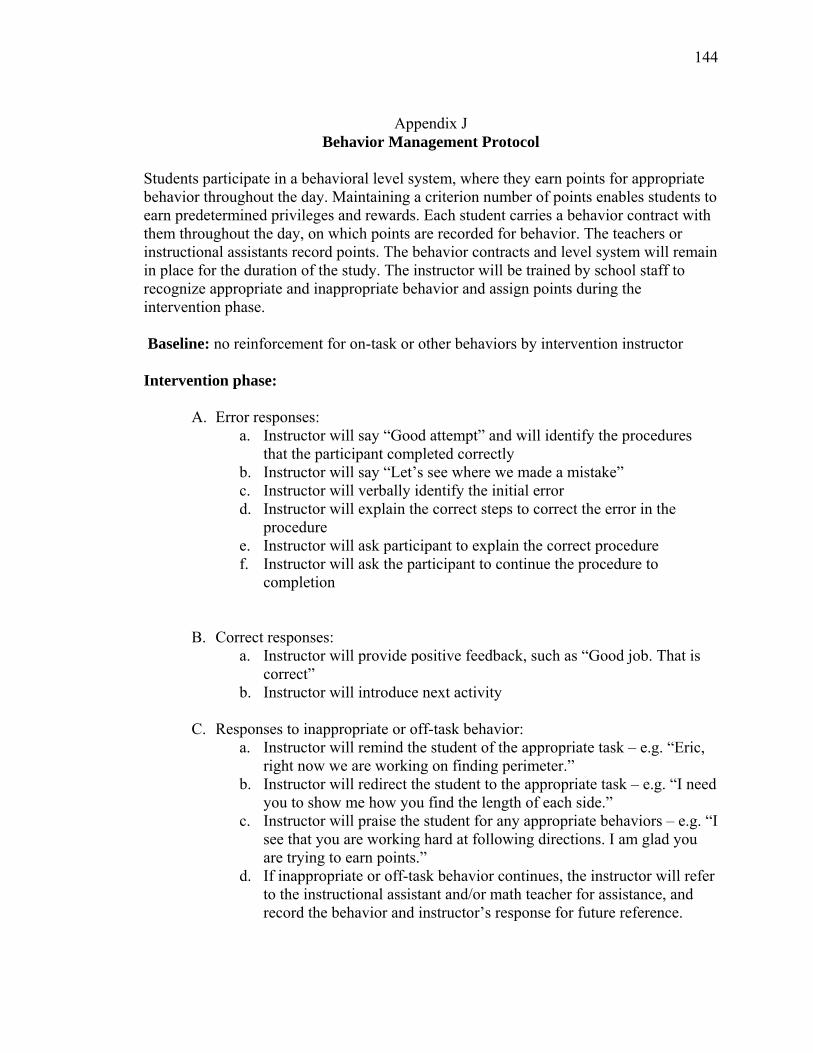
144
Appendix J
Behavior Management Protocol
Students participate in a behavioral level system, where they earn points for appropriate behavior throughout the day. Maintaining a criterion number of points enables students to earn predetermined privileges and rewards. Each student carries a behavior contract with them throughout the day, on which points are recorded for behavior. The teachers or instructional assistants record points. The behavior contracts and level system will remain in place for the duration of the study. The instructor will be trained by school staff to recognize appropriate and inappropriate behavior and assign points during the intervention phase. Baseline: no reinforcement for on-task or other behaviors by intervention instructor Intervention phase:
A. Error responses: a. Instructor will say “Good attempt” and will identify the procedures
that the participant completed correctly b. Instructor will say “Let’s see where we made a mistake” c. Instructor will verbally identify the initial error d. Instructor will explain the correct steps to correct the error in the
procedure e. Instructor will ask participant to explain the correct procedure f. Instructor will ask the participant to continue the procedure to
completion
B. Correct responses: a. Instructor will provide positive feedback, such as “Good job. That is
correct” b. Instructor will introduce next activity
C. Responses to inappropriate or off-task behavior:
a. Instructor will remind the student of the appropriate task – e.g. “Eric, right now we are working on finding perimeter.”
b. Instructor will redirect the student to the appropriate task – e.g. “I need you to show me how you find the length of each side.”
c. Instructor will praise the student for any appropriate behaviors – e.g. “I see that you are working hard at following directions. I am glad you are trying to earn points.”
d. If inappropriate or off-task behavior continues, the instructor will refer to the instructional assistant and/or math teacher for assistance, and record the behavior and instructor’s response for future reference.

145
Appendix K
DOMAIN PROBE A
Student Name: ________________________________________
Directions: Use what you know about area and perimeter to complete the following problems to the best of your ability.
1. You are currently taking a baking class, and have decided to design a square cake for
your friend’s birthday. Using grid paper:
a. Draw a square with lengths of 12 units. Label the sides. b. Use the area formula to solve for the area.
A= _____________________________
c. Use the perimeter formula to solve for the perimeter.
P= _______________________________
2. Name an object that has an area greater than:
o An index card ____________________
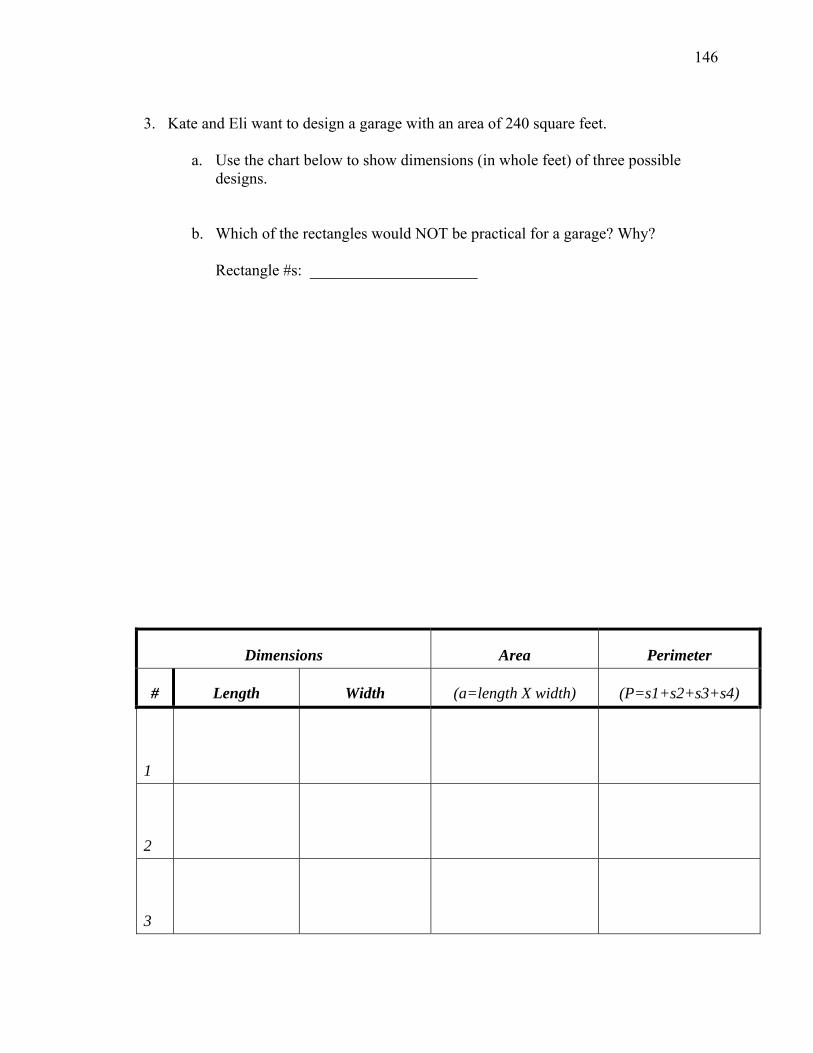
146
3. Kate and Eli want to design a garage with an area of 240 square feet.
a. Use the chart below to show dimensions (in whole feet) of three possible designs.
b. Which of the rectangles would NOT be practical for a garage? Why?
Rectangle #s: _____________________
Dimensions Area Perimeter
# Length Width (a=length X width) (P=s1+s2+s3+s4)
1
2
3
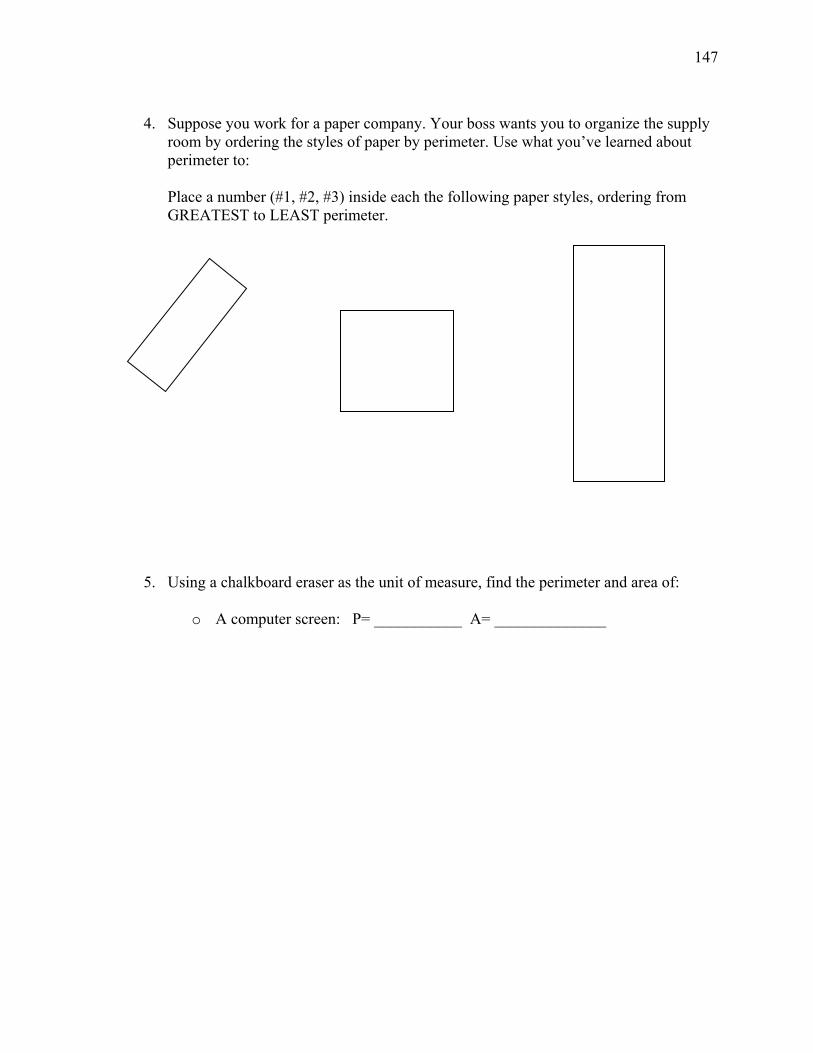
147
4. Suppose you work for a paper company. Your boss wants you to organize the supply
room by ordering the styles of paper by perimeter. Use what you’ve learned about perimeter to: Place a number (#1, #2, #3) inside each the following paper styles, ordering from GREATEST to LEAST perimeter.
5. Using a chalkboard eraser as the unit of measure, find the perimeter and area of:
o A computer screen: P= ___________ A= ______________

148
6. You are on your community’s recreation committee, charged with designing a skate
park for your neighborhood. The park will include half pipes, ramps, rails, and street obstacles. Your committee has two possible designs for the skate park. Answer the following questions using Design A and Design B below.
a. Estimate the perimeter (in inches) of each figure above.
Design A Estimate: ________________________ Design B Estimate: ________________________
b. Use a ruler to measure (in inches) the lengths and widths of each figure above. c. Label each figure above appropriately. d. Find the perimeter (in inches) of each figure above.
Design A: Perimeter = __________________________ Design B: Perimeter = __________________________
Design B
Design A
149
e. Choose the figure with the smaller perimeter. Smaller perimeter: ___________________________
7. The committee would like to know which of the designs from Problem 6 has the greatest area, to maximize the available space for the skate park. a. Find the area of each of the figures (in square inches).
Design A: Area = __________________________ Design B: Area = __________________________
b. Choose the figure that has greater area.
Greater area: ______________________________
Some problems adapted from:
Fey, J., Fitzgerald, W., Friel, S., Lappan, G., & Phillips, E.D. (2004). Connected mathematics: Covering and surrounding. Lansing, MI: Michigan State University.
150
Appendix L OBJECTIVE PROBE (Independent Practice)
1. Helen has designed a rectangle with an area of 59 square units. Her rectangle is the smallest rectangle (smallest area) with whole-number side lengths that can be made from the perimeter of the rectangle.
a. What are the length and width of the rectangle?
___________________________
b. What is the perimeter of the rectangle?
___________________________
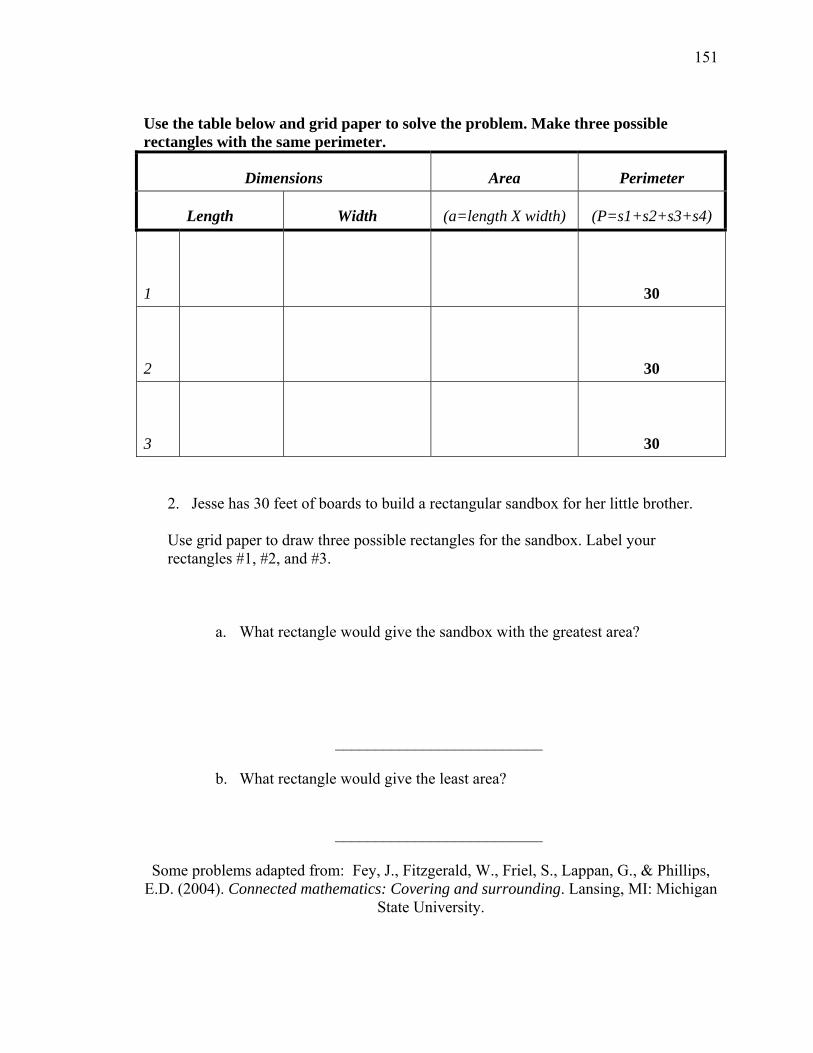
151
Use the table below and grid paper to solve the problem. Make three possible rectangles with the same perimeter.
Dimensions Area Perimeter
Length Width (a=length X width) (P=s1+s2+s3+s4)
1
30
2
30
3
30 2. Jesse has 30 feet of boards to build a rectangular sandbox for her little brother. Use grid paper to draw three possible rectangles for the sandbox. Label your rectangles #1, #2, and #3.
a. What rectangle would give the sandbox with the greatest area?
__________________________ b. What rectangle would give the least area?
__________________________
Some problems adapted from: Fey, J., Fitzgerald, W., Friel, S., Lappan, G., & Phillips, E.D. (2004). Connected mathematics: Covering and surrounding. Lansing, MI: Michigan
State University.
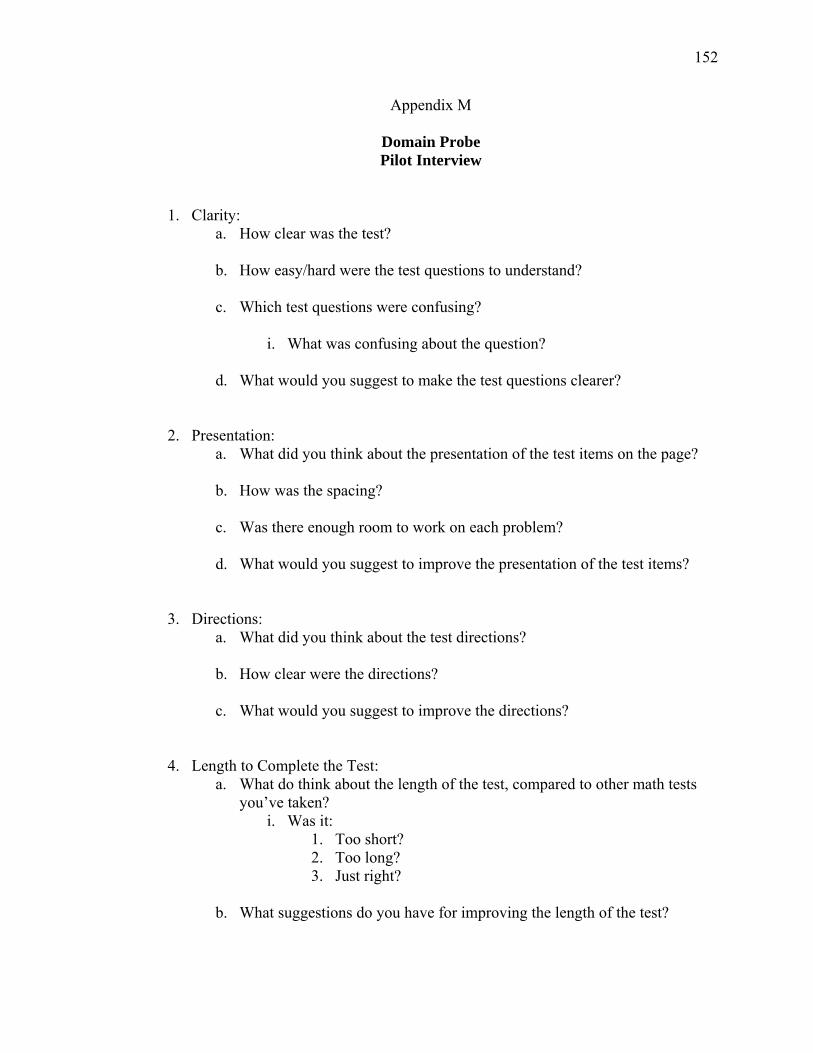
152
Appendix M
Domain Probe Pilot Interview
1. Clarity: a. How clear was the test? b. How easy/hard were the test questions to understand?
c. Which test questions were confusing?
i. What was confusing about the question?
d. What would you suggest to make the test questions clearer?
2. Presentation: a. What did you think about the presentation of the test items on the page? b. How was the spacing?
c. Was there enough room to work on each problem?
d. What would you suggest to improve the presentation of the test items?
3. Directions: a. What did you think about the test directions? b. How clear were the directions?
c. What would you suggest to improve the directions?
4. Length to Complete the Test: a. What do think about the length of the test, compared to other math tests
you’ve taken? i. Was it:
1. Too short? 2. Too long? 3. Just right?
b. What suggestions do you have for improving the length of the test?
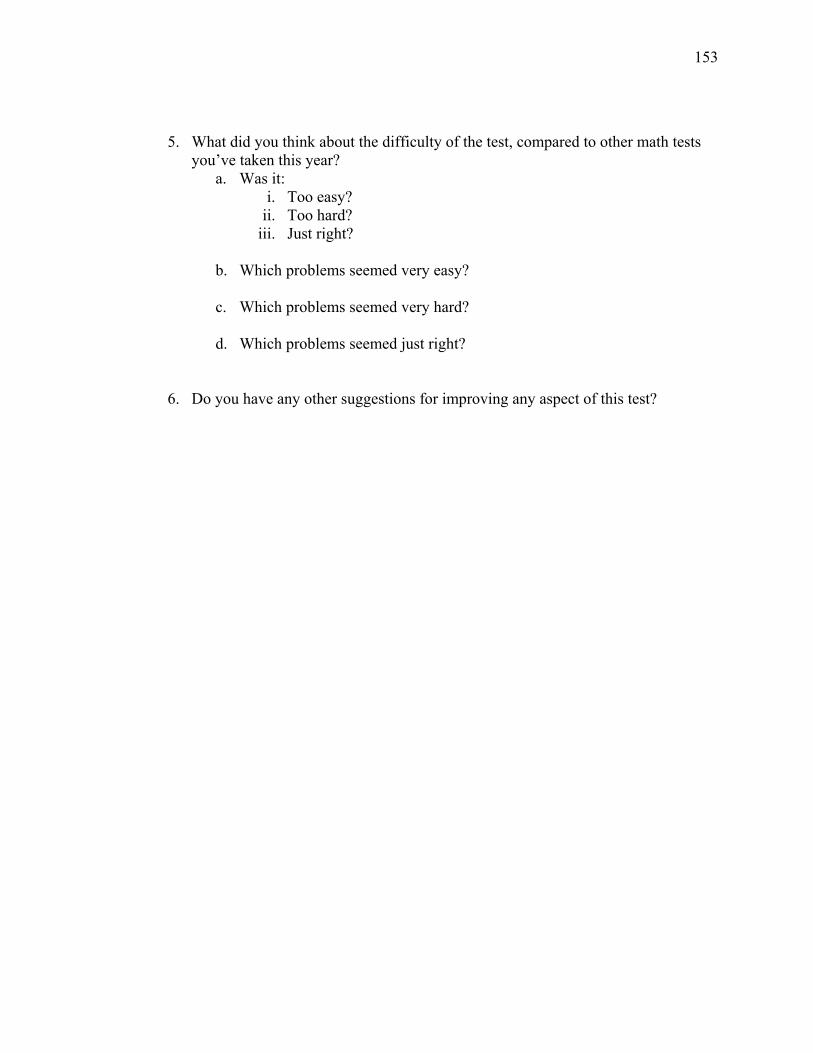
153
5. What did you think about the difficulty of the test, compared to other math tests you’ve taken this year?
a. Was it: i. Too easy?
ii. Too hard? iii. Just right?
b. Which problems seemed very easy? c. Which problems seemed very hard?
d. Which problems seemed just right?
6. Do you have any other suggestions for improving any aspect of this test?

154
Appendix N Transfer and Maintenance Probe
1. Use the space below to draw another flag with the same area, but different lengths
and widths, as this flag.
6 inches 12 inches
2. A sidewalk 2 feet wide surrounds a rectangular garden 20 feet long and 12 feet wide. Using grid paper:
a. Sketch the sidewalk and garden. Label the sides appropriately. b. Find the area of the garden. A = ____________________________
c. Find the area of the sidewalk. A = ___________________________

155
d. Find the perimeter of the garden. P = ________________________
e. Find the perimeter of the garden PLUS the sidewalk. P = _____________
Lovette has designed a rectangle with an area of 196 square inches. Her rectangle is the largest rectangle (largest area) that can be made for any rectangle with the same perimeter.
a. What are the length and width of the rectangle? L= _______ W= _______ b. What is the perimeter of the rectangle? P = ______________________
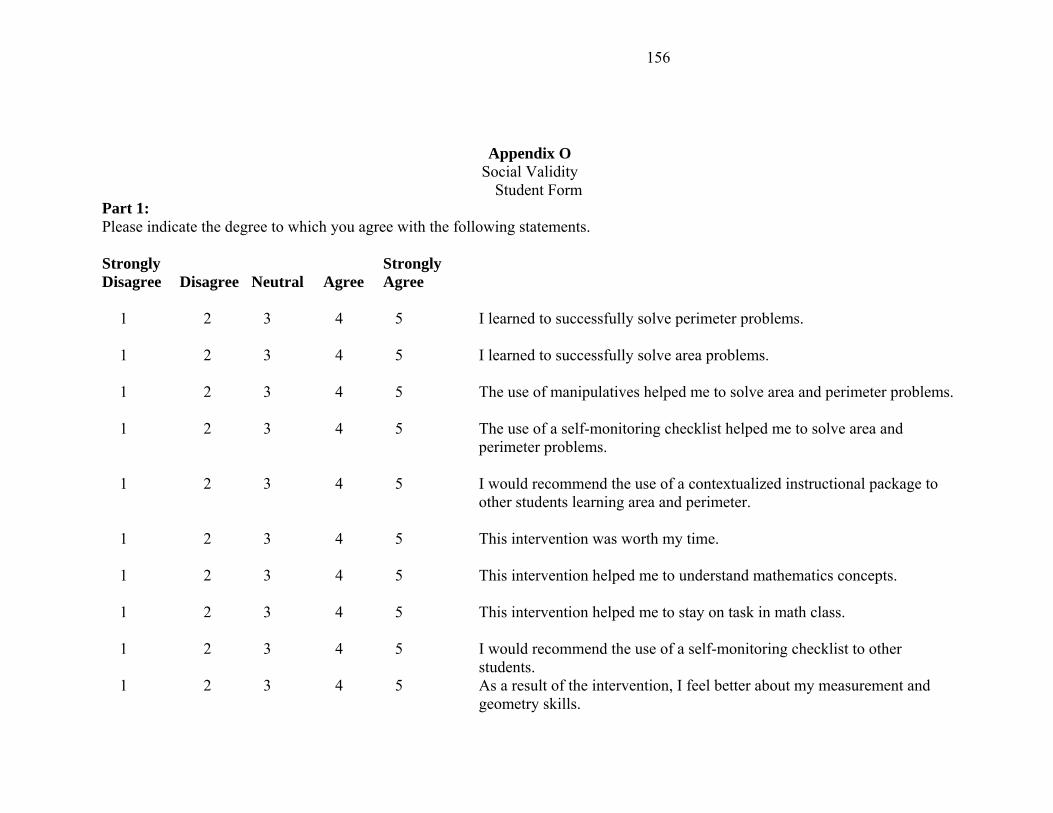
156
Appendix O Social Validity
Student Form Part 1: Please indicate the degree to which you agree with the following statements. Strongly Strongly Disagree Disagree Neutral Agree Agree
1 2 3 4 5 I learned to successfully solve perimeter problems.
1 2 3 4 5 I learned to successfully solve area problems.
1 2 3 4 5 The use of manipulatives helped me to solve area and perimeter problems. 1 2 3 4 5 The use of a self-monitoring checklist helped me to solve area and perimeter problems.
1 2 3 4 5 I would recommend the use of a contextualized instructional package to other students learning area and perimeter.
1 2 3 4 5 This intervention was worth my time.
1 2 3 4 5 This intervention helped me to understand mathematics concepts. 1 2 3 4 5 This intervention helped me to stay on task in math class.
1 2 3 4 5 I would recommend the use of a self-monitoring checklist to other students. 1 2 3 4 5 As a result of the intervention, I feel better about my measurement and geometry skills.
157
Part 2: Write your response to each question below: 1. Are you interested in learning measurement and geometry skills? Why or why not? 2. Tell me ways in which you use area and perimeter in everyday life: 3. Do you enjoy/like mathematics/measurement and geometry? Why or why not? 4. What did you like best about the intervention? 5. What did you like the least about the intervention? 6. What suggestions do you have for improvement?
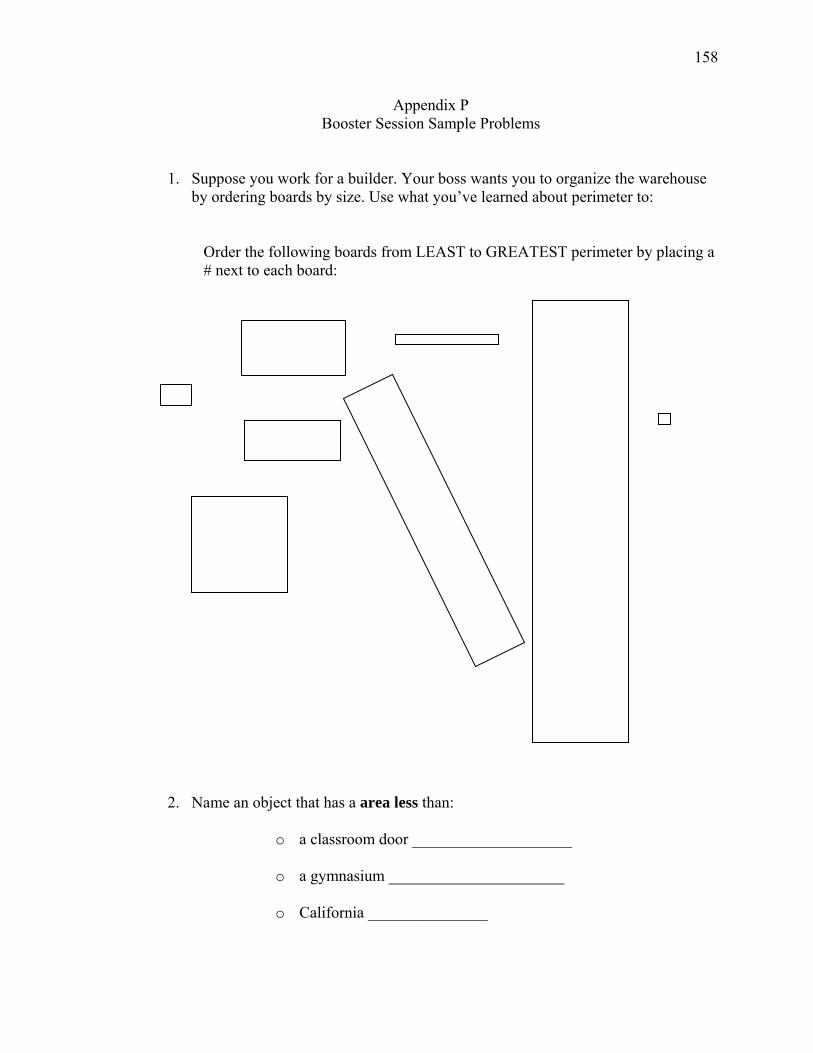
158
Appendix P Booster Session Sample Problems
1. Suppose you work for a builder. Your boss wants you to organize the warehouse by ordering boards by size. Use what you’ve learned about perimeter to:
Order the following boards from LEAST to GREATEST perimeter by placing a # next to each board:
2. Name an object that has a area less than:
o a classroom door ____________________ o a gymnasium ______________________
o California _______________

159
3. Using Post-it notes, measure the area of:
a desktop ___________________
4. Using a geoboard:
A. Design a square with side lengths of 8 units.
B. Draw the shape on grid paper. C. Label the dimensions of the square.
D. Find the perimeter of the square.
Perimeter = ______________________________
5. Gene is helping his mother measure the living room because they want to buy new wood floors. The floor is the shape of a rectangle with a width of 14 ft and a length of 16 ft.
A. Using grid paper, draw the shape of the room.
B. Label the length and width.
C. Find the area of the room.
Area =_____________________

160
6. Use grid paper to:
A. Draw one additional rectangle that has an area less than the area of Gene’s mother’s living room.
B. Label the length and the width of the rectangle.
C. Write the area formula, and then use the area formula to find the area of the rectangle.
Area formula: ____________________________________________ Area of rectangle = ___________________________________
7. Landon has designed a rectangle-shaped tabletop with an area of 300 square inches. His rectangle is the largest rectangle (largest area) that can be made from the perimeter of the rectangle.
c. What are the length and width of the rectangle?
__________________________
d. What is the perimeter of the rectangle?
___________________________
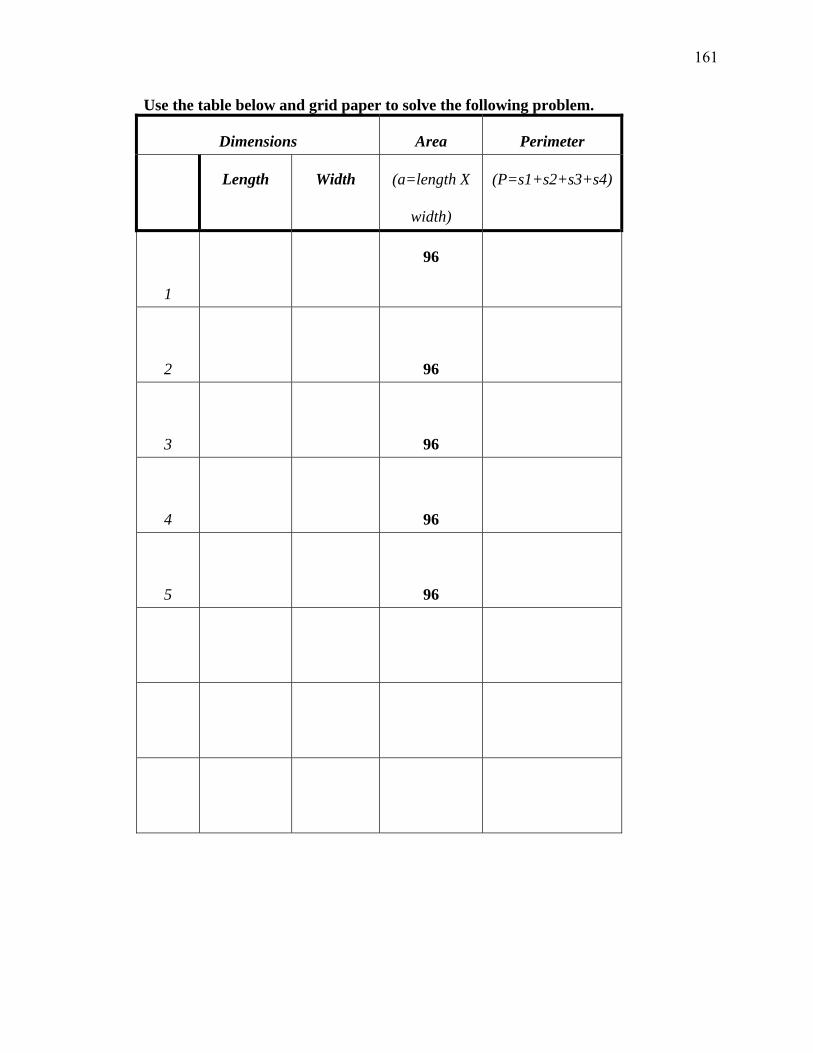
161
Use the table below and grid paper to solve the following problem.
Dimensions Area Perimeter
Length Width (a=length X
width)
(P=s1+s2+s3+s4)
1
96
2
96
3
96
4
96
5
96

162
8. Eric wants to build a rectangular patio in his backyard. He has 96 square flagstones that are each one square foot in size. Use the chart and grid paper to create all possible designs for the patio.
a. Using grid paper, sketch all possible rectangles with the area of 96 square
feet. Label your rectangles #1, #2, #3, etc. b. What are the dimensions of the patio with the smallest perimeter Eric
could build? ______________________
c. What are the dimensions of the patio with the largest perimeter Eric could
build? ______________________
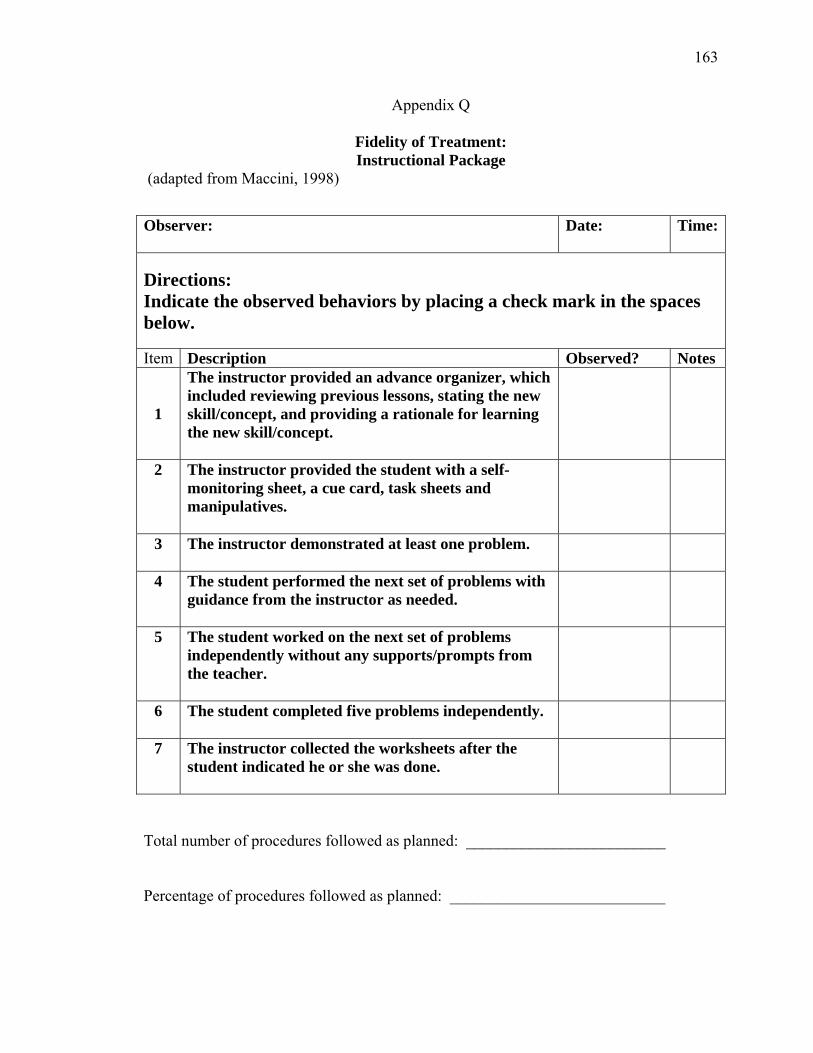
163
Appendix Q
Fidelity of Treatment: Instructional Package
(adapted from Maccini, 1998)
Total number of procedures followed as planned: _________________________ Percentage of procedures followed as planned: ___________________________
Observer:
Date: Time:
Directions: Indicate the observed behaviors by placing a check mark in the spaces below. Item Description Observed? Notes
1
The instructor provided an advance organizer, which included reviewing previous lessons, stating the new skill/concept, and providing a rationale for learning the new skill/concept.
2 The instructor provided the student with a self-monitoring sheet, a cue card, task sheets and manipulatives.
3 The instructor demonstrated at least one problem.
4 The student performed the next set of problems with guidance from the instructor as needed.
5 The student worked on the next set of problems independently without any supports/prompts from the teacher.
6 The student completed five problems independently.
7 The instructor collected the worksheets after the student indicated he or she was done.
164
References
Anderson, J., Kutash, K., & Duchnowski, A. J. (2001). A comparison of the academic
progress of students with EBD and students with LD. Journal of Emotional and
Behavioral Disorders, 9(2), 106-116.
Baker, S., Gersten, R., & Lee, D. (2002). A synthesis of empirical research on teaching
mathemetics to low-achieving students. The Elementary School Journal, 103(1),
51-73.
Balanced Assessment Project Team. (1999). Middle grades assessment. White Plains,
NY: Dale Seymour Publications.
Barrett, J.E., & Clements, D.H. (2003). Quantifying path length: Fourth-grade children’s
developing abstractions for linear measurement. Cognition and Instruction, 21(4),
475-520.
Barrett, J.E., Jones, G., Thornton, C., & Dickson, S. (2003). Understanding children’s
developing strategies and concepts for length. In D.H. Clements & G. Bright
(Eds.) Learning and teaching measurement: 2003 Yearbook. Reston, VA:
National Council of Teachers of Mathematics.
Battista, M. (1982). Understanding area and area formulas. Mathematics Teacher, 75,
362-368.
Battista, M. (2003). Understanding student’s thinking about area and volume
measurement. In D.H. Clements & G. Bright (Eds.) Learning and teaching
measurement: 2003 Yearbook. Reston, VA: National Council of Teachers of
Mathematics.
Blackorby, J., Chorost, M., Garza, N., & Guzman, A. (2003). The academic performance
165
of secondary students with disabilities. In Wagner, M., Marder, C., Blackorby, J.,
Cameto, R., Newman, L., Levine, P., & Davies-Mercier, E. (with Chorost, M.,
Garza, N., Guzman, A., & Sumi, C.) The achievements of youth with disabilities
during secondary school. A report from the National Longitudinal Transition
Study-2 (NLTS2). Menlo Park, CA: SRI International.
Blackorby, J., Chorost, M., Garza, N., & Guzman, A. (2005). The academic performance
of elementary and middle school students with disabilities. In J. Blackorby, M.
Wagner, R. Cameto, E.Davies, P. Levine, L. Newman, C. Marder, and C. Sumi
(with M. Chorost, N. Garza, and A. Guzman) Engagement, academics, social
adjustment, and independence: The achievements of elementary and middle
school students with disabilities. A report from the Special Education Elementary
Longitudinal Study (SEELS). Menlo Park, CA: SRI International.
Bottge, B. (1999). Effects of contextualized math instruction on problem solving of
average and below-average achieving students. The Journal of Special Education,
33(2), 81-92.
Bottge, B.A., & Hasselbring, T.S. (1993). A comparison of two approaches for teaching
complex, authentic mathematics problems to adolescents in remedial math
classes. Exceptional Children, 59(6), 556-566.
Bottge, B.A., Heinrichs, M., Chan, S., Mehta, Z.D., & Watson, E. (2003). Effects of
video-based and applied problems on the procedural math skills of average- and
low-achieving adolescents. Journal of Special Education Technology, 18(2), 5-22.
Bottge, B.A., Heinrichs, M., Chan, S., & Serlin, R.C. (2001). Anchoring adolescents’
166
understanding of math concepts in rich problem-solving environments. Remedial
and Special Education, 22(5), 299-314.
Bottge, B.A., Heinrichs, M., Mehta, Z.D., & Watson, E. (2002). Weighing the benefits of
anchored math instruction for students with disabilities in general education
classes. The Journal of Special Education, 35(4), 186-200.
Boudah, D.J., & O’Neill, K.J. (1999). Learning strategies (ERIC/OSEP Digest E577).
Reston, VA: ERIC Clearinghouse on Disabilities and Gifted Education.
Bradley, R., Henderson, K., Monfore, D.A.(2004). A national perspective on children
with emotional disorders. Behavioral Disorders, 29(3), 211-223.
Braswell, J.S., Dion, G.S., Daane, M.C., & Jin, Y. (2005). The nation’s report card:
Mathematics 2003 (NCES 2005-451). U.S. Department of Education, Institute of
Education Sciences, National Center for Education Statistics, Washington, DC:
U.S. Government Printing Office.
Bruner, J.S. (1966). Patterns of growth. In Toward a theory of instruction (pp. 1-21).
Cambridge, MA: Belknap Press of Harvard University.
Bryant, D.P., Kim, S.A., Hartman, P., & Bryant, B.R. (2006). Standards-based
mathematics instruction and teaching middle school students with mathematical
disabilities. In In M. Montague and A. Jitendra (Eds.), Teaching mathematics to
middle school students with learning disabilities. New York: Guilford Press.
Butler, F.M., Miller, S.P., Crehan, K., Babbitt, B., & Pierce, T. (2003). Fraction
instruction for students with mathematics disabilities: Comparing two teaching
sequences. Learning Disabilities Research and Practice, 18(2), 99-111.
Cade, T., & Gunter, P.L. (2002). Teaching students with severe emotional or behavioral
167
disorders to use a musical mnemonic technique to solve basic division
calculations. Behavioral Disorders, 27(3), 208-214.
Calhoon, M.B., & Fuchs, L.S. (2003). The effects of peer-assisted learning strategies and
curriculum-based measurement on the mathematics performance of secondary
students with disabilities. Remedial and Special Education, 24(4), 235-245.
Carr, S.C., & Punzo, R.P. (1993). The effects of self-monitoring of academic accuracy
and productivity on the performance of students with behavioral disorders.
Behavioral Disorders, 18(4), 241-250.
Chappell, M.F., & Thompson, D.R. (1999). Perimeter or area? Which measure is it?
Mathematics Teaching in the Middle School, 5(1), 20-23.
Cortiella, C. (2005). No Child Left Behind: Determining appropriate assessment
accommodations for students with disabilities. Washington, DC: National Center
for Learning Disabilities.
Crowley, M.L. (1987). The van Hiele model of the development of geometric thought. In
M. Lindquist (ed.) Learning and teaching geometry, K-12: NCTM 1987 yearbook.
Reston, VA: The National Council of Teachers of Mathematics.
Dienes, Z. P. (1967). A theory of mathematics-learning. In Building up mathematics (pp.
19-36). London: Hutchinson Educational.
Fennell, F., & Rowan, T. (2001). Representation: An important process for teaching and
learning mathematics. Teaching Children Mathematics, 7(4), 288-292.
Fey, J., Fitzgerald, W., Friel, S., Lappan, G., & Phillips, E.D. (2004).
Connected mathematics: Covering and surrounding. Lansing, MI: Michigan State
University.
168
Franca, V.M., Kerr, M.M., Reitz, A.L., & Lambert, D. (1990). Peer tutoring among
behaviorally disordered students: Academic and social benefits to tutor and tutee.
Education and Treatment of Children, 13(2), 109-128.
Fuchs, L.S., & Fuchs, D. (2001). Principles for the prevention and intervention of
mathematics difficulties. Learning Disabilities Research & Practice, 16(2), 85-
95.
Gagnon, J.C., & Maccini, P. (2001). Preparing students with disabilities for algebra.
Teaching Exceptional Children, 34(1), 8-15.
Geary, D.C., Hoard, M.K., Nugent, L., & Byrd-Craven, J. (2007). Strategy use, long-term
memory, and working memory capacity. In D.B. Berch & M.M.M. Mazzocco
(Eds.) Why is math so hard for some children? Baltimore: Paul H. Brookes
Publishing Co.
Gersten, R., & Chard, D. (1999). Number sense: Rethinking arithmetic instruction for
students with mathematical disabilities. The Journal of Special Education, 35(1),
18-28.
Gersten, R., Fuchs, L.S., Compton, D., Coyne, M., Greenwood, C., & Innocenti, M.S.
(2005). Quality indicators for group experimental and quasi-experimental
research in special education. Exceptional Children, 71(2), 149-164.
Goldman, S.R., Hasselbring, T.S., & The Cognition and Technology Group at Vanderbilt.
(1997). Achieving meaningful mathematics literacy for students with learning
disabilities. Journal of Learning Disabilities, 30(2), 198-208.
Goldsmith, L.T., & Mark, J. (1999). What is a standards-based mathematics curriculum?.
169
Educational Leadership, 57(3), 40-44.
Graham, S., Harris, K.R., & Reid, R. (1998). Developing self-regulated learners. In R.J.
Whelan (Ed.) Emotional and behavioral disorders: A 25 year focus. Denver:
Love Publishing Company.
Greenbaum, P.E., & Dedrick, R.F. (1996). National Adolescent and Child Treatment
Study (NACTS): Outcomes for children with serious emotional and behavioral
disturbance. Journal of Emotional and Behavioral Disorders, 4(3), 130-147.
Gunter, P.L., & Denny, R.K. (1998). Trends and issues in research regarding academic
instruction of students with emotional and behavioral disorders. Behavioral
Disorders, 24(1), 44-50.
Hallahan, D.P., Lloyd, J., Kosiewicz, M.M., Kauffman, J.M., & Graves, A.W. (1979).
Self-monitoring of attention as a treatment for a learning disabled boy’s off-task
behavior. Learning Disability Quarterly, 2(3), 24-32.
Harris, K.R., Friedlander, B.D., Saddler, B., Frizzelle, R., & Graham, S. (2005). Self-
monitoring of attention versus self-monitoring of academic performance: Effects
among students with ADHD in the general education classroom. The Journal of
Special Education, 39(3), 145-156.
Hawkins, J., Brady, M.P., Hamilton, R., Williams, R.E., & Taylor, R.D. (1994). The
effects of independent and peer guided practice during instructional pauses on the
academic performance of students with behavioral disorders. Education and
Treatment of Children, 17(1), 1-28.
Hodge, J., Riccomini, P. J., Buford, R., & Herbst, M. (2006). A review of instructional
170
interventions in mathematics for students with emotional and behavioral
disorders. Behavioral Disorders, 31(3), 297-311.
Horner, R.D., & Baer, D.M. (1978). Multiple-probe technique: A variation of the
multiple baseline. Journal of Applied Behavior Analysis, 11(1), 189-196.
Horner, R.H., Carr, E.G., Halle, J., McGee, G., Odom, S., Wolery, M. (2005). The use of
single-subject research to identify evidence-based practice in special education.
Exceptional Children, 71(2), 165-179.
Hudson, P., & Miller, S.P. (2006). Designing and implementing mathematics instruction
for students with diverse learning needs. Boston: Pearson Education, Inc.
Individuals with Disabilities Education Act of 1997 (IDEA), 20 U.S.C. § 1400 et. seq.
Individuals with Disabilities Education Improvement Act of 2004 (IDEIA), P.L. 108-446,
20 U.S.C. § 1400 et. seq.
Jones, E.D., & Southern, W.T. (2003). Balancing perspectives on mathematics
instruction. Focus on Exceptional Children, 35(9), 3-16.
Kennedy, C.H. (2005). Single-case designs for educational research. Boston: Pearson
Education, Inc.
Lackay, T.D., & Margalit, M. (2006). Comparisons of achievement, effort, and self-
perceptions among students with learning disabilities and their peers from
different achievement groups. Journal of Learning Disabilities, 39(5), 432-446.
Landrum, T., Katsiyannis, A., & Archwamety, T. (2004). An analysis of placement and
exit patterns of students with emotional or behavioral disorders. Behavioral
Disorders, 29(2), 140-153.
Landrum, T.J., Tankersley, M., & Kauffman, J.M. (2003). What is special about special
171
education for students with emotional or behavioral disorders? The Journal of
Special Education, 37(3), 148-156.
Lane, K. L. (2004). Academic instruction and tutoring interventions for students with
emotional and behavioral disorders: 1990 to the present. In R.B. Rutherford,
M.M. Quinn, & S.R. Mathur (Eds.), Handbook of research in emotional and
behavioral disorders (pp. 462-486). New York: The Guilford Press.
Learning Technology Center at Vanderbilt University (1992). The adventures of Jasper
Woodbury. Nashville, TN: Vanderbilt University.
Lemke, M., Sen, A., Pahlke, E., Partelow, L., Miller, D., Williams, T., Kastberg, D.,
Jocelyn, L. (2004). International outcomes of learning in mathematics literacy
and problem solving: PISA 2003 results from the U.S. perspective (NCES 2005-
003). Washington DC: U.S. Department of Education, Institute of Education
Science, National Center for Education Statistics.
Lloyd, J.W., & Heubush, J.D. (1996). Issues of social validation in research on serving
individuals with emotional or behavioral disorders. Behavioral Disorders, 22(1),
8-14.
Maccini, P. (1998). Effects of an instructional strategy incorporating concrete problem
representation on the introductory algebra performance of secondary students
with learning disabilities. Unpublished doctoral dissertation, Pennsylvania State
University.
Maccini, P., & Gagnon, J.C. (2000). Best practices for teaching mathematics to
secondary students with special needs. Focus on Exceptional Children, 32(5), 1-
23.
172
Maccini, P., & Gagnon, J.C. (2002). Perceptions and application of NCTM standards by
special and general education teachers. Exceptional Children, 68(3), 325-344.
Maccini, P., & Gagnon, J.C. (2006). Mathematics instructional practices and assessment
accommodations by secondary special and general educators. Exceptional
Children, 72(2), 217-234.
Maccini, P., & Hughes, C. (1997). Mathematics interventions for adolescents with
learning disabilities. Learning Disabilities Research and Practice, 12(3), 168-176.
Maccini, P., & Hughes, C.A. (2000). Effects of a problem-solving strategy on the
introductory algebra performance of secondary students with learning disabilities.
Learning Disabilities Research and Practice, 15(1), 10-21.
Maccini, P., & Ruhl, K. (2000). Effects of a graduated instructional sequence on the
algebraic subtraction of integers by secondary students with learning disabilities.
Education and Treatment of Children, 23, 465-489.
Malloy, C.E. (1999). Perimeter and area through the Van Hiele model. Mathematics
Teaching in the Middle School, 5(2), 87-90.
Mastropieri, M.A., Scruggs, T.E., & Shiah, S. (1991). Mathematics instruction for
learning disabled students: A review of research. Learning Disabilities Research
and Practice, 6, 89-98.
McQuillan, K., DuPaul, G.J., Shapiro, E.S., & Cole, C.L. (1996). Classroom
performance of students with serious emotional disturbance: A comparative study
of evaluation methods for behavior management. Journal of Emotional and
Behavioral Disorders, 4(3), 162-170.
Meltzer, L., Reddy, R., Pollica, M.S., Roditi, B., Sayer, J., & Theokas, C. (2004).
173
Positive and negative self-perceptions: Is there a cyclical relationship between
teachers’ and students’ perceptions of effort, strategy use, and academic
performance? Learning Disabilities Research & Practice, 19(3), 33-44.
Mercer, C. D., & Pullen, P.C. (2005). Students with learning disabilities (6th ed.). Upper
Saddle River, NJ: Pearson Prentice Hall.
Mistretta, R.M. (2000). Enhancing geometric reasoning. Adolescence, 35(138), 355-379.
Montague, M. (2004). Math problem solving for middle school students with disabilities.
Washington, DC: The Access Center: Improving Outcomes for all Students K-8.
Retrieved on May 3, 2007, from http://www.k8accesscenter.org/
Montgomery County Public Schools. (2003). Mathematics instructional guide. Rockville,
MD: author.
Mooney, P., Epstein, M.H., Reid, R., & Nelson, J.R. (2003). Status of and trends in
academic intervention research for students with emotional disturbance. Remedial
and Special Education, 24(5), 273-287.
Mulcahy, C.A., & Gagnon, J.C. (2007). Teaching mathematics to secondary students
with emotional/behavioral disorders. Manuscript submitted for publication.
Mullis, I.V.S., Martin, M.O., Gonzalez, E.J., & Chrostowski, S.J. (2004). TIMSS 2003
international mathematics report. Chestnut Hill, MA: TIMSS & PIRLS
International Study Center, Boston College.
National Center for Education Statistics. (2004). The nation’s report card: Mathematics
highlights 2003 (NCES 2004-451). Jessup, MD: U.S. Department of Education,
ED Pubs.
National Center for Education Statistics. (n.d.). TIMSS 2003 results. Retrieved on August
174
22, 2005, from http://nces.ed.gov/timss/.
National Council of Teachers of Mathematics (NCTM). (1989). Curriculum and
evaluation standards for school mathematics. Reston, VA: Author.
National Council of Teachers of Mathematics (NCTM). (2000). Principles and standards
for school mathematics: An overview. Retrieved on October 19, 2005, from
www.nctm.org/standards/
National Research Council. (2001). Adding it up: Helping children learn mathematics. J.
Kilpatrick, J. Swafford, and B. Findell (Eds.) Mathematics Learning Study
Committee, Center for Education, Division of Behavioral and Social Sciences and
Education. Washington, DC: National Academy Press.
Nelson, J.R., Benner, G.J., Lane, K., & Smith, B.W. (2004). Academic achievement of
K-12 students with emotional and behavioral disorders. Exceptional Children,
71(1), 59-73.
No Child Left Behind Act of 2001, Pub. L. No. 107-110, 115 Stat. 1425 (2002).
Odom, S.L., Brantlinger, E., Gersten, R., Horner, R.H., Thompson, B., Harris, K.R.
(2005). Research in special education: Scientific methods and evidence-based
practices. Exceptional Children, 71(2), 137-148.
Parmar, R.S., Cawley, J.F., & Frazita, R.R. (1996). Word problem-solving by students
with and without mild disabilities. Exceptional Children, 62(5), 415-429.
Pierce, C.D., Reid, R., & Epstein, M.H. (2004). Teacher-mediated interventions for
children with EBD and their academic outcomes: A review. Remedial and Special
Education, 25(3), 175-188.
Rectanus, C. (1997). Math by all means: Area and perimeter grades 5-6. White Plains,
175
NY: Math Solutions Publications.
Reid, R. (1996). Research in self-monitoring with students with learning disabilities: The
present, the prospects, the pitfalls. Journal of Learning Disabilities, 29(3), 317-
331.
Reid, R., Gonzalez, J.E., Nordness, P.D., Trout, A., & Epstein, M.H. (2004). A meta –
analysis of the academic status of students with emotional/behavioral disturbance.
The Journal of Special Education, 38(3), 130-143.
Reid, R., & Harris, K.H. (1993). Self-monitoring of attention versus self-monitoring of
performance: Effects on attention and academic performance. Exceptional
Children, 60(1), 29-40.
Reid, R., Trout, A.L., & Schartz, M. (2005). Self-regulation interventions for children
with Attention Deficit/Hyperactivity Disorder. Exceptional Children, 71(4), 361-
377.
Resnick, L.B., & Ford, W.W. (1981). The psychology of mathematics for instruction.
Hillsdale, NJ: Lawrence Erlbaum Associates, Inc.
Rosenshine, B., & Stevens, R. (1986). Teaching functions. In M.C. Wittrock (Ed.),
Handbook of research on teaching (3rd ed., pp. 376-391). New York: MacMillan
Publishing Company.
Ruhl, K.L., & Berlinghoff, D.H. (1992). Research on improving behaviorally disordered
students’ academic performance: A review of the literature. Behavioral
Disorders, 17(3), 178-190.
Sabornie, E.J., Cullinan, D., Osborne, S.S., & Brock, L.B. (2005). Intellectual, academic,
176
and behavioral functioning of students with high-incidence disabilities: A cross-
categorical meta-analysis. Exceptional Children, 72(1), 47-64.
Schloss, P.J., Smith, M.A., & Schloss, C.N. (2001). Instructional methods for secondary
students with learning and behavior problems. (3rd ed.). Boston: Allyn and Bacon.
Skemp, R. (1987). Relational understanding and instrumental understanding. In The
psychology of learning mathematics (pp.152-163). Mahwah, NJ: Erlbaum.
Smith, K.S., & Geller, C. (2004). Essential principles of effective mathematics
instruction: Methods to reach all students. Preventing School Failure, 48(4), 22-
29.
State of Maryland. (2004). Voluntary state curriculum. Baltimore, Maryland: Author.
Stevens, R., & Rosenshine, B. (1981). Advances in research on teaching. Exceptional
Children, 2(1), 1-9.
Stiff, L.V. (2001). Constructivist mathematics and unicorns. Retrieved on March 23,
2006, from www.nctm.org/news/pastpresident/2001-0708presidenthtm.
Stodden, R.A., Galloway, L.A., & Stodden, N.J. (2003). Secondary school curricula
issues: Impact on postsecondary students with disabilities. Exceptional Children,
70(1), 9-25.
Strutchens, M.E., Martin, W.G., & Kenney, P.A. (2003). What students know about
measurement: Perspectives from the NAEP. In D.H. Clements & G. Bright (Eds.)
Learning and teaching measurement: 2003 yearbook. Reston, VA: National
Council of Teachers of Mathematics.
Swain, J.C., & McLaughlin, T.F. (1998). The effects of bonus contingencies in a
177
classwide token program on math accuracy with middle-school students with
behavioral disorders. Behavioral Interventions, 13, 11-19.
Tawney, J.W., & Gast, D.L. (1984). Single-subject research in special education.
Columbus: Charles E. Merrill Publishing Company.
Thurlow, M.L., Moen, R.E., & Wiley, H.I. (2005). Annual performance reports: 2002-
2003 state assessment data. Minneapolis, MN: University of Minnesota, National
Center on Educational Outcomes. Retrieved December 16, 2005, from the World
Wide Web: http://education.umn.edu/NCEO/OnlinePubs/.
Trout, A.L., Nordness, P.D., Pierce, C.D., & Epstein, M.H. (2003). Research on the
academic status of children with emotional and behavioral disorders: A review of
the literature from 1961 to 2000. Journal of Emotional and Behavioral Disorders,
11(4), 198-210.
Uberti, H.Z., Mastropieri, M., & Scruggs, T.E. (2004). Check it off: Individualizing a
math algorithm for students with disabilities via self-monitoring checklists.
Intervention in School and Clinic, 39(5), 269-275.
U.S. Department of Education, Office of Special Education and Rehabilitative Services,
Office of Special Education Programs. (2005). 26th Annual (2004) Report to
Congress on the Implementation of the Individuals with Disabilities Education
Act, vol. 1. Washington, D.C.: Author.
Van de Walle, J.A. (2004). Elementary and middle school mathematics (5th ed.). Boston:
Pearson Education.
Vergason, G.A., and Anderegg, M. L. (1997). Dictionary of special education and
rehabilitation (4th ed.). Denver, CO: LOVE Publishing.
178
Wagner, M. (1995). Outcomes for youths with serious emotional disturbance in
secondary school and early adulthood. The Future of Children, 5(2), 90-112.
Wagner, M., & Cameto, R. (2004). The characteristics, experiences, and outcomes of
youth with emotional disturbances. NLTS Data Brief, 3(2).
Wagner, M., Kutash, K., Duchnowski, A.J., Epstein, M.H., & Sumi, C.W. (2005). The
children and youth we serve: A national picture of the characteristics of students
with emotional disturbances receiving special education. Journal of Emotional
and Behavioral Disorders, 13(2), 79-96.
Wagner, M., Newman, L., Cameto, R., & Levine, P. (2005). Changes over time in the
early postschool outcomes of youth with disabilities: A report of findings from the
National Longitudinal Transition Study (NLTS) and the National Longitudinal
Transition Study-2 (NLTS2). Menlo Park, CA: SRI International.
Walter, M. (1970). A common misconception about area. The Arithmetic Teacher, 17,
286-289.
Ward, C.D. (2001). Under construction: On becoming a constructivist in view of the
Standards. Mathematics Teacher, 94(2), 94-96.
Wehby, J.H., Lane, K.L., & Falk, K.B. (2003). Academic instruction for students with
emotional and behavioral disorders. Journal of Emotional and Behavioral
Disorders, 11(4), 194-197.
Woodcock, R. W., McGrew, K. S., & Mather, N. (2001). Woodcock-Johnson III. Itasca,
IL: Riverside Publishing.
Woodward, J. (2006). Making reform-based mathematics work for academically low-
achieving middle school students. In M. Montague and A. Jitendra (Eds.),
179
Teaching mathematics to middle school students with learning disabilities.
New York: Guilford Press.
Woodward, J., & Montague, M. (2002). Meeting the challenge of mathematics reform for
students with LD. The Journal of Special Education, 36(2), 89-101.
Xin, Y.P., & Jitendra, A.K. (1999). The effects of instruction in solving
mathematical word problems for students with learning problems: A meta-
analysis. The Journal of Special Education, 32(4), 207-225.