Embed Size (px)
Citation preview
Article
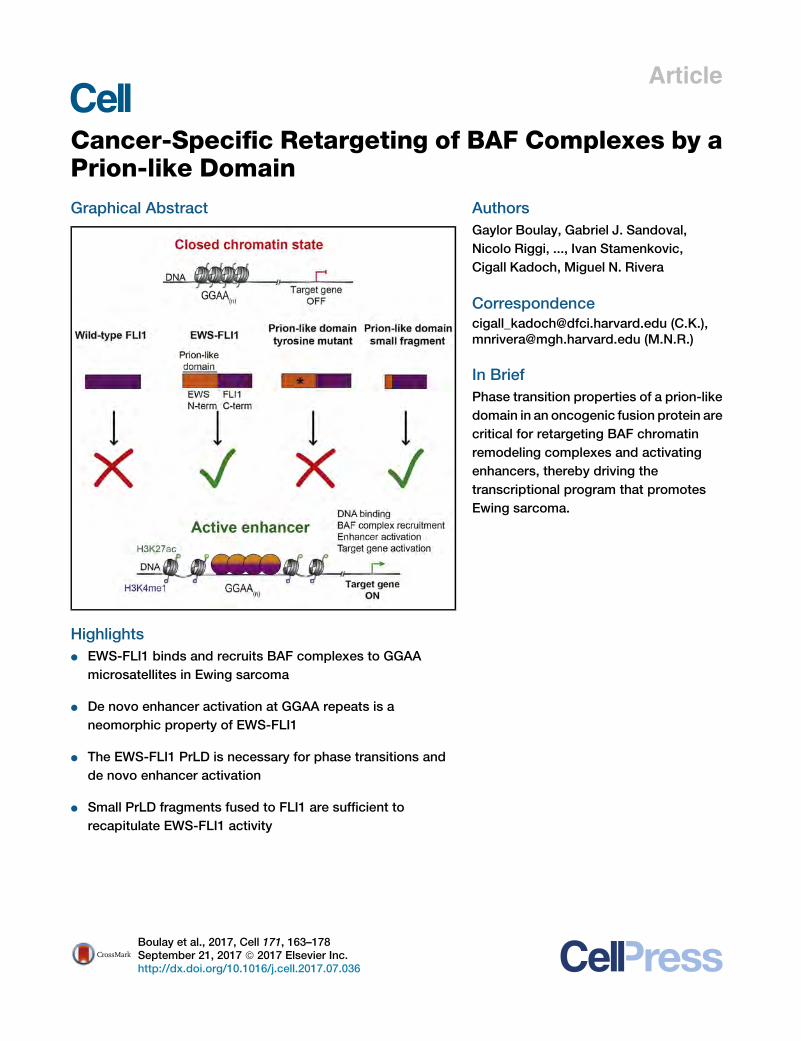
Cancer-Specific Retargeting of BAF Complexes by a
Prion-like DomainGraphical Abstract
Highlights
d EWS-FLI1 binds and recruits BAF complexes to GGAA
microsatellites in Ewing sarcoma
d De novo enhancer activation at GGAA repeats is a
neomorphic property of EWS-FLI1
d The EWS-FLI1 PrLD is necessary for phase transitions and
de novo enhancer activation
d Small PrLD fragments fused to FLI1 are sufficient to
recapitulate EWS-FLI1 activity
Boulay et al., 2017, Cell 171, 163–178September 21, 2017 ª 2017 Elsevier Inc.http://dx.doi.org/10.1016/j.cell.2017.07.036
Authors
Gaylor Boulay, Gabriel J. Sandoval,
Nicolo Riggi, ..., Ivan Stamenkovic,
Cigall Kadoch, Miguel N. Rivera
[email protected] (C.K.),[email protected] (M.N.R.)
In Brief
Phase transition properties of a prion-like
domain in an oncogenic fusion protein are
critical for retargeting BAF chromatin
remodeling complexes and activating
enhancers, thereby driving the
transcriptional program that promotes
Ewing sarcoma.
Article
Cancer-Specific Retargeting of BAFComplexes by a Prion-like DomainGaylor Boulay,1,3,5,6 Gabriel J. Sandoval,2,3,6 Nicolo Riggi,4 Sowmya Iyer,1 Remi Buisson,5 Beverly Naigles,1,5
Mary E. Awad,1,5 Shruthi Rengarajan,1,5 Angela Volorio,1,4,5 Matthew J. McBride,2,3 Liliane C. Broye,4 Lee Zou,5
Ivan Stamenkovic,4 Cigall Kadoch,2,3,7,* and Miguel N. Rivera1,3,5,7,8,*1Department of Pathology, Massachusetts General Hospital and Harvard Medical School, Boston, MA 02114, USA2Dana-Farber Cancer Institute and Harvard Medical School, Boston, MA 02215, USA3Broad Institute of Harvard and MIT, Cambridge, MA 02142, USA4Institute of Pathology, Centre Hospitalier Universitaire Vaudois, Faculty of Biology and Medicine, University of Lausanne, 1011 Lausanne,
Switzerland5Center for Cancer Research, Massachusetts General Hospital and Harvard Medical School, Charlestown, MA 02129, USA6These authors contributed equally7Senior author8Lead Contact*Correspondence: [email protected] (C.K.), [email protected] (M.N.R.)
http://dx.doi.org/10.1016/j.cell.2017.07.036
SUMMARY
Alterations in transcriptional regulators can orches-trate oncogenic gene expression programs incancer. Here, we show that the BRG1/BRM-associ-ated factor (BAF) chromatin remodeling complex,which is mutated in over 20% of human tumors,interacts with EWSR1, a member of a family ofproteins with prion-like domains (PrLD) that arefrequent partners in oncogenic fusions with tran-scription factors. In Ewing sarcoma, we find thatthe BAF complex is recruited by the EWS-FLI1fusion protein to tumor-specific enhancers andcontributes to target gene activation. This processis a neomorphic property of EWS-FLI1 comparedto wild-type FLI1 and depends on tyrosine residuesthat are necessary for phase transitions of theEWSR1 prion-like domain. Furthermore, fusion ofshort fragments of EWSR1 to FLI1 is sufficient torecapitulate BAF complex retargeting and EWS-FLI1 activities. Our studies thus demonstrate thatthe physical properties of prion-like domains canretarget critical chromatin regulatory complexesto establish and maintain oncogenic gene expres-sion programs.
INTRODUCTION
Temporal and spatial regulation of gene expression plays a
fundamental role in directing cell identity and proliferation in
both normal tissues and in human disease. The striking number
of genetic alterations in genes encoding transcription factors,
chromatin modifiers, and histones that have been uncovered
in recent whole-exome sequencing efforts have further high-
lighted the importance of gene regulation in cancer (Lander,
2011). Whereas these alterations can have profound conse-
quences on cancer-specific gene expression, their precise
mechanisms of action, in most cases, remain poorly
understood.
In contrast to most adult tumor types, pediatric cancers are
often driven by a limited number of genetic alterations (Law-
rence et al., 2013). Pathognomonic chromosomal translocations
represent an important class of these abnormalities and often
lead to the formation of oncogenic fusion proteins that involve
transcription factors or transcriptional regulators. One of the
most well-characterized translocations results in the fusion of
the EWSR1 gene and the FLI1 E-Twenty Six (ETS) transcription
factor in Ewing sarcoma, the second most common pediatric
bone cancer (Delattre et al., 1992). The EWS-FLI1 oncogenic
fusion protein is often the only genetic alteration in these tumors
(Brohl et al., 2014; Crompton et al., 2014; Tirode et al., 2014)
and operates as an aberrant transcription factor containing
the ETS DNA-binding domain of FLI1. EWSR1 has been linked
to transcriptional activation and RNA binding (Kovar, 2011),
yet its contribution to the function of EWS-FLI1 remains
poorly defined.
Several studies have shown that EWS-FLI1 is necessary for
Ewing sarcoma tumorigenicity (Herrero-Martin et al., 2011) and
is sufficient for transformation of mesenchymal stem cells
(MSCs) (Riggi et al., 2005, 2008). More recently, EWS-FLI1 has
been shown to be a major determinant of genome-wide chro-
matin states in Ewing sarcoma (Riggi et al., 2014; Tomazou
et al., 2015). Strikingly, EWS-FLI1 is able to activate a large set
of target genes by operating as a pioneer factor at GGAA micro-
satellite repeats and inducing active enhancers de novo starting
from a closed chromatin conformation (Gangwal et al., 2008;
Guillon et al., 2009; Patel et al., 2012; Riggi et al., 2014). This pro-
cess of enhancer activation requires major restructuring of the
chromatin environment, suggesting the participation of chro-
matin remodeling proteins that have yet to be defined.
The mammalian switch/sucrose non-fermentable (SWI/SNF)
(or BAF, for BRG1/BRM-associated factor) complex is an ATP-
dependent chromatin remodeler composed of 12–15 subunits
Cell 171, 163–178, September 21, 2017 ª 2017 Elsevier Inc. 163
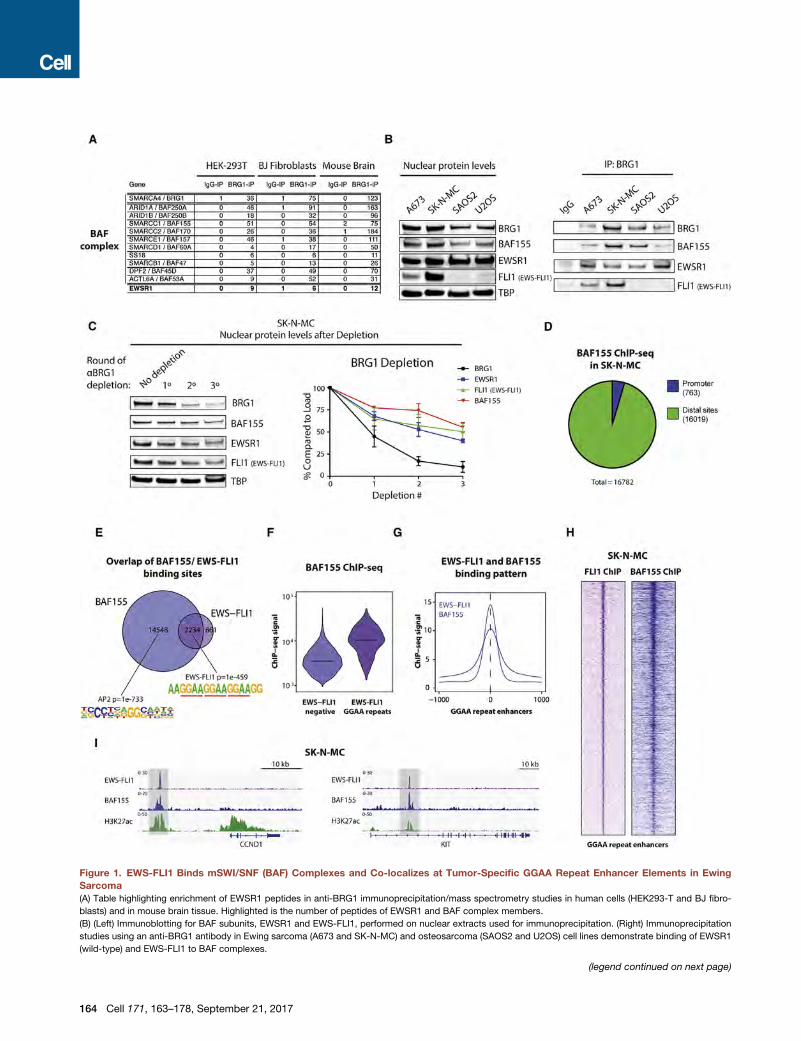
Figure 1. EWS-FLI1 Binds mSWI/SNF (BAF) Complexes and Co-localizes at Tumor-Specific GGAA Repeat Enhancer Elements in Ewing
Sarcoma
(A) Table highlighting enrichment of EWSR1 peptides in anti-BRG1 immunoprecipitation/mass spectrometry studies in human cells (HEK293-T and BJ fibro-
blasts) and in mouse brain tissue. Highlighted is the number of peptides of EWSR1 and BAF complex members.
(B) (Left) Immunoblotting for BAF subunits, EWSR1 and EWS-FLI1, performed on nuclear extracts used for immunoprecipitation. (Right) Immunoprecipitation
studies using an anti-BRG1 antibody in Ewing sarcoma (A673 and SK-N-MC) and osteosarcoma (SAOS2 and U2OS) cell lines demonstrate binding of EWSR1
(wild-type) and EWS-FLI1 to BAF complexes.
(legend continued on next page)
164 Cell 171, 163–178, September 21, 2017
that regulates genomic architecture and DNA accessibility (Ka-
doch and Crabtree, 2015). Recent exome-sequencing studies
have revealed that the genes encoding BAF complex subunits
are recurrently mutated in over 20% of human cancers (Kadoch
et al., 2013). Interestingly, specific subunits appear to be
mutated in different cancer subtypes, suggesting tissue-
specific functions (Kadoch and Crabtree, 2015; Kadoch et al.,
2013; Roberts et al., 2002; Versteege et al., 1998). The high
frequency of alterations in BAF complex subunits across a
range of tumor types points to their critical role in controlling
chromatin architecture and gene expression in cancer (Kadoch
and Crabtree, 2015).
Using an unbiased mass spectrometry approach, we now
show that BAF complexes interact with the wild-type protein
EWSR1 in several cell types and with the EWS-FLI1 fusion pro-
tein in Ewing sarcoma. The BAF complex is specifically recruited
by EWS-FLI1 to tumor-specific GGAA repeat microsatellites
and is necessary for the activation of target genes. Remarkably,
the ability to recruit BAF complexes and activate enhancers
de novo at these repeat sites is a neomorphic property of
EWS-FLI1 that depends on tyrosine residues in the EWSR1
prion-like domain, which are necessary for its interaction with
wild-type EWSR1 and for its phase transition properties
in vitro. These observations expand the set of human cancers
in which BAF complex mistargeting contributes to oncogenesis
beyond settings in which BAF complex genes themselves are
mutated and show that recruitment via a prion-like domain is a
powerful means of retargeting critical chromatin regulatory com-
plexes to tumor-specific loci.
RESULTS
BAF Complexes Interact with Wild-Type EWSR1 and theFusion Protein EWS-FLI1BAF complexes are combinatorially assembled from a set of
ubiquitously expressed core subunits as well as many cell-
type- and context-specific subunits that give rise to an exten-
sive diversity of complex configurations. In order to identify
the constellation of BAF complex subunits and associated pro-
teins, we performed endogenous capture of BAF complexes via
anti-BRG1 immunoprecipitation followed by proteomic mass
spectrometry in several cell types. Notably, these experiments
revealed substantial enrichment of peptides corresponding to
the EWSR1 protein, among several other previously unidentified
(C) (Left) Immunodepletion studies performed on SK-N-MC Ewing sarcoma nuc
experiments using quantitative densitometry is shown. Error bars represent SEM
(D) Distribution of MACS-called BAF155 ChIP-seq peaks in SK-N-MC Ewing sar
putative enhancer sites. Promoters are annotated using the Refseq promoter da
(E) Venn diagram depicting the overlap of BAF155 and EWS-FLI1 (FLI1) MACS-ca
BAF155-only or BAF155/EWS-FLI1 overlap are shown.
(F) Total BAF155 ChIP-seq signals at BAF-155-only sites (n = 14,548) and sites co-
(G) Composite plot shows EWS-FLI1 and BAF155 ChIP-seq signals at overlappin
EWS-FLI1 binding sites.
(H) Heatmaps showing EWS-FLI1 and BAF155 ChIP-seq signal density in Ewing
FLI1-bound GGAA repeat enhancer sites (n = 812).
(I) Representative examples of EWS-FLI1 and BAF155 co-occupancy shown at G
regions are highlighted in light gray.
See also Figure S1.
proteins (Figure 1A). EWSR1 has been linked to several cellular
processes, but most notably it has been shown to be directly
involved in gene regulation as a frequent partner in oncogenic
fusion proteins with transcription factors, such as the EWS-
FLI1 protein in Ewing sarcoma (Mertens et al., 2016). Given
the strong connection between BAF and gene regulation in
cancer, we proceeded to confirm whether EWSR1 as well as
the EWS-FLI1 fusion protein can interact with BAF complexes.
Immunoprecipitation experiments using antibodies specific for
BRG1 performed on nuclear extracts isolated from EWSR1
wild-type cells (SAOS2 and U2OS) or EWS-FLI1-positive
Ewing sarcoma cell lines revealed that both EWSR1 and the
EWS-FLI1 fusion protein interact with BAF complexes (Fig-
ure 1B). Reciprocal immunoprecipitation experiments using an
antibody specific for EWSR1 confirmed these interactions
(Figure S1A). Similar experiments using antibodies specific to
additional BAF complex subunits, BAF155 and SS18, also
confirmed these interactions with EWS-FLI1 in Ewing sarcoma
(Figure S1B).
To further characterize the interaction of EWS-FLI1 with BAF
complexes, we performed immunodepletion experiments using
an anti-BRG1 antibody in SK-N-MC Ewing sarcoma cell nuclear
extracts to determine the relative fraction of EWS-FLI1 bound to
BAF complexes. We found that EWS-FLI1 was significantly
depleted from nuclear lysates over three rounds of anti-
BRG1 immunoprecipitation, suggesting that a high percentage
of total nuclear EWS-FLI1 associates with BAF complexes
(Figure 1C). Reciprocal immunodepletion experiments using
an EWSR1 antibody were only able to slightly deplete BAF com-
plex components, indicating that only a small percentage of to-
tal BAF complexes are bound to EWS-FLI1 and wild-type
EWSR1 (Figure S1C), consistent with genome-wide activities
for this chromatin remodeling complex that are independent
of these proteins. This was further substantiated by density
sedimentation experiments, which showed that neither
EWSR1 nor EWS-FLI1 were core members of the BAF complex
(Figure S1D). Similarly, urea denaturation studies showed
that EWSR1 interactions with BAF complex subunits were
decreased at �0.5 M urea (Figure S1E) and were thus weaker
than those observed between core BAF complex members
(R2.5 M urea; Kadoch and Crabtree, 2013). Taken together,
these data demonstrate that both wild-type EWSR1 and the
oncogenic fusion protein EWS-FLI1 interact with BAF com-
plexes in a transient manner.
lear extracts using an anti-BRG1 antibody. (Right) Quantification of depletion
of n = 2 independent experiments.
coma cells. BAF complexes (as marked by BAF155) are primarily localized at
tabase.
lled peaks in Ewing sarcoma SK-N-MC cells. The top motifs for distal sites with
bound with EWS-FLI1 at GGAA repeats (n = 660) as represented by violin plots.
g GGAA repeat binding sites. The x axis represents a 2-kb window centered on
sarcoma SK-N-MC cells. 10-kb windows in each panel are centered on EWS-
GAA repeat enhancers associated with the CCND1 and KIT genes. Enhancer
Cell 171, 163–178, September 21, 2017 165
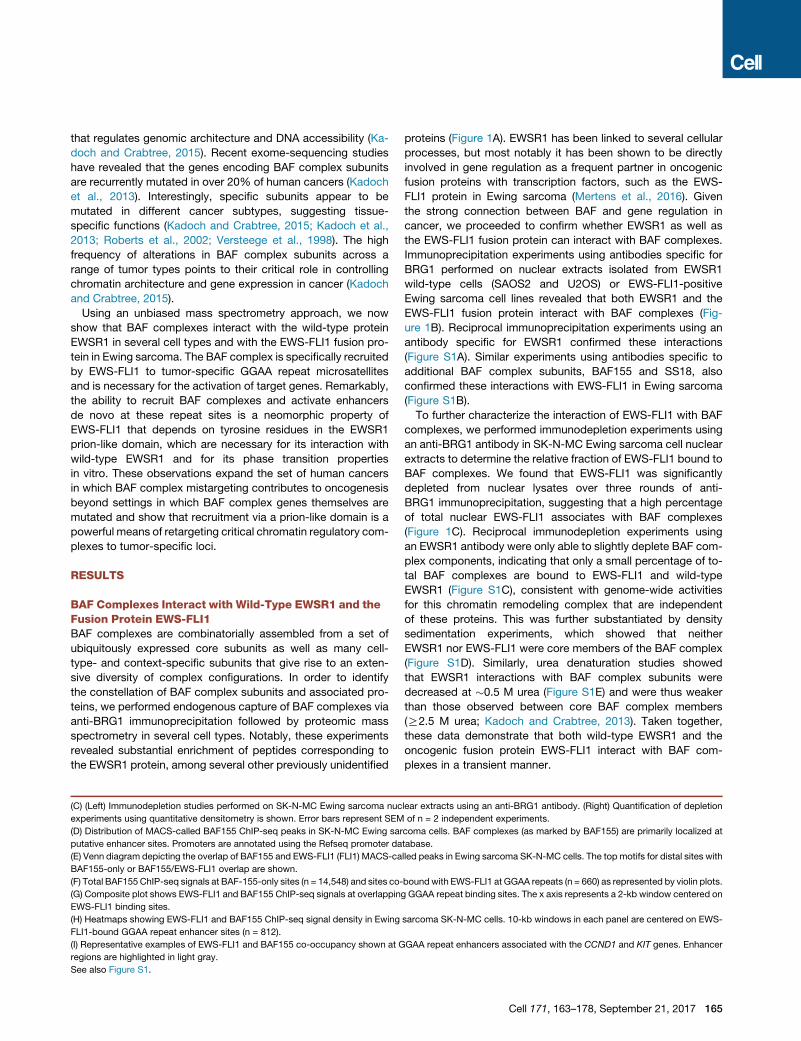
Figure 2. Interdependency of EWS-FLI1 and BAF Complexes in Driving Oncogenic Gene Expression Programs in Ewing Sarcoma(A) shRNA-mediated suppression of EWS-FLI1 (versus shGFP as control) in SK-N-MC Ewing sarcoma cells; immunoblot for FLI1 (EWS-FLI1), EWSR1, and BAF
complex subunits performed on nuclear extracts.
(B) Heatmaps showing EWS-FLI1 and BAF155 ChIP-seq signal density in SK-N-MC cells treated with either shGFP control or shEWS-FLI1 knockdown. 10-kb
windows in each panel are centered on EWS-FLI1-bound GGAA repeat enhancer sites (n = 812).
(C) Example tracks demonstrating decreased binding of BAF155 at EWS-FLI1-bound GGAA repeat enhancers associated with KIT, CCND1, and NKX2-2 in SK-
N-MC cells treated with either shGFP or shEWS-FLI1 knockdown. Enhancer regions of interest are highlighted in light gray.
(D) BAF155 occupancy is decreased specifically at GGAA repeat regions following EWS-FLI1 knockdown in SK-N-MC cells. Boxplots depict the changes in
BAF155 ChIP-seq signals between SK-N-MC cells treated with either shGFP or shEWS-FLI1 knockdown. BAF155 MACS-called peaks are divided into EWS-
FLI1-bound GGAA repeat enhancers (n = 660 sites, purple) and BAF155-only sites (n = 14,548 peaks, blue).
(legend continued on next page)
166 Cell 171, 163–178, September 21, 2017
EWS-FLI1 Recruits BAF Complexes to Tumor-SpecificGGAA Microsatellite Repeat Enhancers to ActivateTarget Gene ExpressionOwing to the biochemical interaction between BAF complexes
and EWS-FLI1, we next sought to determine whether BAF
complexes cooperate with EWS-FLI1 to regulate gene expres-
sion in Ewing sarcoma. We recently demonstrated that EWS-
FLI1 operates as a pioneer factor to induce tumor-specific de
novo enhancers at GGAA microsatellite repeats (Riggi et al.,
2014), a process that may involve significant redistribution
of chromatin remodeling complexes that directly govern DNA
accessibility, such as BAF (Phelan et al., 1999). To address a
potential collaborative role in this process, we performed chro-
matin immunoprecipitation followed by high-throughput DNA
sequencing (ChIP-seq) studies to localize BAF complexes
and EWS-FLI1 occupancy in the Ewing sarcoma cell line SK-
N-MC, using BAF155 and FLI1 antibodies, respectively. The ma-
jority (95.4%) of BAF155 peaks were detected at putative
enhancer regions (Figures 1D and S1F). Moreover, we detected
a striking degree of overlap between BAF155 and EWS-FLI1
sites genome-wide, for which the GGAA repeat was the top-
ranked DNA motif (Figure 1E).
In addition to substantial co-localization, median BAF155
peak occupancy was 2-fold higher at EWS-FLI1-bound GGAA
repeats compared to all other genomic locations (Figure 1F)
and was centered on EWS-FLI1 peaks (Figures 1G–1I and
S1G), suggesting that the localization of BAF complexes may
be dependent on EWS-FLI1 binding. To test this hypothesis,
we depleted EWS-FLI1 in SK-N-MC Ewing sarcoma cells using
short hairpin RNAs (shRNAs) and found that suppression of
EWS-FLI1 led to an almost complete disappearance of BAF
complex occupancy at GGAA repeats (Figures 2A–2C and
S2A), whereas other BAF155 peaks outside these GGAA
enhancer regions remained unaffected (Figure 2D). These re-
sults were further validated by ChIP-qPCR for BAF155 occu-
pancy over selected loci containing GGAA repeats, including
CCND1, SOX2, NR0B1, and LINC00221 (Figures 2E and
S2B), as well as by using an antibody that recognizes the alter-
native BAF ATPase core subunits BRG1/BRM (Figures S2C–
S2E). To account for possible effects of the cell cycle arrest
observed after EWS-FLI1 knockdown (Tanaka et al., 1997),
we arrested A673 cells in the G1 phase prior to performing
ChIP-qPCR (Figure S2F) and co-immunoprecipitation assays
(Figure S2G). Interactions and recruitment at chromatin were
stable in these conditions, further confirming the specificity
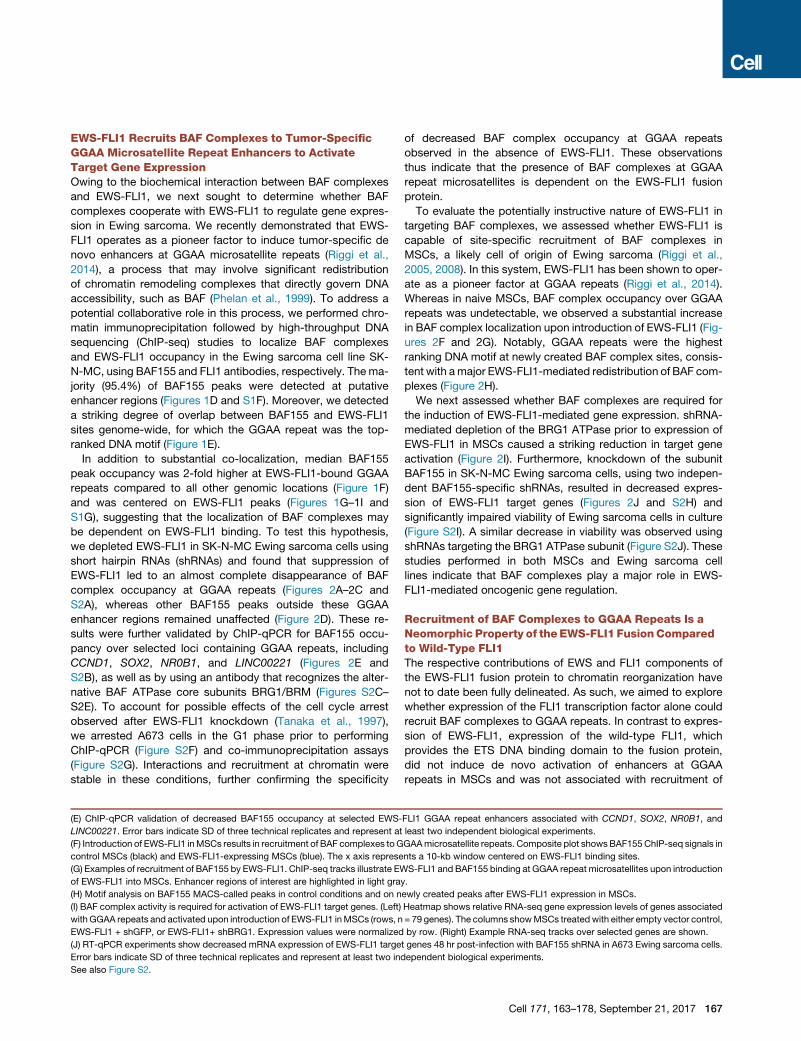
(E) ChIP-qPCR validation of decreased BAF155 occupancy at selected EWS-
LINC00221. Error bars indicate SD of three technical replicates and represent at
(F) Introduction of EWS-FLI1 inMSCs results in recruitment of BAF complexes to G
control MSCs (black) and EWS-FLI1-expressing MSCs (blue). The x axis represe
(G) Examples of recruitment of BAF155 by EWS-FLI1. ChIP-seq tracks illustrate EW
of EWS-FLI1 into MSCs. Enhancer regions of interest are highlighted in light gra
(H) Motif analysis on BAF155 MACS-called peaks in control conditions and on n
(I) BAF complex activity is required for activation of EWS-FLI1 target genes. (Left)
with GGAA repeats and activated upon introduction of EWS-FLI1 inMSCs (rows, n
EWS-FLI1 + shGFP, or EWS-FLI1+ shBRG1. Expression values were normalized
(J) RT-qPCR experiments show decreased mRNA expression of EWS-FLI1 targe
Error bars indicate SD of three technical replicates and represent at least two in
See also Figure S2.
of decreased BAF complex occupancy at GGAA repeats
observed in the absence of EWS-FLI1. These observations
thus indicate that the presence of BAF complexes at GGAA
repeat microsatellites is dependent on the EWS-FLI1 fusion
protein.
To evaluate the potentially instructive nature of EWS-FLI1 in
targeting BAF complexes, we assessed whether EWS-FLI1 is
capable of site-specific recruitment of BAF complexes in
MSCs, a likely cell of origin of Ewing sarcoma (Riggi et al.,
2005, 2008). In this system, EWS-FLI1 has been shown to oper-
ate as a pioneer factor at GGAA repeats (Riggi et al., 2014).
Whereas in naive MSCs, BAF complex occupancy over GGAA
repeats was undetectable, we observed a substantial increase
in BAF complex localization upon introduction of EWS-FLI1 (Fig-
ures 2F and 2G). Notably, GGAA repeats were the highest
ranking DNA motif at newly created BAF complex sites, consis-
tent with amajor EWS-FLI1-mediated redistribution of BAF com-
plexes (Figure 2H).
We next assessed whether BAF complexes are required for
the induction of EWS-FLI1-mediated gene expression. shRNA-
mediated depletion of the BRG1 ATPase prior to expression of
EWS-FLI1 in MSCs caused a striking reduction in target gene
activation (Figure 2I). Furthermore, knockdown of the subunit
BAF155 in SK-N-MC Ewing sarcoma cells, using two indepen-
dent BAF155-specific shRNAs, resulted in decreased expres-
sion of EWS-FLI1 target genes (Figures 2J and S2H) and
significantly impaired viability of Ewing sarcoma cells in culture
(Figure S2I). A similar decrease in viability was observed using
shRNAs targeting the BRG1 ATPase subunit (Figure S2J). These
studies performed in both MSCs and Ewing sarcoma cell
lines indicate that BAF complexes play a major role in EWS-
FLI1-mediated oncogenic gene regulation.
Recruitment of BAF Complexes to GGAA Repeats Is aNeomorphic Property of theEWS-FLI1 FusionComparedto Wild-Type FLI1The respective contributions of EWS and FLI1 components of
the EWS-FLI1 fusion protein to chromatin reorganization have
not to date been fully delineated. As such, we aimed to explore
whether expression of the FLI1 transcription factor alone could
recruit BAF complexes to GGAA repeats. In contrast to expres-
sion of EWS-FLI1, expression of the wild-type FLI1, which
provides the ETS DNA binding domain to the fusion protein,
did not induce de novo activation of enhancers at GGAA
repeats in MSCs and was not associated with recruitment of
FLI1 GGAA repeat enhancers associated with CCND1, SOX2, NR0B1, and
least two independent biological experiments.
GAAmicrosatellite repeats. Composite plot showsBAF155 ChIP-seq signals in
nts a 10-kb window centered on EWS-FLI1 binding sites.
S-FLI1 and BAF155 binding at GGAA repeat microsatellites upon introduction
y.
ewly created peaks after EWS-FLI1 expression in MSCs.
Heatmap shows relative RNA-seq gene expression levels of genes associated
= 79 genes). The columns showMSCs treatedwith either empty vector control,
by row. (Right) Example RNA-seq tracks over selected genes are shown.
t genes 48 hr post-infection with BAF155 shRNA in A673 Ewing sarcoma cells.
dependent biological experiments.
Cell 171, 163–178, September 21, 2017 167

Figure 3. Recruitment of BAF Complexes to GGAA Microsatellite Repeats Is a Neomorphic Property of EWS-FLI1
(A) Heatmaps of FLI1, BAF155, H3K27ac ChIP-seq, and ATAC-seq signal densities in MSCs infected with either control vector, EWS-FLI1, or wild-type FLI1.
10-kb windows in each panel are centered on EWS-FLI1-bound GGAA repeat enhancer sites (n = 812).
(B) Composite plots show FLI1 (left) and BAF155 (right) ChIP-seq occupancy over GGAA repeat enhancers in control MSCs and MSCs expressing EWS-FLI1 or
FLI1. The x axis represents a 10-kb window centered on EWS-FLI1 binding sites. Inset: 10-fold magnification shows minimal wild-type FLI1 binding over repeat
enhancers but no BAF155 recruitment by FLI1.
(C) Bothwild-type FLI1 and EWS-FLI1 interact with BAF complexes. (Left) Immunoblots from nuclear extracts show lentiviral expression of wild-type FLI1 or EWS-
FLI1 and the levels of endogenous BRG1 in U2OS cells. (Right) Co-immunoprecipitation experiments using anti-FLI1 antibodies show interactions with BAF. *
indicates immunoglobulin G (IgG) heavy chains used for immunoprecipitation.
(legend continued on next page)
168 Cell 171, 163–178, September 21, 2017
BAF complexes (Figures 3A, 3B, and S3A). Furthermore,
whereas FLI1 binding was readily detected at non-repeat canon-
ical ETS binding motifs (Figures S3B and S3C), we did not
observe significant binding for FLI1 at GGAA repeat sites (Fig-
ures 3A, 3B, and S3D). Accordingly, FLI1 failed to induce the
expression of known EWS-FLI1 target genes (Figure S3E). Teth-
ering to GGAA repeats and the recruitment of BAF complexes to
these sites is thus a neomorphic property of the EWS-FLI1 fusion
protein compared to wild-type FLI1.
In order to test whether these striking differences between
EWS-FLI1 andwild-type FLI1 were linked to their differential abil-
ity to bind BAF complexes, we performed immunoprecipitation
experiments comparing FLI1 and EWS-FLI1. Immunoprecipita-
tion of lentivirally expressed FLI1 or EWS-FLI1 using an anti-
FLI1 antibody showed that both proteins were capable of pulling
down the BAF complex subunit BRG1 (Figure 3C). Consistent
with these observations, further characterization showed that
both the EWS N-terminal and FLI1 C-terminal fragments of
EWS-FLI1 were able to co-immunoprecipitate BRG1 (Figure 3D).
To test whether an additional interaction domain could account
for the neomorphic properties of EWS-FLI1, we generated a
fusion protein between the BAF complex subunit BAF47 and
the FLI1 C-terminal domain (Figure 3E). This fusion protein was
able to interact with the BAF complex, as demonstrated by
immunoprecipitation (Figure 3F), and had the ability to bind
and increase chromatin opening when expressed in MSCs (Fig-
ures S4A–S4D). However, in contrast to EWS-FLI1, the BAF47-
FLI1 fusion protein failed to display significant binding to
GGAA repeats (Figure S4E), to induce de novo enhancer forma-
tion (Figures 3G and S4F), or to activate target gene expression
(Figures 3H and S4G). Thus, fusion of the FLI1 C terminus directly
to the BAF chromatin remodeling complex is insufficient to
replicate the pioneer function of the EWS-FLI1-bound BAF com-
plexes at GGAA repeats, suggesting additional critical properties
of the EWSR1 fragment of the fusion protein.
Fusion of EWSR1 to FLI1 Confers Prion-like PhaseTransition PropertiesPhase transition is defined as the ability of a biological system
to undergo a change of phase or state, including transitions
from protein solutions to liquid-like phase-separated compart-
ments that constitute membrane-less organelles (Aguzzi and
Altmeyer, 2016). EWSR1 belongs to the FUS, EWSR1, TAF15
(FET) family of proteins and is characterized by intrinsically
disordered low-complexity prion-like domains that have been
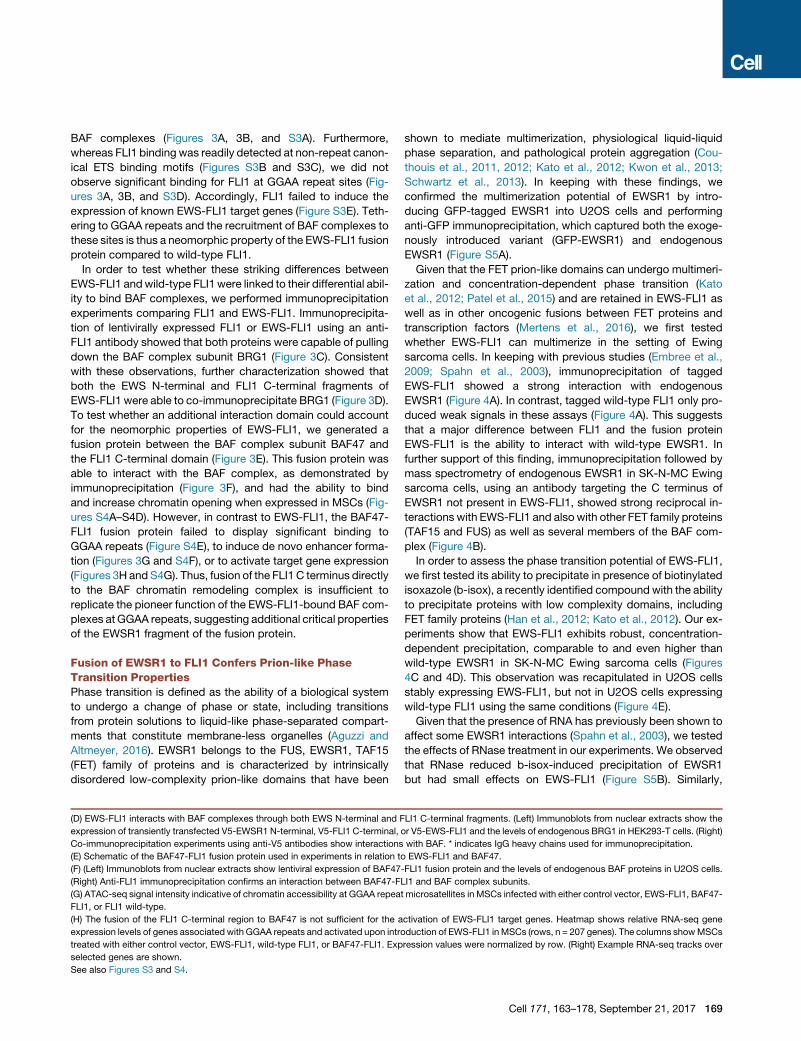
(D) EWS-FLI1 interacts with BAF complexes through both EWS N-terminal and F
expression of transiently transfected V5-EWSR1 N-terminal, V5-FLI1 C-terminal,
Co-immunoprecipitation experiments using anti-V5 antibodies show interactions
(E) Schematic of the BAF47-FLI1 fusion protein used in experiments in relation t
(F) (Left) Immunoblots from nuclear extracts show lentiviral expression of BAF47
(Right) Anti-FLI1 immunoprecipitation confirms an interaction between BAF47-F
(G) ATAC-seq signal intensity indicative of chromatin accessibility at GGAA repea
FLI1, or FLI1 wild-type.
(H) The fusion of the FLI1 C-terminal region to BAF47 is not sufficient for the a
expression levels of genes associated with GGAA repeats and activated upon intro
treated with either control vector, EWS-FLI1, wild-type FLI1, or BAF47-FLI1. Exp
selected genes are shown.
See also Figures S3 and S4.
shown to mediate multimerization, physiological liquid-liquid
phase separation, and pathological protein aggregation (Cou-
thouis et al., 2011, 2012; Kato et al., 2012; Kwon et al., 2013;
Schwartz et al., 2013). In keeping with these findings, we
confirmed the multimerization potential of EWSR1 by intro-
ducing GFP-tagged EWSR1 into U2OS cells and performing
anti-GFP immunoprecipitation, which captured both the exoge-
nously introduced variant (GFP-EWSR1) and endogenous
EWSR1 (Figure S5A).
Given that the FET prion-like domains can undergo multimeri-
zation and concentration-dependent phase transition (Kato
et al., 2012; Patel et al., 2015) and are retained in EWS-FLI1 as
well as in other oncogenic fusions between FET proteins and
transcription factors (Mertens et al., 2016), we first tested
whether EWS-FLI1 can multimerize in the setting of Ewing
sarcoma cells. In keeping with previous studies (Embree et al.,
2009; Spahn et al., 2003), immunoprecipitation of tagged
EWS-FLI1 showed a strong interaction with endogenous
EWSR1 (Figure 4A). In contrast, tagged wild-type FLI1 only pro-
duced weak signals in these assays (Figure 4A). This suggests
that a major difference between FLI1 and the fusion protein
EWS-FLI1 is the ability to interact with wild-type EWSR1. In
further support of this finding, immunoprecipitation followed by
mass spectrometry of endogenous EWSR1 in SK-N-MC Ewing
sarcoma cells, using an antibody targeting the C terminus of
EWSR1 not present in EWS-FLI1, showed strong reciprocal in-
teractions with EWS-FLI1 and also with other FET family proteins
(TAF15 and FUS) as well as several members of the BAF com-
plex (Figure 4B).
In order to assess the phase transition potential of EWS-FLI1,
we first tested its ability to precipitate in presence of biotinylated
isoxazole (b-isox), a recently identified compound with the ability
to precipitate proteins with low complexity domains, including
FET family proteins (Han et al., 2012; Kato et al., 2012). Our ex-
periments show that EWS-FLI1 exhibits robust, concentration-
dependent precipitation, comparable to and even higher than
wild-type EWSR1 in SK-N-MC Ewing sarcoma cells (Figures
4C and 4D). This observation was recapitulated in U2OS cells
stably expressing EWS-FLI1, but not in U2OS cells expressing
wild-type FLI1 using the same conditions (Figure 4E).
Given that the presence of RNA has previously been shown to
affect some EWSR1 interactions (Spahn et al., 2003), we tested
the effects of RNase treatment in our experiments. We observed
that RNase reduced b-isox-induced precipitation of EWSR1
but had small effects on EWS-FLI1 (Figure S5B). Similarly,
LI1 C-terminal fragments. (Left) Immunoblots from nuclear extracts show the
or V5-EWS-FLI1 and the levels of endogenous BRG1 in HEK293-T cells. (Right)
with BAF. * indicates IgG heavy chains used for immunoprecipitation.
o EWS-FLI1 and BAF47.
-FLI1 fusion protein and the levels of endogenous BAF proteins in U2OS cells.
LI1 and BAF complex subunits.
t microsatellites in MSCs infected with either control vector, EWS-FLI1, BAF47-
ctivation of EWS-FLI1 target genes. Heatmap shows relative RNA-seq gene
duction of EWS-FLI1 inMSCs (rows, n = 207 genes). The columns showMSCs
ression values were normalized by row. (Right) Example RNA-seq tracks over
Cell 171, 163–178, September 21, 2017 169
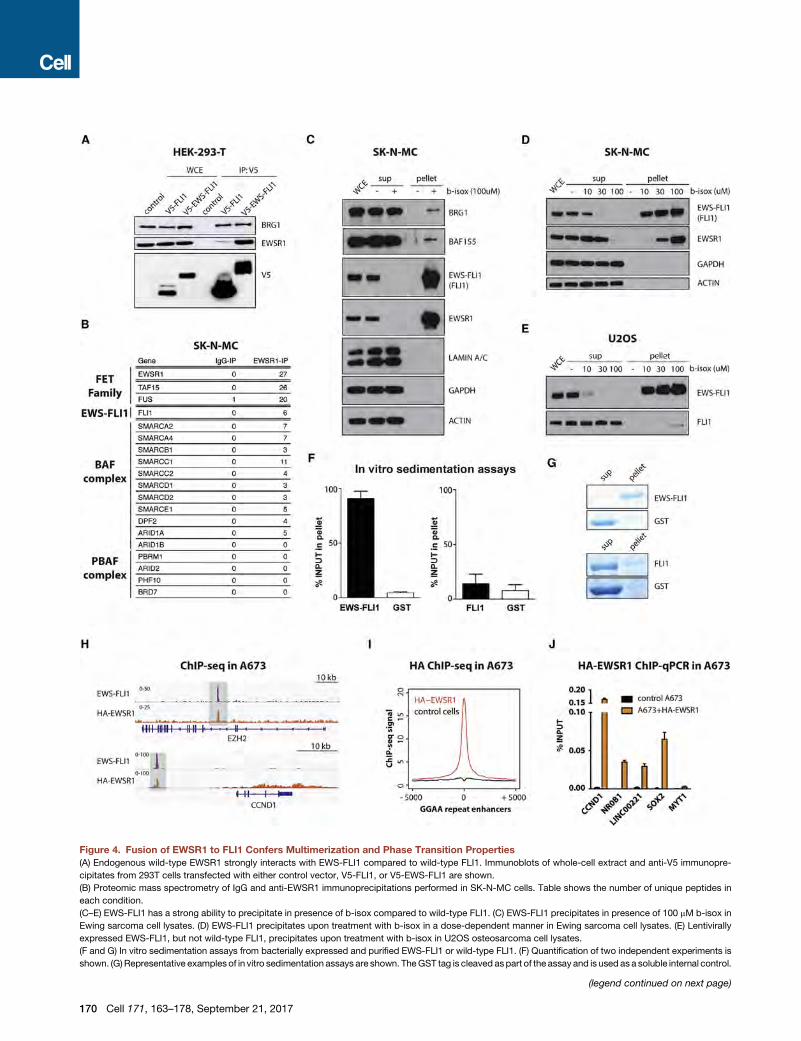
Figure 4. Fusion of EWSR1 to FLI1 Confers Multimerization and Phase Transition Properties
(A) Endogenous wild-type EWSR1 strongly interacts with EWS-FLI1 compared to wild-type FLI1. Immunoblots of whole-cell extract and anti-V5 immunopre-
cipitates from 293T cells transfected with either control vector, V5-FLI1, or V5-EWS-FLI1 are shown.
(B) Proteomic mass spectrometry of IgG and anti-EWSR1 immunoprecipitations performed in SK-N-MC cells. Table shows the number of unique peptides in
each condition.
(C–E) EWS-FLI1 has a strong ability to precipitate in presence of b-isox compared to wild-type FLI1. (C) EWS-FLI1 precipitates in presence of 100 mM b-isox in
Ewing sarcoma cell lysates. (D) EWS-FLI1 precipitates upon treatment with b-isox in a dose-dependent manner in Ewing sarcoma cell lysates. (E) Lentivirally
expressed EWS-FLI1, but not wild-type FLI1, precipitates upon treatment with b-isox in U2OS osteosarcoma cell lysates.
(F and G) In vitro sedimentation assays from bacterially expressed and purified EWS-FLI1 or wild-type FLI1. (F) Quantification of two independent experiments is
shown. (G)Representative examples of in vitro sedimentation assays are shown. TheGST tag is cleaved aspart of the assay and is used as a soluble internal control.
(legend continued on next page)
170 Cell 171, 163–178, September 21, 2017
interactions between EWS-FLI1, EWSR1, and BAF complexes
(BRG1) were not significantly affected by RNase treatment (Fig-
ures S5C and S5D). These results suggest distinct properties for
EWS-FLI1-containing complexes and match previous in vitro
results showing decreased EWSR1 homotypic interactions
and stable heterotypic interactions with EWS-FLI1 upon RNase
treatment (Spahn et al., 2003).
Wild-type EWSR1 has been previously shown to spontane-
ously precipitate in sedimentation experiments used to measure
the intrinsic phase transition potential of purified proteins in vitro
(Couthouis et al., 2012). We thus purified bacterially expressed
glutathione S-transferase (GST)-tagged EWS-FLI1 and wild-
type FLI1 to test their intrinsic phase transition potential. Sedi-
mentation assays revealed that most EWS-FLI1 spontaneously
precipitated, whereas wild-type FLI1 remained soluble in
these conditions (Figures 4F, 4G, and S5E). These results
demonstrate that the EWSR1 prion-like domain confers neomor-
phic intrinsic phase transition properties to the EWS-FLI1 onco-
genic fusion protein. Supporting these observations, confocal
imaging showed that EWS-FLI1 was detectable as nuclear
dot-like structures after lentiviral expression in MSCs whereas
wild-type FLI1 exhibited a more diffuse pattern (Figure S5F).
Having demonstrated interactions between EWS-FLI1 and
EWSR1 and similar phase transition properties conferred by
their prion-like domain in vitro, we expected to find these pro-
teins in the same complexes at GGAA repeats in Ewing sarcoma
cells. To assess this, we introduced hemagglutinin (HA)-tagged
EWSR1 into A673 Ewing sarcoma cells, confirmed its nuclear
localization and its ability to interact with endogenous EWS-
FLI1 and the BAF complex ATPase subunit BRG1 (Figures S5G
and S5H), and assessed its presence at EWS-FLI1-bound
GGAAmicrosatellite repeats. Importantly, we observed substan-
tial co-enrichment of HA-EWSR1 and EWS-FLI1 at GGAAmicro-
satellite repeats, both by ChIP-seq and by validation ChIP-qPCR
over selected target sites (Figures 4H–4J, S5I, and S5J). Further-
more, occupancy of HA-EWSR1 was decreased at these loci
upon shRNA-mediated suppression of EWS-FLI1 (Figure S5K).
Taken together, these observations suggest that EWS-FLI1
and wild-type EWSR1 are both present in the same macromo-
lecular complexes at GGAA repeats in Ewing sarcoma.
Tyrosine Residues in the EWS-FLI1 Prion-like DomainAre Necessary for DNA Binding at GGAA Microsatellitesand De Novo Enhancer ActivationWe next determined whether phase transition mediated by the
prion-like domain of EWS-FLI1 is necessary for DNA binding,
BAF complex recruitment, and de novo enhancer activation at
GGAAmicrosatellite repeats by generating a series of V5-tagged
EWS-FLI1 mutant proteins lacking the ability to precipitate
in vitro. The EWSR1 prion-like domain is rich in [G/S]Y[G/S] mo-
tifs (Figure S6A), and the substitution of these tyrosine residues
with serine has been shown to abrogate phase transitions to hy-
(H–J) EWSR1 is recruited to EWS-FLI1-bound GGAA repeat enhancers in Ewing
HA-EWSR1 atGGAA repeat enhancers in A673 cells. Regions of co-occupancy ar
FLI1 GGAA repeat enhancers in A673 cells. A 10-kb window centered on EWS
HA-EWSR1 binding at EWS-FLI1 GGAA repeat enhancers associated with CCN
See also Figure S5.
drogels observed for the FET protein FUS (Kato et al., 2012;
Kwon et al., 2013). Thus, we generated two EWS-FLI1 mutant
proteins with point mutations altering either 12 or all 37 tyro-
sines in the prion-like domain (namely EWS(YS12)-FLI1 and
EWS(YS37)-FLI1; Figures 5A and S6A). Both mutants were ex-
pressed and localized to the nucleus of lentivirally transduced
MSCs as assessed by immunofluorescence in a manner com-
parable to that of EWS-FLI1 (Figures S6B and S6C). The
EWS(YS12)-FLI1 mutant protein maintained significant interac-
tions with wild-type EWSR1 and BRG1, and although dimin-
ished, b-isox-induced precipitation remained significantly higher
than wild-type FLI1 (Figures 4E, 5B, and 5C). In contrast,
EWS(YS37)-FLI1 displayed reduction in binding to wild-type
EWSR1 and BRG1 as well as a profound loss of b-isox-induced
precipitation to levels comparable to those of wild-type FLI1 (Fig-
ures 4E, 5B, and 5C). EWS(YS37)-FLI1, however, maintained the
ability to homodimerize, a hallmark of ETS family transcription
factors, as assessed by reciprocal immunoprecipitation experi-
ments using overexpressed HA- and V5-tagged variants in
HEK293-T cells (Figure S6D). In keeping with our results ob-
tained with b-isox, in vitro sedimentation assays performed
with purified GST-tagged EWS(YS37)-FLI1 showed a complete
loss of its ability to spontaneously precipitate (Figures 5D
and S6E).
Based on these findings, we further tested the ability of the
EWS(YS37)-FLI1 mutant protein to bind GGAA microsatellite re-
peats and to create active enhancers once expressed in MSCs
(Figure S6F). ChIP-seq experiments clearly demonstrated a dra-
matic reduction in binding of the EWS(YS37)-FLI1 mutant at
these sites, as well as impaired BAF complex recruitment (Fig-
ures 5E and S6G). In line with this observation, DNA accessibility
and marks of enhancer activity assessed by, respectively,
ATAC-seq and ChIP-seq for H3K27ac were undetectable for
the EWS(YS37)-FLI1 mutant (Figures 5E–5G, S6H, and S6I).
Finally, consistent with the impairment of its biochemical proper-
ties, EWS(YS37)-FLI1 was not able to induce expression of
GGAA microsatellite target genes after introduction in MSCs,
whereas EWS(YS12)-FLI1 retained nearly full activity (Figure 5H).
Taken together, our results demonstrate that the tyrosine
residues in the EWS-FLI1 prion-like domain are necessary to
mediate phase transitions and are required for its pioneer activity
by allowing stable DNA binding, BAF complex recruitment at
GGAA repeat microsatellites, and target gene activation.
Fusion of EWSR1 Prion-like Domain Fragments to theFLI1 C Terminus Is Sufficient to Recapitulate EWS-FLI1ActivityGiven that prion-like domains are unstructured, low-complexity
protein sequences, we next tested whether any specific region
within this domain is critical for EWS-FLI1 function. To this
end, we generated a series of EWS-FLI1 internal deletion
mutants (Figure S7A). Whereas the tyrosine residues that we
Sarcoma. (H) Example ChIP-seq tracks show co-occupancy of EWS-FLI1 and
e highlighted in light gray. (I) Composite plot showsHA-EWSR1binding at EWS-
-FLI1-bound repeat enhancer is shown. (J) ChIP-qPCR experiments validate
D1, SOX2, NR0B1, and LINC00221, but not a control region near MYT1.
Cell 171, 163–178, September 21, 2017 171
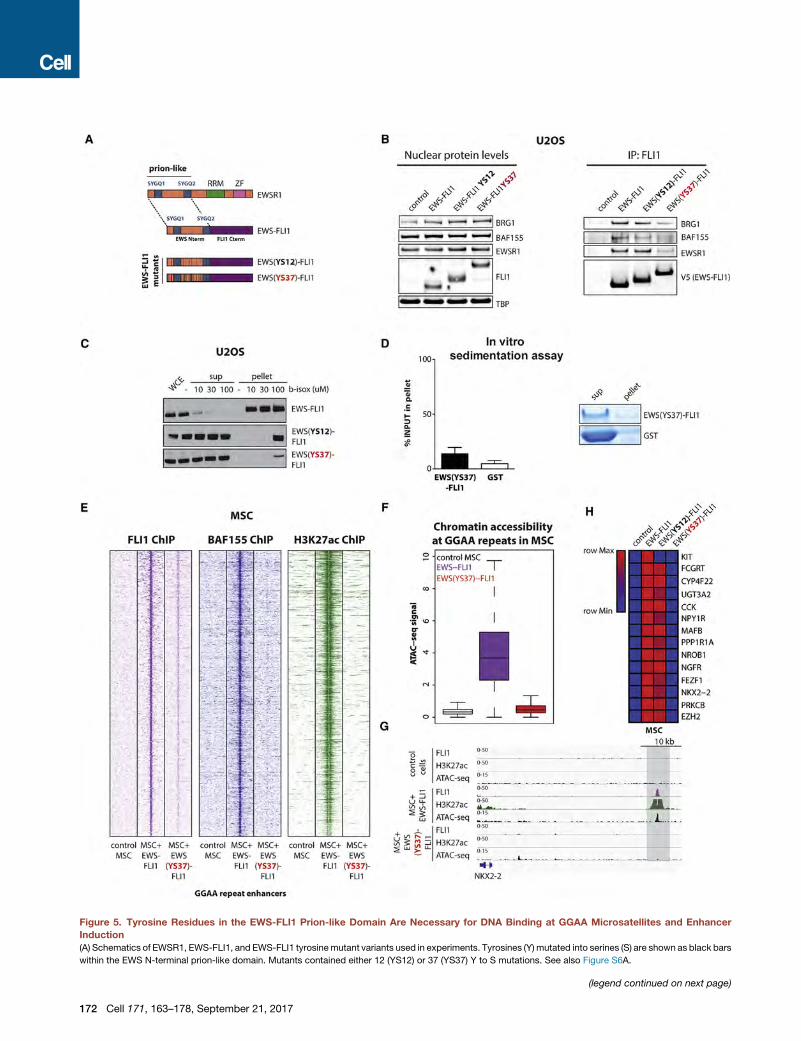
Figure 5. Tyrosine Residues in the EWS-FLI1 Prion-like Domain Are Necessary for DNA Binding at GGAA Microsatellites and Enhancer
Induction
(A) Schematics of EWSR1, EWS-FLI1, and EWS-FLI1 tyrosinemutant variants used in experiments. Tyrosines (Y) mutated into serines (S) are shown as black bars
within the EWS N-terminal prion-like domain. Mutants contained either 12 (YS12) or 37 (YS37) Y to S mutations. See also Figure S6A.
(legend continued on next page)
172 Cell 171, 163–178, September 21, 2017
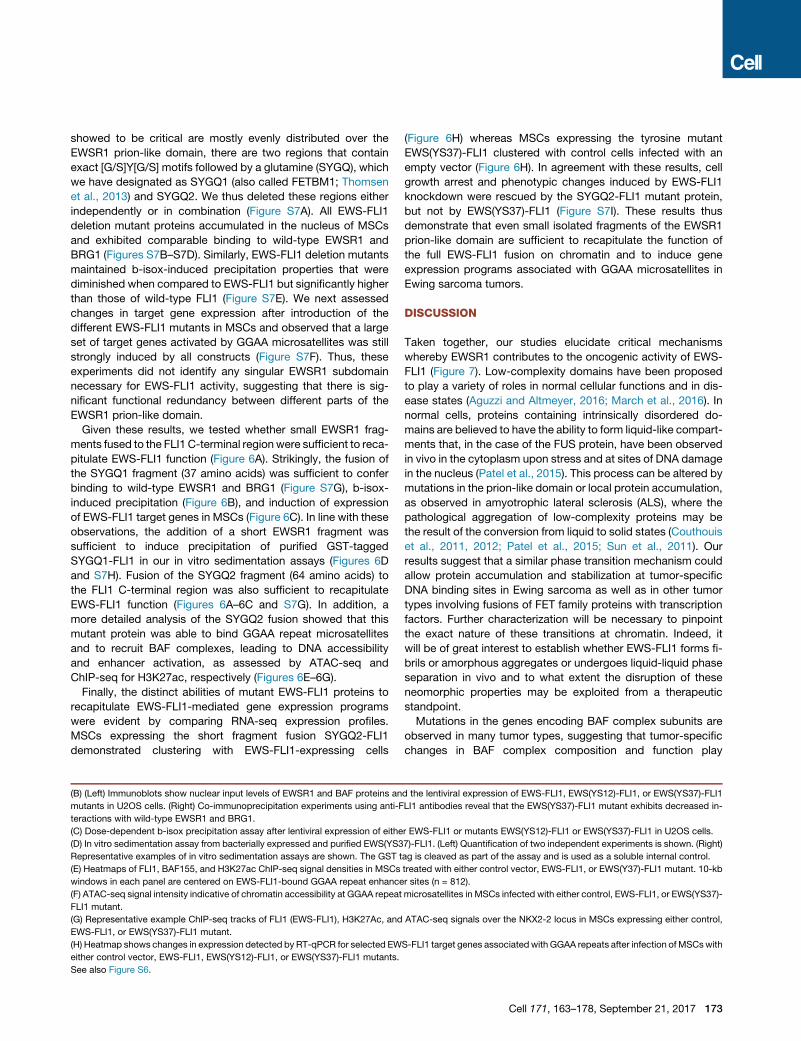
showed to be critical are mostly evenly distributed over the
EWSR1 prion-like domain, there are two regions that contain
exact [G/S]Y[G/S] motifs followed by a glutamine (SYGQ), which
we have designated as SYGQ1 (also called FETBM1; Thomsen
et al., 2013) and SYGQ2. We thus deleted these regions either
independently or in combination (Figure S7A). All EWS-FLI1
deletion mutant proteins accumulated in the nucleus of MSCs
and exhibited comparable binding to wild-type EWSR1 and
BRG1 (Figures S7B–S7D). Similarly, EWS-FLI1 deletion mutants
maintained b-isox-induced precipitation properties that were
diminished when compared to EWS-FLI1 but significantly higher
than those of wild-type FLI1 (Figure S7E). We next assessed
changes in target gene expression after introduction of the
different EWS-FLI1 mutants in MSCs and observed that a large
set of target genes activated by GGAA microsatellites was still
strongly induced by all constructs (Figure S7F). Thus, these
experiments did not identify any singular EWSR1 subdomain
necessary for EWS-FLI1 activity, suggesting that there is sig-
nificant functional redundancy between different parts of the
EWSR1 prion-like domain.
Given these results, we tested whether small EWSR1 frag-
ments fused to the FLI1 C-terminal region were sufficient to reca-
pitulate EWS-FLI1 function (Figure 6A). Strikingly, the fusion of
the SYGQ1 fragment (37 amino acids) was sufficient to confer
binding to wild-type EWSR1 and BRG1 (Figure S7G), b-isox-
induced precipitation (Figure 6B), and induction of expression
of EWS-FLI1 target genes in MSCs (Figure 6C). In line with these
observations, the addition of a short EWSR1 fragment was
sufficient to induce precipitation of purified GST-tagged
SYGQ1-FLI1 in our in vitro sedimentation assays (Figures 6D
and S7H). Fusion of the SYGQ2 fragment (64 amino acids) to
the FLI1 C-terminal region was also sufficient to recapitulate
EWS-FLI1 function (Figures 6A–6C and S7G). In addition, a
more detailed analysis of the SYGQ2 fusion showed that this
mutant protein was able to bind GGAA repeat microsatellites
and to recruit BAF complexes, leading to DNA accessibility
and enhancer activation, as assessed by ATAC-seq and
ChIP-seq for H3K27ac, respectively (Figures 6E–6G).
Finally, the distinct abilities of mutant EWS-FLI1 proteins to
recapitulate EWS-FLI1-mediated gene expression programs
were evident by comparing RNA-seq expression profiles.
MSCs expressing the short fragment fusion SYGQ2-FLI1
demonstrated clustering with EWS-FLI1-expressing cells
(B) (Left) Immunoblots show nuclear input levels of EWSR1 and BAF proteins an
mutants in U2OS cells. (Right) Co-immunoprecipitation experiments using anti-F
teractions with wild-type EWSR1 and BRG1.
(C) Dose-dependent b-isox precipitation assay after lentiviral expression of eithe
(D) In vitro sedimentation assay from bacterially expressed and purified EWS(YS3
Representative examples of in vitro sedimentation assays are shown. The GST t
(E) Heatmaps of FLI1, BAF155, and H3K27ac ChIP-seq signal densities in MSCs
windows in each panel are centered on EWS-FLI1-bound GGAA repeat enhance
(F) ATAC-seq signal intensity indicative of chromatin accessibility at GGAA repeat
FLI1 mutant.
(G) Representative example ChIP-seq tracks of FLI1 (EWS-FLI1), H3K27Ac, and
EWS-FLI1, or EWS(YS37)-FLI1 mutant.
(H) Heatmap shows changes in expression detected by RT-qPCR for selected EW
either control vector, EWS-FLI1, EWS(YS12)-FLI1, or EWS(YS37)-FLI1 mutants.
See also Figure S6.
(Figure 6H) whereas MSCs expressing the tyrosine mutant
EWS(YS37)-FLI1 clustered with control cells infected with an
empty vector (Figure 6H). In agreement with these results, cell
growth arrest and phenotypic changes induced by EWS-FLI1
knockdown were rescued by the SYGQ2-FLI1 mutant protein,
but not by EWS(YS37)-FLI1 (Figure S7I). These results thus
demonstrate that even small isolated fragments of the EWSR1
prion-like domain are sufficient to recapitulate the function of
the full EWS-FLI1 fusion on chromatin and to induce gene
expression programs associated with GGAA microsatellites in
Ewing sarcoma tumors.
DISCUSSION
Taken together, our studies elucidate critical mechanisms
whereby EWSR1 contributes to the oncogenic activity of EWS-
FLI1 (Figure 7). Low-complexity domains have been proposed
to play a variety of roles in normal cellular functions and in dis-
ease states (Aguzzi and Altmeyer, 2016; March et al., 2016). In
normal cells, proteins containing intrinsically disordered do-
mains are believed to have the ability to form liquid-like compart-
ments that, in the case of the FUS protein, have been observed
in vivo in the cytoplasm upon stress and at sites of DNA damage
in the nucleus (Patel et al., 2015). This process can be altered by
mutations in the prion-like domain or local protein accumulation,
as observed in amyotrophic lateral sclerosis (ALS), where the
pathological aggregation of low-complexity proteins may be
the result of the conversion from liquid to solid states (Couthouis
et al., 2011, 2012; Patel et al., 2015; Sun et al., 2011). Our
results suggest that a similar phase transition mechanism could
allow protein accumulation and stabilization at tumor-specific
DNA binding sites in Ewing sarcoma as well as in other tumor
types involving fusions of FET family proteins with transcription
factors. Further characterization will be necessary to pinpoint
the exact nature of these transitions at chromatin. Indeed, it
will be of great interest to establish whether EWS-FLI1 forms fi-
brils or amorphous aggregates or undergoes liquid-liquid phase
separation in vivo and to what extent the disruption of these
neomorphic properties may be exploited from a therapeutic
standpoint.
Mutations in the genes encoding BAF complex subunits are
observed in many tumor types, suggesting that tumor-specific
changes in BAF complex composition and function play
d the lentiviral expression of EWS-FLI1, EWS(YS12)-FLI1, or EWS(YS37)-FLI1
LI1 antibodies reveal that the EWS(YS37)-FLI1 mutant exhibits decreased in-
r EWS-FLI1 or mutants EWS(YS12)-FLI1 or EWS(YS37)-FLI1 in U2OS cells.
7)-FLI1. (Left) Quantification of two independent experiments is shown. (Right)
ag is cleaved as part of the assay and is used as a soluble internal control.
treated with either control vector, EWS-FLI1, or EWS(Y37)-FLI1 mutant. 10-kb
r sites (n = 812).
microsatellites in MSCs infected with either control, EWS-FLI1, or EWS(YS37)-
ATAC-seq signals over the NKX2-2 locus in MSCs expressing either control,
S-FLI1 target genes associatedwith GGAA repeats after infection of MSCswith
Cell 171, 163–178, September 21, 2017 173
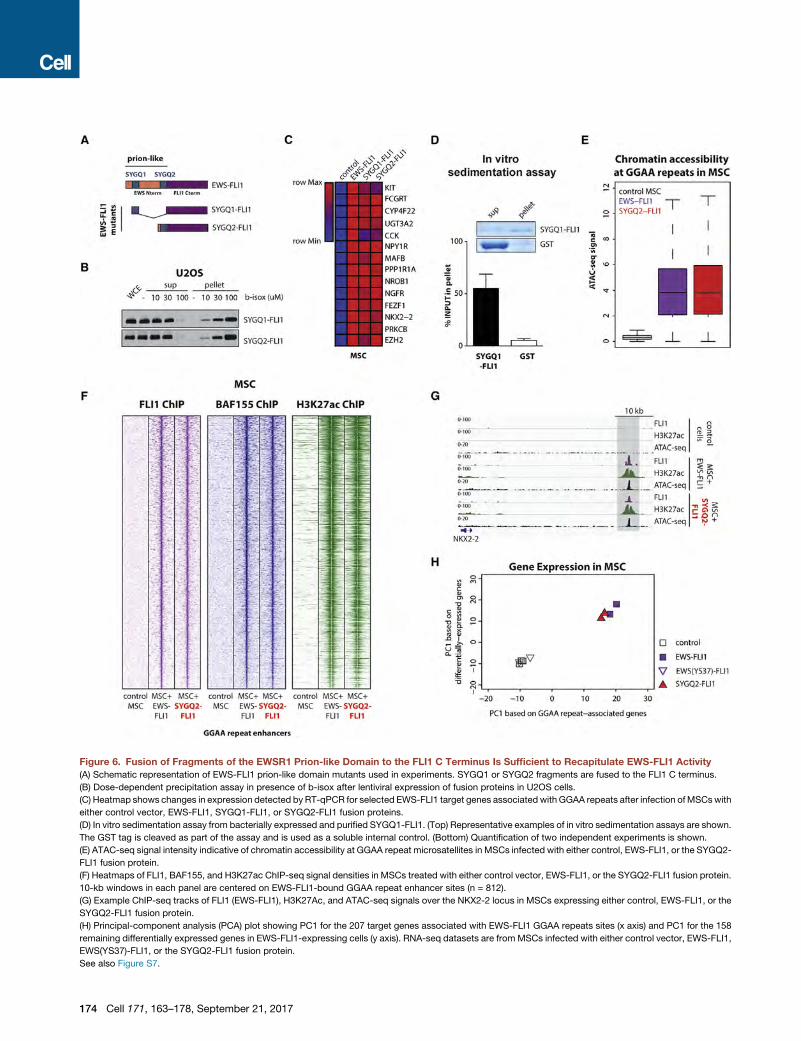
Figure 6. Fusion of Fragments of the EWSR1 Prion-like Domain to the FLI1 C Terminus Is Sufficient to Recapitulate EWS-FLI1 Activity
(A) Schematic representation of EWS-FLI1 prion-like domain mutants used in experiments. SYGQ1 or SYGQ2 fragments are fused to the FLI1 C terminus.
(B) Dose-dependent precipitation assay in presence of b-isox after lentiviral expression of fusion proteins in U2OS cells.
(C) Heatmap shows changes in expression detected by RT-qPCR for selected EWS-FLI1 target genes associated with GGAA repeats after infection ofMSCswith
either control vector, EWS-FLI1, SYGQ1-FLI1, or SYGQ2-FLI1 fusion proteins.
(D) In vitro sedimentation assay from bacterially expressed and purified SYGQ1-FLI1. (Top) Representative examples of in vitro sedimentation assays are shown.
The GST tag is cleaved as part of the assay and is used as a soluble internal control. (Bottom) Quantification of two independent experiments is shown.
(E) ATAC-seq signal intensity indicative of chromatin accessibility at GGAA repeat microsatellites in MSCs infected with either control, EWS-FLI1, or the SYGQ2-
FLI1 fusion protein.
(F) Heatmaps of FLI1, BAF155, and H3K27ac ChIP-seq signal densities in MSCs treated with either control vector, EWS-FLI1, or the SYGQ2-FLI1 fusion protein.
10-kb windows in each panel are centered on EWS-FLI1-bound GGAA repeat enhancer sites (n = 812).
(G) Example ChIP-seq tracks of FLI1 (EWS-FLI1), H3K27Ac, and ATAC-seq signals over the NKX2-2 locus in MSCs expressing either control, EWS-FLI1, or the
SYGQ2-FLI1 fusion protein.
(H) Principal-component analysis (PCA) plot showing PC1 for the 207 target genes associated with EWS-FLI1 GGAA repeats sites (x axis) and PC1 for the 158
remaining differentially expressed genes in EWS-FLI1-expressing cells (y axis). RNA-seq datasets are from MSCs infected with either control vector, EWS-FLI1,
EWS(YS37)-FLI1, or the SYGQ2-FLI1 fusion protein.
See also Figure S7.
174 Cell 171, 163–178, September 21, 2017
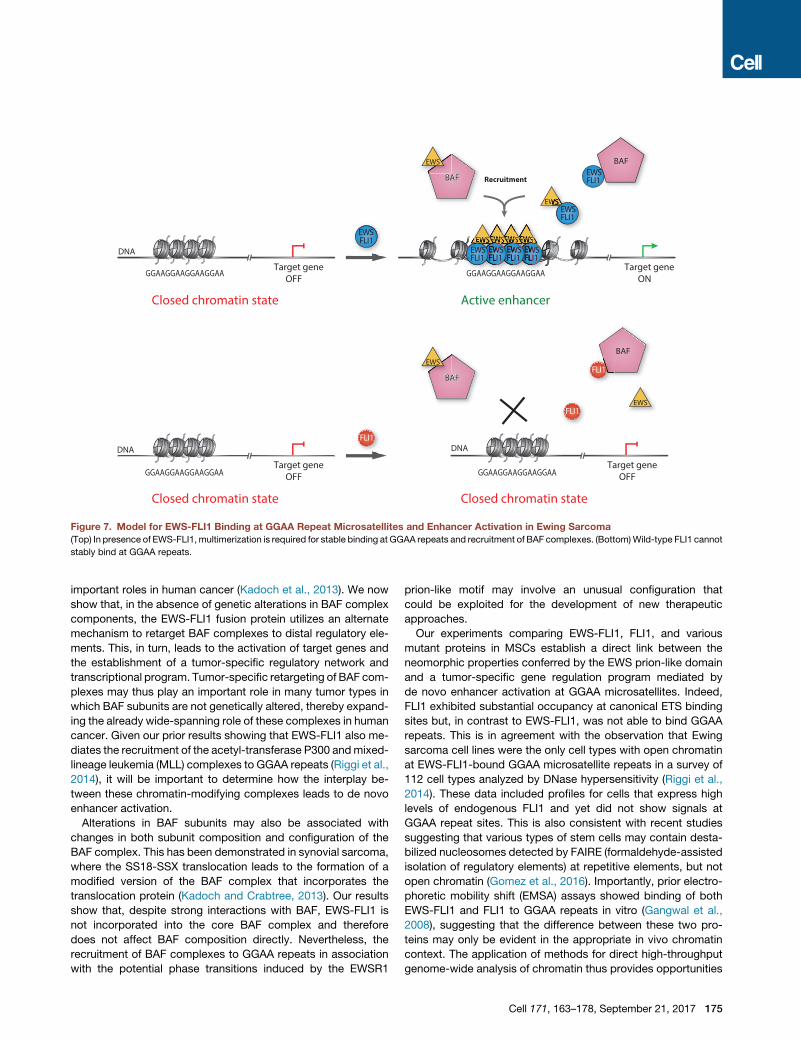
Figure 7. Model for EWS-FLI1 Binding at GGAA Repeat Microsatellites and Enhancer Activation in Ewing Sarcoma(Top) In presence of EWS-FLI1,multimerization is required for stable binding at GGAA repeats and recruitment of BAF complexes. (Bottom)Wild-type FLI1 cannot
stably bind at GGAA repeats.
important roles in human cancer (Kadoch et al., 2013). We now
show that, in the absence of genetic alterations in BAF complex
components, the EWS-FLI1 fusion protein utilizes an alternate
mechanism to retarget BAF complexes to distal regulatory ele-
ments. This, in turn, leads to the activation of target genes and
the establishment of a tumor-specific regulatory network and
transcriptional program. Tumor-specific retargeting of BAF com-
plexes may thus play an important role in many tumor types in
which BAF subunits are not genetically altered, thereby expand-
ing the already wide-spanning role of these complexes in human
cancer. Given our prior results showing that EWS-FLI1 also me-
diates the recruitment of the acetyl-transferase P300 andmixed-
lineage leukemia (MLL) complexes to GGAA repeats (Riggi et al.,
2014), it will be important to determine how the interplay be-
tween these chromatin-modifying complexes leads to de novo
enhancer activation.
Alterations in BAF subunits may also be associated with
changes in both subunit composition and configuration of the
BAF complex. This has been demonstrated in synovial sarcoma,
where the SS18-SSX translocation leads to the formation of a
modified version of the BAF complex that incorporates the
translocation protein (Kadoch and Crabtree, 2013). Our results
show that, despite strong interactions with BAF, EWS-FLI1 is
not incorporated into the core BAF complex and therefore
does not affect BAF composition directly. Nevertheless, the
recruitment of BAF complexes to GGAA repeats in association
with the potential phase transitions induced by the EWSR1
prion-like motif may involve an unusual configuration that
could be exploited for the development of new therapeutic
approaches.
Our experiments comparing EWS-FLI1, FLI1, and various
mutant proteins in MSCs establish a direct link between the
neomorphic properties conferred by the EWS prion-like domain
and a tumor-specific gene regulation program mediated by
de novo enhancer activation at GGAA microsatellites. Indeed,
FLI1 exhibited substantial occupancy at canonical ETS binding
sites but, in contrast to EWS-FLI1, was not able to bind GGAA
repeats. This is in agreement with the observation that Ewing
sarcoma cell lines were the only cell types with open chromatin
at EWS-FLI1-bound GGAA microsatellite repeats in a survey of
112 cell types analyzed by DNase hypersensitivity (Riggi et al.,
2014). These data included profiles for cells that express high
levels of endogenous FLI1 and yet did not show signals at
GGAA repeat sites. This is also consistent with recent studies
suggesting that various types of stem cells may contain desta-
bilized nucleosomes detected by FAIRE (formaldehyde-assisted
isolation of regulatory elements) at repetitive elements, but not
open chromatin (Gomez et al., 2016). Importantly, prior electro-
phoretic mobility shift (EMSA) assays showed binding of both
EWS-FLI1 and FLI1 to GGAA repeats in vitro (Gangwal et al.,
2008), suggesting that the difference between these two pro-
teins may only be evident in the appropriate in vivo chromatin
context. The application of methods for direct high-throughput
genome-wide analysis of chromatin thus provides opportunities
Cell 171, 163–178, September 21, 2017 175
for new insights into critical mechanisms of oncogenic gene
regulation.
In conclusion, our study demonstrates that a prion-like
domain can confer neomorphic properties to fusion proteins
that lead to retargeting of key chromatin regulators and
the establishment of an oncogenic gene regulatory program.
Similar events mediated by FET family proteins or other intrin-
sically disordered proteins are likely to play important roles in
generating tumor-specific regulatory elements in a variety of tu-
mor types and may constitute attractive targets for therapeutic
development.
STAR+METHODS
Detailed methods are provided in the online version of this paper
and include the following:
d KEY RESOURCES TABLE
d CONTACT FOR REAGENT AND RESOURCE SHARING
d EXPERIMENTAL MODEL AND SUBJECT DETAILS
176
B Mesenchymal stem cells
B Cell lines
B Bacterial Cultures
d METHOD DETAILS
B Lentiviral Generation
B Transient Transfections
B Real-Time Quantitative RT-PCR
B Western Blot Analysis
B Nuclear Extract Preparation
B Immunoprecipitations
B Depletion Studies
B Urea Denaturation Studies
B Density Sedimentation Analyses
B Mass Spectrometry
B ChIP-seq
B ChIP-seq Bioinformatic Analysis
B ChIP-qPCR
B RNA-Seq
B RNA-seq bioinformatic Processing
B Definition of target genes associated with EWS-FLI1
bound GGAA-repeats
B Principal Component Analysis
B ATAC-seq Genome-Wide DNA Accessibility Assay
B ATAC-seq bioinformatic Processing
B Immunofluorescence Stainings
B Cell Viability Assays
B G1 Arrest Experiments
B Biotinylated isoxazole-Mediated Precipitation
B Protein purification and sedimentation assays
d QUANTIFICATION AND STATISTICAL ANALYSES
d DATA AND SOFTWARE AVAILABILITY
d ADDITIONAL RESOURCES
SUPPLEMENTAL INFORMATION
Supplemental Information includes seven figures and one table and can be
found with this article online at http://dx.doi.org/10.1016/j.cell.2017.07.036.
Cell 171, 163–178, September 21, 2017
AUTHOR CONTRIBUTIONS
G.B., G.J.S., C.K., and M.N.R. designed the study and wrote the manuscript.
G.B., G.J.S., N.R., R.B., B.N., M.E.A., S.R., A.V., andM.J.M. performed the ex-
periments. S.I., G.B., and M.N.R. conducted bioinformatics analyses. N.R.,
L.C.B., L.Z., and I.S. provided necessary reagents and conceptual advice.
ACKNOWLEDGMENTS
We thank S. Gillepsie, M. Bobbin, M. Aryee, and N. Mashtalir as well as mem-
bers of the Rivera, Kadoch, Bernstein, and Suva labs for valuable guidance
and advice. We thank L. Nieman of the MGH Cancer Center/Molecular Pathol-
ogy Confocal Core (MGH) and members of the Taplin Mass Spec Facility
(HMS) for assistance with experiments and data analysis. We thank G.R.
Crabtree and A. Kuo for kindly sharing the homemade BAF155 (SMARCC1)
antibody used in ChIP-seq experiments. G.J.S. is supported by the
Department of Defense Prostate Cancer Research Program Postdoctoral
Training Award W81XWH-15-1-0659. N.R. is supported by the Swiss
National Science Foundation Professorship grant (PP00P3-157468/1) and
the MEDIC Foundation. R.B. is supported by a NIH Pathway to
Independence Award (1K99CA212154). C.K. is supported by the NIH DP2
New Innovator Award 1DP2CA195762-01, the American Cancer Society
Research Scholar Award RSG-14-051-01-DMC, and the Pew-Stewart
Scholars in Cancer Research Grant. This work was also supported by the
Alex’s Lemonade Stand Foundation Young Investigator Award (C.K.).
M.N.R. is supported by the V Foundation for Cancer Research. M.N.R. is a
consultant for Loxo and receives research support from Affymetrix. C.K. is a
scientific founder, shareholder, and consultant for Foghorn Therapeutics.
Received: February 23, 2017
Revised: June 14, 2017
Accepted: July 21, 2017
Published: August 24, 2017
REFERENCES
Aguzzi, A., and Altmeyer, M. (2016). Phase separation: linking cellular
compartmentalization to disease. Trends Cell Biol. 26, 547–558.
Boulay, G., Awad, M.E., Riggi, N., Archer, T.C., Iyer, S., Boonseng, W.E., Ros-
setti, N.E., Naigles, B., Rengarajan, S., Volorio, A., et al. (2017). OTX2 activity at
distal regulatory elements shapes the chromatin landscape of group 3 medul-
loblastoma. Cancer Discov. 7, 288–301.
Brohl, A.S., Solomon, D.A., Chang, W., Wang, J., Song, Y., Sindiri, S., Patidar,
R., Hurd, L., Chen, L., Shern, J.F., et al. (2014). The genomic landscape of the
Ewing sarcoma family of tumors reveals recurrent STAG2 mutation. PLoS
Genet. 10, e1004475.
Buenrostro, J.D., Giresi, P.G., Zaba, L.C., Chang, H.Y., and Greenleaf, W.J.
(2013). Transposition of native chromatin for fast and sensitive epigenomic
profiling of open chromatin, DNA-binding proteins and nucleosome position.
Nat. Methods 10, 1213–1218.
Couthouis, J., Hart, M.P., Shorter, J., DeJesus-Hernandez, M., Erion, R., Oris-
tano, R., Liu, A.X., Ramos, D., Jethava, N., Hosangadi, D., et al. (2011). A yeast
functional screen predicts new candidate ALS disease genes. Proc. Natl.
Acad. Sci. USA 108, 20881–20890.
Couthouis, J., Hart, M.P., Erion, R., King, O.D., Diaz, Z., Nakaya, T., Ibrahim, F.,
Kim, H.J., Mojsilovic-Petrovic, J., Panossian, S., et al. (2012). Evaluating the
role of the FUS/TLS-related gene EWSR1 in amyotrophic lateral sclerosis.
Hum. Mol. Genet. 21, 2899–2911.
Crompton, B.D., Stewart, C., Taylor-Weiner, A., Alexe, G., Kurek, K.C., Calic-
chio, M.L., Kiezun, A., Carter, S.L., Shukla, S.A., Mehta, S.S., et al. (2014).
The genomic landscape of pediatric Ewing sarcoma. Cancer Discov. 4,
1326–1341.
Delattre, O., Zucman, J., Plougastel, B., Desmaze, C., Melot, T., Peter, M., Ko-
var, H., Joubert, I., de Jong, P., Rouleau, G., et al. (1992). Gene fusion with an

ETS DNA-binding domain caused by chromosome translocation in human
tumours. Nature 359, 162–165.
Dobin, A., Davis, C.A., Schlesinger, F., Drenkow, J., Zaleski, C., Jha, S., Batut,
P., Chaisson,M., andGingeras, T.R. (2013). STAR: ultrafast universal RNA-seq
aligner. Bioinformatics 29, 15–21.
Embree, L.J., Azuma, M., and Hickstein, D.D. (2009). Ewing sarcoma fusion
protein EWSR1/FLI1 interacts with EWSR1 leading to mitotic defects in zebra-
fish embryos and human cell lines. Cancer Res. 69, 4363–4371.
ENCODE Project Consortium (2012). An integrated encyclopedia of DNA ele-
ments in the human genome. Nature 489, 57–74.
Gangwal, K., Sankar, S., Hollenhorst, P.C., Kinsey, M., Haroldsen, S.C., Shah,
A.A., Boucher, K.M., Watkins, W.S., Jorde, L.B., Graves, B.J., and Lessnick,
S.L. (2008). Microsatellites as EWS/FLI response elements in Ewing’s sar-
coma. Proc. Natl. Acad. Sci. USA 105, 10149–10154.
Gomez, N.C., Hepperla, A.J., Dumitru, R., Simon, J.M., Fang, F., and Davis, I.J.
(2016). Widespread chromatin accessibility at repetitive elements links stem
cells with human cancer. Cell Rep. 17, 1607–1620.
Guillon, N., Tirode, F., Boeva, V., Zynovyev, A., Barillot, E., and Delattre, O.
(2009). The oncogenic EWS-FLI1 protein binds in vivo GGAA microsatellite
sequences with potential transcriptional activation function. PLoS ONE
4, e4932.
Han, T.W., Kato, M., Xie, S., Wu, L.C., Mirzaei, H., Pei, J., Chen, M., Xie, Y., Al-
len, J., Xiao, G., and McKnight, S.L. (2012). Cell-free formation of RNA gran-
ules: bound RNAs identify features and components of cellular assemblies.
Cell 149, 768–779.
Heinz, S., Benner, C., Spann, N., Bertolino, E., Lin, Y.C., Laslo, P., Cheng, J.X.,
Murre, C., Singh, H., and Glass, C.K. (2010). Simple combinations of lineage-
determining transcription factors prime cis-regulatory elements required for
macrophage and B cell identities. Mol. Cell 38, 576–589.
Herrero-Martin, D., Fourtouna, A., Niedan, S., Riedmann, L.T., Schwentner, R.,
and Aryee, D.N. (2011). Factors affecting EWS-FLI1 activity in Ewing’s sar-
coma. Sarcoma 2011, 352580.
Kadoch, C., and Crabtree, G.R. (2013). Reversible disruption of mSWI/SNF
(BAF) complexes by the SS18-SSX oncogenic fusion in synovial sarcoma.
Cell 153, 71–85.
Kadoch, C., and Crabtree, G.R. (2015). Mammalian SWI/SNF chromatin re-
modeling complexes and cancer: Mechanistic insights gained from human
genomics. Sci. Adv. 1, e1500447.
Kadoch, C., Hargreaves, D.C., Hodges, C., Elias, L., Ho, L., Ranish, J., and
Crabtree, G.R. (2013). Proteomic and bioinformatic analysis of mammalian
SWI/SNF complexes identifies extensive roles in human malignancy. Nat.
Genet. 45, 592–601.
Kato, M., Han, T.W., Xie, S., Shi, K., Du, X., Wu, L.C., Mirzaei, H., Goldsmith,
E.J., Longgood, J., Pei, J., et al. (2012). Cell-free formation of RNA granules:
low complexity sequence domains form dynamic fibers within hydrogels.
Cell 149, 753–767.
Kovar, H. (2011). Dr. Jekyll and Mr. Hyde: the two faces of the FUS/EWS/
TAF15 protein family. Sarcoma 2011, 837474.
Kwon, I., Kato, M., Xiang, S., Wu, L., Theodoropoulos, P., Mirzaei, H., Han, T.,
Xie, S., Corden, J.L., and McKnight, S.L. (2013). Phosphorylation-regulated
binding of RNA polymerase II to fibrous polymers of low-complexity domains.
Cell 155, 1049–1060.
Lander, E.S. (2011). Initial impact of the sequencing of the human genome. Na-
ture 470, 187–197.
Lawrence, M.S., Stojanov, P., Polak, P., Kryukov, G.V., Cibulskis, K., Siva-
chenko, A., Carter, S.L., Stewart, C., Mermel, C.H., Roberts, S.A., et al.
(2013). Mutational heterogeneity in cancer and the search for new cancer-
associated genes. Nature 499, 214–218.
Li, H., and Durbin, R. (2009). Fast and accurate short read alignment with Bur-
rows-Wheeler transform. Bioinformatics 25, 1754–1760.
Liao, Y., Smyth, G.K., and Shi, W. (2014). featureCounts: an efficient general
purpose program for assigning sequence reads to genomic features. Bioinfor-
matics 30, 923–930.
Love, M.I., Huber, W., and Anders, S. (2014). Moderated estimation of
fold change and dispersion for RNA-seq data with DESeq2. Genome Biol.
15, 550.
March, Z.M., King, O.D., and Shorter, J. (2016). Prion-like domains as epige-
netic regulators, scaffolds for subcellular organization, and drivers of neurode-
generative disease. Brain Res. 1647, 9–18.
Mertens, F., Antonescu, C.R., and Mitelman, F. (2016). Gene fusions in soft
tissue tumors: Recurrent and overlapping pathogenetic themes. Genes Chro-
mosomes Cancer 55, 291–310.
Mikkelsen, T.S., Ku, M., Jaffe, D.B., Issac, B., Lieberman, E., Giannoukos, G.,
Alvarez, P., Brockman, W., Kim, T.K., Koche, R.P., et al. (2007). Genome-wide
maps of chromatin state in pluripotent and lineage-committed cells. Nature
448, 553–560.
Patel, M., Simon, J.M., Iglesia, M.D., Wu, S.B., McFadden, A.W., Lieb, J.D.,
and Davis, I.J. (2012). Tumor-specific retargeting of an oncogenic transcription
factor chimera results in dysregulation of chromatin and transcription.
Genome Res. 22, 259–270.
Patel, A., Lee, H.O., Jawerth, L., Maharana, S., Jahnel, M., Hein, M.Y., Stoy-
nov, S., Mahamid, J., Saha, S., Franzmann, T.M., et al. (2015). A liquid-to-solid
phase transition of the ALS protein FUS accelerated by disease mutation. Cell
162, 1066–1077.
Phelan, M.L., Sif, S., Narlikar, G.J., and Kingston, R.E. (1999). Reconstitution of
a core chromatin remodeling complex from SWI/SNF subunits. Mol. Cell 3,
247–253.
Pohl, A., and Beato, M. (2014). bwtool: a tool for bigWig files. Bioinformatics
30, 1618–1619.
Quinlan, A.R., and Hall, I.M. (2010). BEDTools: a flexible suite of utilities for
comparing genomic features. Bioinformatics 26, 841–842.
Riggi, N., Cironi, L., Provero, P., Suva, M.L., Kaloulis, K., Garcia-Echeverria, C.,
Hoffmann, F., Trumpp, A., and Stamenkovic, I. (2005). Development of Ewing’s
sarcoma from primary bone marrow-derived mesenchymal progenitor cells.
Cancer Res. 65, 11459–11468.
Riggi, N., Suva, M.L., Suva, D., Cironi, L., Provero, P., Tercier, S., Joseph, J.M.,
Stehle, J.C., Baumer, K., Kindler, V., and Stamenkovic, I. (2008). EWS-FLI-1
expression triggers a Ewing’s sarcoma initiation program in primary human
mesenchymal stem cells. Cancer Res. 68, 2176–2185.
Riggi, N., Knoechel, B., Gillespie, S.M., Rheinbay, E., Boulay, G., Suva, M.L.,
Rossetti, N.E., Boonseng, W.E., Oksuz, O., Cook, E.B., et al. (2014). EWS-
FLI1 utilizes divergent chromatin remodeling mechanisms to directly activate
or repress enhancer elements in Ewing sarcoma. Cancer Cell 26, 668–681.
Roberts, C.W., Leroux, M.M., Fleming, M.D., and Orkin, S.H. (2002). Highly
penetrant, rapid tumorigenesis through conditional inversion of the tumor sup-
pressor gene Snf5. Cancer Cell 2, 415–425.
Schwartz, J.C., Wang, X., Podell, E.R., and Cech, T.R. (2013). RNA seeds
higher-order assembly of FUS protein. Cell Rep. 5, 918–925.
Spahn, L., Siligan, C., Bachmaier, R., Schmid, J.A., Aryee, D.N., and Kovar, H.
(2003). Homotypic and heterotypic interactions of EWS, FLI1 and their onco-
genic fusion protein. Oncogene 22, 6819–6829.
Sun, Z., Diaz, Z., Fang, X., Hart, M.P., Chesi, A., Shorter, J., and Gitler, A.D.
(2011). Molecular determinants and genetic modifiers of aggregation and
toxicity for the ALS disease protein FUS/TLS. PLoS Biol. 9, e1000614.
Tanaka, K., Iwakuma, T., Harimaya, K., Sato, H., and Iwamoto, Y. (1997).
EWS-Fli1 antisense oligodeoxynucleotide inhibits proliferation of human
Ewing’s sarcoma and primitive neuroectodermal tumor cells. J. Clin. Invest.
99, 239–247.
Thomsen, C., Grundevik, P., Elias, P., Stahlberg, A., and Aman, P. (2013).
A conserved N-terminal motif is required for complex formation between
FUS, EWSR1, TAF15 and their oncogenic fusion proteins. FASEB J. 27,
4965–4974.
Tirode, F., Surdez, D., Ma, X., Parker, M., Le Deley, M.C., Bahrami, A., Zhang,
Z., Lapouble, E., Grossetete-Lalami, S., Rusch, M., et al.; St. Jude Children’s
Research Hospital–Washington University Pediatric Cancer Genome Project
and the International Cancer Genome Consortium (2014). Genomic landscape
Cell 171, 163–178, September 21, 2017 177

of Ewing sarcoma defines an aggressive subtype with co-association of
STAG2 and TP53 mutations. Cancer Discov. 4, 1342–1353.
Tomazou, E.M., Sheffield, N.C., Schmidl, C., Schuster, M., Schonegger, A.,
Datlinger, P., Kubicek, S., Bock, C., and Kovar, H. (2015). Epigenomemapping
reveals distinct modes of gene regulation and widespread enhancer reprog-
ramming by the oncogenic fusion protein EWS-FLI1. Cell Rep. 10, 1082–1095.
178 Cell 171, 163–178, September 21, 2017
Versteege, I., Sevenet, N., Lange, J., Rousseau-Merck, M.F., Ambros, P.,
Handgretinger, R., Aurias, A., and Delattre, O. (1998). Truncating mutations
of hSNF5/INI1 in aggressive paediatric cancer. Nature 394, 203–206.
Zhang, Y., Liu, T., Meyer, C.A., Eeckhoute, J., Johnson, D.S., Bernstein, B.E.,
Nusbaum, C., Myers, R.M., Brown, M., Li, W., and Liu, X.S. (2008). Model-
based analysis of ChIP-seq (MACS). Genome Biol. 9, R137.
STAR+METHODS
KEY RESOURCES TABLE
REAGENT or RESOURCE SOURCE IDENTIFIER
Antibodies
Antibodies used for immunoblotting and
immunoprecipitation
N/A See Table S1
Antibodies used for ChIP N/A See Table S1
Chemicals, Peptides, and Recombinant Proteins
HALT PROTEASE AND PHOSPHATASE
inhibitors
Pierce Cat#PI78445
Dynabeads� Protein G LIFE TECHNOLOGIES Cat#10004D
Biotinylated isoxazole (b-isox) SIGMA ALDRICH Cat#T511617-1MG
PDGF-BB PeproTech Cat#50589827
TransIT-LT1 Transfection Reagent MIRUS BIO LLC Cat#MIR 2305
Polybrene (HEXADIMETHRINE BROMIDE) Sigma-Aldrich Cat#H9268-50G
Puromycin FISHER SCIENTIFIC Cat#NC9138068
Blasticidin FISHER SCIENTIFIC Cat#NC9016621
Western Lightning Western Blot Chemiluminescence
Reagent Plus
PERKINELMER Cat#NEL104001EA
AUTORAD BLUE FILM FISHER SCIENTIFIC Cat#NC9648989
RNase A ROCHE Cat#11119915001
Proteinase K LIFE TECHNOLOGIES Cat#25530049
Palbociclib (PD 0332991 ISETHIONATE) SIGMA ALDRICH Cat#PZ0199
PRESCISSION PROTEASE FISHER SCIENTIFIC Cat#45001319
GLUTATHIONE SEPHAROSE 4B FISHER SCIENTIFIC Cat#45000139
D(+)TREHALOSE SIGMA ALDRICH Cat#T9531
Critical Commercial Assays
TruSeq Stranded Total RNA Library Prep Kit
with Ribo-Zero Gold Set A
Illumina Cat#RS-122-2301
TruSeq Stranded Total RNA Library Prep Kit
with Ribo-Zero Gold Set B
Illumina Cat#RS-122-2302
Nextera DNA Sample Preparation Kit Illumina Cat#FC-121-1030
Nucleospin RNA Plus Clontech Cat#740984.50
Celltiter-Glo Luminescent cell
viability assay
Promega Cat#G7570
fast SYBR Green Master Mix ThermoFisher Cat#4385618
High Capacity cDNA reverse transcription kit ThermoFisher Cat#4387406
Deposited Data
ChIP-seq, RNA-seq, ATAC-seq data This study GEO: GSE94278
Raw and analyzed data Riggi et al., 2014 GEO: GSE61953
Experimental Models: Cell Lines
A673 ATCC CRL-1598
SK-N-MC ATCC HTB-10
U20S ATCC HTB-96
HEK293-T ATCC CRL-11268
(Continued on next page)
Cell 171, 163–178.e1–e7, September 21, 2017 e1
Continued
REAGENT or RESOURCE SOURCE IDENTIFIER
HEK293-T LentiX Clontech Cat#632180
Human pediatric Mesenchymal
Stem Cells
This study N/A
Experimental Models: Organisms/Strains
BL21(DE3)LYSS FISHER SCIENTIFIC Cat#PRL1195
Oligonucleotides
Primers for RT-qPCR IDT See Table S1
Primers for ChIP-qPCR IDT See Table S1
Recombinant DNA
pLIV-V5-EWS-FLI1 This study N/A
pLIV-V5-FLI1 This study N/A
N106-BAF47-FLI1 This study N/A
pLIV-HA-EWSR1 This study N/A
N106-GFP-EWSR1 This study N/A
pLIV-V5-EWS(YS12)-FLI1 This study N/A
pLIV-V5-EWS(YS37)-FLI1 This study N/A
pLIV-V5-SYGQ1-FLI1 This study N/A
pLIV-V5-SYGQ2-FLI1 This study N/A
pLIV-V5-EWS(DSYGQ1)-FLI1 This study N/A
pLIV-V5-EWS(DSYGQ2)-FLI1 This study N/A
pLIV-V5-EWS(DSYGQ1DSYGQ2)-FLI1 This study N/A
pLIV-V5-EWS N-terminal This study N/A
pLIV-V5-FLI1 C-terminal This study N/A
pINDUCER-GFP This study N/A
pINDUCER- V5-EWS-FLI1 This study N/A
pINDUCER- EWS(YS37)-FLI1 This study N/A
pINDUCER- SYGQ2-FLI1 This study N/A
pGEX-6P1- V5-EWS-FLI1 This study N/A
pGEX-6P1- V5-FLI1 This study N/A
pGEX-6P1- V5-EWS(YS37)-FLI1 This study N/A
pGEX-6P1- V5-SYGQ1-FLI1 This study N/A
shRNA targeting sequence: BRG1
GGCATAGGCCTTAGCAGTAAC
Broad Institute Clone ID: TRCN0000231102
shRNA targeting sequence: BRG1
CTTTGCGTATCGCGGCTTTAA
Broad Institute Clone ID: TRCN0000231101
shRNA targeting sequence: BAF155#1
CCCACCACATTTACCCATATT
Broad Institute Clone ID: TRCN0000015629
shRNA targeting sequence: BAF155#2
GCAGGATATTAGCTCCTTATA
Broad Institute Clone ID: TRCN0000015628
shRNA targeting sequence: EWS-FLI1
CGTCATGTTCTGGTTTGAGAT
Broad Institute Clone ID: TRCN0000005322
Software and Algorithms
bwa Li and Durbin, 2009 https://github.com/lh3/bwa
bwtool Pohl and Beato, 2014 https://github.com/CRG-Barcelona/bwtool
STAR Dobin et al., 2013 https://github.com/alexdobin/STAR
MACS2 Zhang et al., 2008 https://github.com/taoliu/MACS
Prism 6 Graphpad N/A
R version 3.2.3 https://cran.r-project.org
(Continued on next page)
e2 Cell 171, 163–178.e1–e7, September 21, 2017
Continued
REAGENT or RESOURCE SOURCE IDENTIFIER
IGV IGV_2.3.60 https://github.com/igvteam/igv
HOMER Heinz et al., 2010 http://homer.salk.edu/homer/
DESeq2 Love et al., 2014 https://bioc.ism.ac.jp/packages/3.1/
bioc/html/DESeq2.html
bedtools Quinlan and Hall, 2010 https://github.com/arq5x/bedtools
featureCounts Liao et al., 2014 http://subread.sourceforge.net
ImageJ v1.50i National Institutes of Health, USA http://imagej.nih.gov/ij
Other
CONTACT FOR REAGENT AND RESOURCE SHARING
Further information and requests for resources and reagents should be directed to and will be fulfilled by Lead Contact Miguel N.
Rivera ([email protected]).
EXPERIMENTAL MODEL AND SUBJECT DETAILS
Mesenchymal stem cellsMesenchymal stem cells were collected with approval from the Institutional ReviewBoard of the Centre Hospitalier Universitaire Vau-
dois (CHUV, University of Lausanne). Samples were deidentified prior to our analysis. Primary bone marrow derived mesenchymal
stem cells were cultured in Iscove’s modified Dulbecco’s medium containing 10% fetal calf serum (FCS) and 10 ng/ml platelet-
derived growth factor BB (PeproTech).
Cell linesCell lines were obtained from ATCC and media from Life Technologies. Ewing sarcoma cell lines SKNMC and A673 were grown in
RPMI. HEK293-T, U2OS, and SAOS2 cells were grown in DMEM. All media were supplemented with 10% FBS and cells were
cultured at 37�C with 5% CO2. Cells were maintained and split every 2–3 days according to ATCC recommendations.
Bacterial CulturesFor protein production, E. coliBL21 (DE3) pLysS (Fisher Scientific) were grown in LBmedium supplemented with 100 mg/ml ampicillin
and 25 mg/ml chloramphenicol. At absorbance A600 = 0.8, protein expression in E. coli cultures was induced by adding 0.1 mM IPTG
and incubated overnight at 16�C with agitation.
METHOD DETAILS
Lentiviral GenerationLentivirus was produced in 293T LentiX cells (Clontech) either by polyethylenimine (PEI) (Polysciences) transfection with gene deliv-
ery vector and packaging vectors pspax2 and pMD2.G (Kadoch and Crabtree, 2013) or by LT1 (Mirus Bio) transfection with gene
delivery vector and packaging vectors GAG/POL and VSV plasmids (Boulay et al., 2017). Viral supernatants were collected 72h after
transfection and concentrated using either ultracentrifugation (2 hr +4�C at 20,000 rpm) or LentiX concentrator (Clontech). Virus con-
taining pellets were resuspended in PBS and added dropwise on cells in presence of media supplemented with 6 mg/ml polybrene.
Selection of lentivirally-infected cells was achieved with puromycin used at 0.75-1-2 mg/ml (MSC, SK-N-MC and A673/U2OS respec-
tively) and blasticidin used at 7 mg/ml in MSC and U2OS. Overexpression or knockdown efficiency was determined by western blot
analysis and RT-qPCR.
Transient TransfectionsHEK293T cells were plated to 80% confluency prior to transfection using LT1 (Mirus Bio) or PEI (Polysciences) according to the
manufacturer recommendations and were collected after 48h.
Real-Time Quantitative RT-PCRFor gene expression assays, total RNA was isolated from cells using NucleoSpin RNA Plus (Clontech). cDNA was obtained using a
high-capacity RNA to-cDNA kit (Applied Biosystems). 500 nanograms of template total RNA and random hexamers were used for
each reaction. Real-time PCR amplification was performed using fast SYBR Green Master Mix (Life Technologies) and specific
PCR primers in a Lightcycler 480 instrument (Roche). Oligonucleotides used are provided in Table S1. Relative quantification of
each target, normalized to an endogenous control (GAPDH or HPRT1), was performed using the comparative Ct method (Applied
Cell 171, 163–178.e1–e7, September 21, 2017 e3

Biosystems). Error bars indicate SD of three technical replicates and represent at least two independent biological experiments. Sta-
tistical analyses were performed by Student’s t test. In heatmaps, log2 qRT-PCR expression values were averaged across biological
replicates in each condition and scaled for each gene.
Western Blot AnalysisWestern blotting was performed using standard protocols. Primary antibodies used for western blotting are listed in Table S1.
Secondary antibodies were goat anti-rabbit and goat anti-mouse immunoglobulin G-horseradish peroxidase-conjugated (Bio-
Rad, 1:10,000 dilution). Membranes were developed using Western Lightning Plus-ECL enhanced chemiluminescence substrate
(PerkinElmer) and visualized using photographic film. Alternatively, IRDye (Li-COR Biosciences, Lincoln, NE, USA) secondary anti-
bodies were used for visualization with the Li-Cor Oddessy Imaging System (Li-COR Biosciences, Lincoln, NE, USA).
Nuclear Extract PreparationCells were homogenized in Buffer A (25 mM HEPES (pH 7.6), 25 mM KCL, 0.05 mM EDTA, 10% glycerol, 5mMMgCl2, 0.1% NP-40,
supplemented with fresh 1mM DTT, protease inhibitors [Roche], and 1mM PMSF) on ice. Nuclei were sedimented by centrifugation
(1,200 rpm), resuspended in Buffer C (10 mM HEPES (pH 7.6), 3 mM MgCl2, 100 mM KCL, 0.1 mM EDTA, 10% glycerol, 1 mM DTT
and protease inhibitors), and lysed by the addition of ammonium sulfate to a final concentration of 300 mg/mL. Soluble nuclear pro-
teins were separated by ultracentrifugation (100,000 x g) and precipitated with 0.3mg/ml ammonium sulfate for 20min on ice. Protein
precipitate was isolated by ultracentrifugation (100,000 x g) and resuspended in IP buffer 1 (300 mM NaCl, 25 mM HEPES [pH 8.0],
0.1% Tween-20, 10%Glycerol, 1 mMDTT, 1 mMPMSFwith protease inhibitors) or IP buffer 2 (150mMNaCl, 50 mM Tris-HCl, 1 mM
EDTA, 1%Triton X-100, 1mMDTT, 1mMPMSFwith protease inhibitors) for immunoprecipitation analyses or HEMG-0 buffer (25mM
HEPES [pH 7.9], 0.1 mM EDTA, 12.5 mMMgCl2, 100 mM KCl, supplemented with DTT and PMSF) for analyses on glycerol gradient.
ImmunoprecipitationsNuclear extracts were resuspended in IP buffer and placed in protein lo-bind tubes (Eppendorf). Protein concentration was deter-
mined using Bradford assay and adjusted to the final volume of 200 mL at a final concentration of 1 mg/ml with IP buffer. Each IP
was incubatedwith 2 mg of antibody (Antibody specifications are found in Table S1) overnight at 4�Cand then for 1hwith 20 mL Protein
G Dynabeads (Life Technologies) or Protein G Sepharose beads (GE Heathcare). The beads were then washed five times at 4�Cwith
IP buffer and resuspended in 20 mL 2x gel loading buffer (4x LDS buffer; Invitrogen) + DTT and water.
Alternatively, immunoprecipitations were performed as previously described (Boulay et al., 2017): cells were resuspended in IPH
Buffer (50 mM Tris-HCl pH 8, 150 mMNaCl, 5 mM EDTA, 0.5% NP-40 and 10% glycerol supplemented with protease and phospha-
tase inhibitors (Pierce) and 1mM PMSF) before sonication in a QSONICA 800 R instrument. Protein supernatant was then collected
after centrifugation for 15 min at 14 000 rpm and 4�C. Proteins were quantified using a Bradford assay (Pierce) and 500 mg of lysate
were diluted in IPH buffer to a final volume of 1 mL and incubated overnight at +4�C with 2 mg of the indicated antibodies in the pres-
ence of magnetic G-Dynabeads (Life Technologies) and 100 mg/mL Ethidium Bromide (SIGMA-ALDRICH). 100 mg/mL RNase A (Life
Technologies) was used for RNase treatment experiments. Beads were washed 5 times with IPH buffer and eluted by boiling in
loading Laemmli buffer.
Depletion StudiesNuclear extracts were prepared to a final concentration of 2.5 mg/ml with IP buffer 2. For each IP, 75ug (30 mL) of nuclear extract was
incubated with 2.5 mg of antibody overnight at 4�C and then for 1h with 15 mL pre-washed Protein G Sepharose beads. After centri-
fugation (10,000 rpm for 1min) 45 mL of the supernatant was either saved or used for another round of IP. In total 3 rounds of IP were
performed. Quantitative densitometry analyses were performed with the Li-Cor Oddessy Imaging System (Li-COR Biosciences,
Lincoln, NE, USA).
Urea Denaturation StudiesNuclear extracts (150 mg) were subjected to partial urea denaturation, ranging from 0.25 to 2.5M urea (in IP buffer), for 30min at room
temperature (RT) prior to anti-EWSR1 IP. The co-precipitated proteins were analyzed by immunoblot.
Density Sedimentation AnalysesNuclear extracts (500 mg) were resuspended in 200 mL of 0% glycerol HEMG buffer and carefully overlaid onto a 10 mL 10%–30%
glycerol (in HEMG buffer) gradient prepared in a 14 3 89mm polyallomer centrifuge tube (331327, Beckman Coulter, Brea, CA, USA).
Tubes were centrifuged in an SW40 rotor at 4�C for 16 hr at 40,000 rpm. Fractions (0.5 mL) were collected and used in analyses.
Mass SpectrometryImmunoprecipitation using either IgG (Cell Signaling Technology) or anti-EWSR1 (Bethyl) crosslinked antibodies was performed in
SK-N-MCnuclear extracts. Immunoprecipitation samples were then run on a 4%–12%Bis-Tris Gel (ThermoScientific) and subjected
e4 Cell 171, 163–178.e1–e7, September 21, 2017
to Coomassie staining. Bands were then cut from each IP and submitted to the Taplin Biological Mass Spectrometry Facility (Harvard
Medical School) for analysis.
ChIP-seqChIP assays were carried out on A673, SKNMC and MSCs cultures of approximately 2-5 million cells per sample and per epitope,
following the procedures described previously (Mikkelsen et al., 2007). In brief, chromatin from formaldehyde-fixed cells was frag-
mented to a size range of 200–700 bases with a Branson 250 sonifier. Solubilized chromatin was immunoprecipitated with the indi-
cated antibodies overnight at 4�C. Antibody-chromatin complexes were pulled down with protein G-Dynabeads (Life Technologies),
washed, and then eluted. After crosslink reversal, RNase A, and proteinase K treatment, immunoprecipitated DNAwas extractedwith
AMP Pure beads (Beckman Coulter). ChIP DNA was quantified with Qubit. 1-5 ng ChIP DNA samples were used to prepare
sequencing libraries, and ChIP DNA and input controls were sequenced with the Nextseq 500 Illumina genome analyzer.
ChIP-seq Bioinformatic AnalysisReads were aligned to hg19 using bwa (Li and Durbin, 2009). Aligned reads were then filtered to exclude PCR duplicates and were
extended to 200 bp to approximate fragment sizes. Density maps were generated by counting the number of fragments overlapping
each position using igvtools, and normalized to 10 million reads. We used MACS2 (Zhang et al., 2008) to call peaks using matching
input controls with a q-value threshold of 0.01. BAF155 peaks were called using the–broad parameter andwere considered promoter
peaks if they were within 1 kb of transcriptional start sites (TSSs) in the Refseq database. Peaks were filtered to exclude blacklisted
regions as defined by the ENCODE consortium (Consortium, 2012). Peaks within 200 bp of each other were merged. Peak intersec-
tions were identified using bedtools (Quinlan andHall, 2010). Average ChIP-seq signals across intervals were calculated using bwtool
(Pohl and Beato, 2014). Total ChIP-seq signals were calculated by multiplying average signals by peak length. For motif discovery
and peak annotations, we used Homer suite of tools (Heinz et al., 2010). findMotifsGenome.pl was used to identify de novo motifs
within 500 bp flanking centers of distal peaks. The annotatePeaks.pl script was used to assign peaks to annotations. Signals shown in
heatmaps (100 bp windows) and composite plots (10 bp window) were calculated using bwtool (Pohl and Beato, 2014). Heatmap
signals are in log2 scale, centered around EWS-FLI1-bound GGAA repeat enhancers previously described (Riggi et al., 2014) (N =
812) and are capped at the 99th percentile.
ChIP-qPCRChromatin immunoprecipitation was performed as descrived above. Quantitative PCRwas performed using fast SYBRGreenMaster
Mix (Life Technologies) and specific PCR primers in a Lightcycler 480 instrument (Roche). Oligonucleotides used are provided in
Table S1. Relative quantification of each target, normalized to INPUT control, was performed using the comparative Ct method
(Applied Biosystems). Error bars indicate SD of three technical replicates and represent at least two independent biological
experiments.
RNA-SeqTotal RNA was isolated from cells using NucleoSpin RNA Plus (Clontech). 0.5-1 ug of total RNA was treated with Ribogold zero to
remove ribosomal RNA. Illumina sequencing libraries were constructed using random primers according to the manufacturer’s in-
structions using the Truseq Stranded RNA LT Kit.
RNA-seq bioinformatic ProcessingReads were aligned to hg19 using STAR (Dobin et al., 2013). Mapped reads were filtered to exclude PCR duplicates and reads map-
ping to known ribosomal RNA coordinates, obtained from rmsk table in the UCSC database (http://genome.ucsc.edu). Gene expres-
sion was calculated using featureCounts (Liao et al., 2014). Only primary alignments with mapping quality of 10 or more were
counted. Counts were then normalized to 1 million reads. Signal tracks were generated using bedtools (Quinlan and Hall, 2010). Dif-
ferential expression was calculated using DESeq2 (Love et al., 2014).
Definition of target genes associated with EWS-FLI1 bound GGAA-repeatsTo compare changes in expression of GGAA-repeat associated EWS-FLI1 target genes in MSC experiments, we selected genes
based on downregulation upon EWS-FLI1 knockdown in both A673 and SKNMC Ewing sarcoma cells (greater than 2-fold) and a
maximum distance of 1 megabase from a EWS-FLI1-bound GGAA repeat (Riggi et al., 2014). Genes were included in heatmaps if
they were significantly upregulated (2 fold change and corrected p value < 0.05) in the positive control EWS-FLI1 infection in a given
experiment. Normalized expression values were averaged across biological replicates in each condition and scaled for each gene.
Principal Component AnalysisPrincipal Component Analysis (PCA) was performed using the R package ‘‘prcomp.’’ Principal components were calculated sepa-
rately for repeat-associated genes (as described above) and non-repeat-associated genes with reciprocal changes in EWS-FLI1
knockdowns (2-fold in A673 and SKNMC cells) andMSCs infected with EWS-FLI1 (2-fold and corrected p value < 0.05). PC rotations
obtained by evaluating MSCs infected with EWS-FLI1 and controls were used to calculate PC1 scores for other conditions.
Cell 171, 163–178.e1–e7, September 21, 2017 e5
ATAC-seq Genome-Wide DNA Accessibility AssayATAC-seq analysis on human pediatric MSCs was performed as recently described (Buenrostro et al., 2013). Briefly, 5x10⁴ cells for
each condition were first incubated in hypotonic buffer then resuspended in lysis buffer, centrifugated and resuspended in Transpo-
sase reaction mix for additional 30 min at 37�C, following manufacturer recommendations (Nextera DNA sample Prep Kit, Illumina).
After DNA purification, adaptor sequences were added to the fragmented DNA by PCR. Purified PCR products were sequenced us-
ing the Illumina Nextseq device.
ATAC-seq bioinformatic ProcessingPaired end reads were aligned to hg19 using bwa (Li and Durbin, 2009). Reads that aligned in the proper orientation and on the same
chromosome were then filtered to exclude PCR duplicates and processed as previously described (Buenrostro et al., 2013). Briefly,
read start sites were adjusted to represent the center of the transposon binding event (+4 bp in the plus strand and�5 bp in theminus
strand). Signal densities were calculated over a sliding 150 bp window at 20 bp steps and normalized to 10 million reads in each
experiment using bedtools (Quinlan and Hall, 2010). Average ATAC-seq signals across intervals was calculated using bwtool
(Pohl and Beato, 2014). To test chromatin opening in non-GGAA repeat sites after BAF47-FLI1 expression, ATAC-seq signals
were measured at the top 10,000 new peaks detected with the FLI1 antibody after introduction of BAF47-FLI1.
Immunofluorescence StainingsStaining was performed using standard protocols. Briefly, cells were fixed in a 1X PBS solution containing 4% paraformaldehyde
15min at room temperature (RT), washedwith 1X PBS and stored at 4�C. Cells were permeabilized 10min at RT in 1X PBS containing
0.5%Triton X-100 then blocked for 30min at RT, stainedwith the relevant antibody for 2 hr at RT andwith Alexa Fluor 546-conjugated
secondary antibody (Life Technologies) for 1h at RT in the dark. Cells were washed with 1X PBS between each step of the protocol.
Nuclei were stained with DAPI solution.
Cell Viability AssaysCells were seeded in triplicates and grown under log phase growth conditions in cell culture treated 96 well plate. After the indicated
incubation times, cell viability wasmeasured using the CellTiter-Glo luminescent assay (Promega) as described by themanufacturer.
Endpoint luminescence wasmeasured on a SpectraMaxM5 plate reader (Molecular Devices). The data displayed are representative
of at least two biological experiments. Statistical analyses were performed by Student’s t test.
G1 Arrest ExperimentsA673 cells were treated with Palbociclib (PD 0332991 ISETHIONATE, Sigma-Aldrich) at a final concentration of 1.5 uM for 24 hr.
Biotinylated isoxazole-Mediated PrecipitationThese assays were performed as previously described (Kato et al., 2012) with slight modifications. Biotinylated isoxazole (b-isox,
Sigma-Aldrich) was reconstituted in DMSO. Briefly, 5-10 million cells were resuspended in 1 mL lysis buffer (20 mM Tris-HCl pH
7.4, 150 mM NaCl, 5 mM MgCl2, 0.5% NP-40 and 10% glycerol supplemented with 1X Protease/Phosphatase inhibitors (Pierce),
0.1 mM PMSF and 20 mM beta-mercaptoethanol) and incubated for 30 min with rotation at +4�C. Protein supernatant was then
collected after centrifugation for 15 min at 14000 rpm +4�C. A 5% whole cell extract (WCE) control was collected and the remaining
proteins were divided into four aliquots before addition of biotinylated isoxazole at 0, 10, 30 100 uM final concentrations. 100 mg/mL
RNase A (Life Technologies) was used for RNase treatment experiments. The Reaction solutions were incubated at +4�C for 1h with
rotation and centrifuged for 15 min at 14000 rpm +4�C. Supernatant was saved for further analysis and pellets were washed twice in
supplemented Lysis buffer before resuspension in Laemmli buffer. WCE, pellets and supernatants were analyzed by 4%–12% Tris-
Glycine gradient gels (Life Technologies) and western blotting was performed using standard protocols.
Protein purification and sedimentation assaysRecombinant proteins were purified as previously described (Couthouis et al., 2011; Sun et al., 2011) with minor modifications. Wild-
type and mutant constructs were cloned in pGEX-6P1, and expressed in E. coli BL21 (DE3) pLysS (Fisher Scientific). Bacteria were
grown in LB medium supplemented with 100 mg/ml ampicillin and 25 mg/ml chloramphenicol. At absorbance A600 = 0.8, protein
expression in E. coli cultures was induced by adding 0.1 mM IPTG and incubated overnight at 16�C with agitation. Cells were har-
vested by centrifugation and cell pellets were resuspended in 40 mL GST buffer (1X PBS, 150 mM NaCl, 1.5 mM EDTA, 1mM DTT,
0.2% Triton X-100 and Protease/phosphatase inhibitors (Sigma)). The homogenized suspension was sonicated 3 times on ice for
30 s. The insoluble materials were removed by centrifugation (15,000 rpm 20 min at 4�C) and the clarified supernatants were incu-
bated with glutathione Sepharose beads (GE Healthcare) or glutathione magnetic agarose beads (Pierce) for 2 hr at 4�C. The beads
were washed 3 times with GST washing buffer (1X PBS, 350mMNaCl, 1mM EDTA, and 1mMDTT) and once with equilibration buffer
(50 mM Tris-HCl pH 8, 100 mM KAc, 200 mM trehalose, 0.5 mM EDTA). Recombinant proteins were eluted with GST elution buffer
(50 mM Tris-HCl pH 8, 100 mMKAc, 200 mM trehalose, 0.5 mM EDTA, 20 mM glutathione) for 2h at 4�C. Eluted proteins were centri-
fuged (16,000 g 10 min at 4�C) prior to quantification by Bradford assay. Recombinant proteins (2.5 mM) were then resuspended in
reaction buffer (50 mM Tris$HCl, pH 8, 100 mM potassium acetate, 200 mM trehalose, 0.5 mM EDTA, 20 mM glutathione, 60 U/mL
e6 Cell 171, 163–178.e1–e7, September 21, 2017
Scission Protease) and incubated at 25�C for 60 min with agitation (1,200 rpm) in an Eppendorf Thermomixer before centrifugation at
16,000 g for 10min at +25�C. Recombinant GST-EWS-FLI1 bound tomagnetic beadswas quantified against a bovine serum albumin
standard dilution by SDS-PAGE and Coomassie staining andmagnetic beads were removed before final centrifugation. Supernatant
and pellet fractions were then resolved by SDS-PAGE and stained with Coomassie Blue. The amount in either fraction was deter-
mined by densitometry in comparison to an input reaction control using ImageJ software.
QUANTIFICATION AND STATISTICAL ANALYSES
All statistical details of experiments are included in the Figure legends or specific Methods section.
DATA AND SOFTWARE AVAILABILITY
The data accompanying this paper have been deposited into GEO under accession number GSE94278.
ADDITIONAL RESOURCES
To aid our analysis, we also used our publicly available dataset for EWS-FLI1 and H3K27ac ChIP-seq in A673 and SK-N-MC cells
(GEO: GSE61953) (Riggi et al., 2014).
Cell 171, 163–178.e1–e7, September 21, 2017 e7
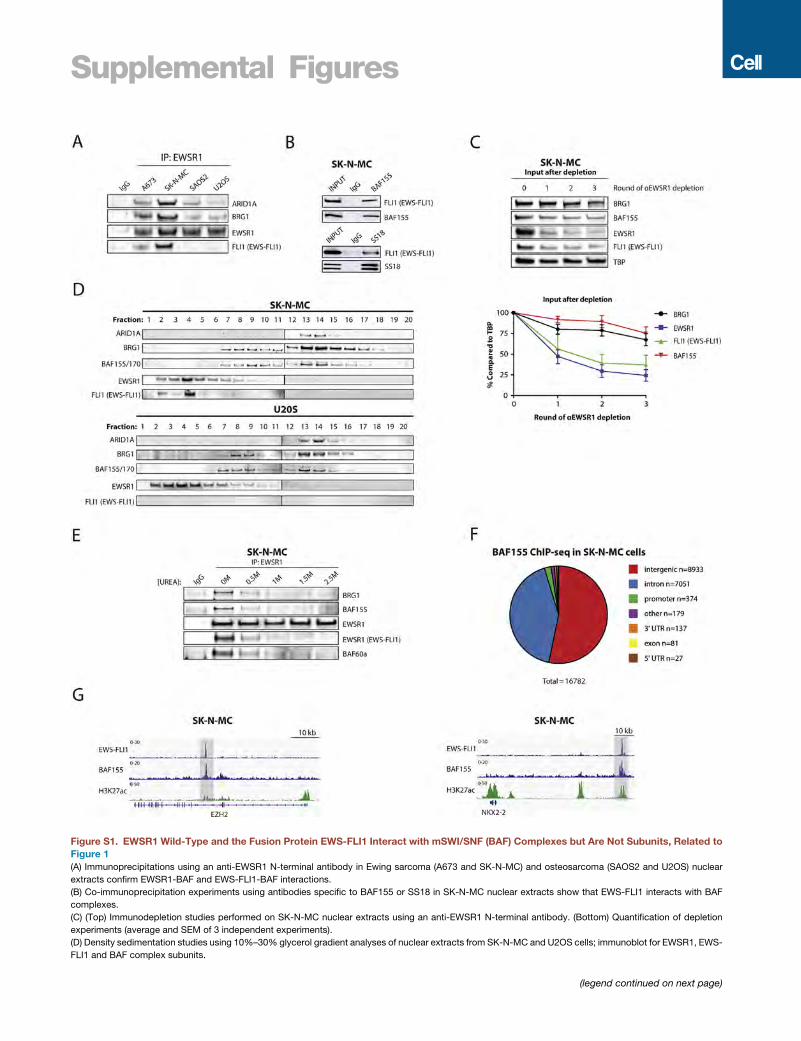
Supplemental Figures
Figure S1. EWSR1 Wild-Type and the Fusion Protein EWS-FLI1 Interact with mSWI/SNF (BAF) Complexes but Are Not Subunits, Related to
Figure 1
(A) Immunoprecipitations using an anti-EWSR1 N-terminal antibody in Ewing sarcoma (A673 and SK-N-MC) and osteosarcoma (SAOS2 and U2OS) nuclear
extracts confirm EWSR1-BAF and EWS-FLI1-BAF interactions.
(B) Co-immunoprecipitation experiments using antibodies specific to BAF155 or SS18 in SK-N-MC nuclear extracts show that EWS-FLI1 interacts with BAF
complexes.
(C) (Top) Immunodepletion studies performed on SK-N-MC nuclear extracts using an anti-EWSR1 N-terminal antibody. (Bottom) Quantification of depletion
experiments (average and SEM of 3 independent experiments).
(D) Density sedimentation studies using 10%–30% glycerol gradient analyses of nuclear extracts from SK-N-MC and U2OS cells; immunoblot for EWSR1, EWS-
FLI1 and BAF complex subunits.
(legend continued on next page)

(E) Urea denaturation analysis performed on anti-EWSR1 C-terminal IPs from SK-N-MC nuclear extracts treated with [urea] = 0-2.5M. EWS-FLI1 and the BAF
complex are held with equimolar affinity to EWSR1.
(F) Pie chart showing annotations of MACS-called peaks for BAF155 ChIP-seq in SKNMC cells using Homer.
(G) Additional representative examples of EWS-FLI1 and BAF155 co-occupancy at GGAA repeat enhancers associated with EZH2 and NKX2-2 genes in SK-N-
MC cells.
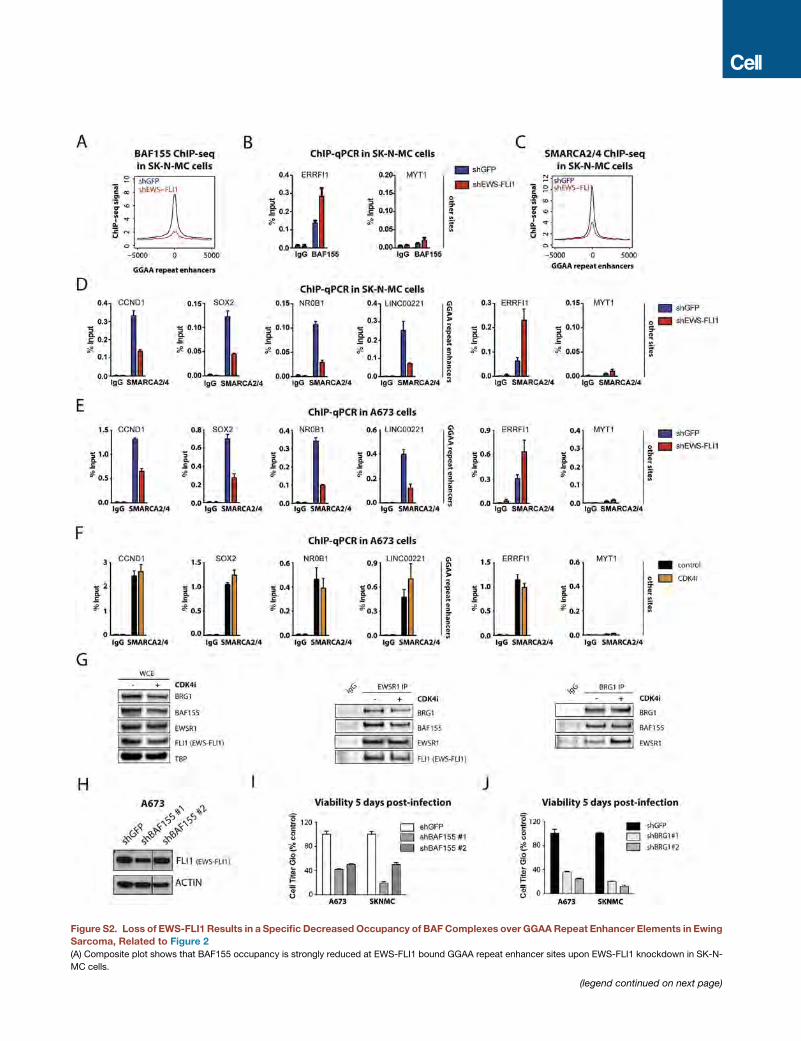
Figure S2. Loss of EWS-FLI1 Results in a Specific Decreased Occupancy of BAFComplexes over GGAARepeat Enhancer Elements in EwingSarcoma, Related to Figure 2
(A) Composite plot shows that BAF155 occupancy is strongly reduced at EWS-FLI1 bound GGAA repeat enhancer sites upon EWS-FLI1 knockdown in SK-N-
MC cells.
(legend continued on next page)

(B) ChIP-qPCR experiments at control sites confirm the specificity of BAF155 decreased occupancy observed at GGAA repeats in Figure 2E upon EWS-FLI1
knockdown in SKNMC cells. ERRFI1 is an ETS binding site repressed by EWS-FLI1 and MYT1 is a negative control region. Error bars indicate SD of three
technical replicates and represent at least two independent biological experiments.
(C) Composite plot shows that SMARCA2/4 occupancy is strongly reduced at EWS-FLI1 bound GGAA repeat enhancer sites upon EWS-FLI1 knockdown in
SKNMC cells.
(D and E) ChIP-qPCR experiments show specific decreased occupancy of SMARCA2/4 upon EWS-FLI1 knockdown in SKNMC (S2D) and A673 cells (S2E) at
GGAA repeats. CCND1, SOX2, NR0B1 and LINC00221 are GGAA repeat microsatellites activated by EWS-FLI1 in Ewing sarcoma. ERRFI1 is an ETS binding site
repressed by EWS-FLI1 and MYT1 is a negative control region. Error bars indicate SD of three technical replicates and represent at least two independent
biological experiments.
(F) ChIP-qPCR experiments showmaintained occupancy of SMARCA2/4 at GGAA repeat enhancers upon CDK4i (palbociclib) treatment in A673 cells. Error bars
indicate SD of three technical replicates and represent at least two independent biological experiments.
(G) Co-immunoprecipitation experiments show maintained interactions between EWSR1, EWS-FLI1 and BAF complex upon CDK4i (palbociclib) treatment in
A673 cells.
(H) Immunoblotting shows maintained EWS-FLI1 protein levels in A673 cells infected with two different shRNAs targeting BAF155 as shown Figure 2J.
(I and J) Cell viability assays (Cell-titer Glo) in A673 and SKNMC cells five days post-infection with two different shRNAs specifically targeting BAF155 (S2I) and
BRG1 (S2J). Error bars indicate SD of three technical replicates and represent at least two independent biological experiments.
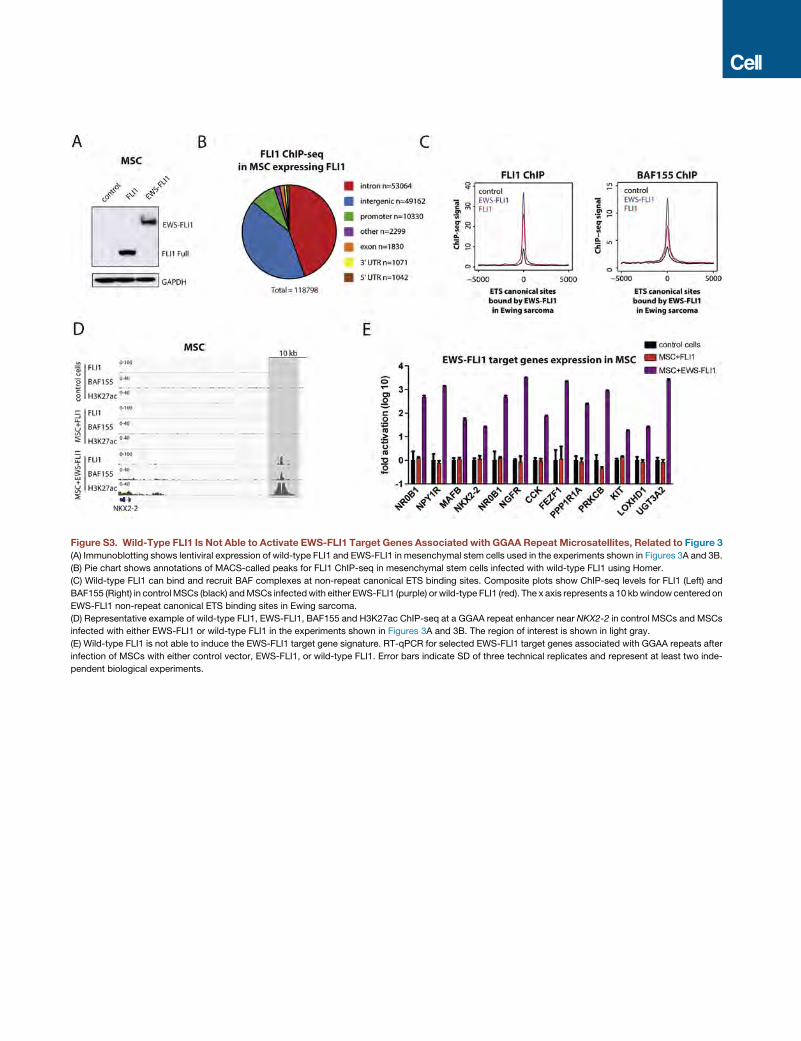
Figure S3. Wild-Type FLI1 Is Not Able to Activate EWS-FLI1 Target Genes Associated with GGAA Repeat Microsatellites, Related to Figure 3
(A) Immunoblotting shows lentiviral expression of wild-type FLI1 and EWS-FLI1 in mesenchymal stem cells used in the experiments shown in Figures 3A and 3B.
(B) Pie chart shows annotations of MACS-called peaks for FLI1 ChIP-seq in mesenchymal stem cells infected with wild-type FLI1 using Homer.
(C) Wild-type FLI1 can bind and recruit BAF complexes at non-repeat canonical ETS binding sites. Composite plots show ChIP-seq levels for FLI1 (Left) and
BAF155 (Right) in controlMSCs (black) andMSCs infectedwith either EWS-FLI1 (purple) or wild-type FLI1 (red). The x axis represents a 10 kbwindow centered on
EWS-FLI1 non-repeat canonical ETS binding sites in Ewing sarcoma.
(D) Representative example of wild-type FLI1, EWS-FLI1, BAF155 and H3K27ac ChIP-seq at a GGAA repeat enhancer near NKX2-2 in control MSCs and MSCs
infected with either EWS-FLI1 or wild-type FLI1 in the experiments shown in Figures 3A and 3B. The region of interest is shown in light gray.
(E) Wild-type FLI1 is not able to induce the EWS-FLI1 target gene signature. RT-qPCR for selected EWS-FLI1 target genes associated with GGAA repeats after
infection of MSCs with either control vector, EWS-FLI1, or wild-type FLI1. Error bars indicate SD of three technical replicates and represent at least two inde-
pendent biological experiments.
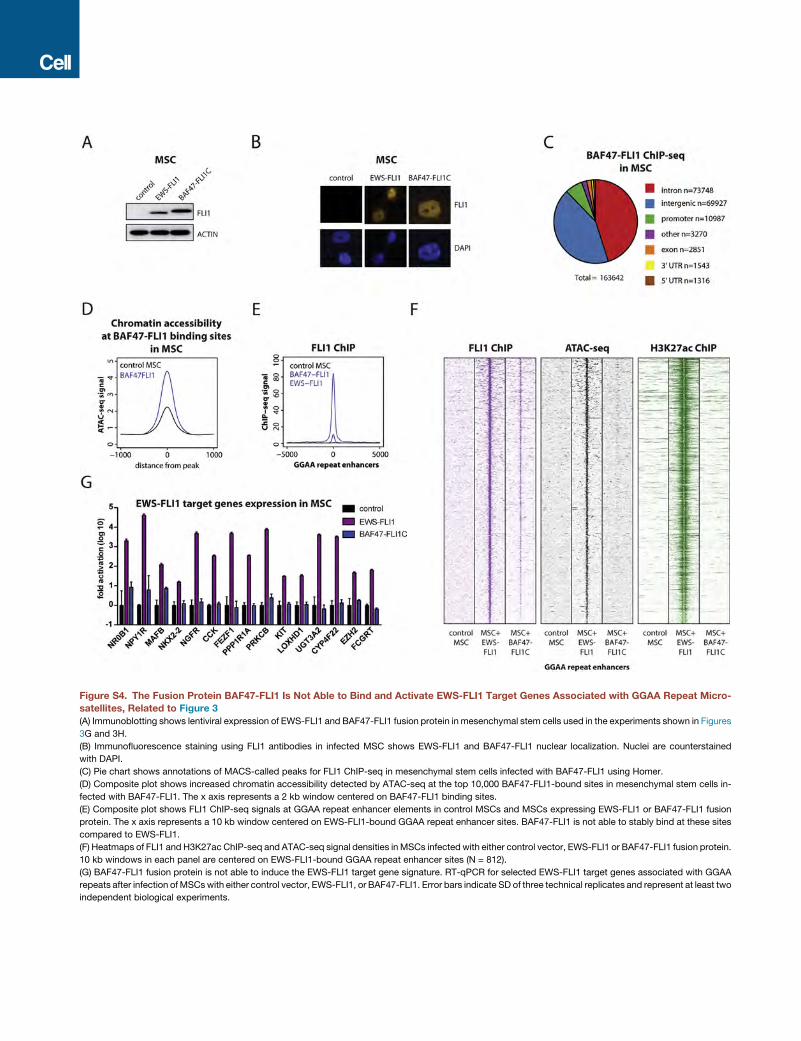
Figure S4. The Fusion Protein BAF47-FLI1 Is Not Able to Bind and Activate EWS-FLI1 Target Genes Associated with GGAA Repeat Micro-
satellites, Related to Figure 3
(A) Immunoblotting shows lentiviral expression of EWS-FLI1 and BAF47-FLI1 fusion protein in mesenchymal stem cells used in the experiments shown in Figures
3G and 3H.
(B) Immunofluorescence staining using FLI1 antibodies in infected MSC shows EWS-FLI1 and BAF47-FLI1 nuclear localization. Nuclei are counterstained
with DAPI.
(C) Pie chart shows annotations of MACS-called peaks for FLI1 ChIP-seq in mesenchymal stem cells infected with BAF47-FLI1 using Homer.
(D) Composite plot shows increased chromatin accessibility detected by ATAC-seq at the top 10,000 BAF47-FLI1-bound sites in mesenchymal stem cells in-
fected with BAF47-FLI1. The x axis represents a 2 kb window centered on BAF47-FLI1 binding sites.
(E) Composite plot shows FLI1 ChIP-seq signals at GGAA repeat enhancer elements in control MSCs and MSCs expressing EWS-FLI1 or BAF47-FLI1 fusion
protein. The x axis represents a 10 kb window centered on EWS-FLI1-bound GGAA repeat enhancer sites. BAF47-FLI1 is not able to stably bind at these sites
compared to EWS-FLI1.
(F) Heatmaps of FLI1 and H3K27ac ChIP-seq and ATAC-seq signal densities inMSCs infected with either control vector, EWS-FLI1 or BAF47-FLI1 fusion protein.
10 kb windows in each panel are centered on EWS-FLI1-bound GGAA repeat enhancer sites (N = 812).
(G) BAF47-FLI1 fusion protein is not able to induce the EWS-FLI1 target gene signature. RT-qPCR for selected EWS-FLI1 target genes associated with GGAA
repeats after infection ofMSCswith either control vector, EWS-FLI1, or BAF47-FLI1. Error bars indicate SD of three technical replicates and represent at least two
independent biological experiments.
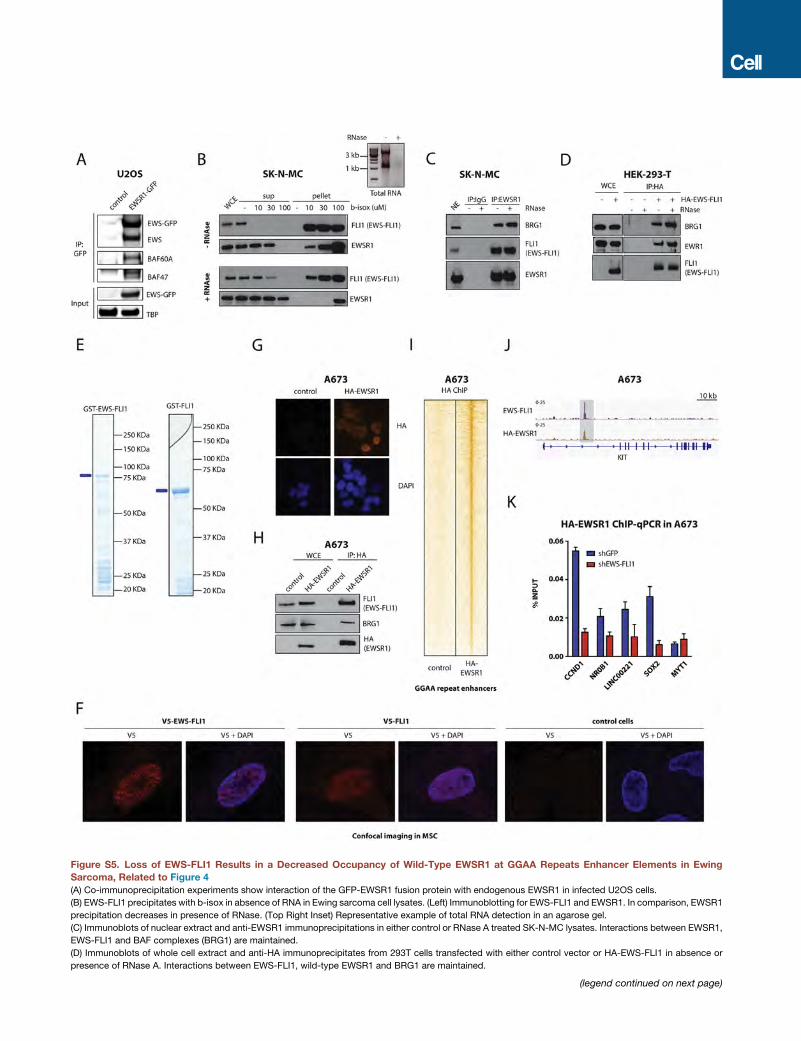
Figure S5. Loss of EWS-FLI1 Results in a Decreased Occupancy of Wild-Type EWSR1 at GGAA Repeats Enhancer Elements in Ewing
Sarcoma, Related to Figure 4
(A) Co-immunoprecipitation experiments show interaction of the GFP-EWSR1 fusion protein with endogenous EWSR1 in infected U2OS cells.
(B) EWS-FLI1 precipitates with b-isox in absence of RNA in Ewing sarcoma cell lysates. (Left) Immunoblotting for EWS-FLI1 and EWSR1. In comparison, EWSR1
precipitation decreases in presence of RNase. (Top Right Inset) Representative example of total RNA detection in an agarose gel.
(C) Immunoblots of nuclear extract and anti-EWSR1 immunoprecipitations in either control or RNase A treated SK-N-MC lysates. Interactions between EWSR1,
EWS-FLI1 and BAF complexes (BRG1) are maintained.
(D) Immunoblots of whole cell extract and anti-HA immunoprecipitates from 293T cells transfected with either control vector or HA-EWS-FLI1 in absence or
presence of RNase A. Interactions between EWS-FLI1, wild-type EWSR1 and BRG1 are maintained.
(legend continued on next page)

(E) SDS-PAGE of purified recombinant GST-EWS-FLI1 and GST-FLI1 stained with Coomassie blue. Full-length proteins are indicated by a blue line. Degradation
products are visible under the full-length purified proteins.
(F) Confocal imaging of immunofluorescence using anti-V5 antibody shows a dotted pattern for V5-EWS-FLI1 and amore diffuse pattern for V5-FLI1 inMSC cells.
Nuclei are counterstained with DAPI.
(G) Immunofluorescence using anti-HA antibody in A673 cells shows nuclear localization of HA-EWSR1. Nuclei are counterstained with DAPI.
(H) Immunoblots of total cell extract and anti-HA immunoprecipitations in A673 cells infected with either control vector or HA-EWSR1. EWSR1 interacts with
endogenous EWS-FLI1 and BAF complexes (BRG1).
(I) Heatmaps of HA ChIP-seq signal densities in A673 cells infected with either control vector or HA-EWSR1. 10 kb windows in each panel are centered on EWS-
FLI1- bound GGAA repeat enhancer sites (N = 812).
(J) Additional Representative example of EWS-FLI1 and HA-EWSR1 co-occupancy at a GGAA repeat enhancer associated with KIT in A673 cells infected with
HA-EWSR1 in the experiments shown in Figures 4H and 4I. The region of interest is shown in light gray.
(K) ChIP-qPCR experiments show decreased occupancy of HA-EWSR1 at GGAA repeats upon EWS-FLI1 knockdown in A673 cells infected with HA-EWSR1.
CCND1, NR0B1, LINC00221 and SOX2 are GGAA repeat microsatellites activated by EWS-FLI1 in Ewing sarcoma and MYT1 is a negative control region. Error
bars indicate SD of three technical replicates and represent at least two independent biological experiments.
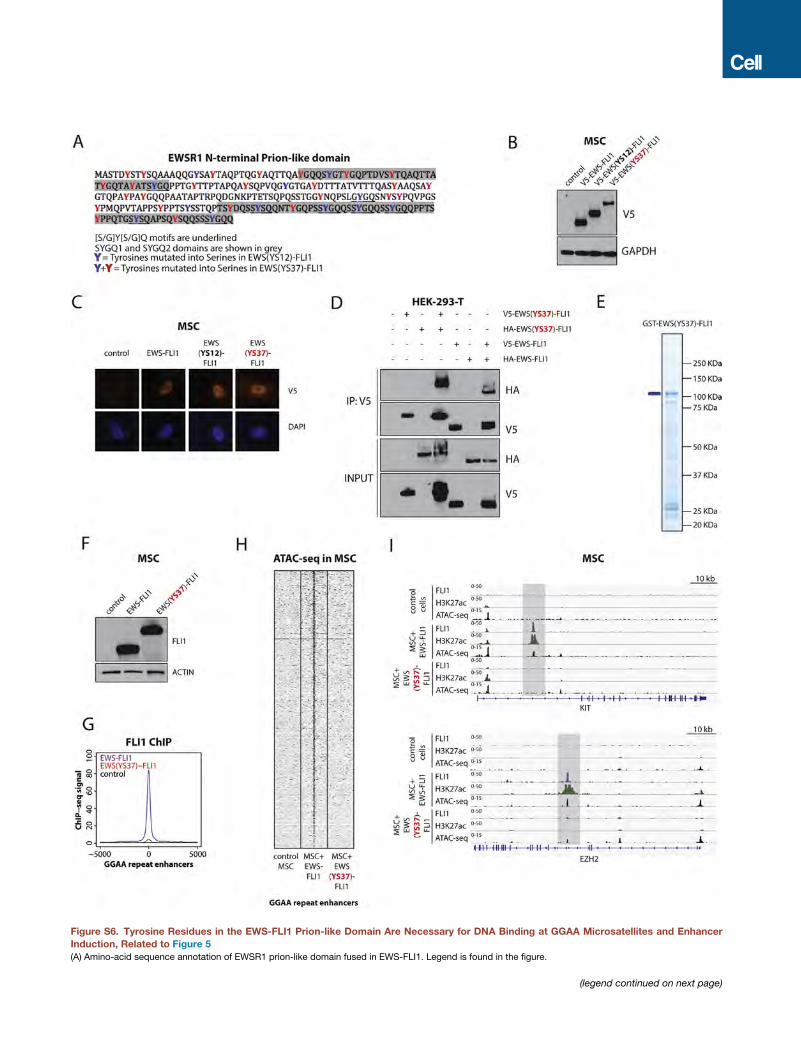
Figure S6. Tyrosine Residues in the EWS-FLI1 Prion-like Domain Are Necessary for DNA Binding at GGAA Microsatellites and Enhancer
Induction, Related to Figure 5
(A) Amino-acid sequence annotation of EWSR1 prion-like domain fused in EWS-FLI1. Legend is found in the figure.
(legend continued on next page)

(B) Immunoblotting shows lentiviral expression of EWS-FLI1, EWS(YS12)-FLI1 or EWS(YS37)-FLI1 mutants in mesenchymal stem cells used in the experiments
shown in Figure 5G.
(C) Immunofluorescence staining using FLI1 antibodies in infected MSC shows the nuclear localization of EWS-FLI1, EWS(YS12)-FLI1 or EWS(YS37)-FLI1
mutants. Nuclei are counterstained with DAPI.
(D) EWS(YS37)-FLI1 mutant protein can homodimerize as strongly as its wild-type counterpart. Co-immunoprecipitation experiments using anti-V5 antibodies in
transiently transfected HEK293-T cells co-expressing HA-tagged and V5-tagged wild-type or mutant EWS-FLI1 proteins.
(E) SDS-PAGE of purified recombinant GST-EWS(YS37)-FLI1 stained with Coomassie blue. Full-length proteins are indicated by a blue line. Degradation
products are visible under the full-length purified proteins.
(F) Immunoblotting shows lentiviral expression of EWS-FLI1 and EWS(YS37)-FLI1 mutant protein in mesenchymal stem cells used in the experiments shown in
Figures 5D–5F.
(G) Composite plot shows FLI1 ChIP-seq signals at GGAA repeat enhancer elements in control MSCs and MSCs expressing EWS-FLI1 or EWS(YS37)-FLI1
mutant protein. The x axis represents a 10 kb window centered on EWS-FLI1-bound GGAA repeat enhancer sites. EWS(YS37)-FLI1 is not able to stably bind at
these sites compared to EWS-FLI1.
(H) Heatmap shows ATAC-seq signal densities in MSCs infected with either control vector, EWS-FLI1 or EWS(YS37)-FLI1 mutant protein. 10 kb windows in each
panel are centered on EWS-FLI1-bound GGAA repeat enhancer sites (N = 812). EWS(YS37)-FLI1 mutant does not induce increased accessibility at GGAA repeat
enhancers.
(I) Additional representative examples of ChIP-seq tracks for FLI1 (EWS-FLI1), H3K27Ac, and ATAC-seq signals over GGAA repeats associated genes in MSCs
expressing either control, EWS-FLI1, or EWS(YS37)-FLI1 mutant in the experiments shown in Figures 5D–5F. The regions of interest are shown in light gray.
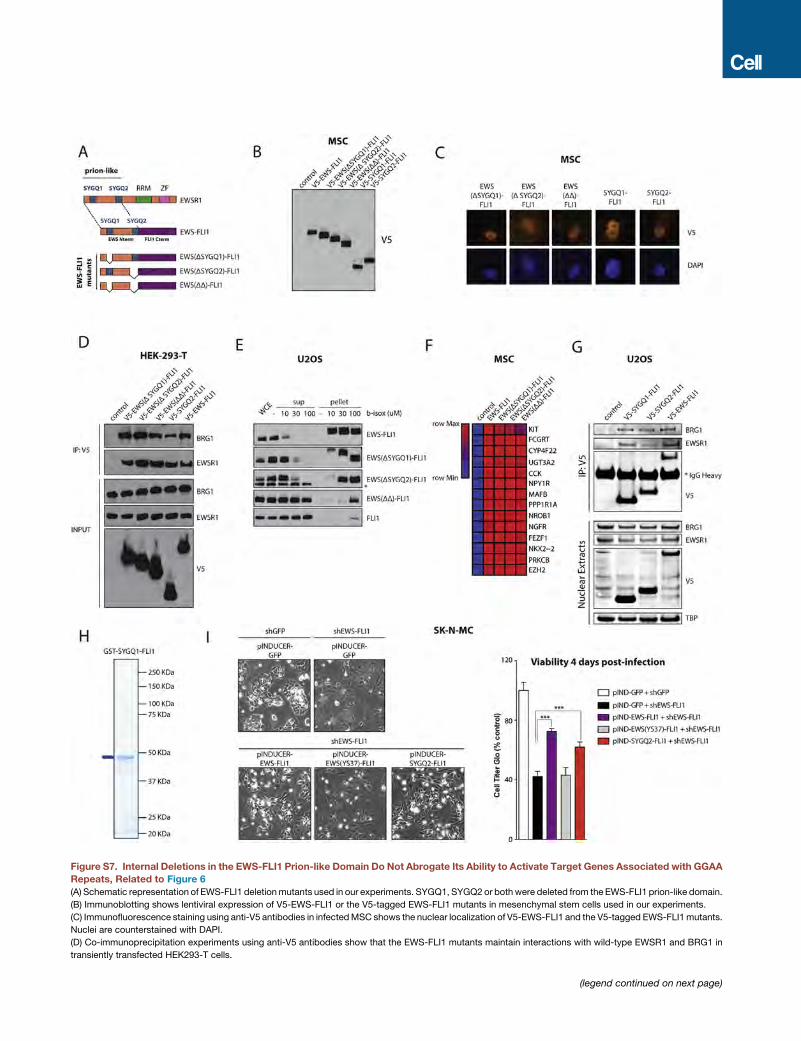
Figure S7. Internal Deletions in the EWS-FLI1 Prion-like Domain Do Not Abrogate Its Ability to Activate Target Genes Associated with GGAA
Repeats, Related to Figure 6
(A) Schematic representation of EWS-FLI1 deletionmutants used in our experiments. SYGQ1, SYGQ2 or both were deleted from the EWS-FLI1 prion-like domain.
(B) Immunoblotting shows lentiviral expression of V5-EWS-FLI1 or the V5-tagged EWS-FLI1 mutants in mesenchymal stem cells used in our experiments.
(C) Immunofluorescence staining using anti-V5 antibodies in infectedMSC shows the nuclear localization of V5-EWS-FLI1 and the V5-tagged EWS-FLI1mutants.
Nuclei are counterstained with DAPI.
(D) Co-immunoprecipitation experiments using anti-V5 antibodies show that the EWS-FLI1 mutants maintain interactions with wild-type EWSR1 and BRG1 in
transiently transfected HEK293-T cells.
(legend continued on next page)

(E) EWS-FLI1 prion-like deletion mutants maintain a significant ability to precipitate in vitro. Dose dependent precipitation assay in presence of b-isox in infected
U2OS cell lysates. * Indicates endogenous wild-type FLI1 in U2OS, which does not precipitate in these conditions.
(F) Heatmap shows changes in expression detected by RT-qPCR for selected EWS-FLI1 target genes associated with GGAA repeats after infection of MSCswith
either control vector, EWS-FLI1, or EWS-FLI1 prion-like deletion mutants. All three mutants induce the EWS-FLI1 target gene signature.
(G) (Top) Co-immunoprecipitation experiments using anti-V5 antibodies show that the EWS-FLI1 mutants SYGQ1-FLI1 and SYGQ2-FLI1 maintain interactions
with wild-type EWSR1 and BRG1. (Bottom) Immunoblots show nuclear input levels of EWSR1, BRG1 and the lentiviral expression of V5-tagged SYGQ1-FLI1,
SYGQ2-FLI1 or EWS-FLI1 in U2OS nuclear extracts.
(H) SDS-PAGE of purified recombinant GST-SYGQ1-FLI1 stained with Coomassie blue. Full-length proteins are indicated by a blue line. Degradation products
are visible under the full-length purified proteins.
(I) Rescue experiments with EWS-FLI1 mutant proteins. (Left) Representative cell images and (Right) Cell viability assays (Cell-titer Glo) in SK-N-MC cells treated
with either shGFP or shEWS-FLI1 knockdown and induced to express GFP, full size EWS-FLI1, EWS(YS37)-FLI1 mutant or the SYGQ2-FLI1 fusion protein.
SKNMC cells were infected with inducible pINDUCER lentiviral constructs for GFP, full size EWS-FLI1, EWS(YS37)-FLI1 mutant or the SYGQ2-FLI1 fusion protein
and selected with neomycin. This was followed by lentiviral infection with either shGFP or shEWS-FLI1 knockdown and induction of pINDUCER expression with
5 ng/mL doxycycline. *** Indicates p value < 0.001. Error bars indicate SD of three technical replicates and represent at least two independent biological
experiments.