Embed Size (px)
Citation preview

1
Cancer Science
Type III interferon enhances the direct antitumor activity of type I interferon
Hitomi Fujie1, Toshiaki Tanaka2, Masatoshi Tagawa3, Takashi Suzuki4,
Naomi Kitamura2 and Muneo Numasaki 1,5
1Department of Nutrition Physiology, Faculty of Pharmaceutical Sciences, Josai University,
1-1 Keyakidai, Sakado, 350-0295, Japan
2Cellular and Developmental Biology, Department of Biological Sciences, Graduate School of
Bioscience and Biotechnology, Tokyo Institute of Technology, 4259 Nagatsuta-cho,
Midori-ku, Yokohama 226-8501, Japan
3Division of Pathology and Cell Therapy, Chiba Cancer Center Research Institute, 666-2
Nitona, Chuo-ku, Chiba 260-8717, Japan
4Department of Anatomic Pathology, Tohoku University School of Medicine, 1-1
Seiryo-machi, Aoba-ku, Sendai 980-8574, Japan
5Correspondence to: Muneo Numasaki, M.D., Ph.D., Department of Nutrition Physiology,
Faculty of Pharmaceutical Sciences, Josai University, 1-1 Keyakidai, Sakado 350-0295,
Japan.
Tel: 81-49-271-8087; Fax: 81-49-271-7984; E-mail: [email protected]
Total word count: 4000
The number of Figure is 10. The number of Table is 1.
2
Summary
The antitumor activities of type III interferon (IFN) (interleukin (IL)-28 and IL-29) and the
combination between type III IFN and type I IFN (IFN-α) were evaluated in in vitro and in
vivo studies using human non-small cell lung cancer (NSCLC). The expression of IL-28
receptor (IL-28R) and IL-10Rß was detected in NSCLC lines. IL-29 significantly inhibited
the in vitro growth of a wide range of NSCLC lines in a dose-dependent fashion. To a lesser
degree, IL-28A also displayed the growth inhibitory activity. Cell cycle analysis revealed that
IL-29 induced cell cycle arrest at the G1 phase and no significant apoptotic cell death. IL-29
up-regulated cyclin-dependent kinase inhibitor p21Waf1/Cip1 in IL-29-sensitive, but not in
IL-29-insensitive cells, and knockdown of p21 with small interfering RNA largely attenuated
the antiproliferative effect. Intratumoral and systemic administration of IL-29 inhibited
NSCLC tumor growth in SCID mice in a dose-dependent manner. Immunohistochemical
analyses demonstrated a marked up-regulated p21 expression in NSCLC tumors treated with
IL-29. Furthermore, the cytokine combination between IL-29 and IFN-α displayed a more
powerful antiproliferative effect in vitro, and a more increased p21 expression than each
reagent alone. Additionally, the cytokine combination therapy suppressed the in vivo NSCLC
growth more effectively than each reagent alone. These findings demonstrate that type III IFN
can enhance type I IFN-mediated antitumor activities, and suggest the possibility that type III
IFN may improve the efficacy and reduce the side effects of type I IFN therapy of cancer.
3
Introduction
IL-28 and IL-29, designated as type III IFN, are recently identified class II cytokine
receptor ligands that are distantly related to members of the IL-10 family and the type I IFN
family (1-3). The type III IFN expression is induced by virus infection or double-stranded
RNA (1-3). Type III IFN signals through the same heterodimeric receptor complex that is
composed of the IL-10Rß and a novel IL-28R (1-3). Type III IFN signaling induces many
genes that are induced by signaling through IFN-α/ß receptors (1-3). These include genes
such as myxovirus resistance-A (MxA), OAS1, a double-stranded RNA-dependent protein
kinase R (PKR) and ADAR, which mediate at least some of the antiviral and antiproliferative
activities of type I IFN (1-3).
IFNs are a large family of protein having a wide variety of biological properties (4).
These include the inhibition of cell growth, activation of T cell and NK cell cytotoxicity,
up-regulation of MHC class I molecules, promotion of T helper type I responses and
inhibition of angiogenesis (5). Especially, IFN-α delivered either by recombinant protein or
by viral or plasmid vectors has been displayed to have potent antitumor effects in mouse
tumor models (5). To date, IFN-α has been approved for treatment of patients with renal cell
carcinoma, metastatic melanoma, and chronic myelogeneous leukemia (6).
Type III IFN exerts bioactivities that overlap those of type I IFN (1-3). Similar to type I
IFN, type III IFN has also been demonstrated to elicit antitumor activity (7-14). Nevertheless,
to date, the studies to evaluate the antitumor action of type III IFN have been limited to a
narrow range of pathological types of human tumors (7-10). In this study, using human
NSCLC lines, we evaluated the direct antitumor activity of type III IFN alone and the
combination between type III IFN and type I IFN in in vitro and in vivo studies.
Materials and Methods

4
Cells, mice and reagents. NSCLC lines were from Cell Resource Center for Biomedical
Research, Institute of Development, Aging and Cancer, Tohoku University. SCID mice were
from Charles River (Yokohama, Japan). IL-28A and IL-29 were from R&D Systems
(Minneapolis, MN). IFN-α was provided by Sumitomo pharmaceuticals (Tokyo, Japan).
Rabbit anti-asialo GM1 antiserum was from Wako Chemicals (Tokyo, Japan). Anti-p16 and
anti-p27 antibodies were from Calbiochem (La Jolla, CA). Anti-p21 antibody was from Santa
Cruz Biotechnology (Santa Cruz, CA).
MTT assay. MTT assay was performed as described previously (15). The percentage of cell
proliferation or reduction of cell proliferation was determined by the previously reported
formula (16,17)
Apoptosis assay. Cells were stimulated with or without cytokine or cisplatin (18) at the
indicated concentrations. To detect apoptotic cell death, a cell death detection ELISA assay kit
(Roche Applied Science, Nutley, NJ) was used. Results for the negative control were set to 10,
and all other measurements were normalized to the control (19). To identify cell death at an
earlier stage, the Annexin V-PE apoptosis detection kit (BD Pharmingen, San Diego, CA) was
used. Apoptotic cell death was analyzed on a FACScan (BD Biosciences, San Jose, CA).
Reverse transcriptase polymerase chain reaction (RT-PCR). Total RNA was extracted
using RNA Bee (TEL-TEST, Friendswood, TX), and used as template for one-step RT-PCR
with the Superscript One-Step RT-PCR with a Platinum Taq kit (Invitrogen Corp., Carlsbad,
CA, USA). The expression of OAS1, PKR, and ADAR was determined with quantitative
RT-PCR using TaqMan Gene Expression Assays (Applied Biosystems, CA). Simultaneously,
mRNA expression for GAPDH was determined using Pre-Developed TaqMan Assay
5
Reagents for GAPDH. Real-time RT-PCR application was carried out using a TaqMan
One-Step RT-PCR Master Mix Reagents Kit (Applied Biosystems). The expression levels of
OAS1, PKR, and ADAR were normalized to GAPDH.
Cell cycle analysis. Cell cycle analysis was performed as described previously (20). In brief,
cells were washed with PBS, suspended in a propidium iodide (PI) solution and then
incubated for 30 min. Cell cycle distribution was determined by FACScan analysis.
Western blot analysis. Total cellular extracts were prepared using Cell Lysis Buffer (Cell
Signaling Technology, Beverly, MA). After electrophoresis, proteins were electrotransferred
onto polyvinylidene difluoride membranes (Millipore, Billerica, MA). Membranes were
incubated with respective antibodies, and then with horseradish peroxidase-conjugated
secondary antibodies (Amersham, Arlington Heights, IL). The immunoreactive proteins were
visualized with the ECL Plus chemiluminescence system (Amersham). The intensity of bands
was analyzed using an image analysis software MultiGauge (Fujifilm, Tokyo, Japan).
RNA interference. Knockdown of p21 through the delivery of double stranded RNA
molecules into the cells was performed using SignalSilence p21Waf1/Cip1 siRNA Kit (Cell
Signaling Technology). The cells transfected with a p21-specific double stranded small
inhibitory RNA (siRNA) oligonucleotide or with a negative control oligonucleotide were
treated with or without IL-29 for the indicated time period.
Evaluation of in vivo tumor growth. To deplete NK cells in SCID mice, anti-asialo GM1
antiserum (Wako Chemicals) was administered 1 day prior to the tumor inoculation, and
subsequently once every 5 days. Mice were inoculated subcutaneously with cells into the right
flank. Tumor volume was calculated by using the formula ab2/2 (a = largest diameter; b =

6
smallest diameter) (21). For intratumoral therapy, cytokine(s) or PBS was injected into tumors
(120-170 mm3) for consecutive 21 days. For systemic therapy, IL-29 or PBS was
administered subcutaneously at the contralateral site to the tumor (80-100 mm3) for
consecutive 15 days.
Immunohistological examination. Immunostaining for Factor VIII related antigen was
performed as described previously (21). For p21 immunostaining, sections were autoclaved
and incubated with anti-p21 antibody. Immunohistochemistry was performed using a
Histofine Simple Stain kit (Nichirei, Tokyo, Japan). Cells exhibiting distinct nuclear staining
were considered positive for p21, and the percentages of positive-staining cells were
determined.
Statistical analyses. Statistical analysis was performed using an unpaired two-tailed Student’s
t-test with a confirmation by parametric and F-tests. Differences were considered to be
statistically significant when the P value was less than 0.05.
Results.
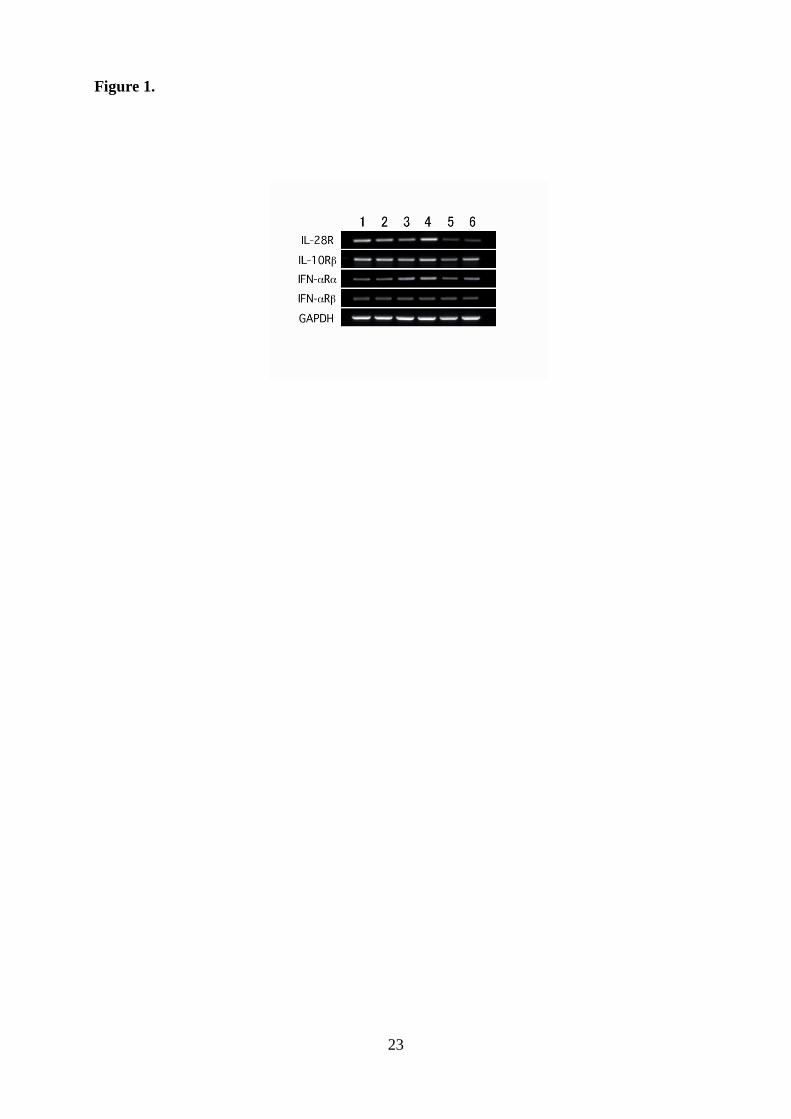
Type III IFN elicits direct antitumor activity. We first examined the expression of the
receptor subunits for type III IFN in NSCLC lines by RT-PCR. The transcripts for IL-28R and
IL-10Rß, which compose of the functional heterodimeric receptor complex for type III IFN,
were expressed (Fig. 1). The expression of mRNA for IFN-αR1 and IFN-αR2 was also
detected (Fig. 1). We next evaluated the growth inhibitory activity of type III IFN with MTT
assay. IL-29 displayed the growth inhibitory activity against a wide range of NSCLC lines in
a dose-response manner (Fig. 2, a-b and Table 1). To a lesser degree, IL-28A also showed the
antiproliferative effect (Fig. 2, a-b).

7
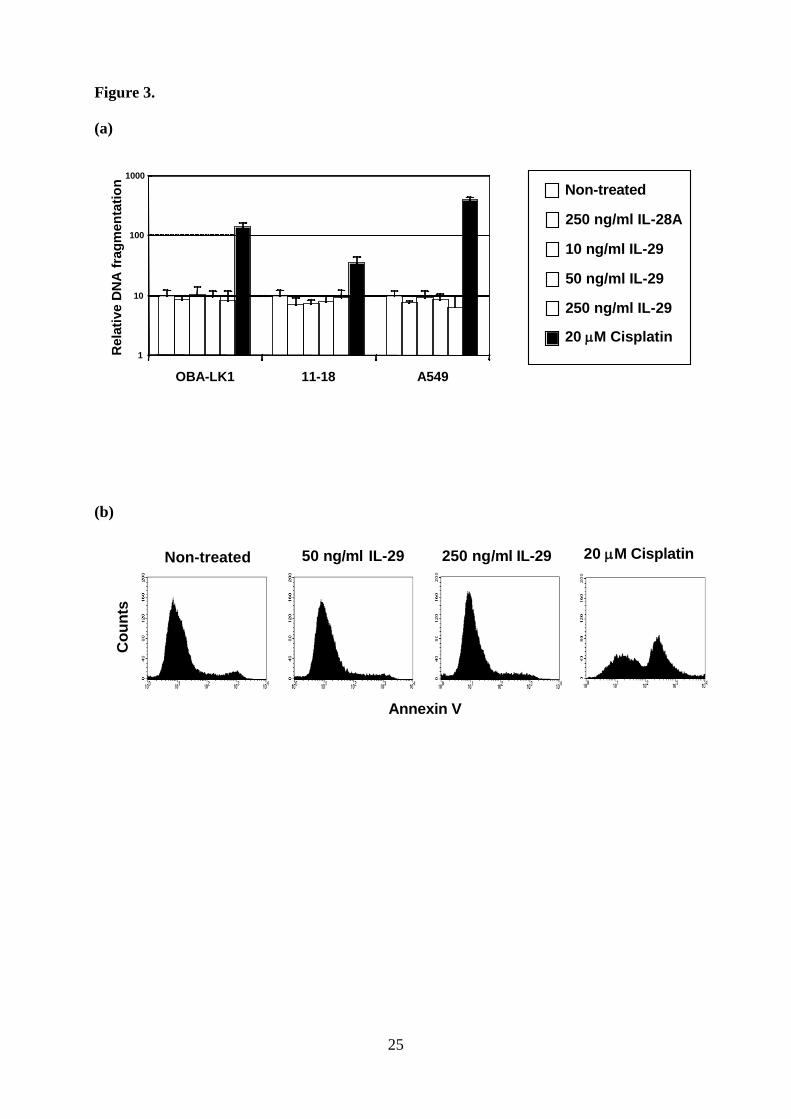
Type III IFN does not induce the apoptotic cell death. To understand the underlying
mechanisms of antitumor effect, we first evaluated the apoptotic cell death. No apoptotic
DNA fragmentation in IL-29-treated cells was observed, whereas cisplatin induced a
significant increase of DNA fragmentation in all cell types (Fig. 3a). Treatment with high
concentration of IL-28A (Fig. 3a) or IL-29 for 48 hours (data not shown) did not induce the
apoptotic DNA fragmentation. Moreover, we investigated the early apoptotic cell death using
Annexin V assay by flow cytometry. Cells treated with cisplatin showed increased cell death,
but IL-29 treatment did not increase the Annexin V-positive cells.
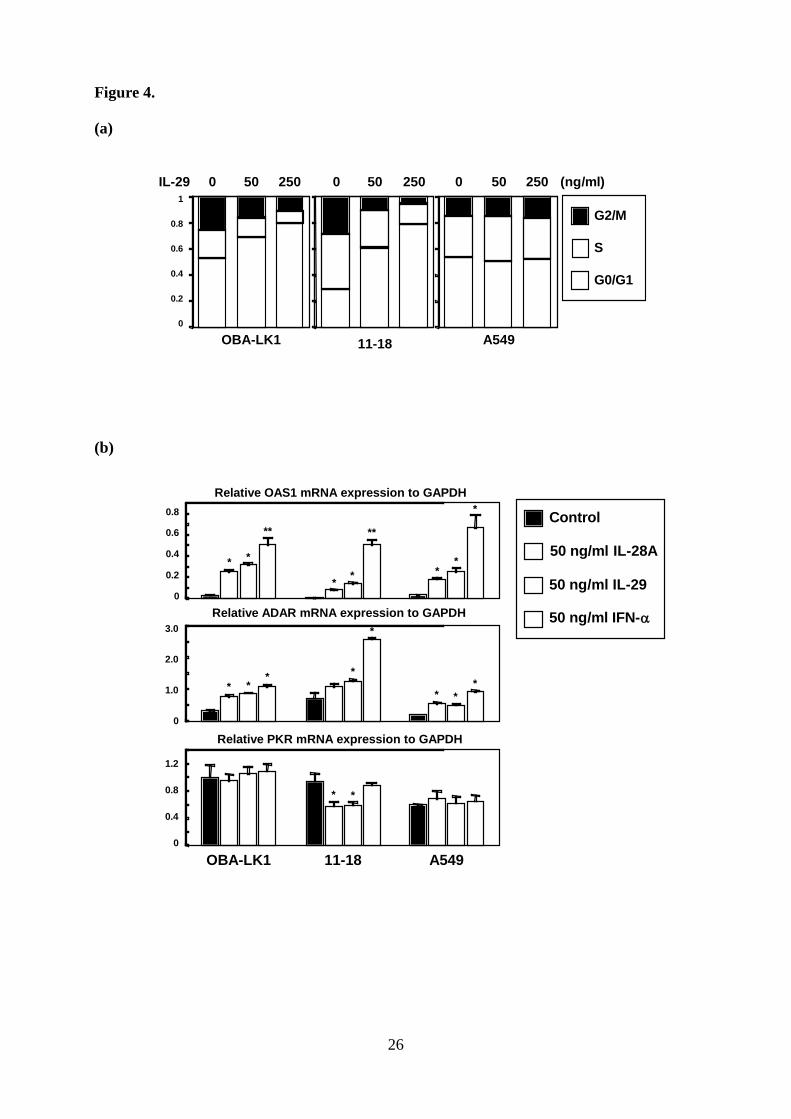
Type III IFN induces cell cycle arrest at the G1 phase. We next investigated the effect of
IL-29 on cell cycle distribution. Cell cycle distribution analysis showed that IL-29 resulted in
accumulation of cell numbers in G1 phase in a dose-dependent manner (Fig. 4a). OBA-LK1
cells treated with 50 ng/ml or 250 ng/ml of IL-29 increased the G1 population from 53% to
69% or 80%, and the identical treatment of 11-18 cells increased the G1 population from 30%
to 61% or 79%, respectively. This increase of G1 population is accompanied by reduction of S
and G2 populations (Fig. 4a).
Type III IFN up-regulates a cyclin-dependent kinase inhibitor p21Waf1/Cip1. To assess
the mechanism of the cell cycle arrest induced by type III IFN, we first examined the OAS1,
PKR, and ADAR expression levels (22-25). A quantitative RT-PCR analysis showed that
IL-29 as well as IFN-α up-regulated the expression of OAS1 and ADAR (Fig 4b). These
molecules were also up-regulated in A549 cells, which growth was little suppressed with type
III IFN. Furthermore, the transcript of PKR was not influenced by any cytokines. These
findings strongly suggested that some other molecules were mainly accountable for the
antiproliferative effect of type III IFN.
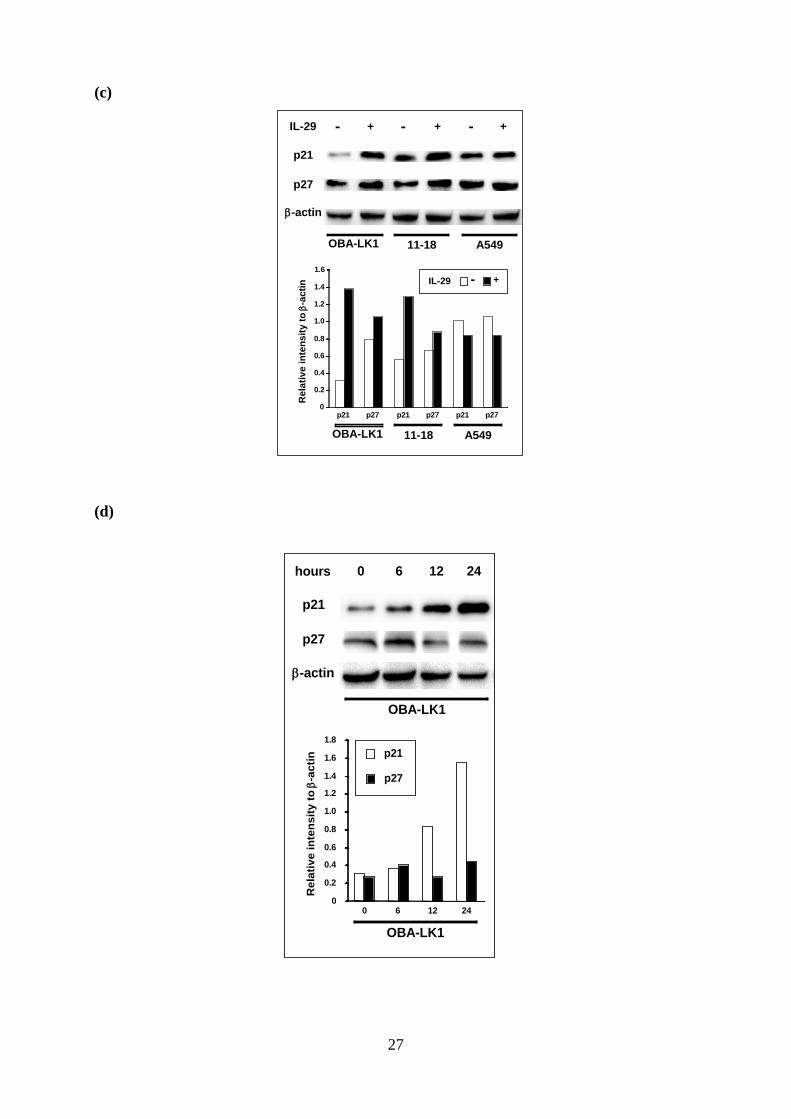
We next focused on the cyclin-dependent kinase inhibitors including p16Ink4a,

8
p21Waf1/Cip1 and p27Kip1, which are involved in cell cycle arrest at the G1 phase. Western
blot analyses showed that p21 and p27 were detected in NSCLC cells, and IL-29 led to a
significant increase of p21 in OBA-LK1 and 11-18, but not in A549 (Fig 4c). The p21
expression in OBA-LK1 increased time-dependently in response to IL-29 (Fig 4d). On the
other hand, the p27 expression was not influenced (Fig 4c). In addition, p16 was not
up-regulated by IL-29 (data not shown).
Up-regulation of p21Waf1/Cip1 is required for the antiproliferative effect of type III
IFN. To examine whether the observed p21 up-regulation is essential for the antiproliferative
effect, we performed siRNA-mediated p21 knockdown. Western blot analysis revealed that
introduction of the p21-siRNA (26) efficiently reduced the p21 expression for 48 hours after
IL-29 treatment (Fig. 5a). The antiproliferative effect was largely alleviated in p21-siRNA
transfected cells compared to non-transfected cells (Fig. 5b). Introduction of the
control-siRNA did not affect the antiproliferative effect (Fig. 5), confirming that this
alleviation of the antiproliferative effect depended on the p21-specifc siRNA and was not the
result of any cell damage by transfection or by introduction of siRNA itself.
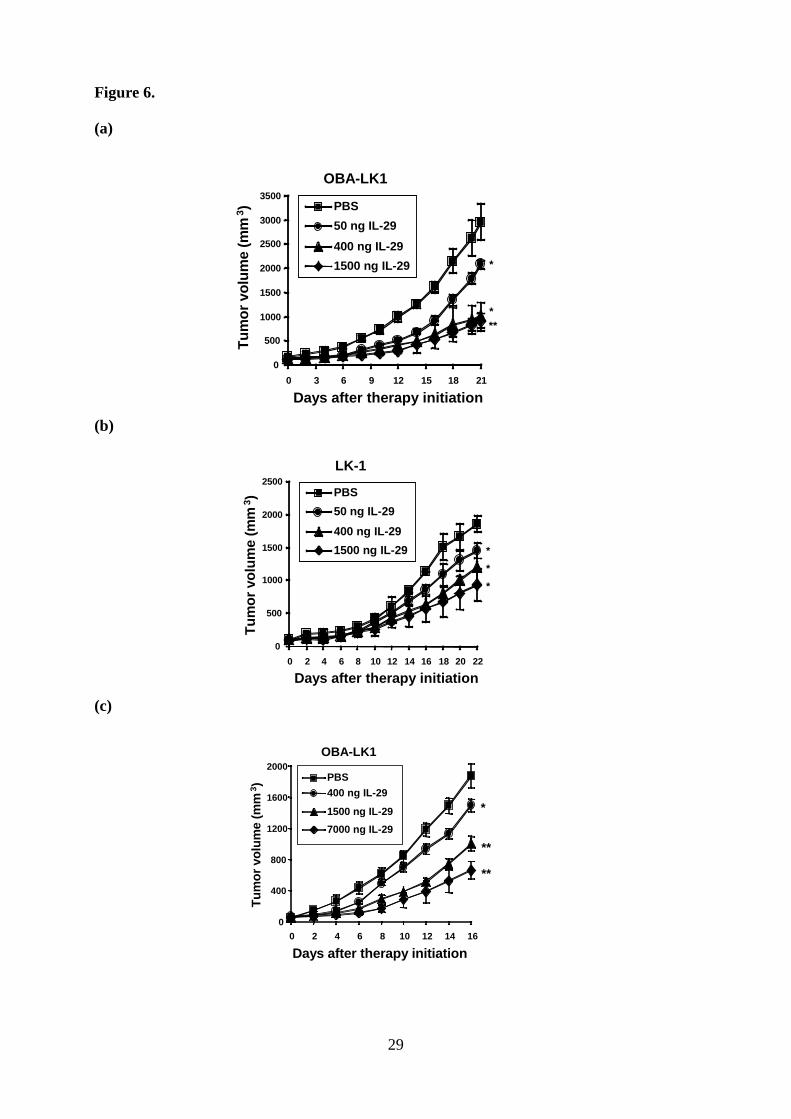
Type III IFN suppresses the in vivo tumor growth. To examine the antitumor activities of
type III IFN in vivo, mice were implanted with NSCLC cells. Animals, which had developed
palpable tumor nodules, were treated with daily intratumoral injections of various doses of
IL-29. Mice treated with IL-29 displayed a significant reduction in tumor volume in a
dose-dependent manner compared with mice treated with PBS (Fig. 6, a and b). Three weeks
after treatment initiation, mice administered with 0.05, 0.4 or 1.5 µg of IL-29 showed a 30, 66
or 69% reduction in OBA-LK1 tumor volume (Fig. 6a), and a 22, 35 or 50% reduction in
LK-1 tumor volume compared with controls (Fig. 6b). In addition, systemic treatment at a
dose of 0.4, 1.5 or 7 µg per mouse per day resulted in a 20, 47 or 65% reduction in tumor
9
volume compared with controls (Fig. 6c). Moreover, in both strategies, type III IFN treatment
did not appear to cause significant adverse reactions.
To assess the mechanism of the in vivo antitumor effect, we performed histological and
immunohistochemical examination. There was little difference between IL-29-treated tumors
and controls in terms of cellularity and presence of stroma (Fig. 7). Immunohistochemical
staining for vascular endothelial cells to probe the possible contribution of the inhibition of
angiogenesis to the observed growth suppression of tumors revealed that IL-29 did not affect
the tumor vascularity (Fig. 7). On the contrary, p21 accumulated more in the tumors treated
with IL-29 than the tumors treated with PBS (Fig. 7). The percentage of p21 positive-staining
cells in the tumors treated with 7 µg of daily systemic therapy was significantly higher than
that in the tumors treated with PBS (27.8 ± 3.0 % versus 18.3 ± 5.4 %, p < 0.03).
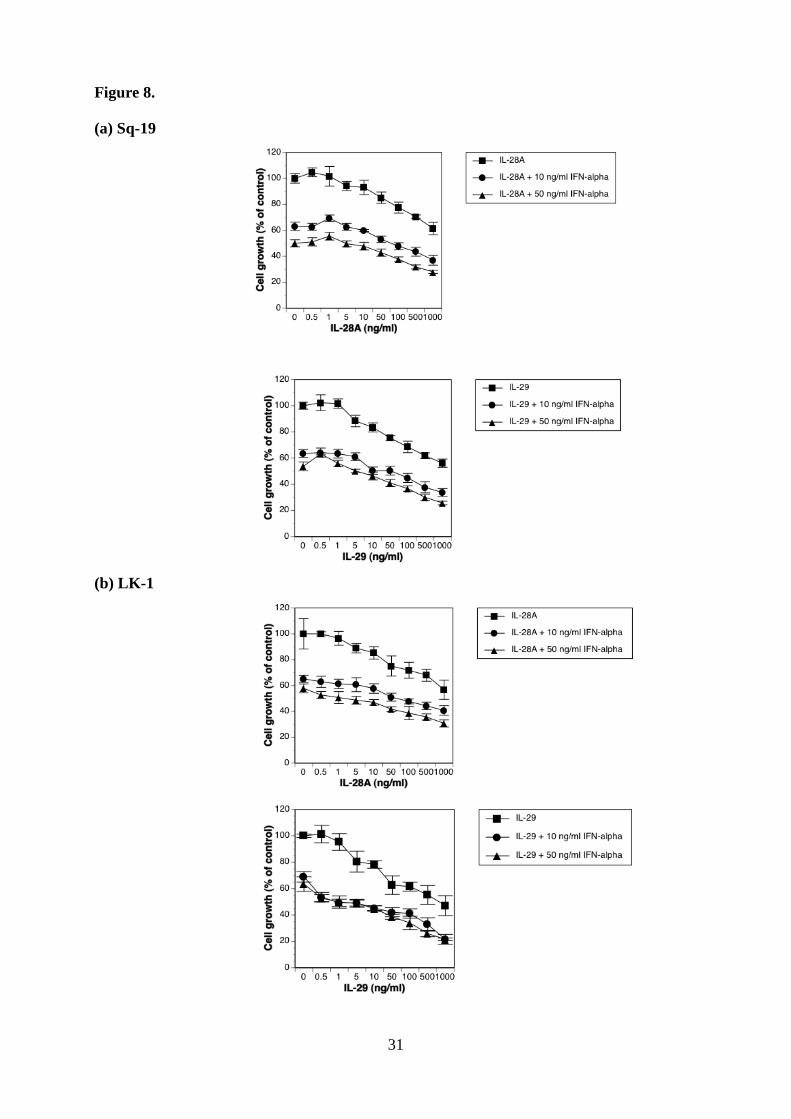
Cytokine combination elicits more potent antitumor effect than each reagent alone.
Since type III IFN signals through the heterodimeric receptor complex, which is quite
different from IFN-αR complex, we compared the growth inhibitory activity of increasing
doses of type III IFN alone to the inhibitory action of increasing doses of type III IFN in
combination with 10 ng/ml and/or 50 ng/ml of IFN-α. The cytokine combination showed a
more powerful antiproliferative effect over the whole IFN-α concentration range tested (Fig.
8, a-d and Table 1).
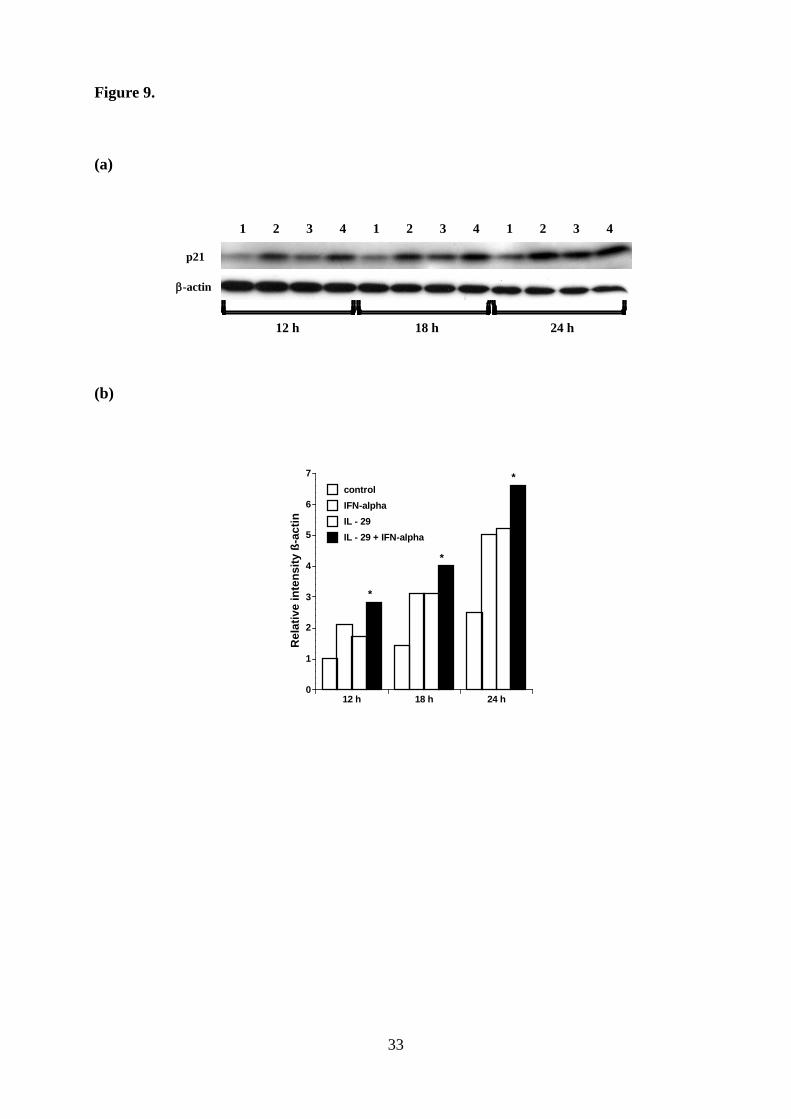
Cytokine combination up-regulates p21 expression more efficiently and suppresses the
in vivo tumor growth more effectively. Type III IFN enhanced the direct antitumor effect of
IFN-α in vitro. Therefore, we evaluated the effect of cytokine combination on p21 expression,
and found that treatment with the combination between IL-29 and TNF-α enhanced p21
expression more efficiently than each reagent alone (Fig. 9). This characteristic biological

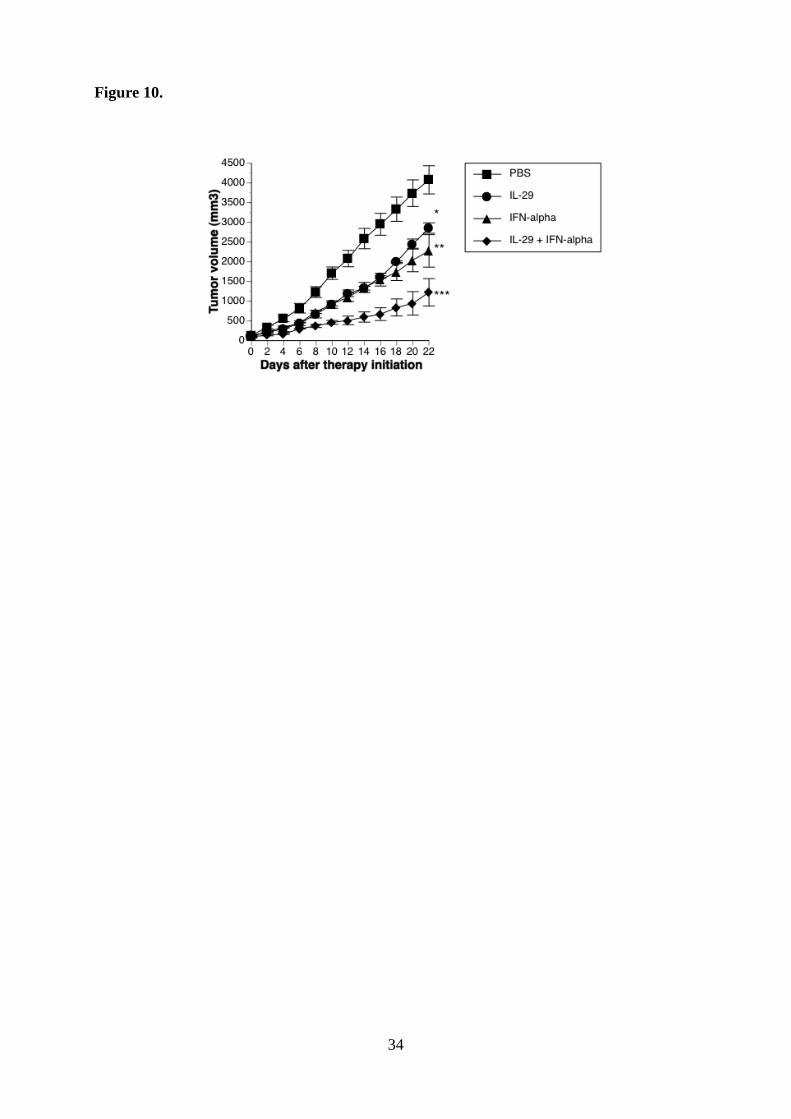
10
function of type III IFN prompted us to further investigate the in vivo biological effect of this
cytokine combination. OBA-LK1 tumors transplanted into SCID mice was treated with IL-29,
IFN-α or a combination. All treatments resulted in significant retarded tumor growth kinetics,
whereas the greatest antitumor activity was obtained with the cytokine combination therapy
(Fig. 10).
Discussion
IFNs have direct antitumor activities including induction of cell death via apoptosis and
antiproliferative effect on tumor cells. To date, type I IFN has been applied for the treatment
of the patients with myelogenous leukemias, multiple myeloma, lymphomas, renal cell
carcinoma, and metastatic melanoma. Newly identified antiviral cytokines IL-28 and IL-29
are considered to belong to the IFN family and designed as type III IFN. In addition to its
primarily reported antiviral activity, type III IFN has been shown to have direct antitumor
actions against a few human tumor lines including glioblastoma line (7), colon cancer line (8),
neuroendocrine cancer line (9) and esophageal carcinoma lines (10). Nevertheless, to date, the
efficacy and the precise molecular mechanisms of antitumor activities of type III IFN have
not been fully elucidated. We therefore investigated the antitumor actions of type III IFN
using NSCLC lines. Our findings indicated that type III IFN has a direct antitumor effect on a
broad range of NSCLC lines, and that type III IFN has a unique biological feature to enhance
the antitumor action of IFN-α. Our findings give rise to the possibility that type III IFN could
improve the therapeutic efficacy of IFN-α although we now do not have evidences that type
III IFN in combination with IFN-α can elicit an additive or a synergistic antitumor effect on
other pathological types of tumors.
In our study, no significant cell death via apoptosis was induced by type III IFN. This
finding is clear contrast with the result obtained from the studies using esophageal carcinoma
lines, in which type III IFN mediated the apoptotic cell death (10). On the other hand,
11
treatment with a sufficient concentration of IL-29 resulted in the increment of cell population
at the G1 phase. These results indicate that IL-29 mediated the growth inhibitory activity
mainly through the cell cycle arrest at the G1 phase. To investigate the underlying
mechanisms, we focused on the cyclin-dependent kinase inhibitors such as p16, p21 and p27,
all of which have the possibility to be responsible for the cell cycle G1 arrest, and found that
IL-29 significantly up-regulated p21 expression in IL-29-sensitive, but not in
IL-29-insensitive cells. Moreover, the antiproliferative effect of IL-29 was largely alleviated
by knockdown of p21 expression using siRNA specific for p21, indicating that the p21
up-regulation is crucial to the antiproliferative effect of IL-29 on NSCLC. These results may
be in line with the previously reported findings that the increased p21 expression is
responsible for cell cycle G1 arrest in many kinds of cells (27-29), and p21 overexpression in
cells resulted in growth inhibition and G1 arrest (30-32).
For the in vivo studies, SCID mice were inoculated with NSCLC cells. Daily treatment
with intratumoral injection of IL-29 resulted in a significant reduction of tumor growth in a
dose-dependent manner. In LK-1 tumor model, IL-29 resulted in moderate antitumor effect
compared to the result obtained from OBA-LK1 tumor model. Furthermore, systemic
administration of IL-29 into mice with OBA-LK1 tumor resulted in significantly reduced
tumor growth and enhanced p21 expression in xenogeneic tumors. In clear contrast to type I
IFN (33), IL-29 did not inhibit the tumor angiogenesis. SCID mice treated with anti-asialo
GM1 antiserum lack functional T cells, B cells and NK cells. Therefore, the growth inhibition
in xenogeneic NSCLC tumor models is most likely due to a direct antitumor action of IL-29.
These findings totally support the notion that the p21 up-regulation plays a major role in the
in vivo antitumor action of IL-29. Actually, p21 expression in NSCLC tumors has been
reported to be a predictor for favorable prognosis (34-36). It is important that the circulating
IL-29 has a therapeutic application to human tumors because this type of treatment can be
beneficial for patients with tumors that are difficult to access or with distant metastases.
Type III IFN displayed the biological property to augment the growth inhibitory effect of

12
IFN-α in vitro, and the combination between IL-29 and TNF-α up-regulated p21 expression
more efficiently than each reagent alone. Therefore, we further evaluated the efficacy of
cytokine combination therapy in vivo. The combination between IL-29 and IFN-α was more
effective in inhibiting tumor growth than was either reagent alone. Although antitumor
activity of type III IFN against various pathological types of tumors has not been fully
evaluated, our findings raise the possibility that the cytokine combination therapy may not
only surpass the therapeutic outcomes of IFN-α monotherapy but also reduce the side effects
by decreasing the daily dose of IFN-α.
In conclusion, type III IFN can elicit direct antitumor effect on NSCLC in vitro and in
vivo mainly through p21Waf1/Cip1 up-regulation. Type III IFN can also enhance the
antitumor action of type I IFN. Considering that type III IFN has immunoregulatory activities,
the application of type III IFN or cytokine combination therapy to immunocompetent cancer
patients may possibly result in greater therapeutic effects.
Acknowledgments
We thank Miss Toshie Suzuki for her excellent technical assistance.

13
References
1. Vilcek J. Novel interferons. Nat Immunol 2003; 4: 8-9.
2. Sheppard P, Kindsvogel W, Xu W, et al. IL-28, IL-29 and their class II cytokine receptor
IL-28R. Nat Immunol 2003; 4: 63-8.
3. Kotenko SV, Gallagher G, Baurin VV, at al. IFN-lambdas mediate antiviral protection
through a distinct class II cytokine receptor complex. Nat Immunol 2003; 4: 69-7.
4. Leaman DW. Mechanism of interferon action. Prog Mol Subcell Biol 1998; 20: 101-42.
5. Pfeffer LM, Dinarello CA, Herberman RB et al. Biological properties of recombinant
alpha-interferons: 40th anniversary of the discovery of interferons. Cancer Res 1998; 58:
2489-99.
6. Weiss K. Safety profile of interferon-α therapy. Semin Oncol 1998; 25: 9-13.
7. Meager A, Visvalingam K, Dilger P, Bryan D, Wadhwa M. Biological activity of
interleukins-28 and -29: Comparison with type I interferons. Cytokine 2005; 31: 109-18.
8. Brand S, Beigel F, Olszak T et al. IL-28A and IL-29 mediate antiproliferative and antiviral
signals in intestinal epithelial cells and murine CMV infection increases colonic IL-28A
expression. Am J Physiol Gastrointest Liver Physiol 2005; 289: G960-8.
9. Zitzmann K, Brand S, Baehs S et al. Auernhammer. Novel interferon-lambdas induce

14
antiproliferative effects in neuroendocrine tumor cells. Biochem Biophys Res Commun 2006;
344: 1334-41.
10. Li Q, Kawamura K, Ma G, Iwata F, Numasaki M, Suzuki N, Shimada H, Tagawa M.
Interferon-lambda induces G1 phase arrest or apoptosis in oesophageal carcinoma cells and
produces anti-tumour effects in combination with anti-cancer agents. Eur J Cancer 2010; 46:
180-90.
11. Lasfar A, Lewis-Antes A, Smirnov SV et al. Characterization of the mouse IFN-lambda
ligand-receptor system: IFN-lambdas exhibit antitumor activity against B16 melanoma.
Cancer Res 2006; 66: 4468-77.
12. Sato A, Ohtsuki M, Hata M, Kobayashi E, Murakami T. Antitumor activity of IFN-lambda
in murine tumor models. J Immunol 2006; 176: 7686-94.
13. Numasaki M, Tagawa M, Iwata F et al. IL-28 elicits antitumor responses against murine
fibrosarcoma. J Immunol 2007; 178: 5086-98
14. Abushahba W, Balan M, Castaneda I et al. Antitumor activity of type I and type III
interferons in BNL hepatoma model. Cancer Immunol Immunother 2010; 59: 1059-71.
15. Numasaki M, Watanabe M, Suzuki T et al. IL-17 enhances the net angiogenic activity and
in vivo growth of human non-small cell lung cancer in SCID mice through promoting
CXCR-2-dependent angiogenesis. J Immunol 2005; 175: 6177-89.
15
16. Fujiwara H, Yamakuni T, Ueno M, et al. IC101 induces apoptosis by Akt
dephosphorylation via an inhibition of heat shock protein 90-ATP binding activity
accompanied by preventing the interaction with Akt in L1210 cells. J Pharmacol Exp Ther
2004; 310: 1288-95.
17. Horton HM, Hernandez P, Parker SE, Barnhart KM. Antitumor effects of
interferon-omega: in vivo therapy of human tumor xenografts in nude mice. Cancer Res 1999;
59: 4064-68.
18. Seki K, Yoshikawa H, Shiiki K, Hamada Y, Akamatsu N, Takeda K. Cisplatin (CDDP)
specifically induces apoptosis via sequential activation of caspase-8, -3 and -6 in
osteosarcoma. Cancer Chemother Pharmacol 2000; 45: 199-206.
19. Nakayama K, Pergolizzi RG, Crystal RG. Gene transfer-mediated pre-mRNA segmental
trans-splicing as a strategy to deliver intracellular toxins for cancer therapy. Cancer Res 2004;
65: 254-63.
20. Morita E, Tada K, Chisaka H, Asao H, Sato H, Yaegashi N, Sugamura K. Human
Parvovirus B19 induces cell cycle arrest at G2 phase with accumulation of mitotic cyclins. J
Virol 2001; 75: 7555–63
21. Numasaki M, Fukushi J, Ono M et al. Interleukin-17 promotes angiogenesis and tumor

16
growth. Blood 2003; 101: 2620-7.
22. Rysiecki G, Gewert DR, Williams BR. Constitutive expression of a 2',5'-oligoadenylate
synthetase cDNA results in increased antiviral activity and growth suppression. J Interferon
Res 1989; 9: 649-57.
23. Koromilas AE, Roy S, Barber GN, Katze MG, Sonenberg N. Malignant transformation by
a mutation of the IFN-inducible dsRNA-dependent protein kinase. Science 1992; 257: 1685-9.
24. Hassel BA, Zhou A, Sotomayor C, Maran A, Silverman RH. A dominant negative mutant
of 2-5A-dependent RNase suppresses antiproliferative and antiviral effects of interferon.
EMBO J 1993; 12: 3297-304.
25. Clemens MJ. PKR-α protein kinase regulated by double-stranded RNA. Int J Biochem
Cell Biol 1997; 29: 945-9.
26. Basile JR. Eichten A, Zacny V, Munger K. NF-kappa B-mediated induction of
p21(Cip1/Waf1) by tumor necrosis factor alpha induces growth arrest and cytoprotection in
norm.al human keratinocytes. Mol Cancer Res 2003; 1: 262-70.
27. Fang F, Orend G, Watanabe N, Hunter T, Ruoslahti E. Dependence of cyclin E-CDK2
kinase activity on cell anchorage. Science 1996; 271: 499-502.

17
28. Bates S, Ryan KM, Phillips AC, Vousden KH. Cell cycle arrest and DNA
endoreduplication following p21Waf1/Cip1 expression. Oncogene 1998; 17: 1691-703.
29. Tsukada Y, Tanaka T, Miyazawa K, Kitamura N. Involvment of down-regulation of Cdk2
activity in hepatocyte growth factor-induced cell cycle arrest at G1 in the human
hepatocellular carcinoma cell line HepG2. J Biochem 2004; 136: 701-9.
30. Hall MC, Li Y, Pong RC, B. Ely, A. I. Sagalowsky, J. T. Hsieh. The growth inhibitory
effect of p21 adenovirus on human bladder cancer cells. J Urol 2000; 163: 1033-8.
31. Harada K, Kurisu K, Sadatomo T et al. Growth inhibition of human glioma cells by
transfection-induced p21 and its effects on telomerase activity. J Neurooncol 2000; 47: 39-46.
32. Chen X, Zhang W, Gao YF, Su XQ, Zhai ZH. Senescence-like changes induced by
expression of p21Waf1/Cip1 in NIH3T3 cell line. Cell Res 2002; 12: 229-33.
33. Sidky YA, Borden EC. Inhibition of angiogenesis by interferons: effects on tumor- and
lymphocyte-induced vascular responses. Cancer Res 1987; 47: 5155-61.
34. Komiya T, Hosono Y, Hirashima T et al. p21 expression as a predictor for favorable
prognosis in squamous cell carcinoma of the lung. Clin Cancer Res 1997; 3: 1831-5.

18
35. Shoji T, Tanaka F, Takata T et al. Clinical significance of p21 expression in non-small cell
lung cancer. J. Clin. Oncol. 2002; 20: 3865-3871.
36. Singhal S, Vachani A, Antin-Ozerkis D, Kaiser LR, Albelda SM. Prognostic implications
of cell cycle, apoptosis, and angiogenesis biomarkers in non-small cell lung cancer: a review.
Clin Cancer Res 2005; 11: 3974-86.
19
Figure Legends
Figure 1. Expression of mRNA encoding IL-28R, IL-10Rβ and IFN-α receptors.
The expression of mRNA encoding IL-28R, IL-10Rβ, IFN-α receptors and GAPDH was
analyzed by RT-PCR. Lane 1: OBA-LK1, Lane 2: LK-1, Lane 3: 11-18, Lane 4: Sq-19, Lane
5: NCI-H23, Lane 6: A549.
Figure 2. Antitumor effect of type III IFN in vitro
a-b. The growth of cells cultured with the indicated concentrations of cytokine for 5 days was
analyzed with MTT assay. Each value represents mean percent cell growth ± SD (n = 5). c-d.
Growth inhibition by IL-28A, IL-29 or 10 ng/ml IFN-α was assessed for 5 consecutive days.
Each value represents the mean absorbance ± SD (n = 5).
Figure 3. Effect of type III IFN on the apoptotic cell death.
a. DNA fragmentation in cells cultured with or without cytokine or cisplatin was analyzed
using a Cell Death Detection ELISA. Each value is normalized to the negative control and
represents mean relative DNA fragmentation ± SD (n = 5). b. OBA-LK1 cells cultured with or
without cytokine or cisplatin for 12 hours were incubated with Annexin V-PE, and analyzed
by flow cytometry.
Figure 4. Effect of IL-29 on cell cycle distribution and expression of cyclin-dependent kinase
inhibitors
a. Cell cycle distribution of the cells cultured with or without IL-29 for 48 hours was analyzed
on a FACScan. b. The expression of mRNA for OAS1, ADAR and PKR in cells cultured with
or without the indicated cytokines were analyzed by quantitative RT-PCR. Each value is
normalized to GAPDH and represents mean ± SD (n = 3; *, p < 0.05; **, p < 0.001 versus
control). c-d. Induction of p21 and p27 in cells cultured with or without 50 ng/ml IL-29 for 24
hours was evaluated with western blot analysis. Time course analysis of p21 and p27

20
induction in OBA-LK1 cells treated with 50 ng/ml IL-29 was also performed. Relative p21
and p27 intensity normalized to β-actin are presented in the bar graph.
Figure 5. RNA interference inhibited IL-29-induced p21 up-regulation and counteracted the
antiproliferative effect
a. Cells were transfected with or without a p21-siRNA oligonucleotide. The p21 expression
was analyzed using western blot analysis. b. Cells were transfected with or without a
p21-siRNA oligonucleotide or a non-targeted control oligonucleotide, and then cultured with
incremental concentrations of IL-29 for 48 hours. Cell growth was analyzed with MTT assay.
Each value represents mean percent cell growth ± SD (n = 5).
Figure 6. Antitumor effect of IL-29 in vivo. a-b. Intratumoral therapy of tumors with IL-29.
Each value represents mean tumor volume (mm3) ± SD for 5 mice per group (*, p < 0.05; **,
p < 0.001; PBS versus IL-29, on day 21 or day 22 after therapy initiation). c. Daily systemic
therapy of OBA-LK1 tumors with IL-29. Each value represents mean tumor volume (mm3) ±
SD for 4 mice per group (*, p < 0.05; **, p < 0.0001; PBS versus IL-29, on day 16 after
therapy initiation).
Figure 7. Histological and immunohistochemical examination. Sections were stained with
hematoxylin and eosin, or immunostained for Factor VIII related antigen or p21.
Figure 8. Antitumor effect of the cytokine combination in vitro. a-d, The effect of the
cytokine combinations on the in vitro NSCLC growth was evaluated with MTT assay. Each
value represents mean percent cell growth ± SD (n = 5).
Figure 9. Effect of cytokine combination on p21 expression. a. LK-1 cells were cultured with
or without cytokine(s) for the indicated hours. Time course analysis of p21 induction was

21
performed using western blot analysis. 1. Control, 2. 10 ng/ml IFN-α, 3. 50 ng/ml IL-29, 4.
50 ng/ml IL-29 plus 10 ng/ml IFN-α
b. The relative p21 intensity normalized to β-actin was presented in the bar graph. (*, p <
0.05: IFN-α or IL-29 versus IL-29 plus INF-α)
Figure 10. Antitumor effect of the combination between IL-29 and IFN-α in vivo.
Simultaneous administration of IL-29 and IFN-α inhibited the growth more effectively than
each reagent alone (*, p < 0.05; PBS versus IL-29; **, p < 0.03 PBS versus IFN-α, ***, p <
0.005; IL-29 or IFN-α versus IL-29 plus IFN-α).

22
Table 1.
Antiproliferative activity of IL-28A, IL-29, IFN-α, IL-28A + TNF-α and IL-29 + INF-α
on human NSCLC lines
Human NSCLC cell line % reduction in cell growth IL-28A IL-29 IFN-α IL-28A + TNF-α IL-29 +TNF-α
Squamous cell carcinoma Sq-1 17 33 42 53 57 Sq-19 < 15 18 27 40 50 LK-2 < 15 18 25 39 47 LK-79 < 15 20 26 36 52 EBC-1 < 15 < 15 71 79 82
Adenocarcinoma 11-18 16 73 92 95 95 LK-1 15 42 36 52 55 NCI-H23 < 15 21 43 57 61
Large cell carcinoma OBA-LK1 48 71 87 92 94 86-2 22 56 77 83 85 Lu99 < 15 17 24 33 38
Alveolar cell carcinoma A549 < 15 < 15 < 15 23 25
The antiproliferative effect of 10 ng/ml IL-28A, 10 ng/ml IL-29, 10 ng/ml IFN-α, 10 ng/ml IL-28A + 10 ng/ml IFN-α or 10 ng/ml IL-29 + 10 ng/ml IFN-α on human NSCLC lines was examined with MTT assay as described in Materials and Methods. The percentage of reduction in cell growth was determined by the following formula: % reduction in cell growth = (1 - A590 of cells cultured with cytokine(s) / A590 of cells cultured without cytokine(s)) x 100. IL-28A + IFN-α or IL-29 + IFN-α significantly inhibited the growth of NSCLC lines more efficiently than each reagent alone.
23
Figure 1.

24
Figure 2. (a) OBA-LK1 (b) 11-18
(c)
OBA-LK1
0.00.10.20.30.40.50.60.70.80.9
0 1 2 3 4 5
Abs
orba
nce
(590
nm
) 11-18Control
IFN-alpha
5 ng/ml IL-28A
50 ng/ml IL-28A
5 ng/ml IL-29
50 ng/ml IL-290.0
0.1
0.2
0.3
0.4
0.5
0.6
0.7
0.8
0 1 2 3 4 5
Abs
orba
nce
(590
nm
)
25
Figure 3.
(a)
(b)
1
10
100
1000
OBA-LK1 11-18 A549
Rel
ativ
e D
NA
frag
men
tatio
n Non-treated
250 ng/ml IL-28A
10 ng/ml IL-29
50 ng/ml IL-29
250 ng/ml IL-29
20 µM Cisplatin
Cou
nts
Annexin V
Non-treated 50 ng/ml IL-29 250 ng/ml IL-29 20 µM Cisplatin
26
Figure 4.
(a)
(b)
OBA-LK10
0.2
0.4
0.6
0.8
1
A549
G2/M
S
G0/G1
IL-29 0 50 250 0 50 250 0 50 250 (ng/ml)
11-18
0
1.0
2.0
3.0Relative ADAR mRNA expression to GAPDH
OBA-LK1 11-180
0.4
0.8
1.2
Relative PKR mRNA expression to GAPDH
0
0.2
0.4
0.6
0.8
Relative OAS1 mRNA expression to GAPDH
50 ng/ml IL-28A
50 ng/ml IL-29
50 ng/ml IFN-α
Control
*
**
*
A549
*
*
*
* **
**
* *
* *
*
****
27
(c)
(d)
p27
p21
β-actin
hours 0 6 12 24
OBA-LK1
0
0.2
0.4
0.6
0.8
1.0
1.2
1.4
1.6
1.8
0 6 12 24
OBA-LK1
p21
p27
Rel
ativ
e in
tens
ity to
β-a
ctin
p27
p21
β-actin
IL-29
OBA-LK1 11-18 A549
- - -+ + +
0
0.2
0.4
0.6
0.8
1.0
1.2
1.4
p21 p27 p21 p27p21 p27
OBA-LK1 11-18 A549
1.6IL-29 - +
Rel
ativ
e in
tens
ity to
β-a
ctin

28
Figure 5.
(a)
(b)
50 ng/ml
p21-siRNA + + + +
12 724824
-24hours
IL-29 -
0
20
40
60
80
100
120
0 0.5 1 5 10 50 100 5001000
Cytokine (ng/ml)
Cel
l gro
wth
(% o
f con
trol
)
control-siRNAp21-siRNAsiRNA(-)
29
Figure 6.
(a)
(b)
(c)
OBA-LK1
0
500
1000
1500
2000
2500
3000
3500
0 3 6 9 12 15 18 21
Days after therapy initiation
Tum
or v
olum
e (m
m3 ) PBS
50 ng IL-29400 ng IL-291500 ng IL-29
*
*
**
LK-1
0
500
1000
1500
2000
2500
0 2 4 6 8 10 12 14 16 18 20 22
Days after therapy initiation
Tum
or v
olum
e (m
m3 ) PBS
50 ng IL-29400 ng IL-291500 ng IL-29
**
*
0 2 4 6 8 10 12 14 16
OBA-LK1
0
400
800
1200
1600
2000
Days after therapy initiation
Tum
or v
olum
e (m
m3 )
PBS400 ng IL-29
1500 ng IL-297000 ng IL-29
*
**
**

30
Figure 7.
IL-29PBSH
emat
oxyl
in a
nd e
osin
Fact
or V
III re
late
d an
tigen
p21W
af1/
Cip
1
31
Figure 8.
(a) Sq-19
(b) LK-1

32
(c) LK-79
(d) Lu99
33
Figure 9.
(a)
(b)
p21
β-actin
1 2 3 4 1 2 3 4 1 2 3 4
12 h 18 h 24 h
12 h 18 h 24 h0
1
2
3
4
5
6
7
Rel
ativ
e in
tens
ity ß
-act
in
controlIFN-alphaIL - 29IL - 29 + IFN-alpha
*
*
*
34
Figure 10.


![Synergistic Effect of Human Immune Interferon and Double-Stranded RNA against Human ... · [CANCER RESEARCH 45, 2539-2544, June 1985] Synergistic Effect of Human Immune Interferon](https://img.pdfslide.us/doc/110x75/5e744b8f5142e90872257cf4/synergistic-effect-of-human-immune-interferon-and-double-stranded-rna-against-human.jpg)