Embed Size (px)
Citation preview
ARTICLE
Cancer risk among insulin users: comparing analogueswith human insulin in the CARING five-country cohort study
Anna But1 & Marie L. De Bruin2,3& Marloes T. Bazelier2 & Vidar Hjellvik4
&
Morten Andersen5,6,7& Anssi Auvinen8
& Jakob Starup-Linde9 &
Marjanka K. Schmidt10,11 & Kari Furu4& Frank de Vries2,12,13,14 &
Øystein Karlstad4& Nils Ekström5
& Jari Haukka1
Received: 13 December 2016 /Accepted: 24 April 2017 /Published online: 1 June 2017# The Author(s) 2017. This article is an open access publication
AbstractAims/hypothesis The aim of this work was to investigate therelationship between use of certain insulins and risk for cancer,when addressing the limitations and biases involved in previ-ous studies.Methods National Health Registries from Denmark(1996–2010), Finland (1996–2011), Norway (2005–2010)and Sweden (2007–2012) and the UK Clinical PracticeResearch Datalink database (1987–2013) were used to conducta cohort study on new insulin users (N = 327,112). By using acommon data model and semi-aggregate approach, we pooledindividual-level records from five cohorts and applied Poisson
regression models. For each of ten cancer sites studied, weestimated the rate ratios (RRs) by duration (≤0.5, 0.5–1, 1–2,2–3, 3–4, 4–5, 5–6 and >6 years) of cumulative exposure toinsulin glargine or insulin detemir relative to that of humaninsulin.Results A total of 21,390 cancer cases occurred during a meanfollow-up of 4.6 years. No trend with cumulative treatmenttime for insulin glargine relative to human insulin was observedin risk for any of the ten studied cancer types. Of the 136associations tested in the main analysis, only a few increasedand decreased risks were found: among women, a higher riskwas observed for colorectal (RR 1.54, 95% CI 1.06, 2.25) and
Electronic supplementary material The online version of this article(doi:10.1007/s00125-017-4312-5) contains peer-reviewed but uneditedsupplementary material, which is available to authorised users.
* Anna [email protected]
* Marie L. De [email protected]
1 Department of Public Health Clinicum, University of Helsinki,Tukholmankatu 8B, P.O. Box 20, 00014 Helsinki, Finland
2 Division of Pharmacoepidemiology and Clinical Pharmacology,Utrecht Institute for Pharmaceutical Sciences, Utrecht University,Universiteitsweg 99, 3584 CG Utrecht, the Netherlands
3 Copenhagen Centre for Regulatory Science (CORS), Department ofPharmacy, University of Copenhagen, Copenhagen, Denmark
4 Department of Pharmacoepidemiology, Norwegian Institute ofPublic Health, Oslo, Norway
5 Centre for Pharmacoepidemiology, Karolinska Institutet,Stockholm, Sweden
6 Research Unit of General Practice, University of Southern Denmark,Odense, Denmark
7 Department of Drug Design and Pharmacology, University ofCopenhagen, Copenhagen, Denmark
8 Department of Epidemiology, School of Health Sciences, Universityof Tampere, Tampere, Finland
9 Department of Endocrinology and Internal Medicine, AarhusUniversity Hospital THG, Aarhus, Denmark
10 Division of Molecular Pathology, The Netherlands Cancer Institute –Antoni van Leeuwenhoek Hospital, Amsterdam, the Netherlands
11 Division of Psychosocial Research and Epidemiology,The Netherlands Cancer Institute – Antoni van LeeuwenhoekHospital, Amsterdam, the Netherlands
12 The Netherlands Department of Clinical Pharmacy and Toxicology,Maastricht University Medical Centre, Maastricht, the Netherlands
13 The Netherlands Research Institute CAPHRI, Maastricht University,Maastricht, the Netherlands
14 The Netherlands MRC Lifecourse Epidemiology Unit, University ofSouthampton, Southampton, UK
Diabetologia (2017) 60:1691–1703DOI 10.1007/s00125-017-4312-5
endometrial cancer (RR 1.78, 95%CI 1.07, 2.94) for ≤0.5 yearsof treatment and for malignant melanoma for 2–3 years (RR1.92, 95%CI 1.02, 3.61) and 4–5 years (RR 3.55, 95%CI 1.68,7.47]); among men, a lower risk was observed for pancreaticcancer for 2–3 years (RR 0.34, 95%CI 0.17, 0.66) and for livercancer for 3–4 years (RR 0.36, 95%CI 0.14, 0.94) and >6 years(RR 0.22, 95% CI 0.05, 0.92). Comparisons of insulin detemirwith human insulin also showed no consistent differences.Conclusions/interpretation The present multi-country studyfound no evidence of consistent differences in risk for tencancers for insulin glargine or insulin detemir use comparedwith human insulin, at follow-up exceeding 5 years.
Keywords Cancer risk .Cohort study .Commondatamodel .
Cumulative treatment time . Detemir . Glargine . Humaninsulin . Insulinanalogues .Newinsulinuser .Poissonmodel .
Rate ratio . Semi-aggregate . Site-specific
AbbreviationsATC Anatomical Therapeutic ChemicalCARING Cancer risk and insulin analoguesCPRD Clinical Practice Research DatalinkDDD Defined daily doseHRT Hormone replacement treatmentNIAD Non-insulin antidiabetic drugNSAID Nonsteroidal anti-inflammatory drugRR Rate ratio
Introduction
Diabetes mellitus and cancer are common diseases with risingincidence and prevalence globally [1, 2]. Diabetes is associat-ed with an increased risk for certain cancers [3] and the patternand magnitude of the excess risk are generally similar for type1 and 2 diabetes [4, 5]. It has been suggested that certaindiabetes risk factors, as well as glucose-lowering medications,may contribute to this association [6]. In 2009, the publicationof four observational studies [7–10] sparked concerns aboutinsulin glargine as a potential modifier of cancer risk [11].
The oncogenic potential of various insulin analogues hasbeen suggested by preclinical safety evaluations showing thatIGF and insulin receptor signalling pathways, which are es-sential for mitogenic potency, are affected by ligand-specificreceptor dynamics, depending on the cell type [12]. Initialobservational studies [7–10] were criticised for limitationsand biases [11, 13, 14] such as short follow-up, inclusion ofprevalent insulin users and time-lag bias [15]. Further attemptsto rule out or confirm the association yielded inconsistentfindings, emphasising the importance of properly designedand conducted observational studies [16].
The evidence from the observational studies remains incon-sistent [17, 18], particularly due to the involvement of method-ological drawbacks, such as time-related biases and selectionbias [15].Moreover, the findings from studies that ignore dose–effect aspects, time-varying character of exposure, site-specificrisks or long latency of cancer are limited in their biologicalplausibility [16, 19]. It was thought that RCTs, the gold stan-dard of treatment comparisons, would disentangle the associa-tion. However, the ORIGIN trial, which showed a null effect[20] and constitutes perhaps the strongest RCT evidenceconcerning the use of insulin analogues and cancer outcomes,has been criticised for evaluation of cancer risk with respect tothe initial insulin glargine allocation but not the cumulativeinsulin glargine use [21]. Overall, there is little robust evidencefrom observational studies or RCTs to draw firm conclusions.
The present observational study, which is a part of theCancer Risk and Insulin Analogues (CARING) project,sought to investigate the effect of exposure to insulin glargineor insulin detemir on cancer risk as compared with that ofhuman insulin, mitigating through study design and analyticalapproaches the limitations and biases involved in the previousstudies.
Methods
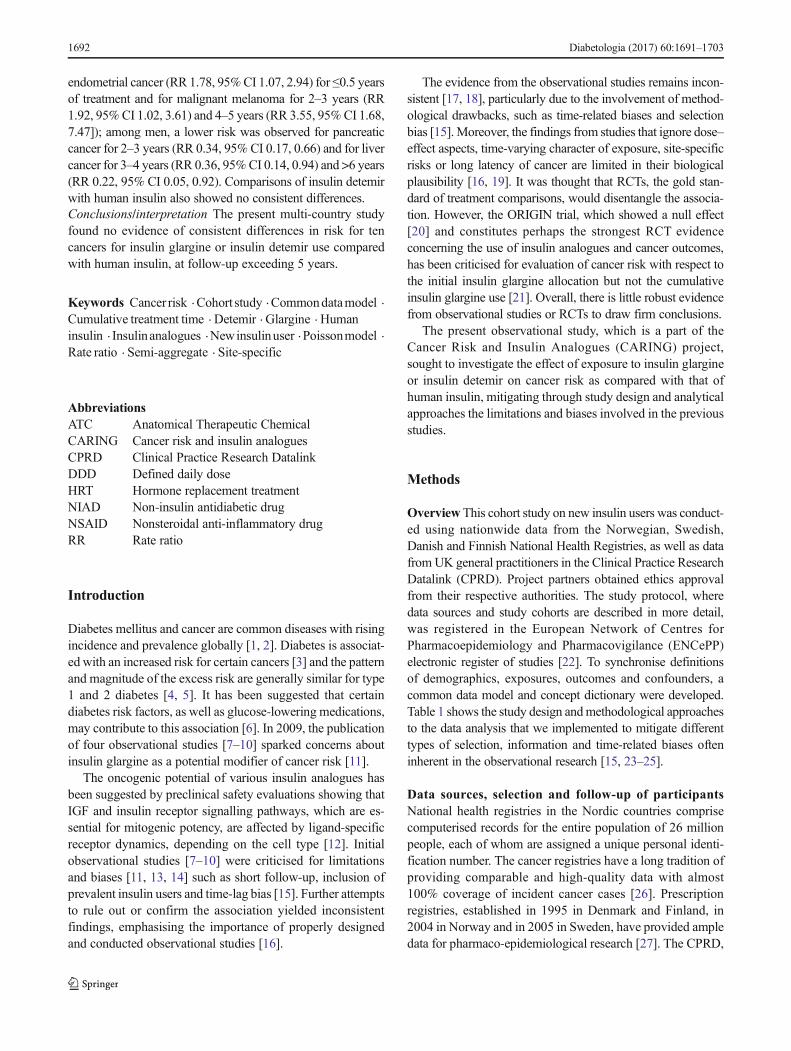
Overview This cohort study on new insulin users was conduct-ed using nationwide data from the Norwegian, Swedish,Danish and Finnish National Health Registries, as well as datafrom UK general practitioners in the Clinical Practice ResearchDatalink (CPRD). Project partners obtained ethics approvalfrom their respective authorities. The study protocol, wheredata sources and study cohorts are described in more detail,was registered in the European Network of Centres forPharmacoepidemiology and Pharmacovigilance (ENCePP)electronic register of studies [22]. To synchronise definitionsof demographics, exposures, outcomes and confounders, acommon data model and concept dictionary were developed.Table 1 shows the study design andmethodological approachesto the data analysis that we implemented to mitigate differenttypes of selection, information and time-related biases ofteninherent in the observational research [15, 23–25].
Data sources, selection and follow-up of participantsNational health registries in the Nordic countries comprisecomputerised records for the entire population of 26 millionpeople, each of whom are assigned a unique personal identi-fication number. The cancer registries have a long tradition ofproviding comparable and high-quality data with almost100% coverage of incident cancer cases [26]. Prescriptionregistries, established in 1995 in Denmark and Finland, in2004 in Norway and in 2005 in Sweden, have provided ampledata for pharmaco-epidemiological research [27]. The CPRD,
1692 Diabetologia (2017) 60:1691–1703
Tab
le1
Methodologicalshortcomings
andbiases
mitigated,addressedby
checking
therobustness
oftheresults
ordisentangled
bythedesign
andanalyticalfeatures
used
inthestudy
Design/analyticalfeature
Selectio
nbias
Inform
ationbias
Tim
e-relatedbias
Confounding
bias
Health
care
accessbias
aPrevalent
user
bias
bMisclassificatio
nof
exposurec
Misclassificatio
nof
outcom
ec,
detectionbias
d
Protopathicbias
(reverse
causation)
e
Immortal
timebias
fTim
e-lagbias
g,
time-window
bias
h
Confounding
byindicatio
niResidual
confoundingj
Adjustm
entfor
timesincestarto
finsulin
use
––
Mitigated
––
–Mitigatedg
–Mitigated
Active-comparatorapproach
––
–Mitigatedd
–Mitigated
Mitigatedg
Mitigated
Mitigated
Cum
ulativeexposure
definitio
n–
–Mitigated
–Disentangled
––
Mitigated
–
Nationw
ideNordicdrug
registers
Mitigated
––
––
––
––
Nationw
ideNordiccancerregisters
––
–Mitigatedc
––
––
–
New
-userdesign
–Mitigated
Mitigated
––
Mitigated
Mitigatedh
Mitigated
–
Sensitiv
ityanalysis
Checked
k–
–Checked
c,k
––
–Checked
l
Tim
e-varyingexposure
definitio
n–
–Mitigated
–Disentangled
Mitigated
Mitigatedh
,mMitigated
aHealth
care
access
bias:d
ifferentiald
egreeof
access
tothehealthcare
amongpatients
bPrevalentuserbias:riskof
outcom
eisconsiderablyhigheror
lowerduring
theearlyperiod
ofdrug
therapy;inclusionof
prevalentusersmay
distortthe
associationbetweentheuseof
drug
andoutcom
e(including
prevalentu
sersmay
also
introduceconfounding)
cMisclassificatio
n(m
easurement)bias:inaccuratemeasurementorclassificationof
keystudyvariables,such
asexposure,outcomeor
confounders:misclassificatio
nof
exposuremay
arisefrom
useof
too
simple(binary)
exposure
definitio
n,especially
forthecomplex
pattern
ofuse;misclassificatio
nof
outcom
emay
occurdueto
theuseof
incompleterecordsto
identifyevents
dDetectio
nbias:d
ifferent
probability
ofoutcom
edetectionduring
thefollo
w-upin
thecomparedgroups
eProtopathicbias:sym
ptom
streatedby
adrug
arethemanifestatio
nof
theyet-undiagnoseddiseaseof
interest
fIm
mortaltim
ebias
arises
becauseof
exclusionor
misclassificatio
nof
thefollo
w-uptim
ebetweenthecohortentryandfirstexposureto
adrug,beforewhich
theoutcom
eof
interestcannot
occur
gTim
e-lagbias:com
paredtreatm
entsarecommonly
used
atdifferentstagesof
thedisease(first-linetherapyvs
second-or
third-lin
etherapy)
hTim
e-windowbias:u
nequalopportunity
tobecomeexposedbetweenthecomparedgroups
owingto
thetim
e-windowdifferential
iConfounding
byindicatio
n:differencesbetweencomparedtreatm
entswith
respecttotheirindicatio
ns(orcontraindicatio
ns)
jResidualconfounding:the
distortio
nthatremains
aftercontrolling
forconfoundingdueto
theunmeasured/uncontrolledconfounders
kRestrictio
nto
theNordiccohorts
lRestrictio
nto
theindividualswith
type
2diabetes
mRestrictio
nto
thecalendar
period
from
2000
onwards
Diabetologia (2017) 60:1691–1703 1693
a large computerised database established in the UK in 1987,contains anonymised medical records, including demo-graphics, prescriptions and cancer diagnoses, that are consid-ered to be of good quality [28]. Currently, 4.4 million individ-uals, 6.9% of the UK population, meet the quality criteria andare broadly representative of the entire population with regardto demographic characteristics [29].
Within the study period (Table 2) defined as the period ofvalid data collection [22], we identified all individuals havingat least one insulin purchase (Nordic countries) or prescription(CPRD). Nordic cohorts were linked with the registered dataon cancer, death and emigration; data for the British cohortwere compiled from information on cancer and death avail-able from the CPRD. New insulin users, who were definedbased on a 1 year lead-in period, were included if they had nohistory of cancer (except non-melanoma skin cancer) and
were aged ≥18 years on the first prescription for any insulin(index date). Follow-up started at index date and ended at thedate of emigration (Sweden, Denmark and Norway) or trans-fer out of the CPRD, diagnosis of any cancer (excluding non-melanoma skin cancer), death or end of follow-up, whicheveroccurred first.
Cancer outcomes, insulin treatments and potential con-founders We relied on coding dictionaries, compiled accord-ing to different coding systems (ICD-7, ICD-9 [www.icd9data.com/2007/Volume1], ICD-10 [www.who.int/classifications/icd/en/] and ICD-O-3 in the Nordic countries;Read code system in the CPRD), to identify incident cancercases defined as the first occurrence of any cancer type [22].Multiple cancers diagnosed on the same date were consideredas distinct site-specific endpoints. Our primary interest was in
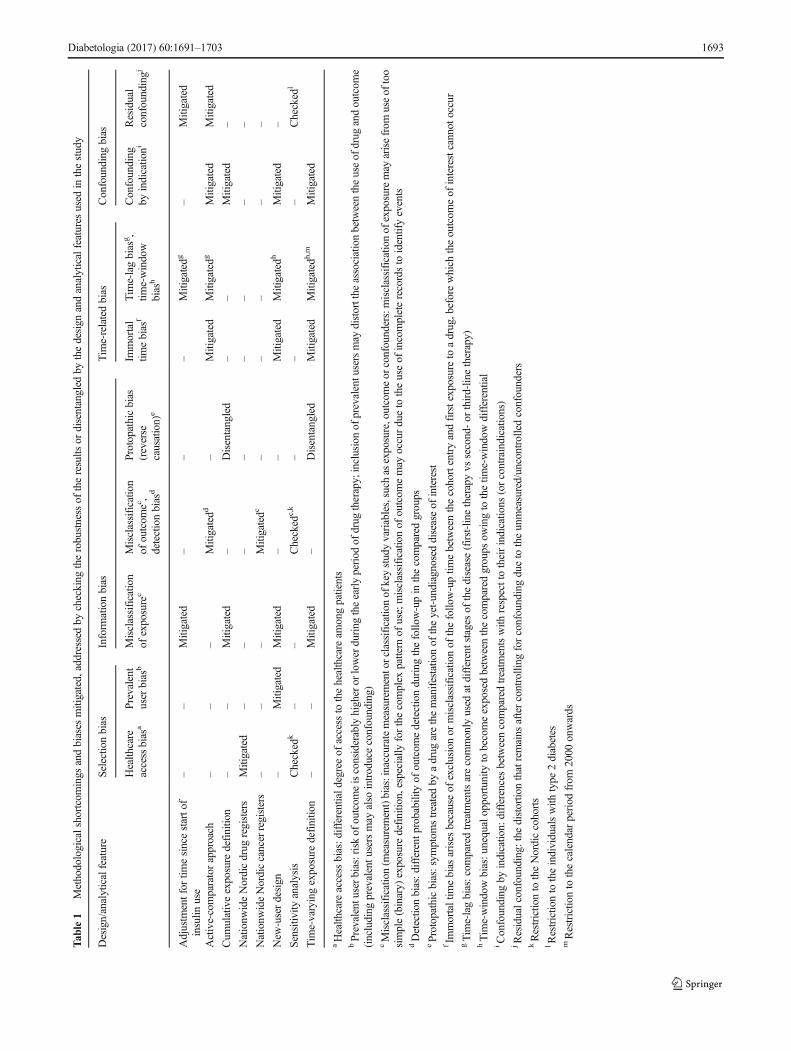
Table 2 Baseline and follow-up characteristics of the study cohorts of new users of insulin
Characteristic Denmark(N = 66,698)
Finland(N = 105,945)
Norway(N = 21,541)
Sweden(N = 85,319)
UK (CPRD)(N = 47,609)
Study perioda 1996–2010 1996–2011 2005–2010 2007–2012 1987–2013
Male sex, n (%) 38,292 (57) 57,691 (55) 12,053 (56) 48,931 (57) 25,589 (54)
Age years, mean (SD)b 60.1 (16.0) 61.6 (15.9) 57.3 (17.8) 64.0 (16.4) 59.3 (16.3)
Age years, n (%)b
18–30 3193 (4.8) 4481 (4.2) 1634 (7.6) 3121 (3.6) 2555 (5.4)
30–40 5075 (7.6) 7317 (6.9) 2653 (12.3) 4924 (5.8) 4540 (9.5)
40–50 8334 (12.5) 11,095 (10.5) 3088 (14.3) 8383 (9.8) 5825 (12.2)
50–60 14,432 (21.6) 22,928 (21.6) 4248 (19.7) 14,870 (17.4) 9351 (19.6)
60–70 16,306 (24.5) 25,254 (23.8) 4220 (19.6) 21,378 (25.1) 11,661 (24.5)
70–80 12,527 (18.8) 22,110 (20.9) 3194 (14.8) 17,176 (20.1) 9505 (20.0)
80+ 6831 (10.2) 12,760 (12.0) 2504 (11.6) 15,466 (18.1) 4172 (8.8)
Follow-up time, years
Mean (SD) 5.3 (3.9) 5.6 (3.9) 2.7 (1.8) 2.7 (1.8) 5.7 (4.3)
Median (interquartile range) 4.5 (1.9, 7.8) 4.7 (2.3, 8.3) 2.5 (1.1, 4.1) 2.6 (1.1, 4.1) 4.7 (1.9, 8.4)
No. of person-years/1000,all (male sex)
331.2 (184.4) 589.1 (316.9) 57.8 (32.4) 226.6 (131.3) 265.3 (141.6)
Ever-use, n (%)c
Human insulin 54,216 (81) 68,894 (65) 17,579 (82) 48,976 (57) 23,183 (49)
Insulin glargine 7151 (11) 43,741 (41) 1447 (7) 15,138 (18) 15,374 (32)
Insulin detemir 9520 (14) 24,593 (23) 868 (4) 4367 (5) 7373 (15)
Other insulin 33,388 (50) 48,280 (46) 14,376 (67) 53,810 (63) 27,491 (58)
Baseline use, n (%)
HRTd 5187 (18) 6546 (14) 1641 (17) 6621 (18) 1530 (7)
NSAIDe 17,800 (27) 29,609 (28) 5437 (25) 16,485 (19) 8935 (18)
Any oral glucose-lowering therapy 49,569 (74) 83,935 (79) 15,051 (70) 62,522 (73) 37,239 (78)
Statin 22,948 (34) 38,493 (36) 9309 (43) 39,635 (46) 24,188 (51)
a Start of study period defined according to the start of prescription registry (Nordic countries) or start of valid data collection (CPRD)bAge at baselinec Ever-use of specific insulin during the follow-upd Female sex onlye Based on prescriptions only
1694 Diabetologia (2017) 60:1691–1703
ten site-specific cancers. Based on NORDCAN data (cancerstatistics from Nordic countries) [26], we selected the eightcancer types with the highest incidence rates (ICD-10 codes):trachea and lung (C33, C34), melanoma of skin (C43), blad-der (C67), colorectal (C18-21), non-Hodgkin lymphoma(C82-86, C88.4), breast (C50), endometrial (C54) and prostate(C61). Liver (C22) and pancreatic (C25) cancers were alsoincluded because of their strong association with diabetes.As a secondary outcome of interest, we investigated the firstoccurrence of any cancer.
Based on Anatomical Therapeutic Chemical (ATC) classi-fication codes [30] (British National Formulation codes for theCPRD), we identified users of human insulin (A10AC01,A10AB01, A10AD01, A10AE01, A10AF01) and the insulinanalogues insulin glargine (A10AE04) and insulin detemir(A10AE05). Any other insulins and analogues were consid-ered as a single group. Prescription data form the Nordic reg-istries included the date and amount purchased, in defineddaily doses (DDDs) [30], but no information on individualdosage. For the CPRD cohort, we derived DDDs from thedosage information (substance strength and amount)contained within prescription data. We assumed a daily con-sumption of 1 DDD per day and transformed each drug recordinto a period covered by the number of DDDs.
For each insulin type of interest, we defined insulin expo-sure time-dependently as a cumulative treatment time. Aftersplitting the individual follow-up period into intervals of120 days, the exposure at the beginning of each interval wasupdated. The exposure began on the date of first prescription/purchase, after which point an individual was considered ex-posed. Cumulative treatment time accrued until exposurestopped and remained unchanged, unless treatment was re-sumed (see electronic supplementary material [ESM]Methods). We then divided cumulative treatment time intohalf-year categories for the first year and 1 year categoriesfor longer exposure; the last categories were >6 years for thebroadly categorised exposure and 9–10 years for the finelycategorised exposure. In addition, each exposure variable in-corporated a non-exposed category assigned to individualsremaining unexposed to the specific insulin.
We considered only confounders available in all fivedatasets [22]. In addition to age, sex and calendar time, thisincluded use of non-insulin glucose-lowering drugs (ATCcode A10B), statins (C10A), nonsteroidal anti-inflammatorydrugs (NSAIDs; M01A) and hormone replacement treatment(HRT; G03), defined as at least one prescription within 1 yearbefore the index date. We also derived several other potentialconfounders: type 1 diabetes mellitus was assigned to thoseaged ≤30 years with no non-insulin glucose-lowering drug onthe index date; type 2 diabetes mellitus was assigned to thoseaged ≥40 years with or without non-insulin glucose-loweringdrugs; unspecified diabetes type was assigned to the rest of thecohort. We specified the duration of insulin-treated diabetes as
time since the index date (in 1 year intervals) and definedmenopausal status time-dependently based on cut-off of50 years of age. Furthermore, the country of the data originserved as a covariate.
Statistical methods The individual-level data from the fivecohorts were standardised by each research partner locallyusing the common data model. We then conducted centralisedanalyses by uploading the unified data to a server at StatisticsDenmark, where for each cohort we constructed the individual-level dataset to assess insulin exposure and other variables inexactly the same way. We employed a semi-aggregate levelapproach [31] to combine the datasets, which were tabulatedby cancer site as the number of cancer cases and person-yearsaggregated by categorical variables. To estimate the incidencerates, we fitted multivariable Poisson regression models to theevent numbers with the natural log of person-years as an offset.Each model included all three time-dependent insulin exposurevariables andwas adjusted for time-dependent age and durationof insulin-treated diabetes, sex (not in the sex-stratified analysis),baseline calendar time, use of non-insulin antidiabetic drugs(NIADs), other co-medication (when relevant [22]) and country.
We conducted an active-comparator analysis [25], wherethe drug of interest is compared with another drug commonlyused for the same indication rather than with no treatment.Inclusion of all three insulin exposures in the same modelallowed us to calculate the rate ratios (RRs) and 95% CIs fora particular exposure category by contrasting the incidencerates, which were estimated for each insulin type and duration.In the primary analyses, we examined sex- and site-specificcancer endpoints without separating between diabetes typesand using insulin exposures with a broader category(>6 years) for the longer cumulative treatment time. For thesecondary analyses, we performed similar evaluations withoutstratifying on sex and using insulin exposures with finercategories.
Sensitivity analysis We also performed several sensitivityanalyses. We restricted the analyses to those who met type 2diabetes criteria to check whether the results change by diabe-tes type (data for individuals with type 1 diabetes were limit-ed). In Europe, marketing authorisation for the long-actinginsulin analogues insulin glargine and insulin detemir wasgranted in June 2000 and June 2004, respectively [32, 33].Coincidentally, usage of two already-approved rapid-actinginsulin analogues, insulin lispro and insulin aspart, gainedpopularity in the early 2000s. To account for the changes inthe profiles of new insulin users, we excluded those enteredbefore 2000. By excluding the CPRD, we addressed the po-tential of underestimating cancer incidence due to case ascer-tainment through the CPRD only without linkage to the na-tional cancer registration data. For breast and endometrial can-cer, we further adjusted for menopausal status.
Diabetologia (2017) 60:1691–1703 1695
We used version 3.2.2 of R (www.R-project.org) [34] toperform all statistical analyses, the Epi package, version 1.1.71 (https://cran.r-project.org/web/packages/Epi/index.html)[35] to carry out exposure calculations and the forestplotpackage, version 1.7 (https://cran.r-project.org/web/packages/forestplot/index.html) [36] for the graphical output.
Results
In the five cohorts totalling 327,112 new insulin users, menpredominated and the mean age at baseline varied between 57and 64 years (Table 2). For the combined data, the meanfollow-up time was 4.6 years (median 3.7, interquartile range1.7–6.3). At the end of follow-up, there was 212,848, 82,851and 46,721 ever-users of human insulin, insulin glargine andinsulin detemir, respectively. In all cohorts, human insulinpredominated in ever-use patterns. Ever-use of insulinglargine and insulin detemir was most common in theFinnish cohort, as was the baseline use of non-insulin glu-cose-lowering therapy. Baseline use of other medication alsodiffered between the cohorts.
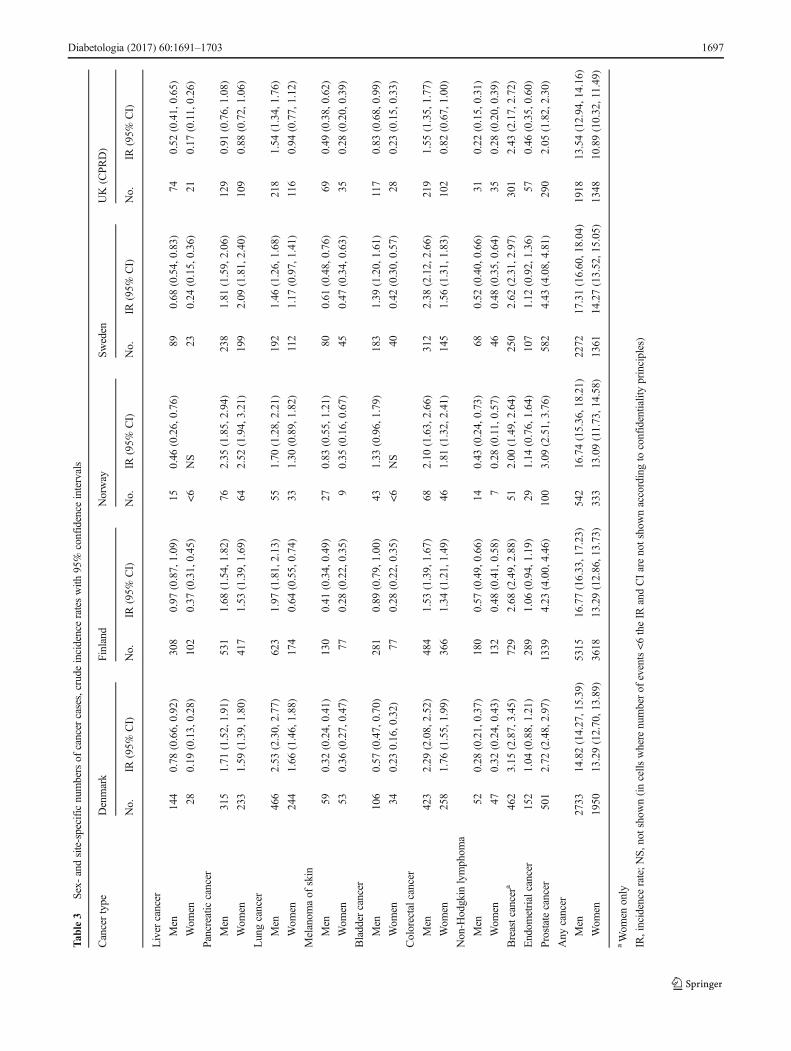
A total of 1.47 million person-years accumulated and21,390 new cancer cases occurred during the follow-up.Table 3 shows country- and sex-specific crude incidence ratesfor the ten site-specific cancers and any cancer. Prostate cancerin men and breast cancer in women showed the highest inci-dence rates in all cohorts except the Norwegian, where pan-creatic cancer was the most common cancer. About 32% of allcancer cases and the majority of pancreatic cancer cases (63%)were diagnosed during the first year of insulin treatment.
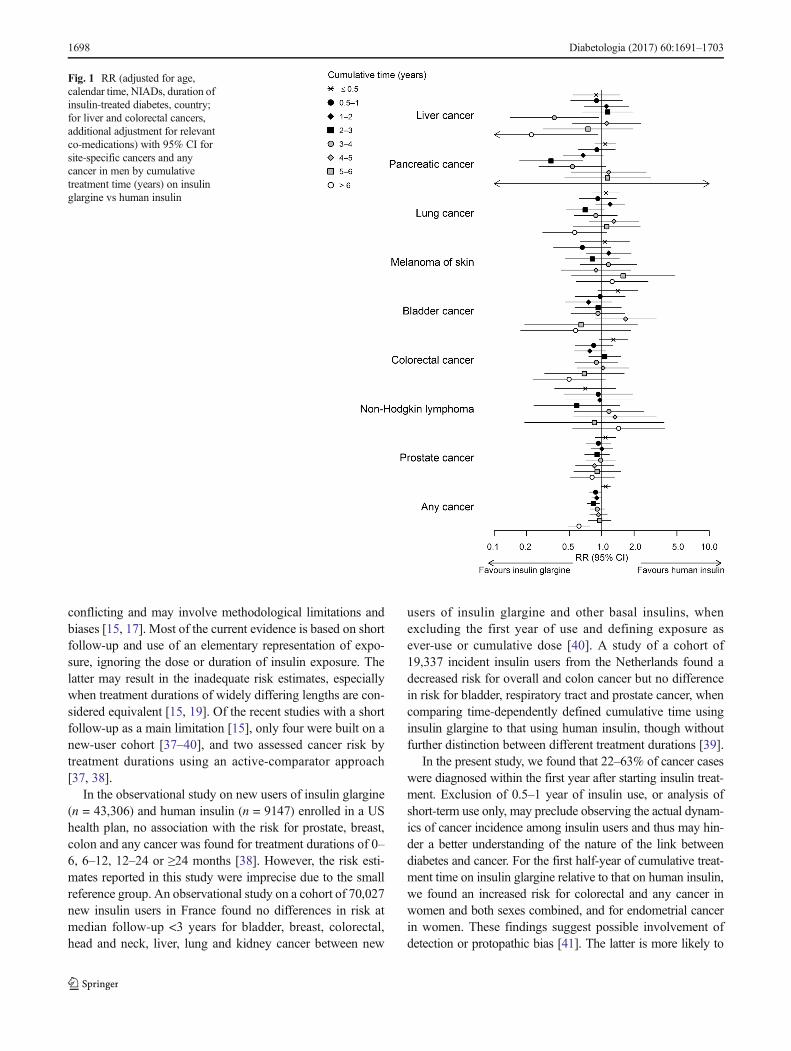
The results of the sex- and site-specific analyses showed nosystematic differences across sites and exposure categories(Figs 1, 2 and ESM Table 1). In women, a higher risk forcolorectal (RR 1.54, 95% CI 1.06, 2.25) and endometrial(RR 1.78, 95% CI 1.07, 2.94) cancer was observed for thefirst half-year of cumulative treatment time on insulin glarginerelative to that on human insulin and a higher risk for mela-noma of skin for 2–3 years (RR 1.92, 95% CI 1.02, 3.61) and4–5 years (RR 3.55, 95% CI 1.68, 7.47). In men, similarcomparisons yielded a lower risk for pancreatic cancer for2–3 years of exposure (RR 0.34, 95% CI 0.17, 0.66), andfor liver cancer for 3–4 years (RR 0.36, 95% CI 0.14, 0.94)and >6 years (RR 0.22, 95% CI 0.05, 0.92). In addition, theresults suggested an increase in the risk for bladder (RR 1.41,95% CI 0.92, 2.17) and colorectal cancer (RR 1.28, 95% CI0.94, 1.75) in men for <0.5 years and for breast cancer for<0.5 years (RR 1.32, 95% CI 0.98, 1.79) and 0.5–1 years(RR1.32, 95% CI 0.95, 1.85) in women.
In similar analyses performed using the 1 year categoriesfor longer duration of exposure (≥6 years) and both sexescombined (not sex-specific cancers), results remained similar(ESM Fig. 1): RR (95% CI) 1.41 (1.11, 1.79) for colorectal
cancer for <0.5 year, 0.67 (0.43, 1.03) for pancreatic cancerfor 2–3 years, 0.44 (0.21, 0.91) for liver cancer for 3–4 yearsand 1.60 (1.05, 2.43) for melanoma of the skin for 4–5 yearsof insulin glargine vs human insulin use. Comparisons ofinsulin detemir vs human insulin and insulin glargine vsinsulin detemir also showed no consistent differences in sex-and site-specific incidence rates (ESM Table 1) as well as inthe analyses combining both sexes (ESM Figs 2 and 3).
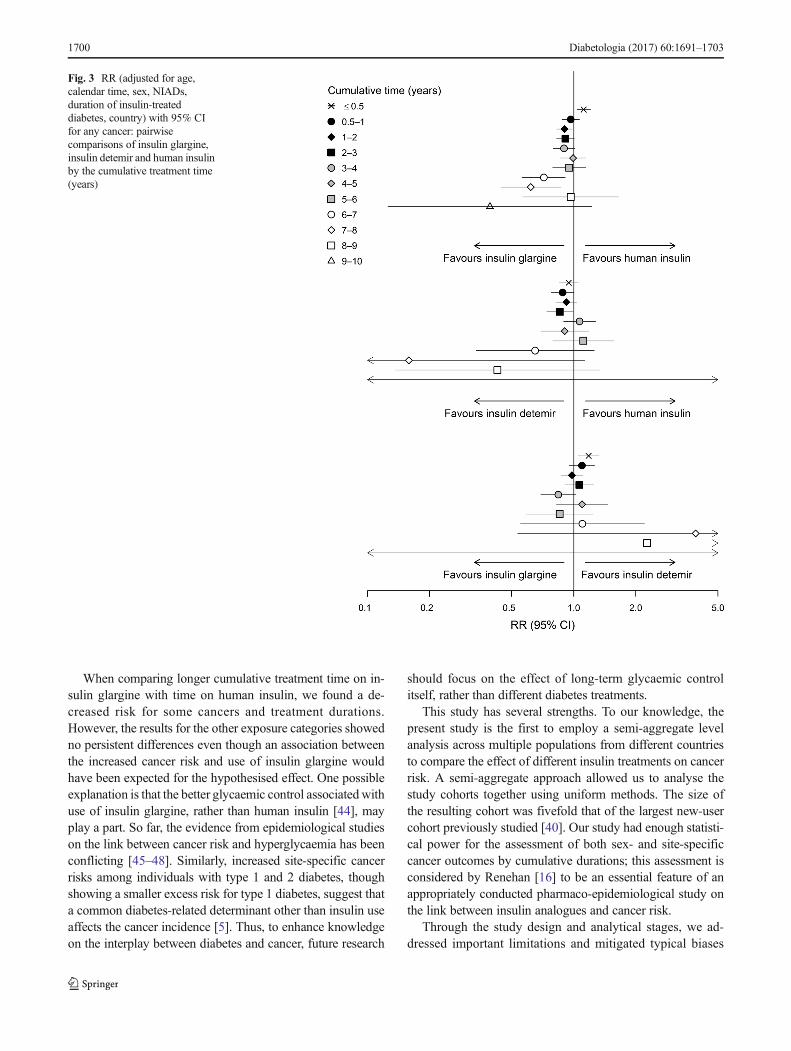
For any cancer in women, we found an elevated risk for0.5 year of insulin glargine use relative to human insulin (RR1.17, 95% CI 1.03, 1.32); in men, there was a lower risk for0.5–1 year (RR 0.87, 95% CI 0.77, 1.00), 1–2 years (RR 0.84,95%CI 0.73, 0.95) and >6 years (RR 0.61, 95%CI 0.48, 0.78)of exposure (Figs 1, 2 and ESM Table 1). Analysis performedwithout stratifying on sex (Fig. 3) yielded an elevated risk forany cancer for insulin glargine use relative to human insulinfor 0.5 year (RR 1.12, 95% CI 1.03, 1.20) and a lower risk for1–2 years (RR 0.90, 95% CI 0.83, 0.98), 6–7 years (RR 0.72,95% CI 0.56, 0.91) and 7–8 years (RR 0.62, 95% CI 0.44,0.86). Other analyses yielded a lower risk for any cancer inmen for 0.5–1, 2–3 and >6 years of insulin detemir use relativeto that of human insulin (ESM Table 1), and an increased riskin men and women combined (RR 1.18, 95% CI 1.05, 1.33)for <0.5 years of insulin glargine use relative to that of insulindetemir (Fig. 3).
Results were robust across a range of sensitivity analyses(ESM Tables 2, 3). Inclusion of the population with type 2diabetes (1.31 million person-years [90%], 21,151cancercases [99%]) yielded similar results to those of the primaryanalysis. The results did not change after either restriction ofthe study period to the time after insulin glargine’s launch(1.12 million person-years [77%], 16,838 cancer cases[79%]) or restriction of the study population to the Nordiccohorts. For breast and endometrial cancers, the resultsremained unchanged after further adjustment for menopausalstatus.
Discussion
In the cohort study of 327,112 new insulin users from fiveEuropean countries, we addressed the relationship betweeninsulin use and cancer incidence of ten site-specific cancersand any cancer, when mitigating methodological shortcom-ings and biases involved in previous studies. Comparisonsof cancer incidence by cumulative treatment time using activecomparators showed no consistent differences in the cancerrisk for insulin glargine or insulin detemir use relative to thatof human insulin use. Although we observed increased anddecreased cancer risks for some sites and treatment durations,no trends in the risk with duration of use were seen.
The findings of previous observational studies on the rela-tionship between cancer risk and use of insulin glargine are
1696 Diabetologia (2017) 60:1691–1703
Tab
le3
Sex-
andsite-specificnumbersof
cancer
cases,crudeincidencerateswith
95%
confidence
intervals
Cancertype
Denmark
Finland
Norway
Sweden
UK(CPR
D)
No.
IR(95%
CI)
No.
IR(95%
CI)
No.
IR(95%
CI)
No.
IR(95%
CI)
No.
IR(95%
CI)
Liver
cancer
Men
144
0.78
(0.66,0.92)
308
0.97
(0.87,1.09)
150.46
(0.26,0.76)
890.68
(0.54,0.83)
740.52
(0.41,0.65)
Wom
en28
0.19
(0.13,0.28)
102
0.37
(0.31,0.45)
<6
NS
230.24
(0.15,0.36)
210.17
(0.11,0.26)
Pancreatic
cancer
Men
315
1.71
(1.52,1.91)
531
1.68
(1.54,1.82)
762.35
(1.85,2.94)
238
1.81
(1.59,2.06)
129
0.91
(0.76,1.08)
Wom
en233
1.59
(1.39,1.80)
417
1.53
(1.39,1.69)
642.52
(1.94,3.21)
199
2.09
(1.81,2.40)
109
0.88
(0.72,1.06)
Lungcancer
Men
466
2.53
(2.30,2.77)
623
1.97
(1.81,2.13)
551.70
(1.28,2.21)
192
1.46
(1.26,1.68)
218
1.54
(1.34,1.76)
Wom
en244
1.66
(1.46,1.88)
174
0.64
(0.55,0.74)
331.30
(0.89,1.82)
112
1.17
(0.97,1.41)
116
0.94
(0.77,1.12)
Melanom
aof
skin
Men
590.32
(0.24,0.41)
130
0.41
(0.34,0.49)
270.83
(0.55,1.21)
800.61
(0.48,0.76)
690.49
(0.38,0.62)
Wom
en53
0.36
(0.27,0.47)
770.28
(0.22,0.35)
90.35
(0.16,0.67)
450.47
(0.34,0.63)
350.28
(0.20,0.39)
Bladder
cancer
Men
106
0.57
(0.47,0.70)
281
0.89
(0.79,1.00)
431.33
(0.96,1.79)
183
1.39
(1.20,1.61)
117
0.83
(0.68,0.99)
Wom
en34
0.23
0.16,0.32)
770.28
(0.22,0.35)
<6
NS
400.42
(0.30,0.57)
280.23
(0.15,0.33)
Colorectalcancer
Men
423
2.29
(2.08,2.52)
484
1.53
(1.39,1.67)
682.10
(1.63,2.66)
312
2.38
(2.12,2.66)
219
1.55
(1.35,1.77)
Wom
en258
1.76
(1.55,1.99)
366
1.34
(1.21,1.49)
461.81
(1.32,2.41)
145
1.56
(1.31,1.83)
102
0.82
(0.67,1.00)
Non-H
odgkin
lymphom
a
Men
520.28
(0.21,0.37)
180
0.57
(0.49,0.66)
140.43
(0.24,0.73)
680.52
(0.40,0.66)
310.22
(0.15,0.31)
Wom
en47
0.32
(0.24,0.43)
132
0.48
(0.41,0.58)
70.28
(0.11,0.57)
460.48
(0.35,0.64)
350.28
(0.20,0.39)
Breastcancera
462
3.15
(2.87,3.45)
729
2.68
(2.49,2.88)
512.00
(1.49,2.64)
250
2.62
(2.31,2.97)
301
2.43
(2.17,2.72)
Endom
etrialcancer
152
1.04
(0.88,1.21)
289
1.06
(0.94,1.19)
291.14
(0.76,1.64)
107
1.12
(0.92,1.36)
570.46
(0.35,0.60)
Prostatecancer
501
2.72
(2.48,2.97)
1339
4.23
(4.00,4.46)
100
3.09
(2.51,3.76)
582
4.43
(4.08,4.81)
290
2.05
(1.82,2.30)
Any
cancer
Men
2733
14.82(14.27,15.39)
5315
16.77(16.33,17.23)
542
16.74(15.36,18.21)
2272
17.31(16.60,18.04)
1918
13.54(12.94,14.16)
Wom
en1950
13.29(12.70,13.89)
3618
13.29(12.86,13.73)
333
13.09(11.73,14.58)
1361
14.27(13.52,15.05)
1348
10.89(10.32,11.49)
aWom
enonly
IR,incidence
rate;N
S,notshown(incells
where
numberof
events<6theIR
andCIarenotshownaccordingto
confidentialityprinciples)
Diabetologia (2017) 60:1691–1703 1697
conflicting and may involve methodological limitations andbiases [15, 17]. Most of the current evidence is based on shortfollow-up and use of an elementary representation of expo-sure, ignoring the dose or duration of insulin exposure. Thelatter may result in the inadequate risk estimates, especiallywhen treatment durations of widely differing lengths are con-sidered equivalent [15, 19]. Of the recent studies with a shortfollow-up as a main limitation [15], only four were built on anew-user cohort [37–40], and two assessed cancer risk bytreatment durations using an active-comparator approach[37, 38].
In the observational study on new users of insulin glargine(n = 43,306) and human insulin (n = 9147) enrolled in a UShealth plan, no association with the risk for prostate, breast,colon and any cancer was found for treatment durations of 0–6, 6–12, 12–24 or ≥24 months [38]. However, the risk esti-mates reported in this study were imprecise due to the smallreference group. An observational study on a cohort of 70,027new insulin users in France found no differences in risk atmedian follow-up <3 years for bladder, breast, colorectal,head and neck, liver, lung and kidney cancer between new
users of insulin glargine and other basal insulins, whenexcluding the first year of use and defining exposure asever-use or cumulative dose [40]. A study of a cohort of19,337 incident insulin users from the Netherlands found adecreased risk for overall and colon cancer but no differencein risk for bladder, respiratory tract and prostate cancer, whencomparing time-dependently defined cumulative time usinginsulin glargine to that using human insulin, though withoutfurther distinction between different treatment durations [39].
In the present study, we found that 22–63% of cancer caseswere diagnosed within the first year after starting insulin treat-ment. Exclusion of 0.5–1 year of insulin use, or analysis ofshort-term use only, may preclude observing the actual dynam-ics of cancer incidence among insulin users and thus may hin-der a better understanding of the nature of the link betweendiabetes and cancer. For the first half-year of cumulative treat-ment time on insulin glargine relative to that on human insulin,we found an increased risk for colorectal and any cancer inwomen and both sexes combined, and for endometrial cancerin women. These findings suggest possible involvement ofdetection or protopathic bias [41]. The latter is more likely to
Fig. 1 RR (adjusted for age,calendar time, NIADs, duration ofinsulin-treated diabetes, country;for liver and colorectal cancers,additional adjustment for relevantco-medications) with 95% CI forsite-specific cancers and anycancer in men by cumulativetreatment time (years) on insulinglargine vs human insulin
1698 Diabetologia (2017) 60:1691–1703
affect the present study, wherein use of insulin glargine was lesscommon than that of human insulin and initiation of insulinglargine was often preceded by use of other insulins, predom-inantly human insulin. According to the current guidelines,switching from human insulin to insulin glargine should beconsidered if an individual has hypoglycaemia or fails to reachthe target glucose level [42]. Poor glycaemic control may be asign of underlying cancer and thus switching insulins becauseof highly variable blood glucose could be associated with morefrequently detected cancer.
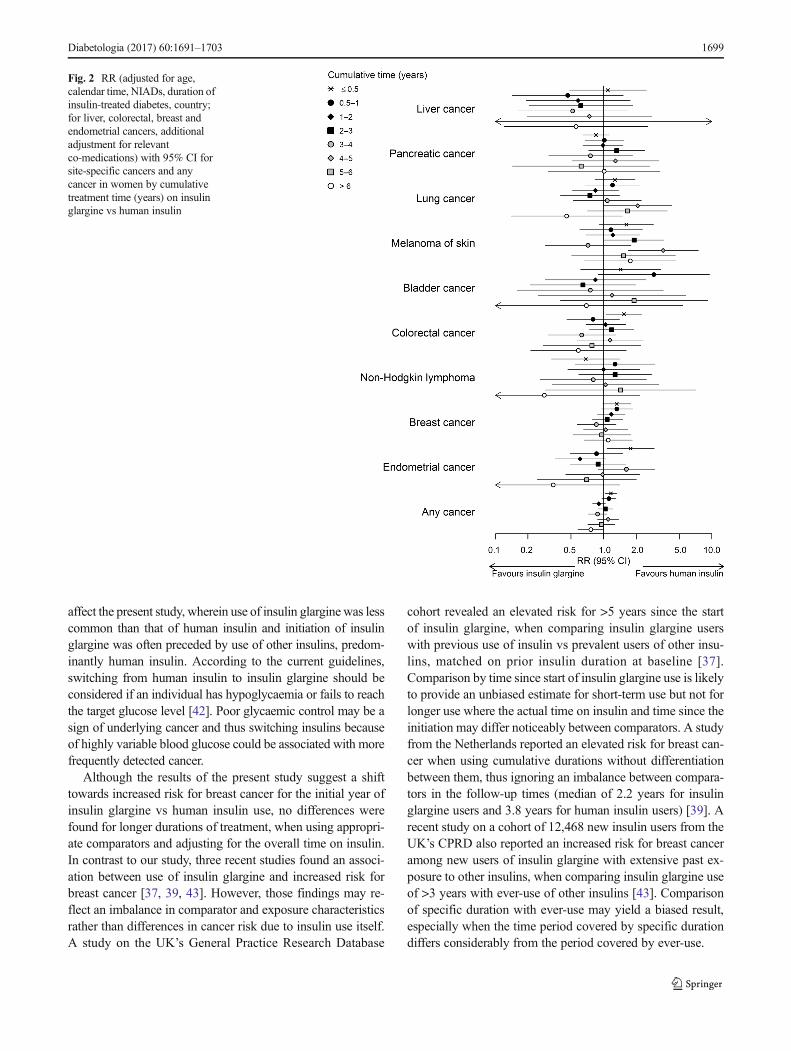
Although the results of the present study suggest a shifttowards increased risk for breast cancer for the initial year ofinsulin glargine vs human insulin use, no differences werefound for longer durations of treatment, when using appropri-ate comparators and adjusting for the overall time on insulin.In contrast to our study, three recent studies found an associ-ation between use of insulin glargine and increased risk forbreast cancer [37, 39, 43]. However, those findings may re-flect an imbalance in comparator and exposure characteristicsrather than differences in cancer risk due to insulin use itself.A study on the UK’s General Practice Research Database
cohort revealed an elevated risk for >5 years since the startof insulin glargine, when comparing insulin glargine userswith previous use of insulin vs prevalent users of other insu-lins, matched on prior insulin duration at baseline [37].Comparison by time since start of insulin glargine use is likelyto provide an unbiased estimate for short-term use but not forlonger use where the actual time on insulin and time since theinitiation may differ noticeably between comparators. A studyfrom the Netherlands reported an elevated risk for breast can-cer when using cumulative durations without differentiationbetween them, thus ignoring an imbalance between compara-tors in the follow-up times (median of 2.2 years for insulinglargine users and 3.8 years for human insulin users) [39]. Arecent study on a cohort of 12,468 new insulin users from theUK’s CPRD also reported an increased risk for breast canceramong new users of insulin glargine with extensive past ex-posure to other insulins, when comparing insulin glargine useof >3 years with ever-use of other insulins [43]. Comparisonof specific duration with ever-use may yield a biased result,especially when the time period covered by specific durationdiffers considerably from the period covered by ever-use.
Fig. 2 RR (adjusted for age,calendar time, NIADs, duration ofinsulin-treated diabetes, country;for liver, colorectal, breast andendometrial cancers, additionaladjustment for relevantco-medications) with 95% CI forsite-specific cancers and anycancer in women by cumulativetreatment time (years) on insulinglargine vs human insulin
Diabetologia (2017) 60:1691–1703 1699
When comparing longer cumulative treatment time on in-sulin glargine with time on human insulin, we found a de-creased risk for some cancers and treatment durations.However, the results for the other exposure categories showedno persistent differences even though an association betweenthe increased cancer risk and use of insulin glargine wouldhave been expected for the hypothesised effect. One possibleexplanation is that the better glycaemic control associatedwithuse of insulin glargine, rather than human insulin [44], mayplay a part. So far, the evidence from epidemiological studieson the link between cancer risk and hyperglycaemia has beenconflicting [45–48]. Similarly, increased site-specific cancerrisks among individuals with type 1 and 2 diabetes, thoughshowing a smaller excess risk for type 1 diabetes, suggest thata common diabetes-related determinant other than insulin useaffects the cancer incidence [5]. Thus, to enhance knowledgeon the interplay between diabetes and cancer, future research
should focus on the effect of long-term glycaemic controlitself, rather than different diabetes treatments.
This study has several strengths. To our knowledge, thepresent study is the first to employ a semi-aggregate levelanalysis across multiple populations from different countriesto compare the effect of different insulin treatments on cancerrisk. A semi-aggregate approach allowed us to analyse thestudy cohorts together using uniform methods. The size ofthe resulting cohort was fivefold that of the largest new-usercohort previously studied [40]. Our study had enough statisti-cal power for the assessment of both sex- and site-specificcancer outcomes by cumulative durations; this assessment isconsidered by Renehan [16] to be an essential feature of anappropriately conducted pharmaco-epidemiological study onthe link between insulin analogues and cancer risk.
Through the study design and analytical stages, we ad-dressed important limitations and mitigated typical biases
Fig. 3 RR (adjusted for age,calendar time, sex, NIADs,duration of insulin-treateddiabetes, country) with 95% CIfor any cancer: pairwisecomparisons of insulin glargine,insulin detemir and human insulinby the cumulative treatment time(years)
1700 Diabetologia (2017) 60:1691–1703
(Table 1) [15, 16, 24, 25, 49]. We adopted several other char-acteristics proposed byRenehan [16], including cohort design,use of validated data sources, exclusion of prevalent users andtime-dependent definition of exposure. Moreover, we used anactive-comparator design, which together with new-user de-sign effectively reduces time-related biases and residual con-founding [15, 25]. In addition, rather than censoring atswitching or stopping an insulin, we followed diabetic indi-viduals through the entire insulin prescribing span. The ad-vantages listed above, along with use of nationwide (Nordiccountries) and representative population-based (CPRD) co-horts, provide generalisable findings that can be directly ap-plied to real-word decision making.
Our study does, however, have some limitations, includinglack of information on important risk factors such as smoking,BMI, sedentary lifestyle, family history of cancer and diabetesduration, type, severity and comorbidities. Diabetes durationhas been associated with changes in cancer risk [4, 49] andobesity was found to contribute to the increased risk of colo-rectal cancer among individuals with type 2 diabetes [50].Studies comparing insulin glargine users with human insulinusers found little evidence of confounding by diabetes dura-tion, hospitalisations or cancer screening [40], or by BMI,smoking, income or HbA1c levels [38, 43, 51]. In addition tothe use of active comparators, which reduces residual con-founding, we accounted for the duration of insulin-treateddiabetes, which could be an effect modifier of the relationshipbetween insulin glargine use and cancer risk [37, 43], andadjusted for baseline use of non-insulin glucose-lowering ther-apy which can be considered as a proxy for one’s diabetesstage when starting insulin treatment. We also performed sen-sitivity analyses to evaluate the effect of diabetes type.
Other disadvantages include lack of information on insulindosage and the fact that exposure to non-insulin glucose-low-ering therapy was defined as baseline usage without distinc-tion between different therapies. Although we accounted forcountry-specific characteristics, we could not rule out any po-tential confounding effects resulting from the differences ininsulin user profiles between the countries. In addition, exam-ining numerous potential associations is likely to producesome false-positive results.
To summarise, the present multi-country study addressedthe clinically important question of whether some of the com-monly used insulin treatments should be preferred over othersas being safer with respect to cancer risk. We found no persis-tent differences in the risk for ten specific cancers and anycancer, when comparing use of the insulin analogues insulinglargine or insulin detemir vs human insulin. These resultsadd to the conclusive evidence on the absence of a relationshipbetween cancer incidence and use of insulin analogues atfollow-up exceeding 5 years. We see no indications to warrantwithholding of the use of the insulin analogues insulinglargine and insulin detemir.
Data availability No additional data are available.
Funding This study was funded by the European Community’sSeventh Framework Programme (FP-7) under grant agreement number282526, the CARING project, and by the Finnish Cultural Foundationgrant number 00160146. The funding sources had no role in the studydesign, data collection, data analysis, data interpretation or writing of thereport.
Duality of interest AB’s employment at the University of Helsinki wasfunded by the CARING project and Finnish Cultural Foundation. MTB’semployment at Utrecht University was funded by the CARING project.MLDB is appointed as professor in Regulatory Science, which chair isfunded by the University of Copenhagen. In addition, she is director ofthe Copenhagen Institute of Regulatory Science (CORS), based at thesame university. CORS is a cross-faculty university anchored institutioninvolving various public (Danish Medicines Agency, CopenhagenUniversity) and private stakeholders (Novo Nordisk, Lundbeck, FerringPharmaceuticals, LEO Pharma) as well as patient organisations (RareDiseases Denmark). The centre is purely devoted to the scientific aspectsof the regulatory field and with a patient-oriented focus, and the researchis not company-specific, product-specific or directly company related.
Apart from the position at the University of Copenhagen, MLDB ispart-time employed by Utrecht University as a senior researcherconducting research under the umbrella of the Utrecht–WHOCollaborating Centre for Pharmaceutical Policy and Regulation. Thiscentre receives no direct funding or donations from private parties, in-cluding the pharmaceutical industry. Research funding from public–pri-vate partnerships (e.g. Innovative Medicines Initiative [IMI]), The EscherProject (http://escher.lygature.org/) is accepted under the condition thatno company-specific product or company-related study is conducted. Thecentre has received unrestricted research funding from public sources, e.g.the WHO, the Netherlands Organisation for Health Research andDevelopment (ZonMW), the Dutch National Health Care Institute(ZIN), the EU 7th Framework Program (FP7), the Dutch MedicinesEvaluation Board (MEB), and the Dutch Ministry of Health.
MAwas employed by the Karolinska Institutet, the Research Unit ForGeneral Practice and by the University of Copenhagen supported by agrant from the Novo Nordisk Foundation (NNF15SA0018404), andparticipates/previously participated in projects funded by AstraZeneca,Pfizer, Novartis, Merck Sharp & Dohme, H. Lundbeck, Mertz andNycomed and received personal fees for leading and teachingpharmacoepidemiology courses at the Medicademy education pro-gramme, the Danish Association for the Pharmaceutical Industry. AAreceived lecture (MSD) and consulting (Epid Research Inc.) fees unrelat-ed to the submitted work. FdV conducted research coordinated by Thecentre for Research Methods, which has received unrestricted fundingfrom ZonMW, the Dutch Health Care Insurance Board (CVZ), theRoyal Dutch Pharmacists Association (KNMP), the private–public-funded Top Institute Pharma, the EU IMI, the EU FP7 and the DutchMinistry of Health and industry (including GlaxoSmithKline, Pfizer andothers). NE has served as a lecturer and on an advisory board for AstraZeneca and Merck Sharp & Dohme. JH is a Chief Science Officer andpartner in Epid Research, which provides commissioned research ser-vices to industry. All other authors declare that there is no duality ofinterest associated with their contribution to this manuscript.
Contribution statement All authors made substantial contributions tothe conception and design of the various aspects of this study or to ac-quisition, analysis or interpretation of data. All authors also contributed todrafting the article or revising it critically for important intellectual con-tent and have given final approval of the version to be published. AB isthe guarantor of this study.
Diabetologia (2017) 60:1691–1703 1701
Open Access This article is distributed under the terms of the CreativeCommons At t r ibut ion 4 .0 In te rna t ional License (h t tp : / /creativecommons.org/licenses/by/4.0/), which permits unrestricted use,distribution, and reproduction in any medium, provided you give appro-priate credit to the original author(s) and the source, provide a link to theCreative Commons license, and indicate if changes were made.
References
1. Ferlay J, Steliarova-Foucher E, Lortet-Tieulent J et al (2013) Cancerincidence and mortality patterns in Europe: estimates for 40 coun-tries in 2012. Eur J Cancer 49:1374–1403
2. International Diabetes Federation (2015) Diabetes atlas.7th edn.Available from www.diabetesatlas.org/, accessed 5 May 2017
3. Starup-Linde J, Karlstad O, Eriksen SA et al (2013) CARING(CAncer Risk and INsulin analoGues): the association of dia-betes mellitus and cancer risk with focus on possible determi-nants - a systematic review and a meta-analysis. Curr Drug Saf8:296–332
4. Harding JL, Shaw JE, Peeters A et al (2015) Cancer riskamong people with type 1 and type 2 diabetes: disentanglingtrue associations, detection bias, and reverse causation. DiabetesCare 38:264–270
5. Carstensen B, Read SH, Friis S et al (2016) Cancer incidence inpersons with type 1 diabetes: a five-country study of 9,000 cancersin type 1 diabetic individuals. Diabetologia 59:980–988
6. Giovannucci E, Harlan DM, Archer MC et al (2010) Diabetes andcancer: a consensus report. Diabetes Care 33:1674–1685
7. ColhounHM (2009) Use of insulin glargine and cancer incidence inScotland: a study from the Scottish diabetes research network epi-demiology group. Diabetologia 52:1755–1765
8. Currie CJ, Poole CD, Gale EAM (2009) The influence of glucose-lowering therapies on cancer risk in type 2 diabetes. Diabetologia52:1766–1777
9. Hemkens LG, Grouven U, Bender R et al (2009) Risk of malignan-cies in patients with diabetes treated with human insulin or insulinanalogues: a cohort study. Diabetologia 52:1732–1744
10. Jonasson JM, Ljung R, Talbäck M et al (2009) Insulin glargine useand short-term incidence of malignancies-a population-basedfollow-up study in Sweden. Diabetologia 52:1745–1754
11. Pocock SJ, Smeeth L (2009) Insulin glargine and malignancy: anunwarranted alarm. Lancet 374:511–513
12. Baricevic I, Jones DR, Roberts DL et al (2015) A framework for thein vitro evaluation of cancer-relevant molecular characteristics andmitogenic potency of insulin analogues. Carcinogenesis 36:1040–1050
13. Gale EAM (2009) Insulin glargine and cancer: another side to thestory? Lancet 374:521
14. Smith U, Gale EAM (2009) Does diabetes therapy influence therisk of cancer? Diabetologia 52:1699–1708
15. Wu JW, Filion KB, Azoulay L et al (2016) The effect of long-actinginsulin analogs on the risk of cancer: a systematic review of obser-vational studies. Diabetes Care 39:486–494
16. Renehan AG (2012) Insulin analogues and cancer risk: the emer-gence of second-generation studies. Diabetologia 55:7–9
17. Karlstad O, Starup-Linde J, Vestergaard P et al (2013) Use of insu-lin and insulin analogs and risk of cancer–systematic review andmeta-analysis of observational studies. Curr Drug Saf 8:333–348
18. Badrick E, Renehan AG (2014) Diabetes and cancer: 5 years intothe recent controversy. Eur J Cancer 50:2119–2125
19. Walker JJ, Johnson JA, Wild SH (2013) Diabetes treatments andcancer risk: the importance of considering aspects of drug exposure.Lancet Diabetes Endocrinol 1:132–139
20. Bordeleau L, Yakubovich N, Dagenais GR et al (2014) Theassociation of basal insulin glargine and/or n-3 fatty acids withincident cancers in patients with dysglycemia. Diabetes Care37:1360–1366
21. Zanders MMJ, Renehan AG, Bowker SL et al (2014) Comment onBordeleau et al. The association of basal insulin glargine and/or n-3fatty acids with incident cancers in patients with dysglycemia.Diabetes Care 37:1360–1366
22. CARING Consortium (2015) Common study protocol version 3.3.Available from www.encepp.eu/encepp/openAttachment/fullProtocolLatest/9631, accessed 21 February 2017
23. Delgado-Rodriguez M, Llorca J (2004) Bias. J EpidemiolCommunity Health 58:635–641
24. Suissa S, Azoulay L (2012) Metformin and the risk of cancer: time-related biases in observational studies. Diabetes Care 35:2665–2673
25. Yoshida K, Solomon DH, Kim SC (2015) Active-comparator de-sign and new-user design in observational studies. Nat RevRheumatol 11:437–441
26. Engholm G, Ferlay J, Christensen N et al (2010) NORDCAN—aNordic tool for cancer information, planning, quality control andresearch. Acta Oncol 49:725–736
27. Furu K, Wettermark B, Andersen M et al (2010) The Nordic coun-tries as a cohort for pharmacoepidemiological research. Basic ClinPharmacol Toxicol 106:86–94
28. Boggon R, van Staa TP, Chapman M et al (2013) Cancer recordingand mortality in the general practice research database and linkedcancer registries. Pharmacoepidemiol Drug Saf 22:168–175
29. Herrett E, Gallagher AM, Bhaskaran K et al (2015) Data resourceprofile: Clinical Practice Research Datalink (CPRD). Int JEpidemiol 44:827–836
30. WHO Collaborating Centre for Drug Statistics Methodology(2017) ATC/DDD Index 2017. Available from www.whocc.no/atc_ddd_index/, accessed 20 March 2017
31. Bazelier MT, Eriksson I, de Vries F et al (2015) Data managementand data analysis techniques in pharmacoepidemiological studiesusing a pre-planned multi-database approach: a systematic literaturereview. Pharmacoepidemiol Drug Saf 24:897–905
32. European Medicines Agency (2017). Lantus. Available from www.ema.europa.eu/ema/index.jsp?curl=pages/medicines/human/med i c i n e s / 000284 / human_med_000882 . j s p&mid=WC0b01ac058001d124, last updated on 1 Mar 2017, accessed 5May 2017
33. European Medicines Agency (2017). Levemir. Available fromwww.ema.europa.eu/ema/index.jsp?curl=pages/medicines/human/med i c i n e s / 000528 / human_med_000884 . j s p&mid=WC0b01ac058001d124, last updated on 6 Feb 2017, accessed 30Jan 2017
34. R Core Team (2015) R: a language and environment for statisticalcomputing. R Foundation for Statistical Computing, Vienna www.R-project.org
35. Carstensen B, Plummer M, Laara E, Hills M (2015) Epi: a packagefor statistical analysis in epidemiology. R package version 1.1.71.Available from http://CRAN.R-project.org/package=Epi, accessed21 February 2017
36. Gordon M, Lumley T (2017) Forestplot: advanced forest plot usinggrid graphics. R package version 1.7. Available from http://CRAN.R-project.org/package=forestplot, accessed 21 February2017
37. Suissa S, Azoulay L, Dell’Aniello S et al (2011) Long-term effectsof insulin glargine on the risk of breast cancer. Diabetologia 54:2254–2262
38. Stürmer T, Marquis MA, Zhou H et al (2013) Cancer incidenceamong those initiating insulin therapy with glargine versus humanNPH insulin. Diabetes Care 36:3517–3525
1702 Diabetologia (2017) 60:1691–1703
39. Ruiter R, Visser LE, van Herk-Sukel MPP et al (2012) Risk ofcancer in patients on insulin glargine and other insulin analoguesin comparison with those on human insulin: results from a largepopulation-based follow-up study. Diabetologia 55:51–62
40. Fagot J-P, Blotière P-O, Ricordeau P et al (2013) Does insulinglargine increase the risk of cancer compared with other basal in-sulins? Diabetes Care 36:294–301
41. Gerhard T (2008) Bias: considerations for research practice. Am JHealth Syst Pharm 65:2159–2168
42. NICE (2015) Type 2 diabetes in adults: management. Availablefrom www.nice.org.uk/guidance/ng28, accessed 1 September 2016
43. Peeters PJHL, Bazelier MT, Leufkens HGM et al (2016) Insulinglargine use and breast cancer risk: associations with cumulativeexposure. Acta Oncol 55:851–858
44. Fiesselmann A, Wiesner T, Fleischmann H, Bramlage P (2016)Real-world therapeutic benefits of patients on insulin glargine ver-sus NPH insulin. Acta Diabetol 53:717–726
45. Saydah SH, Platz EA, Rifai N et al (2003) Association of markersof insulin and glucose control with subsequent colorectal cancerrisk. Cancer Epidemiol Biomark Prev 12:412–418
46. Onitilo AA, Stankowski RV, Berg RL et al (2014) Type 2 diabetesmellitus, glycemic control, and cancer risk. Eur J Cancer Prev 23:134–140
47. Johnson JA, Bowker SL (2011) Intensive glycaemic control andcancer risk in type 2 diabetes: a meta-analysis of major trials.Diabetologia 54:25–31
48. de Beer JC, Liebenberg L (2014) Does cancer risk increase withHbA1c, independent of diabetes? Br J Cancer 110:2361–2368
49. Johnson JA, Carstensen B,Witte D et al (2012) Diabetes and cancer(1): evaluating the temporal relationship between type 2 diabetesand cancer incidence. Diabetologia 55:1607–1618
50. Peeters PJHL, BazelierMT, Leufkens HGM et al (2014) The risk ofcolorectal cancer in patients with type 2 diabetes: associations withtreatment stage and obesity. Diabetes Care 38:495–502
51. Habel LA, Danforth KN, Quesenberry CP et al (2013) Cohort studyof insulin glargine and risk of breast, prostate, and colorectal canceramong patients with diabetes. Diabetes Care 36:3953–3960
Diabetologia (2017) 60:1691–1703 1703


![GIP analogues and the treatment of obesity-diabetes...insulin dependent forms of diabetes in rodents [11]. However, recent clinical studies have identified However, recent clinical](https://img.pdfslide.us/doc/110x75/612fcf6e1ecc51586943b0bf/gip-analogues-and-the-treatment-of-obesity-diabetes-insulin-dependent-forms.jpg)