Embed Size (px)
Citation preview
Neurocomputing 56 (2004) 461–466www.elsevier.com/locate/neucom
Letters
Cancer recognition with bagged ensembles ofsupport vector machines
Giorgio Valentinia ;∗ , Marco Musellib , Francesca Ru)nocaDSI—Dipartimento di Scienze dell’Informazione, Universit�a di Milano, Milano, Italy
bIEIIT—Istituto di Elettronica e di Ingegneria dell’Informazione, e delle Telecomunicazioni,Consiglio Nazionale delle Ricerche, Genova, Italy
cISTI—Istituto di Scienze e Tecnologie dell’Informazione, Consiglio Nazionale delle Ricerche,Pisa, Italy
Abstract
Expression-based classi-cation of tumors requires stable, reliable and variance reductionmethods, as DNA microarray data are characterized by low size, high dimensionality, noise andlarge biological variability. In order to address the variance and curse of dimensionality problemsarising from this di)cult task, we propose to apply bagged ensembles of support vector machines(SVM) and feature selection algorithms to the recognition of malignant tissues. Presented resultsshow that bagged ensembles of SVMs are more reliable and achieve equal or better classi-cationaccuracy with respect to single SVMs, whereas feature selection methods can further enhanceclassi-cation accuracy.c© 2003 Elsevier B.V. All rights reserved.
Keywords: Molecular classi-cation of tumors; DNA microarray; Bagging; Support vector machines
1. Introduction
DNA microarray data provide a functional portrait of tumors, opening new perspec-tives for the classi-cation and diagnosis of malignancies at molecular level [4].Several supervised methods have been applied to the analysis of cDNA microarrays
and high-density oligonucleotide chips [5,7,9]. In particular, support vector machines(SVM) have been recently applied to the analysis of DNA microarray gene expression
∗ Corresponding author.E-mail addresses: [email protected] (G. Valentini), [email protected] (M. Muselli),
ru)[email protected] (F. Ru)no).
0925-2312/$ - see front matter c© 2003 Elsevier B.V. All rights reserved.doi:10.1016/j.neucom.2003.09.001
462 G. Valentini et al. / Neurocomputing 56 (2004) 461–466
data in order to classify normal and malignant tissues and multiple tumor types [6,10].Other approaches pointed out the importance of feature selection methods to reducethe high dimensionality of the input space [8]. In recent works, combinations of binaryclassi-ers (one-versus-all and all-pairs) and error correcting output coding (ECOC)ensembles of MLP, as well as ensemble methods based on resampling techniques,such as bagging and boosting, have been applied to the molecular classi-cation oftumors [5,10]. Indeed, variance problems arising from small samples and biologicalvariability of the data can be addressed through ensemble methods based on resamplingtechniques, while a possible way of dealing with the curse of dimensionality is oDeredby feature selection algorithms.In this work we deal with these problems, combining bagged ensembles of SVMs
and feature selection methods to enhance the accuracy and the reliability of malignancypredictions based on gene expression data.
2. Bagged ensembles of SVMs
We can represent the output of a single experiment with a DNA microarray as apair (x; y), being x∈Rd a vector containing the expression levels for d selected genesand y∈{−1;+1} a binary variable determining the classi-cation of the consideredtissue. Denote with {Tb}Bb=1 a collection of B bootstrapped samples with n elements,generated by choosing at random examples in the training set T={(xj; yj): j=1; : : : ; n}according to a uniform probability distribution. Since the elements from T are drawnwith replacement, every Tb may contain replicates. Suppose, without loss of generality,that the -rst n+ pairs of T have yj =+1, whereas the remaining n− = n− n+ possessa negative output yj =−1.Let fb :Rd → R be the discriminant functions obtained by applying the soft-margin
SVM learning algorithm [3] on the bootstrapped samples Tb:
fb(x) = b+n∑j=1
jyjK(xj; x); (1)
where the scalars j and the bias b are obtained through the solution of a quadraticprogramming problem. The symmetric function K(· ; ·) must be chosen among thekernels of reproducing Kernel Hilbert spaces [11] (e.g. a polynomial or a Gaussian).Every fb is associated with a decision functions hb :Rd → {0; 1} de-ned as hb(x)=
sign(fb(x)). In this way, a set of diDerent classi-ers (base learners) is generated, thusexploiting the diversity of the bootstrapped samples Tb. The generalization ability ofthese base learners can be improved by aggregating them through the standard majorityvoting formula (for two class classi-cation problems) [2]:
hst(x) = sign
(B∑b=1
hb(x)
): (2)
DiDerent choices of discriminant function for the bagged ensemble are possible, someof which lead to the standard decision function hst(x). The following three expressions
G. Valentini et al. / Neurocomputing 56 (2004) 461–466 463
allow also to evaluate the quality of the classi-cation oDered by the bagged ensemble:
favg(x) =1B
B∑b=1
fb(x); fwin(x) =1
|B∗|∑b∈B∗
fb(x);
fmax(x) = hst(x)maxb∈B∗
|fb(x)|; (3)
where the set B∗ = {b : hb(x) = hst(x)} contains the indices b of the base learnersthat vote for the class hst(x). Note that favg(x) is the average of the fb(x), whereasfwin(x) and fmax(x) are, respectively, the average of the discriminant functions of theclassi-ers having indices in B∗ and the signed maximum of their absolute value.
The decision functions hwin(x)=sign(fwin(x)) and hmax(x)=sign(fmax(x)) are equiv-alent to the standard choice hst(x), where each base learner receives the same weight.On the contrary, with havg(x) = sign(favg(x)) the decision of each classi-er in theensemble is weighted via its prediction strength.
3. Quality assessment of classi�ers
Besides the success rate
Succ =12n
n∑j=1
|yj + h(xj)|; (4)
which is an estimate of the generalization error, several alternative measures can beused to assess the quality and to evaluate the con-dence of the classi-cation performedby simple SVMs and bagged ensembles of SVMs.By generalizing a de-nition introduced in [7,8], a -rst choice is the extremal margin
Mext, de-ned as
Mext =� + − � −
max16j6n f(xj)−min16j6n f(xj)(5)
being � + =min16j6n+ f(xj) and � − =maxn++16j6n f(xj). It can be easily seen thatthe larger is the value of Mext, more con-dent is the classi-er. An alternative measure,less sensitive to outliers, is the median margin Mmed
Mmed =�+ − �−
max16j6n f(xj)−min16j6n f(xj); (6)
where �+ and �− are, respectively, the median value of f(x) for the positive andnegative class.
4. Numerical experiments
We applied SVM linear classi-ers to separate normal and malignant tissues withand without feature selection. Then we compared the results obtained with single and
464 G. Valentini et al. / Neurocomputing 56 (2004) 461–466
100
101
102
103
104
0.7
0.75
0.8
0.85
0.9
0.95
Number of genes
100
101
102
103
104
Number of genes
Suc
c
single svmf-avgf-win,f-max
0.15
0.2
0.25
0.3
0.35
0.4
0.45
0.5
Mm
ed
single svmf-avgf-winf-max
(a)
(b)
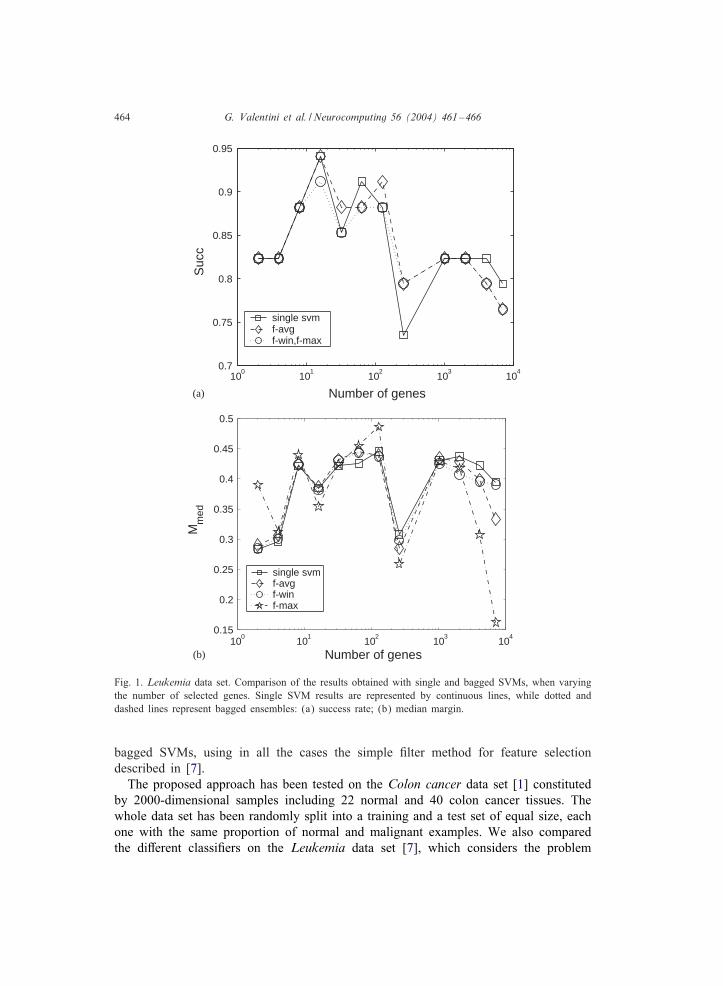
Fig. 1. Leukemia data set. Comparison of the results obtained with single and bagged SVMs, when varyingthe number of selected genes. Single SVM results are represented by continuous lines, while dotted anddashed lines represent bagged ensembles: (a) success rate; (b) median margin.
bagged SVMs, using in all the cases the simple -lter method for feature selectiondescribed in [7].The proposed approach has been tested on the Colon cancer data set [1] constituted
by 2000-dimensional samples including 22 normal and 40 colon cancer tissues. Thewhole data set has been randomly split into a training and a test set of equal size, eachone with the same proportion of normal and malignant examples. We also comparedthe diDerent classi-ers on the Leukemia data set [7], which considers the problem
G. Valentini et al. / Neurocomputing 56 (2004) 461–466 465
100
101
102
103
104
0.76
0.78
0.8
0.82
0.84
0.86
0.88
Number of genes
Suc
c
single svmf-avgf-win,f-max
100
101
102
103
104
0.2
0.25
0.3
0.35
0.4
0.45
0.5
0.55
0.6
0.65
Number of genes
Mm
ed
single svmf-avgf-winf-max
(a)
(b)
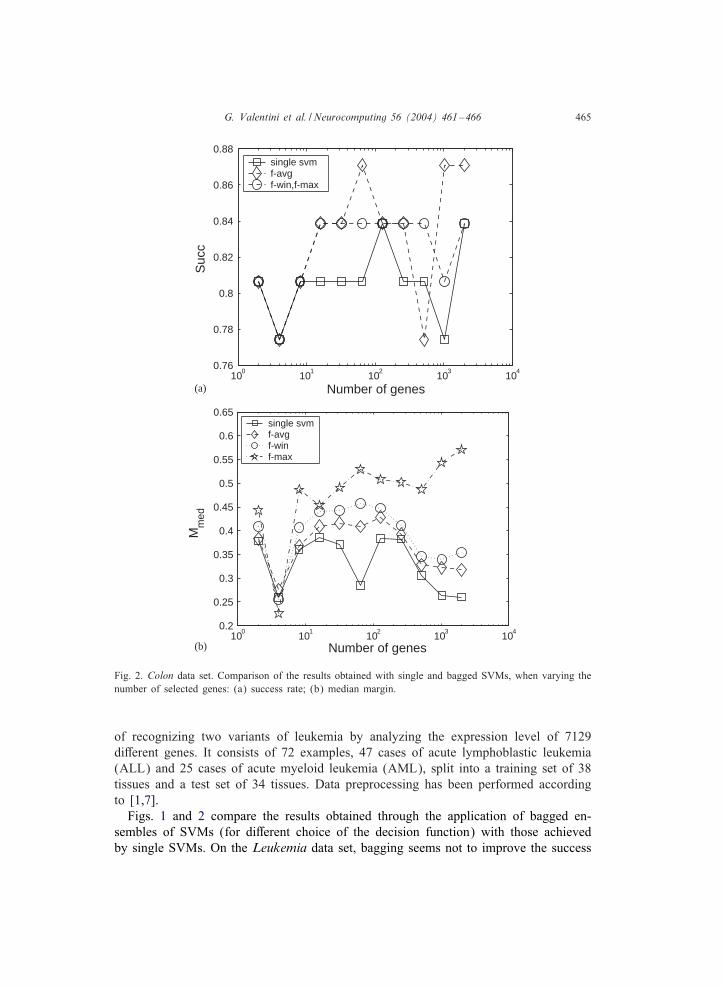
Fig. 2. Colon data set. Comparison of the results obtained with single and bagged SVMs, when varying thenumber of selected genes: (a) success rate; (b) median margin.
of recognizing two variants of leukemia by analyzing the expression level of 7129diDerent genes. It consists of 72 examples, 47 cases of acute lymphoblastic leukemia(ALL) and 25 cases of acute myeloid leukemia (AML), split into a training set of 38tissues and a test set of 34 tissues. Data preprocessing has been performed accordingto [1,7].Figs. 1 and 2 compare the results obtained through the application of bagged en-
sembles of SVMs (for diDerent choice of the decision function) with those achievedby single SVMs. On the Leukemia data set, bagging seems not to improve the success
466 G. Valentini et al. / Neurocomputing 56 (2004) 461–466
rate, even if the predictions are more reliable, especially when a small number of se-lected genes is used (Figs. 1a and b). On the contrary, bagging improves the successrate scored on the Colon data set, both with and without feature selection, in particularif the favg discriminant function is used (Fig. 2a).
Bagged ensembles show clearly larger median margins with respect to single SVMs,con-rming a better overall reliability (Figs. 1b and 2b). Similar results are obtainedwith respect to the maximal margin (data not shown), both with the Leukemia and theColon data set; however, in Colon we observe an opposite behavior if the number ofconsidered genes is relatively large.The results show that bagged ensembles of SVMs are more reliable than single
SVMs in classifying DNA microarray data. Moreover, they obtain an equivalent or abetter accuracy, at least with Colon and Leukemia data sets. Anyway, it is di)cultto establish if a statistically signi-cant diDerence between the two approaches doesexist, given the small size of the available samples. Our results show also that geneselection not always can enhance the recognition rate of tumoral samples: according to[8], it plays a signi-cant role in separating AML from ALL, while, with the Colon dataset, bagging, rather than feature selection, improves the accuracy and the reliability ofSVMs.
References
[1] U. Alon, et al., Broad patterns of gene expressions revealed by clustering analysis of tumor and normalcolon tissues probed by oligonucleotide arrays, Proc. Natl. Acad. Sci. USA 96 (1999) 6745–6750.
[2] L. Breiman, Bagging predictors, Mach. Learning 24 (2) (1996) 123–140.[3] C. Campbell, Kernel methods: a survey of current techniques, Neurocomputing 48 (2002) 63–84.[4] C.H. Chung, P.S. Bernard, C.M. Perou, Molecular portraits and the family tree of cancer, Nat. Genet.
32 (2002) 533–540.[5] S. Dudoit, J. Fridlyand, T. Speed, Comparison of discrimination methods for the classi-cation of tumors
using gene expression data, J. Am. Stat. Assoc. 97 (457) (2002) 77–87.[6] T.S. Furey, et al., Support vector machine classi-cation and validation of cancer tissue samples using
microarray expression data, Bioinformatics 16 (10) (2000) 906–914.[7] T.R. Golub, et al., Molecular classi-cation of cancer: class discovery and class prediction by gene
expression monitoring, Science 286 (1999) 531–537.[8] I. Guyon, J. Weston, S. Barnhill, V. Vapnik, Gene selection for cancer classi-cation using support
vector machines, Mach. Learning 46 (2002) 389–422.[9] J. Khan, et al., Classi-cation and diagnostic prediction of cancers using gene expression pro-ling and
arti-cial neural networks, Nat. Med. 7 (6) (2001) 673–679.[10] G. Valentini, Gene expression data analysis of human lymphoma using support vector machines and
output coding ensembles, Artif. Intell. Med. 26 (3) (2002) 283–306.[11] G. Wahba, Spline models for observational data, in: Regional Conference Series in Applied Mathematics,
Vol. 59, SIAM, Philadelphia, USA, 1990.