Embed Size (px)
Citation preview
1
Cancer immunotherapy is accompanied by distinct metabolic patterns in primary and secondary lymphoid organs observed by non-invasive in vivo 18F-
FDG-PET Johannes Schwenck1,2,3*, Barbara Schörg2*, Francesco Fiz1,4, Dominik Sonanini2,5, Andrea Forschner6, Thomas Eigentler6, Benjamin Weide6, Manuela Martella7, Irene Gonzalez-Menendez3,7, Cristina Campi8, Gianmario Sambuceti9, Ferdinand Seith10, Leticia Quintanilla-Martinez3,7, Claus Garbe6, Christina Pfannenberg10, Martin Röcken3,6,11, Christian la Fougere1,3,11, Bernd J Pichler2,3,11, Manfred Kneilling2,3,6$ 1 Department of Nuclear Medicine and Clinical Molecular Imaging, Eberhard Karls University, 72076
Tübingen, Germany 2 Werner Siemens Imaging Center, Department of Preclinical Imaging and Radiopharmacy, Eberhard Karls University, 72076 Tübingen, Germany
3 Cluster of Excellence iFIT (EXC 2180) "Image-Guided and Functionally Instructed Tumor Therapies", Eberhard Karls University, 72076 Tübingen, Germany
4 Department of Internal Medicine, University of Genoa, Italy
5 Department of Internal Medicine II, Eberhard Karls University, 72076 Tübingen, Germany
6 Department of Dermatology, Eberhard Karls University, 72076 Tübingen, Germany
7 Institute of Pathology and Neuropathology and Comprehensive Cancer Center Tübingen, Eberhard
Karls University, 72076 Tübingen, Germany 8 Department of Mathematics "Tullio Levi-Civita", University of Padua, Italy
9 Nuclear Medicine Unit, Department of Health Sciences, University of Genoa, Italy
10 Department of Diagnostic and Interventional Radiology, Eberhard Karls University,
72076 Tübingen, Germany 11
German Cancer Consortium (DKTK), German Cancer Research Center (DKFZ) Partner Site Tübingen, 72076 Tübingen, Germany
* Contributed equally
$ Corresponding author email: [email protected] telephone: +49-7071-29-83427 fax: +49-7071-29-4451
Short title: Metabolic patterns in immunotherapy responders
2
Supplementary Materials and Methods
Generation of tumor antigen-specific Th1 (Tag2-Th1) cells
Tumor antigen-specific Th1 cells were generated as previously described [1]. Briefly,
CD4+ T cells were isolated from the spleens and lymph nodes of transgenic Tag2-
TCR mice and separated via magnetic-activated cell sorting (MACS) according to
the manufacturer’s protocol (Milteny Biotec GmbH, Bergisch Gladbach, Germany).
The cells were co-cultivated together with irradiated (30 Gy) antigen presenting cells,
CPG oligonucleotide (ODN1668; Eurofins Genomics Germany GmbH, Ebersberg,
Germany), anti-IL-4 mAbs (EMC Microcollections GmbH).
Immunotherapy in RIP1-Tag2 mice
The first cohort of ten- to eleven-week-old RIP1-Tag2 mice (n=5 per treatment
group) with advanced insular cell carcinomas was treated according to the treatment
scheme in Fig. 1A. Briefly, combo-treated mice received weekly injections (i.p.) of
1x10⁶ Tag2-Th1 cells followed by anti-PD-L1 plus anti-LAG-3 mAbs (first injection:
500 µg/mAb, following: 200 µg/mAb; BioXcell, NH, USA) 24 h after whole-body
radiation (2 Gy). Control mice received either isotype-matched IgG (Iso) mAbs
(BioXcell, NH, USA) and/or PBS instead of T cells. (CIT: mAbs+PBS, Th1:
Iso+Tag2-Th1, sham: Iso+PBS).
A second cohort of 10- to 11-week-old RIP1-Tag2 mice mimicked the clinical
conditions and exclusively received anti-PD-L1 and anti-LAG-3 mAbs (i.p.),
importantly without the initial 2 Gy whole-body radiation (CIT, n=8) (Fig. 2A). Sham-
treated mice received Iso mAb-injections twice weekly (i.p.; n=8).
3
Supplementary Discussion
Although a nonessential organ, the spleen has important functions as a reservoir
and as a site of priming and proliferation for lymphocytes [2]. Additionally, the spleen
is involved in the induction of immune tolerance as well as in the removal of aged or
dysfunctional blood cells [2, 3]. Undoubtedly, the spleen is involved in the response
to systemic inflammatory stimuli, such as lipopolysaccharides or RNA vaccinations,
which is observable by the enhanced splenic 18F-FDG-PET uptake [4, 5]. In the
endogenous insular cell carcinoma model, we observed an elevated 18F-FDG tracer
uptake in the spleen in response to PD-L1 mAbs and LAG-3 mAbs with or without
Tag2-Th1 cells, which reflects the enhanced glucose metabolism (Fig. 1C, D and
2C, D). In addition, we observed a trend towards some patients with metastatic
melanoma having increased splenic glucose metabolism in response to CIT, but no
significant differences were found between responders and non-responders (Fig.
3D). The spleen is important for the immune tolerance of tumors as splenic myeloid-
derived suppressor cells (MDSCs) play a major role in suppressing the antitumoral
immune responses [3, 6]. However, little is known about how the spleen is involved
in overcoming immune tolerance by cancer immune therapy. Zhuang et al. revealed
an increase in the number of splenic effector memory T cells by applying an effective
combination therapy that consisted of local radiotherapy, intra-tumoral
cytosine‐phosphorothioate‐guanine, and systemic PD-1 mAb administration in an
experimental lung cancer model [7]. The activation of T cells requires sufficient
glucose uptake via GLUT1, which can be measured by 18F-FDG-PET uptake [8-12].
Using 18F-labeled 2'-deoxycytidine, Radu et al. revealed significant uptake in the
spleen and lymph nodes as a consequence of an anti-tumoral immune response
[13].
4
Supplementary References
1. Braumuller H, Wieder T, Brenner E, Assmann S, Hahn M, Alkhaled M, et al. T-helper-1-cell cytokines drive cancer into senescence. Nature. 2013; 494: 361-5. 2. Bronte V, Pittet MJ. The spleen in local and systemic regulation of immunity. Immunity. 2013; 39: 806-18. 3. Ugel S, Peranzoni E, Desantis G, Chioda M, Walter S, Weinschenk T, et al. Immune tolerance to tumor antigens occurs in a specialized environment of the spleen. Cell Rep. 2012; 2: 628-39. 4. Pektor S, Hilscher L, Walzer KC, Miederer I, Bausbacher N, Loquai C, et al. In vivo imaging of the immune response upon systemic RNA cancer vaccination by FDG-PET. EJNMMI Res. 2018; 8: 80. 5. Pektor S, Bausbacher N, Otto G, Lawaczeck L, Grabbe S, Schreckenberger M, et al. Toll like receptor mediated immune stimulation can be visualized in vivo by [(18)F]FDG-PET. Nucl Med Biol. 2016; 43: 651-60. 6. Li B, Zhang S, Huang N, Chen H, Wang P, Li J, et al. Dynamics of the spleen and its significance in a murine H22 orthotopic hepatoma model. Exp Biol Med (Maywood). 2016; 241: 863-72. 7. Zhuang Y, Li S, Wang H, Pi J, Xing Y, Li G. PD-1 blockade enhances radio-immunotherapy efficacy in murine tumor models. J Cancer Res Clin Oncol. 2018; 144: 1909-20. 8. Wofford JA, Wieman HL, Jacobs SR, Zhao Y, Rathmell JC. IL-7 promotes Glut1 trafficking and glucose uptake via STAT5-mediated activation of Akt to support T-cell survival. Blood. 2008; 111: 2101-11. 9. Cammann C, Rath A, Reichl U, Lingel H, Brunner-Weinzierl M, Simeoni L, et al. Early changes in the metabolic profile of activated CD8(+) T cells. BMC Cell Biol. 2016; 17: 28. 10. Saucillo DC, Gerriets VA, Sheng J, Rathmell JC, Maciver NJ. Leptin metabolically licenses T cells for activation to link nutrition and immunity. J Immunol. 2014; 192: 136-44. 11. Jacobs SR, Herman CE, Maciver NJ, Wofford JA, Wieman HL, Hammen JJ, et al. Glucose uptake is limiting in T cell activation and requires CD28-mediated Akt-dependent and independent pathways. J Immunol. 2008; 180: 4476-86. 12. Cretenet G, Clerc I, Matias M, Loisel S, Craveiro M, Oburoglu L, et al. Cell surface Glut1 levels distinguish human CD4 and CD8 T lymphocyte subsets with distinct effector functions. Sci Rep. 2016; 6: 24129. 13. Radu CG, Shu CJ, Nair-Gill E, Shelly SM, Barrio JR, Satyamurthy N, et al. Molecular imaging of lymphoid organs and immune activation by positron emission tomography with a new [18F]-labeled 2'-deoxycytidine analog. Nat Med. 2008; 14: 783-8.
5
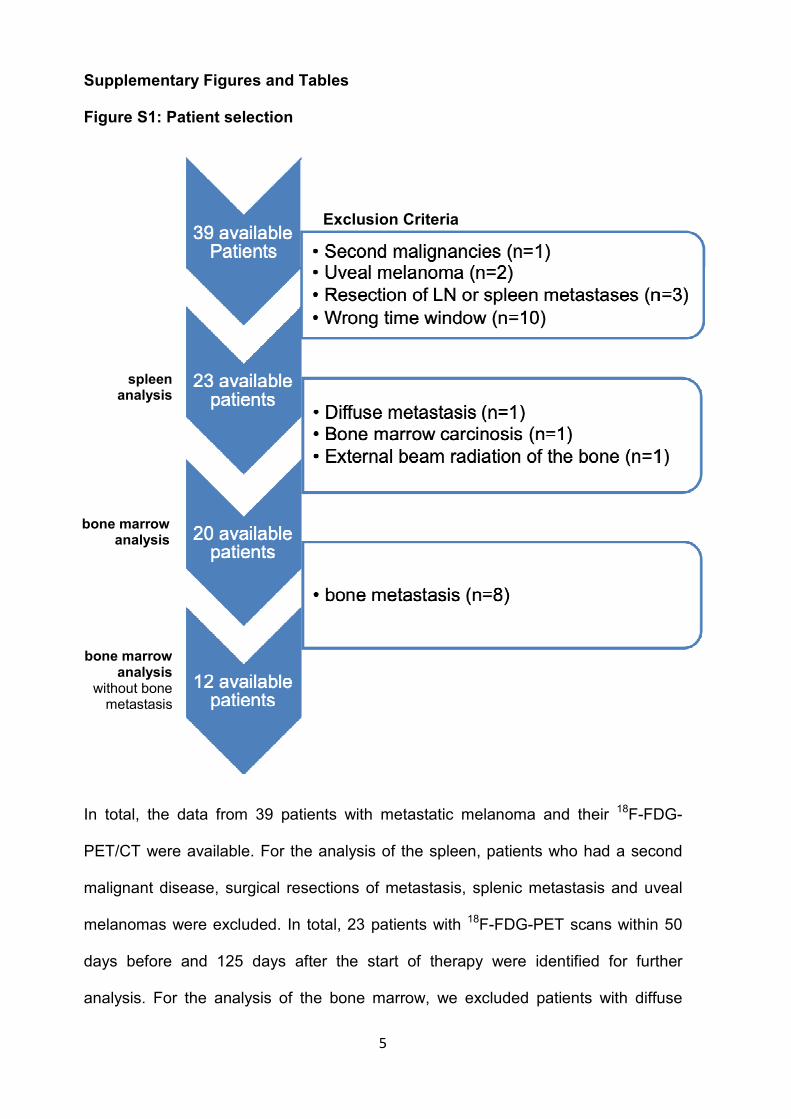
Supplementary Figures and Tables
Figure S1: Patient selection
In total, the data from 39 patients with metastatic melanoma and their 18F-FDG-
PET/CT were available. For the analysis of the spleen, patients who had a second
malignant disease, surgical resections of metastasis, splenic metastasis and uveal
melanomas were excluded. In total, 23 patients with 18F-FDG-PET scans within 50
days before and 125 days after the start of therapy were identified for further
analysis. For the analysis of the bone marrow, we excluded patients with diffuse
spleen analysis
bone marrow analysis
Exclusion Criteria
bone marrow analysis
without bone metastasis

6
bone metastases, bone marrow carcinosis and previous external beam radiation
therapy on bone marrow regions from the analysis of the bone marrow.
7
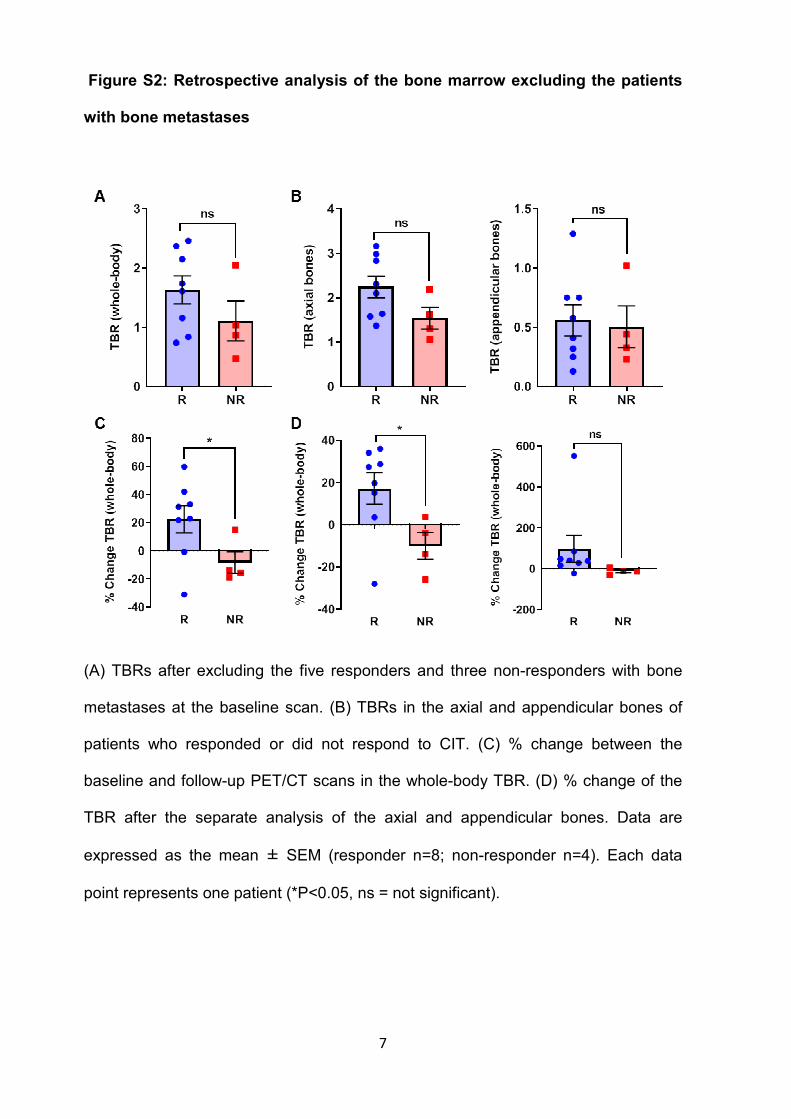
Figure S2: Retrospective analysis of the bone marrow excluding the patients
with bone metastases
(A) TBRs after excluding the five responders and three non-responders with bone
metastases at the baseline scan. (B) TBRs in the axial and appendicular bones of
patients who responded or did not respond to CIT. (C) % change between the
baseline and follow-up PET/CT scans in the whole-body TBR. (D) % change of the
TBR after the separate analysis of the axial and appendicular bones. Data are
expressed as the mean ± SEM (responder n=8; non-responder n=4). Each data
point represents one patient (*P<0.05, ns = not significant).
8
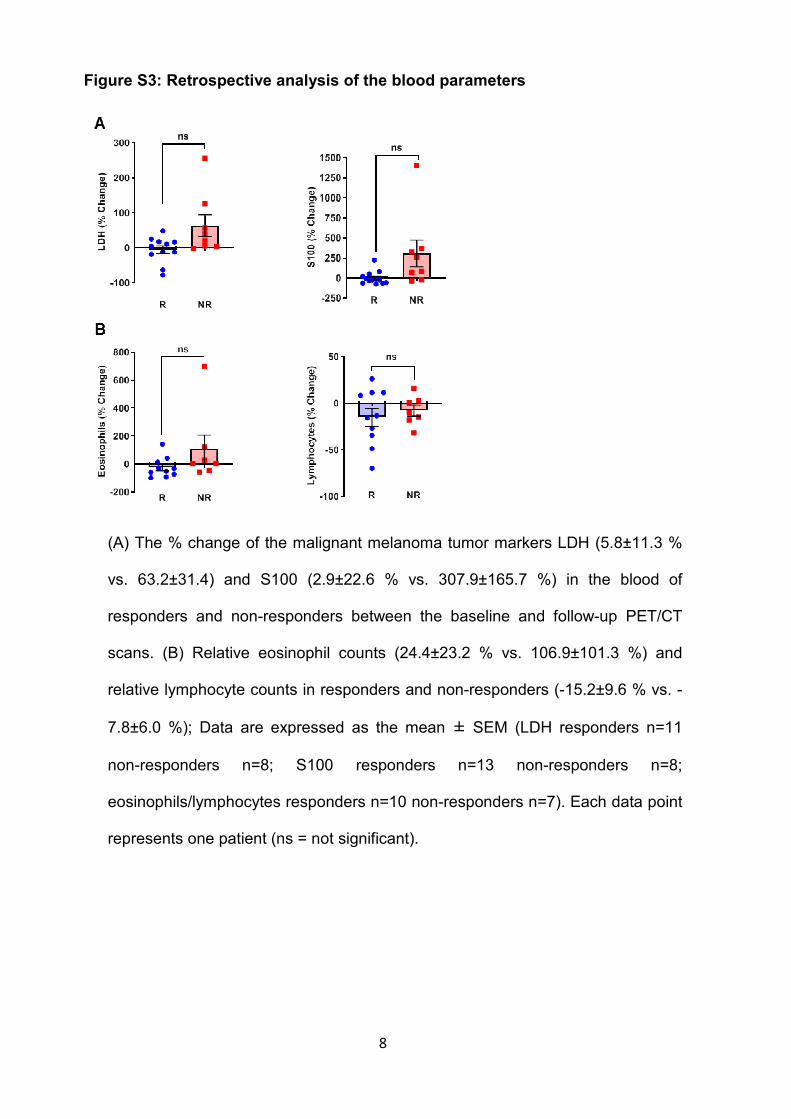
Figure S3: Retrospective analysis of the blood parameters
(A) The % change of the malignant melanoma tumor markers LDH (5.8±11.3 %
vs. 63.2±31.4) and S100 (2.9±22.6 % vs. 307.9±165.7 %) in the blood of
responders and non-responders between the baseline and follow-up PET/CT
scans. (B) Relative eosinophil counts (24.4±23.2 % vs. 106.9±101.3 %) and
relative lymphocyte counts in responders and non-responders (-15.2±9.6 % vs. -
7.8±6.0 %); Data are expressed as the mean ± SEM (LDH responders n=11
non-responders n=8; S100 responders n=13 non-responders n=8;
eosinophils/lymphocytes responders n=10 non-responders n=7). Each data point
represents one patient (ns = not significant).
9
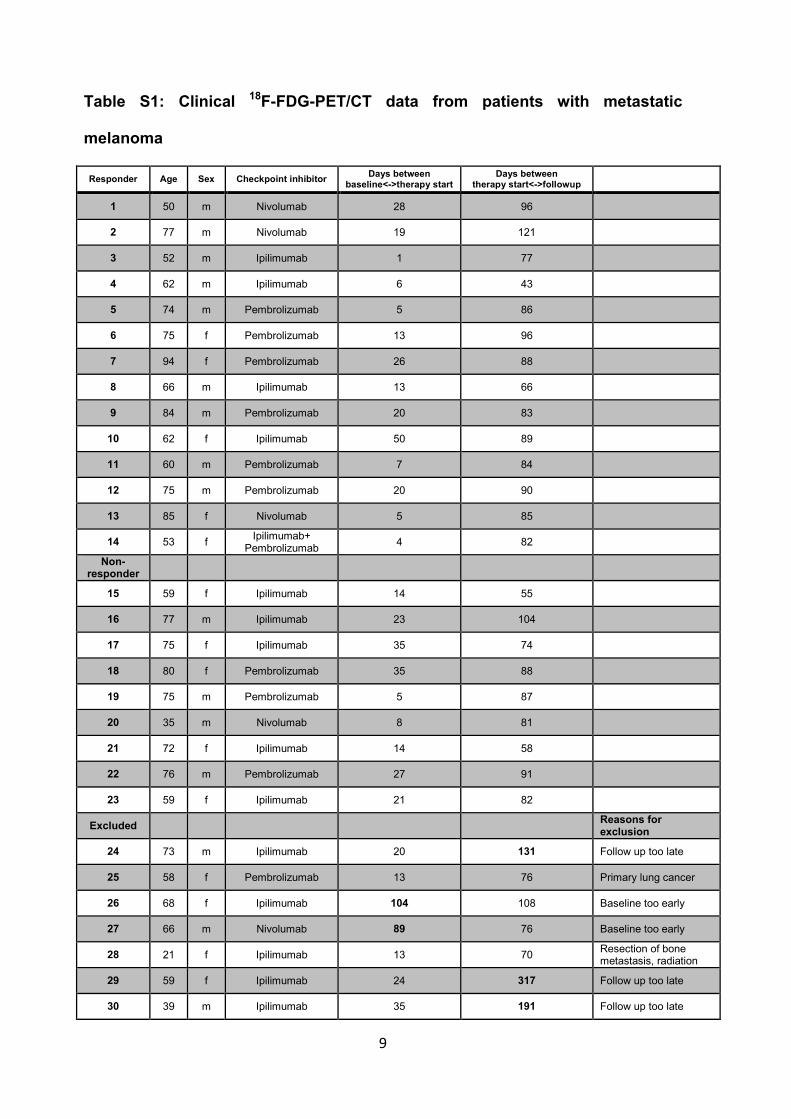
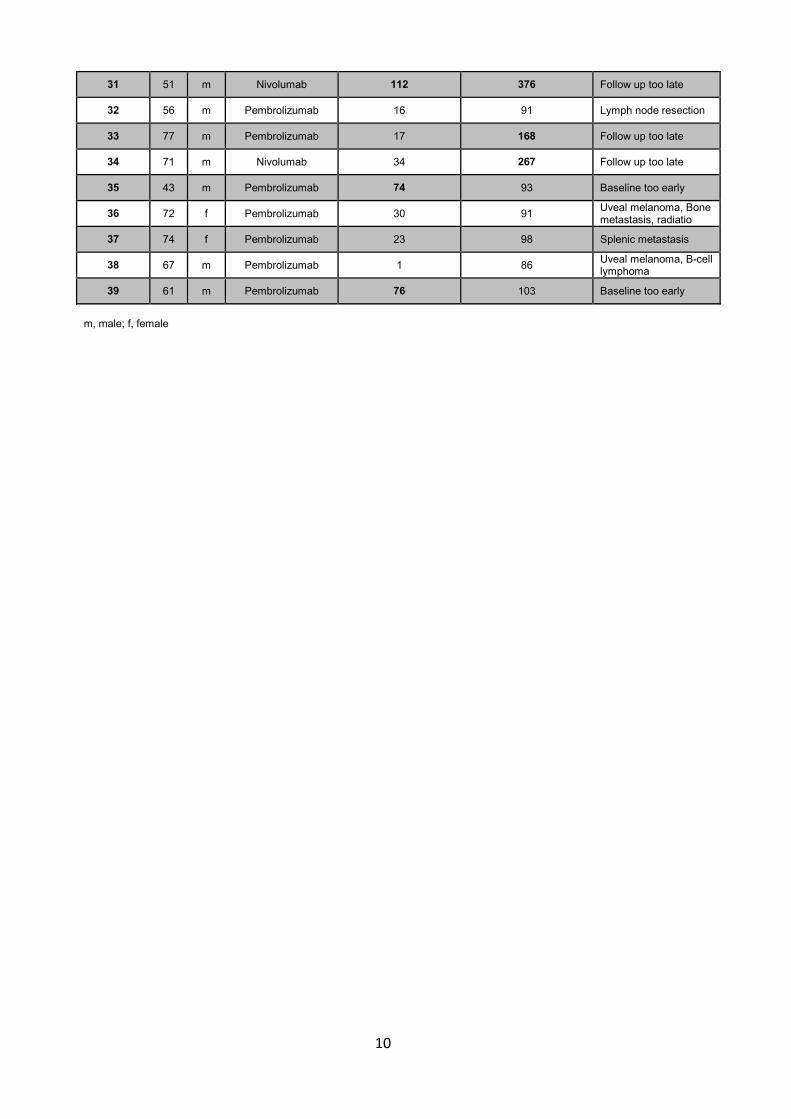
Table S1: Clinical 18F-FDG-PET/CT data from patients with metastatic
melanoma
Responder Age Sex Checkpoint inhibitor Days between
baseline<->therapy start Days between
therapy start<->followup
1 50 m Nivolumab 28 96
2 77 m Nivolumab 19 121
3 52 m Ipilimumab 1 77
4 62 m Ipilimumab 6 43
5 74 m Pembrolizumab 5 86
6 75 f Pembrolizumab 13 96
7 94 f Pembrolizumab 26 88
8 66 m Ipilimumab 13 66
9 84 m Pembrolizumab 20 83
10 62 f Ipilimumab 50 89
11 60 m Pembrolizumab 7 84
12 75 m Pembrolizumab 20 90
13 85 f Nivolumab 5 85
14 53 f Ipilimumab+
Pembrolizumab 4 82
Non-responder
15 59 f Ipilimumab 14 55
16 77 m Ipilimumab 23 104
17 75 f Ipilimumab 35 74
18 80 f Pembrolizumab 35 88
19 75 m Pembrolizumab 5 87
20 35 m Nivolumab 8 81
21 72 f Ipilimumab 14 58
22 76 m Pembrolizumab 27 91
23 59 f Ipilimumab 21 82
Excluded
Reasons for exclusion
24 73 m Ipilimumab 20 131 Follow up too late
25 58 f Pembrolizumab 13 76 Primary lung cancer
26 68 f Ipilimumab 104 108 Baseline too early
27 66 m Nivolumab 89 76 Baseline too early
28 21 f Ipilimumab 13 70 Resection of bone metastasis, radiation
29 59 f Ipilimumab 24 317 Follow up too late
30 39 m Ipilimumab 35 191 Follow up too late
10
31 51 m Nivolumab 112 376 Follow up too late
32 56 m Pembrolizumab 16 91 Lymph node resection
33 77 m Pembrolizumab 17 168 Follow up too late
34 71 m Nivolumab 34 267 Follow up too late
35 43 m Pembrolizumab 74 93 Baseline too early
36 72 f Pembrolizumab 30 91 Uveal melanoma, Bone metastasis, radiatio
37 74 f Pembrolizumab 23 98 Splenic metastasis
38 67 m Pembrolizumab 1 86 Uveal melanoma, B-cell lymphoma
39 61 m Pembrolizumab 76 103 Baseline too early
m, male; f, female
11
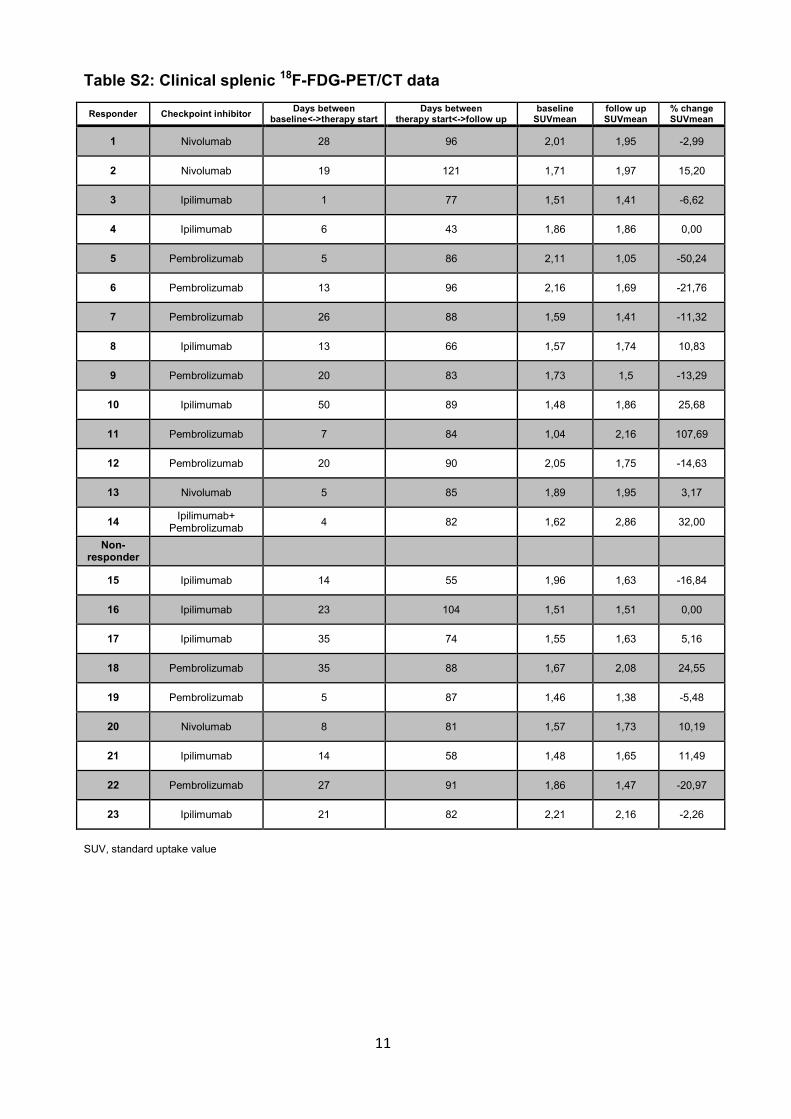
Table S2: Clinical splenic 18F-FDG-PET/CT data
SUV, standard uptake value
Responder Checkpoint inhibitor Days between
baseline<->therapy start Days between
therapy start<->follow up baseline
SUVmean follow up SUVmean
% change SUVmean
1 Nivolumab 28 96 2,01 1,95 -2,99
2 Nivolumab 19 121 1,71 1,97 15,20
3 Ipilimumab 1 77 1,51 1,41 -6,62
4 Ipilimumab 6 43 1,86 1,86 0,00
5 Pembrolizumab 5 86 2,11 1,05 -50,24
6 Pembrolizumab 13 96 2,16 1,69 -21,76
7 Pembrolizumab 26 88 1,59 1,41 -11,32
8 Ipilimumab 13 66 1,57 1,74 10,83
9 Pembrolizumab 20 83 1,73 1,5 -13,29
10 Ipilimumab 50 89 1,48 1,86 25,68
11 Pembrolizumab 7 84 1,04 2,16 107,69
12 Pembrolizumab 20 90 2,05 1,75 -14,63
13 Nivolumab 5 85 1,89 1,95 3,17
14 Ipilimumab+
Pembrolizumab 4 82 1,62 2,86 32,00
Non-responder
15 Ipilimumab 14 55 1,96 1,63 -16,84
16 Ipilimumab 23 104 1,51 1,51 0,00
17 Ipilimumab 35 74 1,55 1,63 5,16
18 Pembrolizumab 35 88 1,67 2,08 24,55
19 Pembrolizumab 5 87 1,46 1,38 -5,48
20 Nivolumab 8 81 1,57 1,73 10,19
21 Ipilimumab 14 58 1,48 1,65 11,49
22 Pembrolizumab 27 91 1,86 1,47 -20,97
23 Ipilimumab 21 82 2,21 2,16 -2,26
12
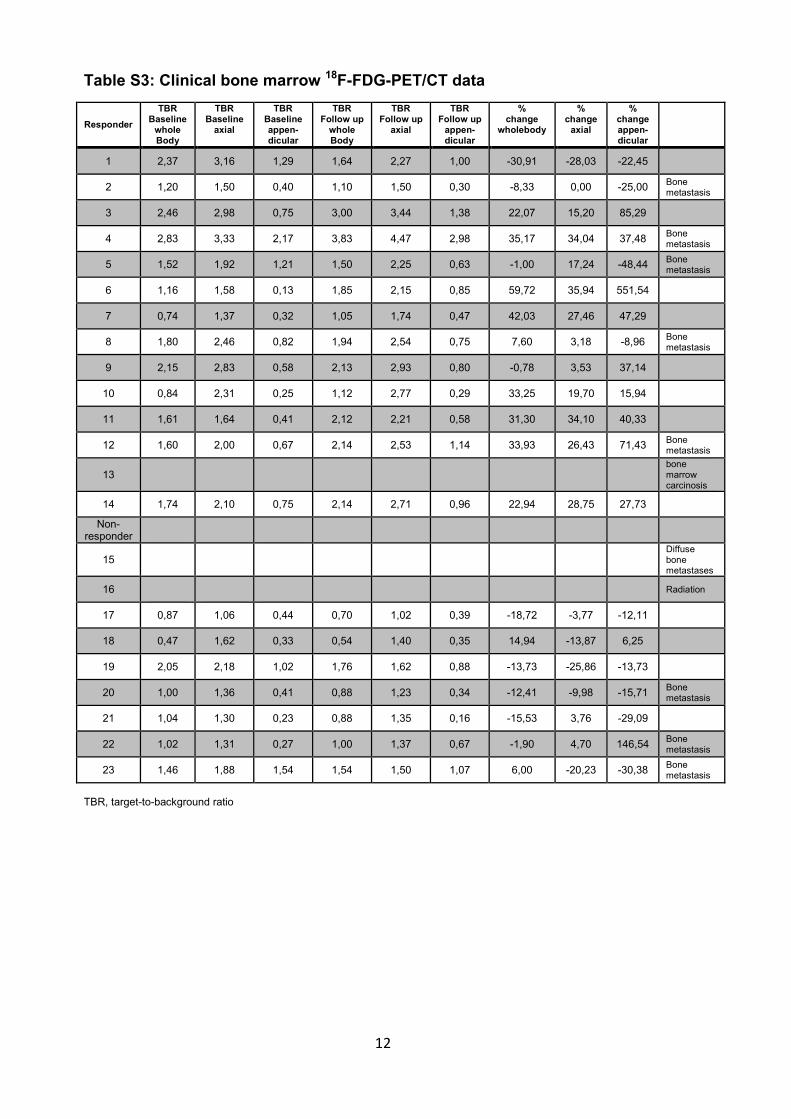
Table S3: Clinical bone marrow 18F-FDG-PET/CT data
TBR, target-to-background ratio
Responder
TBR Baseline
whole Body
TBR Baseline
axial
TBR Baseline appen-dicular
TBR Follow up
whole Body
TBR Follow up
axial
TBR Follow up
appen-dicular
% change
wholebody
% change
axial
% change appen-dicular
1 2,37 3,16 1,29 1,64 2,27 1,00 -30,91 -28,03 -22,45
2 1,20 1,50 0,40 1,10 1,50 0,30 -8,33 0,00 -25,00 Bone metastasis
3 2,46 2,98 0,75 3,00 3,44 1,38 22,07 15,20 85,29
4 2,83 3,33 2,17 3,83 4,47 2,98 35,17 34,04 37,48 Bone metastasis
5 1,52 1,92 1,21 1,50 2,25 0,63 -1,00 17,24 -48,44 Bone metastasis
6 1,16 1,58 0,13 1,85 2,15 0,85 59,72 35,94 551,54
7 0,74 1,37 0,32 1,05 1,74 0,47 42,03 27,46 47,29
8 1,80 2,46 0,82 1,94 2,54 0,75 7,60 3,18 -8,96 Bone metastasis
9 2,15 2,83 0,58 2,13 2,93 0,80 -0,78 3,53 37,14
10 0,84 2,31 0,25 1,12 2,77 0,29 33,25 19,70 15,94
11 1,61 1,64 0,41 2,12 2,21 0,58 31,30 34,10 40,33
12 1,60 2,00 0,67 2,14 2,53 1,14 33,93 26,43 71,43 Bone metastasis
13
bone marrow carcinosis
14 1,74 2,10 0,75 2,14 2,71 0,96 22,94 28,75 27,73
Non-responder
15
Diffuse bone metastases
16
Radiation
17 0,87 1,06 0,44 0,70 1,02 0,39 -18,72 -3,77 -12,11
18 0,47 1,62 0,33 0,54 1,40 0,35 14,94 -13,87 6,25
19 2,05 2,18 1,02 1,76 1,62 0,88 -13,73 -25,86 -13,73
20 1,00 1,36 0,41 0,88 1,23 0,34 -12,41 -9,98 -15,71 Bone metastasis
21 1,04 1,30 0,23 0,88 1,35 0,16 -15,53 3,76 -29,09
22 1,02 1,31 0,27 1,00 1,37 0,67 -1,90 4,70 146,54 Bone metastasis
23 1,46 1,88 1,54 1,54 1,50 1,07 6,00 -20,23 -30,38 Bone metastasis