Embed Size (px)
Citation preview
Cancer Care: Chart Set
www.oecd.org/health/health-systems/cancer-care.htm
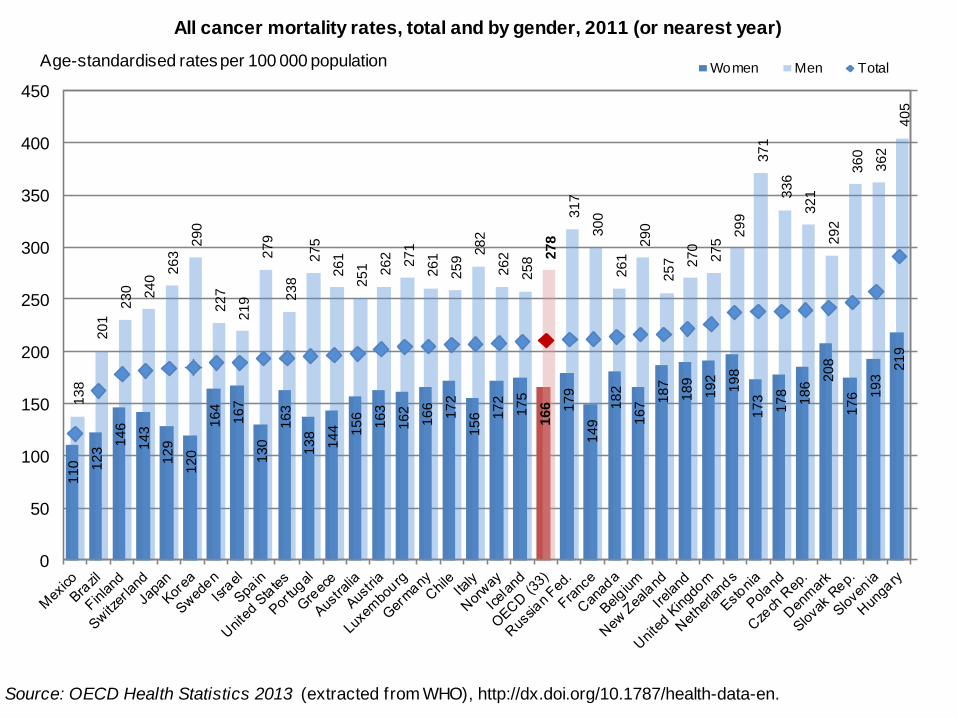
Source: OECD Health Statistics 2013 (extracted from WHO), http://dx.doi.org/10.1787/health-data-en.
All cancer mortality rates, total and by gender, 2011 (or nearest year)
110 123
146
143
129
120
164
167
130
163
13
8
144 15
6
163
162
166
172
15
6 172
175
16
6 17
9
149
18
2
167 1
87
189
192
19
8
173
17
8
186
208
176 1
93
219
138
201
23
0 240
263
290
227
219
279
238
27
5
261
25
1 262
271
261
259
282
262
258 2
78
31
7
300
261
290
257 270
27
5
29
9
371
33
6
321
292
36
0
36
2
40
5
0
50
100
150
200
250
300
350
400
450
Women Men TotalAge-standardised rates per 100 000 population
Source: OECD Health Statistics 2013 (extracted from WHO), http://dx.doi.org/10.1787/health-data-en.
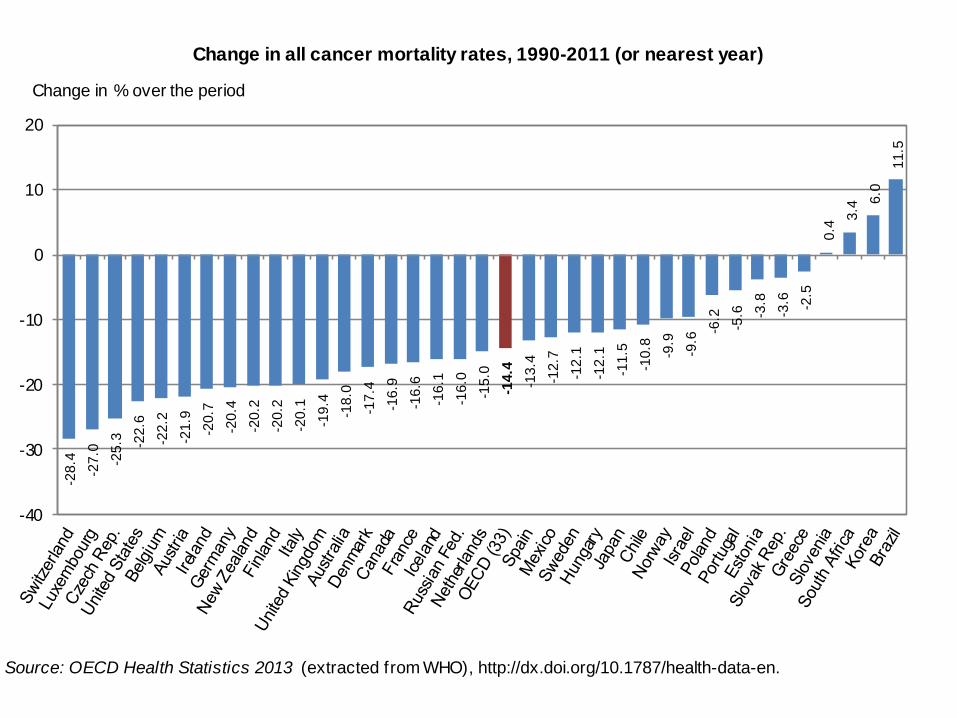
Change in all cancer mortality rates, 1990-2011 (or nearest year)-2
8.4
-27.0
-25.3 -2
2.6
-22.2
-21.9
-20.7
-20
.4
-20
.2
-20
.2
-20
.1
-19
.4
-18
.0
-17
.4
-16
.9
-16
.6
-16
.1
-16.0
-15.0
-14.4
-13.4
-12.7
-12.1
-12.1
-11
.5
-10
.8
-9.9
-9.6
-6.2
-5.6 -3
.8
-3.6 -2.5
0.4
3.4
6.0
11.5
-40
-30
-20
-10
0
10
20
Change in % over the period

1. Programme. 2. Survey. * Three-year average.
Mammography screening in women aged 50- 69,
2001 to 2011 (or nearest year)
Source: OECD Health Statistics 2013 ,
http://dx.doi.org/10.1787/health-data-en.
9.4
16.0
17.4
27.3
36.4
44.8
47.4
49.5
51.0
52.7
53.5
54.3
55.0
57.1
58.9
59.6
59.7
60.2
61.0
61.5
71.0
72.2
72.2
72.6
72.6
72.8
72.9
73.6
73.7
77.1
80.2
80.4
82.1
85.5
9.1
22.5
37.0
25.7
38.1
56.9
24.8
9.3
59.0
61.7
55.8
50.0
53.3
62.6
72.7
76.3
77.6
75.3
84.8
80.4
87.4
0 25 50 75 100
Chile ¹Slovak Rep. ¹
Mexico ¹Turkey ¹Japan 2
Switzerland ²Hungary ¹Greece ²Estonia ¹
Czech Rep. ¹France ¹
Germany ¹Australia ¹
Poland ²Korea ¹
Italy ¹Iceland ¹*
Luxembourg ¹*Belgium ¹OECD20
New Zealand ¹Canada ²Ireland ¹
Norway ¹United Kingdom ¹
Slovenia ¹Israel ¹
Portugal ²Denmark ¹
Spain ²Austria ²
United States ²Netherlands ¹
Finland ¹
% of w omen screened
2011 2001

Breast cancer five-year relative survival, 2001-2006
and 2006-2011 (or nearest period)
Source: OECD Health Statistics 2013 ,
http://dx.doi.org/10.1787/health-data-en.
1. Period analysis. 2. Cohort analysis. * Three-period average.
Note: 95% confidence intervals represented by H.
73.6
80.5
80.7
80.7
80.7
82.0
82.6
84.2
84.5
84.6
85.0
85.0
85.2
85.6
85.9
85.9
86.1
86.2
86.4
87.4
87.7
87.7
89.3
70.2
77.3
76.4
76.5
78.6
81.8
82.3
82.6
81.8
78.6
84.8
0.0
82.6
83.1
84.7
84.9
83.7
86.1
85.7
84.4
87.3
87.0
86.5
87.5
0.0
0 20 40 60 80 100
Poland ²
Ireland ¹
Czech Rep. ²
Latvia ²
United Kingdom ¹
Denmark ²
Portugal ²
OECD (19)
Austria ²
Singapore ²
Belgium ¹
Germany ¹
Korea ¹
Slovenia ¹
Finland ¹
Netherlands ²
Norway ¹
Israel ¹
Sweden ²
New Zealand ¹
Japan ²
Iceland ²*
Australia ¹
Canada ²
United States ²
Age-standardised survival (%)
2006-2011 2001-2006

* Three-year average.
Source: OECD Health Statistics 2013 , http://dx.doi.org/10.1787/health-data-en.
Breast cancer mortality in women, 2001 to 2011 (or nearest year)7
.8
14.2
14.5
19
.4
20.3
21.2
21.5
22
.5
22.8
23
.1
23
.2
24.2
24.5
24
.8 26.0
26
.3
26.5
26.6
27
.1
27
.1
27
.2
27.5
27.7
28.3
28
.8 30.0
30.4
30.7
30
.9
31.2
31.2
31.5
31.6
32.3
32.8 34
.2
34.7
6.2
12.7
13.7
17.8
20.1
25.3
29.5
23.0
28.1
27.7
26.7
25.5
29.6
28.1
32.2
30.2
33.8
32.6
31.6
31.3
27.0
31.2
28.3
31.4
31.8
33.3
37.7
34.6
25.6
34.1
38.2
35.0
40.8
38.5
40.6
35.8
43.6
0
5
10
15
20
25
30
35
40
45
2001 2011Age-standardised rates per 100 000 w omen
1. Programme. 2. Survey. * Three-year average.
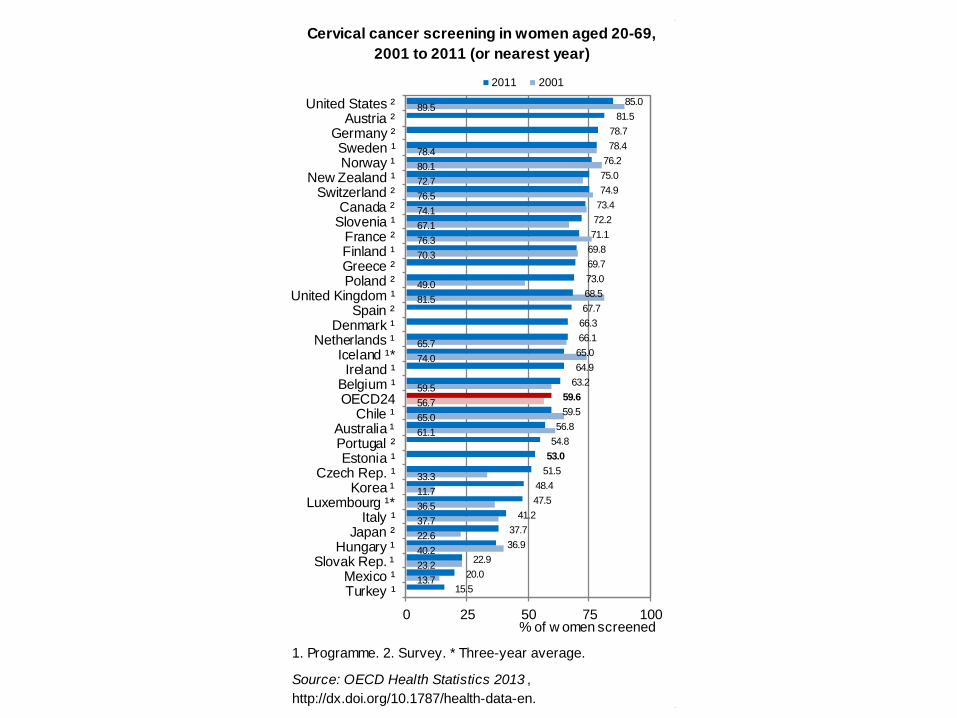
Cervical cancer screening in women aged 20-69,
2001 to 2011 (or nearest year)
Source: OECD Health Statistics 2013 ,
http://dx.doi.org/10.1787/health-data-en.
15.5
20.0
22.9
36.9
37.7
41.2
47.5
48.4
51.5
53.0
54.8
56.8
59.5
59.6
63.2
64.9
65.0
66.1
66.3
67.7
68.5
73.0
69.7
69.8
71.1
72.2
73.4
74.9
75.0
76.2
78.4
78.7
81.5
85.0
13.7
23.2
40.2
22.6
37.7
36.5
11.7
33.3
61.1
65.0
56.7
59.5
74.0
65.7
81.5
49.0
70.3
76.3
67.1
74.1
76.5
72.7
80.1
78.4
89.5
0 25 50 75 100
Turkey ¹Mexico ¹
Slovak Rep. ¹Hungary ¹
Japan ²Italy ¹
Luxembourg ¹*Korea ¹
Czech Rep. ¹Estonia ¹
Portugal ²Australia ¹
Chile ¹OECD24Belgium ¹Ireland ¹
Iceland ¹*Netherlands ¹
Denmark ¹Spain ²
United Kingdom ¹Poland ²Greece ²Finland ¹France ²
Slovenia ¹Canada ²
Switzerland ²New Zealand ¹
Norway ¹Sweden ¹
Germany ²Austria ²
United States ²
% of w omen screened
2011 2001
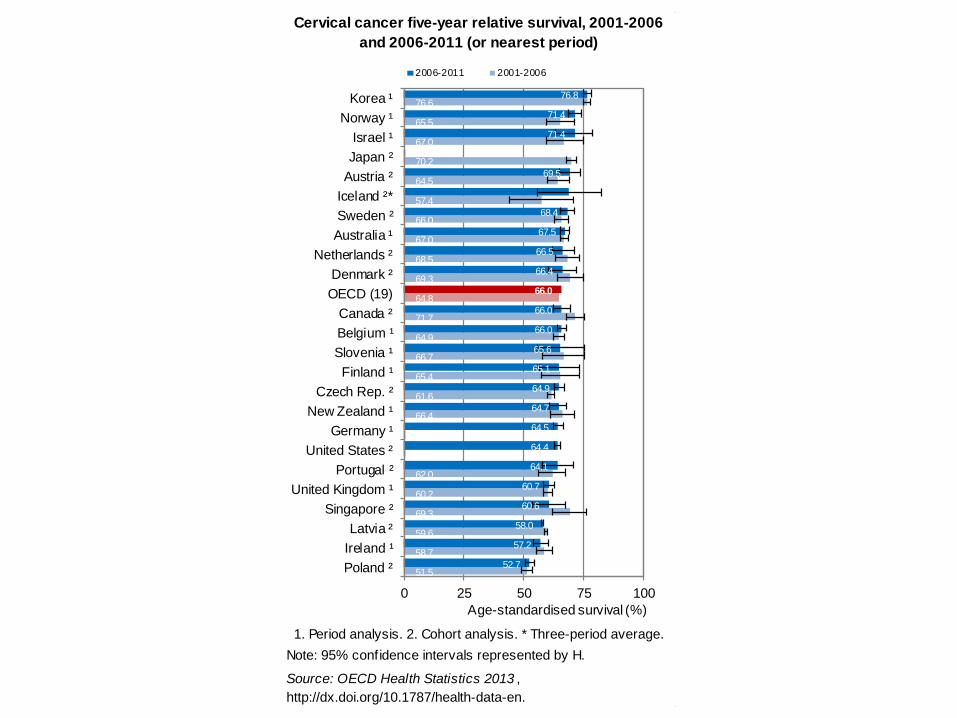
Cervical cancer five-year relative survival, 2001-2006
and 2006-2011 (or nearest period)
Source: OECD Health Statistics 2013 ,
http://dx.doi.org/10.1787/health-data-en.
1. Period analysis. 2. Cohort analysis. * Three-period average.
Note: 95% confidence intervals represented by H.
52.7
57.2
58.0
60.6
60.7
64.1
64.4
64.5
64.7
64.9
65.1
65.6
66.0
66.0
66.0
66.4
66.5
67.5
68.4
69.5
71.4
71.4
76.8
51.5
58.7
59.6
69.3
60.2
62.0
0.0
0.0
66.4
61.6
65.4
66.7
64.9
71.7
64.8
69.3
68.5
67.0
66.0
57.4
64.5
70.2
67.0
65.5
76.6
0 25 50 75 100
Poland ²
Ireland ¹
Latvia ²
Singapore ²
United Kingdom ¹
Portugal ²
United States ²
Germany ¹
New Zealand ¹
Czech Rep. ²
Finland ¹
Slovenia ¹
Belgium ¹
Canada ²
OECD (19)
Denmark ²
Netherlands ²
Australia ¹
Sweden ²
Iceland ²*
Austria ²
Japan ²
Israel ¹
Norway ¹
Korea ¹
Age-standardised survival (%)
2006-2011 2001-2006
* Three-year average.
Source: OECD Health Statistics 2013 , http://dx.doi.org/10.1787/health-data-en.
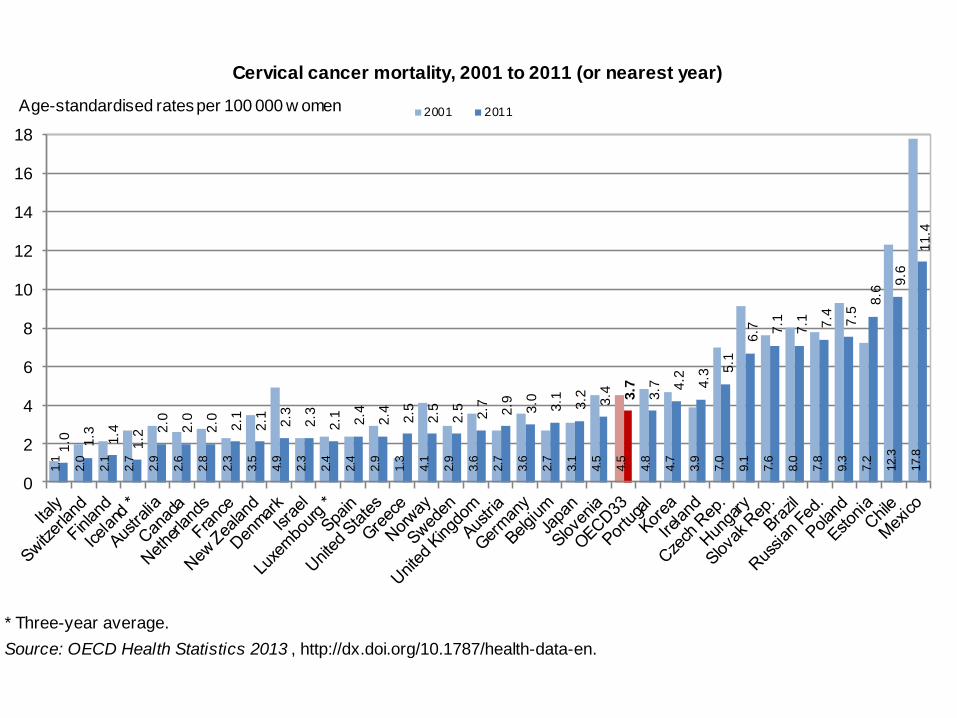
Cervical cancer mortality, 2001 to 2011 (or nearest year)1.0 1.3 1.4
1.2
2.0
2.0
2.0 2.1
2.1 2.3
2.3
2.1 2.4
2.4 2.5
2.5
2.5 2.7 2.9 3.0 3.1 3.2 3.4 3.7
3.7 4
.2 4.3
5.1
6.7 7
.1
7.1 7.4 7.5
8.6
9.6
11.4
1.1
2.0
2.1
2.7
2.9
2.6
2.8
2.3
3.5
4.9
2.3
2.4
2.4
2.9
1.3
4.1
2.9
3.6
2.7
3.6
2.7
3.1
4.5
4.5
4.8
4.7
3.9
7.0
9.1
7.6
8.0
7.8
9.3
7.2
12.3
17.8
0
2
4
6
8
10
12
14
16
18
2001 2011Age-standardised rates per 100 000 w omen
Note: 95% confidence intervals represented by H.
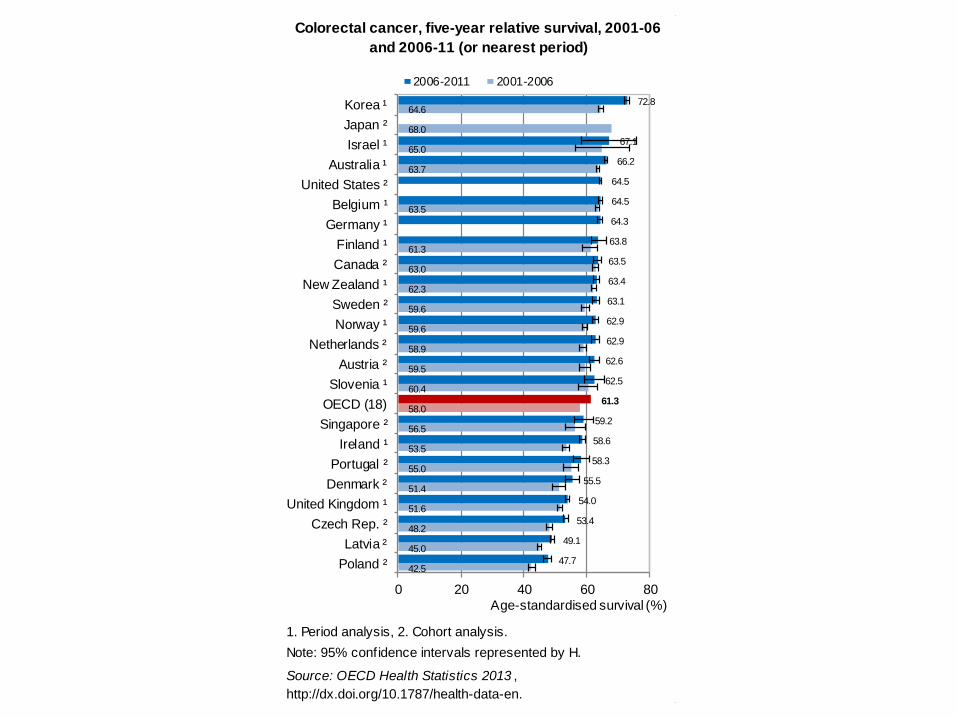
Colorectal cancer, five-year relative survival, 2001-06
and 2006-11 (or nearest period)
Source: OECD Health Statistics 2013 ,
http://dx.doi.org/10.1787/health-data-en.
1. Period analysis, 2. Cohort analysis.
47.7
49.1
53.4
54.0
55.5
58.3
58.6
59.2
61.3
62.5
62.6
62.9
62.9
63.1
63.4
63.5
63.8
64.3
64.5
64.5
66.2
67.1
72.8
42.5
45.0
48.2
51.6
51.4
55.0
53.5
56.5
58.0
60.4
59.5
58.9
59.6
59.6
62.3
63.0
61.3
63.5
63.7
65.0
68.0
64.6
0 20 40 60 80
Poland ²
Latvia ²
Czech Rep. ²
United Kingdom ¹
Denmark ²
Portugal ²
Ireland ¹
Singapore ²
OECD (18)
Slovenia ¹
Austria ²
Netherlands ²
Norway ¹
Sweden ²
New Zealand ¹
Canada ²
Finland ¹
Germany ¹
Belgium ¹
United States ²
Australia ¹
Israel ¹
Japan ²
Korea ¹
Age-standardised survival (%)
2006-2011 2001-2006
95% confidence intervals represented by H.
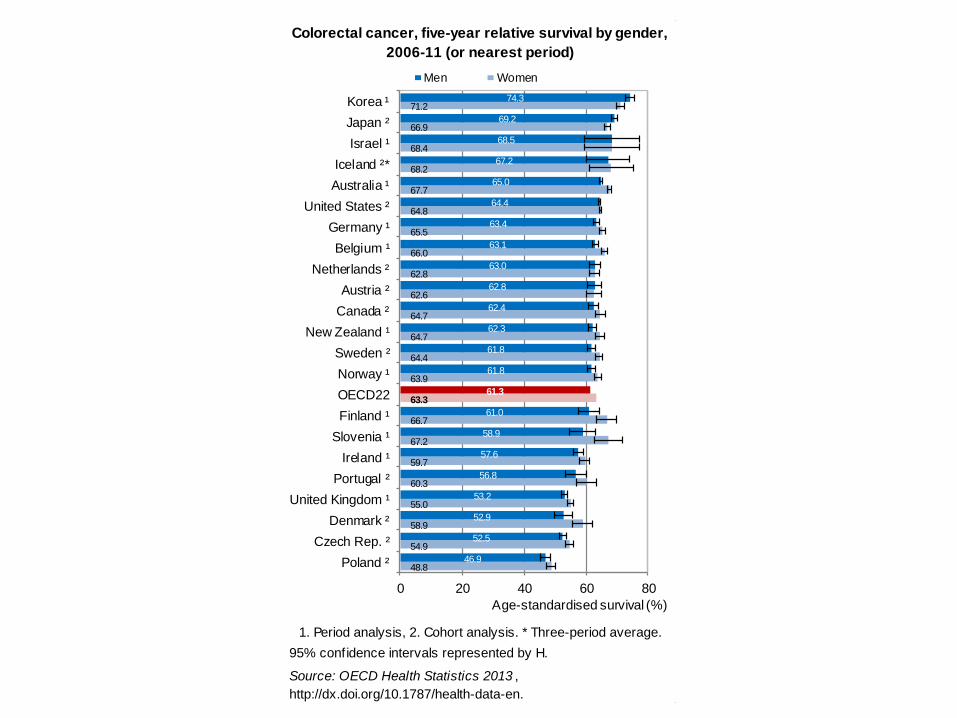
Colorectal cancer, five-year relative survival by gender,
2006-11 (or nearest period)
1. Period analysis, 2. Cohort analysis. * Three-period average.
Source: OECD Health Statistics 2013 ,
http://dx.doi.org/10.1787/health-data-en.
48.8
54.9
58.9
55.0
60.3
59.7
67.2
66.7
63.3
63.9
64.4
64.7
64.7
62.6
62.8
66.0
65.5
64.8
67.7
68.2
68.4
66.9
71.2
46.9
52.5
52.9
53.2
56.8
57.6
58.9
61.0
61.3
61.8
61.8
62.3
62.4
62.8
63.0
63.1
63.4
64.4
65.0
67.2
68.5
69.2
74.3
0 20 40 60 80
Poland ²
Czech Rep. ²
Denmark ²
United Kingdom ¹
Portugal ²
Ireland ¹
Slovenia ¹
Finland ¹
OECD22
Norway ¹
Sweden ²
New Zealand ¹
Canada ²
Austria ²
Netherlands ²
Belgium ¹
Germany ¹
United States ²
Australia ¹
Iceland ²*
Israel ¹
Japan ²
Korea ¹
Age-standardised survival (%)
Men Women
* Three-year average.
Source: OECD Health Statistics 2013 , http://dx.doi.org/10.1787/health-data-en.
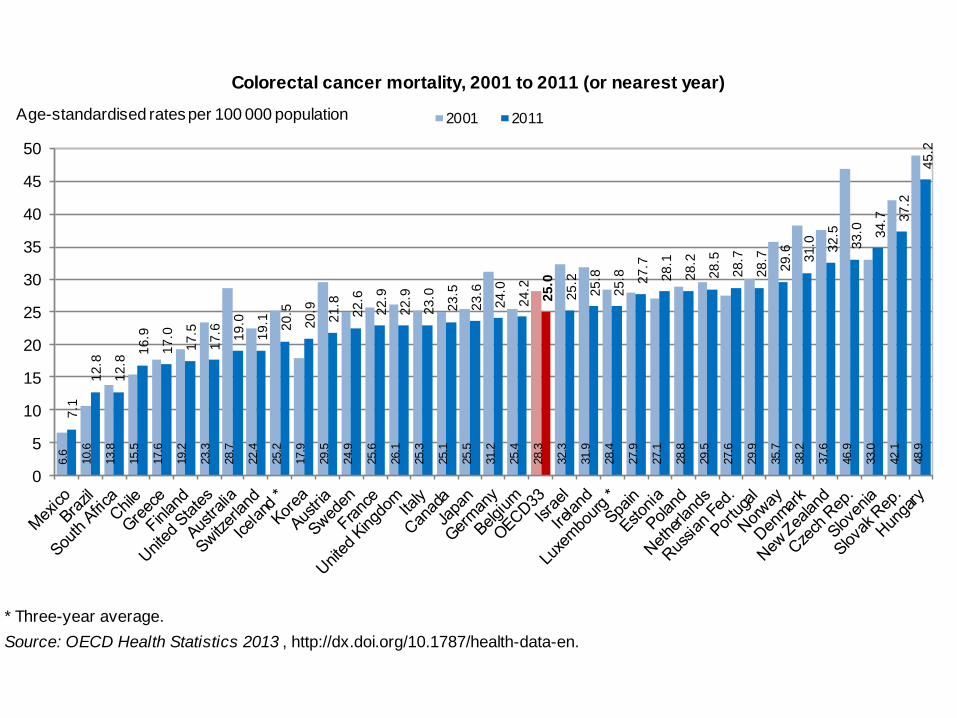
Colorectal cancer mortality, 2001 to 2011 (or nearest year)7
.1
12
.8
12
.8
16
.9
17
.0
17.5
17.6 19.0
19.1 20
.5
20.9
21
.8
22.6
22.9
22.9
23
.0
23
.5
23
.6
24
.0
24
.2
25
.0
25
.2
25
.8
25
.8 27
.7
28
.1
28
.2
28
.5
28
.7
28
.7
29
.6 31
.0 32.5
33.0 34.7 3
7.2
45.2
6.6
10.6
13.8
15.5
17.6
19.2
23.3
28.7
22.4
25.2
17.9
29.5
24.9
25.6
26.1
25.3
25.1
25.5
31.2
25.4
28.3
32.3
31.9
28.4
27.9
27.1
28.8
29.5
27.6
29.9
35.7
38.2
37.6
46.9
33.0
42.1
48.9
0
5
10
15
20
25
30
35
40
45
50
2001 2011Age-standardised rates per 100 000 population

United States
Austria
Spain
Slovenia
Canada
New Zealand
France
Poland
Denmark
Belgium
Czech Republic
Hungary
Slovak Republic
United Kingdom
Mexico1
Estonia
1. Visits in the past 12 months.
Source: Devaux and de Looper (2012).
Cervical cancer screening in past 3 years by
income level, selected OECD countries, 2009 (or
nearest year)
0 20 40 60 80 100
% of w omen aged 20-69
Low income High incomeAverage

Spain
Austria
United States
France
New Zealand
Canada
Belgium
Czech Republic
Hungary
Poland
Slovak Republic
United Kingdom
Slovenia
Estonia
Mexico1
Denmark1
1. Visits in the past 12 months.
Source: Devaux and de Looper (2012).
Breast cancer screening in past 2 years by
income level, selected OECD countries, 2009 (or
nearest year)
0 20 40 60 80 100
% of w omen aged 50-69
Low income High incomeAverage

Source: Eurostat Statistics Database 2013.
Colorectal cancer screening once in lifetime by educational level, European countries, 2009 (or
nearest year)
0
10
20
30
40
50
60
% of people aged 50-75
Lowest educational level Medium educational level Highest educational level
More information
www.oecd.org/health/health-systems/cancer-care.htm
www.oecd.org/health/healthataglance
www.oecd.org/els/health-systems/oecdhealthdata.htm