Embed Size (px)
Citation preview

CANARD DESIGN NOTES
This document summarizes an approach to the design of canard type model aircraft.
Section 1 provides design considerations.
Section 2 introduces the basic canard geometry and aerodynamic relationships.
Section 3 provides basic information on airfoil and flap (elevator) characteristics.
Section 4 uses the information from Section 3 to describe two approaches to designing a canard model.
Section 5 describes vertical stabilizer requirements.
After searching the literature on canard model airplanes, Andy Lennon's book " R/C Model Aircraft Design ", chapter 22, was used as the primary reference for the design. Most of the equations in this document are from his book.
Section 1. Design Considerations.
Lennon presents information on the criteria for a successful canard design as follows.
1. The front wing must stall before the aft wing. That way when the front wing stalls the aft wing still provides lift and allows the nose to drop, moving the front wing back into the lifting state. If the aft wing stalls first, the tail will drop causing the front wing to increase lift, making things worse.
2. The aft wing must arrive at an angle of zero lift before the front wing. As the nose is put in a downward relative to the wind position the aft wing will loose lift before the front wing. The aft wing will start to drop while the front wing holds the nose up. As the plane rotates nose upward the aft wing will move into positive lift angle and recover. If the front wing goes through the zero lift angle before the aft plane, it will drop the nose and decrease the aft wing lift, increasing the nose dropping effect.
3. The front wing carries weight and is part of the load carrying lifting structure. Its weight carrying capacity is a variable that affects the plane neutral point and Center of Gravity, CG. Increasing its load moves the CG forward that increases pitch stability; decreasing it moves the CG backwards that decreases pitch stability.
4. A vertical stabilizer is necessary aft of the CG to stabilize unwanted yaw caused by side forces during turns. Side pressure in front of the CG tends to be destabilizing while side pressure aft of the CG tends to be stabilizing. (This action is similar to that of a weather vane). Hence the aft side area moment behind the CG needs to about 25% greater than that of the front area moment to insure yaw stability.
5. The longer the front wing moment arm relative to the CG is the more effectively it controls dynamic pitch, or the front wing area can be reduced for the same control authority. (Torque = Force x Lever Arm). Conversely, pitch becomes more sensitive to control inputs.
document.docx 1 OF 19

Section 2 Geometry and Aerodynamic Relationships
Figure 2-1 shows the general geometry of canard type aircraft, identifying the principal characteristics that control performance.
Figure 2-1. Canard GeometryAf is the area of the front wing, sq. in.Ar is the area of the rear wing, sq. in.ACf is the location of the front wing aerodynamic centerACr is the location of the rear wing aerodynamic centerL is the distance between the aerodynamic centers, in.D is the distance from the rear aerodynamic center to the CG location, in.N is the distance from the neutral point to the rear aerodynamic center, in.
Wt is the total plane weight, ouncesWf is the weight supported by the front wingWr is the weight supported by the rear wing.
Calculate the neutral point distance, N
Eq. 2-1 N= Af∗LAf+eff∗Ar
eff is the efficiency of the rear wing taking into account the down-wash from the front wing. Assume eff = 0.8 for the portion of the rear wing directly behind the front wing span.
Calculate the CG distance, D
Eq. 2-2 D=N+k∗MACr
document.docx 2 OF 19

MAC r is the mean aerodynamic cord of the rear wing and k is a static margin fraction, typically in the range of 0.2 to 0.25. The larger the value the more stable the pitch but the less maneuverable as well.
Calculate the wing loads.
Eq 2-3 Wf =
Wt∗DL
Eq. 2-4 Wr =
Wt∗(L−D)L or Wt−Wf
Calculate the lift coefficient, CL, of each wing that is required to maintain level flight at a given speed.
Eq. 2-5 CLf=
Wf∗3519¿ σ∗V2∗Af ¿¿
¿
Eq. 2-6 CLr=
Wr∗3519¿ σ∗V2∗Ar ¿¿
¿
Where σ is the relative air density, equal to 1.0 at sea level.V is the speed in mph
It can be shown that the ratio of the front lift coefficient to the rear coefficient is as follows:
Eq. 2-7
CLfCLr
= DL−D
∗ArAf
This ratio must be greater than 1 to satisfy stability requirements and is typically on the order of 1.4 to 1.6. This means that the front wing lift coefficient must be greater than the rear one for all angles of attack. This relationship is useful in determining the ability of the front wing to control the rear wing Angle of Attack, AoA, over the operating range.
document.docx 3 OF 19

Section 3 Airfoil and Flap Characteristics
The design of the front wing must satisfy Lennon's first two criteria: the front must stall before rear and the rear must pass through zero CL first. In order to make a suitable selection it is useful to review the characteristics of various airfoil sections taking into account aspect ratio, plan form and Reynolds number.
Figure 3-1 illustrates the general geometry of an airfoil. All angles of attack are measured relative to the chord line that linearly connects the front-most point of the leading edge to the rear-most point of the trailing edge. In the analysis that follows the chord line of the rear wing is used as the angular reference line for alignment with the front wing and the thrust axis.
Figure 3-1 Wing Section Profile Geometry (from Simons)
The coefficient of lift, CL, and the coefficient of drag, CD, differ somewhat from airfoil to airfoil type. Figure 3-2 illustrates the general relationship between airfoils with different cambers. Camber is the line that equally divides the top and bottom surfaces. The zero camber, or symmetrical, airfoil zero lift occurs at zero AoA and has the lowest maximum CL. The maximum CL range for this type of airfoil ranges from about 0.8 to 1.1 Also its CL is symmetrical around the zero crossing, meaning that it operates equally well upright or inverted.
The moderately cambered airfoil CL becomes zero at a moderate negative angle, meaning that the lift stops at a slight nose down attitude. Its maximum CL is a little greater than that of the symmetrical airfoil but less than that of the highly cambered airfoil, typically in the range 1.2 to 1.4. Its CL is not symmetric around zero lift but still shows a moderate lift capability when inverted. The highly cambered airfoil has the greatest maximum CL, on the order of 1.5 or so, and crosses the zero lift condition at the most negative AoA. It has relatively limited range of lift when inverted.
document.docx 4 OF 19

Figure 3-2 Airfoil Type Comparisons (from Simons)
Figure 3-3 plots the section CL and CD values for the Eppler 478 symmetrical profile at infinite aspect ratio (Infinitely long wing of constant chord length). Figure 3-4 is a similar plot for the Clark Y mildly cambered profile. Figure 3-5 is a plot of the Benedek 8405A highly cambered profile. The graphs illustrate the effects of Reynolds number on the various profiles, as well. The CL curves have similar shapes for all three profiles. The slope of the CL curves at high Reynolds number is essentially the same although not readily evident from the graphs. The symmetrical CL curve passes through zero at zero AoA while the other two pass through zero at -3 to -4 degrees AoA. If the three curves were overlaid so they had the same zero crossing location they would be nearly identical until the symmetrical profile reached its maximum CL of about 1.1. The Clark Y would reach its maximum CL of about 1.4 and then the Benedek maximum CL would be reached at about 1.5. There are literally thousands of airfoil section profiles available but they more or less fall into this range of performance.
Figure 3-3. Eppler 478 Airfoil CL and CD Characteristics
document.docx 5 OF 19

Figure 3-4. Clark Y CL and CD Characteristics
Figure 3-5. Benedek 8405A CL and CD Characteristics
Note from the graphs that the performance degrades as the Reynolds number decreases. The Reynolds number is defined by Equation 3-1: Note that it is not a function of wing shape or span.
Eq. 3-1 Rn=780∗V∗C
V is the speed in mph and C is the mean aerodynamic chord in inches.
Table 3-1 Reynolds Number TableV, mph C = 3 in C = 5 in C = 7 in
15 35100 58500 8145020 46800 78000 10920025 58500 97500 136500
document.docx 6 OF 19

While there is variation in the degree of degradation from profile to profile, a Reynolds number in the range of 70,000 to 100,000 is where the degradation becomes noticeable. Since RC model's stall speeds on the order of 20 mph are desirable, the MAC generally should be 5 inches or greater.
Another consideration in selecting wing dimensions is the effect of aspect ratio on CL and AoA. Figure 3-6 illustrates this effect. Aspect Ratio, AR, is a measure of a wing's proportions, defined as AR = span^2/Area. For rectangular wings this ratio becomes span/width.
Figure 3-6. The slope of the wing lift curve at different aspect ratios. (from Simons)
Aspect ratio does not affect the AoA at zero lift. It changes the curve slope and maintains the maximum CL unless the aspect ratio becomes very low (on the order of 3 or less). The slope of the curve as a function of aspect ratio, AR, can be approximated by the following formula:
Eq. 3-2slope= 0 .11∗AR
AR+2∗(1+T ) per degree
Eq. 3-3 Where AR= span
2
area
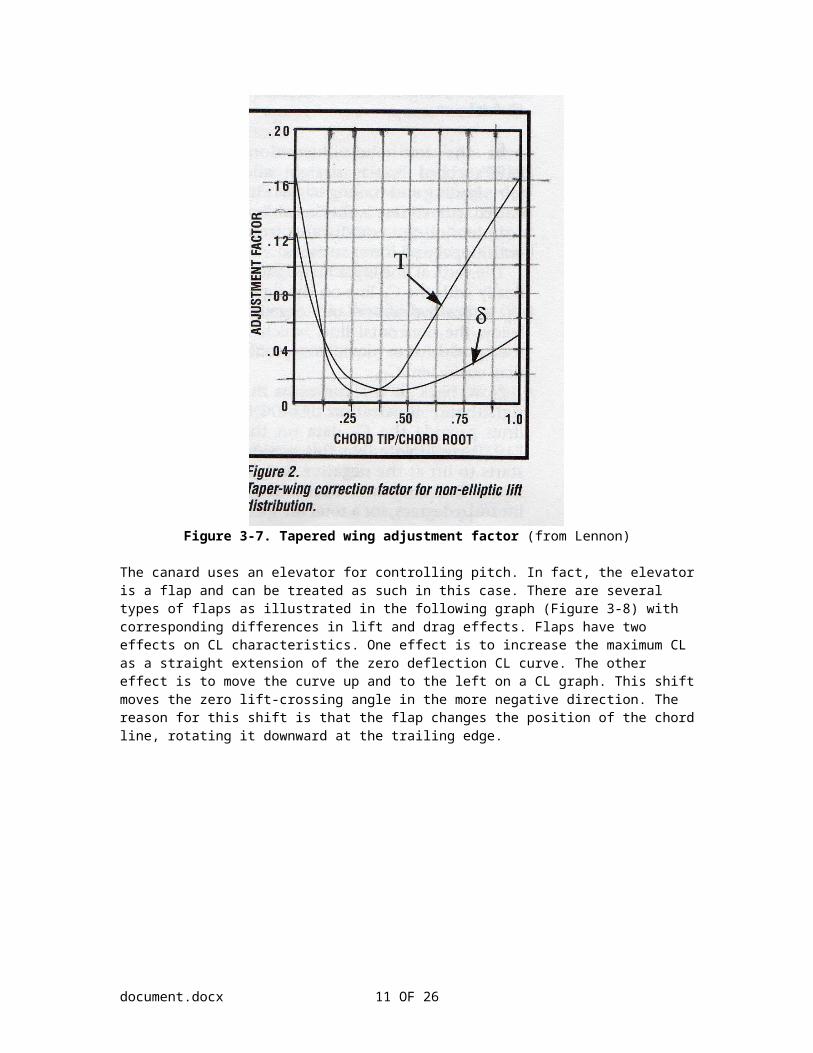
T is a correction factor that takes in to account the wing shape variation from an elliptical plan-form.
document.docx 7 OF 19
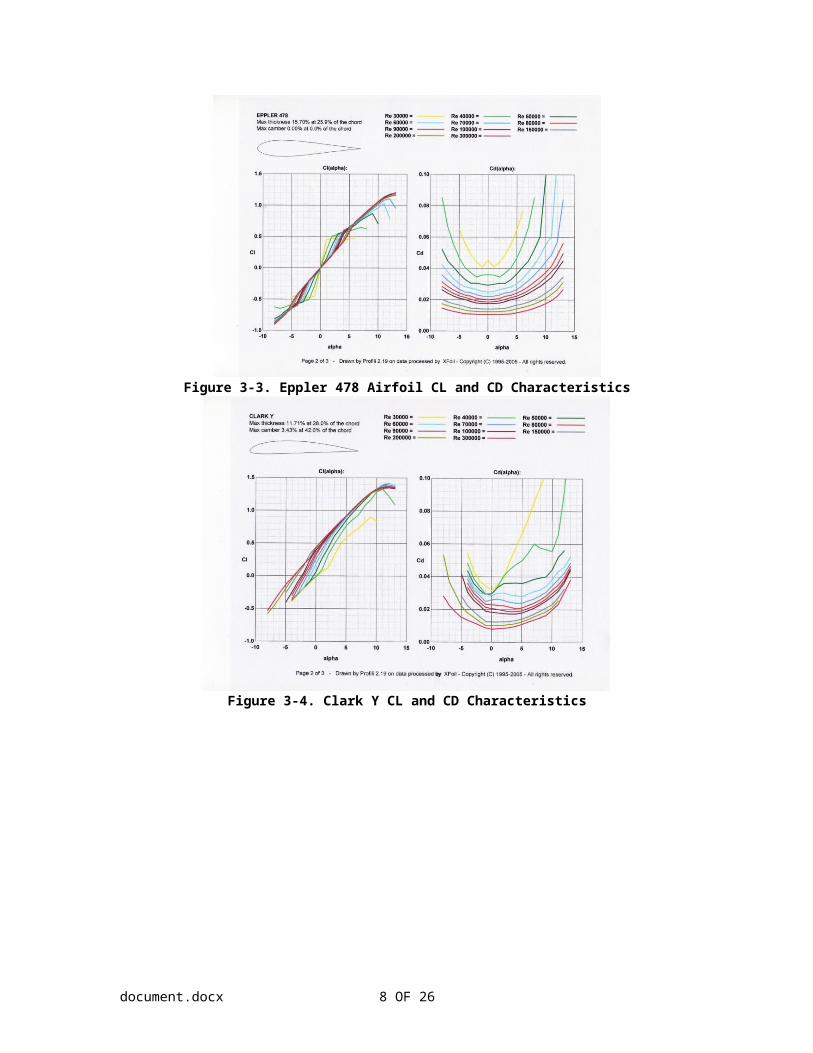
Figure 3-7. Tapered wing adjustment factor (from Lennon)
The canard uses an elevator for controlling pitch. In fact, the elevator is a flap and can be treated as such in this case. There are several types of flaps as illustrated in the following graph (Figure 3-8) with corresponding differences in lift and drag effects. Flaps have two effects on CL characteristics. One effect is to increase the maximum CL as a straight extension of the zero deflection CL curve. The other effect is to move the curve up and to the left on a CL graph. This shift moves the zero lift-crossing angle in the more negative direction. The reason for this shift is that the flap changes the position of the chord line, rotating it downward at the trailing edge.
document.docx 8 OF 19

Figure 3-8. Flap Characteristics (from Lennon)
The plain flap is commonly used on models for elevators as it allows both positive (upward) and negative (downward) deflection. The literature indicates that a plain flap to cord ratio of 0.2 C is near optimum. Smaller elevator ratios have lower lift increases while larger ones don't improve lift but increase drag. Split flaps provide greater lift increase but cannot be deflected upwards. The slotted flap has the best improvement but is difficult to build and does not lend itself readily to upward deflection. The remainder of this document will be based on the plain flap used as an elevator.
The plain flap graph does not lend itself easily to prediction of canard performance. This is because the effects on chord line angle change and its shifting of the CL curve are not directly related. What is needed is a translation of the flap deflection angle to the chord line change angle so the CL curves can be displayed on a common graph with the rear wing CL curves. The following Figure 3-9 illustrates the translation.
document.docx 9 OF 19

Figure 3-9. Flap Geometry
The angle A is the change in chord line angle with deflection angle D and is the amount the CL zero lift crossing AoA shifts to the negative direction. The following table lists the values of angle A as a function of deflection angle D with the corresponding increase in CL for the 0.2 C plain flap.
Table 3-2. Flap Deflection TableDeflection D, degrees A, degrees Delta CL
0 0 010 2.0 0.1520 4.0 0.330 5.9 0.4240 7.7 0.5550 9.3 0.61
document.docx 10 OF 19
Section 4 Canard Design Options
There are five basic ingredients in designing a canard that meets the Lennon criteria. These are airfoil types, aspect ratio, elevator deflection range, relative wing loading, and incidence angle with respect to the chord line of the rear wing.
Start with selection of airfoil types. If aerobatics is a primary objective choose a symmetrical airfoil for both wings and having the same maximum CL. If general purpose flying is the objective select moderately cambered airfoils having the same or nearly the same maximum CL. Elevators may not work well with highly cambered airfoils so are not recommended for the front wing. The condition of front wing stalling first is adjustable by choice of aspect ratio, elevator settings and adjusting the angle of incidence between the two wings. Another method is to adjust the relative wing loading by adjustment of CG.
The criterion for the front wing stalling first is that the AoA at stall occurs before that of the rear wing. Therefore the approach is to calculate the AoA at stall for each wing and compare them. For example, assume both wings employ a Clark-Y airfoil that has a maximum CL of 1.4 and a zero lift AoA crossing of -4 degrees. Assume that the aspect ratios for the front and rear wings are 6 and 5 respectively and that the wings are rectangular (tip/root = 1).
Calculate the slope of each CL curve using Eq. 3-2. slope front = 0.11*6/(6+2*(1+.16)) = 0.079 per degree
slope rear = 0.11*5/(5+2*(1.16)) = 0.075 per degree
AoA max Cl front = AoA @ zero lift + CLmax/slope = -4 + 1.4/.079 = 13.7 degrees (zero deflection)
AoA max CL front = -4 - 9.3 +(1.4+0.61)/0.079 = 12.1 degrees. (50 degrees deflection)
AoAmax CL rear = -4 +1.4/0.075 = 14.7 degrees
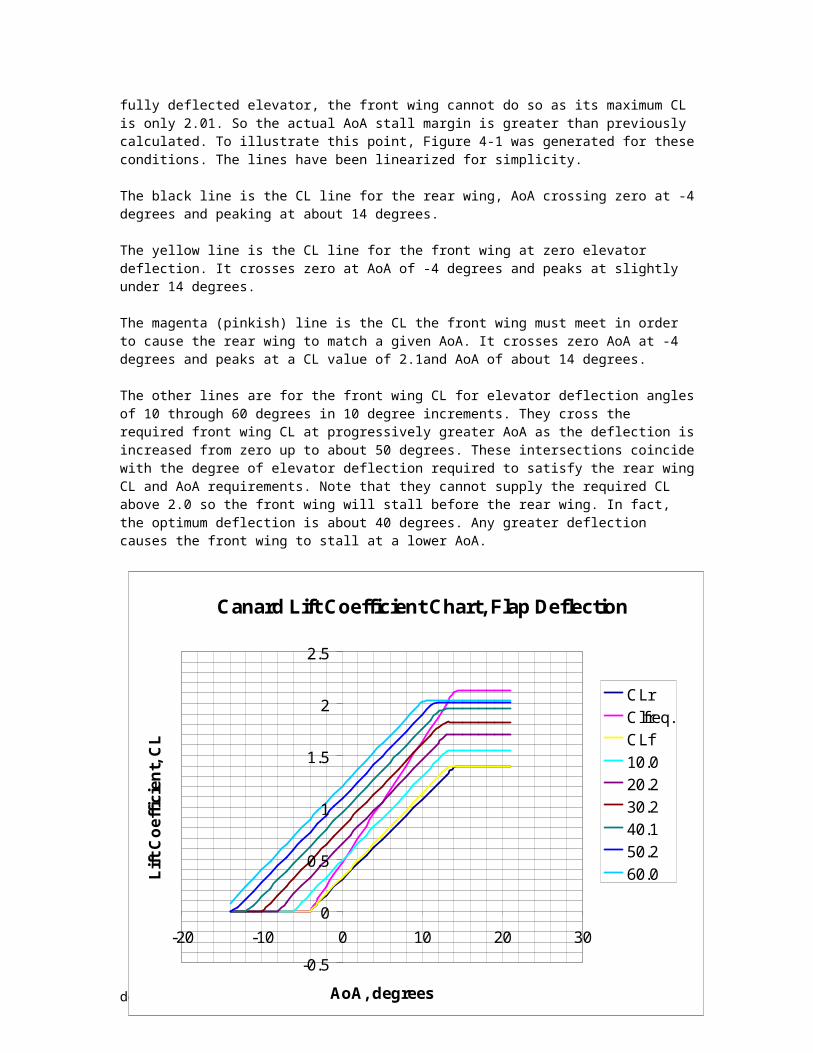
There is a small margin in AoA for this example, but it leaves out the effect of relative wing loading. For stability reasons the front wing must be more heavily loaded than the rear wing. (Refer to Eq. 2-3). The requirement is that the front wing CL must be greater than that of the rear wing at any given rear wing AoA. For example, assume that the required CLf/CLr ratio is 1.5. Then in order for the front wing to be able to rotate the rear wing to an AoA that reaches the stall angle, it must produce a CLf of 1.4 * 1.5 = 2.1. But in this design, even with fully deflected elevator, the front wing cannot do so as its maximum CL is only 2.01. So the actual AoA stall margin is greater than previously calculated. To illustrate this point, Figure 4-1 was generated for these conditions. The lines have been linearized for simplicity.
The black line is the CL line for the rear wing, AoA crossing zero at -4 degrees and peaking at about 14 degrees.
The yellow line is the CL line for the front wing at zero elevator deflection. It crosses zero at AoA of -4 degrees and peaks at slightly under 14 degrees.
The magenta (pinkish) line is the CL the front wing must meet in order to cause the rear wing to match a given AoA. It crosses zero AoA at -4 degrees and peaks at a CL value of 2.1and AoA of about 14 degrees.
The other lines are for the front wing CL for elevator deflection angles of 10 through 60 degrees in 10 degree increments. They cross the required front wing CL at progressively greater AoA as the deflection is increased from zero up to about 50 degrees. These intersections coincide with the degree of elevator deflection required to satisfy the rear wing CL and AoA requirements. Note that they cannot supply the required CL above 2.0 so the front wing will stall before the rear wing. In fact, the optimum deflection is about 40 degrees. Any greater deflection causes the front wing to stall at a lower AoA.
document.docx 11 OF 19
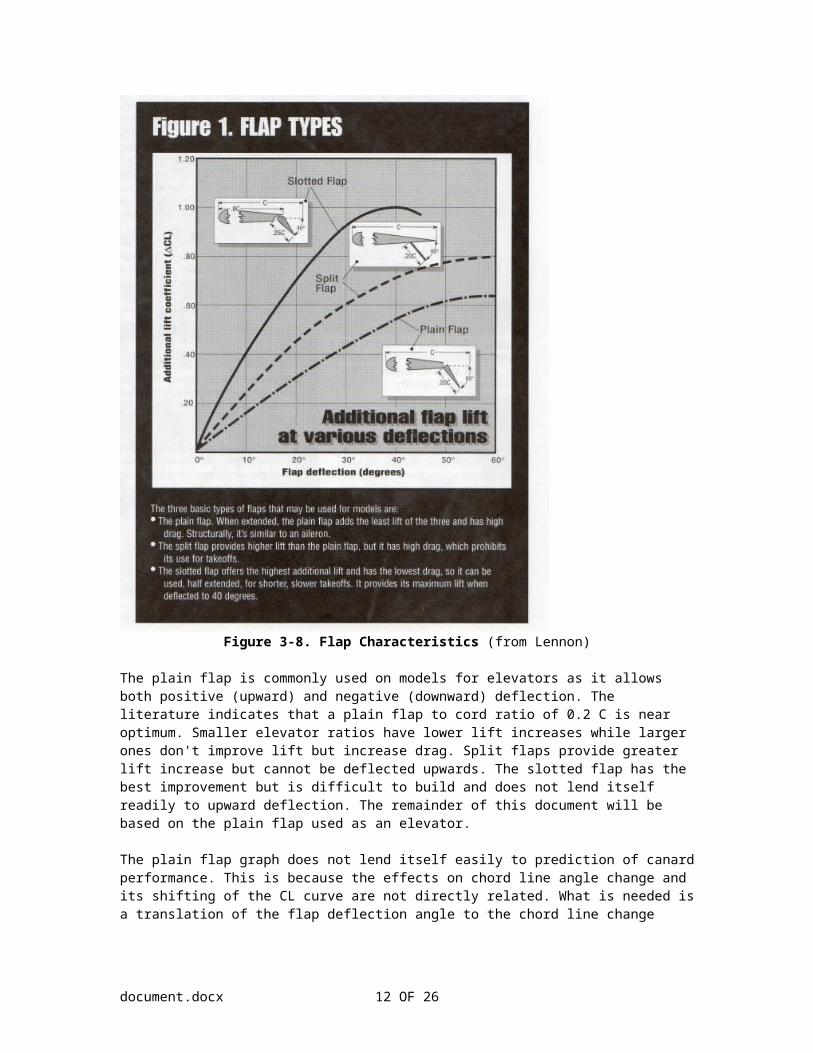
Figure 4-1. Lift Coefficient vs AoA for Several Conditions.
The graphs assume that the incidence angle between the two wings is zero. If the chord of the front wing is raised one degree above that of the rear wing the front wing curves will all shift one degree to the left, or negative, direction. Conversely, decreasing the angle of incidence will move the curves to the right, or positive, direction.
Another way of modifying the relationships is to change the CG location. Moving the CG closer to the front wing increases the front wing load that in turn increases the front wing CL needed to satisfy the rear wing AoA requirements. When graphed, the peak-required front CL will increase and the slope will increase so that the elevator intersections will move to the left some.
First Design Method
The equations in Section 2 are useful where the design is already reasonably complete. However, for an entirely new design their use tends to result in multiple iteration to converge on a satisfactory design. While in any new design effort it requires making a series of initial assumptions or guesses, the method that follows tends to reduce that aspect of the design process. Essentially it starts with a few dimensional givens and applies a series of selected ratios to compute the other dimensions. The outputs are wing dimensions, aerodynamic centers, neutral point, CG and stall AoAs. Table 4-1 lists the required inputs.
document.docx 12 OF 19
Canard Lift Coefficient Chart, Flap Deflection
-0.5
0
0.5
1
1.5
2
2.5
-20 -10 0 10 20 30
AoA, degrees
Lift
Coe
ffici
ent,
CL
CLrClfreq.CLf10.020.230.240.150.260.0

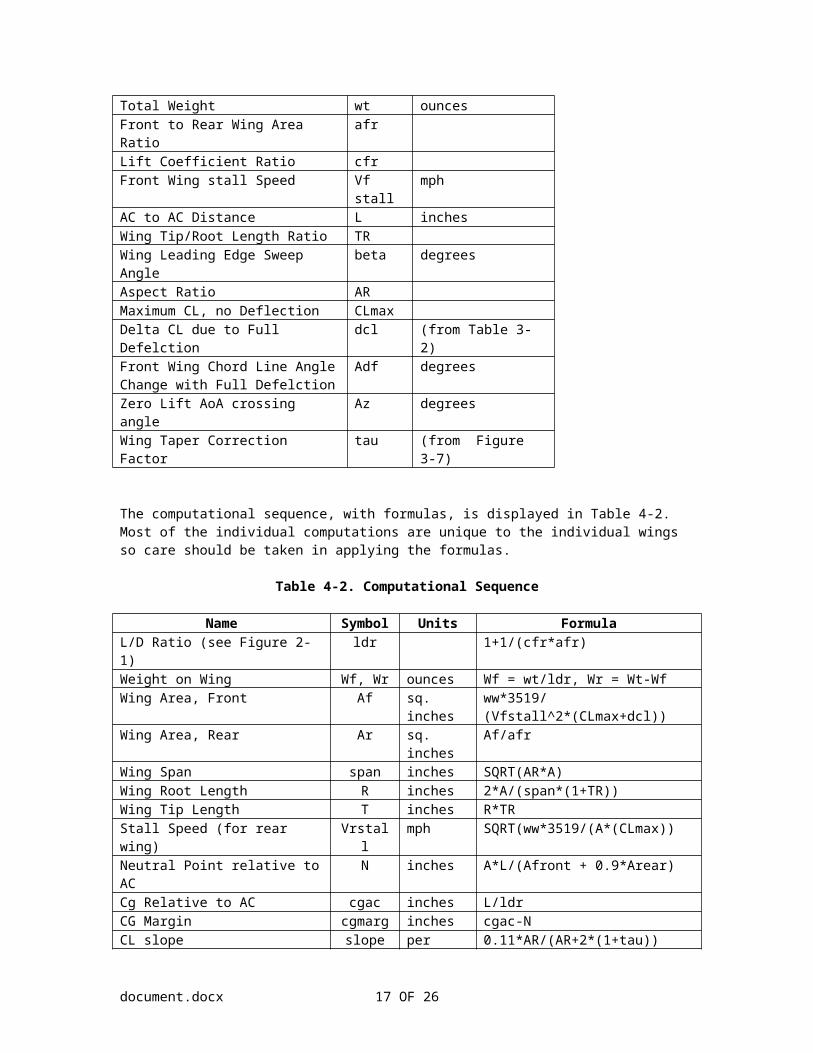
Table 4-1 Design Input TableParameter Name Symbo
lUnits
Total Weight wt ouncesFront to Rear Wing Area Ratio afrLift Coefficient Ratio cfrFront Wing stall Speed Vf stall mphAC to AC Distance L inchesWing Tip/Root Length Ratio TRWing Leading Edge Sweep Angle beta degreesAspect Ratio ARMaximum CL, no Deflection CLmaxDelta CL due to Full Defelction dcl (from Table 3-2)Front Wing Chord Line Angle Change with Full Defelction
Adf degrees
Zero Lift AoA crossing angle Az degreesWing Taper Correction Factor tau (from Figure 3-7)
The computational sequence, with formulas, is displayed in Table 4-2. Most of the individual computations are unique to the individual wings so care should be taken in applying the formulas.
Table 4-2. Computational Sequence
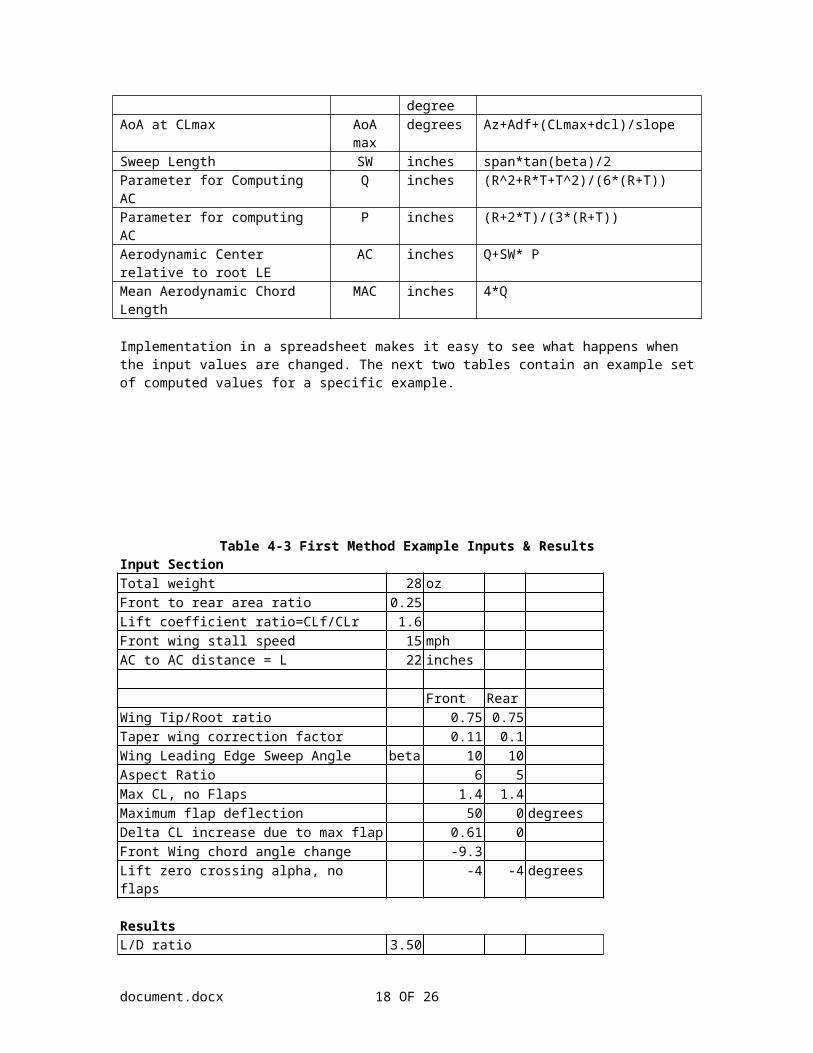
Name Symbol Units FormulaL/D Ratio (see Figure 2-1) ldr 1+1/(cfr*afr)Weight on Wing Wf, Wr ounces Wf = wt/ldr, Wr = Wt-WfWing Area, Front Af sq. inches ww*3519/(Vfstall^2*(CLmax+dcl))Wing Area, Rear Ar sq. inches Af/afrWing Span span inches SQRT(AR*A)Wing Root Length R inches 2*A/(span*(1+TR))Wing Tip Length T inches R*TRStall Speed (for rear wing) Vrstall mph SQRT(ww*3519/(A*(CLmax))Neutral Point relative to AC N inches A*L/(Afront + 0.9*Arear)Cg Relative to AC cgac inches L/ldrCG Margin cgmarg inches cgac-NCL slope slope per degree 0.11*AR/(AR+2*(1+tau))AoA at CLmax AoA max degrees Az+Adf+(CLmax+dcl)/slopeSweep Length SW inches span*tan(beta)/2Parameter for Computing AC Q inches (R^2+R*T+T^2)/(6*(R+T))Parameter for computing AC P inches (R+2*T)/(3*(R+T))Aerodynamic Center relative to root LE
AC inches Q+SW* P
Mean Aerodynamic Chord Length MAC inches 4*Q
Implementation in a spreadsheet makes it easy to see what happens when the input values are changed. The next two tables contain an example set of computed values for a specific example.
document.docx 13 OF 19
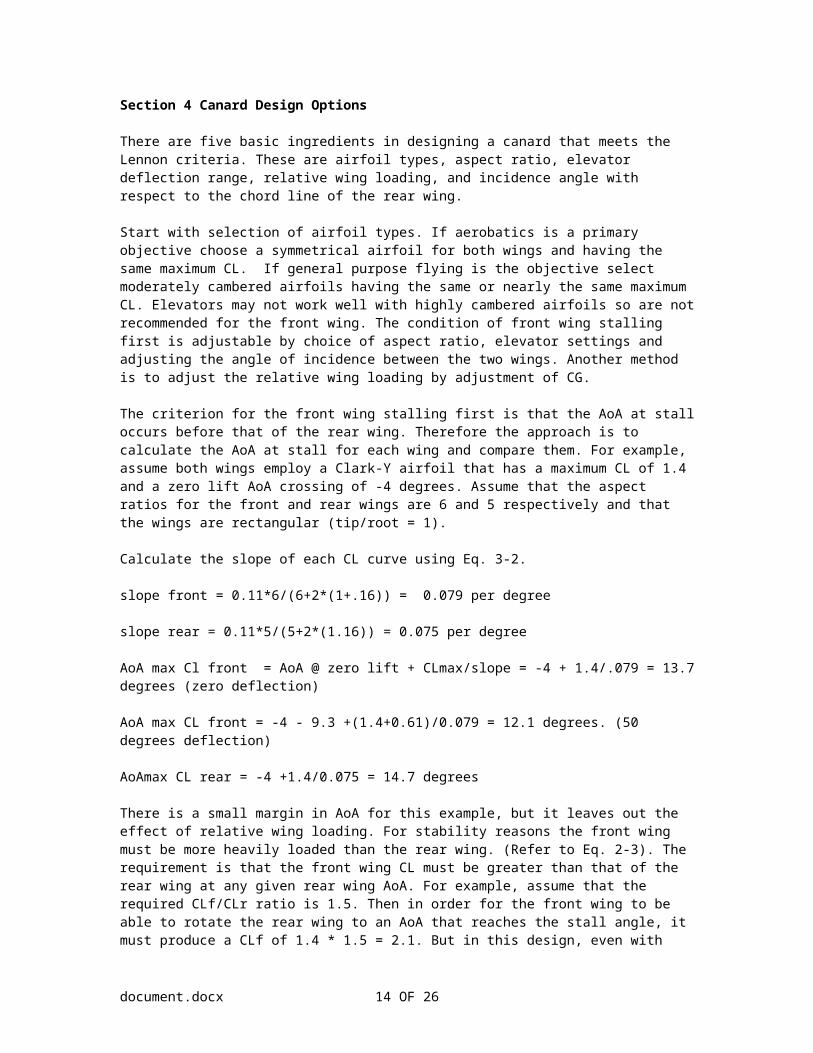
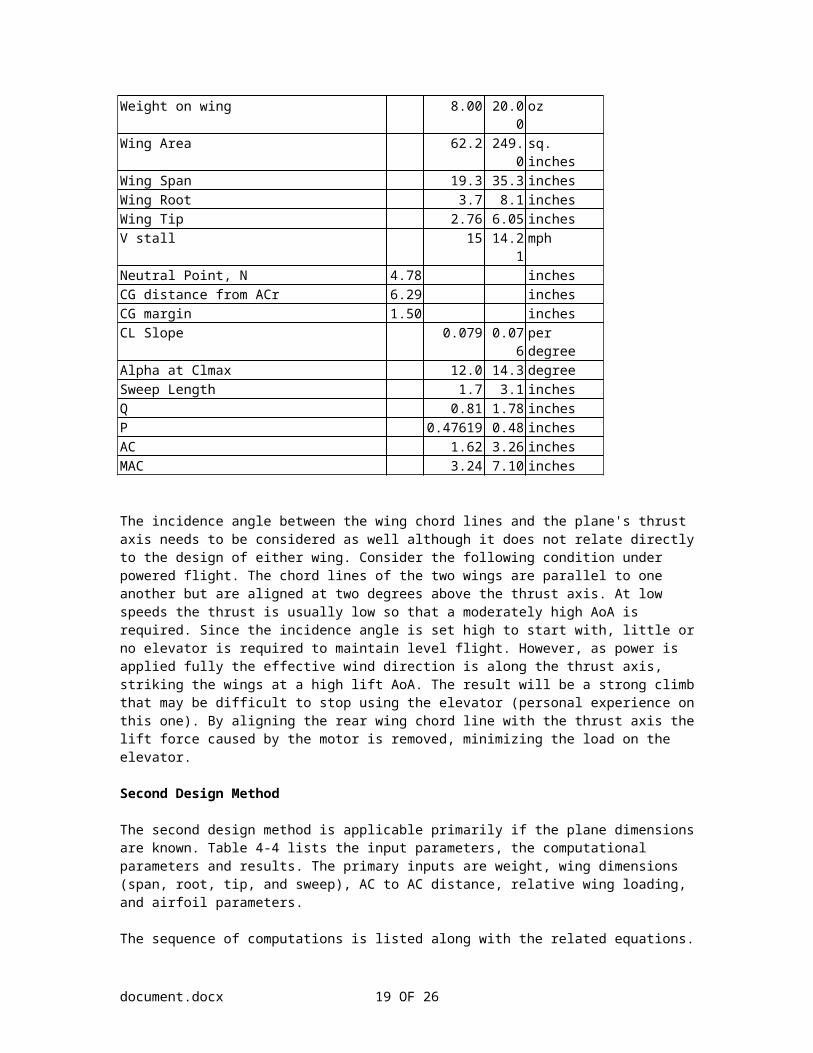
Table 4-3 First Method Example Inputs & ResultsInput SectionTotal weight 28 ozFront to rear area ratio 0.25Lift coefficient ratio=CLf/CLr 1.6Front wing stall speed 15 mphAC to AC distance = L 22 inches
Front RearWing Tip/Root ratio 0.75 0.75Taper wing correction factor 0.11 0.1Wing Leading Edge Sweep Angle beta 10 10Aspect Ratio 6 5Max CL, no Flaps 1.4 1.4Maximum flap deflection 50 0 degreesDelta CL increase due to max flap 0.61 0Front Wing chord angle change -9.3Lift zero crossing alpha, no flaps -4 -4 degrees
ResultsL/D ratio 3.50Weight on wing 8.00 20.00 ozWing Area 62.2 249.0 sq. inchesWing Span 19.3 35.3 inchesWing Root 3.7 8.1 inchesWing Tip 2.76 6.05 inchesV stall 15 14.21 mphNeutral Point, N 4.78 inchesCG distance from ACr 6.29 inchesCG margin 1.50 inchesCL Slope 0.079 0.076 per degreeAlpha at Clmax 12.0 14.3 degreeSweep Length 1.7 3.1 inchesQ 0.81 1.78 inchesP 0.47619 0.48 inchesAC 1.62 3.26 inchesMAC 3.24 7.10 inches
The incidence angle between the wing chord lines and the plane's thrust axis needs to be considered as well although it does not relate directly to the design of either wing. Consider the following condition under powered flight. The chord lines of the two wings are parallel to one another but are aligned at two degrees above the thrust axis. At low speeds the thrust is usually low so that a moderately high AoA is required. Since the incidence angle is set high to start with, little or no elevator is required to maintain level flight. However, as power is applied fully the effective wind direction is along the thrust axis, striking the wings at a high lift AoA. The result will be a strong climb that may be difficult to stop using the elevator (personal experience on this one). By aligning the rear wing chord line with the thrust axis the lift force caused by the motor is removed, minimizing the load on the elevator.
Second Design Method
document.docx 14 OF 19
The second design method is applicable primarily if the plane dimensions are known. Table 4-4 lists the input parameters, the computational parameters and results. The primary inputs are weight, wing dimensions (span, root, tip, and sweep), AC to AC distance, relative wing loading, and airfoil parameters.
The sequence of computations is listed along with the related equations.
The primary results are wing area, aerodynamic center, neutral point, CG, CG margin, mean aerodynamic chord, maximum AoA at stall and stall speed.
document.docx 15 OF 19
Table 4-4 Second Design MethodINPUTS ResultsName Symbols Units Common Front Rear Name Common Front RearTotal Weight Wt oz 18 Wing Area, sq. inches 82 164AC-AC Distance L inches 18 Neutral Point, inches 6.42Front/Rear CL ratio Clratio 1.5 CG, inches 7.71Wing Span Sf, Sr inches 20.3 27.2 CG margin, inches 1.29Wing Root Rf, Rr inches 4.6 6.9 Aerodynamic Center, inches 1.59 2.33Wing Tip Tf, Tr inches 3.48 5.18 MAC, inches 4.07 6.08Wing Sweep SWf, SWr inches 1.2 1.7 AoA at stall, degrees 11.56 17.56Maximum CL, no Flaps Clmaxf, Clmaxr 1 1 Stall Speed, mph 14.61 14.85CL Increase with Flaps Dclf, Dclr 0.55 0.15 Wing Load, ounces 7.71 10.29Zero AoA Crossing, no Flaps Azf, Azrr degrees -1 0Chord Angle Change With Flaps Adf, Adr degrees -7.7 2Tapered-wing Correction tauf, taur 0.16 0.11
CALCULATIONSName Symbols Units Common Front RearWing Area Af, Ar sq. inches 82.012 164.288 Sf*(Rf+Tf)/2 Sr*(Rr+Tr)
/2Front/Rear Area Ratio Afr 0.50 Af/ArL/D Ratio LDr 2.34 1+1/(CLratio*Afr)CG Distance D inches 7.71 L/LDrNeutral Point N inches 6.42 Af*L/(Af+0.9*Ar)CG Margin Cgmarg inches 1.29 D-NWing Load Wlf, Wlr oz 7.71 10.29 Wt/LDr Wt-WlfTip/Root Ratio TRf, TRr 0.76 0.75 Tf/Rf Tr/RrAspect Ratio Arf, Arr 5.02 4.50 Sf^2/Af Sr^2/ArCl slope slopef, sloper per degree 0.076 0.074 0.11*ARf/(ARf+2*(1+tau(TRf))) 0.11*ARr/(ARr+2*(1+tau(TRr)))AoA at Maximum CL AoAmaxf, AoAmaxr degrees 11.56 17.56 Azf+Adf+(CLmaxf+Dclf)/slopef Azrr+Adr+(CLmaxr+Dclr)/sloperStall Speed Vstallf, Vstallr mph 14.6 14.8 SQRT(3519*Wlf/(Af*(CLmaxf+Dclf))) SQRT(3519*Wlr/(Ar*CLmaxr))
AC Location Parameter Qf, Qr inches 1.02 1.52 (Rf^2+Rf*Tf+Tf^2)/(6*(Rf+Tf)) (Rr^2+Rr*Tr+Tr^2)/(6*(Rr+Tr))AC Location Parameter Pf, Pr 0.48 0.48 (Rf+2*Tf)/(3*(Rf+Tf)) (Rr+2*Tr)/
(3*(Rr+Tr))Aerodynamic Center Acf, Acr inches 1.59 2.33 QF+SWf*Pf Qr+SWr*
PrMean Aerodynamic Chord MACf, MACr inches 4.07 6.08 4*QF 4*Qr
document.docx 16 OF 19
Section 5 Vertical Stabilizer Requirements
Most, but not all, canard aircraft employ pusher arrangements. This is because the CG tends to be toward the rear, near the rear wing leading edge, so that balancing is difficult if the motor is in the front. The consequence of this choice is to place greater demands on the vertical stabilizer than might otherwise be necessary because of the relatively short moment arm. Figure 5-1 illustrates the problem.
Figure 5-1. Lateral Area Geometry for Determining Lateral Stability
The CG is far back, just in front of the rear wing. The area A1 in front of the CG may be larger than area A2 aft of the CG. Hence in turns the front acts like a backward weather vane, an unstable condition. By adding Area 3 to the aft end this condition can be mitigated. Areas A2+A3 must be greater than area A1 for stability. CLA stands for Center of Lateral Area, the location where the areas balance to either side. The CLA must be behind the CG. For good lateral control the rule of thumb is that the ratio of the distance LR1 to LR2 should be about 0.25. LR2 is the distance from the CG to the vertical stabilizer 1/4 mean aerodynamic chord line. Precise determination of the location of this line is not necessary.
Calculating the location of the CLA line location is not easy, nor does it tell you much about how to size the vertical stabilizer. Use the following method to establish the CLA.
Cut out a profile of the design, using heavy cardboard and mark the CG location. If two vertical stabilizers are used double the thickness where they occur. Lay the cutout on a horizontal surface on top of a sharp edged object such as a piece of triangular stock. Move the cutout until it balances. The balance point establishes the CLA location and the distance LR1. Measure the distance LR2 on the cutout. If the ratio of LR1 to LR2 is about 0.25 you are done. If the ratio is greater than 0.25, decrease the vertical stabilizer area. If it is less, increase its area or move it backward.
The pusher configuration does not lend itself to a single vertical stabilizer located on the centerline. First the fin must be in front of the propeller so it tends to be close to the CG, making it be rather large. Second, the airflow from the propeller may affect the rudder performance adversely. The solution is to use a pair of fins that are mounted along the rear edge of the wing clear of the prop circle. The usual place is to mount them at the wing tips where they can be extended rearward without affecting the ailerons. Rudders are optional as the plane will fly without them, although with less lateral control.
Section 6 General Commentary
Canards are a particular member of a class of aircraft having two lifting surfaces. They have smaller front surfaces than rear surfaces. Conventional designs are mostly two surface also with the front surface larger than the rear surface. The design principles in this document apply to any two-surface design with the document.docx 17 OF 19
primary difference being the location of the pitch controls. Canards apply pitch control via elevators, while conventional designs employ rear-wing elevators.
The results obtained by these calculations are approximations so some margin should be applied to critical areas. Some examples:
1. Pitching moments created by asymmetric airfoils is ignored. The result is that the canard wing loading is underestimated.
2. Drag moments are ignored. They too can cause pitching moments in addition to slowing the model.
3. The fuselage generally is considered to be a degrading influence on performance.
4. There usually is no flap across the fuselage so the actual flap performance is less than that calculated. It is recommended that the area blocked by the fuselage not be included in the front wing lift equations. Compensate by increasing the unblocked wing area.
5. The thrust axis may not pass through the vertical CG location and still be parallel to the rear wing chord. If that is the case, power changes will result in pitch changes, placing additional loads on the elevator. Hence if at all possible maintain parallelism with the rear wing chord while passing the thrust axis through the CG.
6. Most canard designs place the motor in the rear to satisfy CG requirements. This position also minimizes the effects of propeller airflow over the lifting and control surfaces. However, low speed control suffers, as the control surfaces become less effective. Some vertical maneuvers are not possible because there is little or no airflow over them.
7. Tractor designs are possible. In order to work the CG must be moved forward. This forward movement increases the canard wing loading so the solution is to increase its area and maybe decrease the rear wing area. The result is what is usually called a tandem-wing design.
document.docx 18 OF 19
REFERENCES
FLAPS1. Dwinell, James H., " Principles of Aerodynamics", McGraw-Hill Book Company, New York 1949, Chapter 10, pp229 - 240. Provides summary of the characteristics of flaps on performance with some data.
2. Simons, Martin, "Model Aircraft Aerodynamics", Fourth Edition, Special Interest Model Books, Dorset, England, 1999. Chapter 7.7, pp79 - 84. Provides general information on the effects of flaps on lift and drag coefficients. No data is provided. The generic CL versus AoA graphs for the differences in camber types and the generic aspect ratio effects graphs are from Simons.
3. Abbott, Ira H. & Doenhoff, Albert E., "Theory of Wing Sections", Dover Publications, Inc., New York, 1959, Chapter 8, High Lift Devices. Emphasis is on experimental data, primarily for split flaps. Appendix IV has extensive graphs of flapped wing sections for a large range of airfoils.
4. Lennon, Andy, "R/C Model Aircraft Design", Air Age Inc., 2002, Chapter 20, pp93-97. Not much is discussed on flaps. Chapter 14, pp63-66. Contains short text, one graph. Chapter 5, pp25-26. Contains a brief section on flaps with a graph.
CANARDS
1. Lennon, Andy, "R/C Model Aircraft Design", Air Age Inc., 2002. Chapter 22, pp102-110. This chapter provides an overview of canards and provides design steps and formulas. This is the best source of practical design available for models although it is incomplete, as it does not address the interaction of a flapped front wing and the rear wing.
AIRFOIL PLOTS
The airfoil plots were generated using the Profili 2.0 computer program.
document.docx 19 OF 19


![5 - Moment-Area Method[1]](https://img.pdfslide.us/doc/110x75/543fa1f2afaf9fd4148b4896/5-moment-area-method1.jpg)