Embed Size (px)
Citation preview
Canadians and Greenhouse Gas EmissionsBy: Sarah Deslippe
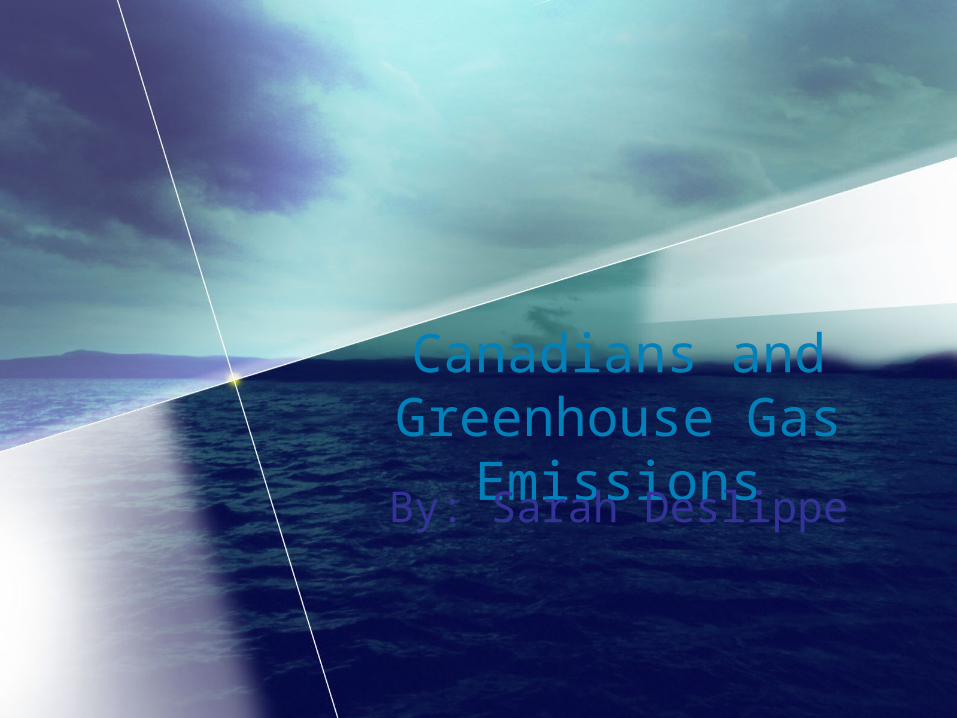
What are Greenhouse Gasses?
• Carbon Dioxide: most common type, comes from petroleum and natural gas and coal
• Methane: occurs when vegetation is burned, digested or rotted. Comes from coal mining, landfills, and agriculture
• Nitrous oxide: Burning of fossil fuels for agriculture, occurs in chemical fertilizer
Question
• How does Canada compare to the world with regards to per capita greenhouse gas emissions?
• What are the sources of greenhouse gases in Canada?
• How have the total and per capita emissions in Canada changed over the years?
• What are the possible implications if Canadians continue emitting greenhouse gases at our current rate?
Hypothesis
• I predict that a graph showing international statistics would show very low GHG emissions in at least 80% of countries surveyed and a very high consumption in the remaining 20%
• I believe that Canada’s emissions will have increased over the 10 year period I will be discussing
• I predict that Canada will have a very high record of GHG emissions owning to our climate and standard of living

International Statistics
GHGs per Capita per Country in 2003
Data For International Comparison
• Cross-sectional Study
• Examines and Compares the Total Consumption of GHGs in Tonnes of CO2 equivalent
• Single Variable Data
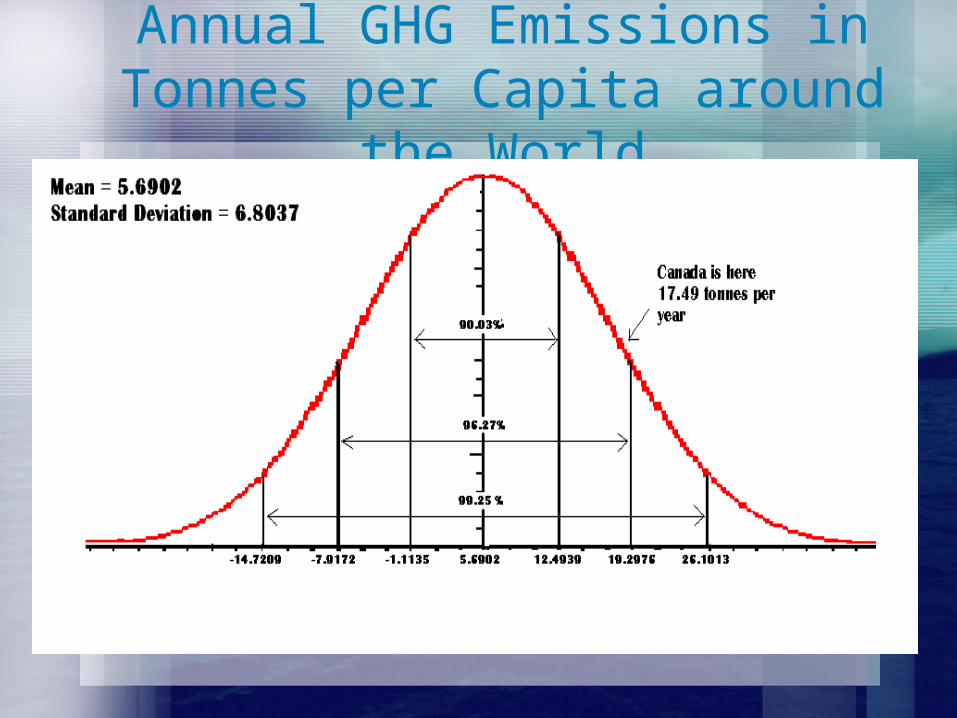
Annual GHG Emissions in Tonnes per Capita around the World
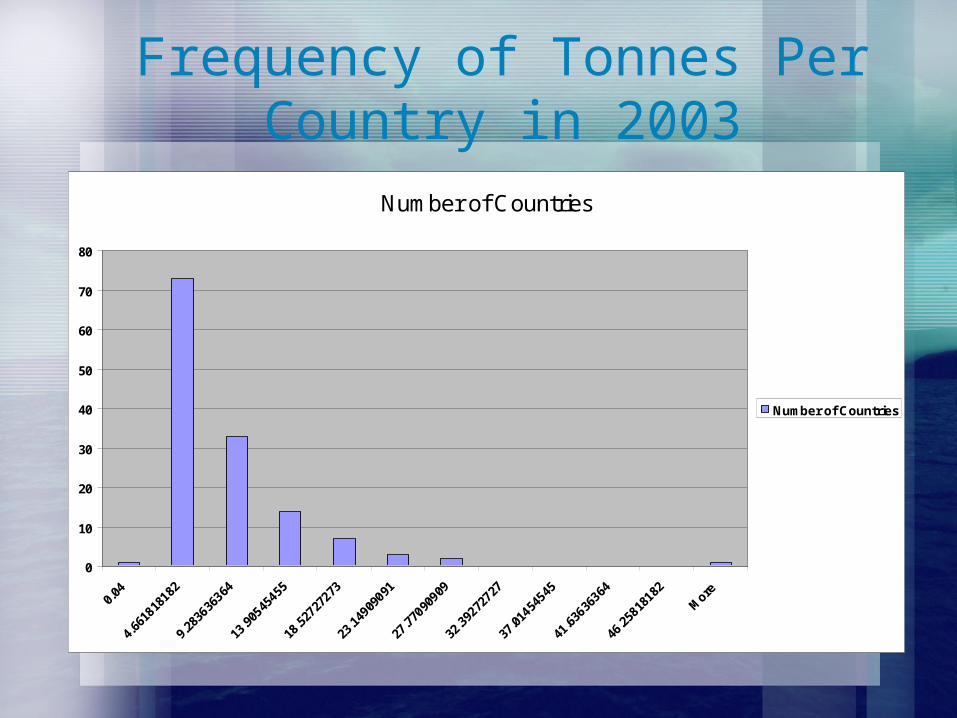
Frequency of Tonnes Per Country in 2003
Number of Countries
0
10
20
30
40
50
60
70
80
0.04
4.66
1818
182
9.28
3636
364
13.9
0545
455
18.5
2727
273
23.1
4909
091
27.7
7090
909
32.3
9272
727
37.0
1454
545
41.6
3636
364
46.2
5818
182
More
Number of Countries
Analyzing the International Distribution Chart
• Data Distribution is NOT Normal• data is too widely spread, yet too much falls
within one standard deviation– High consumption in few developed nations
(parts of North America and Europe)– Low consumption in many underdeveloped
nations (Africa, parts of Latin America)– High consumption in Newly Industrialized
nations and oil bearing nations (Iran, Kuwait, other parts of Asia)
– Medium consumption of few developed nations (parts of Europe)
GHGs in CanadaSources and Types of GHGs in Canada
Reasons for Higher GHG Emissions in Canada
• Colder winters
• Longer Traveling Distances
• Increase in Standard of Living
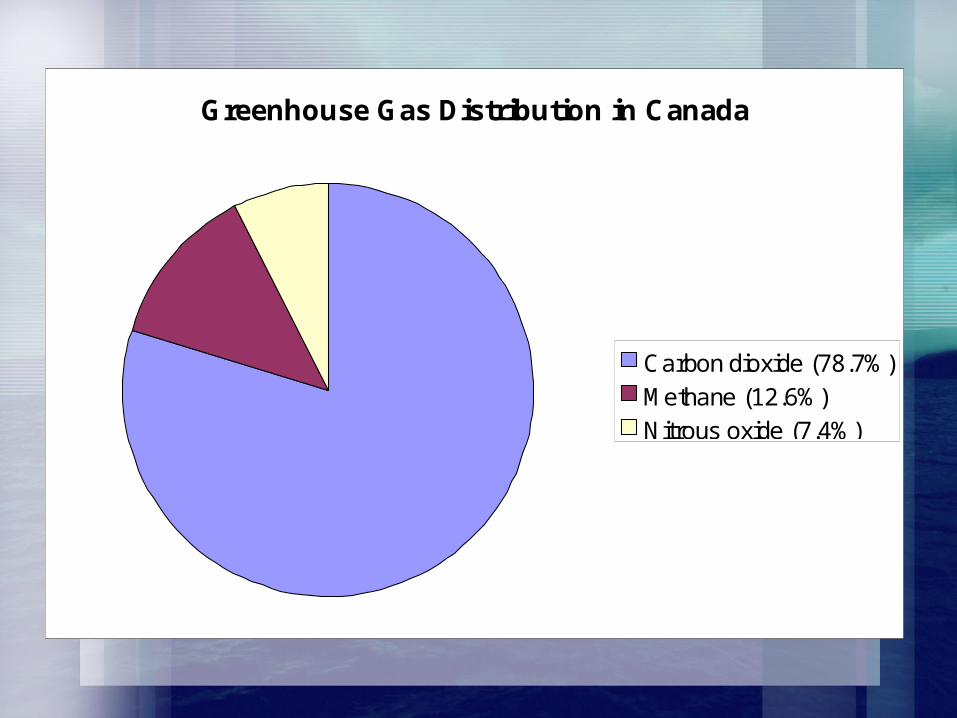
Greenhouse Gas Distribution in Canada
Carbon dioxide (78.7%)Methane (12.6%)Nitrous oxide (7.4%)
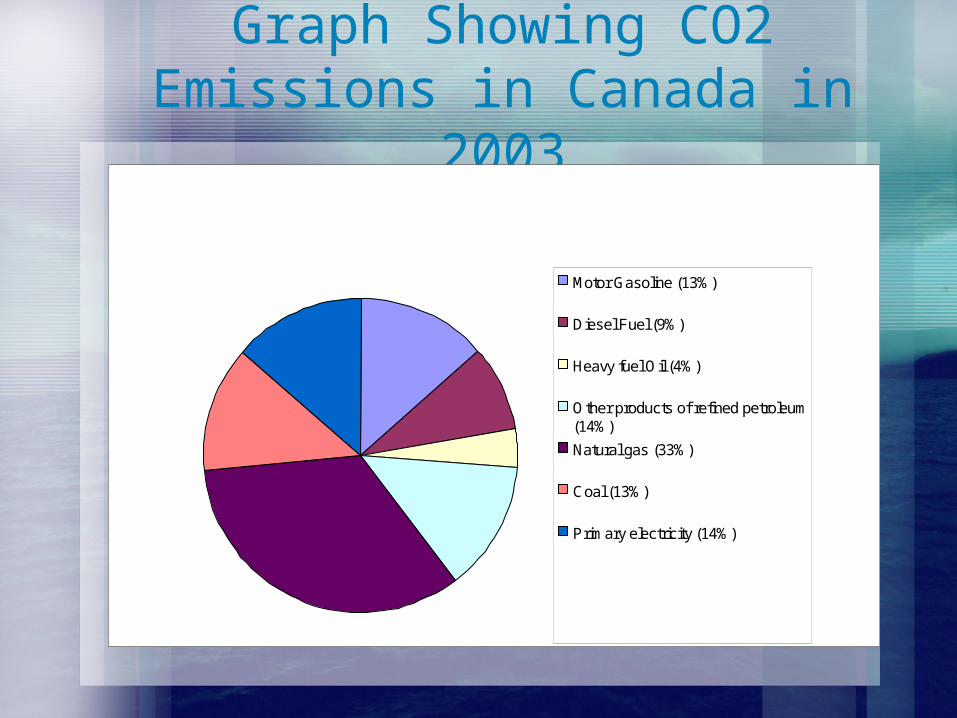
Graph Showing CO2 Emissions in Canada in 2003
Motor Gasoline (13%)
Diesel Fuel (9%)
Heavy fuel Oil (4%)
Other products of refined petroleum(14%)
Natural gas (33%)
Coal (13%)
Primary electricity (14%)
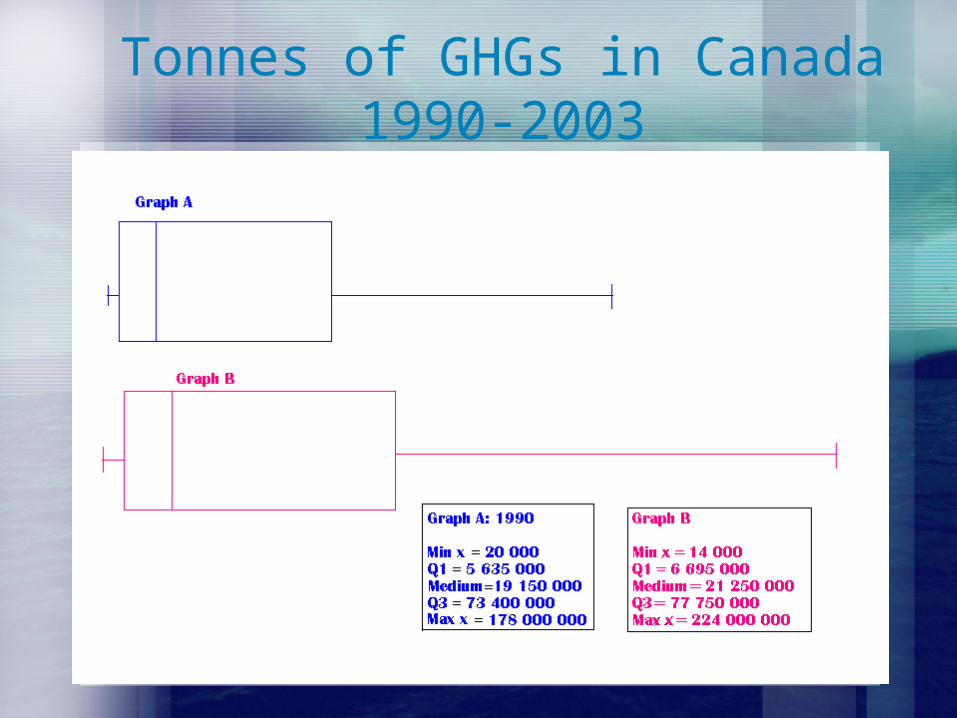
Tonnes of GHGs in Canada 1990-2003
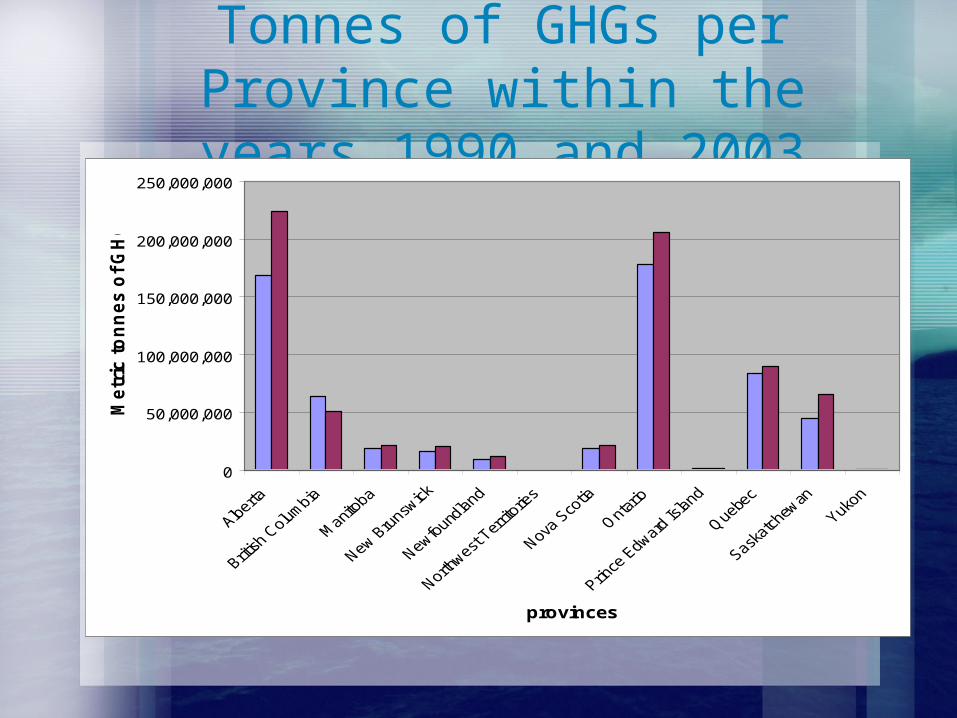
Tonnes of GHGs per Province within the years 1990 and 2003
0
50,000,000
100,000,000
150,000,000
200,000,000
250,000,000
provinces
Me
tric
to
nn
es
of
GH
Gs
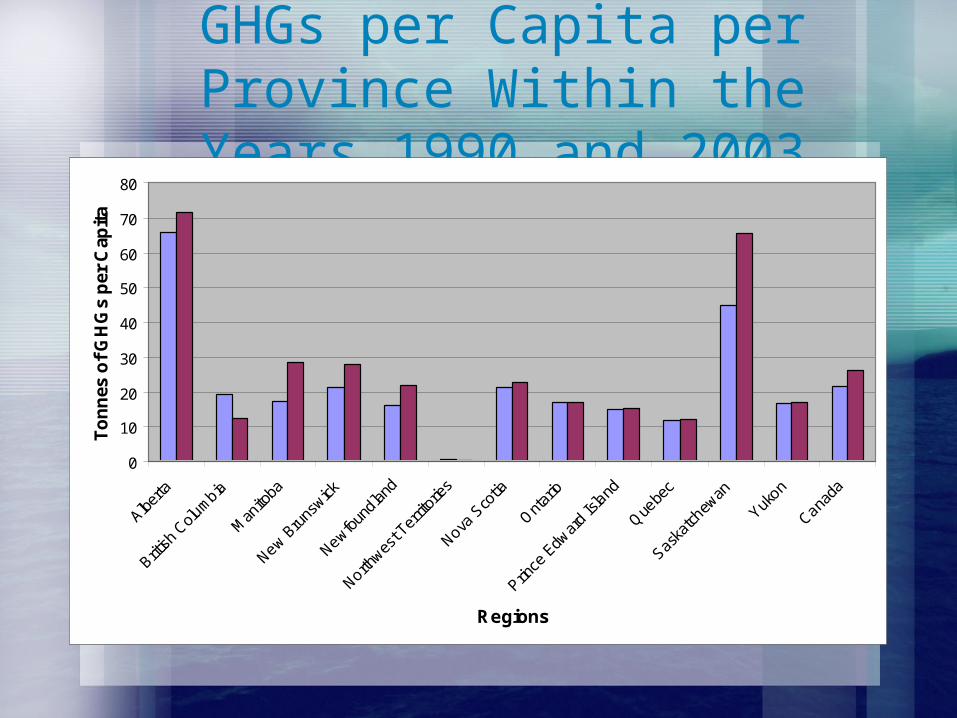
GHGs per Capita per Province Within the Years 1990 and 2003
0
10
20
30
40
50
60
70
80
Alberta
British
Colu
mbia
Man
itoba
New Bru
nswick
Newfoun
dland
Northwes
t Ter
ritor
ies
Nova S
cotia
Ontar
io
Prince
Edw
ard Is
land
Quebe
c
Saska
tchew
an
Yukon
Canada
Regions
To
nn
es o
f G
HG
s p
er C
apit
a

Province BreakdownSources per Province and Reason for Change
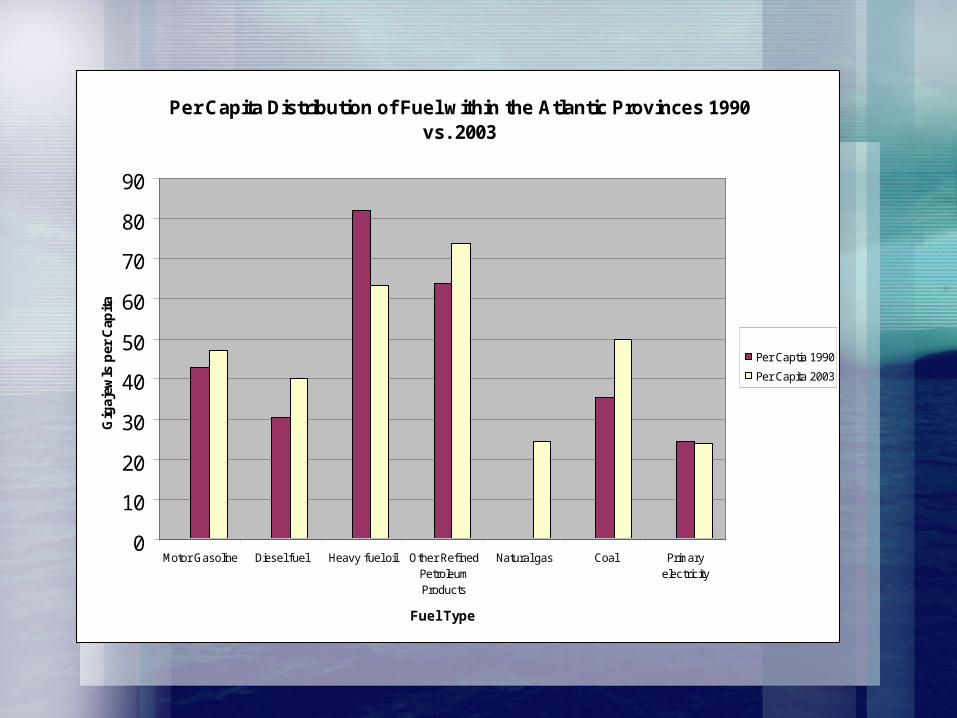
Per Capita Distribution of Fuel within the Atlantic Provinces 1990 vs. 2003
0
10
20
30
40
50
60
70
80
90
Motor Gasoline Diesel fuel Heavy fuel oil Other RefinedPetroleumProducts
Natural gas Coal Primaryelectricity
Fuel Type
Gig
ajew
ls p
er C
apit
a
Per Captia 1990
Per Capita 2003
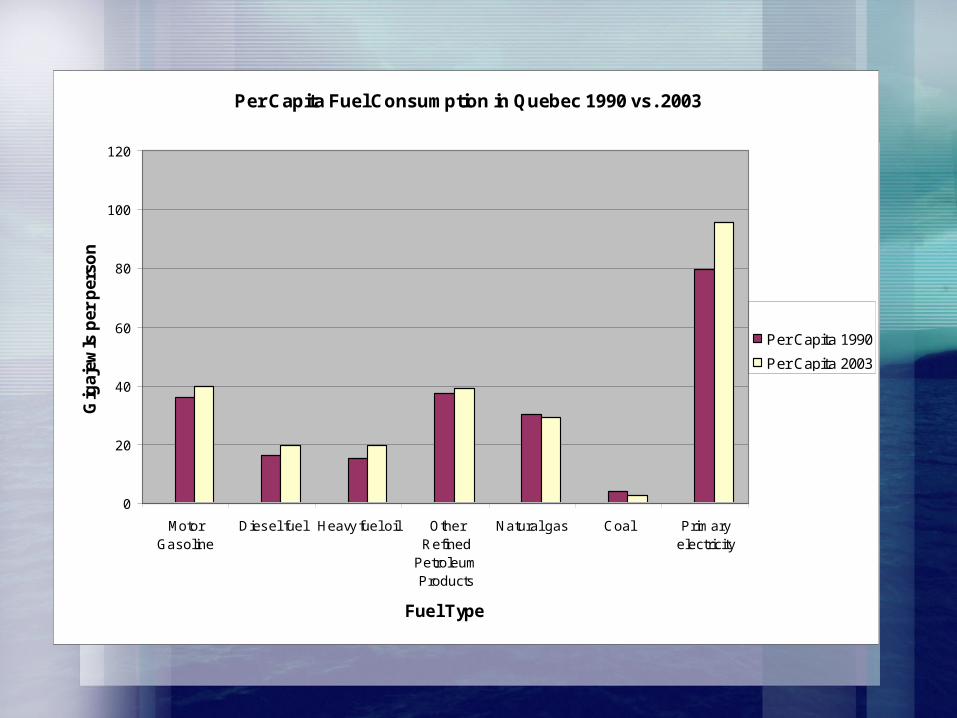
Per Capita Fuel Consumption in Quebec 1990 vs. 2003
0
20
40
60
80
100
120
MotorGasoline
Diesel fuel Heavy fuel oil OtherRefined
PetroleumProducts
Natural gas Coal Primaryelectricity
Fuel Type
Gig
ajew
ls p
er p
erso
n
Per Capita 1990
Per Capita 2003
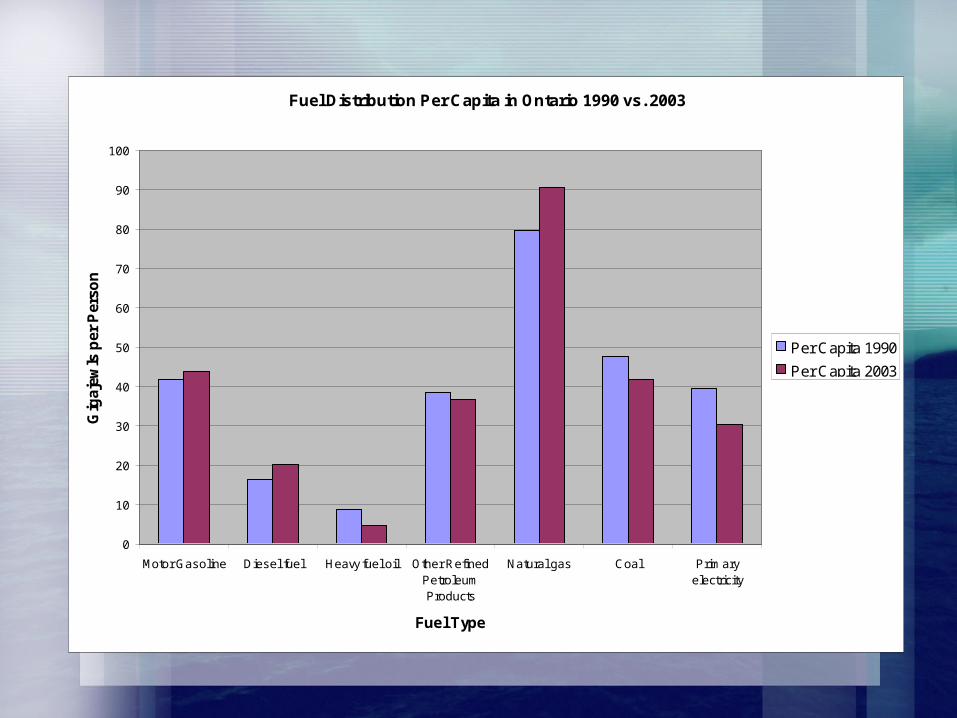
Fuel Distribution Per Capita in Ontario 1990 vs. 2003
0
10
20
30
40
50
60
70
80
90
100
Motor Gasoline Diesel fuel Heavy fuel oil Other RefinedPetroleumProducts
Natural gas Coal Primaryelectricity
Fuel Type
Gig
ajew
ls p
er P
erso
n
Per Capita 1990
Per Capita 2003
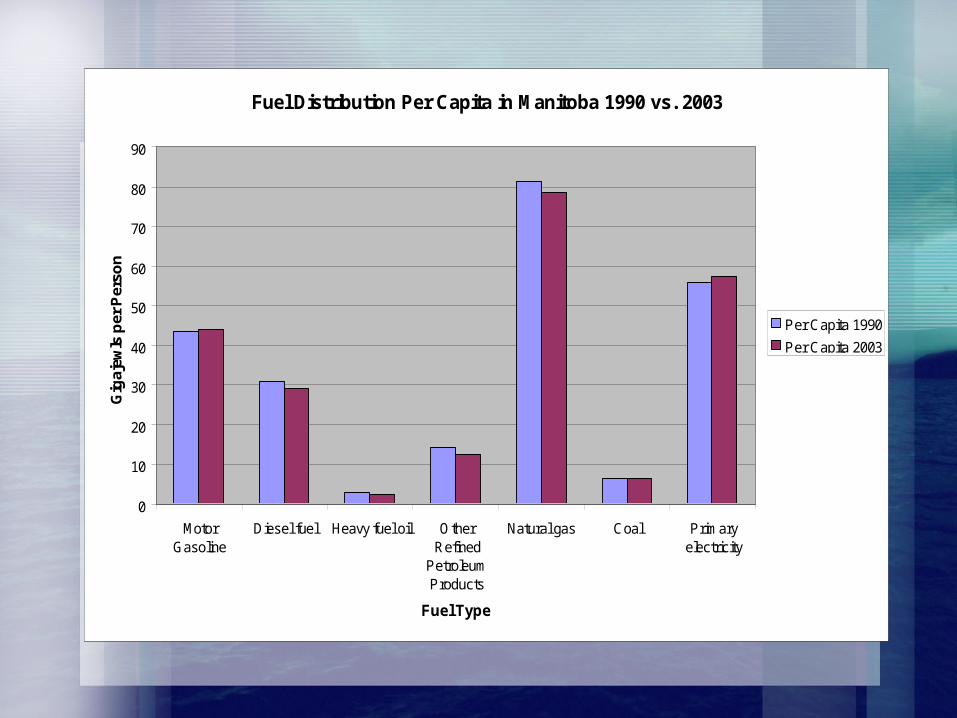
Fuel Distribution Per Capita in Manitoba 1990 vs. 2003
0
10
20
30
40
50
60
70
80
90
MotorGasoline
Diesel fuel Heavy fuel oil OtherRefined
PetroleumProducts
Natural gas Coal Primaryelectricity
Fuel Type
Gig
ajew
ls p
er P
erso
n
Per Capita 1990
Per Capita 2003
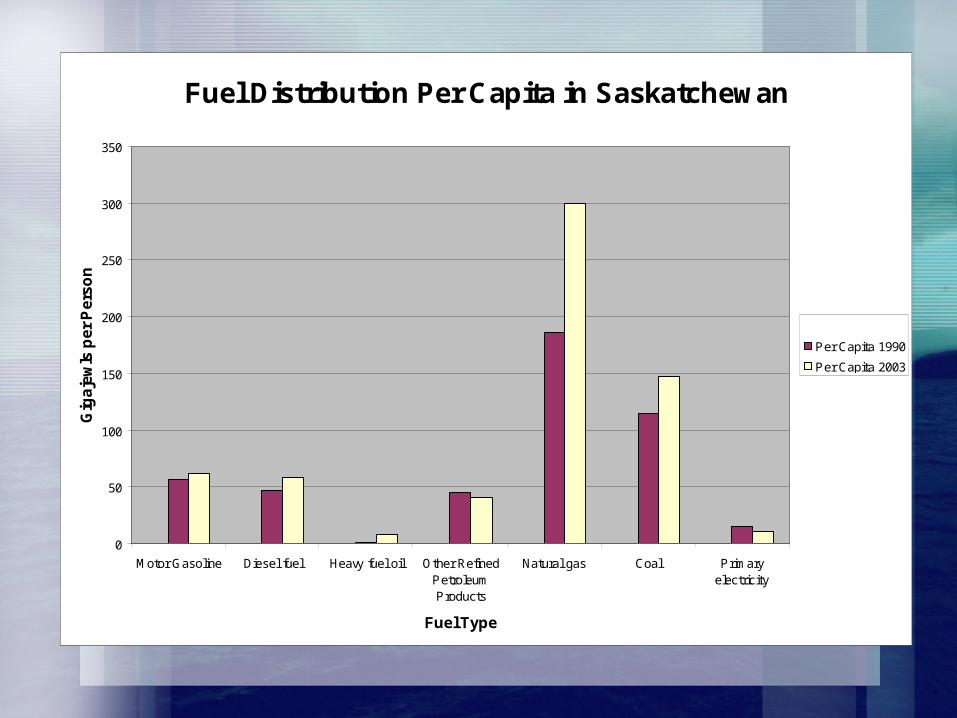
Fuel Distribution Per Capita in Saskatchewan
0
50
100
150
200
250
300
350
Motor Gasoline Diesel fuel Heavy fuel oil Other RefinedPetroleumProducts
Natural gas Coal Primaryelectricity
Fuel Type
Gig
aje
wls
pe
r P
ers
on
Per Capita 1990
Per Capita 2003
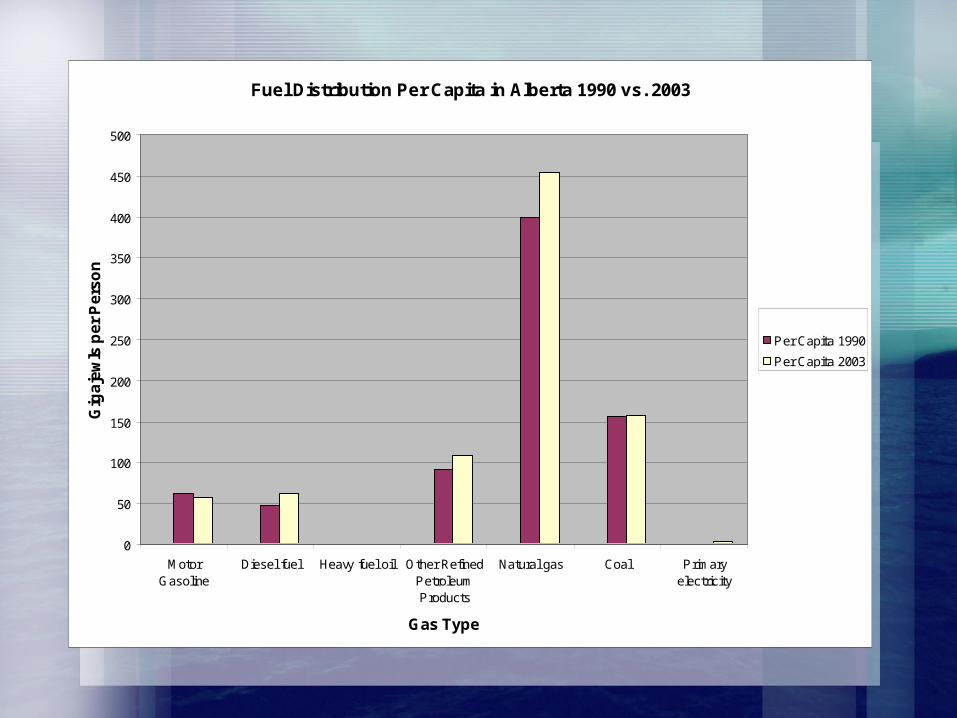
Fuel Distribution Per Capita in Alberta 1990 vs. 2003
0
50
100
150
200
250
300
350
400
450
500
MotorGasoline
Diesel fuel Heavy fuel oil Other RefinedPetroleumProducts
Natural gas Coal Primaryelectricity
Gas Type
Gig
aje
wls
pe
r P
ers
on
Per Capita 1990
Per Capita 2003
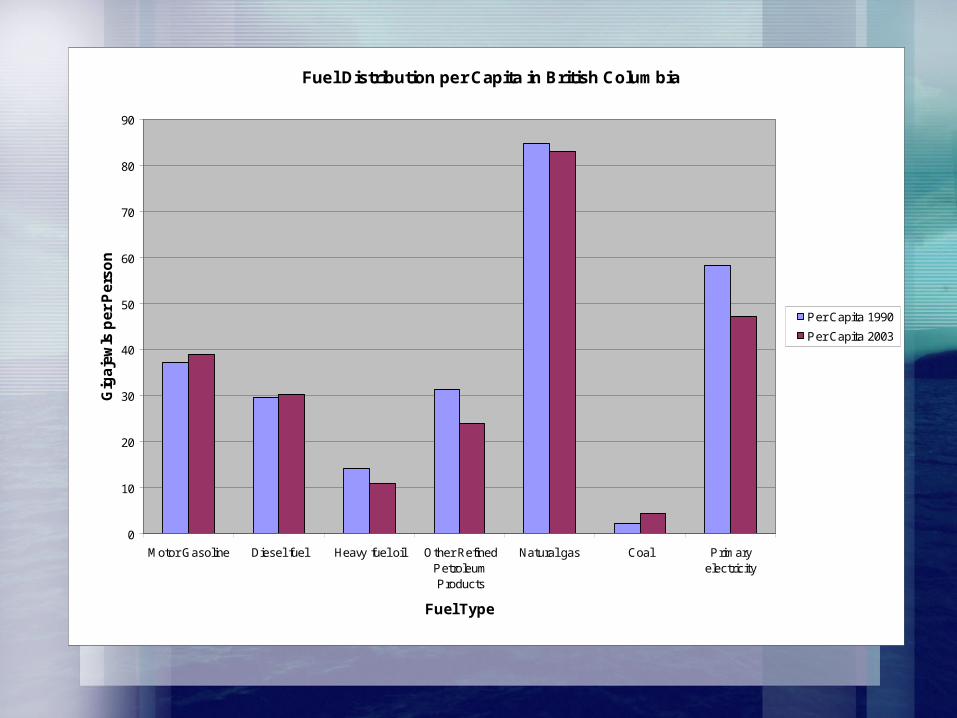
Fuel Distribution per Capita in British Columbia
0
10
20
30
40
50
60
70
80
90
Motor Gasoline Diesel fuel Heavy fuel oil Other RefinedPetroleumProducts
Natural gas Coal Primaryelectricity
Fuel Type
Gig
aje
wls
pe
r P
ers
on
Per Capita 1990
Per Capita 2003
Kilotonnes of GHG Emissions per year in Canada
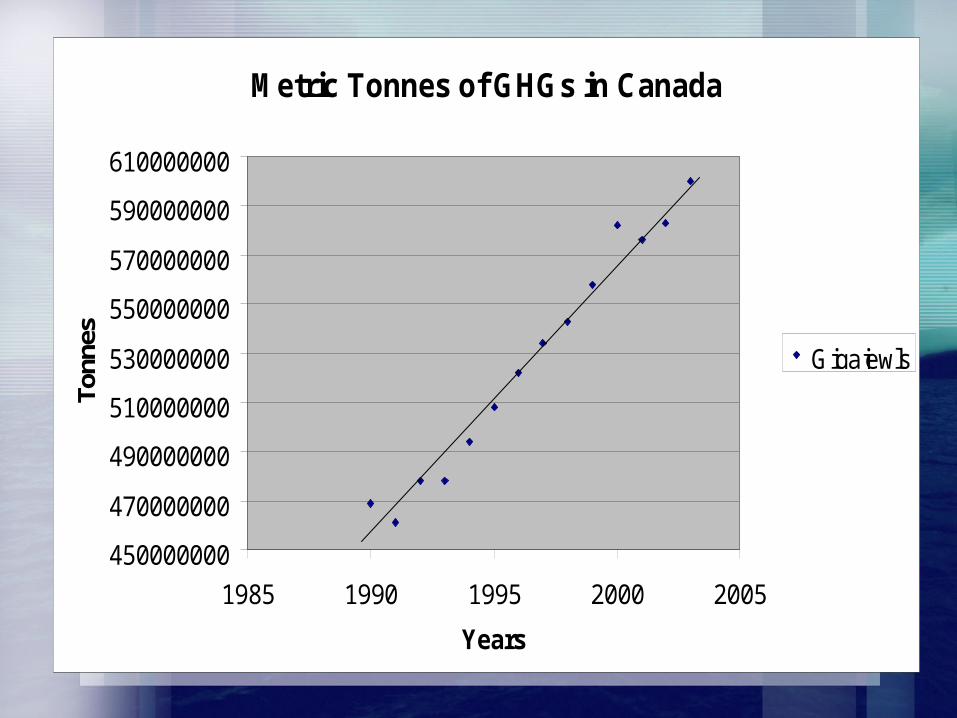
Metric Tonnes of GHGs in Canada
450000000
470000000
490000000
510000000
530000000
550000000
570000000
590000000
610000000
1985 1990 1995 2000 2005
Years
Tonn
es
Gigajewls

Facts on Graph Concerning Line of Best Fit on Total Emissions in Canada• I chose linear regression as the “r2” value
was 0.01 units closer to one then that of the quadratic
• y = mx + b• m= 10,911,694.51• b = -2.1257• r2 = .97• r = .98• Bias? Unlike the other Graphs, this one is
not per capita
Environmental Impacts• Melting of northern Glaciers may lead to wide
scale flooding (raise sea level six to seven meters• Increase risk of seasonal forest fires in Yukon and
Northwest Territories• Deadly “debris flows” in BC from wetter winters• Hotter summers decrease surface water for
consumption and recreation• Decrease of biodiversity• Coastal regions sensitive to flooding and erosion• Negative impacts on crops from smog and lack of
water• More Hurricanes of Katrina’s magnitude
Health Impacts
• Warmer climate means increase in West Nile, Malaria, and Lyme disease
• Heat stroke and dehydration• Asthma and allergies intensified• Increase in micro-organisms that
contaminate food• Increase susceptibility to lung and skin
cancer
Conclusion
• My hypothesis concerning international statistics was incorrect as I did not consider the impact of newly industrialized nations
• If Canadians and other citizens continue consuming energy the way we do we will either end up with very serious environmental and health impacts, or we will run out of energy sources
Source of DataCanada, a Big Energy Consumer: A Regional Perspective
Author: Marinka Ménard Manufacturing, Construction and Energy Division
www.statcan.ca
Environment Canada -1990-2003 National and Provincial GHG Emissions
www.ec.gc.ca
United Nations Statistics Division –Greenhouse Gas Emissions
www.un.org
One Tonne Challenge –Climate Change Impacts
www.climatechange.ca

The End