Embed Size (px)
Citation preview

WINNIPEG | OTTAWA | EDMONTON | REGINA
[email protected] www.pra.ca
Prepared for:
Canadian University Survey Consortium/
Consortium canadien de recherche sur les étudiants
universitaires
CANADIAN UNIVERSITY SURVEY CONSORTIUM
2016 FIRST-YEAR
UNIVERSITY STUDENT SURVEY
BRANDON UNIVERSITY
COMPARISON REPORT

CUSC-CCREU
2016 First-Year Student Survey
AGREEMENT FOR DATA USE
Members of the consortium are bound by the following Agreement for the control of survey data.
It was agreed by the participants that data are owned collectively and will be distributed only by
collective agreement.
1. TERMS AND CONDITIONS
Each participating member institution of the Canadian University Survey Consortium /
Consortium canadien de recherche sur les étudiants universitaires (CUSC/CCREU) has
committed, through a signed agreement, to terms and conditions regarding the collection,
storage, and use of survey data and the dissemination of related reports as follows:
A. The Corporation hereby known as the Canadian University Survey Consortium /
Consortium canadien de recherche sur les étudiants universitaires (CUSC/CCREU)
coordinates surveys of students in member institutions, facilitates the exchange of the
survey data among member institutions, and promotes awareness of the value of the
surveys among university administrators and policy makers in the post-secondary
educational system.
B. The survey data and analysis have five broad purposes for the members:
1) to better understand and track student experience and satisfaction with many aspects
of the institutions they attend
2) to improve student educational outcomes
3) to improve the services available to students
4) to benchmark for purposes of internal management and decision making
5) to contribute to accountability reports to the governing bodies of member institutions,
governments, and the public
C. The exchange of confidential data among member institutions requires goodwill and trust
among the member institutions. This Agreement shall be guided by the principle that
member institutions of CUSC/CCREU will act in the best interests of all member
institutions of the Corporation. The primary consideration in issues of disclosure of
research results shall be the avoidance of public comparisons that could damage the
reputation of a member institution.
D. Statistical measures and analysis of survey data may be of interest to wider audiences
than the members of the Corporation for policy formulation, advocacy, or publication of
research. Members of the Corporation are encouraged to make best use of the survey
data, including publication of research results while observing confidentiality
requirements.
E. The Corporation and each member institution define their respective obligations in
relation to the use of the data that is shared between the Corporation and the Members as
follows:

CUSC-CCREU
2016 First-Year Student Survey
Definitions:
In this Agreement, unless the context requires or specifies otherwise:
a. “Data” means an electronic record of the answers to the questions on the survey
instrument given by each respondent at the universities that participated in the survey.
b. “Aggregate Data” means all of the data or data for groups of universities. Generally,
aggregate data is expressed as statistics and research findings across data drawn from all
universities or groups of universities.
c. “Member Institution” means a university that is a member of CUSC/CCREU.
d. “Publish” means dissemination of research findings beyond the senior administration of a
member institution.
e. “Senior Administration” means the officer of a member institution with overall
responsibility for academic programs and student services.
2. OWNERSHIP OF SURVEY DATA
The data collected in surveys of students attending a member institution is the property of that
institution.
3. EXCHANGE OF SURVEY DATA AMONG MEMBERS
Each member institution will make its survey data available to other member institutions for the
general purposes as outlined in Parts A to E above. Each member institution is bound by
restrictions on the use and disclosure of data belonging to other member institutions.
4. COMPARISONS LIMITED TO AGGREGATE DATA
The only interuniversity comparisons permitted for publication or circulation beyond a member
institution’s senior administration are those based on the aggregate data for all member
institutions or the aggregate data for the groups of member institutions identified by
CUSC/CCREU.
A member institution may prepare and circulate reports based on aggregated data from selected
groups of member institutions for internal use only to senior administrators of its institution.
5. LIMITATIONS ON THE USE OF DATA
A member institution may not publish statistical measures or analysis of its own data for
purposes of institutional promotion in a manner that would harm the reputation of another
member institution.
A member institution may not publish statistical measures or analysis of data collected at another
member institution with the name of the institution disclosed. Member institutions may publish
statistical measures and analysis of their own data.
A member institution may not publish statistical measures or analysis of data collected at another
member institution that would allow an informed reader to identify the institution by reference to
location, uncommon programs, or other information contained in the published material.

CUSC-CCREU
2016 First-Year Student Survey
6. REQUIREMENTS FOR CONFIDENTIALITY
A member institution may make available to its senior administrators statistical measures and
analysis of data from another member institution, with the identity of the member disclosed, for
the purposes outlined in Parts A–E above. The member institution disclosing the identity of
another member institution in these circumstances must ensure that those to whom the
information is made available are aware of its confidential nature and restricted audience.
A member institution may be requested to disclose data or statistical measures under freedom of
information legislation or other requirements for accountability. In these circumstances, member
institutions may disclose their own data to fulfill the request. Member institutions shall not
disclose data that belongs to other member institutions unless the request explicitly demands it
and legal counsel advises that the request must be fulfilled. If it must be fulfilled, the member
institution shall notify immediately the other member institution(s). If it does not have to be
fulfilled the requester should be referred to the other member institution(s), which should be
notified immediately.
7. EXCLUSIVE USE OF INSTRUMENTS AND METHODOLOGY
The survey instruments and methodology are for the exclusive use of the member institutions
and are not to be shared with organizations outside the Corporation.
8. ACCESS TO AGGREGATE DATA
Access to the aggregate data for research purposes may be granted to interested persons,
provided the intended use is a legitimate, non-commercial one, and the researcher is qualified
and agrees to acknowledge ownership of the data by participating universities and provide the
consortium with a copy of any report or publication that is produced. Decisions on such requests
will be made by the CUSC/CCREU Board of Directors in consultation with members of the
consortium (all participating institutions) in the case of requests that seem problematic.

CUSC-CCREU
2016 First-Year Student Survey
Table of Contents
AGREEMENT FOR DATA USE
EXECUTIVE SUMMARY ........................................................................................................................... i
1.0 Introduction ...................................................................................................................................... 1 1.1 Methodology ........................................................................................................... 2
1.2 Response rates ......................................................................................................... 3 1.3 Weighting ................................................................................................................ 4 1.4 University comparisons .......................................................................................... 5 1.5 Statistically significant differences ......................................................................... 5 1.6 Non-response .......................................................................................................... 5
2.0 Profile of first-year students ............................................................................................................. 6 2.1 Personal profile ....................................................................................................... 6 2.2 Disabilities .............................................................................................................. 8
2.3 Living arrangements ............................................................................................... 9 2.4 Parents’ education ................................................................................................. 10
3.0 Motivation for attending university ............................................................................................... 11 3.1 Importance of reasons for going to university ...................................................... 11 3.2 Most important reason .......................................................................................... 12
4.0 Choosing a university .................................................................................................................... 13 4.1 Applications .......................................................................................................... 13
4.2 Selecting their university ...................................................................................... 14 4.3 Selecting their university (International students) ................................................ 15 4.4 Sources of information .......................................................................................... 16
5.0 Orientation ..................................................................................................................................... 17
6.0 Registration .................................................................................................................................... 17
7.0 Expectations and experience .......................................................................................................... 18 7.1 Overall expectations.............................................................................................. 19
8.0 Transition to university .................................................................................................................. 20
9.0 Educational experiences ................................................................................................................. 21 9.1 Perceptions of professors ...................................................................................... 21 9.2 Ability to evaluate teaching .................................................................................. 22
9.3 Satisfaction with quality of teaching..................................................................... 22 9.4 Perceptions of staff ............................................................................................... 23
10.0 Commitment to completion ........................................................................................................... 24 10.1 Perceptions of effort .............................................................................................. 24 10.2 Perceptions of university education ...................................................................... 25
10.3 Perceptions of finances ......................................................................................... 25 10.4 Perceptions of persistence ..................................................................................... 26 10.5 Feel as if they belong at this university ................................................................ 26

CUSC-CCREU
2016 First-Year Student Survey
11.0 Overall evaluation .......................................................................................................................... 27 11.1 Satisfaction with concern shown by student as an individual............................... 27
11.2 Satisfaction with decision to attend this university............................................... 27 11.3 Recommend university to others .......................................................................... 27
12.0 Goal development .......................................................................................................................... 28 12.1 Chosen a major or discipline................................................................................. 28 12.2 Post-graduation plans ............................................................................................ 28 12.3 Career planning ..................................................................................................... 29 12.4 Steps taken for employment post-graduation ....................................................... 29
13.0 Satisfaction with facilities and services ......................................................................................... 30 13.1 General facilities and services .............................................................................. 30 13.2 Academic services ................................................................................................ 31
13.3 Special services ..................................................................................................... 32
14.0 Academic profile ............................................................................................................................ 33
15.0 Current employment ...................................................................................................................... 34
16.0 Finances ......................................................................................................................................... 35 16.1 Credit cards ........................................................................................................... 35
16.2 Financial awards and assistance............................................................................ 36
Appendix A – 2015 CUSC-CCREU Survey

CUSC-CCREU i
2016 First-Year Student Survey
EXECUTIVE SUMMARY
Introduction
The 2016 First-Year Student Survey marks the 22nd cooperative study undertaken by the
Canadian University Survey Consortium/Consortium canadien de recherche sur les étudiants
universitaires (CUSC-CCREU). The 2016 survey involved 34 universities and almost 15,000
first-year university students from across Canada.
Profile of first-year students
The demographic profile of first-year students shows the following:
► First-year students tend to be Canadian citizens (88%), female (66%), and 18 years old
(64%). Many self-identify as a member of a visible minority (40%), while few self-
identify as Aboriginal (3%).
► About 22% self-identify as having a disability; among those with a disability, it is most
often a mental health issue (12%).
► Many first-year students live in on-campus housing (40%), and among those who do not
live in on-campus housing, 33% would like to if given the opportunity.
► Just 11% of first-year students are first-generation students — that is, neither parent had
any post-secondary education. Conversely, 20% have at least one parent/guardian who
completed a graduate degree.
Motivation for attending university
When asked to select the most important reason for why they decided to attend university,
preparing for a specific job or career (44%) was the most important reason. However, two other
non-job related aspects land in the top five, and include to apply what they learn to make a
positive difference in society (10%) and to satisfy their intellectual curiosity (7%).
Choosing a university
Overall, 76% of students applied to a university other than the one they are currently attending.
On average, they applied to about two other universities. About 17% applied to a college or
CEGEP in addition to their current university. Although many students applied elsewhere, 81%
said they are attending their first choice.
Students said that, among the 18 aspects explored, their university has the program they wanted
to take (33%), but also wanting to live close to home (16%) and their program had a work
experience program (12%) were the most important reasons for selecting their university.
In terms of source of information, visits to campus for an open house (52%), their university’s
website (50%), and parents (46%) were the most important sources of information. At the lower
end, the university’s Facebook site (14%), university’s social media sites (12%), and contact
with university athletic coaches (8%) were not rated as being important relative to other aspects.

CUSC-CCREU ii
2016 First-Year Student Survey
Orientation and registration
About 68% of first-year students participated in orientation. Among those who participated in
orientation, most seemed to be satisfied with aspects related to orientation, and were most
satisfied that orientation made them feel welcome at their university (93%) and least satisfied
with orientation building their confidence (77%).
Overall, students seemed to be satisfied with registration, including 84% who were satisfied with
getting into all the courses they wanted and 78% who were satisfied with the process of
registering for their courses.
Expectations and experience
First-year students rated 17 experiences as to whether they exceeded, met, or fell below their
expectations. Results seem to indicate that students are more likely to be surprised about the
academic challenges of university (e.g., time to put into their coursework and how demanding
their courses are) and cost-related aspects (e.g., cost of going to university and debt to complete
program).
When asked to summarize their overall experiences to date, first-year students are slightly more
likely to say their university experiences exceeded (23%) rather than fell short (13%) of their
expectations. Another 64% said the university met their expectations.
Transition to university
Students found success in many aspects, with many aspects having more than 8 in 10 students
saying they have had some or very much success. The two areas where students have found less
success are finding career information (17% very much) and becoming involved in campus
activities (14% very much).
Educational experiences
Students rated their satisfaction with various educational experiences:
► Most students reported having had positive experiences with professors. In fact, among 15
aspects of interaction with professors, only three areas (professors take a personal interest in
their academic progress, professors provide useful feedback on academic work, and
professors provide prompt feedback on academic work) received less than 70% agreement.
► Overall, almost all students said they were given the chance to evaluate the quality of
teaching in their courses, although fewer than half (47%) said they were able to evaluate the
teaching in all their courses.
► Among first-year students, almost 9 in 10 agreed that they are generally satisfied with the
quality of teaching they received, including 18% who strongly agreed.

CUSC-CCREU iii
2016 First-Year Student Survey
Commitment to completion
Several measures were used to gauge students’ commitment to completing their programs at
their universities.
► Almost all students agreed that they are willing to put a lot of effort into being successful
at university (50% strongly agreed), which is reflected in the fact that almost as many
agreed that they normally go to all of their classes (51% strongly agreed). Although
students may feel they can put in the effort, about 7 in 10 agreed that they can deal with
stress, but only 17% strongly agreed. Also, just 6 in 10 agreed that they have good study
habits, and just 12% strongly agreed.
► Results show that at least 3 in 4 first-year students agreed with the survey’s statements
about their university education, including that most of their courses are interesting (25%
strongly agreed), their course load is manageable (15% strongly agreed), they had
adequate information about their program from the university before they enrolled (19%
strongly agreed), and they are in the right program (32% strongly agreed).
► About 7 in 10 students agreed that a university degree is worth the cost (30% strongly agreed)
or that they have the financial resources to complete their program (20% strongly agreed).
► At the time of the survey, 9 in 10 first-year students plan to come back to their university
next year including 58% who strongly agreed. Slightly fewer (about 8 in 10) plan to
complete their degree at their university, including 48% who strongly agreed. Just 9%
plan to transfer to another university next year, while 5% plan on going to
college/CEGEP next year.
► About 3 in 4 first-year students agreed that they feel as if they belong at this university,
including 24% who strongly agreed.
Overall evaluation of student experiences
When rating their experiences at university, students indicated the following:
► Almost 3 in 4 first-year students said they are satisfied with the concern shown by the
university for them as an individual, although just 6% are very satisfied.
► Over 9 in 10 first-year students are satisfied with their decision to attend their university,
including 25% who are very satisfied.
► Overall, 95% of first-year students would recommend their university to others.
Goal development
The following bullets summarize information about students’ goals, both for their current and
future programs.
► About 73% of first-year students said they had selected their major or discipline.
► At this early point in their university studies, students seem to be equally likely to want to
apply to a professional program (29%) as graduate school (34%), although many seem to
be unsure at this point.

CUSC-CCREU iv
2016 First-Year Student Survey
► Overall, 31% of first-year students have a specific career in mind, while another 32% have
several possible careers in mind. Despite many having a career (or two) in mind, just 19%
said they know their career options very well.
► First-year students have taken few concrete steps to prepare for employment, as most steps
involve gathering information from talking with parents/family (75%), friends (65%), or
professors (23%). Among more concrete behaviours, 42% have a resumé or CV, while
about 23% have volunteered in their chosen field of employment.
Satisfaction with facilities and services
Students indicated their use and satisfaction with several different facilities and services, which
are categorized below.
► General facilities and services. Among those who used each general service or facility,
students are satisfied. Among 13 areas, two have satisfaction ratings below 80%: parking
facilities (53%) and food services (71%).
► Academic services. Among those who have used each academic service, students
reported very high levels of satisfaction, ranging from 86% to 92%.
► Special services. Satisfaction with special services is also very high, with at least 77% of
those who used them saying they are satisfied or very satisfied with it. Interestingly, the
special services that are used more frequently tend to be those that have a lower proportion
of students satisfied, as financial aid and personal counselling are used most often.
Academic profile
Results show that the majority of first-year students are attending full-time (95%), began their
post-secondary studies (83%) or studies at their current university (91%) in the current academic
year (83%), did not transfer from another institution (94%), and reported an average grade of B-
or higher (79%).
Current employment
Overall, 34% of first-year students are currently employed, most often off campus. Among those
who are currently employed, results show that the typical student works about 14 hours per week
and about 43% said their employment has a negative impact on their academic performance.
Financing education
About 60% of first-year students reported they have at least one credit card. Among those
students who have credit cards, about 88% reported they pay off their balance each month and
they carry an average balance of $487.
Overall, 58% of first-year students said they have received a financial award from their
university. Among those who received an award, 71% said they would not have been able to
attend university without this financial assistance.

CUSC-CCREU 1
2016 First-Year Student Survey
1.0 Introduction
Since 1994, the Canadian University Survey Consortium/Consortium canadien de recherche sur
les étudiants universitaires (CUSC-CCREU) has coordinated surveys of students attending
member institutions and facilitated sharing the survey data among its member institutions.
The surveys and shared data have the following five broad purposes:
► to better understand and track students’ experiences and satisfaction with many aspects of
the universities they attend
► to improve students’ educational outcomes
► to improve the services available to students
► to benchmark for purposes of internal management and decision making
► to contribute to accountability reports for the governing bodies of member institutions,
governments, and the public
This is the 22nd cooperative study undertaken by CUSC-CCREU. Prior to 2014, the surveys ran
in a three-year cycle, targeting first-year, graduating, and all students in separate years. In 2014,
the all students survey was changed to a survey of middle-years students (i.e., students in the
second or third year of a four-year program, second year of a three-year program, or second to
fourth years of a five-year program).
Table 1 shows the types of students CUSC-CCREU has surveyed and the number of
participating universities each year.
Table 1: Past CUSC-CCREU surveys
Year Sample Number of participating
universities
1994 All undergraduates 8
1996 All undergraduates 10
1997 Graduating students 9
1998 First-year students 19
1999 All undergraduates 23
2000 Graduating students 22
2001 First-year students 26
2002 All undergraduates 30
2003 Graduating students 26
2004 First-year students 27
2005 All undergraduates 28
2006 Graduating students 25
2007 First-year students 34
2008 All undergraduates 31
2009 Graduating students 34
2010 First-year students 38
2011 All undergraduates 25
2012 Graduating students 37
2013 First-year students 35
2014 Middle-years students 28
2015 Graduating students 36
2016 First-year students 34

CUSC-CCREU 2
2016 First-Year Student Survey
1.1 Methodology
1.1.1 Questionnaire design
CUSC-CCREU surveys run on a three-year cycle, targeting a different group of undergraduate
Baccalaureate students each year. Starting in 2014, CUSC-CCREU redesigned the surveys with a
core set of questions that are common to all three surveys and questions that are specific to each
group of students. The final questionnaire for the 2016 First-Year Student Survey can be found in
Appendix A.
1.1.2 Surveying students
Each university supported the study by generating a sample of qualifying students. In some
cases, institutions provided all qualifying students, while others provided a random sample of
students.
PRA was responsible for managing the online survey. This involved liaising with the
participating universities, providing the company contracted to host the online survey with a
database of student email addresses, preparing the introductory and reminder emails to students,
and responding to student questions about questionnaire content, as well as technical questions
about using the online survey.

CUSC-CCREU 3
2016 First-Year Student Survey
1.2 Response rates
Table 2 shows the response rates by university, which ranged from 11.7% to 53.6%, with an
overall response rate of 25.7%. This yielded 14,886 students who completed the survey.1
Table 2: Survey response rate
University Surveys Response
rate Distributed Completed Brandon University 579 133 23.0%
Brock University 2,916 542 18.6%
Carleton University 4,069 1,017 25.0%
Concordia University 5,669 1,250 22.0%
Concordia University of Edmonton 396 154 38.9%
Dalhousie University 2,329 752 32.3%
Lakehead University 917 346 37.7%
McGill University 5,396 764 14.2%
McMaster University 4,940 675 13.7%
Mount Royal University 1,037 379 36.5%
Nipissing University 597 231 38.7%
Redeemer University College 144 75 52.1%
Ryerson University 1,000 205 20.5%
Saint Mary's University 894 298 33.3%
Simon Fraser University 1,000 499 49.9%
The King's University 181 97 53.6%
Thompson Rivers University 623 275 44.1%
Trent University 1,437 308 21.4%
Trinity Western University 345 124 35.9%
Université de Moncton 616 281 45.6%
Université de Sherbrooke 2,138 695 32.5%
University of King's College 230 84 36.5%
University of Lethbridge 1,000 357 35.7%
University of Manitoba 4,048 885 21.9%
University of New Brunswick (Fredericton) 920 252 27.4%
University of New Brunswick (Saint John) 400 149 37.3%
University of Northern British Columbia 347 153 44.1%
University of Regina 1,500 657 43.8%
University of Saskatchewan 1,944 553 28.4%
University of the Fraser Valley 2,059 241 11.7%
University of Victoria 1,000 287 28.7%
University of Waterloo 2,000 711 35.6%
University of Winnipeg 1,119 353 31.5%
Wilfrid Laurier University 4,139 1,104 26.7%
Total 57,929 14,886 25.7%
1 PRA defined a completed survey as one on which a student answered up to the Living Arrangements
section (approximately 80% of the questions).

CUSC-CCREU 4
2016 First-Year Student Survey
1.3 Weighting
In order to compensate for the discrepancies between the population of first-year students among
participating institutions and the sample population, the data in this report have been weighted.
The applied weights are shown in Table 3.
Table 3: Applied weights
University
Population of first-year students
Completed surveys Applied weight
Population % of
population Population
% of population
Brandon University 579 0.82% 133 0.9% 0.918
Brock University 2916 4.13% 542 3.6% 1.134
Carleton University 4069 5.76% 1017 6.8% 0.844
Concordia University 5669 8.03% 1250 8.4% 0.956
Concordia University of Edmonton 396 0.56% 154 1.0% 0.542
Dalhousie University 2329 3.30% 752 5.1% 0.653
Lakehead University 917 1.30% 346 2.3% 0.559
McGill University 5396 7.64% 764 5.1% 1.489
McMaster University 4940 7.00% 675 4.5% 1.543
Mount Royal University 1037 1.47% 379 2.5% 0.577
Nipissing University 597 0.85% 231 1.6% 0.545
Redeemer University College 144 0.20% 75 0.5% 0.405
Ryerson University 5639 7.99% 205 1.4% 5.800
Saint Mary's University 894 1.27% 298 2.0% 0.633
Simon Fraser University 3185 4.51% 499 3.4% 1.346
The King's University 181 0.26% 97 0.7% 0.393
Thompson Rivers University 623 0.88% 275 1.8% 0.478
Trent University 1437 2.04% 308 2.1% 0.984
Trinity Western University 345 0.49% 124 0.8% 0.587
Université de Moncton 616 0.87% 281 1.9% 0.462
Université de Sherbrooke 2138 3.03% 695 4.7% 0.649
University of King's College 230 0.33% 84 0.6% 0.577
University of Lethbridge 1112 1.58% 357 2.4% 0.657
University of Manitoba 4048 5.73% 885 5.9% 0.964
University of New Brunswick (Fredericton) 920 1.30% 252 1.7% 0.770
University of New Brunswick (Saint John) 400 0.57% 149 1.0% 0.566
University of Northern British Columbia 347 0.49% 153 1.0% 0.478
University of Regina 1571 2.23% 657 4.4% 0.504
University of Saskatchewan 1944 2.75% 553 3.7% 0.741
University of the Fraser Valley 2059 2.92% 241 1.6% 1.801
University of Victoria 2583 3.66% 287 1.9% 1.898
University of Waterloo 6079 8.61% 711 4.8% 1.803
University of Winnipeg 1119 1.59% 353 2.4% 0.668
Wilfrid Laurier University 4139 5.86% 1104 7.4% 0.791

CUSC-CCREU 5
2016 First-Year Student Survey
1.4 University comparisons
For comparison purposes, participating universities were categorized into three groups, shown in
Table 4.
► Group 1 consists of universities that offer primarily undergraduate studies and that have
smaller student populations.
► Group 2 consists of universities that offer both undergraduate and graduate studies and
that tend to be of medium size in terms of student population.
► Group 3 consists of universities that offer both undergraduate and graduate degrees, with
most having professional schools as well. These tend to be the largest institutions in
terms of student populations.
Table 4: Categories of participating universities
Group 1 (n = 15) Group 2 (n = 12) Group 3 (n = 7)
Brandon University Concordia University of Edmonton Mount Royal University Nipissing University Redeemer University College Saint Mary's University The King's University Trent University Trinity Western University University of King's College University of Lethbridge University of New Brunswick (Saint John) University of Northern British Columbia University of the Fraser Valley University of Winnipeg
Brock University Carleton University Lakehead University Ryerson University Simon Fraser University Thompson Rivers University Université de Moncton University of New Brunswick (Fredericton) University of Regina University of Victoria University of Waterloo Wilfrid Laurier University
Concordia University Dalhousie University McGill University McMaster University Université de Sherbrooke University of Manitoba University of Saskatchewan
1.5 Statistically significant differences
Large sample sizes may inflate measures of statistical significance and may lead to false
conclusions about the strength of association. The chi-square measure of association, in
particular, is susceptible to this possibility. Therefore, the standards for designating whether a
relationship can be termed statistically significant have been increased: the Pearson’s chi-square
must have probability of a type 1 error of less than .001 and either the Phi coefficient or
Cramer’s V must have a value of .150 or greater. Throughout this document, any differences
reported meet these criteria, unless otherwise stated.
Table 5: Criteria for statistical significance
Test Level for significance
Pearson’s chi-square <.001
Phi coefficient or Cramer’s V .150 or higher
1.6 Non-response
Non-responses have not been included in the analysis. Therefore, throughout this report, unless
explicitly stated as a subpopulation, overall results exclude those who did not respond to a
particular question.

CUSC-CCREU 6
2016 First-Year Student Survey
2.0 Profile of first-year students
2.1 Personal profile
Results on the following page show the following:
► There is about double the number of females (66%) than males (34%). Although the
survey does tend to over-represent females, females were still made up the majority of the
sample provided by universities.
► The typical student is between 18 to 19 years of age, and 64% of students are 18 or
younger. Given students’ ages, it is not surprising that just 2% reported being married and
1% have children. Those attending Group 2 universities (18.0 years) tend to be about a
year younger on average than those attending Group 3 (19.1 years) or Group 1 (19.3
years). This appears to be largely driven by the fact that 82% of those in Group 2 were 18
years old or younger compared to 57% in Group 1 and 44% in Group 3 universities.
► About 88% of students are Canadian citizens, with the remaining students almost equally
split among those who are international students (7%) or permanent residents (5%).
Although it falls just below the threshold for statistical significance, it appears that
students attending a Group 3 (83%) university are much less likely than those attending
Group 1 (92%) or Group 2 (91%) universities to be Canadian citizens.
► Overall, 40% of students reported being a visible minority, and 3% self-identify as being
Aboriginal. Group 2 (46%) and Group 3 (38%) universities are much more likely than
Group 1 (24%) universities to have students who self-identify as a member of a visible
minority; however, they are about twice as likely to have students who self-identify as
Aboriginal (although the difference among university groups for the proportion of
Aboriginal students is not statistically significant).

CUSC-CCREU 7
2016 First-Year Student Survey
Table 6: Personal profile
All students (n=14,886)
Comparison Group
(n=3,151)
Brandon University
(n=133)
Gender
Male 34% 31% 26%
Female 66% 69% 74%
Other <1% - -
Age at beginning of year
18 and under 64% 75% 50%
19 20% 19% 21%
20 to 21 12% 4% 10%
22 to 24 3% 1% 5%
25 and over 1% 1% 14%
Average age 18.6 18.2 21.0
Marital status
Single 77% 74% 67%
In a relationship 21% 25% 25%
Married or common-law 2% 1% 8%
Children
Yes 1% 1% 10%
- Under 5 years old <1% 1% 7%
- 5 to 11 years old <1% <1% 3%
- 12 years old or older <1% <1% 3%
Citizenship
Canadian citizen 88% 86% 79%
International student 7% 6% 11%
Permanent resident 5% 8% 11%
Visible minority*
Total self-identified 40% 29% 20%
Aboriginal**
Total self-identified 3% 7% 11% * 'Visible minority' includes respondents who self-identified as belonging to a group other than 'Aboriginal', 'Inuit', 'Métis', or 'White'. ** 'Aboriginal' includes respondents who self-identified as 'Aboriginal'.
Difference by age. As expected, older students are more likely to report having children and
being married/common-law.

CUSC-CCREU 8
2016 First-Year Student Survey
2.2 Disabilities
Overall, 22% of first-year students self-identify as having a disability. The most common
disability reported by students is a mental health (12%) issue.
Among those with a disability, 32% said their disability requires accommodation from their
university, with those with a learning disability (68%) being most likely to say their disability
requires accommodation. The least likely of those are those with a vision impairment (16%),
perhaps indicating that students who require glasses may have indicated having a vision
impairment.
Among those who require accommodation for their disability, 55% said the accommodation was
adequate, while 14% said it was not adequate.
Table 7: Disabilities
All students (n=14,886)
Comparison Group
(n=3,151)
Brandon University
(n=133)
Disability
Total self-identified 22% 19% 23%
Require accommodation*
Yes 32% 28% 30%
Accommodation is adequate**
Yes 55% 56% 33%
Partly 31% 26% 33%
No 14% 18% 33% * The proportion is out of those who identify as having a disability. ** The proportion is out of those who identify as having a disability that requires accommodation.

CUSC-CCREU 9
2016 First-Year Student Survey
2.3 Living arrangements
As Table 8 shows, a majority of students live on their own, most commonly renting their
accommodations either off campus (15%) or on campus (40%). About 43% of first-year students
live with parents, guardians, or relatives. Among those not currently living on campus, just 33%
said they would prefer to live on campus if they had the choice.
Group 2 (48%) students are more likely than Group 1 (33%) and Group 3 (34%) students to be
living in on-campus housing. Not only that, but Group 2 (41%) students not currently living on
campus are more likely than Group 1 (25%) or Group 3 (28%) students to want to live in on-
campus housing, although this difference falls just below the threshold for statistical
significance.
Table 8: Living arrangements
All students (n=14,886)
Comparison Group
(n=3,151)
Brandon University
(n=133)
Current living arrangements
With parents, guardians, or relatives 43% 58% 29%
In on-campus housing 40% 23% 24%
In rented housing off campus (shared or alone) 15% 17% 38%
In personally-owned home 1% 2% 8%
Other 1% 1% 2%
Preference to live on campus if given the choice*
Yes 33% 26% 14% * The proportion is shown out of those not currently living on campus.
Difference by visible minority. Visible minority students (42%) not currently living on campus
are more likely than non-visible minority students (25%) to say they would want to live on
campus if given the opportunity.
Difference by age. The older a student is, the more likely they are to report living in a personally
owned home and less likely to be living with parents, guardians, or relatives.

CUSC-CCREU 10
2016 First-Year Student Survey
2.4 Parents’ education
Just 11% of first-year students are first-generation students. That is, neither parent had any post-
secondary education. In contrast, 20% of students have at least one parent who has obtained a
graduate-level degree.
Although there is very little difference among groups and the proportion of students that are first-
generation, the proportion of students who had a least one parent graduate with a graduate-level
degree is higher among Group 3 (23%) students compared to Group 2 (19%) or Group 1 (14%)
students; however, this difference falls just below the criteria for statistical significance.
Table 9: Parents' highest level of education
All students (n=14,886)
Comparison Group
(n=3,151)
Brandon University
(n=133)
High school or less 11% 13% 17%
Some college or university 9% 9% 12%
College, CEGEP, or technical school graduate 18% 20% 24%
University or professional school graduate 38% 40% 32%
Graduate degree 20% 14% 11%
Other <1% <1% - Note: 'Don't know' responses are not shown in the table but are included in the calculations.

CUSC-CCREU 11
2016 First-Year Student Survey
3.0 Motivation for attending university
3.1 Importance of reasons for going to university
The table below shows first-year students’ motivation for attending university, ordered by the
proportion who rated each as important or very important. Results show that the top three aspects
are all career-oriented motivators, and include more likely to get a job with a degree (91%), get a
more fulfilling job (90%), and to prepare for a specific job (90%).
At the lower end, few students said they were motivated by the chance to participate in varsity
athletics (12%) or they didn’t have anything better to do (12%).
Table 10: Motivation for attending university (% important or very important)
All students (n=14,886)
Comparison Group
(n=3,151)
Brandon University
(n=133)
I am more likely to get a job with a degree 91% 92% 86%
To get a more fulfilling job than I probably would if I didn't go 90% 91% 90%
To prepare for a specific job or career 90% 92% 89%
To satisfy my intellectual curiosity 80% 74% 77%
Learning new things is exciting 80% 75% 75%
To apply what I will learn to make a positive difference in society or my community 78% 77% 74%
To get a broad education 78% 74% 70%
To earn more money than if I didn't go 73% 74% 68%
To explore whether university is right for me 41% 42% 41%
To meet my family's expectations 58% 59% 44%
The satisfaction of doing challenging academic work 57% 51% 52%
To meet new people 53% 45% 37%
Most of my friends are going 24% 19% 13%
The chance to participate in varsity athletics 12% 11% 15%
I didn't have anything better to do 12% 9% 11%
Difference by visible minority. Students who self-identify as a member of a visible minority
(68%) are statistically more likely than non-visible minority (50%) students to rate to meet their
family’s expectations as important for motivating them to attending university.

CUSC-CCREU 12
2016 First-Year Student Survey
3.2 Most important reason
After ranking each motivator individually, first-year students were asked to select the most
important reason for why they decided to attend university. Not surprising, given the information
in the previous table, preparing for a specific job or career (44%) was the most important
reason. However, two other non-job related aspects land in the top five (although selected by
10% or fewer students), and include to apply what they learn to make a positive difference in
society (10%) and to satisfy their intellectual curiosity (7%).
Table 11: Top five most important reasons
All students (n=14,886)
Comparison Group
(n=3,151)
Brandon University
(n=133)
To prepare for a specific job or career 44% 53% 51%
To apply what I will learn to make a positive difference in society or my community 10% 8% 12%
I am more likely to get a job with a degree 10% 8% 5%
To get a more fulfilling job than I probably would if I didn't go 9% 8% 9%
To satisfy my intellectual curiosity 7% 4% 6%

CUSC-CCREU 13
2016 First-Year Student Survey
4.0 Choosing a university
4.1 Applications
Overall, 76% of students applied to a university other than the one they are currently attending.
On average, they applied to about two other universities. About 17% applied to a college or
CEGEP in addition to their current university. Although many students applied elsewhere, 81%
said they are attending their first choice.
Group 2 (87%) students were statistically more likely than Group 1 (61%) and Group 3 (69%)
students to apply to other universities; however, Group 3 (27%) university students were more
likely to have applied to a college or CEGEP than Group 1 (12%) or Group 2 (11%) students.
Although Group 2 students are more likely to apply to university than Group 1 or Group 3
students, they are only slightly more likely to say that they are not attending their first choice.
About 24% of Group 2 students are not attending their first choice, compared to 18% of Group 1
and 14% of Group 3 students, and this difference is not statistically significant.
Table 12: Applications
All students (n=14,886)
Comparison Group
(n=3,151)
Brandon University
(n=133)
Applied to other universities
Yes 76% 45% 36%
Average number overall 2.3 1.0 .7
Average number in Canada 2.0 .8 .5
Average number outside Canada .3 .1 .2
Applied to college or CEGEP
Yes 17% 11% 8%
Currently attending first choice
Yes 81% 87% 82%
Difference by age. As students get older, they are less likely to apply to other universities (in or
outside of Canada). For instance, 81% of students aged 18 and younger applied to more than one
university, and this steadily decreases across age groups to 32% of those aged 25 and older.
Conversely, younger students tended to be less likely to apply to college as well, as just 9% of
those aged 18 or younger applied to college and this increases up to those who are aged 20 to 21
(48%) before decreasing back down to about 20% of those aged 25 and older.

CUSC-CCREU 14
2016 First-Year Student Survey
4.2 Selecting their university
Students rated 18 aspects concerning their importance in selecting their university. When the
aspects were ranked by the proportion who answered important or very important, students were
most likely to say that their university has the program they wanted to take (87%) followed by
their university’s academic reputation (72%).
At the lower end, aspects such as it’s where their family wanted them to go (18%), where their
friends were going (14%), or being able to participate in varsity athletics (9%) are rated as less
important.
There were several statistical differences by group:
► Group 1 students are most likely to say that the size of the university suiting me is
important
► Group 2 students are more likely to say that the program they wanted has a co-op,
practicum, or other work experience and offered a scholarship are important
Table 13: Importance for selecting their university (% important or very important)
All students (n=14,886)
Comparison Group
(n=3,151)
Brandon University
(n=133)
It has the program I want to take 87% 82% 78%
The academic reputation of the university 72% 60% 49%
The city/town it's in 65% 67% 71%
Availability of public transportation 59% 47% 28%
The size of the university suits me 58% 54% 73%
It has a good reputation for campus life 53% 45% 39%
The program I want has a co-op, practicum, or other work experience 52% 42% 28%
It offered a scholarship 51% 58% 47%
Cost of tuition and fees 46% 47% 59%
I wanted to live close to home 45% 60% 67%
It offered other financial assistance 39% 40% 32%
The program I want offers study/work experience abroad 38% 30% 29%
It offered a place in residence 29% 19% 14%
I wanted to live away from home 25% 15% 20%
Cost of university residence 21% 17% 22%
It's where my family wanted me to go 18% 23% 18%
It's where my friends are going 14% 20% 9%
The chance to participate in varsity athletics 9% 8% 10%
Difference by age. As students get older, they are less likely to rate offered a place in residence
and it offered a scholarship as important.

CUSC-CCREU 15
2016 First-Year Student Survey
4.2.1 Most important reasons for selecting their university
Students were presented with the same list of 18 aspects and asked to select the reason that was
most important for selecting their university. Foremost, students said that their university has the
program they wanted to take (33%), but also wanting to live close to home (16%) and their
program had a work experience program (12%) were important.
The university group students attend seems to impact what is most important to them when
selecting their university. Group 3 students tend to put more emphasis than other students on
their university having the program they wanted to take and the academic reputation of the
university, while Group 1 students put more emphasis on wanting to live close to home and the
cost of tuition and fees. Group 2 students put more emphasis on the program they wanted having
a co-op, practicum or other work experience, relative to other groups.
Table 14: Top five most important reasons for selecting their university
All students (n=14,886)
Comparison Group
(n=3,151)
Brandon University
(n=133)
It has the program I want to take 33% 30% 20%
I wanted to live close to home 16% 25% 34%
The program I want has a co-op, practicum, or other work experience 12% 5% -
The academic reputation of the university 9% 5% 5%
Cost of tuition and fees 6% 9% 17%
4.3 Selecting their university (International students)
International students (identified through information supplied by each institution) were asked to
rate the importance of five aspects that might specifically attract students living outside Canada.
Three aspects seemed to be important, including cost of tuition and fees for international
students (79%), thinking their university would be a welcoming environment (75%), and the
academic reputation of Canadian universities (72%).
Least important appears to be obtaining a visa for Canada was easier than for other countries
(34%); however, about one-third of international students indicate this was important.
Table 15: Importance for selecting their university for international students (% important or very important)
All students
(n=997)
Comparison Group (n=171)
Brandon University
(n=14)
Cost of tuition and fees for international students 79% 85% 86%
I thought it would be a welcoming environment 75% 69% 71%
Academic reputation of Canadian universities in general 72% 67% 86%
Friends or family recommended it 46% 41% 64%
Obtaining a visa for Canada was easier than for other countries 34% 35% 29% Note: Only international students were asked the importance of these aspects.

CUSC-CCREU 16
2016 First-Year Student Survey
4.4 Sources of information
First-year students rated the importance of 19 sources of information they may have used when
making a decision about whether or not to attend their university. Examining results in the table
below shows that no single aspect seems to outweigh others, with several being selected as
important by about half of students. These include visits to campus for an open house (52%),
their university’s website (50%), and parents (46%). Of interest, parents were an important
source of information, but when students rated the importance of choosing their university
because it was where their family wanted them to go (as seen in Section 4.2), family was not
rated as an important influencer. This seems to indicate that students go to their parents for
information, but ultimately where their parents want them to go does not weight heavily on their
decision.
At the lower end, the university’s Facebook site (14%), university’s social media sites (12%),
and contact with university athletic coaches (8%) were not rated as being important relative to
other aspects.
Table 16: Importance of sources of information (% important or very important)
All students (n=14,886)
Comparison Group
(n=3,151)
Brandon University
(n=133)
Visit to campus for an open house 52% 48% 33%
The university's website 50% 47% 55%
Parents 46% 51% 44%
Printed university brochure, pamphlet, or viewbook 44% 38% 30%
Students attending the university 44% 43% 41%
Other visit to campus 40% 35% 35%
Contact with admissions staff on campus 37% 36% 41%
High school/CEGEP counsellors or teachers 36% 41% 37%
Friends 32% 34% 29%
Visit by a university representative to your high school or CEGEP 29% 31% 20%
Maclean's university rankings 29% 15% 11%
Contact with professors 26% 23% 36%
The Times Higher Education World University Rankings 20% 10% 9%
QS World University Rankings 20% 9% 8%
Globe and Mail Canadian University Report 20% 11% 9%
Academic Ranking of World Universities 17% 9% 9%
The university's Facebook site 14% 8% 13%
The university's other social media sites 12% 8% 10%
Contact with university athletic coaches 8% 8% 10%
Differences by visible minority. Students who self-identify as a member of a visible minority
group rated several of the sources of information as important/very important relative to those
who did not self-identify. These include Times Higher Education World University Rankings
(29% versus 14%), QS World University Rankings (29% versus 14%), Globe and Mail Canadian
University Report (27% versus 15%), and Academic Ranking of World Universities (25% versus
11%).

CUSC-CCREU 17
2016 First-Year Student Survey
5.0 Orientation
About 68% of first-year students participated in orientation. Among those who participated in
orientation, most seemed to be satisfied with aspects related to orientation, being most satisfied
that orientation made them feel welcome at their university (93%) and least satisfied with
orientation building their confidence (77%).
Table 17: Orientation participation and satisfaction
All students (n=14,886)
Comparison Group
(n=3,151)
Brandon University
(n=133)
Participated in an orientation
Yes 68% 77% 84%
Satisfaction with aspects of orientation (% very or somewhat satisfied)*
Feeling welcome at the university 93% 93% 96%
Providing information about campus life 87% 84% 83%
Providing information about student services 86% 85% 91%
Helping you understand the university's academic expectations 86% 86% 91%
Helping your personal and social transition to university 81% 78% 82%
Building your confidence 77% 76% 71% * Only those who participated in an orientation program were asked how satisfied they were.
Differences by age. As students get older, they are statistically less likely to participate in
orientation, dropping from 73% of those 18 and younger to 44% of those 25 and older.
6.0 Registration
Overall, students seemed to be satisfied with registration, including 84% who were satisfied with
getting into all the courses they wanted and 78% satisfied with the process of registering for
their courses.
Table 18: Satisfaction with registration (% very or somewhat satisfied)
All students (n=14,886)
Comparison Group
(n=3,151)
Brandon University
(n=133)
Getting into all the courses you wanted 84% 87% 95%
Process of registering for courses 78% 82% 92%

CUSC-CCREU 18
2016 First-Year Student Survey
7.0 Expectations and experience
First-year students rated 17 experiences as to whether they exceeded, met, or fell below their
expectations. The average was calculated based on ratings of much less than expected (1), less
than expected (2), about what expected (3), more than expected (4), and much more than
expected (5).
In some cases, experiences, such as making friends or intellectual stimulation, should hopefully
exceed students’ expectations, while others, such as cost of going to university or getting lost in
the crowd, should hopefully be less than expected. Others are hard to gauge as they might
depend on the students’ preferences (e.g., doing course work on their own, doing course work in
groups).
However, the results start to paint a picture that students are more likely to be surprised about the
academic challenges of university (e.g., time to put into their coursework and how demanding
their courses are) and cost-related aspects (e.g., cost of going to university and debt to complete
program).
Although students may select their university for different reasons, their expectations seem to be
consistently met. The only noticeable, albeit not statistically different, difference is that Group 1
students are more likely than Group 2 and Group 3 students to say that contact with professors in
the classroom and contact with professors outside of the classroom is more or much more than
expected.
Table 19: Mean ratings of experiences compared to expectations
All students (n=14,886)
Comparison Group
(n=3,151)
Brandon University
(n=133)
The time you have to put into your coursework 3.6 3.6 3.6
How academically demanding your courses are 3.5 3.5 3.5
Cost of going to university 3.5 3.4 3.1
Debt you might have to take on to complete your program 3.3 3.3 3.0
Intellectual stimulation 3.2 3.2 3.2
Doing coursework on your own 3.2 3.2 3.1
Writing in your academic work 3.2 3.2 3.1
Doing coursework in groups 3.1 2.9 2.8
The university has help and advising available when I need it 3.0 3.1 3.2
Class participation 3.0 2.9 3.1
Using math in your academic work 3.0 2.9 2.8
Contact with your professors in the classroom 3.0 2.9 3.2
Contact with your professors outside of the classroom 2.9 2.8 3.1
Making friends 2.9 2.7 2.7
Your course grades 2.8 2.7 2.8
I get lost in the crowd 2.6 2.5 2.3
Getting involved in campus social activities 2.6 2.5 2.5

CUSC-CCREU 19
2016 First-Year Student Survey
Differences by university grades. There are a few statistically significant differences marked by
students’ grades. First, students with lower grades are more likely to say that the time they have
to put into their course work is more or much more than they expected, as the proportion
increases from 43% of those with an A- or higher to 65% with a C+ or lower.
Second, students with lower grades are more likely to say their course grades are lower or much
lower than expected. The proportion increases from 14% of those with an A- or higher up to 74%
of those with a C+ or lower. Of interest, 45% of those with an A- or higher said their grades are
higher or much higher than they expected (compared to just 3% of those with a C+ or lower).
Table 20: Ratings of experiences compared to expectations
Brandon University (n=133)
Less/much less than I expected
About what I expected
More/much more than I expected
Doing coursework on your own 5% 78% 17%
Intellectual stimulation 7% 69% 24%
The time you have to put into your coursework 9% 36% 55%
How academically demanding your courses are 10% 42% 48%
The university has help and advising available when I need it 11% 59% 29%
Writing in your academic work 12% 66% 22%
Contact with your professors in the classroom 13% 59% 29%
Cost of going to university 15% 64% 21%
Class participation 16% 57% 27%
Contact with your professors outside of the classroom 19% 52% 29%
Debt you might have to take on to complete your program 23% 50% 26%
Using math in your academic work 23% 65% 12%
Doing coursework in groups 32% 48% 20%
Your course grades* 36% 47% 17%
Making friends 38% 49% 14%
Getting involved in campus social activities 41% 52% 7%
I get lost in the crowd 57% 32% 11% * This question was asked using a scale from 'much lower than expected' to 'much higher than expected'.
7.1 Overall expectations
When asked to summarize their overall experiences to date, first-year students are slightly more
likely to say their university experiences exceeded (23%) rather than fell short (13%) of their
expectations.
Table 21: Meeting expectations
All students (n=14,886)
Comparison Group
(n=3,151)
Brandon University
(n=133)
Exceeded 23% 16% 14%
Met 64% 71% 75%
Fell short 13% 13% 11%
Differences by university grades. As students’ grades increase, they are more likely to say their
experiences have exceed their expectations and less likely to say their expectations fell short.

CUSC-CCREU 20
2016 First-Year Student Survey
8.0 Transition to university
Students rated their success in transitioning to university through 17 aspects of university life.
The table below shows the proportion that rated their success as some or very much success (top
two ratings on a four-point scale), with answers from those who said ‘no basis for opinion’
removed.
Students found success in many aspects, with many aspects having more than 8 in 10 students
saying they have had some or very much success. The two areas where students have found less
success are finding career information (17% very much) and becoming involved in campus
activities (14% very much).
Table 22: Success transitioning to university (% some or very much)
All students (n=14,886)
Comparison Group
(n=3,151)
Brandon University
(n=133)
Finding your way around campus 95% 95% 93%
Understanding the course material 95% 95% 95%
Finding information about academic integrity 91% 89% 86%
Choosing a program of study 91% 87% 86%
Meeting academic demands 91% 90% 91%
Performing well in written assignments 88% 85% 83%
Commuting to campus 85% 87% 85%
Dealing with new living arrangements 80% 77% 85%
Using the library 80% 77% 88%
Finding suitable housing 79% 79% 87%
Managing your finances 77% 78% 79%
Performing well in courses that require math 75% 73% 77%
Getting academic advice 74% 72% 83%
Managing your time 73% 74% 77%
Making friends 71% 63% 58%
Finding career information 61% 62% 68%
Becoming involved in campus activities 46% 37% 37% Note: These questions included an option for students to say 'No basis for opinion' and those responses have been removed from the calculations.
Differences by university grades. As students’ grades increase, students are more likely to report
having some or very much success transitioning to the following: meeting academic demands,
performing well in written assignments, performing well in courses that require math,
understanding course material, and managing their time.

CUSC-CCREU 21
2016 First-Year Student Survey
9.0 Educational experiences
9.1 Perceptions of professors
Students rated their levels of agreement with a series of statements about their professors. Most
students reported having had positive experiences with university faculty. At the high end, at
least 9 in 10 first-year students agreed with the following:
► Most of my professors treat students the same regardless of race (55% strongly agreed)
► Most of my professors treat students the same regardless of gender (55% strongly agreed)
► Most of my professors seem knowledgeable in their fields (36% strongly agreed)
► Most of my professors are reasonably accessible outside of class (14% strongly agreed)
At the lower end, about 2 in 3 first-year students agreed with the following:
► Most of my professors provide useful feedback on my academic work (9% strongly agreed)
► Most of my professors provide prompt feedback on my academic work (7% strongly agreed)
► Most of my professors take a personal interest in my academic progress (9% strongly
agreed)
Generally, students indicate similar experiences with professors across groups, although Group 1
students tend to be more likely than students in other groups to agree or strongly agree; however,
none of these differences meet the criteria for being statistically different.
Table 23: Perception of professors (% agree or strongly agree)
All students (n=14,886)
Comparison Group
(n=3,151)
Brandon University
(n=133)
Treat students the same regardless of race* 97% 97% 100%
Treat students the same regardless of gender* 97% 97% 99%
Seem knowledgeable in their fields 97% 98% 98%
Are reasonably accessible outside of class 90% 91% 94%
Encourage students to participate in class discussions 87% 86% 94%
Are consistent in their grading 86% 87% 91%
Are fair in their grading 85% 86% 90%
Look out for students' interests* 85% 84% 90%
Communicate well in their teaching 85% 85% 92%
Are well-organized in their teaching 84% 86% 91%
Are intellectually stimulating in their teaching 81% 82% 89%
Treat students as individuals, not just numbers 79% 77% 86%
Provide useful feedback on academic work 68% 70% 82%
Provide prompt feedback on academic work 65% 68% 77%
Take a personal interest in academic progress 64% 63% 74% * These questions included an option for students to say 'No basis for opinion' and those responses have been removed from the calculations.
CUSC-CCREU 22
2016 First-Year Student Survey
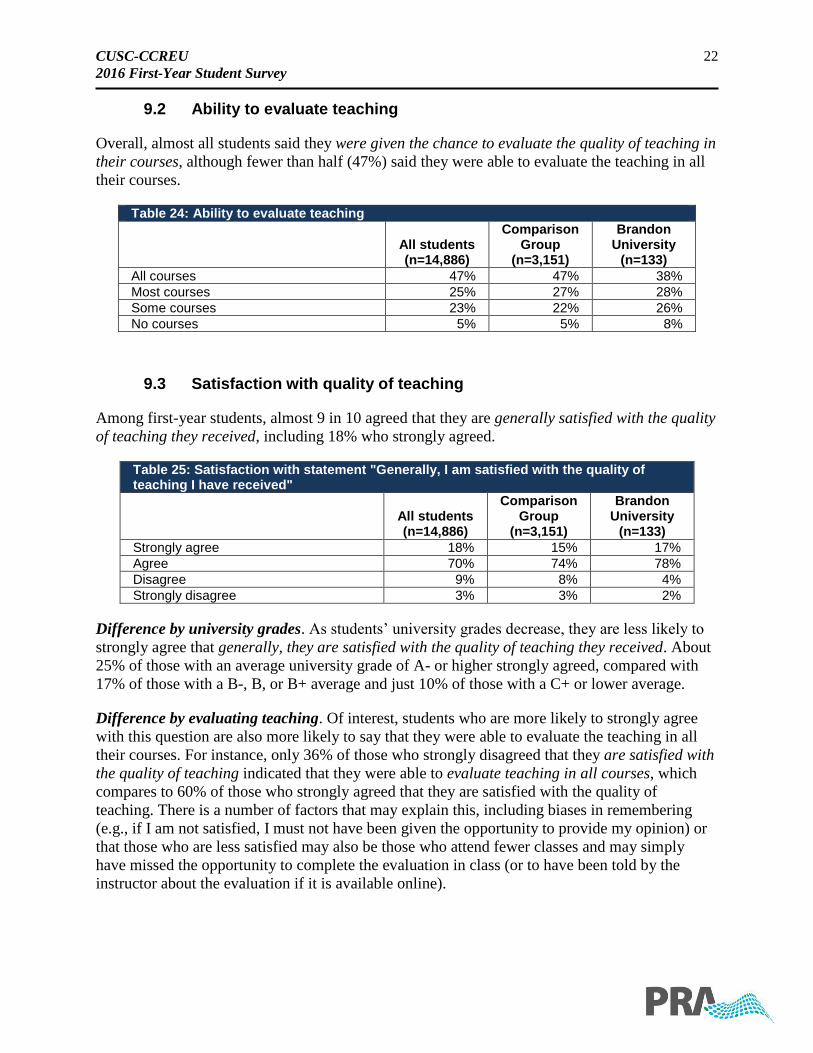
9.2 Ability to evaluate teaching
Overall, almost all students said they were given the chance to evaluate the quality of teaching in
their courses, although fewer than half (47%) said they were able to evaluate the teaching in all
their courses.
Table 24: Ability to evaluate teaching
All students (n=14,886)
Comparison Group
(n=3,151)
Brandon University
(n=133)
All courses 47% 47% 38%
Most courses 25% 27% 28%
Some courses 23% 22% 26%
No courses 5% 5% 8%
9.3 Satisfaction with quality of teaching
Among first-year students, almost 9 in 10 agreed that they are generally satisfied with the quality
of teaching they received, including 18% who strongly agreed.
Table 25: Satisfaction with statement "Generally, I am satisfied with the quality of teaching I have received"
All students (n=14,886)
Comparison Group
(n=3,151)
Brandon University
(n=133)
Strongly agree 18% 15% 17%
Agree 70% 74% 78%
Disagree 9% 8% 4%
Strongly disagree 3% 3% 2%
Difference by university grades. As students’ university grades decrease, they are less likely to
strongly agree that generally, they are satisfied with the quality of teaching they received. About
25% of those with an average university grade of A- or higher strongly agreed, compared with
17% of those with a B-, B, or B+ average and just 10% of those with a C+ or lower average.
Difference by evaluating teaching. Of interest, students who are more likely to strongly agree
with this question are also more likely to say that they were able to evaluate the teaching in all
their courses. For instance, only 36% of those who strongly disagreed that they are satisfied with
the quality of teaching indicated that they were able to evaluate teaching in all courses, which
compares to 60% of those who strongly agreed that they are satisfied with the quality of
teaching. There is a number of factors that may explain this, including biases in remembering
(e.g., if I am not satisfied, I must not have been given the opportunity to provide my opinion) or
that those who are less satisfied may also be those who attend fewer classes and may simply
have missed the opportunity to complete the evaluation in class (or to have been told by the
instructor about the evaluation if it is available online).
CUSC-CCREU 23
2016 First-Year Student Survey
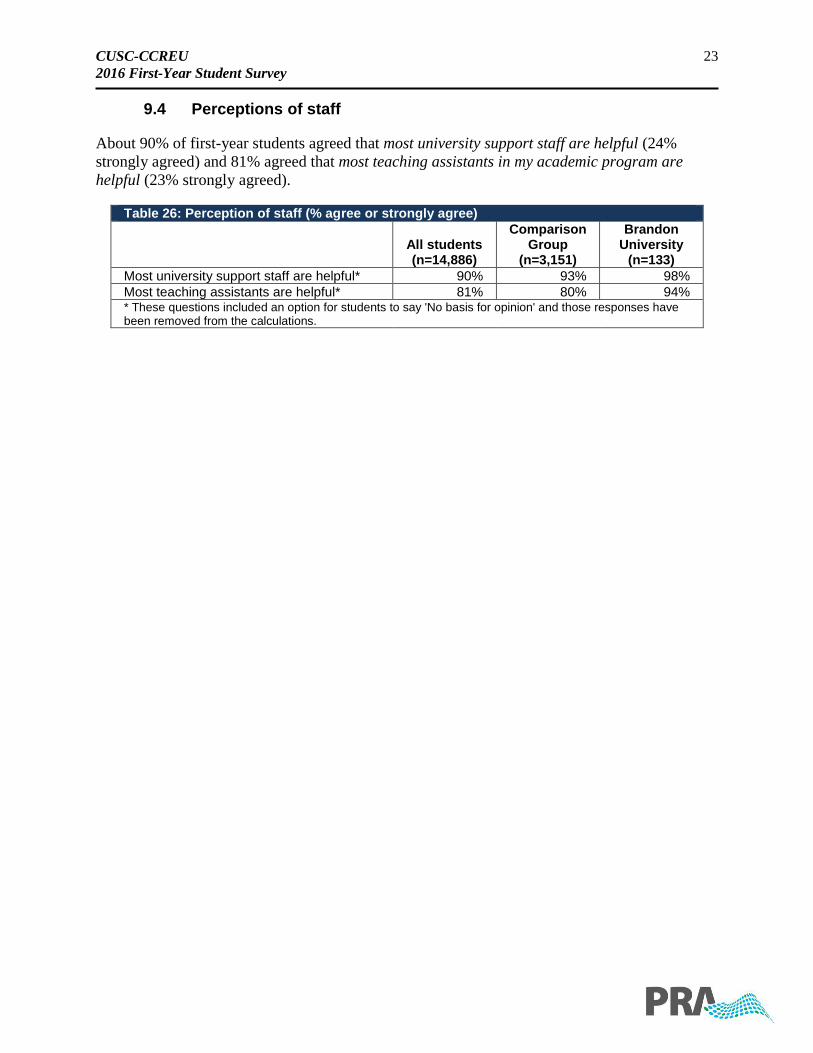
9.4 Perceptions of staff
About 90% of first-year students agreed that most university support staff are helpful (24%
strongly agreed) and 81% agreed that most teaching assistants in my academic program are
helpful (23% strongly agreed).
Table 26: Perception of staff (% agree or strongly agree)
All students (n=14,886)
Comparison Group
(n=3,151)
Brandon University
(n=133)
Most university support staff are helpful* 90% 93% 98%
Most teaching assistants are helpful* 81% 80% 94% * These questions included an option for students to say 'No basis for opinion' and those responses have been removed from the calculations.

CUSC-CCREU 24
2016 First-Year Student Survey
10.0 Commitment to completion
10.1 Perceptions of effort
Almost all students agreed that they are willing to put a lot of effort into being successful at
university (50% strongly agreed), which is reflected in the fact that almost as many agreed that
they normally go to all of their classes (51% strongly agreed).
Although students may feel they can put in the effort, about 7 in 10 agreed that they can deal
with stress, but only 17% strongly agreed. Also, just 6 in 10 agreed that they have good study
habits, with just 12% who strongly agreed.
Table 27: Agreement with statements about student's abilities and effort (% agree or strongly agree)
All students (n=14,886)
Comparison Group
(n=3,151)
Brandon University
(n=133)
I am willing to put a lot of effort into being successful at university 96% 95% 95%
I normally go to all of my classes 90% 93% 93%
I can deal with stress 73% 73% 74%
I have good study habits 61% 59% 68% Note: 'Don't know' responses are not shown in the table but are included in the calculations.
Differences by university grades. Students seem to have some self-awareness when it comes to
how their ability relates to their grades. Specifically, results show that as university grades
decrease, agreement also decreases for the following:
► I can deal with stress declined from 81% of those with an average university grade of A-
or higher to 60% of those with an average grade of C+ or lower.
► I have good study habits declined from 75% of those with an average university grade of
A- or higher to 40% of those with an average grade of C+ or lower.
Of interest, there is very little difference by university grades in agreement that students
normally go to all their classes. About 93% of those with an average of A- or higher agreed, and
this drops slightly to 85% of those with an average of C+ or lower.
Differences by gender. Among all questions, the only statistically significant difference between
male and female students is the agreement that they can deal with stress, as male (82%) students
are more likely to agree with this statement than female (68%) students.

CUSC-CCREU 25
2016 First-Year Student Survey
10.2 Perceptions of university education
Results show that at least 3 in 4 first-year students agreed with statements about their university
education, including the following:
► most of their courses are interesting, including 25% who strongly agreed
► their course load is manageable, including 15% who strongly agreed
► they had adequate information about their program from the university before they
enrolled, including 19% who strongly agreed
► they are in the right program, including 32% who strongly agreed
Table 28: Agreement with statements about university education (% agree or strongly agree)
All students (n=14,886)
Comparison Group
(n=3,151)
Brandon University
(n=133)
Most of my courses are interesting 85% 87% 87%
My course load is manageable 81% 81% 87%
I had adequate information about my program from the university before I enrolled 77% 75% 77%
I am in the right program for me 75% 73% 80% Note: 'Don't know' responses are not shown in the table but are included in the calculations.
Difference by university grades. The lower students’ university grades are the less likely they
are to agree that their course load is manageable. The proportion drops from 86% of those with
an average university grade of A- or higher to 68% of those with a C+ or lower.
10.3 Perceptions of finances
About 7 in 10 students agreed that a university degree is worth the cost (30% strongly agreed) or
that they have the financial resources to complete their program (20% strongly agreed).
Table 29: Agreement with statements about finance-related aspects (% agree or strongly agree)
All students (n=14,886)
Comparison Group
(n=3,151)
Brandon University
(n=133)
A university degree is worth the cost 71% 69% 82%
I have the financial resources to complete my program 71% 69% 77% Note: 'Don't know' responses are not shown in the table but are included in the calculations.

CUSC-CCREU 26
2016 First-Year Student Survey
10.4 Perceptions of persistence
At the time of the survey, 9 in 10 first-year students plan to come back to their university next
year including 58% who strongly agreed. Slightly fewer (about 8 in 10) plan to complete their
degree at their university, including 48% who strongly agreed.
Just 9% plan to transfer to another university next year, while 5% plan on going to
college/CEGEP next year.
Table 30: Agreement with statements about persistence (% agree or strongly agree)
All students (n=14,886)
Comparison Group
(n=3,151)
Brandon University
(n=133)
I plan to come back to this university next year 91% 88% 88%
I plan to complete my degree at this university 82% 79% 77%
I plan to transfer to another university next year 9% 8% 8%
I plan to go to college/CEGEP next year 5% 6% 5% Note: 'Don't know' responses are not shown in the table but are included in the calculations.
10.5 Feel as if they belong at this university
About 3 in 4 first-year students agreed that they feel as if they belong at this university, including
24% who strongly agreed. About 1 in 10 disagreed, including 3% who strongly disagreed. Of
interest, 13% said they do not know if they belong at their current university, indicating that they
do not have enough information to decide if they belong or are still weighing whether or not they
belong at their current university.
Table 31: Feel as if student belongs at this university
All students (n=14,886)
Comparison Group
(n=3,151)
Brandon University
(n=133)
Strongly agree 24% 15% 16%
Agree 51% 54% 54%
Disagree 9% 10% 10%
Strongly disagree 3% 3% 2%
Don't know 13% 17% 19%

CUSC-CCREU 27
2016 First-Year Student Survey
11.0 Overall evaluation
11.1 Satisfaction with concern shown by student as an individual
Almost 3 in 4 first-year students said they are satisfied with the concern shown by the university
for them as an individual, although just 6% are very satisfied. Among the approximately 1 in 4
who are dissatisfied, including 5% are very dissatisfied.
Table 32: Satisfaction with concern shown by the university for student as an individual
All students (n=14,886)
Comparison Group
(n=3,151)
Brandon University
(n=133)
Very satisfied 6% 4% 3%
Satisfied 69% 68% 80%
Dissatisfied 21% 23% 11%
Very dissatisfied 5% 5% 5%
11.2 Satisfaction with decision to attend this university
Over 9 in 10 first-year students are satisfied with their decision to attend their university,
including 25% who are very satisfied.
Table 33: Satisfaction with decision to attend this university
All students (n=14,886)
Comparison Group
(n=3,151)
Brandon University
(n=133)
Very satisfied 25% 18% 19%
Satisfied 67% 73% 74%
Dissatisfied 7% 7% 5%
Very dissatisfied 2% 2% 2%
11.3 Recommend university to others
Overall, 95% of first-year students would recommend their university to others.
Table 34: Recommend university to others
All students (n=14,886)
Comparison Group
(n=3,151)
Brandon University
(n=133)
Would recommend 95% 95% 98%
Would not recommend 5% 5% 2%

CUSC-CCREU 28
2016 First-Year Student Survey
12.0 Goal development
12.1 Chosen a major or discipline
At the time of their survey, 73% of first-year students said they had selected their major or
discipline.
Table 35: Chosen a major or discipline
All students (n=14,886)
Comparison Group
(n=3,151)
Brandon University
(n=133)
Yes 73% 67% 60%
No 27% 33% 40%
12.2 Post-graduation plans
At this early point in their university studies, students seem to be equally likely to want to apply
to a professional program (29%) as graduate school (34%). Many seem to be unsure at this
point.
Table 36: Post-graduation plans
All students (n=14,886)
Comparison Group
(n=3,151)
Brandon University
(n=133)
Apply to professional program
Yes 29% 38% 29%
No 34% 31% 30%
Unsure 36% 32% 41%
Apply to graduate school
Yes 34% 26% 25%
No 21% 26% 27%
Unsure 46% 48% 48%

CUSC-CCREU 29
2016 First-Year Student Survey
12.3 Career planning
Overall, 31% of first-year students have a specific career in mind, while another 32% have
several possible careers in mind. Despite many having a career (or two) in mind, just 19% said
they know their career options very well.
Table 37: Career plans
All students (n=14,886)
Comparison Group
(n=3,151)
Brandon University
(n=133)
Description of career plans
I have a specific career in mind 31% 43% 46%
I have several possible careers in mind 32% 29% 27%
I have some general ideas but I need to clarify them 24% 18% 19%
I am unsure, but I want to develop a career plan 10% 8% 7%
I am not thinking about a career at this stage of my studies 2% 2% 2%
How well students know career options
Very well 19% 20% 29%
Fairly well 48% 48% 41%
Only a little 29% 28% 28%
Not at all 4% 4% 3%
12.4 Steps taken for employment post-graduation
About 9 in 10 first-year students have taken at least one step to prepare for employment or a
career after graduation. Most often these steps are informal, such as talking with parents/family
(75%), friends (65%), or professors (23%) about career options. Among more concrete
behaviours, 42% of first-year students have a resumé or CV, while about 23% have volunteered
in their chosen field of employment.
Table 38: Steps taken to prepare for employment or career after graduation
All students (n=14,886)
Comparison Group
(n=3,151)
Brandon University
(n=133)
Talked with parents/family about employment/career 75% 77% 74%
Talked with friends about employment/career 65% 62% 59%
Created resumé/curriculum vitae 42% 28% 30%
Volunteered in chosen field of employment 23% 23% 23%
Talked with professors about employment/career 23% 19% 22%
Attended an employment fair 18% 25% 26%
Met with a career counsellor 16% 22% 19%
Worked in chosen field of employment 13% 12% 16%
Created an e-portfolio 10% 5% 2%
I have a career mentor 5% 4% 5%
None 9% 9% 11% Note: Respondents could provide more than one answer. Therefore, columns will not sum to 100%.

CUSC-CCREU 30
2016 First-Year Student Survey
13.0 Satisfaction with facilities and services
13.1 General facilities and services
The table below shows that some services are used by first-year students more often than others.
For instance, the most commonly used resources are on-campus bookstores (76%), food services
(66%), and library electronic resources (62%), while few students reported using the computing
services help desk (9%). Group 1 students (45%) are much more likely than Group 2 (24%) or
Group 3 (20%) students to have used parking.
Table 39: Use of general facilities and services
All students (n=14,886)
Comparison Group
(n=3,151)
Brandon University
(n=133)
On-campus bookstores 76% 81% 75%
Food services 66% 68% 40%
Library electronic resources 62% 58% 59%
On-campus library 45% 45% 56%
Athletic facilities 37% 38% 38%
University residences 34% 21% 20%
Online campus bookstores 33% 36% 11%
Parking 26% 46% 44%
Campus medical services 18% 12% 7%
Other recreational facilities 17% 18% 12%
Facilities for university-based social activities 14% 11% 11%
Facilities for student associations 11% 6% 5%
Computing services help desk 9% 6% 13%
Difference by visible minority. Students who self-identify as a member of a visible minority
(15%) are statistically less likely to report using parking than those who did not self-identify
(34%).
Difference by age. As students get older, they are less likely to report using food services,
athletic facilities, and university residences.

CUSC-CCREU 31
2016 First-Year Student Survey
Among those who used each general service or facility, the table below shows very little
difference in the satisfaction of general facilities and services, with the exception of parking
facilities (53%) and food services (71%).
Table 40: Satisfaction with general facilities and services (% satisfied or very satisfied)
All students Comparison
Group Brandon
University
On-campus library 96% 97% 99%
Library electronic resources 95% 94% 97%
Other recreational facilities 95% 96% 100%
Facilities for university-based social activities 95% 95% 93%
Facilities for student associations 94% 96% 100%
Athletic facilities 93% 96% 94%
Computing services help desk 93% 94% 100%
Online campus bookstores 91% 91% 93%
On-campus bookstores 90% 92% 92%
Campus medical services 84% 90% 100%
University residences 82% 80% 74%
Food services 71% 79% 57%
Parking 53% 52% 76% Note: Percentages are based on those who have used the service.
13.2 Academic services
With the exception of academic advising (of which 38% have used), between 7% and 14% used
the academic services shown in the table below.
Table 41: Use of academic services
All students (n=14,886)
Comparison Group
(n=3,151)
Brandon University
(n=133)
Academic advising 38% 44% 40%
Tutoring 14% 15% 31%
Study skills and learning supports 14% 12% 28%
Writing skills 10% 14% 20%
Co-op offices and supports 7% 2% 2%
Among those who have used each academic service, students reported very high levels of
satisfaction, ranging from 86% to 92%.
Table 42: Satisfaction with academic services (% satisfied or very satisfied)
All students Comparison
Group Brandon
University
Study skills and learning supports 92% 93% 92%
Co-op offices and supports 89% 90% 100%
Writing skills 88% 88% 88%
Tutoring 88% 89% 93%
Academic advising 86% 88% 91% Note: Percentages are based on those who have used the service.

CUSC-CCREU 32
2016 First-Year Student Survey
13.3 Special services
As the name implies, special services are those that tend to be created for specific groups of
students, although they are often not accessible for all students, as only one service (financial aid
– 25%) is used by more than 10% of students.
Table 43: Use of special services
All students (n=14,886)
Comparison Group
(n=3,151)
Brandon University
(n=133)
Financial aid 25% 19% 15%
Personal counselling 9% 7% 8%
Career counselling 8% 8% 11%
Advising for students who need financial aid 7% 4% 3%
Employment services 6% 4% 9%
Services for international students 6% 5% 8%
Services for students with disabilities 5% 3% 4%
Services for First Nations students 1% 3% 3%
Difference by visible minority. As might be expected, students who self-identify as a member of
a visible minority (10%) are statistically more likely to report using services for international
students than those who did not self-identify (3%).
Satisfaction with special services is also very high, with at least 77% of those who used a service
saying there are satisfied or very satisfied with it. Interestingly, the special services that are used
more frequently tend to be those that have a lower proportion of students satisfied, as financial
aid and personal counselling are used most often.
Table 44: Satisfaction with special services (% satisfied or very satisfied)
All students Comparison
Group Brandon
University
Services for First Nations students 91% 94% 100%
Career counselling 88% 94% 93%
Services for international students 88% 91% 90%
Services for students with disabilities 88% 89% 80%
Employment services 85% 84% 83%
Financial aid 83% 89% 90%
Personal counselling 81% 88% 73%
Advising for students who need financial aid 77% 82% 100% Note: Percentages are based on those who have used the service.

CUSC-CCREU 33
2016 First-Year Student Survey
14.0 Academic profile
Examining students’ academic profiles shows that the majority are attending full-time (95%),
began their post-secondary studies (83%) or studies at their current university (91%) this
academic year, did not transfer from another institution (94%), and reported an average grade of
B- or higher (79%).
Given that Group 2 students tended to be younger than Group 1 and Group 3 students, it is not
surprising that they are more likely to have enrolled in post-secondary studies and at their
university this year.
Table 45: Academic profile
All students (n=14,886)
Comparison Group
(n=3,151)
Brandon University
(n=133)
Course load
Full-time 95% 96% 78%
Part-time 5% 4% 22%
Year began post-secondary studies
2015/2016 83% 97% 89%
2014 2% 1% 1%
2013 8% <1% -
2012 4% <1% 1%
2011 or earlier 4% 1% 9%
Year first enrolled at this university
2015/2016 91% 91% 94%
2014 or earlier 9% 9% 6%
Transferred from other institution
Yes 6% 2% 5%
Reported university grade
A-, A, or A+ 31% 24% 29%
B-, B, or B+ 49% 48% 51%
C-, C, or C+ 18% 25% 17%
D 2% 3% 3%
F <1% <1% -

CUSC-CCREU 34
2016 First-Year Student Survey
15.0 Current employment
Overall, 34% of first-year students are currently employed, most often off campus. Although not
statistically significant, Group 1 (46%) students are more likely than Group 2 (29%) and Group 3
(34%) students to be employed.
Among those who are currently employed, results show that the typical student works about 14
hours per week and about 43% said their employment has a negative impact on their academic
performance. Not only are Group 1 students more likely to work, they are also working more
hours, as 24% are working more than 20 hours per week compared to 11% of Group 2 and 12%
of Group 3 students who are employed.
Table 46: Employment status
All students (n=14,886)
Comparison Group
(n=3,151)
Brandon University
(n=133)
Currently employed
Yes, both on and off campus 1% 1% 2%
Yes, on campus 3% 2% 2%
Yes, off campus 30% 38% 37%
No, but seeking work 29% 26% 20%
No, not seeking work 37% 32% 40%
Number of hours worked per week*
10 or less 43% 37% 41%
11 to 20 43% 49% 37%
21 to 30 11% 12% 11%
Over 30 4% 3% 11%
Average 14.1 14.6 17.0
Impact of employment on academic performance*
Very positive 3% 3% 4%
Somewhat positive 10% 8% 11%
No impact 45% 44% 61%
Somewhat negative 39% 42% 20%
Very negative 4% 3% 4% * Only students who are currently employed were asked how many hours they work per week and whether their employment has an impact on their academic performance.
Difference by age. Older students are more likely than younger students to be employed and work
more hours per week. The proportion of students who are employed increases from 29% of those
aged 18 and younger to 60% of those aged 22 to 24, before dropping to 50% of those aged 25 and
older. The hours students who are employed work also increases with age, as students aged 18 and
younger reported working about 13 hours per week, up to 22 hours per week for those aged 25 and
older. Of interest, even though older students work more, they are not significantly more likely to
report that their work has a negative impact on their academic performance.
Difference by university grades. Although there is virtually no difference in the proportion of
students working by their university grades, there is some evidence to suggest that those with
lower grades work more on average. Students with an A- or higher reported working about 12
hours per week, compared to about 15 hours per week for those with a C+ or lower. Although
potentially telling, the difference falls just below the threshold for statistical significance.

CUSC-CCREU 35
2016 First-Year Student Survey
16.0 Finances
16.1 Credit cards
About 60% of first-year students reported they have at least one credit card, although just 15%
have two or more cards. Among those students who have credit cards, about 88% reported they
pay off their balance each month and, as such, their current credit card balance is zero; however,
when asked what their current credit card balance is, just 7% said it is zero. Among those with an
unpaid balance, the average credit card debt students have is $1,549.
Group 1 students tend to carry a higher balance on their credit cards than Group 2 and Group 3
students.
Table 47: Credit cards
All students (n=14,886)
Comparison Group
(n=3,151)
Brandon University
(n=133)
Number of credit cards
None 40% 44% 43%
One 45% 42% 45%
Two 7% 5% 3%
Three or more 8% 9% 9%
Average number 1.8 1.8 1.2
Regularly pay off balance each month*
Yes 88% 87% 80%
Total credit card balance*
Zero 7% 3% -
$500 or less 83% 85% 82%
$501 to $1,000 5% 6% 9%
Over $1,000 5% 6% 9%
Average (all with credit card) $487 $968 $385
Average (those with unpaid balance) $1,549 $1,683 $974 * Total credit card balance and payment of the balance were asked of those who had at least one credit card.
Difference by age. The older a student is, the more likely they are to have two or more credit
cards (increasing from 12% of those aged 18 and younger to 39% of those aged 25 and older).
Younger students are also more likely to pay off their balance each month, with 89% of those
aged 18 and younger saying they pay their last balance, compared to 56% of those aged 25 and
older. Among those with credit card debt, the average debt also increases with age from $1,401
(aged 18 and younger) to $4,858 (aged 25 and older).

CUSC-CCREU 36
2016 First-Year Student Survey
16.2 Financial awards and assistance
Overall, 58% of first-year students said they have received a financial award from their
university. Among those who received an award, 71% said they would not have been able to
attend university without this financial assistance.
Group 2 (69%) students are much more likely than Group 1 (53%) and Group 3 (46%) to report
receiving a financial award from their university, although the proportion who would not have
been able to attend without the award/assistance is somewhat similar across university groups.
Table 48: Financial awards and assistance
All students (n=14,886)
Comparison Group
(n=3,151)
Brandon University
(n=133)
Received financial award from this university
Yes 58% 63% 44%
Would have been able to attend without financial assistance*
Yes 71% 75% 86%
No 29% 25% 14% * Only students who received a financial award or bursary from this university were asked if they would have been able to attend without financial assistance.
Differences by university grades. As students’ university grades decrease, students are less
likely to report they received a financial award from their university, declining from 70% of
those with a grade of A- or higher to 48% of those with a C+ or lower.

Appendix A – 2016 CUSC-CCREU Survey

1
2016 Survey of First Year Students
This survey is being completed by first-year students at approximately [__] Canadian universities. We want to learn more about our new students to help them make a successful transition to university. If you cannot finish the survey in one sitting, you can close it and return to it using the link in the email we sent you. You will be returned to the page you were on when you closed.
All of your responses are confidential. _____________________________________________________________________________________
Motivation
How important were each of the following possible reasons in your decision to go to university? Not
important Somewhat important Important
Very important
motiv1 To prepare for a specific job or career ☐ ☐ ☐ ☐ motiv2 To satisfy my intellectual curiosity ☐ ☐ ☐ ☐ motiv3 To earn more money than if I didn’t go ☐ ☐ ☐ ☐ motiv4 To get a broad education ☐ ☐ ☐ ☐ motiv5 I am more likely to get a job with a degree ☐ ☐ ☐ ☐ motiv6 The satisfaction of doing challenging academic
work ☐ ☐ ☐ ☐ motiv7 To apply what I will learn to make a positive
difference in society or my community ☐ ☐ ☐ ☐ motiv8 I didn’t have anything better to do ☐ ☐ ☐ ☐ motiv9 To get a more fulfilling job than I probably would
if I didn’t go ☐ ☐ ☐ ☐ motiv10 To meet my family’s expectations ☐ ☐ ☐ ☐ motiv11 Learning new things is exciting ☐ ☐ ☐ ☐ motiv12 Most of my friends are going ☐ ☐ ☐ ☐ motiv13 To meet new people ☐ ☐ ☐ ☐ motiv14 The chance to participate in varsity athletics ☐ ☐ ☐ ☐ motiv15 To explore whether university is right for me ☐ ☐ ☐ ☐ motiv16 Other reason (please specify below): ☐ ☐ ☐ ☐ motivtxt ___________________________________ motivtop Which one was the most important to you? _________
Applications How many universities besides <university name> did you apply to?
app1 in Canada: _______ app2 in other countries: _______
app3 Did you apply to a college or CEGEP? Yes ☐ No ☐
app4 Is <university name> your first choice? Yes ☐ No ☐ [If app4 = “No” branch to apptxt, otherwise branch to the Selection section.]
Apptxt What was your first choice university? __________________________________________

2
Selection
How important were each of the following in your decision to choose <university name>?
Not important
Somewhat important Important
Very important
sel1 I wanted to live close to home ☐ ☐ ☐ ☐ sel2 I wanted to live away from home ☐ ☐ ☐ ☐ sel3 It offered a place in residence ☐ ☐ ☐ ☐ sel4 Cost of university residence ☐ ☐ ☐ ☐ sel5 Cost of tuition and fees ☐ ☐ ☐ ☐ sel6 It has the program I want to take ☐ ☐ ☐ ☐ sel7 The program I want has a co-op, practicum or other
work experience ☐ ☐ ☐ ☐ sel8 The program I want offers study/work experience
abroad ☐ ☐ ☐ ☐ sel9 The academic reputation of the university ☐ ☐ ☐ ☐ sel10 It has a good reputation for campus life ☐ ☐ ☐ ☐ sel11 It offered a scholarship ☐ ☐ ☐ ☐ sel12 It offered other financial assistance ☐ ☐ ☐ ☐ sel13 The size of the university suits me ☐ ☐ ☐ ☐ sel14 The city/town it’s in ☐ ☐ ☐ ☐ sel15 Availability of public transportation ☐ ☐ ☐ ☐ sel16 It’s where my friends are going ☐ ☐ ☐ ☐ sel17 It’s where my family wanted me to go ☐ ☐ ☐ ☐ sel18 The chance to participate in varsity athletics ☐ ☐ ☐ ☐ sel19 Other reason (please specify below): ☐ ☐ ☐ ☐ seltxt ____________________________ seltop Which one was the most important to you? ___________
[Students identified in the university’s sample file as international/visa students will be branched to vsel1; other students will be branched to the Sources of information section.] How important were each of the following in your decision to study at <university name>?
Not important
Somewhat important Important
Very important
vsel1 Academic reputation of Canadian universities in general ☐ ☐ ☐ ☐
vsel2 Cost of tuition and fees for international students ☐ ☐ ☐ ☐ vsel3 Friends or family recommended it ☐ ☐ ☐ ☐ vsel4 I thought it would be a welcoming environment ☐ ☐ ☐ ☐ vsel5 Obtaining a visa for Canada was easier than for other
countries ☐ ☐ ☐ ☐ vsel6 Other reason (please specify below): ☐ ☐ ☐ ☐ vseltxt _____________________________

3
Sources of information
How important were each of the following sources of information in your decision to study at <university name>? Not
important Somewhat important Important
Very important
inf1 Visit by a university representative to your high school or CEGEP ☐ ☐ ☐ ☐
inf2 The university’s web site ☐ ☐ ☐ ☐ inf3 The university’s Facebook site ☐ ☐ ☐ ☐ inf4 The university’s other social media sites (e.g., Twitter,
tumblr, etc.) ☐ ☐ ☐ ☐ inf5 Printed university brochure, pamphlet or viewbook ☐ ☐ ☐ ☐ inf6 Visit to campus for an open house ☐ ☐ ☐ ☐ inf7 Other visit to campus ☐ ☐ ☐ ☐ inf8 Contact with admissions staff on campus ☐ ☐ ☐ ☐ inf9 Contact with professors ☐ ☐ ☐ ☐ Inf10 Contact with university athletic coaches ☐ ☐ ☐ ☐ inf11 High school/CEGEP counsellors or teachers ☐ ☐ ☐ ☐ inf12 Students attending the university ☐ ☐ ☐ ☐ inf13 Friends ☐ ☐ ☐ ☐ inf14 Parents ☐ ☐ ☐ ☐ inf15 Maclean’s university rankings ☐ ☐ ☐ ☐ inf16 Globe and Mail Canadian University Report ☐ ☐ ☐ ☐ inf17 The Times Higher Education World University
Rankings ☐ ☐ ☐ ☐ inf18 QS World University Rankings ☐ ☐ ☐ ☐ inf19 Academic Ranking of World Universities (“Shanghai
rankings”) ☐ ☐ ☐ ☐ inf20 Other (please specify below:) ☐ ☐ ☐ ☐ inftxt ________________________________
orient1 Did you participate in an orientation program before or after arriving on campus last fall? Yes ☐ No ☐ [IF NO SKIP TO REGIST1]
How Satisfied were you with each of the following aspects of the orientation? Very
dissatisfied Somewhat dissatisfied
Somewhat satisfied
Very satisfied
Don’t Know
orient2 Feeling welcome at the university ☐ ☐ ☐ ☐ ☐ orient3 Helping you understand the university’s
academic expectations ☐ ☐ ☐ ☐ ☐ orient4 Helping your personal and social transition to
university ☐ ☐ ☐ ☐ ☐ orient5 Providing information about campus life ☐ ☐ ☐ ☐ ☐ orient6 Providing information about student services ☐ ☐ ☐ ☐ ☐ orient7 Building your confidence ☐ ☐ ☐ ☐ ☐ regist1 How satisfied are you with the process of
registering for courses at <UNIVERSITY NAME>? ☐ ☐ ☐ ☐ regist2 Thinking about all the courses in which you
wanted to register this year, how satisfied were you with getting into these courses? ☐ ☐ ☐ ☐

4
Expectations and experience
Now that you have been at <university name> for a while, how does your experience compare to what you expected in these areas?
Much less than I expected
Less than I expected
About what I expected
More than I expected
Much more than I expected
exp1 Cost of going to university ☐ ☐ ☐ ☐ ☐ exp2 Debt you might have to take on
to complete your program ☐ ☐ ☐ ☐ ☐ exp3 How academically demanding
your courses are ☐ ☐ ☐ ☐ ☐ exp4 The time you have to put into
your coursework ☐ ☐ ☐ ☐ ☐ exp5 Contact with your professors in
the classroom ☐ ☐ ☐ ☐ ☐ exp6 Contact with your professors
outside of the classroom ☐ ☐ ☐ ☐ ☐ exp7 Class participation ☐ ☐ ☐ ☐ ☐ exp8 Writing in your academic work ☐ ☐ ☐ ☐ ☐ exp9 Using math in your academic
work ☐ ☐ ☐ ☐ ☐ exp10 Doing course work in groups ☐ ☐ ☐ ☐ ☐ exp11 Doing course work on your own ☐ ☐ ☐ ☐ ☐ exp12 Intellectual stimulation ☐ ☐ ☐ ☐ ☐ exp13 Making friends ☐ ☐ ☐ ☐ ☐ exp14 Getting involved in campus social
activities ☐ ☐ ☐ ☐ ☐ exp15 The university has help and
advising available when I need it ☐ ☐ ☐ ☐ ☐ exp16 I get lost in the crowd ☐ ☐ ☐ ☐ ☐ exp17 Your course grades ☐ ☐ ☐ ☐ ☐
Exceeded Met Fallen short
exp18 Has <university name> exceeded, met or fallen short of your expectations? ☐ ☐ ☐

5
Transition to university
How much success have you had adjusting to <university name> in the following areas?
None
Very little Some
Very much
No basis for opinion
tran1 Meeting academic demands ☐ ☐ ☐ ☐ ☐ tran2 Choosing a program of study ☐ ☐ ☐ ☐ ☐ tran3 Getting academic advice ☐ ☐ ☐ ☐ ☐ tran4 Performing well in written assignments ☐ ☐ ☐ ☐ ☐ tran5 Performing well in courses that require
math ☐ ☐ ☐ ☐ ☐ tran6 Understanding the course material ☐ ☐ ☐ ☐ ☐ tran7 Managing your finances ☐ ☐ ☐ ☐ ☐ tran8 Managing your time ☐ ☐ ☐ ☐ ☐ tran9 Making friends ☐ ☐ ☐ ☐ ☐ tran10 Becoming involved in campus activities ☐ ☐ ☐ ☐ ☐ tran11 Finding suitable housing ☐ ☐ ☐ ☐ ☐ tran12 Dealing with new living arrangements ☐ ☐ ☐ ☐ ☐ tran13 Finding your way around campus ☐ ☐ ☐ ☐ ☐ tran14 Using the library ☐ ☐ ☐ ☐ ☐ tran15 Finding career information ☐ ☐ ☐ ☐ ☐ tran16 Commuting to campus ☐ ☐ ☐ ☐ ☐ tran18 Finding information about academic
integrity (plagiarism, proper citation, etc.) ☐ ☐ ☐ ☐ ☐

6
Professors
Please indicate your level of agreement or disagreement with the following statements about your professors.
Most of my professors … Strongly disagree Disagree Agree
Strongly agree
prof1 are reasonably accessible outside of class ☐ ☐ ☐ ☐
prof2 take a personal interest in my academic progress ☐ ☐ ☐ ☐
prof3 treat students as individuals, not just numbers ☐ ☐ ☐ ☐
prof4 encourage students to participate in class discussions ☐ ☐ ☐ ☐
prof5 are well organized in their teaching ☐ ☐ ☐ ☐
prof6 seem knowledgeable in their fields ☐ ☐ ☐ ☐
prof7 communicate well in their teaching ☐ ☐ ☐ ☐
prof8 are intellectually stimulating in their teaching ☐ ☐ ☐ ☐
prof9 provide useful feedback on my academic work ☐ ☐ ☐ ☐
prof10 provide prompt feedback on my academic work ☐ ☐ ☐ ☐
prof11 are fair in their grading ☐ ☐ ☐ ☐ prof12 are consistent in their grading ☐ ☐ ☐ ☐
Most of my professors … Strongly disagree Disagree Agree
Strongly agree
No basis for opinion
prof13 treat students the same regardless of gender ☐ ☐ ☐ ☐ ☐
prof14 treat students the same regardless of race ☐ ☐ ☐ ☐ ☐
prof15 look out for students' interests ☐ ☐ ☐ ☐ ☐
Yes, all courses
Yes, most courses
Yes, some courses No courses
prof16 Were you given the chance to evaluate the quality of teaching in your courses?
☐ ☐ ☐ ☐
Considering all of your professors and courses please indicate your level of agreement or disagreement with the following statement. Strongly
disagree Disagree Agree Strongly
agree prof17 Generally, I am satisfied with the
quality of teaching I have received ☐ ☐ ☐ ☐

7
Staff
Please indicate your level of agreement or disagreement with the following statements.
Strongly disagree Disagree Agree
Strongly agree
No basis for opinion
staff1 Most teaching assistants in my academic program are helpful ☐ ☐ ☐ ☐ ☐
staff2 Most university support staff (e.g., clerks, secretaries, etc.) are helpful ☐ ☐ ☐ ☐ ☐
Commitment to completion
Please indicate your level of agreement or disagreement with the following statements.
Strongly disagree Disagree Agree
Strongly agree
Don’t know
cmt1 I have the financial resources to complete my program ☐ ☐ ☐ ☐ ☐
cmt2 I had adequate information about my program from the university before I enrolled ☐ ☐ ☐ ☐ ☐
cmt3 I am in the right program for me ☐ ☐ ☐ ☐ ☐ cmt4 Most of my courses are interesting ☐ ☐ ☐ ☐ ☐ cmt5 My course load is manageable ☐ ☐ ☐ ☐ ☐ cmt6 I normally go to all of my classes ☐ ☐ ☐ ☐ ☐ cmt7 I am willing to put a lot of effort into being
successful at university ☐ ☐ ☐ ☐ ☐ cmt8 I can deal with stress ☐ ☐ ☐ ☐ ☐ cmt9 I have good study habits ☐ ☐ ☐ ☐ ☐ cmt10 I plan to come back to this university next year ☐ ☐ ☐ ☐ ☐ cmt11 I plan to transfer to another university next
year ☐ ☐ ☐ ☐ ☐ cmt12 I plan to go to college/CEGEP next year ☐ ☐ ☐ ☐ ☐ cmt13 I plan to complete my degree at this university ☐ ☐ ☐ ☐ ☐ cmt14 A university degree is worth the cost ☐ ☐ ☐ ☐ ☐ eval11 I feel as if I belong at this university ☐ ☐ ☐ ☐

8
Overall evaluation
How satisfied or dissatisfied are you with the following aspects of <university name>?
Very dissatisfied Dissatisfied Satisfied
Very satisfied
eval3 concern shown by the university for you as an individual ☐ ☐ ☐ ☐
eval9 your decision to attend this university ☐ ☐ ☐ ☐ eval12 Would you recommend <university name> to others? Yes ☐ No ☐ [If eval12 = “No” branch to eval12txt, otherwise branch to the Goal development section.]
Why wouldn’t you recommend <university name>? eval12txt __________________________________________________________________________ __________________________________________________________________________
Goal development
goal1 Have you chosen a major or discipline? Yes ☐ No ☐
After you have completed your undergraduate studies do you intend to: goal3 apply to a professional program (e.g., Medicine, Law, etc.) Yes ☐ No ☐ Unsure ☐ goal4 apply to graduate school Yes ☐ No ☐ Unsure ☐
goal5 Which of the following best describes your career plans? I have some general ideas but I need to clarify them ☐ I have several possible careers in mind ☐ I have a specific career in mind ☐ I am unsure but I want to develop a career plan ☐ I am not thinking about a career at this stage of my studies ☐
goal6 How well do you know the career options your program or intended program could open for you? Very well ☐ Fairly well ☐ Only a little ☐ Not at all ☐
Please indicate what steps if any you have taken to prepare for employment/your career after graduation? Check all that apply.
goal7 Talked with professors about employment/career ☐ goal8 Talked with parents/family about employment/career ☐ goal9 Talked with friends about employment/career ☐ goal10 Created resume or curriculum vitae (CV) ☐ goal11 Created an e-portfolio (an inventory of skills, abilities and
experience maintained on the web) ☐ goal12 Attended an employment fair ☐ goal13 Met with a career counsellor ☐ goal14 Worked in my chosen field of employment ☐ goal15 Volunteered in my chosen field of employment ☐ goal16 I have a career mentor ☐ goal17 None of the above ☐

9
Services
Please indicate which of the following services you have used since last September and how satisfied you are with the ones you have used.
Used
Satisfaction if service used Very
dissatisfied Dissatisfied Satisfied Very
Satisfied
srv1 Services for First Nations students ☐ srv1sat ☐ ☐ ☐ ☐ srv2 Services for international students ☐ srv2sat ☐ ☐ ☐ ☐ srv3 Services for students with
disabilities ☐
srv3sat ☐ ☐ ☐ ☐
srv4 University libraries: physical books, magazines, stacks
☐ srv4sat
☐ ☐ ☐ ☐
srv5 University libraries: electronic resources
☐ srv5sat
☐ ☐ ☐ ☐
srv6 Employment services ☐ srv6sat ☐ ☐ ☐ ☐ srv7 Career counselling ☐ srv7sat ☐ ☐ ☐ ☐ srv8 Personal counselling ☐ srv8sat ☐ ☐ ☐ ☐ srv9 Academic advising ☐ srv9sat ☐ ☐ ☐ ☐ srv10 Tutoring ☐ srv10sat ☐ ☐ ☐ ☐ srv11 Study skills and learning supports ☐ srv11sat ☐ ☐ ☐ ☐ srv12 Writing skills ☐ srv12sat ☐ ☐ ☐ ☐ srv13 University residences ☐ srv13sat ☐ ☐ ☐ ☐ srv14 Advising for students who need
financial aid ☐
srv14sat ☐ ☐ ☐ ☐
srv15 Financial aid ☐ srv15sat ☐ ☐ ☐ ☐ srv16 Athletic facilities ☐ srv16sat ☐ ☐ ☐ ☐ srv17 Other recreational facilities ☐ srv17sat ☐ ☐ ☐ ☐ srv18 University bookstores: physical
stores ☐
srv18sat ☐ ☐ ☐ ☐
srv19 University bookstores: online inventory check, ordering, etc.
☐ srv19sat
☐ ☐ ☐ ☐
srv20 Campus medical services ☐ srv20sat ☐ ☐ ☐ ☐ srv21 Co-op offices and supports ☐ srv21sat ☐ ☐ ☐ ☐ srv22 Facilities for university-based social
activities ☐
srv22sat ☐ ☐ ☐ ☐
srv23 Facilities for student associations ☐ srv23sat ☐ ☐ ☐ ☐ srv24 Computing services help desk ☐ srv24sat ☐ ☐ ☐ ☐ srv25 Food services ☐ srv25at ☐ ☐ ☐ ☐ srv26 Parking ☐ srv26at ☐ ☐ ☐ ☐

10
Academic history
hist1 In what year did you begin your postsecondary studies? Year: _______ hist2 In what year did you first enrol at <university name>? Year: _______ hist3 Have you transferred to <university name> from another postsecondary institution?
Yes ☐ No ☐ hist4 Please choose the letter grade that best reflects your overall average grade: A ☐ (includes A+, A and A-) B ☐ (includes B+, B and B-) C ☐ (includes C+, C and C-) D ☐ F ☐
Employment
work1 Excluding work related to a co-op program are you employed during the current academic term? Yes, off campus ☐ Yes, on campus ☐ Yes, both off campus and on campus ☐ No, but I am looking for work ☐ No, and I am not looking for work ☐ [If work1 = “Yes …” branch to work2, otherwise branch to the Finances section.] work2 On average, how many hours per week are you employed in this work? ___________ work3 What impact has this employment had on your academic performance? Very negative ☐ Somewhat negative ☐ No impact ☐ Somewhat positive ☐ Very positive ☐
Finances
fin1 How many credit cards do you have? _____ [If <> 0 branch to fin3, otherwise fin5.] fin2 Do you usually pay off the whole balance every month? Yes ☐ No ☐ fin3 What is the total unpaid balance on all of your cards? $____________ fin4 Did you receive a scholarship, financial award or bursary from <university name> for the 2015-2016
academic year? Yes ☐ No ☐ fin5 Would you have been able to attend <university name> without financial assistance from
<university name>? Yes ☐ No ☐

11
Living arrangements
live1 Where are you currently living? In on-campus housing (university residence, dorm, etc.) ☐ With parents, guardians or relatives ☐ In rented off-campus housing shared with others ☐ In rented off-campus housing on your own ☐ In a home you own ☐ livetxt Other (please specify): ____________________________________ ☐ [If live1 <> “In on-campus housing” branch to live2, otherwise branch to
live3]
live2 Would you prefer to live in on-campus housing if you had the choice? Yes
☐ No ☐
live3 What is your marital status?
Single ☐
Married or common law ☐
In a relationship other than married or common law ☐
live4 Do you have children? Yes ☐ No ☐
[If live4 = “Yes” branch to live5, otherwise branch to Disability section]
live5 How many up to age 5? _____ live6 How many age 5 to 11? _____ live7 How many 12 or older? _____
Disability
disability Do you have any of the following disabilities? Select all that apply.
Do you require accommodation
for learning?
Is the accommodation at your university adequate?
Yes Partly No
Mobility dis1 ☐ acom1 yes ☐ needs1 ☐ ☐ ☐ Hearing dis2 ☐ acom2 yes ☐ needs2 ☐ ☐ ☐ Speech dis3 ☐ acom3 yes ☐ needs3 ☐ ☐ ☐
Vision impairment dis4 ☐ acom4 yes ☐ needs4 ☐ ☐ ☐ Learning dis5 ☐ acom5 yes ☐ needs5 ☐ ☐ ☐
Head injury dis6 ☐ acom6 yes ☐ needs6 ☐ ☐ ☐ Other physical disability dis7 ☐ acom7 yes ☐ needs7 ☐ ☐ ☐
Attention deficit disorder dis8 ☐ acom8 yes ☐ needs8 ☐ ☐ ☐ Mental health dis9 ☐ acom9 yes ☐ needs9 ☐ ☐ ☐
Other (specify below:) dis10 ☐ acom10 yes ☐ needs10 ☐ ☐ ☐ distxt _________________________________
I do not have a disability dis11 ☐

12
Parental educational attainment
What is the highest level of education your parent(s)/guardian(s) have completed? meduc
Parent/Guardian 1 peduc
Parent/Guardian 2 Less than high school ☐ ☐ High school ☐ ☐ Some college, CEGEP or technical school (no certificate or diploma) ☐ ☐ College, CEGEP or technical school graduate ☐ ☐ Some university (no degree or diploma) ☐ ☐ Undergraduate university degree (e.g., BA, BSc, etc.) ☐ ☐ Professional degree (e.g., law, medicine, etc.) ☐ ☐ Graduate degree (e.g., Master’s, PhD) ☐ ☐ Other – Mother (please specify) meductxt ______________________________ Other – Father (please specify) peductxt ______________________________ Don’t know/Not applicable ☐ ☐
Ethnicity
Are you … (check all that apply) eth1 Aboriginal (e.g., status, non-status, Métis, Inuit) ☐ eth2 Arab (e.g., Saudi, Egyptian, etc.) ☐ eth3 Black ☐ eth4 Chinese ☐ eth5 Filipino ☐ eth6 Japanese ☐ eth7 Korean ☐ eth8 Latin American ☐ eth9 South Asian (e.g., East Indian, Pakistani, Sri Lankan, etc.) ☐ eth10 Southeast Asian (e.g., Cambodian, Indonesian, Laotian, Vietnamese, etc.) ☐ eth11 West Asian (e.g., Afghan, Iranian, etc.) ☐ eth12 White ☐ eth13 Other (please specify below): ☐ ethtxt ________________________ [If eth1 = “Aboriginal” branch to ab1, otherwise branch to the Comments section.] Which of the following describes your Aboriginal background? ab1 First Nations status ☐ ab2 First Nations non-status ☐ ab3 Metis ☐ ab4 Inuit ☐ ab5 Other ☐

13
Comments Please take this opportunity to comment fully about your overall university experience. Your remarks will provide valuable information to the institution. negativ Looking back on your experiences as a student, what aspects of your experience at <university name> have been most negative? How could we have helped or done a better job? _________________________________________________________________________________ positiv Looking back on your experiences as a student, what aspects of your experience at <university name> have been most positive? _________________________________________________________________________________


![2016 Survey of First Year Students · 2016 Survey of First Year Students This survey is being completed by first-year students at approximately [__] Canadian universities. We want](https://img.pdfslide.us/doc/110x75/5f66d440f2984a27782266de/2016-survey-of-first-year-students-2016-survey-of-first-year-students-this-survey.jpg)


![CUSC - EXHIBIT O - PART II B - National Grid plc v1.1 EXO PARTII B-2 V1.1 – 21st December 2005 CUSC - EXHIBIT O - PART II B DATED 200[ ] (1) [Insert name of Relevant Transmission](https://img.pdfslide.us/doc/110x75/5adfbc677f8b9a8f298d4d98/cusc-exhibit-o-part-ii-b-national-grid-plc-v11-exo-partii-b-2-v11-21st.jpg)
![Social Capital USA [The First Wave Only] · 1 Social Capital USA [The First Wave Only] Codebook S. Survey Specifics Survey case # case_ Survey year year Survey month month Survey](https://img.pdfslide.us/doc/110x75/5e8b2e94640b2c04ce2a5b73/social-capital-usa-the-first-wave-only-1-social-capital-usa-the-first-wave-only.jpg)