Embed Size (px)
Citation preview

Canadian Travel to the U.S.
Presented by:
MARK BROWNOffice of Travel and Tourism IndustriesInternational Trade AdministrationU.S. Department of CommerceOctober 2010
Presented to:
Discover America Committee--CANADA

2Office of Travel & Tourism Industries, International Trade Administration, U.S. Department of Commerce
Agenda for Today
• Fun Facts about Canada• Big to Small
– Global travel trends– Canada outbound volume and trends– Canada to the U.S. volume and trends– Canada’s importance to the U.S. travel industry– Visitation to U.S. states– Canadian visitor profile update and trends
• Looking ahead• Primer on the Travel Promotion Act• Q & A
3Office of Travel & Tourism Industries, International Trade Administration, U.S. Department of Commerce
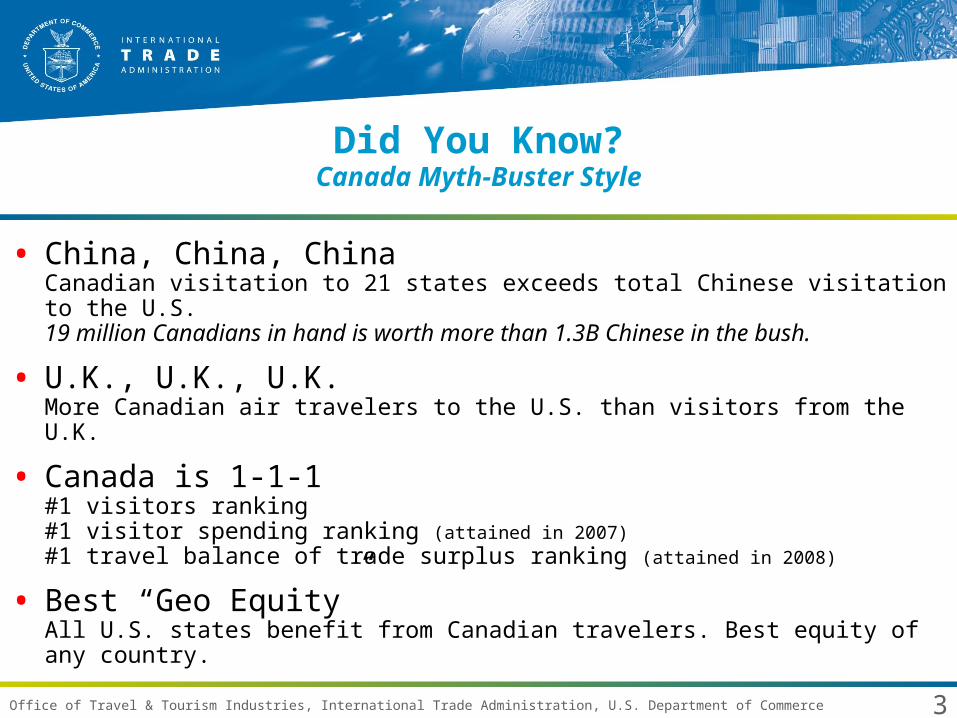
Did You Know?Canada Myth-Buster Style
• China, China, ChinaCanadian visitation to 21 states exceeds total Chinese visitation to the U.S.19 million Canadians in hand is worth more than 1.3B Chinese in the bush.
• U.K., U.K., U.K.More Canadian air travelers to the U.S. than visitors from the U.K.
• Canada is 1-1-1#1 visitors ranking#1 visitor spending ranking (attained in 2007)#1 travel balance of trade surplus ranking (attained in 2008)
• Best “Geo Equity”All U.S. states benefit from Canadian travelers. Best equity of any country.

4Office of Travel & Tourism Industries, International Trade Administration, U.S. Department of Commerce
OTTI’s Canada Travel Program
• Dedicated OTTI Research Analyst.
• Monthly U.S. Inbound / Outbound visitor volume by travel segments(with ongoing summary).
• Annual Report (comprehensive visitor profile).
• Dedicated section on TINET website. Substantial addition of historical tables and analyses.
• Nurture relationships with Statistics Canada, CTC, CB-C, CS offices, DiscoverAmerica Committee-Canada.
• Travel & Tourism Advisory Board consideration for marketing and policy programs.
• WHTI tracking on monthly basis.
• Monitor demographics / economy changes.
• Your head cheerleader as the Travel Promotion Act of 2009 developments unfold.
5Office of Travel & Tourism Industries, International Trade Administration, U.S. Department of Commerce
Global Travel Trends
6Office of Travel & Tourism Industries, International Trade Administration, U.S. Department of Commerce
$0
$100
$200
$300
$400
$500
$600
$700
$800
$900
$1,000
0
100
200
300
400
500
600
700
800
900
1,000
1950
1960
1965
1970
1975
1980
1981
1982
1983
1984
1985
1986
1987
1988
1989
1990
1991
1992
1993
1994
1995
1996
1997
1998
1999
2000
2001
2002
2003
2004
2005
2006
2007
2008
2009
2010
World Arrivals World Receipts
World Arrivals (millions) World Receipts ($billions)
1950 - 1980 1981 - 2010
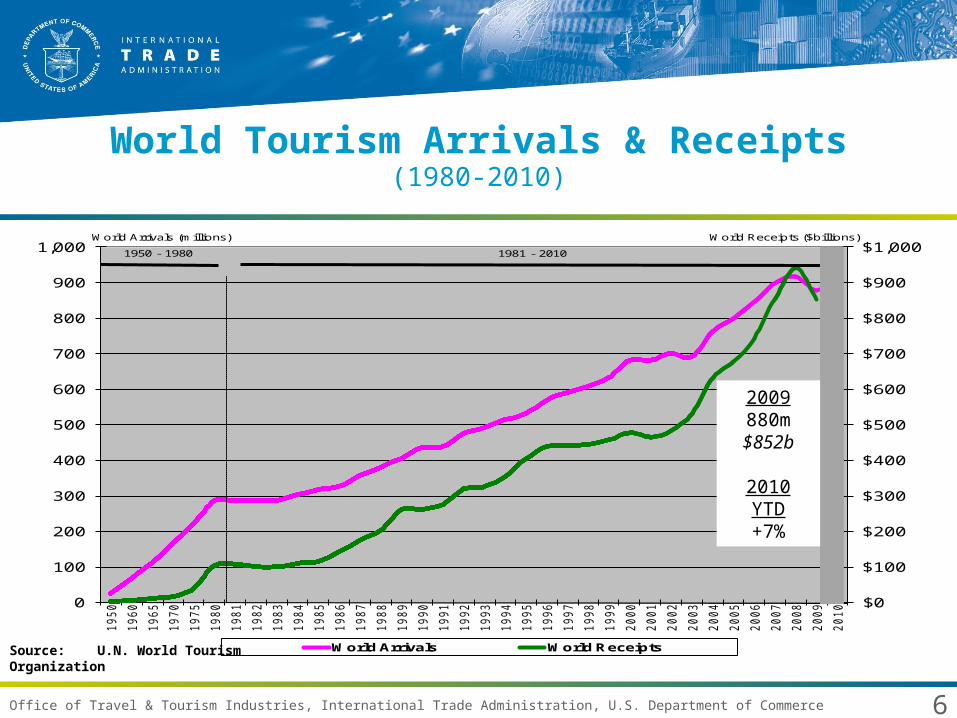
World Tourism Arrivals & Receipts(1980-2010)
Source: U.N. World Tourism Organization
2009880m$852b
2010 YTD+7%

7Office of Travel & Tourism Industries, International Trade Administration, U.S. Department of Commerce
Top Ten Country Rankings of GlobalVisitors and Receipts (2009)
All Countries $852 All Countries 880
1 United States $110 11.7% France 74 8.4%2 Spain $62 6.5% United States 55 6.2%3 France $57 5.9% Spain 52 5.9%4 Italy $46 4.8% China 51 5.8%5 China $41 4.3% Italy 43 4.9%
6 Germany $40 4.2% United Kingdom 28 3.2%7 United Kingdom $36 3.8% Turkey 26 2.9%8 Australia $25 2.6% Germany 24 2.8%9 Turkey $22 2.3% Malaysia 24 2.7%
10 Austria $22 2.3% Mexico 22 2.4%
Destination 2009 World Destination 2009 WorldRank Country Receipts* Share Country Visitors Share
($bil) (%) (mil) (%)
Source: U.N. World Tourism Organization.* Latest data available and excludes air passenger fares ($26.4 billion for U.S. alone in 2009). World shares based on unrounded data.
The United States leads the world in global travel and tourism exports (spending receipts) and ranks 2rd in global visitation.
U.S. Air Carriers

8Office of Travel & Tourism Industries, International Trade Administration, U.S. Department of Commerce
Spending Update from
• VISA: 20% RISE IN U.S. INBOUND TOURISM SPENDING. A new report from Visa Inc. shows the tourism industry has begun to rebound during the first six months of 2010. From Jan. 1 to June 30 of this year, spending by international visitors to the U.S. on their Visa‐branded payment cards was up 20% over the comparable period of 2009. At the same time, Americans are spending at higher levels when traveling internationally: Spending by U.S. travelers abroad on Visa cards was up 9.3% in the first quarter of 2010 compared to the same period in 2009. Total first‐half visitor spending in the U.S. for Canada was $4.6 billion, up 22%; the U.K. was $1.2 billion, up 16%; Japan $387 million, up 3%; Mexico $819 million, up 24%; and Brazil $835 million, up 73%. (www.TravelPulse.com, 8/31)
• However, DOC/Bureau of Economic Analysis reports international spending +8% through June and +10% through August.

9Office of Travel & Tourism Industries, International Trade Administration, U.S. Department of Commerce
5
7
9
11
13
15
17
19
21
23
1971
1972
1973
1974
1975
1976
1977
1978
1979
1980
1981
1982
1983
1984
1985
1986
1987
1988
1989
1990
1991
1992
1993
1994
1995
1996
1997
1998
1999
2000
2001
2002
2003
2004
2005
2006
2007
2008
2009
2010
2011
2012
2013
2014
19,113,000
8.67
19,221,000?
12,666,000
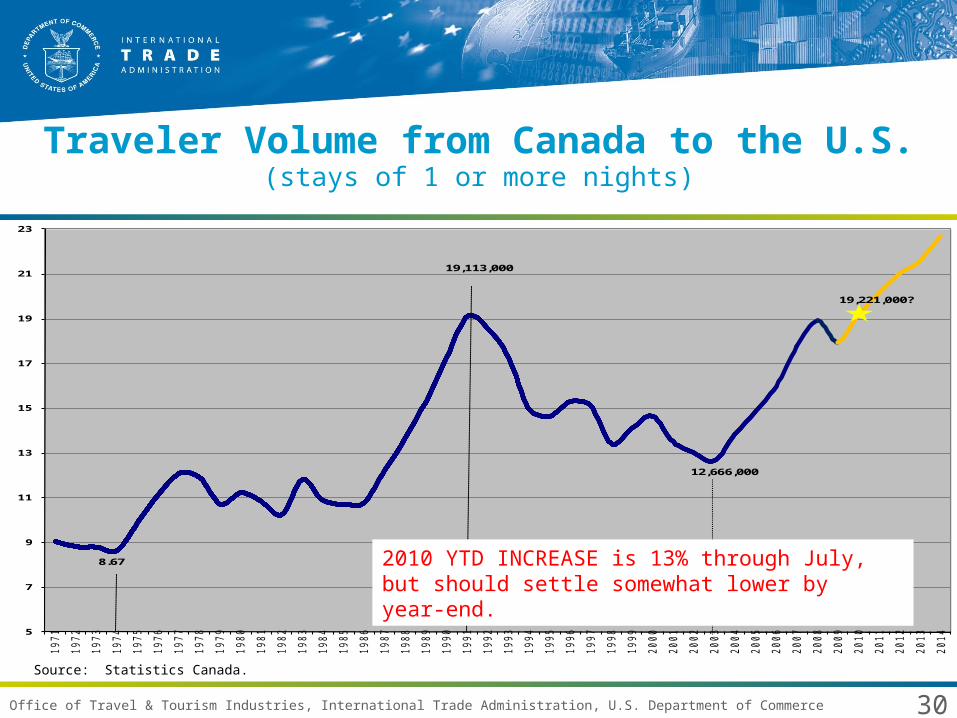
Traveler Volume from Canada to the U.S.(stays of 1 or more nights)
Source: Statistics Canada.
2010 YTD INCREASE is 13% through July, but should settle somewhat lower by year-end.

10Office of Travel & Tourism Industries, International Trade Administration, U.S. Department of Commerce
Trends in Travel from/to Canada(stays of 1 or more nights)
Source: Statistics Canada.

11Office of Travel & Tourism Industries, International Trade Administration, U.S. Department of Commerce
Canada Outbound / U.S. Shareannual growth rates 1999-2010YTD--1+ nights
-10%
-5%
0%
5%
10%
15%
1999 2000 2001 2002 2003 2004 2005 2006 2007 2008 2009 2010YTD
Canada to U.S. Canada to NON-U.S.
Canadians have been traveling outside Canada! U.S. performance trailed non-U.S. performance in 9 of the past 11 years. Not so in 2010!

12Office of Travel & Tourism Industries, International Trade Administration, U.S. Department of Commerce
Canadian Outbound Traveler Volume(percent change same month from previous year)
-20%-15%-10%
-5%0%5%
10%15%20%
25%30%35%
Jan
Feb
Mar
Apr
May
Jun
Jul
Aug
Sep
Oct
Nov
Dec
Jan
Feb
Mar
Apr
May
Jun
Jul
Aug
Sep
Oct
Nov
Dec
Jan
Feb
Mar
Apr
May
Jun
Jul
Aug
Sep
Oct
Nov
Dec
Jan
Feb
Mar
Apr
May
Jun
Jul
Aug
Sep
Oct
Nov
Dec
Jan
Feb
Mar
Apr
May
Jun
Jul
Aug
Sep
Oct
Nov
Dec
To USA To Other
06 /05 07 / 06 08 / 07 09 / 08 10 / 09
Outbound to the U.S. is often inconsistent with outbound to the rest of the world in magnitude…and recently in direction of change. Outbound to the U.S. was 70% of all outbound in 2008—a proportion that has declined for a decade.

13Office of Travel & Tourism Industries, International Trade Administration, U.S. Department of Commerce
Canada to U.S.12-month moving average
The 12 consecuting months of decline in 2008/2009 has been matched by 8 consecutive increases in 2009/2010. The growth still has momentum…
-10%
-5%
0%
5%
10%
15%
20%
DE
C
JA
N
FE
B
MA
R
AP
R
MA
Y
JU
N
JU
L
AU
G
SE
P
OC
T
NO
V
DE
C
JA
N
FE
B
MA
R
AP
R
MA
Y
JU
N
JU
L
AU
G
SE
P
OC
T
NO
V
DE
C
JA
N
FE
B
MA
R
AP
R
MA
Y
JU
N
JU
L
AU
G
SE
P
OC
T
NO
V
DE
C
JA
N
FE
B
MA
R
AP
R
MA
Y
JU
N
JU
L
AU
G
SE
P
OC
T
NO
V
DE
C
JA
N
FE
B
MA
R
AP
R
MA
Y
JU
N
JU
L
AU
G
SE
P
OC
T
NO
V
DE
C
% Change 12-Mo. Avg.
2006 2007 2008 2009 2010

14Office of Travel & Tourism Industries, International Trade Administration, U.S. Department of Commerce
Where are Canadians Traveling?
• After U.S., all other countries are 1.0 million or fewer.
• Top countries: Mexico, U.K., France, Cuba, Dominican Republic, Germany, Italy, Netherlands, China, and Spain.
• High growth rates for Mexico, Cuba, DR, China, Spain, HK.

15Office of Travel & Tourism Industries, International Trade Administration, U.S. Department of Commerce
International Total * 54,958 -5% 12%1 Canada 17,973 -5% 12%2 Mexico 13,164 -4% 12%
Overseas ** 23,756 -6% 11%3 United Kingdom 3,899 -15% -2%4 Japan 2,918 -10% 20%5 Germany 1,687 -5% 2%6 France 1,204 -3% 8%7 Brazil 893 16% 36%8 Italy 753 -3% 12%9 South Korea 744 -2% 48%10 Australia 724 5% 27%
Origin of Visitor 2009p 09 / 08 10/09 AUG. YTD
(000s) (% change) (% change)
Top Origin Markets forInternational Travelers to the U.S.
* International travelers include all countries generating visitors to the U.S.** Overseas includes all countries except Canada and Mexico. Record year for travel to U.S.

16Office of Travel & Tourism Industries, International Trade Administration, U.S. Department of Commerce
11 Spain 597 -9% 9%
12 India 549 -8% 18%13 Netherlands 548 -10% 3%14 China (PRC) 525 6% 57%15 Venezuela 507 0% -5%
16 Colombia 425 1% 19%17 Ireland 411 -23% -14%18 Argentina 356 12% 21%19 Switzerland 356 4% 9% 20 Sweden 324 -18% 12%
Origin of Visitor 2009p 09 / 08 10/09 AUG. YTD
(000s) (% change) (% change)
Top Origin Markets forInternational Travelers to the U.S.
Record year for travel to U.S.
17Office of Travel & Tourism Industries, International Trade Administration, U.S. Department of Commerce
Total Travel Record YearReceipts Travel Record
Origin Country 2009 Receipts Set($bil) ($bil)
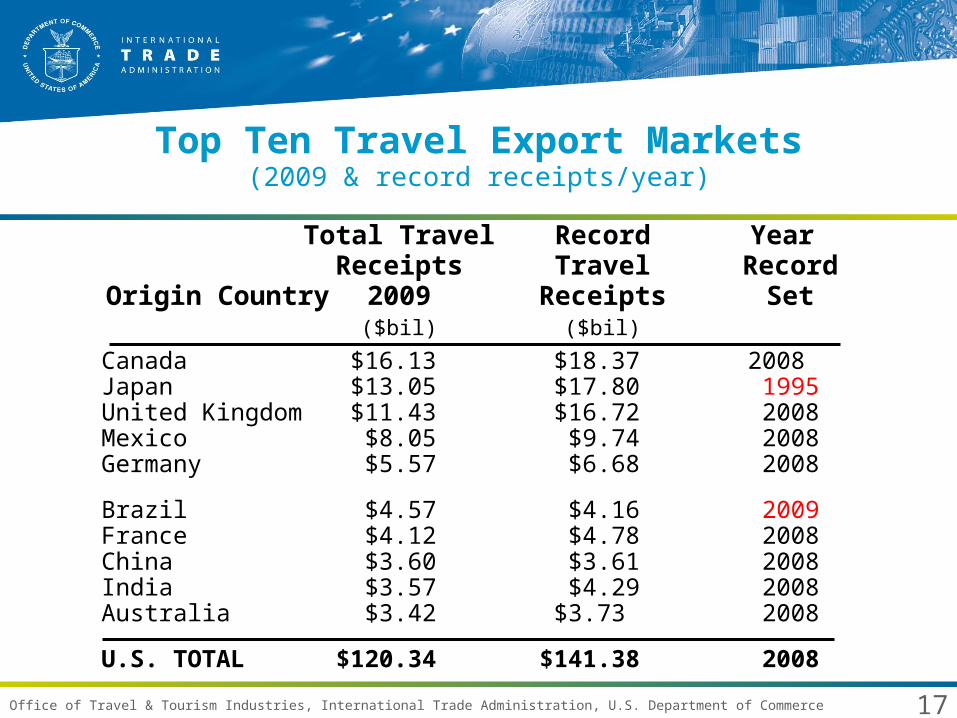
Top Ten Travel Export Markets(2009 & record receipts/year)
Canada $16.13 $18.37 2008 Japan $13.05 $17.80 1995United Kingdom $11.43 $16.72 2008Mexico $8.05 $9.74 2008Germany $5.57 $6.68 2008
Brazil $4.57 $4.16 2009France $4.12 $4.78 2008China $3.60 $3.61 2008India $3.57 $4.29 2008Australia $3.42 $3.73 2008
U.S. TOTAL $120.34 $141.38 2008

18Office of Travel & Tourism Industries, International Trade Administration, U.S. Department of Commerce
International Travel to The U.S. in Perspective
• U.S.– 4% of travelers– 17% of travel spending (and…employment, payroll, taxes)– 21% of all lodging, 13% of all sightseeing services, 10% of all gaming,
2%-4% of all restaurants, recreation/entertainment, sports.
• Orlando– 6% of travelers– 17% of spending– Large % of lodging
• NYC– 18% of travelers– 41% of spending– 52% of lodging

19Office of Travel & Tourism Industries, International Trade Administration, U.S. Department of Commerce
Importance of the Canadian Travel Market to the U.S.
• Canada accounts for 32.7% of U.S. international visitors and 13.4% of visitor spending.
• …and...– Spending had been growing at high rates for several years to produce
consecutive records….but tumbled 12% in 2009…but in 2010…– For many destinations, Canadian visitation occurs in non-peak seasons
and helps to distribute visitors more uniformly throughout the year.– All states benefit from Canadian travelers! Geographic equity is best
among origin countries (27 states of 2+% of total visitors).
• Rankings:– #1 visitors (17.97 M)– #1 spending ($16.13 B)– #1 travel balance of trade surplus ($9.91 B)

20Office of Travel & Tourism Industries, International Trade Administration, U.S. Department of Commerce
Key Travel Characteristics of Canadian Travelers
(2009)• Main Trip Purpose
– 60% Leisure (49% holiday, vacation; 5% 2nd home; 6% events)– 19% Visit Friends or Relatives (VFR)– 11% Business (4% meetings; 5% convention; 2% other work)– 10% Other (3% pers., 1% transit; 1% study; 3% shop; 2% other)
• Origin Province– Ontario 39% of population but 45% of travelers. BC also higher share
of visitors than population (13% vs. 17%).
• State Destinations– A few destinations dominate the numbers. Florida is 15% of visitors,
but 33% of visitor-nights due to snowbirds.– Every U.S. region and state was down for 2009 in visitors, visitor-
nights, and spending.
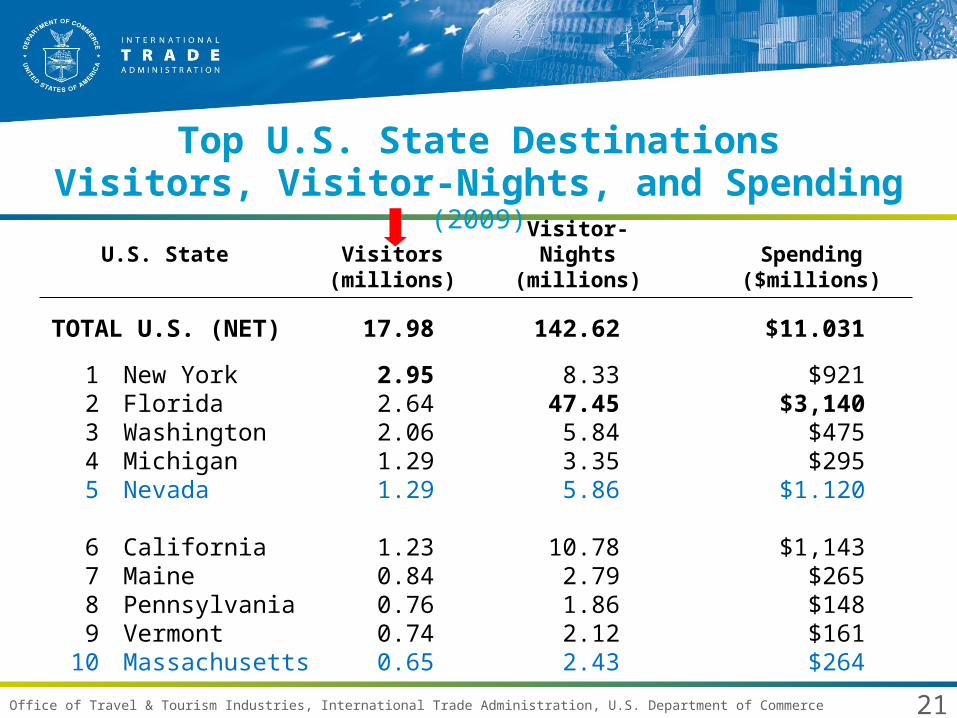
21Office of Travel & Tourism Industries, International Trade Administration, U.S. Department of Commerce
Visitor-U.S. State Visitors Nights Spending
(millions) (millions) ($millions)
TOTAL U.S. (NET) 17.98 142.62 $11.031
1 New York 2.95 8.33 $9212 Florida 2.64 47.45 $3,1403 Washington 2.06 5.84 $4754 Michigan 1.29 3.35 $2955 Nevada 1.29 5.86 $1.120
6 California 1.23 10.78 $1,143 7 Maine 0.84 2.79 $265
8 Pennsylvania 0.76 1.86 $1489 Vermont 0.74 2.12 $161
10 Massachusetts 0.65 2.43 $264
Top U.S. State DestinationsVisitors, Visitor-Nights, and Spending (2009)

22Office of Travel & Tourism Industries, International Trade Administration, U.S. Department of Commerce
Key Travel Characteristics of Canadian Travelers (continued) (2009)
• Transportation (mode of entry into U.S.)– 60% auto (34% plane; 3% bus; 3% other).– 71% of business travelers flew.
• Accommodations– 56% hotel/motel (16% friends/relatives; 10% camp/trailer/cabin).– Hotel/motel differs by purpose (88% bus.; 57% leisure; 29% vfr).
• Stay Length– 37% of Canadian state-visits are day trips.– Among overnight trips:
• 10% are 1-night trips.• 6% are 3 weeks or longer. 3+ weeks accounts for 40% of visitor-nights.• 7.93 nights average stay length, 9.55 leisure…but this average is
misleading…

23Office of Travel & Tourism Industries, International Trade Administration, U.S. Department of Commerce
Canadian Nights in the U.S.(among overnight LEISURE visitors--60% of total state visits--2009)
0%
5%
10%
15%
20%
25%
1 2 3 4-6 7-9 10-13 14-16 17-20 21-30 31-59 60+
% of total 1+ night trips
mean avg.=9.55 nights
mode =4-6 nights
medianavg. =
4-6 nights

24Office of Travel & Tourism Industries, International Trade Administration, U.S. Department of Commerce
Key Travel Characteristics ofCanadian Travelers -- continued (2009)
• Spending (source: Statistics Canada; all records)
– $11.0 billion (excludes fares to travel to the U.S.)– $1,320 per party– $614 per visitor– $77 per visitor per night
– Of the 76% of spending reported with detail:• 34% accommodations• 22% food & beverage• 18% other (souvenirs, shopping, etc)• 13% transportation (in U.S.)• 12% entertainment

25Office of Travel & Tourism Industries, International Trade Administration, U.S. Department of Commerce
Sum of all 18 activities 348% 233% 341% 392% 225%
Go Shopping 73% 53% 69% 78% 73%Go Sightseeing 45% 33% 35% 54% 25%Visit Friends Or Relatives 37% 16% 95% 24% 31%Participate Sports/Out. Activities 32% 12% 24% 40% 17%Go To A Bar Or Night Club 23% 35% 15% 24% 17%
Visit A Historic Site 22% 17% 18% 25% 11%Visit A Nat. Or State Nature Park 17% 8% 12% 22% 8%Visit A Museum Or Art Gallery 16% 14% 14% 18% 8%Attend Cultural Events 13% 9% 10% 15% 7%Go To A Casino 13% 7% 5% 17% 7%
Canadian Activity Participation Rateswhile in the U.S. (2009)
Activity Total Business VFR PleasureOther
26Office of Travel & Tourism Industries, International Trade Administration, U.S. Department of Commerce
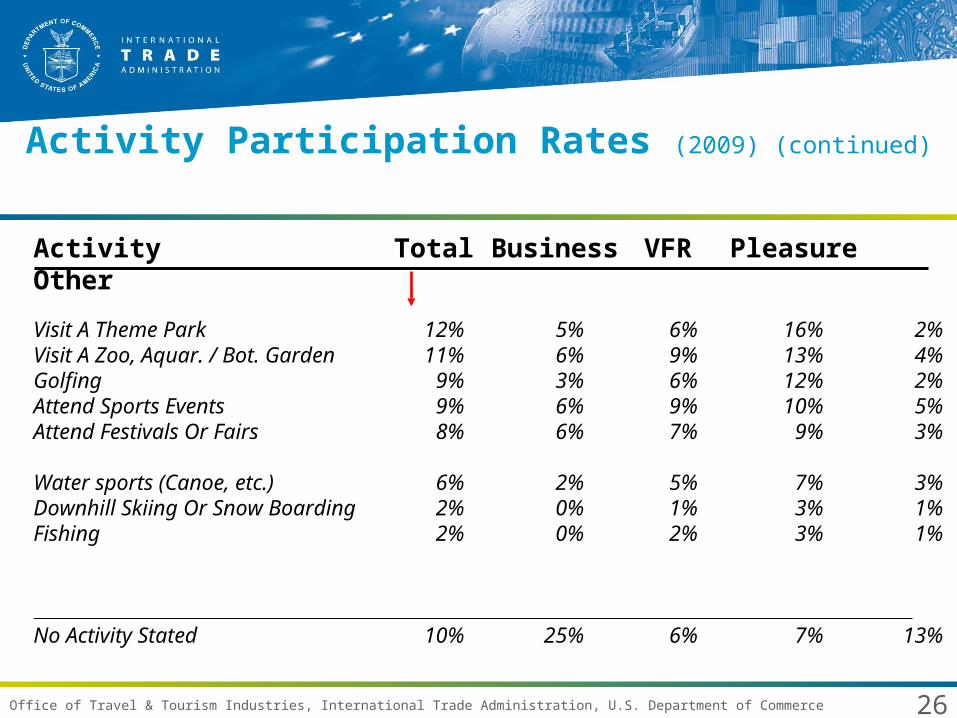
Visit A Theme Park 12% 5% 6% 16% 2%Visit A Zoo, Aquar. / Bot. Garden 11% 6% 9% 13% 4%Golfing 9% 3% 6% 12% 2%Attend Sports Events 9% 6% 9% 10% 5%Attend Festivals Or Fairs 8% 6% 7% 9% 3%
Water sports (Canoe, etc.) 6% 2% 5% 7% 3%Downhill Skiing Or Snow Boarding 2% 0% 1% 3% 1%Fishing 2% 0% 2% 3% 1%
No Activity Stated 10% 25% 6% 7% 13%
Activity Participation Rates (2009) (continued)
Activity Total Business VFR PleasureOther

27Office of Travel & Tourism Industries, International Trade Administration, U.S. Department of Commerce
Looking Ahead
28Office of Travel & Tourism Industries, International Trade Administration, U.S. Department of Commerce
Outlook for Canada Travel to the United States
http://redkid.net/generator/8ball/

29Office of Travel & Tourism Industries, International Trade Administration, U.S. Department of Commerce
Outlook for Canada Travel to the United States
http://redkid.net/generator/8ball/
30Office of Travel & Tourism Industries, International Trade Administration, U.S. Department of Commerce
5
7
9
11
13
15
17
19
21
23
1971
1972
1973
1974
1975
1976
1977
1978
1979
1980
1981
1982
1983
1984
1985
1986
1987
1988
1989
1990
1991
1992
1993
1994
1995
1996
1997
1998
1999
2000
2001
2002
2003
2004
2005
2006
2007
2008
2009
2010
2011
2012
2013
2014
19,113,000
8.67
19,221,000?
12,666,000
Traveler Volume from Canada to the U.S.(stays of 1 or more nights)
Source: Statistics Canada.
2010 YTD INCREASE is 13% through July, but should settle somewhat lower by year-end.

31Office of Travel & Tourism Industries, International Trade Administration, U.S. Department of Commerce
Factors for 2010 and BeyondEconomy
– Unemployment about 8.1%and improving-ish.A year ago 8.7%.
– GDP up 3.7% in September. Down 2.6 in 2009.
– Household finances strong-ish Household wealth strong-ish.
– Near-retirees on track regarding retirement planning.
– Inflation about 1.7% in September (annual rate)a year ago -1%
– Mortgage / credit card debt??? 5.0
5.5
6.0
6.5
7.0
7.5
8.0
8.5
9.0
JAN1999
APR1999
JUL1999
OCT1999
JAN2000
APR2000
JUL2000
OCT2000
JAN2001
APR2001
JUL2001
OCT2001
JAN2002
APR2002
JUL2002
OCT2002
JAN2003
APR2003
JUL2003
OCT2003
JAN2004
APR2004
JUL2004
OCT2004
JAN2005
APR2005
JUL2005
OCT2005
JAN2006
APR2006
JUL2006
OCT2006
JAN2007
APR2007
JUL2007
OCT2007
JAN2008
APR2008
JUL2008
OCT2008
JAN2009
APR2009
JUL2009
OCT2009
JAN2010
APR2010
JUL2010
OCT2010
1999 2000 2001 2002 2003 2004 2005 2006 2007 2008 2009 2010
Unemployment Rate
32Office of Travel & Tourism Industries, International Trade Administration, U.S. Department of Commerce
0.60
0.65
0.70
0.75
0.80
0.85
0.90
0.95
1.00
1.05
1.10
95-01
95-04
95-07
95-10
96-01
96-04
96-07
96-10
97-01
97-04
97-07
97-10
98-01
98-04
98-07
98-10
99-01
99-04
99-07
99-10
00-01
00-04
00-07
00-10
01-01
01-04
01-07
01-10
02-01
02-04
02-07
02-10
03-01
03-04
03-07
03-10
04-01
04-04
04-07
04-10
05-01
05-04
05-07
05-10
06-01
06-04
06-07
06-10
07-01
07-04
07-07
07-10
08-01
08-04
08-07
08-10
09-01
09-04
09-07
09-10
10-01
10-04
10-07
10-10
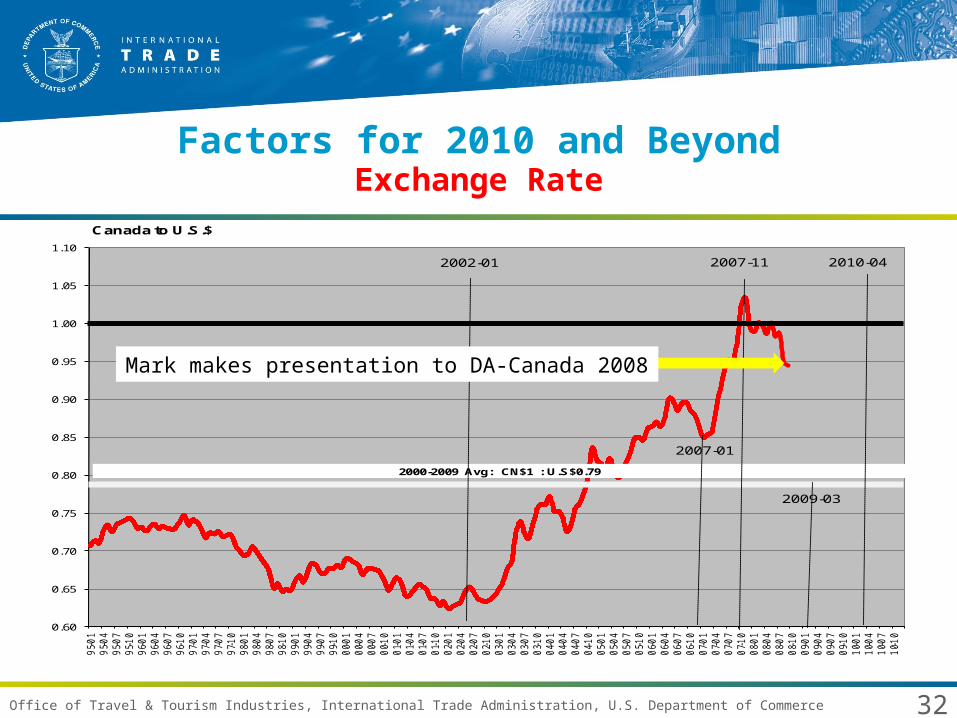
2000-2009 Avg: CN$1 : U.S$0.79
2007-112002-01
Canada to U.S.$
2009-03
2007-01
2010-04
Factors for 2010 and BeyondExchange Rate
Mark makes presentation to DA-Canada 2008

33Office of Travel & Tourism Industries, International Trade Administration, U.S. Department of Commerce
0.60
0.65
0.70
0.75
0.80
0.85
0.90
0.95
1.00
1.05
1.10
95-01
95-04
95-07
95-10
96-01
96-04
96-07
96-10
97-01
97-04
97-07
97-10
98-01
98-04
98-07
98-10
99-01
99-04
99-07
99-10
00-01
00-04
00-07
00-10
01-01
01-04
01-07
01-10
02-01
02-04
02-07
02-10
03-01
03-04
03-07
03-10
04-01
04-04
04-07
04-10
05-01
05-04
05-07
05-10
06-01
06-04
06-07
06-10
07-01
07-04
07-07
07-10
08-01
08-04
08-07
08-10
09-01
09-04
09-07
09-10
10-01
10-04
10-07
10-10
2000-2009 Avg: CN$1 : U.S$0.79
2007-112002-01
Canada to U.S.$
2009-03
2007-01
2010-04
Factors for 2010 and BeyondExchange Rate
Mark makes presentation to DA-Canada 2009

34Office of Travel & Tourism Industries, International Trade Administration, U.S. Department of Commerce
Factors for 2010 and BeyondExchange Rate
0.60
0.65
0.70
0.75
0.80
0.85
0.90
0.95
1.00
1.05
1.10
95-01
95-04
95-07
95-10
96-01
96-04
96-07
96-10
97-01
97-04
97-07
97-10
98-01
98-04
98-07
98-10
99-01
99-04
99-07
99-10
00-01
00-04
00-07
00-10
01-01
01-04
01-07
01-10
02-01
02-04
02-07
02-10
03-01
03-04
03-07
03-10
04-01
04-04
04-07
04-10
05-01
05-04
05-07
05-10
06-01
06-04
06-07
06-10
07-01
07-04
07-07
07-10
08-01
08-04
08-07
08-10
09-01
09-04
09-07
09-10
10-01
10-04
10-07
10-10
2000-2009 Avg: CN$1 : U.S$0.79
2007-112002-01
Canada to U.S.$
2009-03
2007-01
2010-04
35Office of Travel & Tourism Industries, International Trade Administration, U.S. Department of Commerce
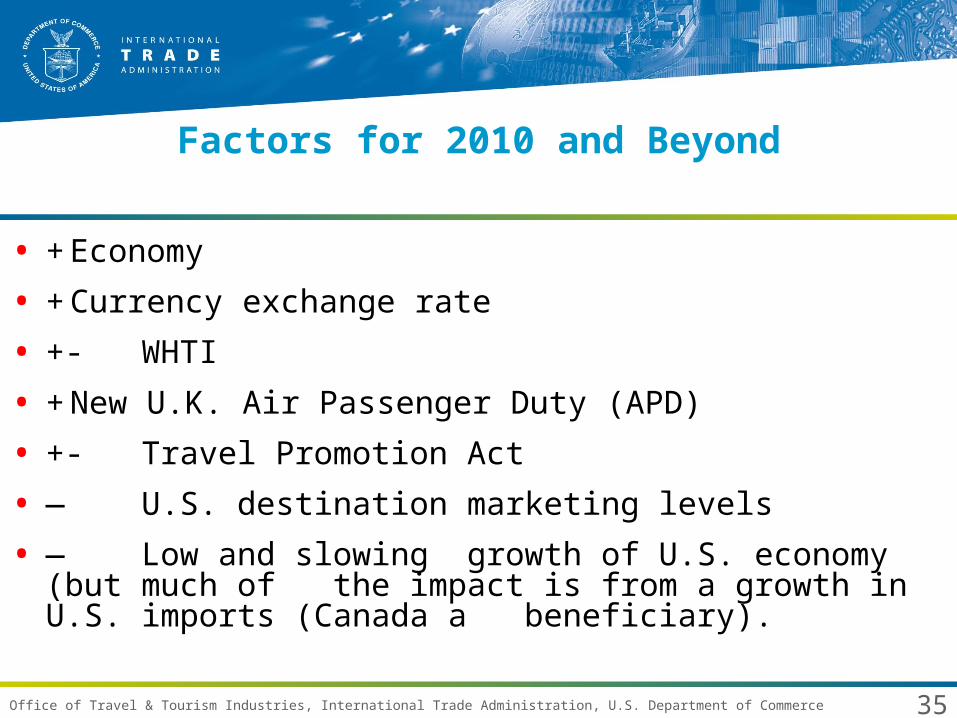
Factors for 2010 and Beyond
• + Economy
• + Currency exchange rate
• +- WHTI
• + New U.K. Air Passenger Duty (APD)
• +- Travel Promotion Act
• — U.S. destination marketing levels
• — Low and slowing growth of U.S. economy (but much of the impact is from a growth in U.S. imports (Canada a beneficiary).
36Office of Travel & Tourism Industries, International Trade Administration, U.S. Department of Commerce
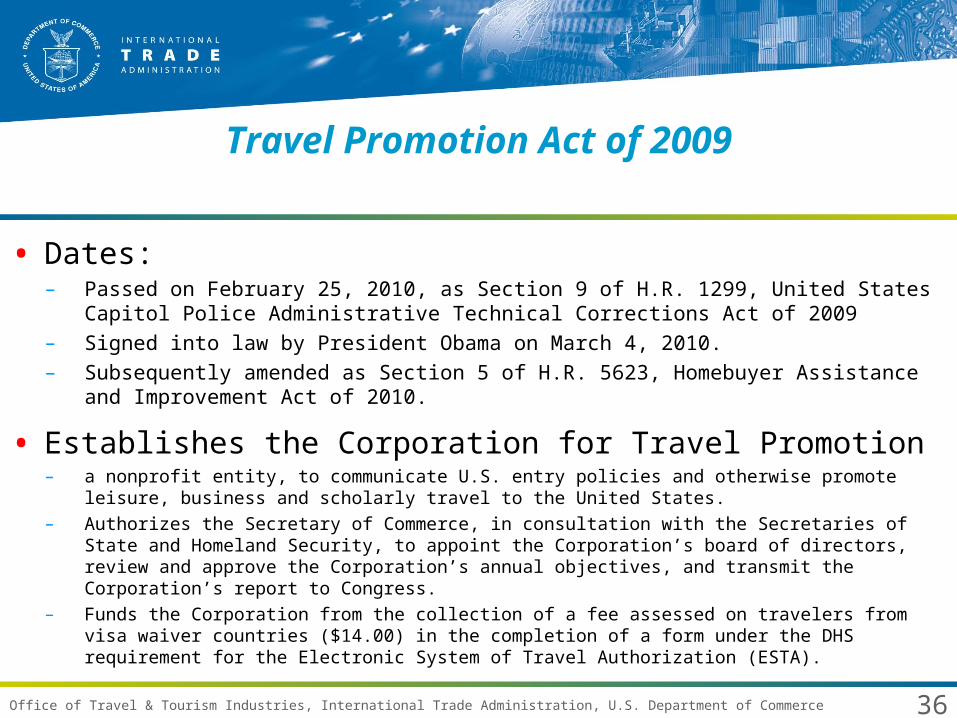
Travel Promotion Act of 2009
• Dates:– Passed on February 25, 2010, as Section 9 of H.R. 1299, United States Capitol Police
Administrative Technical Corrections Act of 2009– Signed into law by President Obama on March 4, 2010. – Subsequently amended as Section 5 of H.R. 5623, Homebuyer Assistance and
Improvement Act of 2010.
• Establishes the Corporation for Travel Promotion– a nonprofit entity, to communicate U.S. entry policies and otherwise promote leisure, business and
scholarly travel to the United States.
– Authorizes the Secretary of Commerce, in consultation with the Secretaries of State and Homeland Security, to appoint the Corporation’s board of directors, review and approve the Corporation’s annual objectives, and transmit the Corporation’s report to Congress.
– Funds the Corporation from the collection of a fee assessed on travelers from visa waiver countries ($14.00) in the completion of a form under the DHS requirement for the Electronic System of Travel Authorization (ESTA).
37Office of Travel & Tourism Industries, International Trade Administration, U.S. Department of Commerce
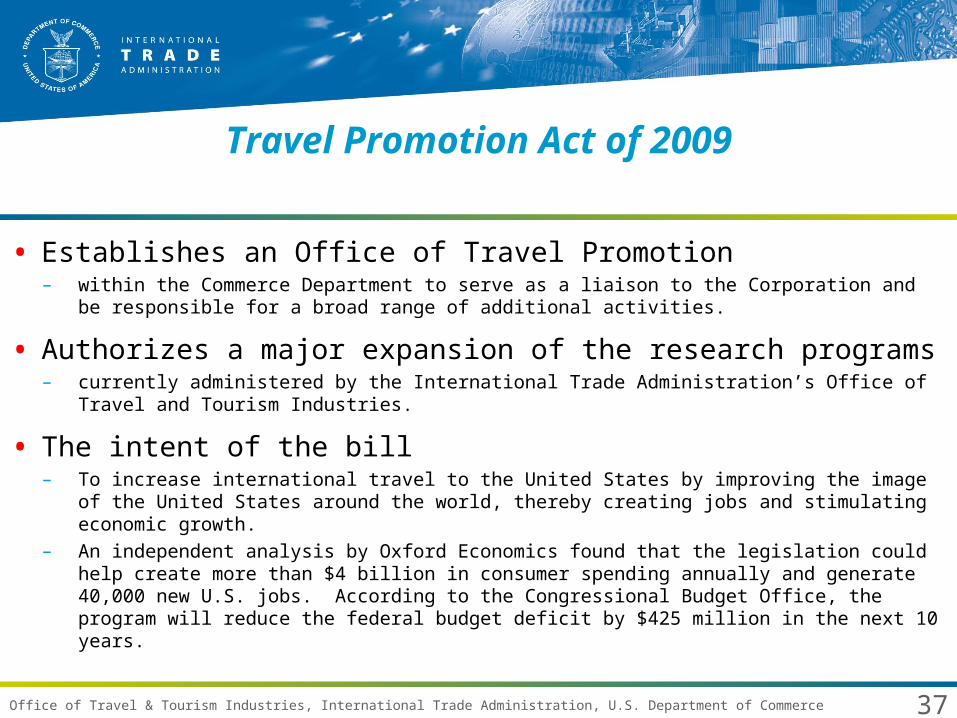
Travel Promotion Act of 2009
• Establishes an Office of Travel Promotion– within the Commerce Department to serve as a liaison to the Corporation and be
responsible for a broad range of additional activities.
• Authorizes a major expansion of the research programs– currently administered by the International Trade Administration’s Office of Travel and
Tourism Industries.
• The intent of the bill– To increase international travel to the United States by improving the image of the United
States around the world, thereby creating jobs and stimulating economic growth.– An independent analysis by Oxford Economics found that the legislation could help create
more than $4 billion in consumer spending annually and generate 40,000 new U.S. jobs. According to the Congressional Budget Office, the program will reduce the federal budget deficit by $425 million in the next 10 years.

38Office of Travel & Tourism Industries, International Trade Administration, U.S. Department of Commerce
Travel Promotion Act of 2009Corporation for Travel Promotion Funding Details
• In year one, the Corporation is to be funded from a drawdown of up to $10 million.
• In year two, the drawdown is up to $100 million with a 50% match by industry (80% of the match can be in-kind, 20% must be in cash).
• In years three, four and five, the drawdown is up to $100 million with 100% industry match.
• In year six and beyond, funding of the Corporation would be by industry assessment only as the Act sunsets in 2015.
39Office of Travel & Tourism Industries, International Trade Administration, U.S. Department of Commerce
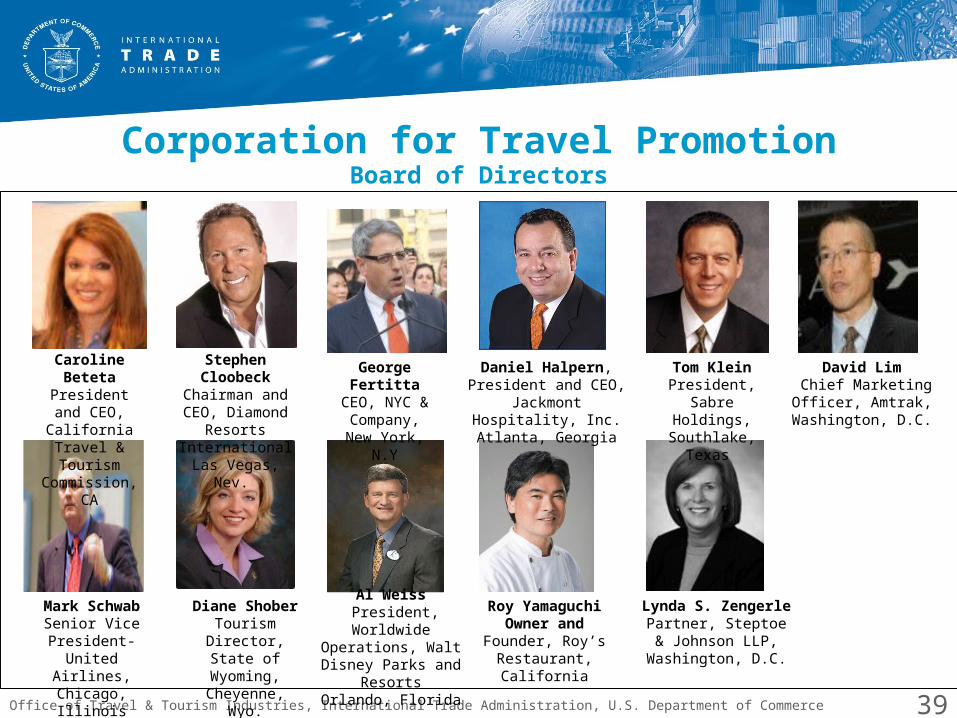
Al Weiss President, Worldwide
Operations, Walt Disney Parks and ResortsOrlando, Florida
Roy YamaguchiOwner and Founder,
Roy’s Restaurant, California
Lynda S. ZengerlePartner, Steptoe &
Johnson LLP, Washington, D.C.
Mark SchwabSenior Vice President-
United Airlines, Chicago, Illinois
Caroline BetetaPresident and CEO, California
Travel & Tourism Commission, CA
Stephen CloobeckChairman and CEO, Diamond Resorts
International Las Vegas, Nev.
Daniel Halpern, President and CEO, Jackmont
Hospitality, Inc.Atlanta, Georgia
David Lim Chief Marketing Officer, Amtrak,
Washington, D.C.
George FertittaCEO, NYC & Company,
New York, N.Y
Tom KleinPresident, Sabre
Holdings, Southlake, Texas
Diane ShoberTourism Director, State of Wyoming, Cheyenne, Wyo.
Corporation for Travel PromotionBoard of Directors

40Office of Travel & Tourism Industries, International Trade Administration, U.S. Department of Commerce
Summary of Key Findings
• Global Travel: Strong +7% rebound YTD led by Asia and South America.
• Canada Travel: Strong 13% rebound YTD (Aug) to USA following 5% decline in 2009. Non-U.S.2010 YTD also up, but only +3%. New record THIS YEAR is assured strongly likely highly possible!
• Canada Rankings: #1 visitors, #1 spending, #1 travel trade balance.
• Profile: travel attributes mostly stable. Watch DEcreases in travel party spending, but increases in casino, souvenir/shopping spending, average stay length.
• Forecast: Favorable outlook>>economy, currency exchange rate, TPA!!
• WHTI: Phase III June 2009 full implementation now a year behind us.
• Travel Promotion Act : Potential for significant level of marketing effort in a year or two and subsequent increase in visitor volume/spending. MVB is head cheerleader for promoting the USA to the Canada market.

41Office of Travel & Tourism Industries, International Trade Administration, U.S. Department of Commerce
Summary of Why Canada!
• Top dog: #1 in visitors and visitor spending and travel trade balance.
• Geo-equity: Best of any visitor origin country.
• Canada marketing (was) on rise: DiscoverAmerica.com, state-level efforts.
• Shoulder season: helps fulfill many destinations’ expansion goals.
• Open wallets: $$$ per-visitor per-night grew fast until 2009. Comparisons to other countries is not valid due to short-term stays bringing down average.
• Economics: looking much better, especially compared to Europe.
• International!!!!: Canada is a big part of the general story of international (growing) importance. 2009 perhaps an anomaly to long-term trend. Domestic industry may be mature from an industry life-stage perspective???

42Office of Travel & Tourism Industries, International Trade Administration, U.S. Department of Commerce
Thank You!
Questions?
MARK BROWNOffice of Travel and Tourism IndustriesInternational Trade AdministrationU.S. Department of CommercePhone: [email protected]://tinet.ita.doc.gov