Embed Size (px)
Citation preview
3vYi
W& *14
CANADIAN SUPREME COURT DECISION-MAKING, 1875-1990:
INSTITUTIONAL,GROUP,AND INDIVIDUAL
LEVEL PERSPECTIVES
DISSERTATION
Presented to the Graduate Council of the
University of North Texas in Partial
Fulfillment of the Requirements
For the Degree of
DOCTOR OF PHILOSOPHY
By
Panu Sittiwong, B.A., M.A.
Denton, Texas
May, 1994
Sittiwong, Panu, Canadian Supreme Court Decision-Making, 1875-1990:
Institutional, Group, and Individual Level Perspectives. Doctor of Philosophy
(Political Science), May, 1994, 203 pp., 23 tables, 42 illustrations, bibliography,
87 titles.
Since its creation in 1875, the Canadian Supreme Court has undergone
several institutional transitions. These transitions have changed the role of the
Court toward a more explicit and influencial policy making role in the country.
Despite this increasingly significant role, very limited attention has been given
to the Court. With this perspective in mind, this study presents several analyses
on the decision making process of the Canadian Supreme Court. At the
institutional level, the study found that within the stable workload, the cases
composition has shifted away from private law to public law cases. This shift is
more significant when one concentrates on appeals involving constitutional and
rights cases. The study found that this changing pattern of the Court's decision
making was a result of the institutional changes shaping the Supreme Court.
Statistically, the abolition of rights to appeal in civil cases in 1975 was found to
be the most important source of the workload change.
Another institutional behavior that was analyzed was conflict in decision-
making. It was found that the variation in the rate of dissensus in the Court's
decision making can be explained by the leadership of the chief justice. Finally,
the study found that the level of liberalism in the Court varied from one natural
court to another. These differences, among other things, may be the result of
shifts in individual justice's ideologies in each natural court.
This hypothesis was partly confirmed in the analyses based on the group
level. The results of the multidimensional scaling analysis suggest that more
often than not, the voting blocs were partially structured and explainable by
either liberal or conservative ideological dimensions.
In the final analysis chapter, the study expanded the previous research to
test the time bound nature of the personal attributes models in explainig justices'
liberalism in voting behavior. The results were mixed. While the models were
successful in explainig the variation in the liberalism scores for justices who
served in the Court during 1949-1990, the same models did not succeed or only
partially succeeded in explaining the variation for justices who served during
1875-1990.
TABLE OF CONTENTS
Page
LIST OF TABLES iv
LIST OF ILLUSTRATIONS . vi
Chapter
1 . THE CANADIAN SUPREME COURT AND ITS DECISION MAKING 1
The Canadian Supreme Court in Transition: A Short Historical Review The Significance of Historical Changes for the Canadian Supreme Court's Political Role Approaches to Decision Making in judicial Research Purpose and Outline of the Study
2 . INSTITUTIONAL LEVEL PERSPECTIVE 24
Review of the Literature and Research Design Data Collection an Missing Cases Size and Sources of Caseload Composition of Caseload Conflict in Decision Making Policy Direction in Decision Making
3 . GROUP LEVEL PERSPECTIVE 102
Research Design Voting Coalitions in the Canadian Supreme Court
4 . EXPLAINING INDIVIDUAL JUSTICE'S DECISION MAKING . 143
Structure of Canadian Personal Attributes Model Research Design Methods and Findings
111
5 . CONCLUSION 173
APPEXDIX 181
BIBLIOGRAPHY 196
IV
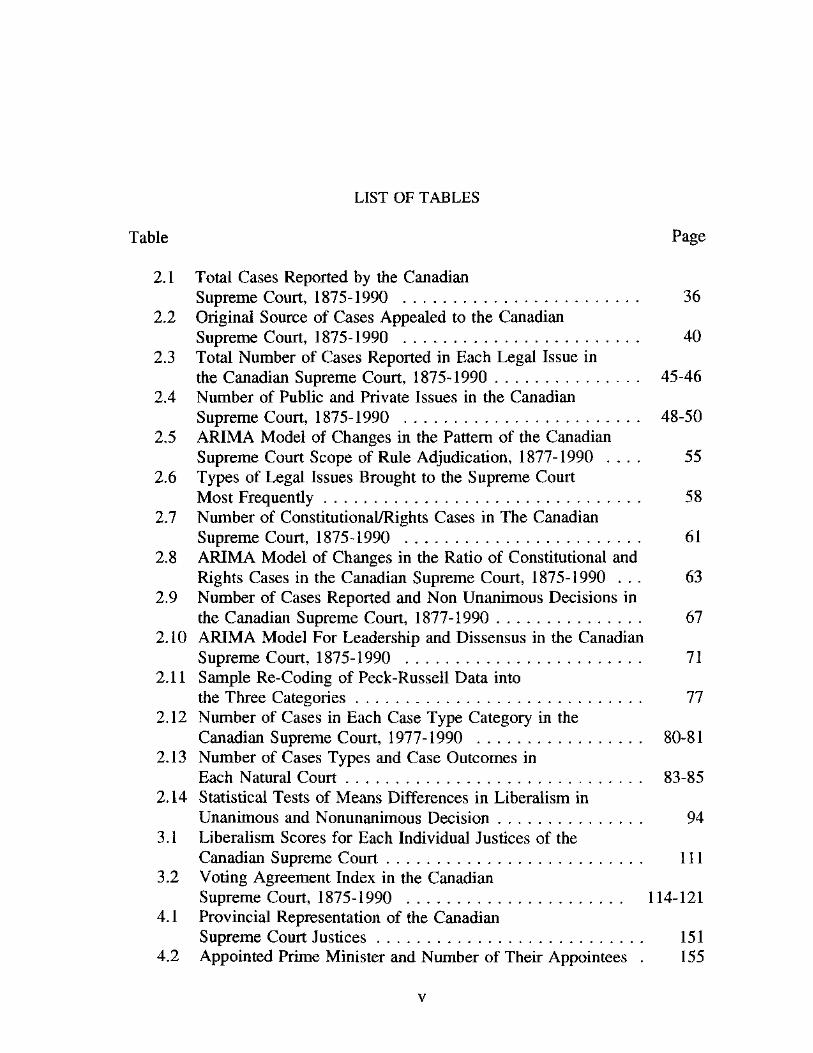
LIST OF TABLES
Table Page
2.1 Total Cases Reported by the Canadian Supreme Court, 1875-1990 36
2.2 Original Source of Cases Appealed to the Canadian Supreme Court, 1875-1990 40
2.3 Total Number of Cases Reported in Each Legal Issue in the Canadian Supreme Court, 1875-1990 45-46
2.4 Number of Public and Private Issues in the Canadian Supreme Court, 1875-1990 . 48-50
2.5 ARIMA Model of Changes in the Pattern of the Canadian Supreme Court Scope of Rule Adjudication, 1877-1990 . . . . 55
2.6 Types of Legal Issues Brought to the Supreme Court Most Frequently 58
2.7 Number of Constitutional/Rights Cases in The Canadian Supreme Court, 1875-1990 61
2.8 ARIMA Model of Changes in the Ratio of Constitutional and Rights Cases in the Canadian Supreme Court, 1875-1990 . . . 63
2.9 Number of Cases Reported and Non Unanimous Decisions in the Canadian Supreme Court, 1877-1990 67
2.10 ARIMA Model For Leadership and Dissensus in the Canadian Supreme Court, 1875-1990 71
2.11 Sample Re-Coding of Peck-Russell Data into the Three Categories 77
2.12 Number of Cases in Each Case Type Category in the Canadian Supreme Court, 1977-1990 80-81
2.13 Number of Cases Types and Case Outcomes in Each Natural Court 83-85
2.14 Statistical Tests of Means Differences in Liberalism in Unanimous and Nonunanimous Decision 94
3.1 Liberalism Scores for Each Individual Justices of the Canadian Supreme Court I l l
3.2 Voting Agreement Index in the Canadian Supreme Court, 1875-1990 114-121
4.1 Provincial Representation of the Canadian Supreme Court Justices 151
4.2 Appointed Prime Minister and Number of Their Appointees . 155

4.3 Operationalization of Personal Attribute Factors 158 4.4 OLS Estimation for Individual Claims and Economic Claims
Model for Justices Who Served During 1949 to 1990 160 4.5 OLS Estimation for Individual Claims and Economic Claims
Model for Justices Who Served During 1875 to 1949 162 4.6 OLS Estimation for Individual Claims and Economic Claims
Model for All Justices 163 4.7 Descriptive Statistics For Liberalism Scores 166
VI

LIST OF ILLUSTRATIONS
Figure Page
2.1 Number of The Canadian Supreme Court's Cases Reported, 1875-1990 37
2.2 Major Sources of Canadian Supreme Court Decision by Decade 41
2.3 Sources of Canadian Supreme Court Decision by Principle Region
2.4 Number of Public Law and Private Law Issues, 1875-1990 2.5 Percentages of Public Law Issues, 1875-1990 2.6 Number and Percentages of Constitutions and Rights Cases 2.7 Percentages of Constitutional and Rights Cases, 1875-1990 2.8 Level of Dissensus in the Canadian Supreme Court, 1875-1990 68 2.9 Level of Dissensus in the Canadian Supreme Court, 1875-1990 69 2.10 Percentages of Cases Types Mix in Canadian Supreme
Court, 1875-1990 86 2.11 Percentages of Liberalism in Each Natural Court, 1875-1990 . . 89 2.12 Percentages of Liberalism in Individual Claims Cases in
Each Natural Court, 1875-1990 89 2.13 Percentages of Liberalism in Economic Cases in Each
Natural Court, 1875-1990 90 2.14 Percentages of Liberalism in Fiscal Claims Cases in Each
Natural Court, 1875-1990 90
43 51 52 60 62
3.1 Multidimensional Scales Solution for Natural Court 1 123 3.2 Multidimensional Scales Solution for Natural Court 2 123 3.3 Multidimensional Scales Solution for Natural Court 3 124 3.4 Multidimensional Scales Solution for Natural Court 4 124 3.5 Multidimensional Scales Solution for Natural Court 5 126 3.6 Multidimensional Scales Solution for Natural Court 6 126 3.7 Multidimensional Scales Solution for Natural Court 7 127 3.8 Multidimensional Scales Solution for Natural Court 8 127 3.9 Multidimensional Scales Solution for Natural Court 9 128 3.10 Multidimensional Scales Solution for Natural Court 10 128 3.11 Multidimensional Scales Solution for Natural Court 11 129 3.12 Multidimensional Scales Solution for Natural Court 12 129 3.13 Multidimensional Scales Solution for Natural Court 13 130 3.14 Multidimensional Scales Solution for Natural Court 14 130
Vll

3.15 Multidimensional Scales Solution for Natural Court 15 132 3.16 Multidimensional Scales Solution for Natural Court 16 132 3.17 Multidimensional Scales Solution for Natural Court 17 133 3.18 Multidimensional Scales Solution for Natural Court 18 133 3.19 Multidimensional Scales Solution for Natural Court 19 134 3.20 Multidimensional Scales Solution for Natural Court 20 134 3.21 Multidimensional Scales Solution for Natural Court 21 . . . . . . 135 3.22 Multidimensional Scales Solution for Natural Court 22 135 3.23 Multidimensional Scales Solution for Natural Court 23 137 3.24 Multidimensional Scales Solution for Natural Court 24 137 3.25 Multidimensional Scales Solution for Natural Court 25 138 3.26 Multidimensional Scales Solution for Natural Court 26 138 3.27 Multidimensional Scales Solution for Natural Court 27 139 4.1 Box Plots of Justices Liberalism Scores 167
vm
CHAPTER 1
THE CANADIAN SUPREME COURT AND ITS DECISION MAKING
Since 1949, when the right to appeal to the British Privy Council was
abolished, the Canadian Supreme Court has undergone institutional transitions.
These transitions have changed the role of the Court from an essentially
"adjudicatory role" toward a more explicit and influencial policy making role in
the Canadian regime (Morton 1986, 3). The new constitution (The Charter of
Rights) of 1982 helped to strengthen this new found role of the Court.
Despite this increasingly significant role of the Supreme Court, very
limited attention has been given to it, even among scholars of Canadian origin,
when compared to the U.S. Supreme Court.1 The lack of attention reflected the
Court's strict interpretation of its duty as a mere interpretator and discoverer of
the law, as well as the limited constitutional role the Court was expected to play
(Sittiwong 1985, 8-9). Those who did study the Court, on the other hand,
argued that the Canadian Supreme Court had a considerable functional
significance in Canadian politics. In deciding a dispute, justices of the Supreme
Court, from time to time, were required to exercise considerable discretion,
regardless of how they chose to define their poitical function (see Cheffin, 1966
and Fouts, 1969 in particular). Through a review of some "highlight" decisions,
1

2
Sittiwong provides evidence of this functional significance and the exercise of
discretion (1985, 11-12) .
Given the increasing importance of the Canadian Supreme Court, it is
appropriate that this dissertation analyze its decision making. At a minimum, it
hopes to make a contribution to the rejuvenation of the Canadian judicial
behavior study tradition, which virtually disappeared during the 1970's.
Second, it hopes to provide an analysis which will contribute to the
understanding of the transformation of the Canadian judiciary that is now
occurring.
Canadian Supreme Court in Transition: A Short Historical Review
The Canadian Supreme Court is a relatively young institution. It was
established in 1875, under the grant of power given to the Canadian Parliament
by the British North American Act of 1867. During its early period the
Supreme Court was not the final court of appeal for Canada. That body was the
Judicial Committee of the Privy Council in England. The final appeal to the
Privy council was abolished in 1949 by the amenment to section 1024(4) of the
Criminal Code, and the Supreme Court became the final court of appeal.
The establishment of the Supreme Court was not without difficulty. It
occurred eight years after the introduction of the British North America Act,
and six years after the first Supreme Court Act was introduced to the House of

3
Commons. The story of its establishment gives us some insight into the factors
that have shaped Canadian Supreme Court politics from that day to this.
The first bill was introduced on May 21, 1869 by Sir John Macdonald.
According to his proposal
the Supreme Court was to be composed of one Chief Justice and six Judges who were to hold office on 'good behavior and be removable only upon the address of the Senate and House of Commons. . . . [Its intention was to establish] the Dominion's highest Court, but was not to be considered as doing away with the right of appeal to the Judicial Committee of the Privy Council in England. (MacKinnon 1946, 259).
The Parliament did not take any action concerning the bill, instead copies
of it were sent to the judges throughout the country for their opinions
(Mackinnon 1946, 259).
On March 18, 1870 the new bill was introduced. This bill, however, was
withdrawn on May 11. The main reasons for this abandonment were the
question of representation on the court of each province, and the jurisdiction of
the new court. This bill did not contain a provision for the representation of
each province. It was understood that the Chief Justice and six judges were to
be chosen as far as possible in a representative manner from the benches and
bars of the various provinces, with two judges from Quebec (MacKinnon 1946,
259-260).
Concerning its jurisdiction, the bill gave vast power to the Supreme Court,
including power over provincial law matters. This touched off the strongest
4
reaction against the new court. The critics' basic contention was that decisions
dealing with Quebec's Civil Code rendered by provincial judges who had been
trained and had practiced in that legal system ought not to be reviewed by a
court of appeal which has only a minority who know such law. They pointed
out that "[it] would be that those same laws would be explained by men who
would not understand them, and who would, involuntarily perhaps, graft English
jurisprudence upon a French Code of Laws" (Russell 1970, 7). Their classical
example was that
The Quebec suitor who won his case before the Superior Court, the Court of Review and the Court of Queen's Bench in Quebec only to lose, three to two, before the Supreme Court of Canada might, in such a situation, lose his case when 11 judges had been in his favour and only three against him (MacKinnon 1946, 262).
After his withdrawal of the 1870 bill, Macdonald planned to introduce a
third bill in 1873, but was prevented by his political defeat in that year. It took
five years for the third bill to be introduced. In 1875 the Honourable
Telesphore Fournier, Minister of Justice in the Lawrence Mackenzie
Government, introduced a bill for the establishment of a Supreme Court, and a
Court of Exchequer for the Dominion of Canada. This bill was passed on April
8, 1875 by a vote of 112 to 40. This marked the beginning of the Canadian
Supreme Court.
According to this bill, the Court's principal function was to serve as a
final appellate tribunal with broad powers of review over the provincial courts
5
decisions. The Court was composed of six judges, including a Chief Justice.
Among them two judges would be appointed from the benches and bar of
Quebec.
Despite the earlier objection concerning the composition of the Supreme
Court, the Supreme Court Acts did not resolve the Quebec case being heard by
a minority of the Quebec judges. Hence the Court was put in the position
where its authority was not acceptable by all groups in the country.
Even though the 1875 Supreme Court Act established the Courts as a final
court of appeal, it did not abolish the right to appeal to the Privy Council. The
interpretation of section 47 of the Act is that
no appeals would lie from the Canadian Supream Court, to any Court of appellate jurisdiction in the United Kingdom. . . . [However,] Privy Council. . . was not a court but an advisory board to the monarch and therefore did not fall within section 47 of the act. . . . [Thus, it retained a right to hear appeals] (Editor. Osgoode Hall Law Journal 1964, 171).
Concerning the Court's status when it was first established, MacKinnon pointed
out that
From the beginning the "supremacy" of the Supreme Court was overshadowed by the right of appeal to the Privy Council. . . . Although the right of appeal directly from the Court to the Privy Council was to be limited, it remained in the case of judgements of the courts of last resort in the provinces. . .[There were two] options of preceeding either to the Supreme Court or directly to the Privy Council. The Supreme Court was therefore "supreme" only in cases which were taken to it, and even then its "supremacy" was subject to the royal prerogative. . . . Hence the authority of the Supreme Court would be final only in relatively unimportant cases (1946, 262).
6
On October 8, 1875 the first Chief Justice, Sir William Buell Richards, was
sworn in and the other five judges, Sir William Johnstone Ritchie, Sir Samuel
Henry Strong, the Honourable Telephore Fournier, the Honourable Jean Thomas
Tashereau, and the Honourable William Alexander Henry, were sworn in on
November 8, 1875. The Supreme Court convened for its first session on
January 17, 1876. However, they did not hear an appeal until June 5, 1876 in
Taylor vs. The Queen (Laskin 1975, 462-3).
In its first decade of existence, the Supreme Court was attacked by several
groups. The lines of criticism revolved around the questions unresolved prior to
its establishment. The first group of critics argued that the establishment of the
Supreme Court under the subordination to the Privy Council did not serve the
purpose of section 101 of the B.N.A. Acts, that is, to establish additional courts
for the better administration of the laws of Canada. They felt that the Supreme
Court was simply an additional step through which the parties to the disputes
would have to go before appeal to the Privy Council (Russell 1970, 16).
The second line of criticism - that the Supreme Court weakened and
devalued the top Provincial Courts - was launched primarily by the Ontarians
and Quebeckers. The Maritimes and Western provinces did not join in the
attack because neither of them had established specialized courts of appeal.
Thus they were "inclined to welcome the court as a better accessible and less
expensive alternative to the Privy Council" (Russell 1970, 18). The Ontarians
7
and Quebeckers, on the other hand, had recently established their appellate
courts, and saw the Supreme Court as inappropriately degrading them. These
two groups, however, based their critiques on different factors. The Quebeckers
emphasized the distinction between common law and civil law. The complained
that their civil law ought not to be interpreted by a court whose members were
predominantly trained in and had practiced common law.
The Ontario critics, on the other hand, were concerned mainly that, on the
whole, the Supreme Court members would be far less qualified when compared
to the judges of the Ontario Court of Appeals2 (Russell 1970, 18). They lacked
confidence in the Supreme Court justices who were appointed from provinces
other than Ontario.
A serious attack on the Supreme Court came in 1879 when Mr. Joseph
Keeler, the member of Parliament from Northumberland East, Ontario,
introduced a bill to the Parliament of Canada to abolish the Court. Fortunately,
most of the members of the Parliament did not seriously consider the matter.
They "treated the introduction of this bill as a practical joke and the first reading
ended in a debate on procedure" (Mackinnon 1946, 269). However, this did not
prevent Mr. Keeler's second effort. On Febuary 19, 1880 a second bill with the
same purpose was introduced. MacKinnon described the Parliament action:
This time a lively debate took place on the merits and weaknesses of the Court. The critics decried the expense to the taxpayers of maintaining the court; some declared that the cost to the litigants in
appearing before it barred the poor from justice. . . . The possibility of the invasion of provincial rights was continually brought up. Political influence was also charged, for some branded the Court as a refuge for the political supporters of the late administration (1946,
269-70).
With support from both Government and opposition, the Supreme Court
survived the serious attack. "The government took note of the criticism and
announced its intention of meeting the objections which were raised. The bill
then received six months hoist by the vote of 148 to 29" (Mackinnon 1946,
271). This marked the end of the efforts to abolish the Supreme Court.
Toward the turn of the century, the Canadian public, both French-speakers
and English-speakers, started to realize and understand the necessity for the two
legal cultures to co-exist side by side. This helped the Supreme Court gain
more confidence from the Canadian public. However, one major problem was
still left unsolved, the Court's subordination to the Privy Council.
The effort to abolish the right to appeal to the Privy Council was not
something new in Canadian legal development. It had been current among
Canadian leaders since the Supreme Court had been first established. However,
this effort did not succeed until seventy four years later, in 1949. Canadian
scholars, both historians and political scientists, agreed that the major event
which paved the way for the abolition of the right to appeal to Privy Council
was the Statute of Westminster (1931). By virtue of this Statute
certain fetters that affected the legislative competence of Canada [were removed]. With these fetters removed, the provisions of the B.N.A. Act of 1867 had full effect to invest in the Parliament of Canada a complete legislative authority throughout the Dominion (Editor. Osgoode Hall Law Journal 1964, 171-72).
In 1933 Parliament passed an amendment to section 1024(4) of the
Criminal Code. According to this amendment, "no appeal shall be brought in
any criminal case from a judgement or order of any court in Canada to his
Majesty in Council." (Editor. Osgoode Hall Law Journal 1964, 171-72). The
Privy Council confirmed these two laws in the case of British Coal Corporation
vs. The King (1935). They held that "since the passing of the Statute of
Westminster, the limitations of the Colonial Laws Validity Act were abrogated
and the Dominion was competent to limit appeals on criminal matters to the
Supreme Court of Canada" (Editor. Osgoode Hall Law Journal 1964, 172).
Fourteen years later, the Supreme Court Act was amended to make the
Supreme Court the final appellate court for all Canada. On October 9, 1950, the
Court held a special session "to inaugurate the new status of the Supreme Court
of Canada" (Laskin 1975, 463). Together with the Court's new status, the size
of the Supreme Court was increased to nine judges, with three judges to come
from Quebec.
The next important change in the Supreme Court occured in 1975, when
there was a change in the Court's jurisdiction. Parliament passed a bill to
abolish the right to appeal in civil cases involving $10,000 or more. This
10
action was an effort to establish a dual legal system in Canada (Russell 1980,
9) . As a consequence, Russell argued that
it will likely shift the Supreme Court's role to one which is principally concerned with the interpretation of federal statutes and the adjudication of citizen claims against federal administrative organs (Russell 1982, 10).
The final significant structural change, certainly a major one, occurred in
1982. The Constitutional amendments of 1982 finally established the Supreme
Court as an institution of the Constitution rather than of the parliament.
According to Section 41(d) of Constitution Act of 1982, the Supreme Court
statutory composition of nine judges, with three from Quebec, may not be
changed without the unanimous consent of the Federal goverment and all the
provinces. In addition. Section 42 protects the Supreme Court from any other
changes by statutory acts. This provision dictates that any other change to the
Supreme Court must be accomplished through the process of constitutional
amendment.
The Significance of Historical Changes for the Canadian
Supreme Court 's Political Role
All the changes outlined above have significantly altered the role of the
Canadian Supreme Court in the politics of the country. At its creation, the
Canadian Supreme Court was supreme only in its name. The ability of the
parties of the dispute to appeal to the Privy Council in England undermined its
11
role in public policy making in the country. In addition, via the per saltern
appeal, provincial governments could appeal from the decisions of the provincial
appeal courts directly to the Privy Council, and avoid the Supreme Court
altogether (Morton 86, 2).
The long subordination to the Judicial Committee of the Privy Council led
to two major consequences. First, the justices conceived of themselves as legal
positivists, a discoverers of law as a fixed body of principles, whose role is only
to discover and interpret the law.3 A most dramatic example of this view is
found in a 1936 opinion by Justice Cannon opposing Dominion social
legislation (Reference re The weekly Rest in Industrial Under-Takings Act, The
Minimum Wages Act, and The Limitation of Hours of Work Act (1936)).
When an act of parliament is challenged before this court as unconstitutional, our duty is to lay the article of the constitution which is invoked beside the statute which is challenged and decide whether the latter squares with the former. Our only power is to announce our considered judgement upon the question. This court neither approves nor condemns any legislative policy. Our delicate and dificult office is to ascertain and declare whether the legislation is in accordance with or contravention of the provisions of the constitution. Having done so, our duty ends (Supreme Court Reports 1936, 513).4
The second consequence was their alleged rigorous adherence to the
doctrine of "stare decisis." The late Chief Justice Bora Laskin, as a law
professor, pointed out that:
At a minimum, "Stare Decisis" meant that the Supreme Court. . . considered itself bound by the decisions of the highest court of appeal, the Privy Council . . . [who] considered itself bound by the decision
12
of the house of Lords, the United Kingdom's ultimate appeal court. This fact compelled the Canadian Courts, either by force of logic or tradition, to consider themselves bound to follow the decisions of the House of Lords and of English courts of higher or co-ordinate jurisdiction (Laskin 1951, 1074-75).
All the changes outlined above helped the Supreme Court to gradually
transform its role to a more politically active one. The abolition of the rights to
appeal to the Privy Council especially helped to increase the Supreme Court's
prestige by making it the "final and exclusive" court of appeal for Canada.
The abolition of appeals by right in civil cases with a value over $10,000
contributed to the autonomy and freedom of the Court to select and control its
own docket. It allowed the Court to pick and choose cases which raise
significantly important questions of law and policy. This idea was reflected in
then Chief Justice Laskin's comment that this change confirmed "the Court's
status as Canada's ultimate appellate court" (1975, 474), by altering the
function of the Supreme Court from that of "traditional appellate review" to that
of "supervisory control." Supervisory control means "to oversee the
development of the law in the courts of Canada, to give guidance. . . to the
provincial couts. . . on issues of national concern" (Laskin 1975, 474).
This change has dramatically changed the composition of the Supreme
Court's caseload. For example, I shall show that while prior to 1975 a
majority of cases in the Supreme Court came to the Courts as of right, this
13
pattern was reversed in the post-1975 period.5 A full discussion of the Supreme
Court's case load will be presented in a later chapter.
The political roles of the Supreme Court were broadened further with the
1982 amendment that added the Charter of Rights and Freedom to the
Constitution and broadened the scope of the Supreme Court's exercise of
judicial review. The new constitution now provides the Supreme Court and all
lower courts the ability to censor not only the rules and regulations passed by
both the provincial and federal legislative and executive branches, but also the
conduct of all their employees (Morton 1986, 14).
The combined effect of the abolition of the right to appeal in the civil
cases and the Charter of Rights has drastically changed the role of the Supreme
Court in Canadian politics. I shall subsequently show that the number of private
matter cases brought to the Supreme Court decreased while public matter cases
increased, after these changes; quantitatively the political role of the Canadian
Supreme Court is expanding. This is especially true as more constituitonal law-
related cases are brought to the Supreme Court, a trend that already had started
by the 1980's.
Approaches to Decision Making in Judicial Research
The study of judicial decision-making can be conducted from at least two
different approaches, the traditional and the empirical or behavioral. A study is
14
classified as traditional if it is descriptive in nature and does not use or uses
very little quantification in its methodology. The focal point of such a study
typically is to examine a supreme court by concentrating on doctrinal analysis of
one decision or a set of decisions. The study is classified as empirical if it is
interested in collecting facts and refining methodologies in an attempt to
encourage or derive scientific generalizations about how and why judges make
the decisions they do.
Empirically, decision-making in judicial politics can be studied from two
major approaches. In his attempt to introduce a theoretical framework for
decision making in judicial politics, Gibson suggests an integration of various
levels of analysis (institution, group) with the individual level (1983, p. 8). The
combination will provide us with at least three perspectives on supreme court
decision making: the court as an institution, as a group, and as individual
decision makers (Tate and Handberg 1986, 5).
The first approach, the macro or institutional level approach, uses the court
as a unit of analysis. This approach looks at the Supreme Court as a political
institution which renders discrete policy decisions similar to those of the
legislative or executive branch. The focal point of study in this approach is to
analyze various aspects of the decision making of courts in different countries or
across different periods of time in a given country.
15
Analyzing a court's decision outcomes allows us to decribe the types of
public policy issues, the typical directions of those policies outcomes, and
continuity and change in those patterns of decision making.
While the institutional perspective provides us an overall picture of
Supreme court decision making outcomes, it fails to account for the roles of the
individual justices who makeup the court. The institutional outcomes of the
court's decision making are in fact the aggregate behaviors of those justices.
Hence, analyses based on the group and individual level will provide a further
and better understanding of the decision making of the Supreme Court.
The main theme in group level analysis is to identify judicial voting
coalitions and the attitude dimensions underlying such coalitions. Supreme
Court justices are viewed as the decision makers who interact among themselves
in order to reach the final decision. The decision outcomes of the Supreme
Court, especially in non-unanimous cases, may represent two or more interacting
groups of justices who reached different consensuses on what the law means
when it is ambiquous or when clear precedents are lacking. Hence, an analysis
of the justices' voting coalitions and the attitudes underlying such groups may
help us explain the changing public policy outcomes of the Supreme Court.
Analyzing group behavior may help us understand group interaction. It
does not, however, provide an understanding of why a particular judge
developed the attitudes he has, and what accounts for such development.

16
Analysis based on justice's individual backgrounds may help to explain their
attitudes and voting behaviors. Individual level analysis is, then, interested in
explaining a justice's role and voting behavior using some individual level
factors such as personal attributes. While no attempt was made to link several
levels and units of nalysis in the previous research, this study will try to analyze
the institutional level together with the group and individual level.
The micro level approach uses the individual judge as the unit of analysis.
Its aims are to explain the behaviors and the factors which influence the
behaviors of particular judges. In the past this approach has been dominated by
two major complementary models, the psychometric and the personal attibute or
social backgrounds model.
According to Glendon Schubert, the psychometric model will show the
differences in and the consistency of the attitudes of a group of persons toward
a single shared value. This model is based on the assumption that "whatever
their degrees of complexity, it is possible to represent symbolically the
ideological positions of justices comprising the Supreme Court at any particular
time as a configuration of ideal points in a psychological space of specifiable
dimensionality" (1974, 17-18). This model then argues that judges who share a
common ideology toward a particular issue will decide and vote in the same
way; differences in ideology and attitude will make them vote differently.
Consequently, "by investigating the relationships between and among
17
issue-vectors and ideal-points in the space of the model, we can learn about
ideological relationships within, between, and among the minds of the justices
who, in the empirical sense, comprise our set of respondents" (p. 19).
The second model, the personal attribute or social background model, is an
extension of the first one. This model agrees that the differences in justices'
ideologies and attitudes will have impacts on the outcome of the cases. These
differences are assumed to result from their life experiences or social and
personal backgrounds of these judges, among other things.
Purpose and Outline of the Study
Previous research (Sittiwong, 1985) attempted to demonstrate the
significance of the Supreme Court in Canadian politics. It showed that the
Court, through its decision processes, has engaged routinely in the authoritative
allocations of values in the society. In addition, the attribute or social
backgrounds model was applied to explain conservative and liberal voting in the
Court. This study will be an expansion of the previous study.
The three levels perspective will be used as the main analytical framework
for the study. At the institutional level, the main analyses purpose will involve
cross-time comparison of various aspects of Supreme Court decision making. A
full discussion is presented later in Chapter 2. Its intention is to show and
18
explain continuity and change in the Canadian Supreme Court's role as a
political institution which renders and shapes public policies in Canada.
At the group level, the study will try to identify voting coalitions in each
"natural court" (a court of constant membership) and how they vary over time.
Understanding these voting structures in the Supreme Court may help us
understand continuity and changes in direction of the Supreme Court public
policy outcomes.
The individual level analysis to be presented is not new in nature, but is
new in substance. My previous research (Sittiwong, 1985; see also Tate and
Sittiwong, 1989) applied the personal attributes model to the Canadian Supreme
Court justices in order to explain their propensity to be liberal in their voting
behavior. This dissertation will improve upon and update the former study in
several areas by:
1. including more justices in the model;
2. including more personal attribute factors in the model;
3. conducting separate analyses of the model for different substantive
cases types.
4. conducting separate analyses of the model for different time frames.
The study will analyze six personal attributes models. By comparing those
models, this study hopes to identify the personal attribute factors which can

19
explain a justice's voting behavior significantly and consistently both across
substantive case types and across time.
The study is divided into five chapters. Following this introductory
chapter, each chapter will focus on the analysis of the Canadian Supreme
Court's decision making. Each will focus on a different unit of analysis.
Chapter two will analyse decision making at the institutional level. Chapter
three will use the group as the unit of analysis, and Chapter four will focus on
the individual level. Chapter five provides conclusion and suggestions for future
research.

20
Endnotes
1. For some of the politically-oriented studies of the court see Russell (1970, 1975), Weiler (1974), Cheffins (1966), Fouts (1969) Peck (1967, 1969), McWhinney (1974), Morton (1985, 1986), and Tate and Sittiwong (1989) Morton, Russell, and Withey (1991).
2. This was evidenced as some of the Ontario leading judges and lawyers in that period opted to remain at the less prestigues provincial courts or in private practice rather than accept appointment to the Supreme Court (Morton 1986, 2).
3. For examples of argument in this line see E. McWhinney (1974), H. McD. Clokie (1942), and J. A. Corry (1967).
4. The argument by Justice Cannon was similar to that made by Justice Owen Roberts in United States v. Butler. He wrote that:
It is sometimes said that the court assumes a power to overrule or control the action of the people's representatives. This is a misconception. The Constitution is the supreme law of the land ordained and established by the people. All legislation must conform to the principles it lays down. When an act of Congress is appropriately challenged in the courts as not conforming to the constitutional mandate, the judicial branch of the government has only one duty - to lay the article of the Constitution which is invoked beside the statute which is challenged and to decide whether the latter squares with the former (297 U. S. 1 (1936), at 62).
5. The Canadian Bar Association's Committee on the Constitution reports that in 1975 the Supereme Court heard 31 cases which were predominantly civil law. The number was reduced to 16 in 1976, and only 6 in 1977 (The Committee on the Constitution of the Canadian Bar Association 1978, 58 as cited in Russell. 1984, 233).
CHAPTER REFERENCES
Cheffins, Ronald I. 1966. "The Supreme Court of Canada: The Quiet Court in an Unquiet Country." Osgoode Hall Law Journal 4: 259-275.
Clokie, H. McD. 1942. "Judicial Review, Federalism, and the Canadian Constitution." Canadian Journal of Economics and Political Science 8: 537-56.
Corry, J. A. 1967. "Precedent and Policy In the Supreme Court." Canadian Bar Review 45: 627-666.
Editors. Osgoode Hall Law Journal. 1964. "Historical Sketch of the Supreme Court of Canada." Osgoode Hall Law Journal 3: 171-74.
Fouts, Donald R. 1969. "Policy-Making in the Supreme Court of Canada." In Comparative Judicial Behavior: Cross-Cultural Studies in Political Decision-Making in the East and West, eds. Glendon A. Schubert and David J. Danelski. New York: Oxford University Press.
Gibson, James L. 1983. "From Simplicity to Complexity: The Development of Theory in the Study of Judicial Behavior." Political Behavior 5: 7-49
Laskin, Bora. 1951. "The Supreme Court of Canada, A Final Court of Appeal of and for Canadians." Canadian Bar Review 64: 1038-79.
Laskin, Bora. 1975. "The Supreme Court of Canada, The First One Hundred Years: A Capsule Institutional History." The Canadian Bar Review 53: 459-68.
MacKinnon, Frank. 1946. "The Establishment of the Supreme Court of Canada." The Canadian Historical Review 27: 258-74.
McWhinney, Edward. 1974. "The Political Impact of the Canadian Supreme Court." Notre Dame Lawyer 49: 1000-11.
21
22
Morton, F. L. 1986. "The Politicization of the Supreme Court of Canada." Paper presented to the Interim Meeting of the Research Committee on Comparative Judicial Studies of the International Political Science Association, Center for the Study of Law and Society, University of California, Berkeley, December 14-15, 1986.
Morton, F. L. 1987. "The Political Impact of the Canadian Charter of Rights and Freedoms." Canadian Journal of Political Science 20: 31-54.
Morton, F. L., Peter H. Russell and Michael J. Withey. 1991. "The Supreme Court's First 100 Charter of Rights Decisions: A Statistical Analysis." Occasional Papers Series, Research Study 6.1, Research Unit for Socio-Legal Studies, University of Calgary.
Peck, Sydney L. 1967. "The Supreme Court of Canada (1958-1966): A Search for Policy through Scalogram Analysis." Canadian Bar Review. 45: 666-726.
Peck, Sidney L. 1969. "A Scalogram Analysis of the Supreme Court of Canada, 1958-1967." In Comparative Judicial Behavior: Cross-Cultural Studies in Political Decision-Making in the East and West, eds. Glendon A. Schubert and David J. Danelski. New York: Oxford University Press.
Russell, Peter H. 1970. The Supreme Court of Canada as a Bilingual and Bicultural Institution. Ottawa: Information Canada.
Russell, Peter H. 1975. "The Political Role of the Supreme Court of Canada in Its First Century." Canadian Bar Review 53: 576-596.
Russell, Peter H. 1980. "Introduction, History and Development of the Court in National Society: The Canadian Supreme Court." Canada-United States Law Journal (Conference on "Comparison of the Role of the Supreme Court in Canada and the United States", Case Western Reserve University, Cleveland, Ohio, October 20, 1979) 3: 4-14.
Russell, Peter H. 1984. "Constitutional Reform of the Judicial Bench: Symbolic vs Operational Considernations." Canadian Journal of Political Science 17: 227-52.
Schubert, Glendon A. 1974. Judicial Mind Revisited: Psychometric Analysis of Supreme Court Ideology. New York: Oxford University Press.
23
Schubert, Glendon A. and David J. Danelski, eds. 1969. Comparative Judicial Behavior: Cross-Cultural Studies in Political Decision-Making in the East and West. New York: Oxford University Press.
Sittiwong, Panu. 1985. "Canadian Supreme Court Decision-Making: The Personal Attribute Model in Explaining Justices' Patterns of Decision-Making, 1949-1980." Master Thesis, North Texas State University.
Tate, C. Neal and Roger Handberg. 1986. "The Decision Making of the United State Supreme Court 1916-85: A Three Level Perspective." Paper presented to the Annual Meeting of the American Political Science Association, Washington D.C. August 27-31.
Tate, C. Neal and Panu Sittiwong. 1989. "Decision Making in the Canadian Supreme Court: Extending the Personal Attributes Model Across Nations." Journal of Politics 51: 900-16.
Weiler, Paul. 1974. In the Last Resort: A Critical Study of the Supreme Court of Canada. Toronto: Carswell.
CHAPTER 2
INSTITUTIONAL LEVEL PERSPECTIVE
Review of the Literature and Research Design
Empirically, decision-making in judicial politics can be studied using three
major approaches. The first approach, the macro or institutional level approach,
uses the court as a unit of analysis. This approach looks at a court as a political
institution that renders discrete policy decisions similar to those of the
legislature or executive. The focal point of study in this approach is the
analysis of various aspects of the decision-making of courts in different
countries or across different periods of time.
Several studies can provide examples of institutional level empirical
analyses of various aspects of the judicial system. Mcintosh (1981) studied the
relationship between socioeconomic development and the rate of litigation,
degree of change in legal agenda, and case disposition pattern. His main
purpose was to answer the question "whether the dispute resolution of courts has
diminished with social and economic development and rising litigation costs" (p.
823). Using data from 1820 to 1970 for the cases filed in the circuit courts of
St. Louis, Missouri, he found that neither socioeconomic development nor
increasing costs of litigation lessened the dispute resolution of the St. Louis
24
25
circuit courts. His analysis showed that there is a nonlinear relationship
between the rate of private law case filings and socioeconomic development (p.
828). The filing rate showed a decline in the period from the 1840s to the
1890s and then showed an increase followed by stability (p. 828). While the
rates of litigation remained stable, the study, however, found different patterns
of types of litigation. From 1820 to 1920, economic issues combined to
dominate the court agenda. Family law and tort cases have dominated in the
post-1920 period (p. 829). Concerning the methods of case disposition,
Mcintosh found a pattern in which contested judgments declined and voluntary
dismissals and uncontested judgments increased (p. 847).
While the Mcintosh study focuses on one court, others have attempted to
compare courts in different settings. For example, Steven Daniels (1990)
compared patterns of caseloads in circuit and county courts in four counties in
Illinois and in, another study, compared civil litigation differences between
urban and rural trial courts in Illinois (Daniels 1982). In a similar way,
Stookey (1986) looked at the relationship between socioeconomic cycles and the
pattern of civil litigation in four economically different counties in Arizona, and
Friedman and Percival (1976) studied the various aspects of the dispute
settlement function of two Superior Courts in two counties in California from
1890 to 1970. They found that despite their differences in the level of
industrialization and urbanization, the two Courts performed these functions in
26
the similar way and showed the same pattern of changes in these functions,
away from dispute resolution toward more routine administration (p. 301).
Although the above studies used data from the lower courts, Casper and
Posner (1976), as a response to the recommendation of the study by the Freund
Commission on the caseload problem of the U.S. Supreme Court, presented both
a theoretical structure of caseload development and the potential nature of the
workload generated by the growth in cases filed before the Supreme Court.
They found that the rate of increase of the U.S. Supreme Court varied in
different types of dockets, and that the factors that affect the increase in
caseload were due mainly to the change in law rather than to socioeconomic
growth (pp. 55-56). They also found that the increase in caseload resulted in
the increased demand of justices' time to screen cases for review. The increase
in time pressure, however, did not reduce the ability of the Court to "discharge
its responsibilities or its ability to review a case where Supreme Court review
would serve an important function" (p. 92).
Other studies focus on the nature of U.S. Supreme Court caseload. For
example, McLauchlan (1980) used an exploratory data analysis technique to
describe the patterns of caseload over time. In another study, McLauchlan
(1981) used regression analysis to model the macro-level variables which seem
to influence the Court's caseload over time. Yet, another study by Tate and
27
Handburg (1986) provide examples of studies of the public policy case mix of
the U.S. Supreme Court over a long period of time.
Others looked at caseloads in other countries. For example, Van Loon
and Langerwarf (1990) examined the civil courts in Belgium. Using a so-called
"Functional Theory," they tried to relate socioeconomic development to
litigation trends in Belgium for 1835-1980 (p. 282). They found that some of
the hypotheses derived from the functional theory are supported by the data, and
some are contradicted (p. 294). Van Loon and Langerwarf concluded that,
socioeconomic development is not the only one factor in explaining this
litigation trend. To better understand this trend, they recommended three classes
of factors: the rules of law and judicial process, the organization and operation
of the courts, and factors outside the court, including socioeconomic change
(p.295).
While the above studies focus mostly on the courts' caseloads in general,
other studies focus on particular issues. For example Ulmer's study focuses on
government litigations and civil liberties in the U. S. Supreme Court (Ulmer
1985). Ulmer hypothesized that governmental litigants are more likely than
nongovernmental litigants to be favored in cases decided by the U.S. Supreme
Court (p. 901). By analyzing all cases which raised a civil liberties issue from
1903-1966, he found that there is a significant trend toward less support for
government litigants (p. 905). In addition, he found that the Supreme Court
28
steadily diminished state power over civil liberties cases more than that of
federal government agencies (p. 907).
Another study analyses the "demise of consensual norms in the U.S.
Supreme Court" (Walker, Epstein, and Dixon 1988). They pointed out that the
early 1940s marked a period in which the U.S. Supreme Court experienced
drastic and permanent changes in their decision-making unanimity (p. 361). The
increase in these decision conflicts was attributed to several factors, including:
change in the Court's caseload; change in the Court's composition and its
justices' characteristic; and leadership style of the chief justice (p.364). They
concluded that, in combination with other factors, the leadership of Harlen Fisk
Stone contributed to this change (pp. 384-85).
Walker, Epstein, and Dixon's finding was confirmed in the study by
Haynie (1992). Using the tenure of each chief justices as intervention variables,
Haynie found that two chief justices, Hughes and Stone, had significantly
contributed to the change in the level of dissenting behavior in the U.S.
Supreme Court (pp. 1164-65).
Another recent study analyzed the reaction of a Supreme Court in a
political crisis situation (Tate and Haynie 1993). Using data from the Philippine
Supreme Court, the authors analyzed the impact of the martial law period on the
institutional performance of the Court. Defining the onset, consolidation,
breakdown of martial law authoritarianism, and revolution (pp.218-220), they

29
apply the Box-Jenkins ARIMA model to assess the impacts of those four
interventions on the Supreme Court's functional performance of conflict
resolution, social control, and routine administration (pp. 210-211).
For the Canadian Supreme Court, there are only a few studies which have
studied the Court's institutional decision-making empirically. Russell, one of
the pioneers of the empirical analysis of the Canadian Supreme Court, presented
a statistical summary of the cases it decided from 1875 to 1969 (Russell 1975).
The study concentrated on the caseload, origin of cases, types of cases, and
impact of the Court's decisions on provincial and federal constitutional law.
A more recent study examined Canadian Supreme Court decisions in cases
involving the Canadian Charter of Rights (Morton, Russell, and Withey 1991).
It showed that since the introduction of the Charter of Rights in 1982, the Court
has become an increasingly important political actor that has influenced the
public policy of the country, especially in the area of individual-state
relationships. It pointed out that while both the federal and provincial
governments were affected by the charter, "the impact . . . on the provinces has
been qualitatively greater than its effect on federal law-making, and that Quebec
in particular has been most affected" (p. 20).
The studies cited above illustrate several approaches which can be used to
investigate various aspects of the institutional behavior of the Supreme Court.
In fact, Tate and Handberg (1986) suggest that "given appropriate data, it is
30
possible to investigate any number of other aspects of the Court's decision
making" (p. 7).
At the institutional analysis level, this study will investigate several
aspects of the Canadian Supreme Court's decision-making and how it has varied
over the period 1875-1990:
1. The size and sources of the Court's caseload;
2. The composition of the Court's caseload, focusing on:
a. general patterns of composition.
b. a massive shift from private to public law matters.
c. a striking increase in constitutional law and related matters;
3. The patterns of conflict in the Court's decision-making; and,
4. The direction of the Court's decision outcome, focusing on:
a. direction of the Court's policy making in major substantive
decision-making areas.
b. the changes in those directions over time.
In the cross-time comparison, two classes of factors will be considered as
potential explanations of continuity and change in Supreme Court decision
outcomes: overall structural changes and within-structure changes. Overall
structural changes refer to the changing status of the Supreme Court from
subordination to the Privy Council during the pre-1949 period to the Court of
Last Resort for Canada after 1949, and from parliamentary supremacy to

31
constitutional supremacy, i.e., from the Court created by an act passed by the
Parliament to the Court established by the new Constitution in 1982 (Russell
1982, 2). The structural changes are hypothesized to have effects on the Court
in its decision-making process, functional performance, and aggregate behavior,
since they help to define the new role, scope, and depth of rule adjudication for
the Court.
Within-structure changes refer to changes in the Court's personnel, the
retirement of judges from the Court, and the appointment of new judges to the
Court. Based on the personnel changes, we can define the Supreme Court in a
particular period as a natural court (a court of constant memberships). An
analysis of changes in natural court membership may help to explain
continuities and changes in the direction of Court policy outcomes. Before
beginning these analyses, it is necessary to describe the data they will use.
Data Collection and Missing Cases
When this project was proposed, the data to be used in the institutional
analysis consisted of a one-half random sample of all the Supreme Court cases
reported from 1875 to 1985. This plan was changed because the study is now
able to make use of a previously collected set of relatively extensive data on the
decisions of the Supreme Court for the period 1875-1969. These data, collected
in the early 1970s by Professor Sidney Peck of York University and Professor
32
Peter Russell of the University of Toronto with the support of the Canada
Council and the Social Science and Humanities Research Council, were initially
analyzed by Russell (1975), and freely made available for use in this analysis.
Upon receiving the data from Canada, Professor Neal Tate, with support from
the Canadian Faculty Research Program of the Embassy of Canada, the
Southwest Association for Canadian Studies, and the Faculty Research
Committee of the University of North Texas, was able to expand the data from
1970 through the first half of 1990.
The availability of these more extensive data led me to change the plan
for data collection. Instead of collecting and using a 50 percent random sample
of all the cases, the study will primarily analyze the existing Peck, Russell, and
Tate data. However, the decision to use these data was not without its
problems.
An initial analysis of the Peck-Russell-Tate data suggested that there
should be a total of 8417 decisions reported from 1875 through the first session
of 1990. Of the 8417 cases, there are 6241 cases from 1875 through 1969, and
2176 cases from 1970 to 1990. Unfortunately, the original data for 1875-1969
collected by Peck and Russell were still in the form of computer punch cards,
and it turned out that numerous cards were missing.
The missing cases presented a variety of problems. The data contained
two punch cards of information for each reported decision. The initial analysis
33
suggested that there were 1306 cases missing card one and 1365 cases missing
card two. The missing cards two, however, did not present a major problem
since card two contained no information pertinent to cases decided before the
appointment of Justice J. W. Estey in 1944 (see the codebook to the data in
Appendix A). Hence most of these missing cases did not have to be recoded.
Missing data on card one was more serious, both quantitatively and
qualitatively, because card one contained all the substantive information coded
about the case. Hence, all 1306 cases with card one missing had to be recoded.
The completion of this recoding was the final stage in Tate's restoration of the
complete Peck-Russell dataset.
In addition to the Peck-Russell-Tate dataset, the study will use another
dataset consisting of only nonunanimous decisions but including variables not
coded in the Peck-Russell dataset. Part of these data were coded earlier and
were used in the previous studies (Sittiwong 1985; Tate and Sittiwong 1989).
The nonunanimous dataset previously covered all the split decision from 1949 to
1985. The availability of the Peck-Russell-Tate dataset allowed this study to
expand to cover all such cases from 1875 to the first session of 1990. The
nonunanimous decision data will be used for comparison with the analysis of
the policy direction of case outcomes. In addition, it also was used to cross
check the reliability of the Peck-Russell-Tate data.
34
Size and Sources of Caseload
The legal provisions concerning the jurisdiction of the Canadian Supreme
Court were originally defined in the Federal Supreme Court Act of 1875 section
35. According to this act,
The Supreme Court shall have, hold and exercise an appellate, civil
and criminal jurisdiction within and throughout Canada.
Based on this act, the Supreme Court has jurisdiction over every aspect of
Canadian law. This broad base covers federal and provincial laws and statutes,
public and private matters, and common and civil law throughout Canada. In
addition, sections 55 and 56 provide the Supreme Court the right to hear
references1 by the Governor-in-Council, or by the Senate or House of Commons,
on important questions. Section 55 stated:
Important questions of law or fact concerning
(a) the interpretation of the British North America Acts;
(b) the constitutionality or interpretation of any federal or provincial legislation;
(c) the appellate jurisdiction as to educational matters, by the British North America Act, 1867, or by any other Act or law vested in the Governor in Council;
(d) the power of the Parliament of Canada, or of the legislatures of the provinces, or of the respective governments thereof, whether or not the particular power in question has been or is proposed to be exercised; or
(e) any other matter, whether or not in the opinion of the Court ejusdem generis1 with the foregoing enumerations, with
35
reference to which the Governor in Council sees fit to submit any such question;
may be referred by the Governor in Council to the Supreme Court for hearing and consideration; and any question concerning any of the matters aforesaid, so referred by the Governor in Council, shall be conclusively deemed to be an important question.
Section 56 then provides the power to the Senate or House of Commons of the
federal Parliament to refer bills to the Supreme Court.
Two major changes altered the original scope of the Court's jurisdiction.
The first occurred in 1975 when the right of appeal was abolished in civil cases
where the amount in dispute exceeded $10,000. This limitation did not reduce
the jurisdiction of the Supreme Court, but left it to the Court to select the cases
it will hear.
The second change, a more important one, occurred in 1982. The
adoption of the Charter of Rights broadened the scope of Supreme Court
judicial review. F. L. Morton (1986) points out that:
The Charter applies not just to the legislation and administrative rules and regulations of both levels of government, but also the conduct of all government employees—policemen, prison wardens, and administrators of other public services and program. This latter category of "state action" was rarely subject to judicial review prior to 1982 (p. 14).
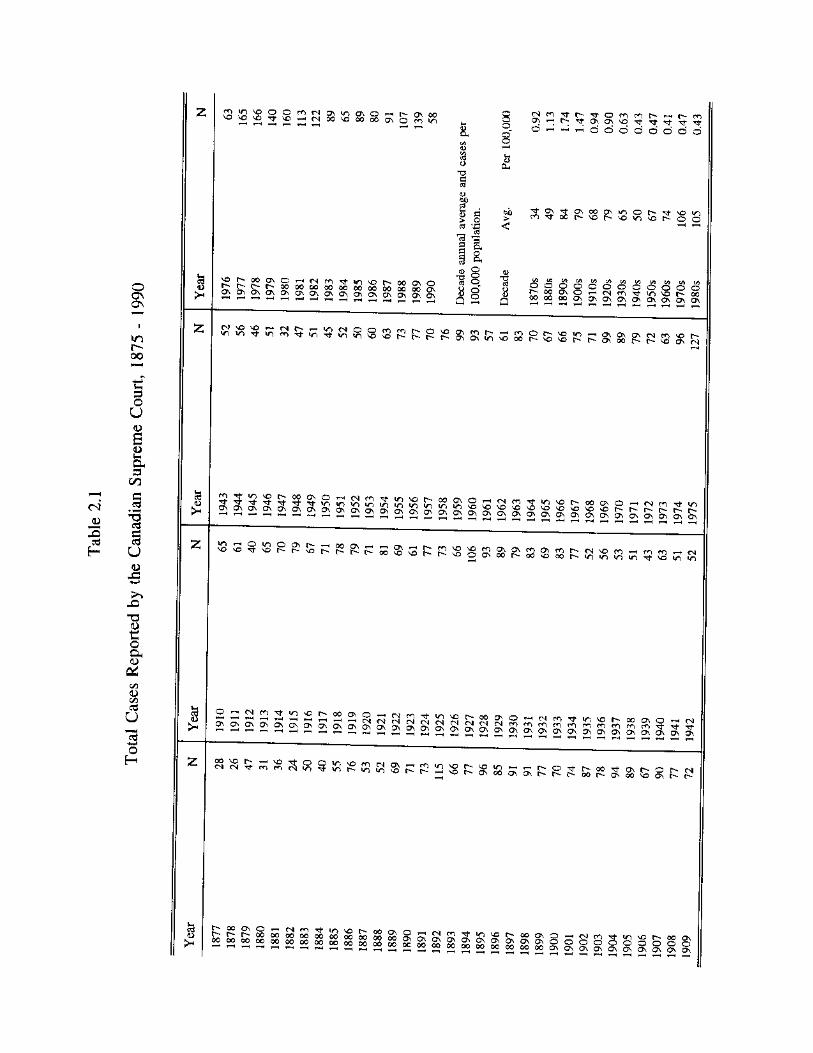
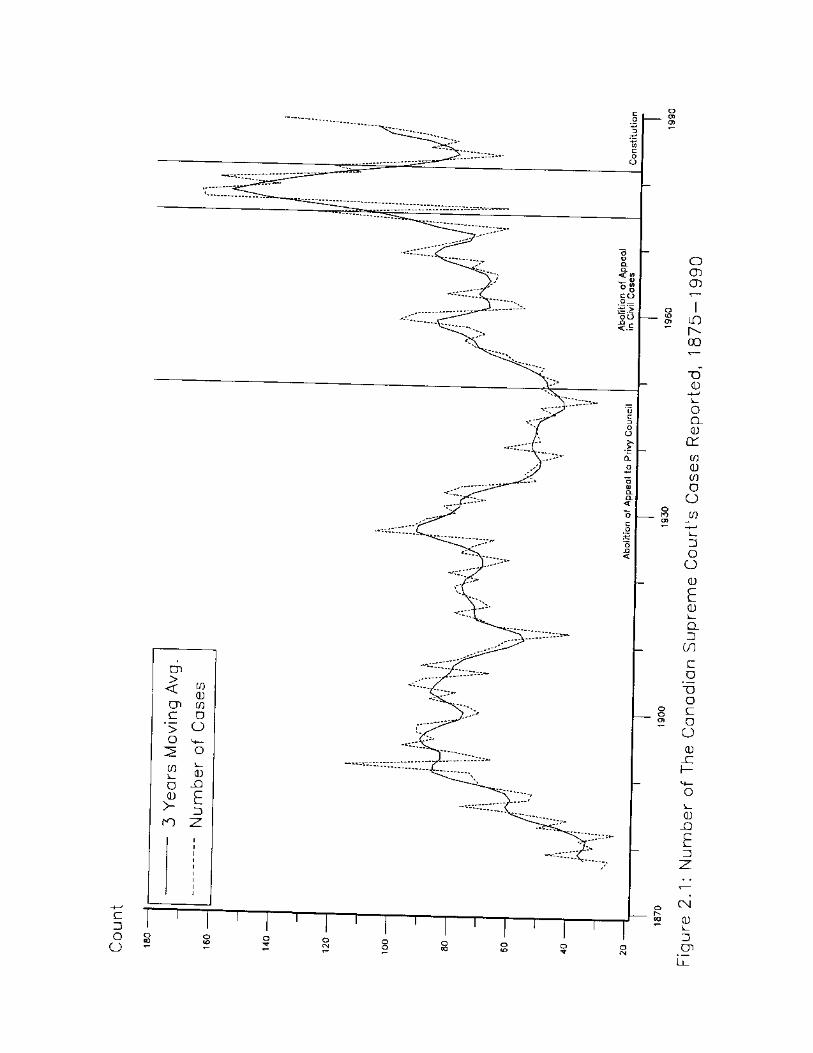
For the initial picture of the Canadian Supreme Court's decision-making,
one can turn to Table 2.1, which presents the number of decisions it reported
each year in the period 1875-1990, along with the by-decade annual averages
and cases per 100,000 population. Figure 2.1 presents the plot of the annual
o O N O N i—1
i n i > 0 0 T—<
t s S3 O
U
C3 O t - i a ,
D
CO r - H
< N 3 • ¥•4
CD f-»H " 3 X ) s-5
c d e g
H U
o X !
>> X )
7 3 <D
t s o
O h <D
C* CO O CO c d
U
o
H
^ ^ ^ T t V D H M C O ^ O O O O O N O f O > n
& i/i <U
o
T 3
^ ^ ^ ^ < ^ < ^ V j C ? ' , ! : t T t r t T t , , | ' t O H H H d c i d d c i d d d
<D
a >
S3 > c3
1 3 3 a
a
I EL
I a
i 9 ^ £ ? ^ 9 r H ^ ^ T J ' , o i o r > ' 0 0 o \ o " 3
8 Q
W) <
<1> T 3 cd
I
ON o n TJ-
p N O O ^ i o O h ^ ^ c i n h ^ h ^ i n ^ o h o o
° ° o o o o
o o o o o o o n o n o n o n o n o n g n o n o n
m T f - -4 T f T t
a s l l l l l l l l l l l l l l l l l l l l l l l l l l g g l l l
S S S B R g f c p g g i p s s s f c p g g g i g g g g ^ g p . g j j o g j ^ g . g ^ g
a i l l l l l l l l l l l l l l l l l l l l s s s a a s l s l S S
00 \ 0 h H \n <N ( N r t <m m S i S ! S S 8 S $ £ P 2 ! S F C £ ! 3 5 ; S ; & G ; I S ; P > A 8 ! S 8 F C P !
I l l l l l l l l l l l l l l l l l l l l l l l l l l l l l l l l
c 15 O O
cn cn

38
cases reported. In order to help clarify the trend in the data, Figure 2.1 also
presents the three years center moving average plot of the data.
The graph presented in Figure 2.1 is quite interesting. It shows some
cyclical trend in the number of reported cases. There is a steady increase in the
cases reported in the first 20 years of the Court's existence, which remains
stable at the rate of 85 reported cases per year. This trend continued for the
next 10 years, then it showed a decline to about 75 reported cases annually.
With the initial increase in the late 1920s, the Supreme Court reported less cases
during 1930-1949. The Court reported more cases steadily duing the 1950s,
followed by a fluctuation during the period 1960-1974. Despite the abolition of
the rights to appeal in civil cases, the period immediatly after 1975 showed a
drastic increase in the number of cases reported. In fact, the cases reported by
the Court reached its all time high in 1981. The early 1980s showed a steady
decrease in cases reported until 1985 where the trend is reversed toward the end
of the series.
The fluctuation in Court cases reported did not show any effect of
population growth in the country. In fact, the ratio between average cases
reported per 100,000 population shows a decline from the early to the later
period. Since the abolition of the rights to appeal to the Privy Council in 1949,
the annual average cases per 100,000 population are about 0.4 cases. At this
time, it is difficult to pinpoint the factors which can explain the variation in the
39
cases reported. The sudy lacks appropriate data that may have a potential to
explain these variations. This subject will be pursued in later study.
The sources of the cases decided by the Supreme Court from 1875 to
1990 is presented in Table 2.2. The sources of the Supreme Court cases reflect
the socioeconomic dimensions of the Canadian polity and how those dimensions
have changed over time. Despite their skepticism toward the Court in the early
period, Quebec and Ontario were the major sources of the Court's cases. The
Federal Court and British Columbia came in third and fourth, respectively.
Collectively, they represented about 72.5% of all of the Supreme Court
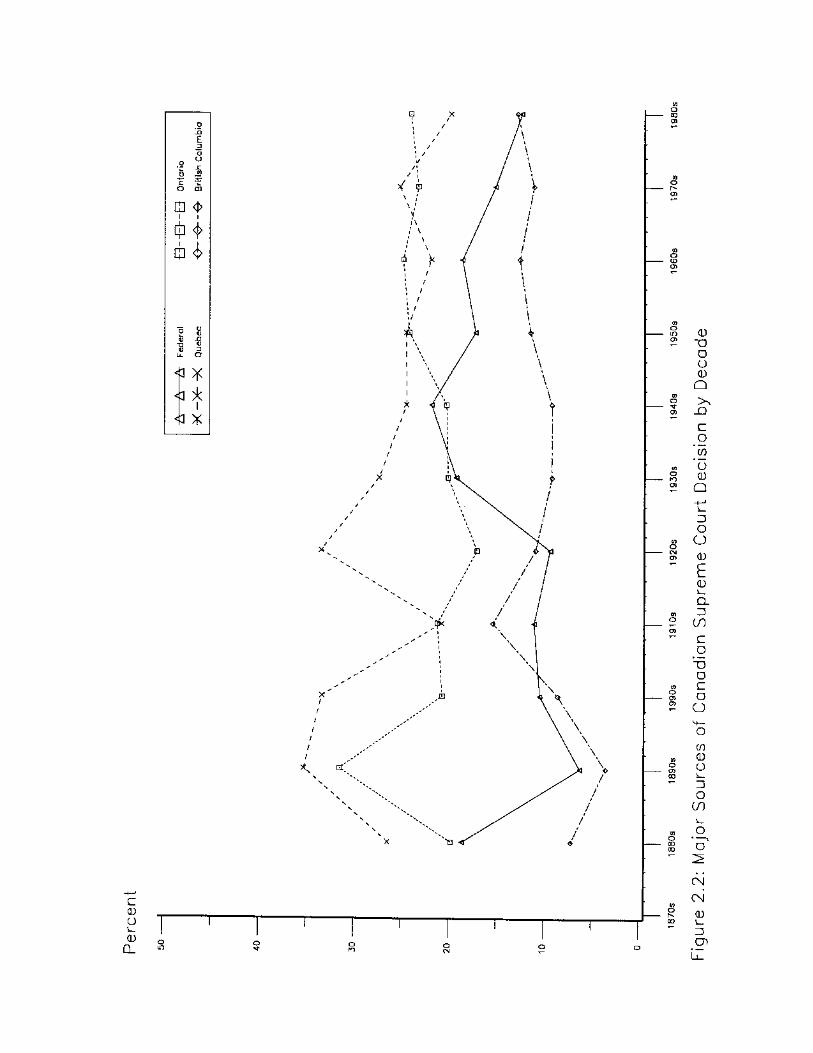
decisions (see Figure 2.2).
Figure 2.2 demonstrates that the combined share of Ontario and Quebec,
the two largest provinces, both in size and population, has generally declined
from the earlier to the later decades, but in the twentieth century that decline has
been due almost entirely to Quebec. In fact, from the 1920s to the present
Ontario's share has increased and remained stable while Quebec's, with a single
reversal, has declined. In contrast, the share of British Columbia has shown a
steady increase throughout the twentieth century paralleling its growth in
population and economic significance.
Although Figure 2.2 represents only three major provinces in Canada, it
does not imply that other provinces are not important sources of Canadian
Supreme Court decisions. Their shares, however, can be most easily understood

Tf" o
© *3-
t2 (T) OO vo ON 1-4 O
o ON ON
*o oo
a 00 c*
O ON
00 rfr
d <N!
V) o wS
oi 2 S 00
<N
O Tt 5 \q
ON O* oi O
<M o
tt 3 O U §
8. §< CO
1
<s
<s Tf a\
£
55 $
Z
*n r-« 00
vq vq r-4
o \o
Os
*n o
ON o
o a
vq -rf
3
rf
MD rf
vo
g
<N d
<N c4 jd 13 H
U <u
T) <L> <D O* Oh C c/S <D CO cd U
On rf <si ro <N
£ &
VO o
o
<N o
o *o
- §
<-N> \6
O)
Tf <N
o
\D
vo \o
V£> S
<o OO t-»
Tf VO
<D S3 O 00 73 g *Sb 'C o
o o C\
oo vq co oo
T-H <N| Csi »ri 2 ?
<N o
\JD o
Tt* c4
o
<N
o rf
O \T) <N
T-H |> OV t-h v~» oo r-H <N
»n T-H r-H
CT\ OO <N
CO S
<N
V~> \D 0\ ^ O OO i-i <
<N r-J "I- c4
8
8
u •a
I <u 55 CtJ eC
§ 2:
2 OQ £ <D 55 £
O "S ei O
e« -8 S
JJ 5
H U £ OQ z
d o •g i
Q O
§ 4> • <j>
* * I
X
X /
c 0 o L_ 0 Q_
0 "O o G 0 Q
_Q
c o
'(£
*o 0 Q
D O O 0
0
Q_ D GO
C a
*~D D C O O H— O cn 0 o
D O
i f )
o i oo
CN
CN
0 L_ =3
cn

42
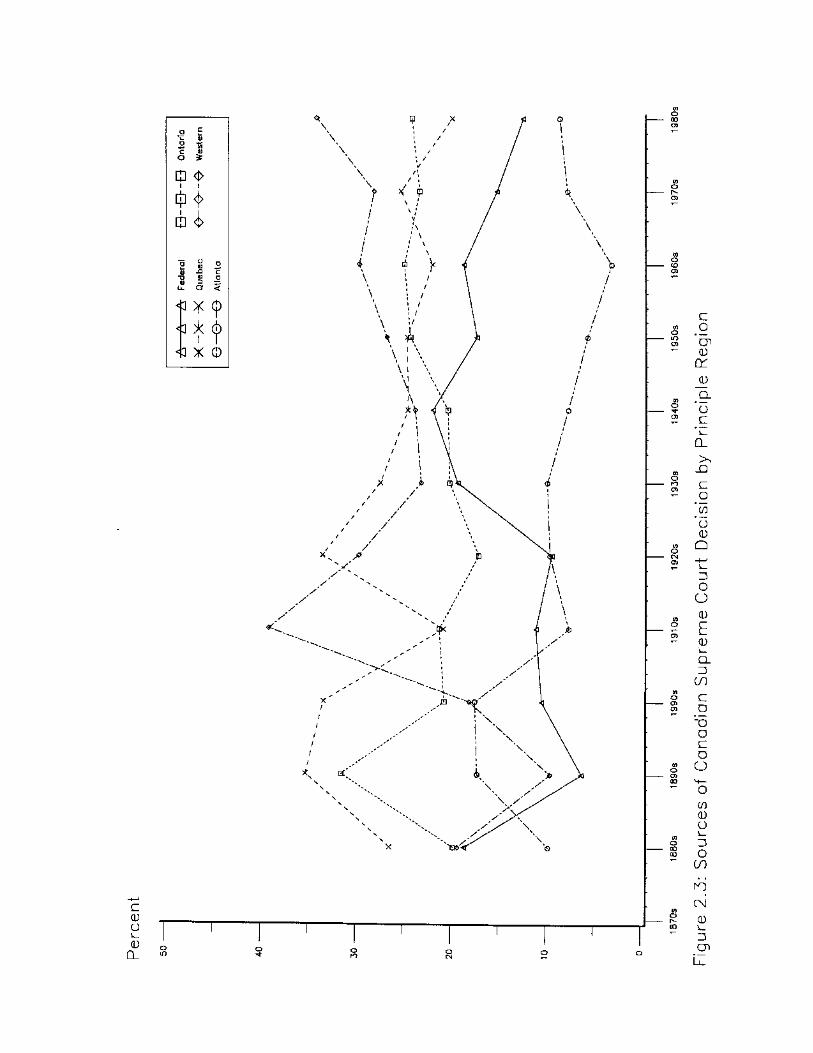
by combining them into the principal regional divisions that are common in
Canada.3 Figure 2.3 presents these regional shares. It shows the shift in
Supreme Court decision-making attention from eastern to western Canada.
Ignoring the anomalously high share of the decisions coming from the western
provinces in the 1910s and 1920s, one sees a steady increase in the share of the
western provinces in the Supreme Court's decisions, and a decline in the share
of the Atlantic region.
These changing patterns are hardly a surprise. They parallel the patterns
of population and economic share for Canada's regions (see Jackson, Jackson
and Baxter-Moore 1986 ). Perhaps more to the point, they reflect the pattern of
changing economic well-being of Canada's regions and the increasing late-
twentieth century suspicion of Quebec for federal governmental institutions and
agencies.
Composition of The Caseload
The scope of rule adjudication can be observed quantitatively by looking
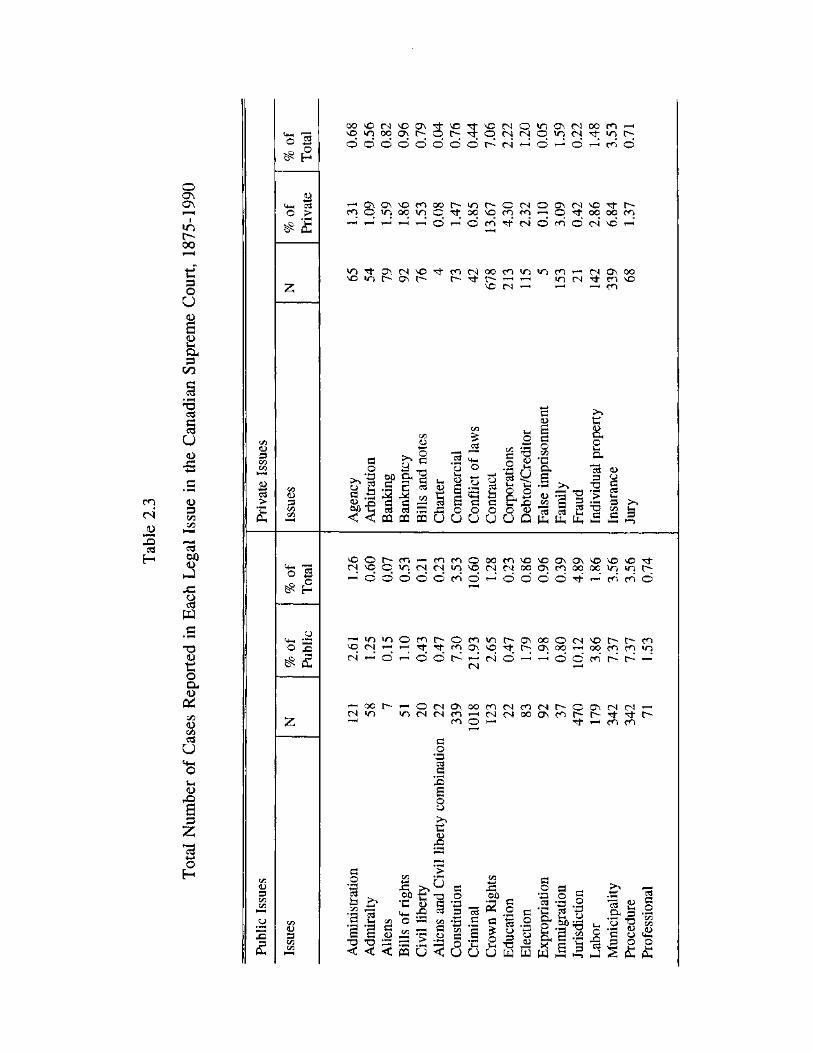
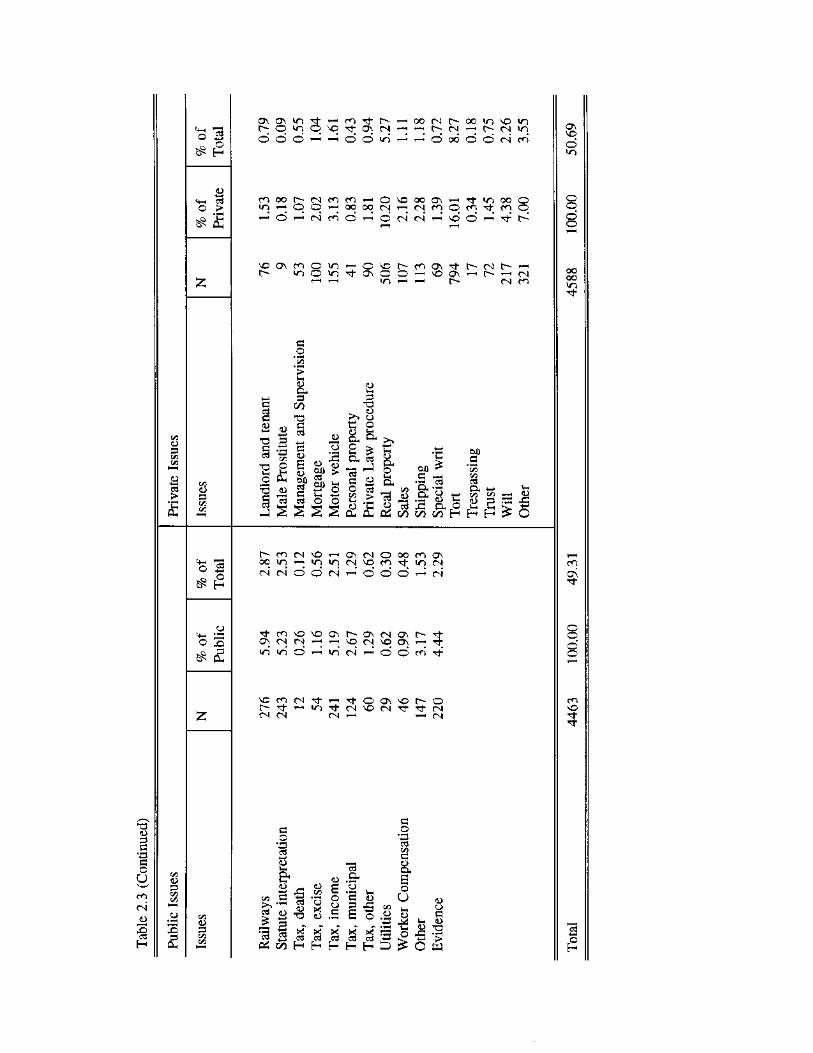
at the variety of types of cases decided by the Court. Table 2.3 presents the
total case mix of the Canadian Supreme Court. It shows that the Court was
asked to make decisions in a substantial variety of issue areas. The issues
involved in the cases range from such private disputes as family law, wills,
motor vehicles, etc. to public policy related issues such as constitution law,
1 2 E 1 2 1 o ^
a <t>
i <i>
• i
i ( S « 2 u -a c XI « o u J3 ^ u. a <
< 3 * (j)
<
< 3 X 0
o m o>
o o>
o O)
o 00 oo
c 0 o !k_. CD CL
C O
*cn 0 (Z
_0 Q. *Q C * !k_ CL
_Q
C O \n *o 0 O
= 5 O o
CD
£ 0 k_ CL D U1 C O T3 D C O O M— o cn 0 o
D O CO
ro
CN
0 L. D cn

44
federalism, civil liberties, taxation, etc. More detailed discussion of these issues
is presented below.
The table classifies the number of issues raised in the cases decided into
two categories, public and private law. In total, 4,463 issues raised in the cases
(49.31%) are classified as public law issues and there are 4,588 issues in the
private law area (50.69%).4 While private law issues outnumber public law
issues overall, criminal law issues were the most frequently raised issues with a
total of 1,018 (10.60%). Tort, contract, real property, and jurisdiction cases
round up the five issues decided by the Court most frequently. Combined they
account for 38.3% of all issues raised.
Looking at Table 2.3 alone may lead one to conclude that the Canadian
Supreme Court did not significantly play a role in public policy formulation in
Canada. The majority of its caseload has been in private law areas, and the
number of controversial policy issues such as constitutional law or civil rights
and liberties was small. However, a more careful analysis of the dynamics of
the casetypes decided by the Court in different periods shows that the Canadian
Supreme Court has gradually increased its role in politics.
To understand the dynamics of the Court's rule adjudication, we need to
look at the frequencies with which the various types of issues were raised in
different periods. To make the presentation more meaningful and manageable,
the issues raised in the cases that were classified in Table 2.3 have been
CO CN <D
1 H
o OS ON
i *Ti r-00
t3 §
u §
a S3 CO
13
u Q •S
<D S3 «s C« HH
13 &JQ <D
J
w
£
a o OS 03 <D C/5 ctf u
tH
<u
1
3 o H
3
£
£ t+H CJ o > s £
CO <D 0 CO CO
i >
<D =3 CO CO
5 S £
CO <D =3 CO CO
I
CO <D CO CO
00 \D (N vo 0\ in oo o\
o d d o o o
vo 5
VO CN O i n Q\ C N O O cn r-H t > 5 O C N C N o i n C N i n t >
d d C N r-H* d O r-H c n d
G \ V O c n oo o CN O On CN i n o o *n O OO V O c n c n T—' p "3"
r-H t-h" o O c n t" CN d c n o <T> O
*n rt o\ cn vo Tt >n h a\ h
t> OO OO CO CN r-H*
m c N o o m m * r ) m T — < C N O > O O i> o ^ >n (N i1 m \o
'O M H *—1i t—( rO
CO
I
g"i s
l l l l a S wj -e ca ( d a j : < < oa pa cq u
a g
£ M
"S £ o o U U
.2 2 a sj o o & £ O «D U Q
>> tJ
i o
Si 2
CO *d
CU
& 13 <D g s a
>> T3 s o
Fraud
" > P3 VH
CO 13 PLh
C3 U- F
raud
I S3 CO a
voor^cnr^cncnooocnvovoo\a\vovovo^fr cni vq| Ci tr> cni cn vq cni cn oc> o\ cn oo oci in *n r*; ^ O O O O O c n O ^ O O O O r f T - I r n c n O
U M-i r-4 IT) i n o c n o c n * o r ^ o S V O C N I—* i-j T f c n o\ v q Tf-
^ <£ (N r-H o d o C N
C N o
o CN V O r > c^- c n O O r-H O O c n c n *r>
o o c n
cn cn r H O O h H O n O \ X c n ( N f n c N h O O \ ( N ( S CN *n > T ) ( N ( N r i r H ^ ^ o o o \ n h h T r i - h r-H (Tj <3 rH T'
a 0
1
1 o O
ti o
x>
a 0
1
-a
5
CO £ Ctf> *G «+i o CO
>
ti T3 <L> Q 4D C5 5=3 co
• a | s :e § -a a •§ 5 s - 1 1 -i | s j < < « U < O U U B W B S l j 2 i : £
CO s 0J) 2 a £ O
a o 'S o 5
a o a H
*3 ° S *£3 .2
*C c3 +3 5- S o 8 -a 13 b a co
>» ^
13 a & S3 *3 T3 C O .P P
ctf C o • »-H CO CO .<u
o £
^ £
£ <4-H Ctf
o >
# £
c e 0 S3 c « c «
1 >
£ C/3 <D S 3 W3
o 3
# £
CJ J Z J
o 3
s £
" 8
§ ' S 0
u
N—•
C O
c n <D
1
H
t » <D S 3
£ <D
O N O N * o 3
r -H C O ^ t r -H O O C N o 0 0 w o V O i n o o MO 3 V O ^ t O N C N r -H r -H t > C N T-H t > C N
o o d r -H r-H* d o * o 1 - 4 r -H d O O d o CM* C O
C O O O r - C N C O C O o V O O O O N r-H T f - * o O O o O
* o r -H p O r - H O O O O C N r-H C N C O O C O C O o o
r"H o *" H C N C O o r -H o C N C N r-H v d r -H
o o o r -H
V O O N C O r - * o
a
.2 *«
& S 3
0 0
1
c 5 <D
a o
s >
WO * n
^ o v o r - c o o N ^ t c ^ o i r - ^ ^ ! J \ O O H \ 0 0 \ H t S H ^
* r > r -H t - h t > c n c n
a
<D +-»
" 3
o l i
S
3 •a Kjn £ <D
csJ c $
s s
j D
T 3
« ' • §
% > o x )
t i 2
o o
s s
> %
s
C u O
% a CJ 0
a
£ ctf
J
1 >
£
£ a
D *
0 4 0 0
O D ^
• S 1 3 & ' s «
2 *> « a P
W C / 3 H
W >
.s *35
3
& « e s
H H
3 5
£ o
C O C N V O r-H O N C N o O O C O O N O O WO r - H *T) * n C N V O C O w o ( N
C N C N O o C N r—H o o o r - 4 ( N
O N C O C N
V O C N
V O O N v q
O N C N
C N V O
O N O N
w o w o d C N ^H* d d CO* T f
V O C O C N ^ f - r - H T t O O N V O t ^ O h T f r H i O T f ( N V D ( N ^ T t M C N M ( N h t—. o i
« 0
1 t s
|
« . 3
£ o
£ 3 •a | C * in
"§ • -C3 Q
- S S
1 1 H H
<D
1 3
* 3
•a _ 3 5 w
. S % |
% £ < £ i
H h h 5
<D
a o o a
a 0
1 «D a
a 0
L >
fcj
• a
1
<D
a Vh <D
_ § 3 2 > O W
O N V O
o w o
o o GO t o t j -
C O
O N
• ^ t
O o
o * o
CO V O
5
£

47
combined into two broad categories: private and public issues. Table 2.4 shows
the total number and percentages of cases which raised private law or public
law issues annually from 1877 to the first half of 1990. These numbers are
plotted in Figure 2.4 and Figure 2.5, respectively.
The pattern depicted in Table 2.4 and Figure 2.4 is very striking. With
only 11 exceptions (1910, 1912, 1939, 1944, 1946, 1959, 1967, 1968, 1970,
1971, 1974), private law matters maintained a numerical dominance over public
law issues in the Canadian Supreme Court's decision-making almost every year
from 1877 through 1976. In this period private issues were decided by the
Court at an average of 50 cases annually, constituting 56.79% of all cases.
Public law cases were decided by the Court at an average of 39 cases annually,
constituting 43.21% of all cases. One might notice that in the decade 1967-76,
public law issues dominated private law issues in five of ten years, thus hinting
at the change to come. From 1977 on, however, the Supreme Court's decision-
making has been clearly and lopsidedly dominated by public law matters. The
average number of public law cases increases to 77 annually accounting for
71.05% of all cases, while the number of private law cases declines to 32 cases
annually, accounting for 28.95% of all cases.
The figure is subdivided into four segments based on the occurrence of
significant changes relevant to the Canadian Supreme Court. The first period
covers from the establishment of the Supreme Court to 1949, when the right to
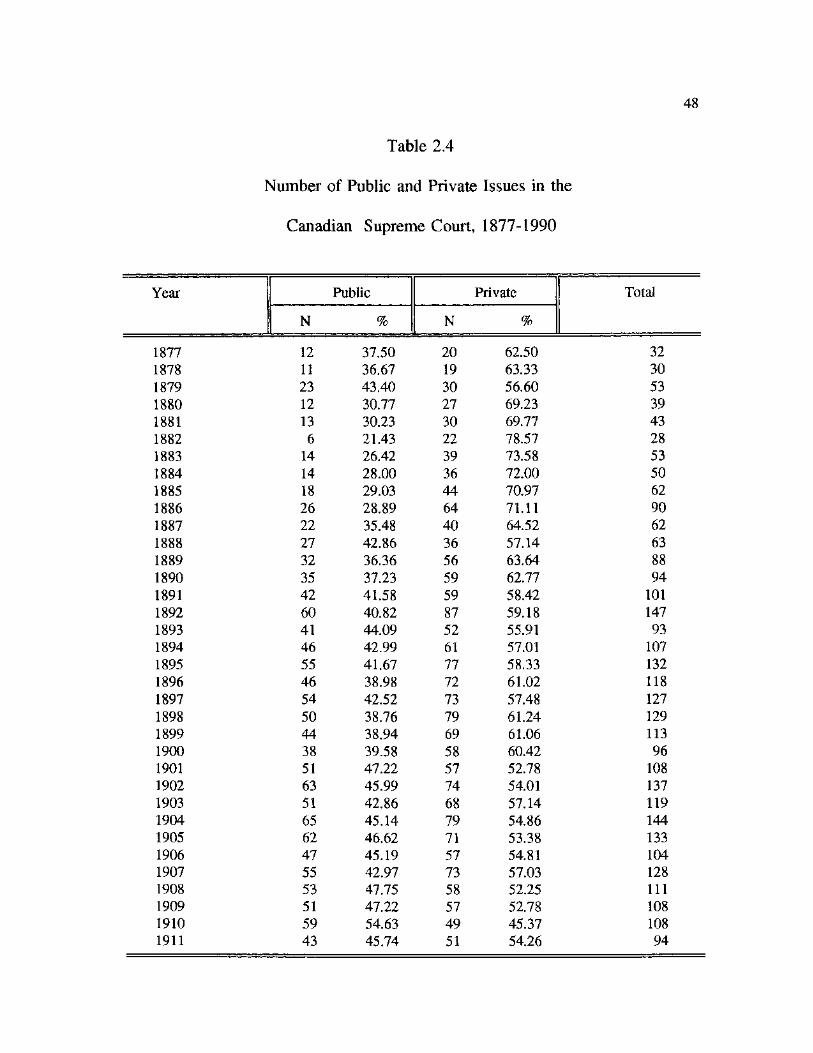
Table 2.4
Number of Public and Private Issues in the
Canadian Supreme Court, 1877-1990
48
Year Public Private Total Year
N % N %
Total
1877 12 37.50 20 62.50 32 1878 11 36.67 19 63.33 30 1879 23 43.40 30 56.60 53 1880 12 30.77 27 69.23 39 1881 13 30.23 30 69.77 43 1882 6 21.43 22 78.57 28 1883 14 26.42 39 73.58 53 1884 14 28.00 36 72.00 50 1885 18 29.03 44 70.97 62 1886 26 28.89 64 71.11 90 1887 22 35.48 40 64.52 62 1888 27 42.86 36 57.14 63 1889 32 36.36 56 63.64 88 1890 35 37.23 59 62.77 94 1891 42 41.58 59 58.42 101 1892 60 40.82 87 59.18 147 1893 41 44.09 52 55.91 93 1894 46 42.99 61 57.01 107 1895 55 41.67 77 58.33 132 1896 46 38.98 72 61.02 118 1897 54 42.52 73 57.48 127 1898 50 38.76 79 61.24 129 1899 44 38.94 69 61.06 113 1900 38 39.58 58 60.42 96 1901 51 47.22 57 52.78 108 1902 63 45.99 74 54.01 137 1903 51 42.86 68 57.14 119 1904 65 45.14 79 54.86 144 1905 62 46.62 71 53.38 133 1906 47 45.19 57 54.81 104 1907 55 42.97 73 57.03 128 1908 53 47.75 58 52.25 111 1909 51 47.22 57 52.78 108 1910 59 54.63 49 45.37 108 1911 43 45.74 51 54.26 94

49
Table 2.4 (Continued)
Year Public Private Total Year
N % N %
Total
1912 28 50.91 27 49.09 55 1913 48 47.06 54 52.94 102 1914 45 44.55 56 55.45 101 1915 53 44.17 67 55.83 120 1916 46 46.94 52 53.06 98 1917 48 46.15 56 53.85 104 1918 34 33.33 68 66.67 102 1919 56 45.53 67 54.47 123 1920 38 41.30 54 58.70 92 1921 31 30.39 71 69.61 102 1922 37 42.05 51 57.95 88 1923 38 44.71 47 55.29 85 1924 53 46.90 60 53.10 113 1925 38 42.22 52 57.78 90 1926 33 36.67 57 63.33 90 1927 61 42.07 84 57.93 145 1928 59 44.03 75 55.97 134 1929 53 45.30 64 54.70 117 1930 43 43.88 55 56.12 98 1931 42 41.58 59 58.42 101 1932 38 47.50 42 52.50 80 1933 42 42.86 56 57.14 98 1934 39 40.63 57 59.38 96 1935 33 45.83 39 54.17 72 1936 36 47.37 40 52.63 76 1937 22 34.92 41 65.08 63 1938 28 42.42 38 57.58 66 1939 29 51.79 27 48.21 56 1940 37 41.11 53 58.89 90 1941 31 41.89 43 58.11 74 1942 33 43.42 43 56.58 76 1943 28 38.36 45 61.64 73 1944 37 51.39 35 48.61 72 1945 26 41.27 37 58.73 63 1946 38 52.78 34 47.22 72 1947 18 41.86 25 58.14 43 1948 30 47.62 33 52.38 63 1949 35 46.67 40 53.33 75 1950 35 49.30 36 50.70 71 1951 37 45.12 45 54.88 82 1952 33 46.48 38 53.52 71 1953 37 42.53 50 57.47 87
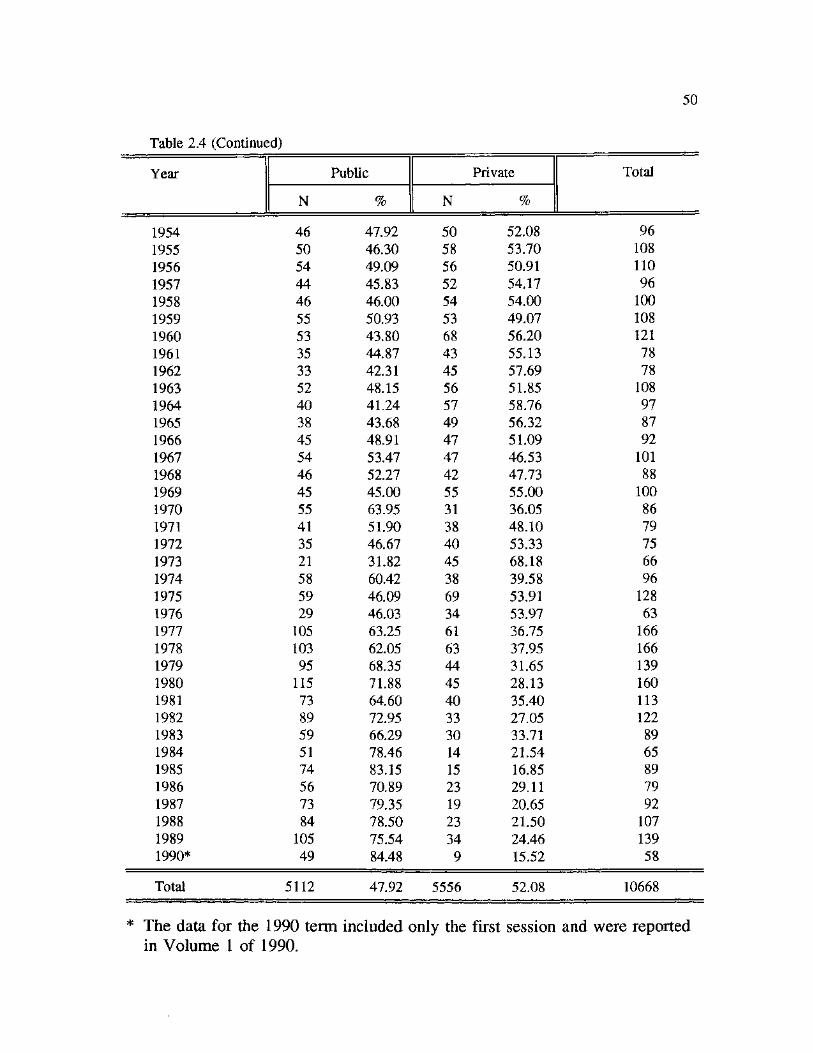
50
Table 2.4 (Continued)
Year Public Private Total Year
N % N %
Total
1954 46 47.92 50 52.08 96 1955 50 46.30 58 53.70 108 1956 54 49.09 56 50.91 110 1957 44 45.83 52 54.17 96 1958 46 46.00 54 54.00 100 1959 55 50.93 53 49.07 108 1960 53 43.80 68 56.20 121 1961 35 44.87 43 55.13 78 1962 33 42.31 45 57.69 78 1963 52 48.15 56 51.85 108 1964 40 41.24 57 58.76 97 1965 38 43.68 49 56.32 87 1966 45 48.91 47 51.09 92 1967 54 53.47 47 46.53 101 1968 46 52.27 42 47.73 88 1969 45 45.00 55 55.00 100 1970 55 63.95 31 36.05 86 1971 41 51.90 38 48.10 79 1972 35 46.67 40 53.33 75 1973 21 31.82 45 68.18 66 1974 58 60.42 38 39.58 96 1975 59 46.09 69 53.91 128 1976 29 46.03 34 53.97 63 1977 105 63.25 61 36.75 166 1978 103 62.05 63 37.95 166 1979 95 68.35 44 31.65 139 1980 115 71.88 45 28.13 160 1981 73 64.60 40 35.40 113 1982 89 72.95 33 27.05 122 1983 59 66.29 30 33.71 89 1984 51 78.46 14 21.54 65 1985 74 83.15 15 16.85 89 1986 56 70.89 23 29.11 79 1987 73 79.35 19 20.65 92 1988 84 78.50 23 21.50 107 1989 105 75.54 34 24.46 139 1990* 49 84.48 9 15.52 58
Total 5112 47.92 5556 52.08 10668
* The data for the 1990 term included only the first session and were reported in Volume 1 of 1990.
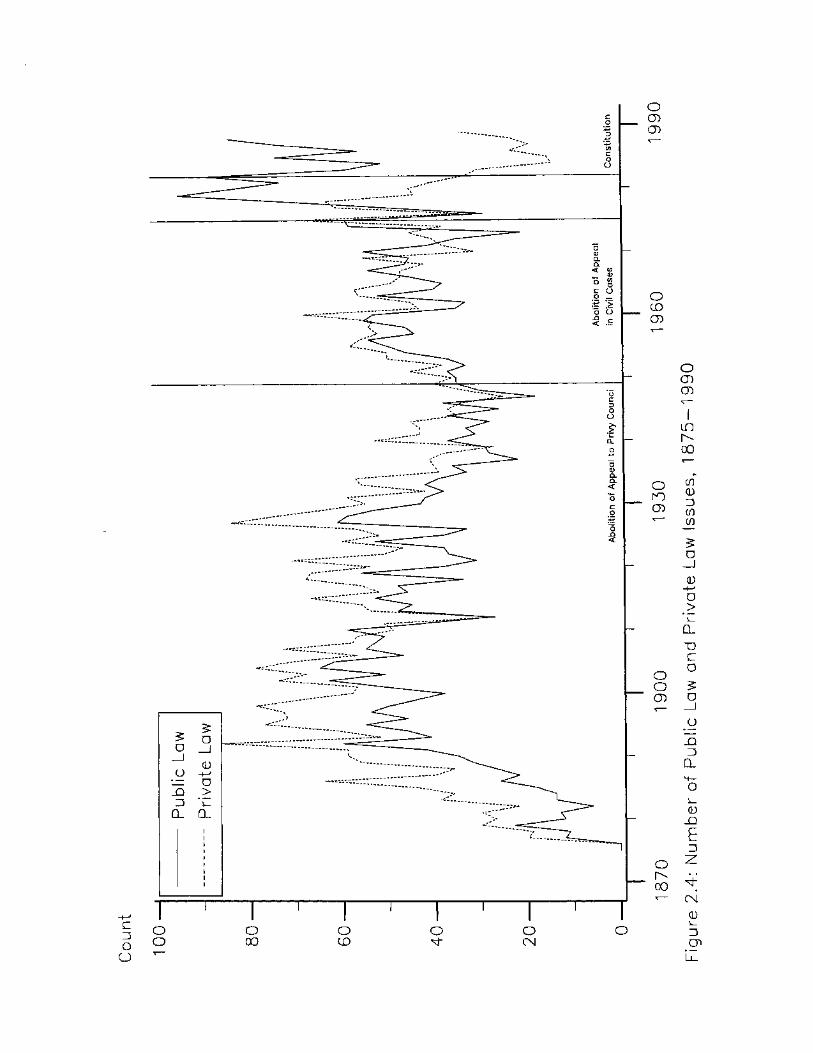
c =3 O
O
o CD o >
O CO CD
O r o CD
O O CD
O r ^ 00
o (J) CD
LO r ^ 00
c n CD 3 ( n i f )
£ a
CD
a > *L_ CL
X J C O
a _J
o
2 5 =3
CL M— o CD
- D
CN
0 k_ D CP
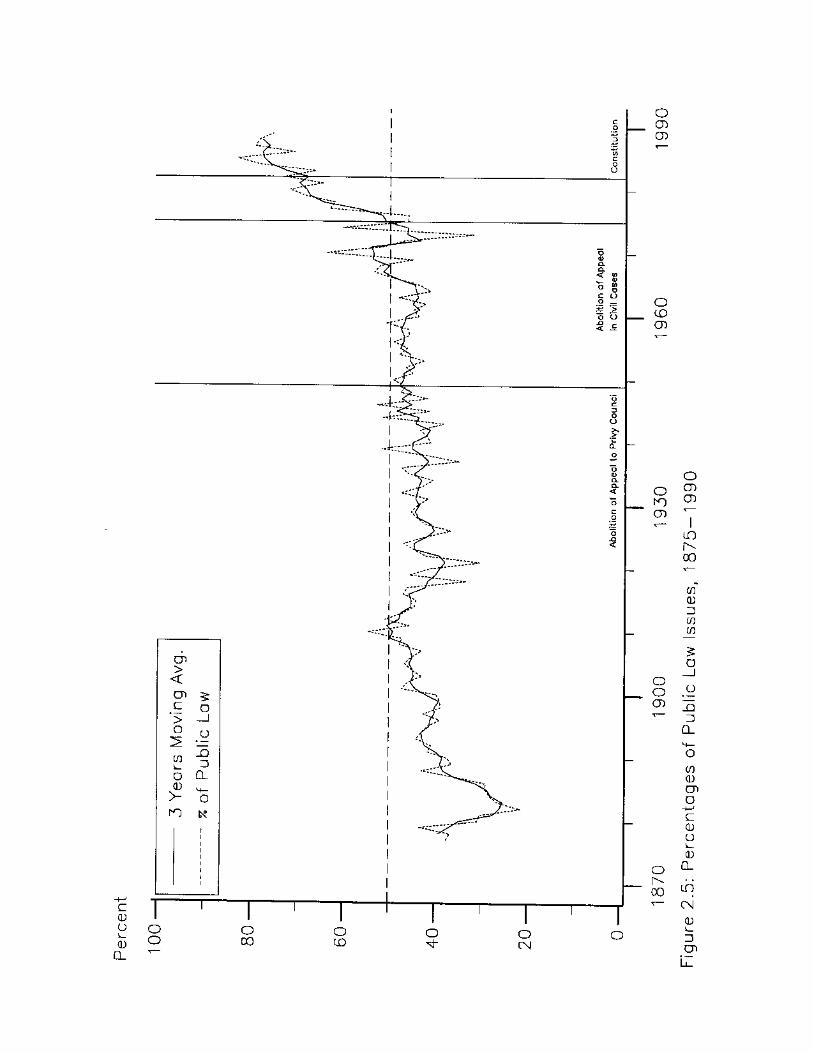
c 0 Q L_ 0
Q_
O CT> (J)
O CO CD
O
CX>
O O CT>
O r^ 00
o CD CD
LO
00
cn 0 D in CO
o
o
25 D
0_
cn 0 cn o C 0 o 0
CL
U1 CN 0
D cn
53
appeal to the Privy Council was abolished. The second period is between 1949
and 1975 when the Court's jurisdiction was changed. The third period is from
1975 to 1982, after the right to appeal in civil cases where the amount in
dispute exceeded $10,000 was abolished. The fourth period, from 1982 to 1990,
covers the time after the new constitution.
As mentioned in Chapter One, these changes significantly altered the
political importance of the Supreme Court. The abolition of the right to appeal
to the Privy Council helped to increase the Supreme Court's prestige by making
it the final and exclusive court of appeal for Canada. The abolition of appeals
by right in civil cases with a value over $10,000 contributed to the autonomy
and freedom of the Court to select and control its own docket. It allowed the
Court to pick and choose cases that raise significantly important questions of
law and policy. The adoption of the Charter of Rights constitutionalized the
Court's authority.
Using these divisions, one can see that the abolition of the right to appeal
to the Privy Council did not drastically alter the balance of the Supreme Court's
rule adjudication. However, the latter two changes appear to have significantly
shifted that balance. This is clear from Figure 2.5, which plots the percentage
of total reported decisions accounted for by public law cases from 1877 through
1990. After 1975, the graph shows a continuing rise of public law issues. The
54
adoption of the new constitution in 1982 appears to solidify their domination in
the Supreme Court decision making in the 1980s.
To test the significance of these events on the changing rule adjudication
pattern statistically, the study estimated a Box-Jenkins ARIMA (3,1,0)5 model
for the data. The shift in percentages of public issues cases was modelled as a
function of three time series interventions and the three changes marked by the
abolition of the right to appeal to the Privy Council, the abolition of the right to
appeal in civil cases, and the adoption of the new constitution. These events are
hypothesized to have a permanent effect with a gradual onset6 on the proportion
of public issues cases. Since the abolition of the right to appeal in civil cases
(1975) and the adoption of the new constitution (1982) occurred in a close time
span, the study also hypothesized that they have a compound effect on the
changes. Table 2.5 presents the result of the multivariate Box Jenkins ARIMA
(3,1,0) estimation and their associated statistics.
Prior to estimating the multivariate model, I calculated univariate models
for each intervention. The results of the univariate models are similar to those
of the multivariate one. The result of the multivariate model shows that the
abolition of rights to appeal to the Privy Council did not significantly change
the ratio of public issues cases decided by the Supreme Court. The study
expected that the abolition of the right to appeal in civil cases and the adoption
of the new constitution will have a compound effect on the Court's scope of
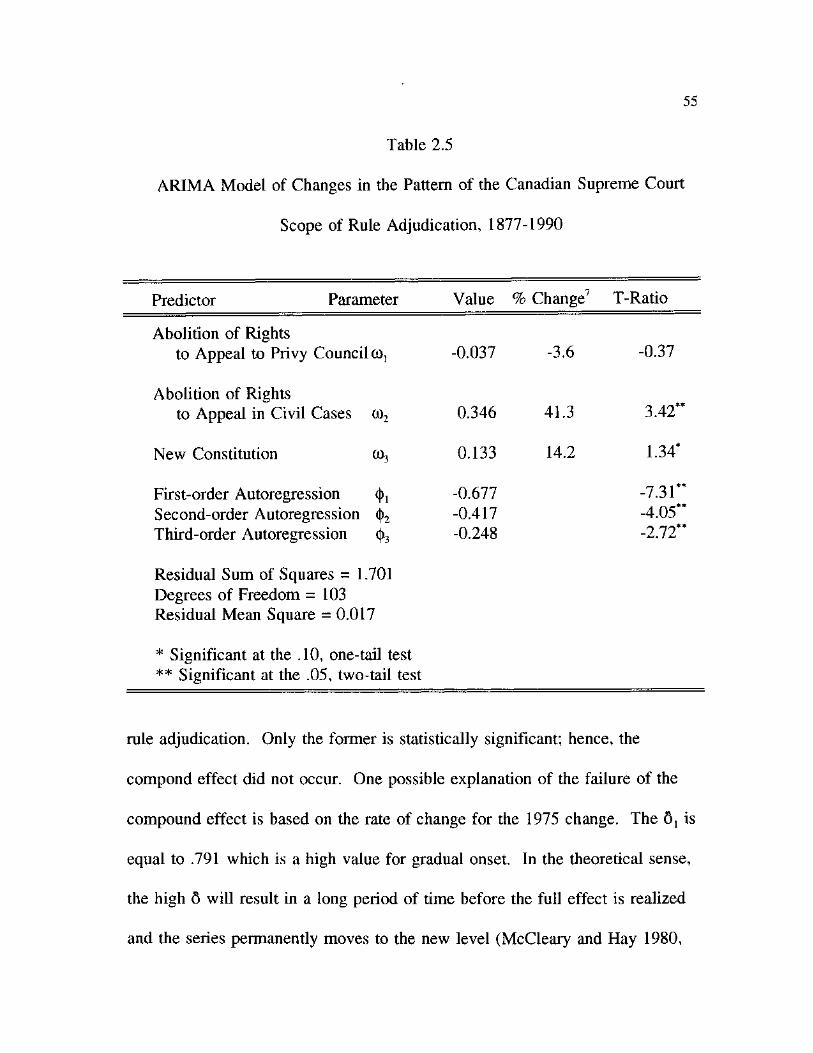
55
Table 2.5
ARIMA Model of Changes in the Pattern of the Canadian Supreme Court
Scope of Rule Adjudication, 1877-1990
Predictor Parameter Value % Change7 T-Ratio
Abolition of Rights to Appeal to Privy CouncilC0j -0.037 -3.6 -0.37
Abolition of Rights to Appeal in Civil Cases (02 0.346 41.3 3.42**
New Constitution co3 0.133 14.2 1.34*
First-order Autoregression (j)1 -0.677 -7.31** Second-order Autoregression (t>2 -0.417 -4.05 Third-order Autoregression (j)3 -0.248 -2.72**
Residual Sum of Squares = 1.701 Degrees of Freedom =103 Residual Mean Square = 0.017
* Significant at the .10, one-tail test ** Significant at the .05, two-tail test
rule adjudication. Only the former is statistically significant; hence, the
compond effect did not occur. One possible explanation of the failure of the
compound effect is based on the rate of change for the 1975 change. The is
equal to .791 which is a high value for gradual onset. In the theoretical sense,
the high 6 will result in a long period of time before the full effect is realized
and the series permanently moves to the new level (McCleary and Hay 1980,
56
157-59). Since there are only 5 periods that separate 1975 from 1982, it is
possible that the full impact was not yet realized before the new intervention
occurs. In another word, the event in 1975 and the event in 1982 are
statistically correlated to one another. In fact, McCleary and Hay, in their
example, show that it is possible that the mathematical results of a compound
effect and a long gradual effect are similar (1980, 189-90). The model
estimates that the abolition of the rights to appeal in civil cases has caused a
change in the percentage of public issues cases decided by the Court by 41.3%
per year.
Symbolically, the change in 1975 was the least important change of the
three changes because it did not alter the status of the Supeme Court as a
supeme, independent and constitutionally created institution in the country.
Operationally, however, it allows the Court to control the selection of cases it
wants to hear and decide. The analyses presented above suggest that the Court
has seized the moment and elevated itself to become an important political
institution whose behavior, through the decison in a case, will have an impact
on public policies in the country.
The dynamics of the Supreme Court's mix of rule adjudication are also
evident when one again examines change over time in the types of cases that
dominate the Court's reported decisions. Table 2.6 presents the ten most
frequendy raised issues in the decision-making of the Canadian Supreme Court
57
in the three different time periods: the period prior to the abolition of appeals to
the Privy Council (1875-1949), the period from then until the change in the
Court's jurisdiction in 1975, and, from 1975 to 1990.
It is clear from the table that the case mix of the Court changed
significantly from the first to the third period. In the first period, the Canadian
Supreme Court was dealing most frequently with private law matters. Private
law matters constituted 57.6% of all cases in this period, and the first three
types of private law cases heard (tort, contract, real property ) represent 23.7%
of all the cases in that period. In this period, there were only three types of
public law cases in the top ten, and constitutional cases were not among them:
Railways (ranked number 6), Municipality (ranked number 7), and Criminal
(ranked number 10). Together they constituted only 12% of all cases in this
period. This pattern changes somewhat in the second period as public law
matters (Criminal and Income Tax cases) share the top four spots with the
private law cases (Tort and Contract). The top two public law case categories
combined outnumber the top two private law categories combined, but not by
much (17.5% to 14.6%). Of the top ten categories in this period, five categories
were public law cases (Criminal, Income Tax, Municipality, Constitutional,
Labor) and 4 categories were private law (Tort, Contract, Real Property, Motor
Vehicle) with Procedure as the remaining category. In addition, the total
number of issues raised in this period was more evenly split between the two
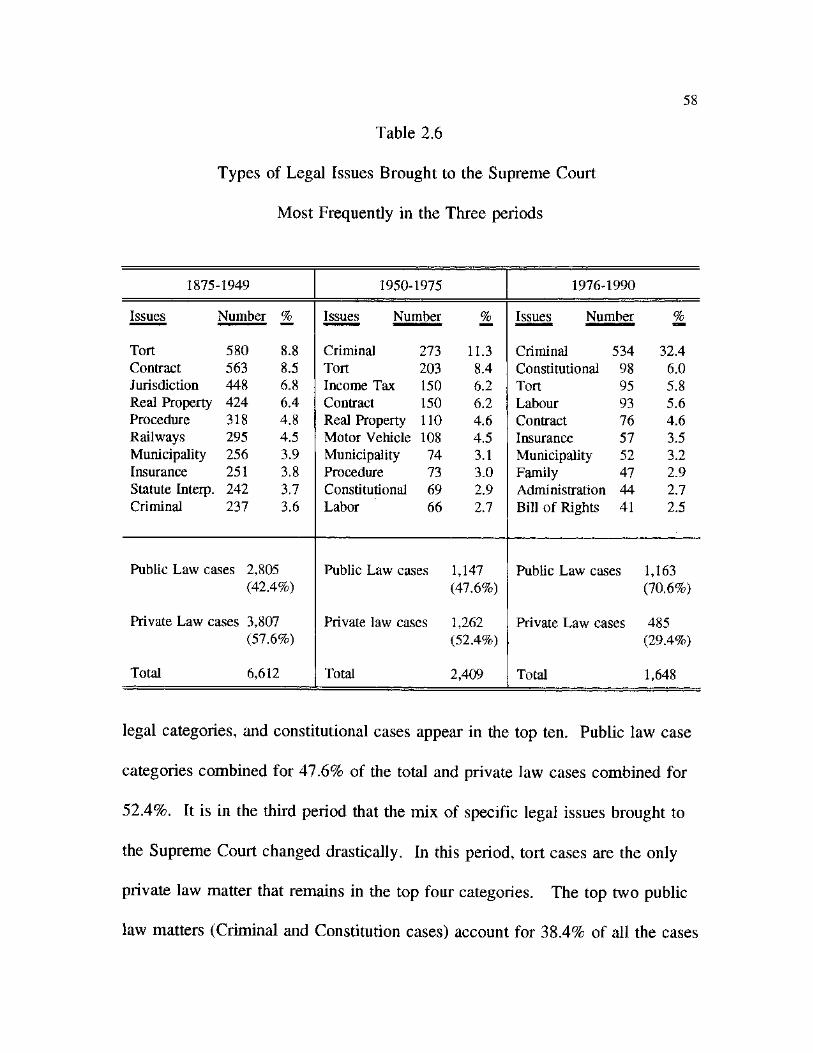
Table 2.6
Types of Legal Issues Brought to the Supreme Court
Most Frequently in the Three periods
58
1875-1949 1950-1975 1976-1990
Issues Number % Issues Number % Issues Number %
Tort 580 8.8 Criminal 273 11.3 Criminal 534 32.4 Contract 563 8.5 Tort 203 8.4 Constitutional 98 6.0 Jurisdiction 448 6.8 Income Tax 150 6.2 Tort 95 5.8 Real Property 424 6.4 Contract 150 6.2 Labour 93 5.6 Procedure 318 4.8 Real Property 110 4.6 Contract 76 4.6 Railways 295 4.5 Motor Vehicle 108 4.5 Insurance 57 3.5 Municipality 256 3.9 Municipality 74 3.1 Municipality 52 3.2 Insurance 251 3.8 Procedure 73 3.0 Family 47 2.9 Statute Interp. 242 3.7 Constitutional 69 2.9 Administration 44 2.7 Criminal 237 3.6 Labor 66 2.7 Bill of Rights 41 2.5
Public Law cases 2,805 Public Law cases 1,147 Public Law cases 1,163 (42.4%) (47.6%) (70.6%)
Private Law cases 3,807 Private law cases 1,262 Private Law cases 485 (57.6%) (52.4%) (29.4%)
Total 6,612 Total 2,409 Total 1,648
legal categories, and constitutional cases appear in the top ten. Public law case
categories combined for 47.6% of the total and private law cases combined for
52.4%. It is in the third period that the mix of specific legal issues brought to
the Supreme Court changed drastically. In this period, tort cases are the only
private law matter that remains in the top four categories. The top two public
law matters (Criminal and Constitution cases) account for 38.4% of all the cases
59
heard by the Court, and public law cases dominate the Court's workload: they
account for 70.6% of all cases heard in this period.
The shift from private to public law concerns becomes even more
prominent when we restrict our attention to cases that raised the most policy-
relevant public matters, constitutional or rights issues. The constitutional or
rights cases category groups together cases coded as having raised Aliens, Bill
of Rights, Civil Liberties, Constitution, Education, Criminal Law, Immigration,
Procedure, and Crown Rights issues. Table 2.7 presents the distribution of
public, private, and constitutional and rights cases by decade. The distribution
of constitutional/rights cases is plotted in Figure 2.6, and Figure 2.7 plotts the
annual number and percentages of constitutional/rights cases.
The graph in Figure 2.6 depicts the total number of constitutional and
rights case, on the left Y-axis (Total), and the percentages of public law cases
(% Public) and of all cases (% Total) on the right Y-axis. We can see clearly
from the table and the figure that the Court's scope of rule adjudication had
changed drastically from the beginning to the more recent years. In the early
period, the constitutional and rights cases were not very significant either in
number or percentage. However, their curves climb steadily and they become a
majority of public law decisions by the 1970s and the 1980s. In the 1980s, they
represented almost one-half of all decisions in the Canadian Supreme
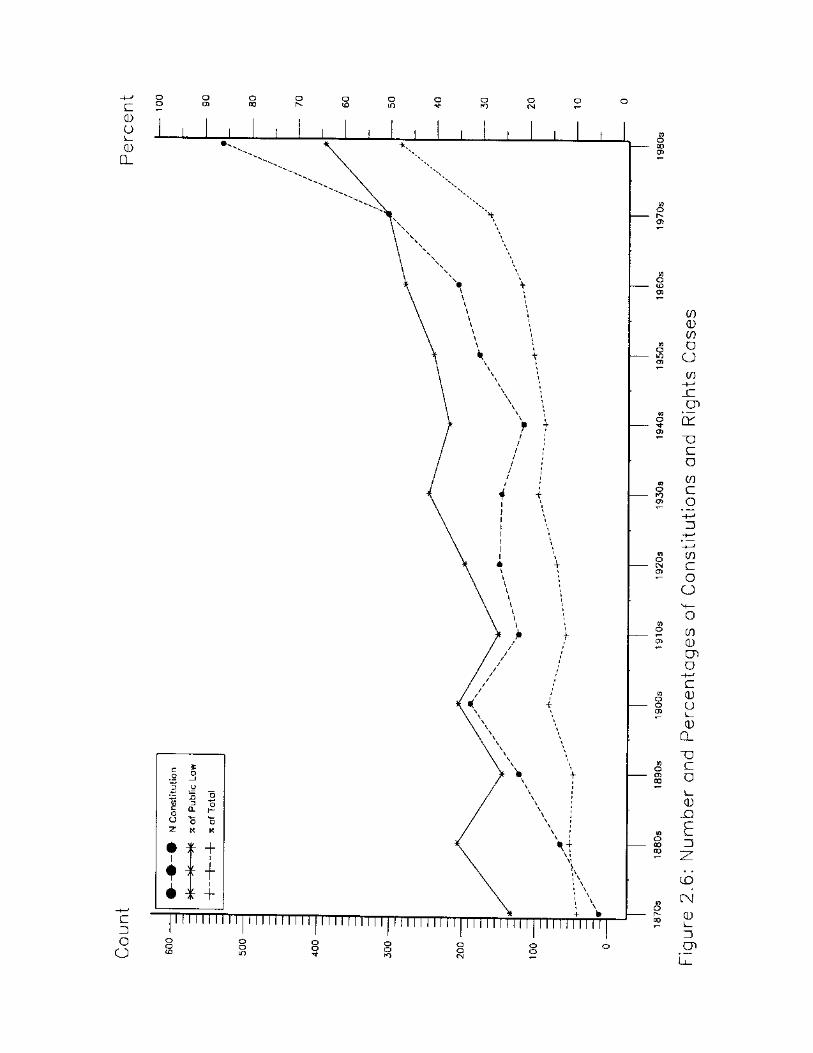
c CD Q ik_ 0
D_
o o o
00 o to o
in o tn
C Z5 O
o
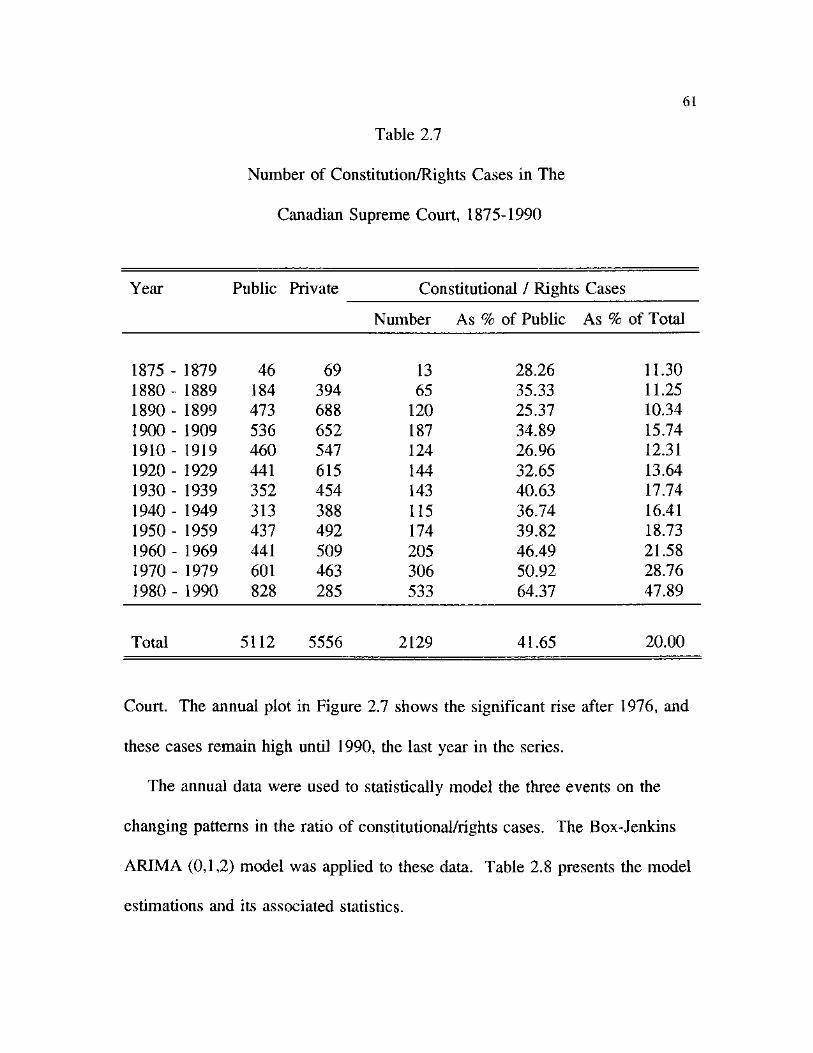
61
Table 2.7
Number of Constitution/Rights Cases in The
Canadian Supreme Court, 1875-1990
Year Public Private Constitutional / Rights Cases Year Public
Number As % of Public As % of Total
1875 - 1879 46 69 13 28.26 11.30 1880 - 1889 184 394 65 35.33 11.25 1890 - 1899 473 688 120 25.37 10.34 1900 - 1909 536 652 187 34.89 15.74 1910 - 1919 460 547 124 26.96 12.31 1920- 1929 441 615 144 32.65 13.64 1930 - 1939 352 454 143 40.63 17.74 1940 - 1949 313 388 115 36.74 16.41 1950 - 1959 437 492 174 39.82 18.73 1960 - 1969 441 509 205 46.49 21.58 1970 - 1979 601 463 306 50.92 28.76 1980 - 1990 828 285 533 64.37 47.89
Total 5112 5556 2129 41.65 20.00
Court. The annual plot in Figure 2.7 shows the significant rise after 1976, and
these cases remain high until 1990, the last year in the series.
The annual data were used to statistically model the three events on the
changing patterns in the ratio of constitutional/rights cases. The Box-Jenkins
ARIMA (0,1,2) model was applied to these data. Table 2.8 presents the model
estimations and its associated statistics.
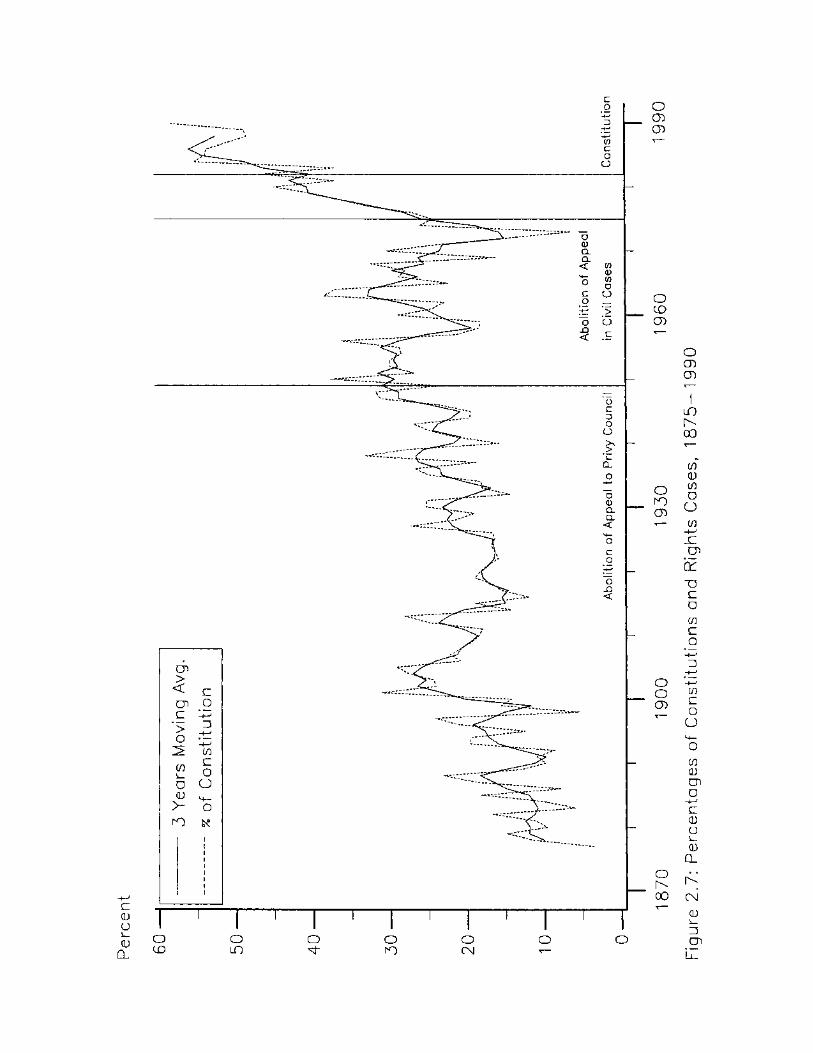
c CD O L -
CD CL
O CD cn
m
00
i f ) 0 (/) D O cn
jc g>
hi
"U c 0
01 c o
CO c o o H— o w 0 cn o c 0 o
0 CL
CN
0 L-D cn
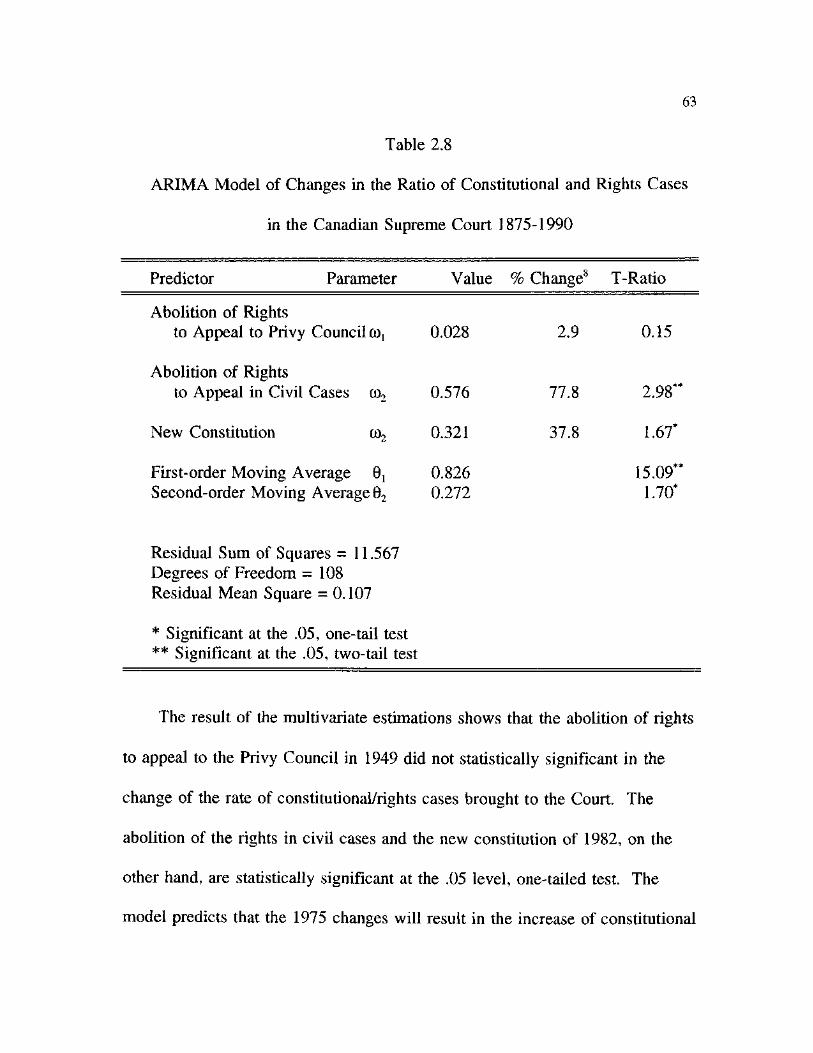
63
Table 2.8
ARIMA Model of Changes in the Ratio of Constitutional and Rights Cases
in the Canadian Supreme Court 1875-1990
Predictor Parameter Value % Change8 T-Ratio
Abolition of Rights to Appeal to Privy Council©! 0.028 2.9 0.15
Abolition of Rights to Appeal in Civil Cases od2 0.576 77.8 2.98**
New Constitution co2 0.321 37.8 1.67*
First-order Moving Average 0j 0.826 15.09** Second-order Moving Average 02 0.272 1.70*
Residual Sum of Squares = 11.567 Degrees of Freedom =108 Residual Mean Square = 0.107
* Significant at the .05, one-tail test ** Significant at the .05, two-tail test
The result of the multivariate estimations shows that the abolition of rights
to appeal to the Privy Council in 1949 did not statistically significant in the
change of the rate of constitutional/rights cases brought to the Court. The
abolition of the rights in civil cases and the new constitution of 1982, on the
other hand, are statistically significant at the .05 level, one-tailed test. The
model predicts that the 1975 changes will result in the increase of constitutional
64
and rights cases by 77.8%, and the new constitution resulted in the increase of
the rate by 37.8% . This is precisely shown in the graph. One can see that the
graph line shows a small rise, with some fluctuation in some years, but remains
stable from 1949 to 1975. The big increase in the ratio of constitutional and
rights cases came after the abolition of the rights to appeal in civil cases in 1975
and continue to rise after 1982.
The statistical insignificance of the abolition of rights to appeal to the
Privy Council in 1949 is interesting. As mentioned earlier, this change helped
the Canadian Supreme Court become the final appellate court in Canada, and
was suggested by Canadian Supreme Court scholars as a "crucial and necessary
first step toward the enhancement of the Supreme Court's political influence"
(Morton 1986, 6). The statistical findings in this study, however, fail to confirm
that conclusion.
The changing mix of cases heard by the Canadian Supreme Court from
the private law to the public law domain and the significant rise in the
constitutional and rights cases can be viewed as a shift in the role of the Court
in Canadian politics. Private law matters have limited public policy
consequence. Public law matters, on the other hand, have a significant impact
on the public policies of the country, especially when the cases involve
constitutions, civil rights, taxation, and criminal law. This study has
65
demonstrated that these cases are on the rise, while private law matters are on
the decline.
These changes in its rule adjudication document that the Canadian Supreme
Court has transformed itself (been transformed) from a traditional and "non-
political" judicial branch to a more politically-oriented and significant institution.
The above analysis allows one to assert that the contemporary Canadian
Supreme Court has come to play a significant role in shaping public policies in
Canadian society. The increase in the constitutional and rights cases brought to
the Supreme Court will undoubtedly keep the Supreme Court in the middle of
several public policy debates, and these constitutional and rights cases will have
a larger impact on the society than private or other public law matters cases.
Conflict in Decision Making
Previous sections focused on the work of the Canadian Supreme Court;
this section will present a different institutional behavior of the Court, conflict in
decision-making. Since the publication of Pritchett's The Roosevelt Court,
judicial politics scholars were directed to the study of conflict in decision-
making by focusing on the nonunanimous decisions rendered by the court.
Pritchett provided the reason for study the non-unanimous decision as:
A unanimous judicial decision throws little light upon . . . "deliberation in process." It tells nothing of the conflicts around the judicial conference table, the accommodations and the comprises that went into the final result. A unanimous opinion is a composite
66
and quasi-anonymous product, largely valueless for understanding the values and motivation of individual justices.
A nonunanimous opinion admits the public to the Supreme Court's inner sanctum. In such a case the process of deliberation has failed to produce a conclusion satisfactory to all participants. Having carried the argument as far as they usefully can, the justices find it necessary finally to take a vote, state and support the winning and losing positions, and place the arguments before the world for judgement. In informing the public of their decisions and their reasons, the justices also supply information about their attitudes and their values which is available in no other way (1946, xii).
The main theme in this section is to present an overall picture of the
conflict in decision-making of the Canadian Supreme Court. It will also try to
assess the impacts of the institutional change on these conflicts, and finally it
will present the factors that probably cause the rise or decline in such conflict.
Table 2.9 presents the annual number of cases reported and number of
nonunanimous decisions and their percentages; and Figure 2.7 presents the time
series plot of the percentages and the moving average trends.
Looking first at the percentage of the nonunanimous decision in the Court,
on the average, its percentages of nonunanimous decisions was 32.72% with the
high of 79.17% in 1882 and the low of 9.43% in 1937. The over time trend is
very striking. The plot shows a secular trend downward from the early period
to the latter with some cycles. The institutional changes in the Supreme Court
discussed earlier did not shows any impacts on these trends. In fact, a statistical
model for the time series with three interventions did not show any statistical
significance. Hence, these trends resulted from some other factors. Previous
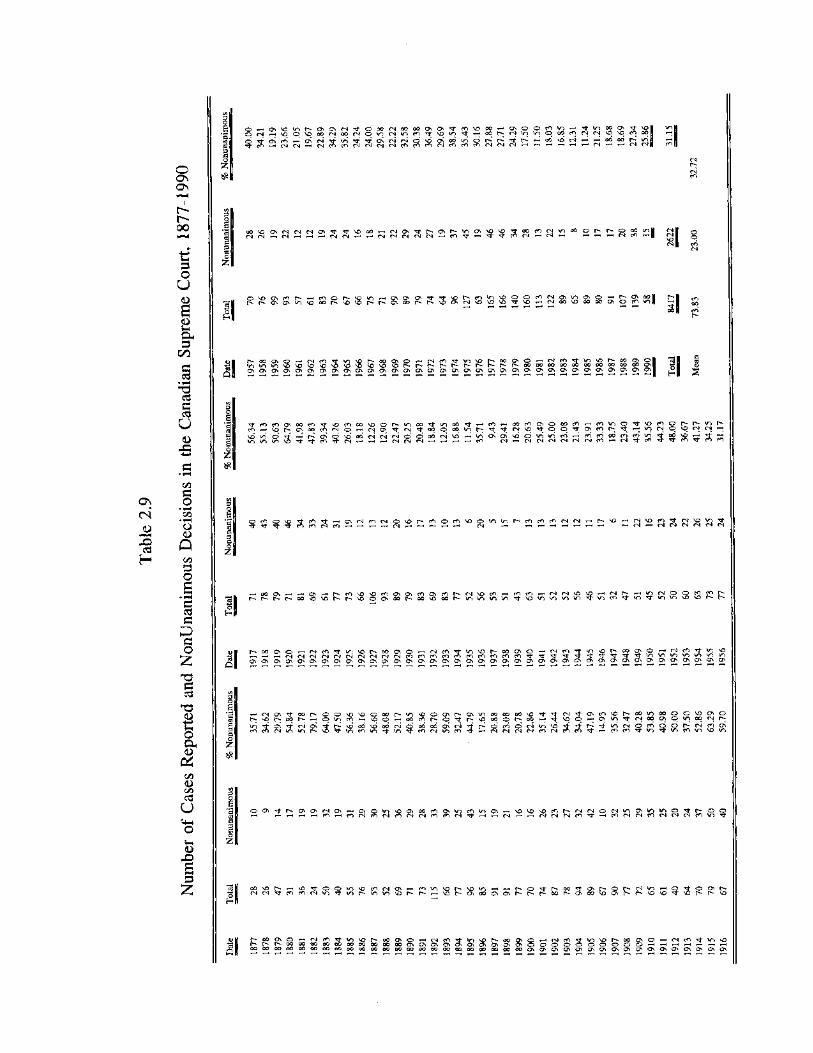
? £ c r i v o > o r - o * o \ c J i t o o o ( N o o o o o o N i - ( < i , o o o ^ a * o o ^ * o t - H T t - v i c o ( > H ^ o \ 0 0 0 N w r j O ^ w ^ ^ l ; ^ V ) T l ; H 0 0 [ « . N i o i o q 0 0 ( O ( N ( N ^ ^
^ r i ^ ^ VD 5 5 ? i c i d 9 IS ? i ?2 *2 2 ^ ^ ^ ^ ^ 0 0
rH O) (N CO <N <N CN <N CO (O SI si £ $
o o \ £ ) i J i M r ) N U ^ T | - ^ M r H ( N c ^ ' t h O \ l ^ * n o \ \ D ^ 3 I J O r f l f s ( , n i : 0 o ^ h O c o *nH ( V | ( S H C l H f H H ( N ( S H H f v i n W M M H ( f | ^ H t ^ ( ' l N H ( S H iH ^ (N (ft T-H ||
8 £ P 8
N 9 0 O > O H N ( f i r f ^ * 0 N 0 0 0 ^ O ' H t N ( < i ^ , V , ) ' O ( > > l » O * O H C > | ( n r f i n \ 0 t , , » 0 0 q ! O l n i / 1 > n ( O ^ O V 3 y 3 y ! l M 3 ^ 0 * 0 * O l O t v t s t , s h ^ { , s h t ^ ( v r , , O O f l O O O O O ( » ( l O O O O O C O O O C 3 \
Q H U1 U1 Ul O \ ( ^ O * O \ O i ( ^ C ^ o v o \ O N ^ O * O N ® O * ® O ^ O \ i III
z *
^ c i o o y o o h ^ o O T f i o o o r f H ^ i - i o o c o o o o o c o < — t c o v n o ^ f ^ o c o o r - i N q r t M C f t r f c s ' t o o q o o v j h ' t ^ N ' O ^ o o ^ o ^ ^ ^ ^ H V i q q ^ q 1
rt^c^Q^odwrjddd(«c,ivo'rH>nc^o\vdd>nintrHco^oci(<i(2(o3;Mio t cO ( N H N N t N M C l r J W r H N T t ' C O ' T ' t d
ON
( N
o
5 H
^ c s f T t t N i o ^ r * c o o f O v o o * o * n r - c n c o f O < N c N r - H r - ' 0 l » - l r - . r - l C N T - « T - H T - H r - . T - l CN r-H ^ ^ ^ r-> ,-, r-^ r-4
*-> C-1 CO Tf un MO . . CS <N D M (N (N
Q^OsOsO^GhO^GhO^GhOsChOhOh v , , . , ..., V. v . v... X-. , CO CO *3" Tt rf Tf TJ- T t ^ t O N O s c ^ i O N O N O v a N O N O i O N O N C ^ O N a N O N O s O N O s c ^ O N O O x c ^ c ^ c y i O N O s
o
GO <D CZ)
c t f u <4-<
o
<5 J O
a s r e o o r - o o v o v o h o o t ^ H O V i c n r t ON rf fN ON ^ tN V) *0 (— VD
o o r - * n v - o o o N t * - O N V ^ o o o o o o ' s D T f ' < : i -q ^ o o ^ h q ^ h v o o o o t ^ o o r - ^ v u y
^ M a o O N d o O ( » o i ( N r t ^ d ^ 6 N l n ^ t t . _ - - - • • - ^ F c n r s v - j c O T l - T - H C N c s e N C N i c n t N c o c o Tj- *n co v> •
t O N c o v o h o o i n o o i p i — l O N V o r t r J o o o N
vS CS Q CO CO ^ <
o *o vo CO CN CO
3 z r» o rf- r*~ 00 r - r - r-- 00 r -
11 r - O O O N O ' — ^ C N c O T t i r j V O O O O O x O — < CN CO ^ ( " " • ( N t ^ o o o o o o o o c o a w o o o o o o o ^ ^ ^ c c f * . . » , v , » . O O O O O O O O O O O O O O O O O O O O O O O O O O O O O O O O O O O O O O O O O O O O
ON ON ON ON ON r - . O O O N O ' - H C N c O T t V O V O
O O O N C R I O N O N C ^ O N O N O N O N O N O > O N O N O N O N C 7 > O N
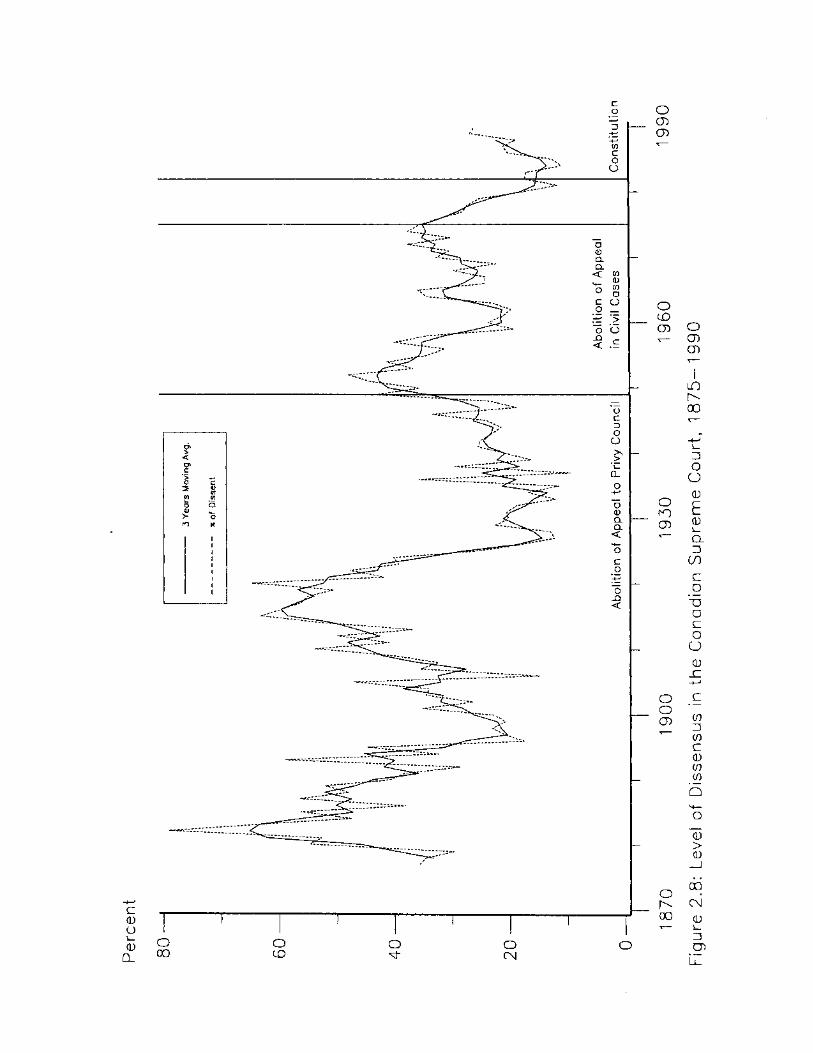
c 0 o !w_
0 a.
o cn CD
m r^ 00
D O O 0
E 0 Q. =3
00 C O
~o a c o O 0 _c
in D cn c 0 in cn Q M— o
"0 > 0
oo c\i 0 L_ D cn
Ll_
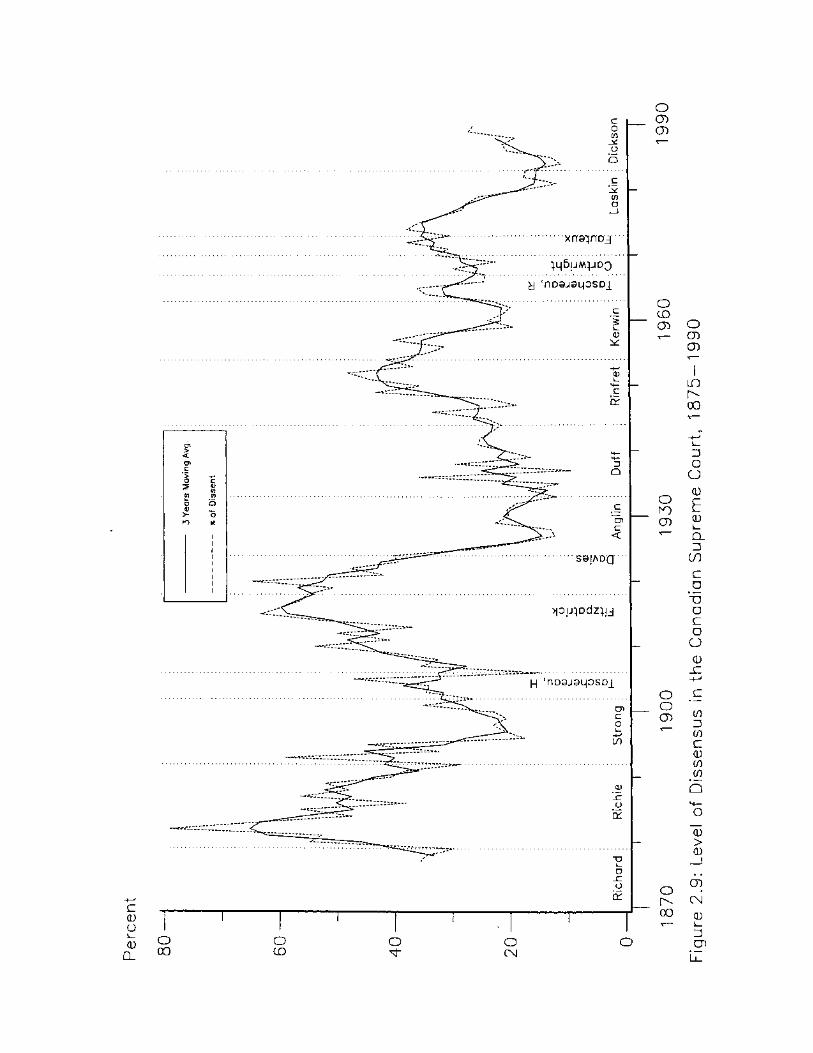
c 0 (J k_ 0 QL
Xn HDj
}i|6um}jdq y 4nD9J9LjDSD_[
S0IADQ
>pU}DCiZ}!J
H nD9J9LjOSDJ[
o CD CD
LO r 00
D o o 0
0 !w_ CL D
i f )
c o T3 O C O O 0 _C
en D in c 0 c/) en
o "0 > 0
co c\j 0 L_ D gi L.
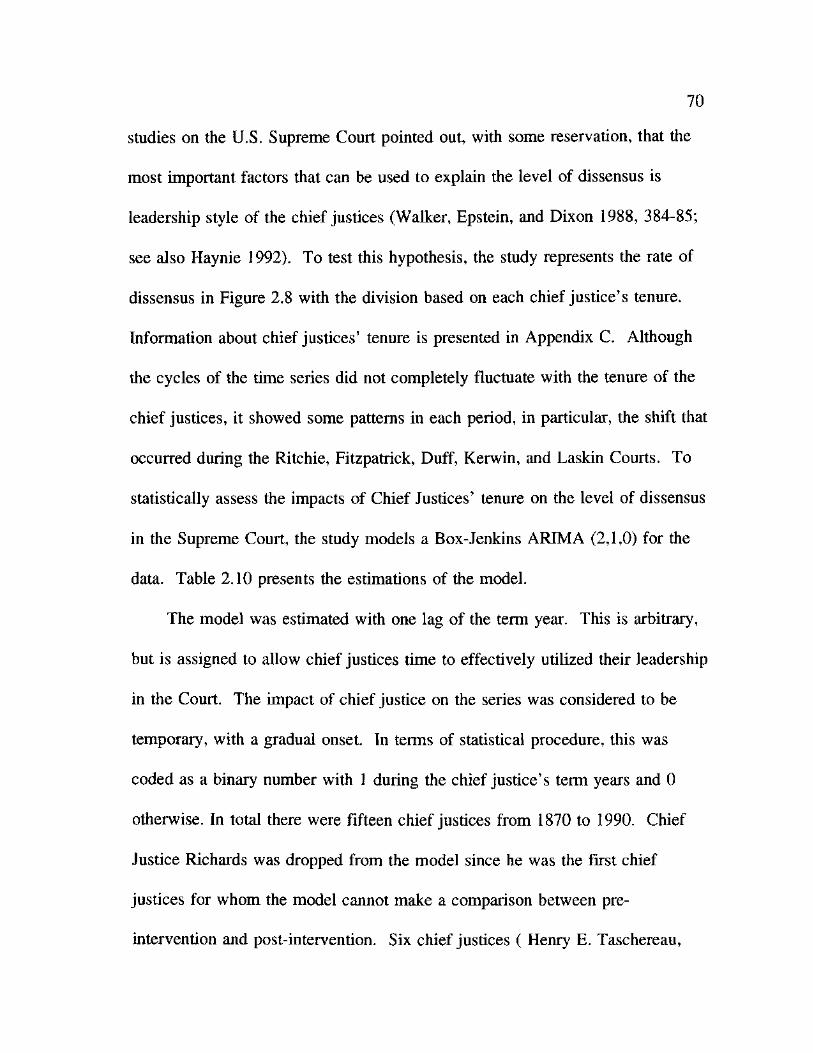
70
studies on the U.S. Supreme Court pointed out, with some reservation, that the
most important factors that can be used to explain the level of dissensus is
leadership style of the chief justices (Walker, Epstein, and Dixon 1988, 384-85;
see also Haynie 1992). To test this hypothesis, the study represents the rate of
dissensus in Figure 2.8 with the division based on each chief justice's tenure.
Information about chief justices' tenure is presented in Appendix C. Although
the cycles of the time series did not completely fluctuate with the tenure of the
chief justices, it showed some patterns in each period, in particular, the shift that
occurred during the Ritchie, Fitzpatrick, Duff, Kerwin, and Laskin Courts. To
statistically assess the impacts of Chief Justices' tenure on the level of dissensus
in the Supreme Court, the study models a Box-Jenkins ARIMA (2,1,0) for the
data. Table 2.10 presents the estimations of the model.
The model was estimated with one lag of the term year. This is arbitrary,
but is assigned to allow chief justices time to effectively utilized their leadership
in the Court. The impact of chief justice on the series was considered to be
temporary, with a gradual onset. In terms of statistical procedure, this was
coded as a binary number with 1 during the chief justice's term years and 0
otherwise. In total there were fifteen chief justices from 1870 to 1990. Chief
Justice Richards was dropped from the model since he was the first chief
justices for whom the model cannot make a comparison between pre-
intervention and post-intervention. Six chief justices ( Henry E. Taschereau,

71
Table 2.10
ARIMA Model For Leadership and Dissensus in the
Canadian Supreme Court, 1877 - 1990
Chief Justices Parameter Value % Change9 T-Ratio
Richie CO, 0.506 65.9 2.41* Strong (fl2 0.416 51.6 1.82* Fitzpatrick CO3 0.168 18.3 2.06* Anglin co4 0.141 15.1 0.74 Duff 0.428 53.4 3.06* Rinfret 0.116 12.3 1.24 Kerwin co7 -0.083 -8.1 -0.51 Laskin C0g -0.113 -10.7 -1.51** First-order Autoregression -0.465 -4.58* Second-order Autoregression 0 2 -0.241 -2.33*
Residual Sum of Squares = 8.531 Degrees of Freedom = 93 Residual Mean Square = 0.092
* Significant at the .05, one-tail test ** Significant at the .10, one-tail test.
Davies, Robert Taschereau, Cartwright, Fauteux, and Dickson) were excluded
because their tenures were too short.
The estimated model was very successful in accounting for the variations
in the series. Of all the chief justices included in the model, five chief justices
showed a statistical significance in the changing level of dissensus in the Court.
Richie (1879-1892), Strong (1892-1902), Fitzpatrick (1906-1918), and Duff
(1933-1944) were responsible for the increase in the dissensus rate during their
72
chief justice tenure. Chief Justice Laskin was the only chief justice who
demonstated the leadership in controlling and reducing the level of dissensus in
his Court.
The ability of Chief Justice Laskin to reduce dissensus in his Court is
rather interesting because Laskin dissented the most during his years as a junior
judge of the Supreme Court. His rate of dissensus as a junior judge was about
20% of all cases he participated in. This rate, however, dropped to about 8%
during his years as the chief justice.
The success of the initial model to explore the role of chief justices on the
level of dissensus in decision-making is impressive. Social behavior and
phenomena are rather more complex so that one cannot fully explain them using
a single factor alone. This is probably also the case of the level of dissensus in
the Canadian Supreme Court. Despite the success of the model, the study
acknowledges that there are other potential variables that also can account for
those variations. Indeed, Peterson has identified four general categories of
factors relating to probable causes of dissenting behaviors. These include factors
such as difficult question of law, size of caseload, court professional on
dissenting behavior, leadership, individual justices' ideology, etc. (1981, 424).
A full analysis on this subject, however, is beyond the scope of this study. A
more complete analysis will be persued in future research. At a minimum, the
exploratory work presented above serves as the initial empirical work toward a
73
better understanding of conflict in the decision making process of the Canadian
Supreme Court.
Policy Direction in Decision Making
To understand that the judicial system has impact on public policies in the
country is not sufficient. It is also important to understand how these policies
were impacted and in which direction they were changed. The direction of the
Court's decision-making reflects the substantive policy preferences of the
Court's majority, judged as pro or con on certain liberal interests. In the United
States in this century, the vast majority of the Supreme Court's decision now
fall into three substantive areas: civil liberties, economic interests, and fiscal
claims (see Pacelle 1992). According to Glendon Schubert, civil liberties cases
are those in which the primary issue "involves a conflict between personal rights
and claims to liberty and governmental authority," while economic interest cases
are those involving a conflict between "underprivileged economic interests as
against those of affluence and monopoly power." Finally, fiscal claims cases
are those that involve "monetary conflicts of interest between private individuals
and government" (Schubert 1962, 97-102).
Though Schubert's classifications were for the U.S. system, they are also
appropriate to Canada. Analogs of these decision categories account for the vast
majority of Canadian Supreme Court decisions from 1875-1990. In civil rights

74
and liberties cases, the primary issue involves claim to a particular right or
liberty that has been allegedly unjustly denied, ordinarily by the action of a
government at either the provincial or national levels. Despite the fact that the
Charter of Rights in Canada was not adopted until 1982, it is understood that
Canadians do have the basic rights and liberties that are common in democratic
societies. Those rights and liberties include the right to free speech, freedom of
religious belief and practices, freedom of the press, right to a fair trial, and
others. In fact, Russell points out that the Charter did not really create new
rights, but rather a new way of making decisions about rights in which the court
system plays a systematic and authoritative role (1982, 32).
The economics case type can be straightforwardly applied to the Canadian
system. It involves mainly civil suits among individuals, business or groups.
The issues in the conflicts involve private monetary disputes, torts, landlord-
tenant, labor-management disputes, worker compensation, individual properties,
sales of goods, contracts, insurance, banking, etc. The complete list of issues is
presented in the codebook (item number 7 and 8). It also includes cases
involving business regulation by the government. Finally, the fiscal claims
cases involve mainly taxation cases between government agencies and
individuals or business agencies.
Unfortunately, while Schubert's civil rights and liberties classifications are
simple and straightforward, and familiar to American students of judicial
75
politics, they are somewhat difficult to apply using the Peck and Russell dataset.
The information used to classify cases is coded as four variables that describe
the types of legal issues raised in a given case, and in a fifth variable that
identifies the "broad legal issue" raised in the case. The variables are numbers
7 to 12 in the codebook. For economic and fiscal claims cases, the Peck and
Russell data generally contain enough information to allow one reliably to
classify cases into the two categories. This was not the case in civil liberties
cases. The reason is that Peck and Russell did not classify their cases using
categories that can easily be matched with Schubert's categories of civil liberties
claims, and their data do not contain enough additional information to allow one
reliably to classify a given case into an appropriate civil liberties category.
While the categories used by Peck and Russell to code legal issues make it
difficult to code civil rights and liberties issues directly, they do not prevent this
study from classifing cases into one of the three following categories:
1. Individual claims against government in cases other than economic or
fiscal claims;
2. Economic claims cases; and
3. Fiscal claims cases.
The first category will consist of cases that have a private individual as one
party in the case and a government agency as the opposing party. The issues
involved in these cases are those coded by Peck and Russell as having raised
76
issues concerning aliens, the bill of rights, criminal law, constitution, civil
liberties, immigration, municipality, Crown rights, procedure, evidence, statute
interpretation, and conflict of law. Sample of these cases are presented in Table
2.11. For example, one case was assigned as an individual claim because the
legal issues raised in the case include criminal, evidence, and procedure, and the
broad legal categories involved in the case were constitution and federal statute
(see case number 1 in Table 2.11). Case number 9 was assigned as an
economic case because it raised the individual property issue and involved
commercial law. Finally, case number 16 was classified as a fiscal claims case
because it involved taxation and federal statute.
Based on the information coded in the Appelant (item 13), the Respondent
(item 14), and the Disposition of Appeal (item 5), each case can be classified as
having liberal or conservative outcome. The liberal outcome cases are those
where the Court decided in favor of the individual in individual claims cases.
In economic claims cases, the Court majority favored the interest of the
"underprivileged." For example, they are the cases where the Court favored
private individual against corporation, labor over management, tenant in
landlord-tenant cases, debtor in debt collection cases, etc. It also includes pro
government outcomes in business regulation cases. In the fiscal claims cases,
the liberal outcomes are those cases where the court decided in favor of the
government. The conservative outcome will be the opposite.10

77
Table 2.11
Sample Re-Coding of Peck-Russell Data into the Three Categories
Peck-Russell Issues Coded in the Data
Legal Issue coded in Item 7
Legal Issue coded in Item 8
Legal Issue Legal Issue Broad Legal coded in Item 9 coded in Item 10 Categories coded
Individual Claims Cases:
1. Criminal
2. Criminal
3. Constitution
4. Constitution
5. Immigration 6. Civil Liberty
7. Municipality
Evidence Procedure
Procedure Aliens
B. of Rights
Aliens Criminal
Civil Liberty
Jurisdiction
Motor Veh.
Constitution and Federal Statute Federal Statute Constitution and Federal Statute Constitution and Federal Statute Federal Statute Constitution and Federal Statute Civil Code and Provincial Statute
Economic Cases:
8. Real Property 9. Statute Interpret. Ind. Property 10. Railways Tort 11.
12.
13. Labor 14. Utilities 15.
Landlord-Tenant
Insurance
Tort Contract Contract
Procedure Banking
Contract
Real Property
Fraud
Debtor-Creditor
Commercial Law Commercial Law Federal Statute Federal Statute and Commercial Law Prov. Statute and Commercial Law Civil Code Civil Code Federal Statute and Commercial Law
Fiscal Claims Cases:
16. Income Tax 17. Excise Tax Sales
18. Municipality Tax 19. Jurisdiction 20. Utilities Real Properties
21. Jurisdiction Real Properties 22. Municipality Tax
Jurisdiction Crown Rights
Banking Tax, Other Municipality Tax
Excise Tax Sales
Procedure
Federal Statute Federal Statute and Provincial Statute Provincial Statute Federal Statute Provincial Statute and Civil Code Provincial Statute Provincial Statute
78
By analyzing the outcome of the cases, we can determine the policy
preferences of the Supreme Court. As the Supreme Court's reported cases can
be both unanimous and nonunanimous decisions, looking at the conflict in their
decision-making will help in understanding the magnitude of their policy
preferences and the role of each individual judge in determining the outcome of
the decision. One can assume that judges who cast the dissenting vote in a case
have strong opinions on the subject that they are willing to let be known.
Hence a look at the presence or absence of a nonunanimous decision in the
court's work will shed some light on the direction of its policy preferences. The
study will analyze unanimous decisions toghether with nonunanimous decisions.
It is more useful to base the analyses on "natural court," or a Court of constant
membership, rather than on the year to avoid overly small numbers of case
types in each year and because the changes in the Supreme Court personnel
composition can be used as possible explanations of shifts in case outcomes.
The setting of the Court agenda—the selection of cases for decision—is an
interaction process between two major actors: "organized group litigants and the
justice" (Pacelle 1992, 36). A particular cases or class of cases selected by the
Court for judgment does not entirely depend on the litigants to bring cases to
the Supreme Court, but also on the desire of justices to influence a particular
issue or set a particular public policy agenda. In fact, Supreme Court justices
can influence the type of litigant that will be brought to the Court by their
79
consistency in refusing to hear a particular type of case. For these reasons, the
natural court unit is appropriate.
A natural court is defined as a court of constant membership, i.e., one in
which no new justice is appointed (see Schubert [1974] for the first known
example). They are useful analytical units because they change with personnel
changes and, thus, allow one to decipher behavior patterns that may be due to
personnel adjustments. This study could not, however, use the strict definition
of natural court. In addition to the above definition, it also required a natural
court to cover a minimum of two years. The additional requirement is useful
since it allows us to be able to analyze more cases during the periods where
there was a high turnover of judges on the Supreme Court. Appendix B
presents the classification of each natural court with the names of the justices
who served in a particular court.
The study divided the Canadian Supreme Court from 1877 to 1990 into 27
different natural courts. Table 2.12 presents the annual distribution of each
case type and Table 2.13 presents the data based on natural court. The annual
percentages of each case type are plotted in Figure 2.10.
In total, there were 1,625 cases (19.31%) classified as individual claims
against government (ICLAIM); 5,558 cases (66.03%) classified as economic
claims (ECON); 810 cases (9.62%) classified as fiscal claims (FISCAL); and
424 cases (5.04%) not classified. As expected, the mix of types of cases that
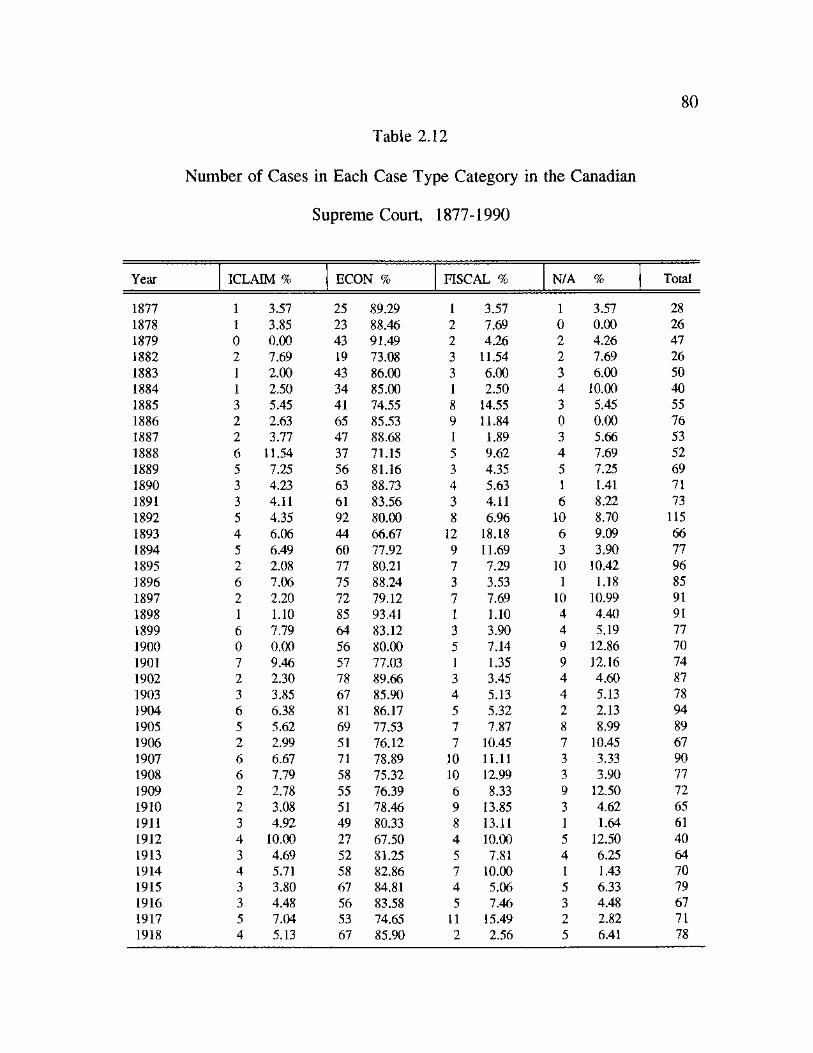
Table 2.12
Number of Cases in Each Case Type Category in the Canadian
Supreme Court, 1877-1990
80
Year ICLAIM % ECON % FISCAL % N/A % Total
1877 1 3.57 25 89.29 1 3.57 1 3.57 28 1878 1 3.85 23 88.46 2 7.69 0 0.00 26 1879 0 0.00 43 91.49 2 4.26 2 4.26 47 1882 2 7.69 19 73.08 3 11.54 2 7.69 26 1883 1 2.00 43 86.00 3 6.00 3 6.00 50 1884 1 2.50 34 85.00 1 2.50 4 10.00 40 1885 3 5.45 41 74.55 8 14.55 3 5.45 55 1886 2 2.63 65 85.53 9 11.84 0 0.00 76 1887 2 3.77 47 88.68 1 1.89 3 5.66 53 1888 6 11.54 37 71.15 5 9.62 4 7.69 52 1889 5 7.25 56 81.16 3 4.35 5 7.25 69 1890 3 4.23 63 88.73 4 5.63 1 1.41 71 1891 3 4.11 61 83.56 3 4.11 6 8.22 73 1892 5 4.35 92 80.00 8 6.96 10 8.70 115 1893 4 6.06 44 66.67 12 18.18 6 9.09 66 1894 5 6.49 60 77.92 9 11.69 3 3.90 77 1895 2 2.08 77 80.21 7 7.29 10 10.42 96 1896 6 7.06 75 88.24 3 3.53 1 1.18 85 1897 2 2.20 72 79.12 7 7.69 10 10.99 91 1898 1 1.10 85 93.41 1 1.10 4 4.40 91 1899 6 7.79 64 83.12 3 3.90 4 5.19 77 1900 0 0.00 56 80.00 5 7.14 9 12.86 70 1901 7 9.46 57 77.03 1 1.35 9 12.16 74 1902 2 2.30 78 89.66 3 3.45 4 4.60 87 1903 3 3.85 67 85.90 4 5.13 4 5.13 78 1904 6 6.38 81 86.17 5 5.32 2 2.13 94 1905 5 5.62 69 77.53 7 7.87 8 8.99 89 1906 2 2.99 51 76.12 7 10.45 7 10.45 67 1907 6 6.67 71 78.89 10 11.11 3 3.33 90 1908 6 7.79 58 75.32 10 12.99 3 3.90 77 1909 2 2.78 55 76.39 6 8.33 9 12.50 72 1910 2 3.08 51 78.46 9 13.85 3 4.62 65 1911 3 4.92 49 80.33 8 13.11 1 1.64 61 1912 4 10.00 27 67.50 4 10.00 5 12.50 40 1913 3 4.69 52 81.25 5 7.81 4 6.25 64 1914 4 5.71 58 82.86 7 10.00 1 1.43 70 1915 3 3.80 67 84.81 4 5.06 5 6.33 79 1916 3 4.48 56 83.58 5 7.46 3 4.48 67 1917 5 7.04 53 74.65 11 15.49 2 2.82 71 1918 4 5.13 67 85.90 2 2.56 5 6.41 78

Table 2.12 (Continued)
81
Year ICLAIM % ECON % FISCAL % N/A % Total
1919 6 7.59 64 81.01 1 8.86 2 2.53 79 1920 8 11.27 59 83.10 4 5.63 0 0.00 71 1921 7 8.64 68 83.95 3 3.70 3 3.70 81 1922 6 8.70 47 68.12 12 17.39 4 5.80 69 1923 5 8.20 48 78.69 4 6.56 4 6.56 61 1924 3 3.90 61 79.22 12 15.58 1 1.30 77 1925 2 2.74 60 82.19 8 10.96 3 4.11 73 1926 8 12.12 48 72.73 9 13.64 1 1.52 66 1927 13 12.26 74 69.81 14 13.21 5 4.72 106 1928 14 15.05 65 69.89 9 9.68 5 5.38 93 1929 6 6.74 62 69.66 13 14.61 8 8.99 89 1930 8 10.13 51 64.56 15 18.99 5 6.33 79 1931 16 19.28 53 63.86 12 14.46 2 2.41 83 1932 8 11.59 43 62.32 10 14.49 8 11.59 69 1933 7 8.43 57 68.67 13 15.66 6 7.23 83 1934 7 9.09 53 68.83 13 16.88 4 5.19 77 1935 11 21.15 30 57.69 7 13.46 4 7.69 52 1936 7 12.50 40 71.43 6 10.71 3 5.36 56 1937 6 11.32 39 73.58 3 5.66 5 9.43 53 1938 8 15.69 38 74.51 5 9.80 0 0.00 51 1939 5 11.63 25 58.14 8 18.60 5 11.63 43 1940 6 9.52 49 77.78 7 11.11 1 1.59 63 1941 7 13.73 41 80.39 1 1.96 2 3.92 51 1942 6 11.54 32 61.54 10 19.23 4 7.69 52 1943 5 9.62 39 75.00 7 13.46 1 1.92 52 1944 7 12.50 33 58.93 9 16.07 7 12.50 56 1945 5 10.87 33 71.74 5 10.87 3 6.52 46 1946 8 15.69 26 50.98 13 25.49 4 7.84 51 1947 8 25.00 20 62.50 2 6.25 2 6.25 32 1948 12 25.53 22 46.81 13 27.66 0 0.00 47 1949 7 13.73 30 58.82 10 19.61 4 7.84 51 1950 8 17.78 22 48.89 10 22.22 5 11.11 45 1951 11 21.15 31 59.62 7 13.46 3 5.77 52 1952 11 22.00 27 54.00 8 16.00 4 8.00 50 1953 13 21.67 40 66.67 6 10.00 1 1.67 60 1954 11 17.46 42 66.67 8 12.70 2 3.17 63 1955 15 20.55 38 52.05 18 24.66 2 2.74 73 1956 20 25.97 46 59.74 9 11.69 2 2.60 77 1957 6 8.57 46 65.71 11 15.71 7 10.00 70 1958 8 10.53 48 63.16 19 25.00 1 1.32 76 1959 11 11.11 65 65.66 20 20.20 3 3.03 99 1960 17 18.28 57 61.29 19 20.43 0 0.00 93 1961 7 12.28 39 68.42 6 10.53 5 8.77 57 1962 10 16.39 42 68.85 7 11.48 2 3.28 61 1963 18 21.69 54 65.06 11 13.25 0 0.00 83 1964 17 24.29 43 61.43 7 10.00 3 4.29 70
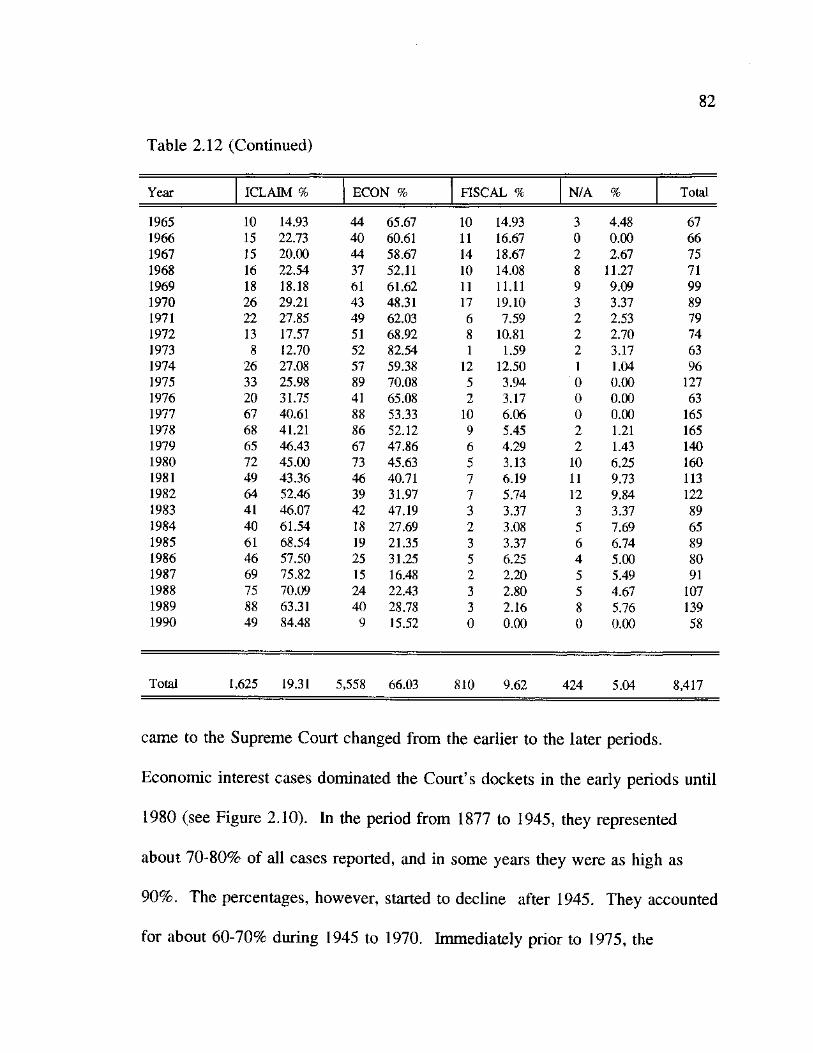
82
Table 2.12 (Continued)
Year ICLAIM % ECON % FISCAL % N/A % Total
1965 10 14.93 44 65.67 10 14.93 3 4.48 67 1966 15 22.73 40 60.61 11 16.67 0 0.00 66 1967 15 20.00 44 58.67 14 18.67 2 2.67 75 1968 16 22.54 37 52.11 10 14.08 8 11.27 71 1969 18 18.18 61 61.62 11 11.11 9 9.09 99 1970 26 29.21 43 48.31 17 19.10 3 3.37 89 1971 22 27.85 49 62.03 6 7.59 2 2.53 79 1972 13 17.57 51 68.92 8 10.81 2 2.70 74 1973 8 12.70 52 82.54 1 1.59 2 3.17 63 1974 26 27.08 57 59.38 12 12.50 1 1.04 96 1975 33 25.98 89 70.08 5 3.94 0 0.00 127 1976 20 31.75 41 65.08 2 3.17 0 0.00 63 1977 67 40.61 88 53.33 10 6.06 0 0.00 165 1978 68 41.21 86 52.12 9 5.45 2 1.21 165 1979 65 46.43 67 47.86 6 4.29 2 1.43 140 1980 72 45.00 73 45.63 5 3.13 10 6.25 160 1981 49 43.36 46 40.71 7 6.19 11 9.73 113 1982 64 52.46 39 31.97 7 5.74 12 9.84 122 1983 41 46.07 42 47.19 3 3.37 3 3.37 89 1984 40 61.54 18 27.69 2 3.08 5 7.69 65 1985 61 68.54 19 21.35 3 3.37 6 6.74 89 1986 46 57.50 25 31.25 5 6.25 4 5.00 80 1987 69 75.82 15 16.48 2 2.20 5 5.49 91 1988 75 70.09 24 22.43 3 2.80 5 4.67 107 1989 88 63.31 40 28.78 3 2.16 8 5.76 139 1990 49 84.48 9 15.52 0 0.00 0 0.00 58
Total 1,625 19.31 5,558 66.03 810 9.62 424 5.04 8,417
came to the Supreme Court changed from the earlier to the later periods.
Economic interest cases dominated the Court's dockets in the early periods until
1980 (see Figure 2.10). In the period from 1877 to 1945, they represented
about 70-80% of all cases reported, and in some years they were as high as
90%. The percentages, however, started to decline after 1945. They accounted
for about 60-70% during 1945 to 1970. Immediately prior to 1975, the
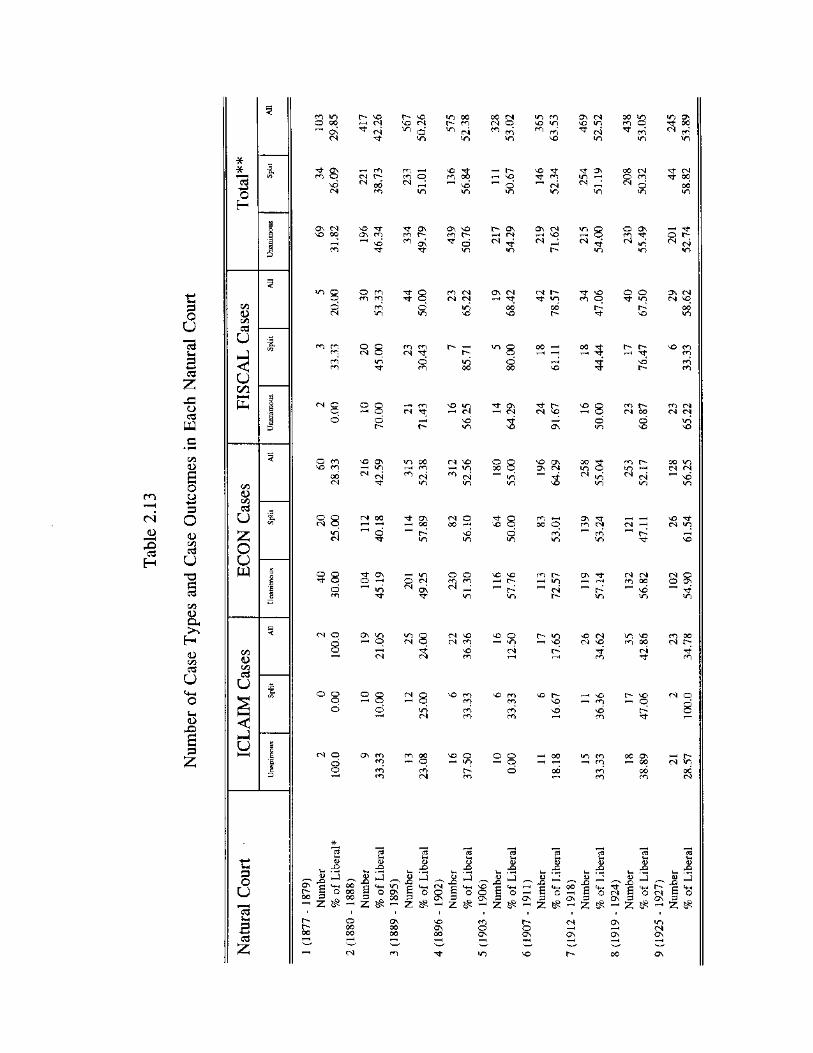
O N < N
t > s o CM S O ( N
^ o m
« n o o
O c o
^ c 4 IT)
0 0 CM CM O ^ c o
i n
m e n s o * n
O N < N s o m
^ d m
o o i n
c o o
^ c o
m
s
* *
o H
T f O N c o ©
^ CO CM R -< N ^
c o r n c o o CM * \6
m O i n
s o T f
T f c o
^ CM » n
Tj- O s
i n
0 0 C M O C O 5 CM
00 00 i n
o \ < N s o 00
S O Tfr O N C O
TF ON c o r -
O N S O c o r -
^ o
» n
T— ON r-H CM
^ T f V )
O N C M S O
< N S 8 « n
O ON c o <<t ^ u S
i n
© ? < N ^
i n
t i & o
u
I z x :
o
c d
w
C/J
< D <Z3
c d
u
u
cn E
8 O C O C O C O
o C M
"3" C O CM CM CM
O i n
C O C O CM T f
o C O
o t >
a s o i n
O N C M ^-i T t
00 s o
o 00
O N r-4 < N
CM R -T t i n
o o t >
r -CM S O
3
T f s o C O O
2 5
9
2 8 o i n
o o tj- i n
c o r -CM 0 0
ON < N CM s o
S O C O C O
CO CM CM CM
m
r-H
r 4
JS •§ H
c «
1 B
p O
<t> c o a U
C O
< u £ H
<D c 3
u
S3 "I 3 z
O C O S O C O
C/5
< D
c o
C 3
u z o u
w
C O
< D C O
c d u
< - J
u
o C M
a
o
o C O
o
o
o
o o o
s o O N r-t m
t ?
ON » n t-H ©
i n o o r-H <T)
r o ^
i n
r » m
O < N CM
3
C M S O r-H V )
^ r i i n
o 00
s o ON ON CM
o o 3 t m O
< N 00
s o m
o o C O C O < N *
< N S O ( N C O
S O C O
SO O t-H i n
C O
"<t S O
o i n
i > m
s o o r-. i n
S O C O c o
C O C O
o o r-H O
o
C O 00
C M »
S O r -S O
00
00
O N Tl"
i n
s o < N c m s q
C O
C O
S O
C O
c o r -
i n
CM C M C O 0 0
^ s o i n
m s o C O o o
5
SO i n
S O "<fr CM * n
CM o
> n
C O 0 0 CM t > ^r
c o
o
o
o
r-* tr-CM IN
s
ti 3
O
U
I
/—N r> *—•1
ON RJ <4-I ^ S o
2 £ sfc
r -i > o o
o JD o o rt 4 H
o o S o
^ 5 5 ^
o 00 00
V VH .-a « J
O N 00 00
<4-H <N| "rt
O o g
^ 2 s o O N 00
i—] FS *-•*
"cd
S3 S3 & X)
M XA
WH -O o Xa 4>
X) r-v <L>
X) , s s o O a
<+-( o i—i a
<+H o
00 B <4-H O ON 3
$ ON a ON 53
S
ON 2 $ Z 2 S
CO l > CM ON o o T H ON ON ON ON
v—4 H f-H r H •s^ N— IN s o I > 00
C3
M
z &
at I 3
r - a C M g o
I
» n CM ON
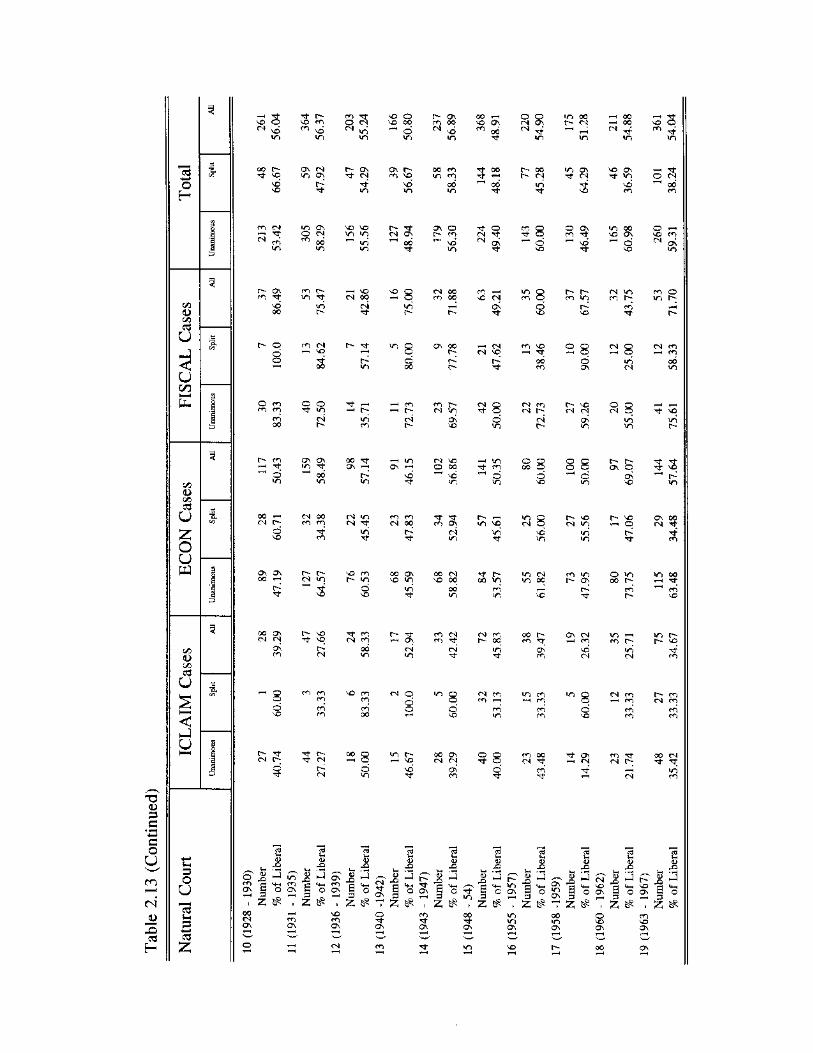
- a o 5* a
a o U
co
C 4
JH
H
3
Tota
l 1
1
O> O C/5 CD
u
3
O> O C/5 CD
u % V3
< u CO E
u
D
YJ O
CZ) C3
u
YJ O
CZ) C3
u % 00
z o u UJ
z o u UJ
Una
nim
ous
A> C/J
u
3
A> C/J
u 2
S
3 I—I
U HH
Una
nim
ous
+->
o o U
•a 3 S3
Z
3 3 <N ^
m
oo r»
vo vo
co <N
<N ^
R- ON co rt
t- o o o
O CO co co
o >n
oo FN
ON ON 00 rH
5
00 ON <N <N
ON co
8
C ~ TF <N R-
TF F-VO co ^ KO
m
ON TS UN ON
T?
IT) ON O <N «*
co IN
co (N i-l vo
o o *3- IN
<N J>
00 in
(N OO co co
co
R- F-CN IN
3
O VO TF VO
5
CO TF O CN <N ^
J> ON TT <N
m
\o \o in m
IN V)
f-« vo (N 00
9
00 Tt ON RH
<N M (N RT
T?
vo co IN
TT co (N EN
vo co RO
o in
<S> CO CS
-> ^ FN A o ON A
£ t£ , £ l£ 00 <N ON
AJ
J CO r* *+H ON G o 1—1 3 ^
. £ ^ VO CO ON
vo o vo 00 ^ o
IN
ON R-CO NO
t** <N ON ^ 00
TF*
in r^
R- ON CO 00
*n
00 CO m co
<N l>
VO
CO CO <N 00
RH ON <N IN
<N o o o
vo RT*
00 m
ON O T> CO
<N 00 CO 00
^ s ON 3 T £ §
ON
00 rH vo ON
^ 3
5 2 ^ 00
^t
* 3 CN <N
<N VO O OO T"H vo
IN
CO ON <si «n
oo <N VO 00
CO (N CO
9
00 ON CN <N
§
rH <N
<N MS
T?
<N
O in
o IN
!>• t-h
in vq
t?
T}- T-oo m
<N CO l> 00
»n
(SI CO CO RH
o
13 13 G O>
1 J!
X> A> r£i
O ON A 3
*0
-54; A O
I -54;
O O <N ON
M
OO (N
O vo
M co
CO VO r-H Tf
<N CO (N R-
(N O
o OO
o vo
vo IN
m <N in oo
00 CO
CD
j 3 i ° Z T£
»n oo O <N
in ON <N
CO 00 CN| T}-
s
O ON CO ^ vo
TJ-
R- I> co in
o ON
r- vo <N (N
o o
r- vo cs <n
co in R- ON
5
ON CS RH CO
VO <N
O vo
ON rH <N
S^ l A
ON P
9 ON
00
ON
m IN ON
00 m ON
vo ON Tt wo
VO CO
uo oo vo ON ^ O
VO
<N m co r-
CO
o <N
in IN
R- R-ON O
!> VO rH O
o «n OO T~-
V0 rH co r-
a
(N CO RH CO
o VO C\
VO S
in
00 CO
O rH VO CO <N
CO O M I>
(SI CO rH CO
00 in
rf vq in
5 s IN
ON 00 (SI
CO
in oo rH Tt
M R-R- VQ
co
r- co <N co
00 <N RF TT;
IN co
VO ON
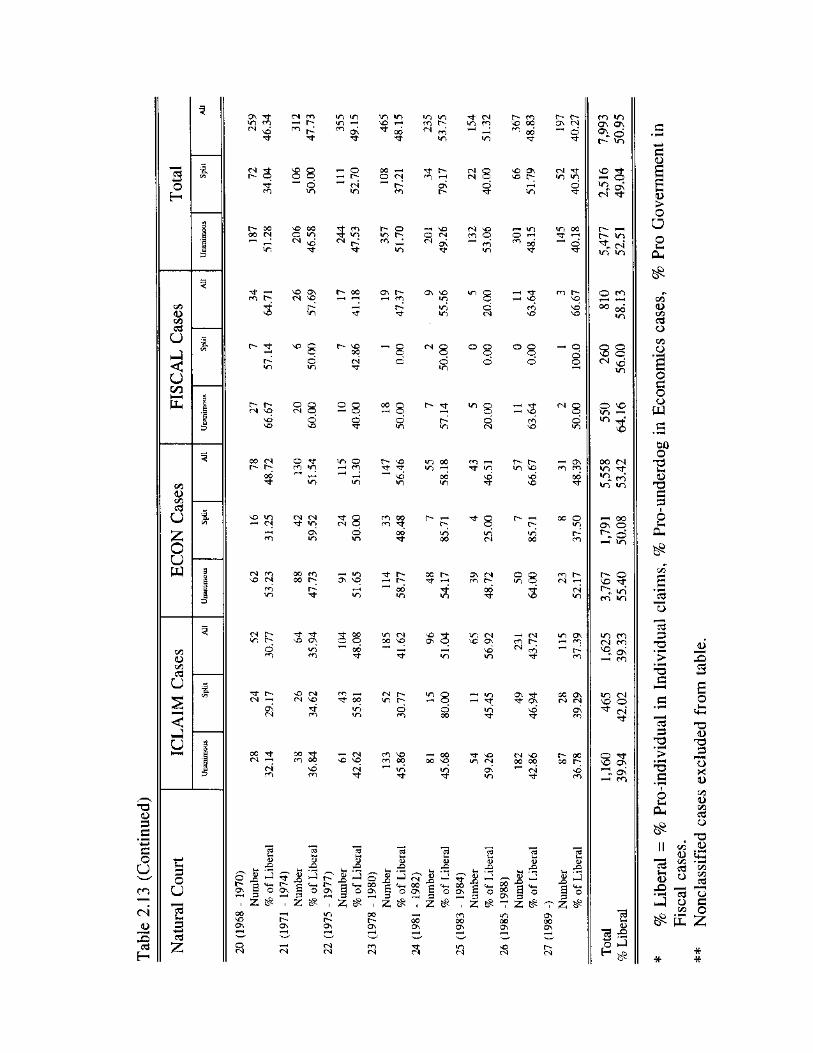
T 3 <D 53 a « a o O
c o ¥•*4
< N
J£ 3
H
s O
H
C/5 O CZ) ctf
u
J <
u C O H H
b
%
7i
oa <D C/3 Ctf
u
5 5
O
U W
<Z5 <D CO cd
o
< l-J
u
Tt
Vh
0
u
1 3
1
z
ON Tf <N CO in m in m »n in <n co t> in so T—< CO r-<N so CO CO ON Tt 00 <N CO
Tt Tt Tt m
72
s so o 8
o 00 o
rH <N 3
4
t -
*~H o oi ON CO in m CO l>
i> 00 00 CO r- o SO 00 <N °, in in »n o <N r-' -H <N SO* CN i> CO rH <N ON
in Tt Tt m Tt
r—t so ON » 00 ON t - ON SO CO r - «N SO T—4 rH rH CO in
r-H in so in Tt Tt in
r- Tt
i> i> (N
00 <N r-
00 Tt
SO m rH <N
<N
<N t> m r-
Tt r-<N T-H
<N co
o IT)
o <N
O SO
00 CO
l> ON
00 SO ON
a
J Q 4> H™1 XT o **-< ^ a o o\ g
$$ *7 55
i> OS
Tt CN m co
CN <N
<N SO CO O
i> co SO 00 ^ 00
Tt
so o\ SO C-
<—• *n O ^ 00
Tt
s
<N <N Tt in
ON in
Tt Tt so ON
so <M <N so
Tt CO
co
o <N
o o o
o Tt
o *n
i> Tt
o o o o
3 3 o in
o <N
Tt <N
O in
co oo co Tt
oo Tt a
00 CO r-H in Tt r-00 ON SO i>
CO T-H 00 in Tt in m
s in CM 00 so
oo r-
Tt H
Tt m
SO ^ On O
ON (N m t>
o in
$ 3
m <N SO ON
co oo
9
<N in
o co
co so co oo T-"1 in
Tt
o 00
H 00 00
Tt SO m cs
ON m
rH <N co i>
" 9
ON Tt Tt ON
SO Tt
<N so 00 00
9
2
S 3 ,£> ^ a 3
03
I
O
_ J
a o in !> ON
<N <N
s
2 3 O , 2;
00 t> ON
« J S |
x>
J 53
d s •§
° o\ g ^ 7 £
CO 00 ON
0) XI
J <+H o
cfl a>
^ <3> So -g oo a ON J3
in oo ON
ON (N
CN Tt in m
m oo Tt T-4
o Tt in O r- SO in 00 CO t- r- rH ON CO •n rH CO Tt Tt in i-H Tt wo in vo CO CO
^4 T_4 SO 00 SO so 00 in m in in Tt ^o Tt
oo o m
CO
CO » CM r-H
m on rH CO
CO
00 ON O* CN
l> 00 00 o
ON 00 ON
s a
m *n ON Q\ °\ o o» in
so
CS T^-
m t-
<N in m
o rH oo
S 8 ^ so
*n
O vo *n V*
oo <N in Tf
in »n
-h oo ON O
r- o Tf
in m CN CO
^ ON T-h co
*n <N \£> O ^ CN
^t
O Tf SO ON ^ ON f-H m
1 o
r-"
C
i
I > O
a
o VH
Ph
c/) <D C/3 «3 O
W5 o
o c o o
W
bD 0
' S «D
T 3 a 53 1
2 OH
&
a * a f—M
o
1 3 53 • 4
a
0
"I
1
<+H
«D
O
<D
<D
C/3
O
. T 3 C/3 2^ O I m CO * rH
M ^ £2 S " §
JD I—( »—H J g §
^ E Z
* •fc
fi^S 53
T 5
T 3 C • H I o u
Q«
H
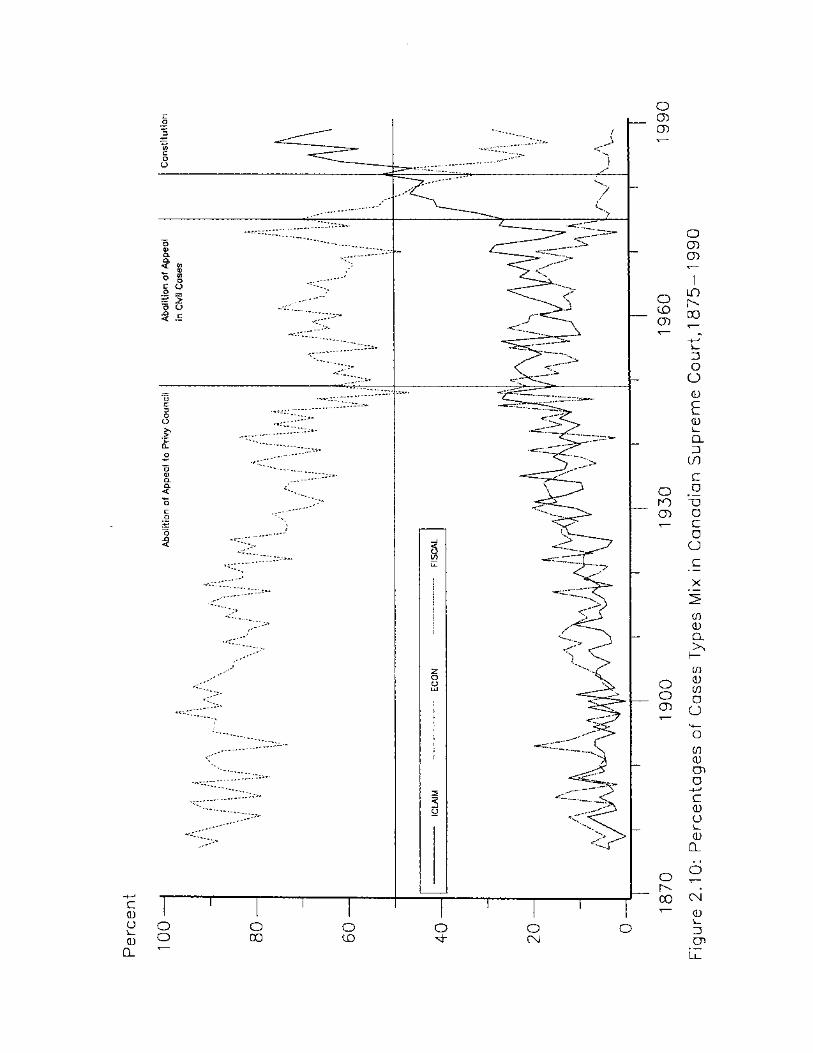
c 0 o
0 Q_
00 CN
87
economic cases again showed another rise. The abolition of the rights to appeal
in civil cases not only helped shift the balance between public law and private
law, but it also helped to shift the case type mix as well. After 1975,economic
cases dropped drastically from about 70% of the case mix to 15% in 1990.
On the reverse path, individual claims cases rose from unimportant in the
Supreme Court's agenda to a majority of cases at the end of the 1980s. From
1877 to 1920, they represented less than 10% of the mix. The initial increase in
individual claims cases occurred in the late 1920s when they consistently
accounted for about 10-20% annually. After 1945, the individual claims cases
again moved up to a new plateau, constituted more than 20% and remained at
this level until 1975. In the post-1975 period, they showed a drastic rise and
eventually surpassed economic cases as the number one case type in 1980.
They became a majority of the Supreme Court agenda in 1982 when they
accounted for more than 50% for the first time in Supreme Court history. With
a single decline in 1983, individual claims cases accounted more than 50% of
the case mix, and have shown a steady rise throughout the 1980s and into the
1990s. They represented about 84% of the cases mixed in 1990.
Initially, fiscal claims cases showed the same pattern as individual claims
cases, and were not a significant part of the case type mix. From the beginning
until 1970, they represented about 10-20% of the case mix. After 1970,
however, they took a different turn. While the individual claims cases soared to
88
a new level, fiscal claims cases showed a steady decline, and eventually lost
their share in the Supreme Court's agenda. Since 1975, they have accounted for
less than 10% of the case mix. The Supreme Court heard only 3 cases in 1988
and 1989 and the Court did not report any fiscal claims cases in the first volume
of 1990.
In terms of the policy preferences of the Supreme Court, Table 2.13 also
presents the percentages of liberal outcome in each category for unanimous,
nonumanimous, and all decisions. Figure 2.11 presents each natural court's
overall liberalism, and Figure 2.12 to Figure 2.14 plots the percentage liberal in
unanimous and nonunanimous decisions in each case type category.
Looking first at the overall percent liberal column, we see that the Court
overall was neither liberal nor conservative. The mean liberalism score is
50.95%. Individual natural courts, however, show substantial differences in
scores. Natural court 1 (1875-1879), 2 (1880-1888), 15 (1948-1954), 20 (1968-
1970), 21 (1971-1974), 22 (1975-1977), 23 (1978-1980), 26 (1985-1988), and
27 (1989-) showed liberalism scores of less than 50%, ranging from 29.85% for
Court 1 through 49.15% for Court 22. The remaining natural court showed
scores higher than 50%, with natural court 6 (1907-1911) showing the highest
liberalism score of 63.53%. Each natural court, except natural court 6 (1907-
1911), natural court 17 (1958-1959), and natural court 22 (1975-1977), showed
a similar pattern in their level of liberalism between unanimous and
nonunanimous decisions. Their respective scores fall within one standard
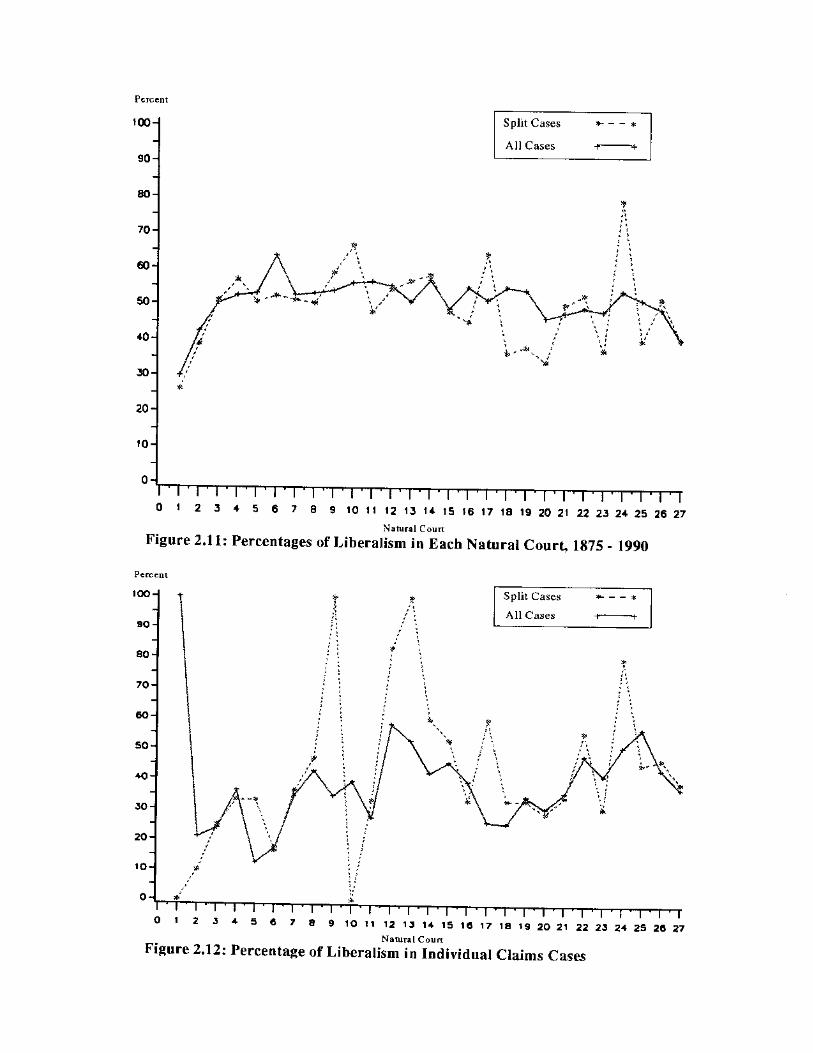
Percent
100-
90-
80
70
60
50
40 H
30
20 H
10
0-
Split Cases #-
All Cases -r-
*
- +
' • i l l i ' i ' i ' i ' i ' i ' i ' i 1 1 1 1 1 1 • i • i • i • i • i • i ' i • i • i • i • i • i 0 1 2 3 4 5 6 7 8 9 1 0 1 1 1 2 1 3 1 4 1 5 1 6 1 7 1 8 1 9 20 2 1 2 2 23 24 25 26 27
Natural Court
Figure 2.11: Percentages of Liberalism in Each Natural Court, 1875 - 1990
Percent
100- Split Cases
All Cases
i i i ' i • i i 11 • i • i • i i 11 * i * i * i * i * i * i * i * i • i 4- 5 6 7 8 9 10 11 12 13 14 15 10 17 18 19 2 0 21 22 23 24 2 5 2 6 27
Natural Court
Figure 2.12: Percentage of Liberalism in Individual Claims Cases
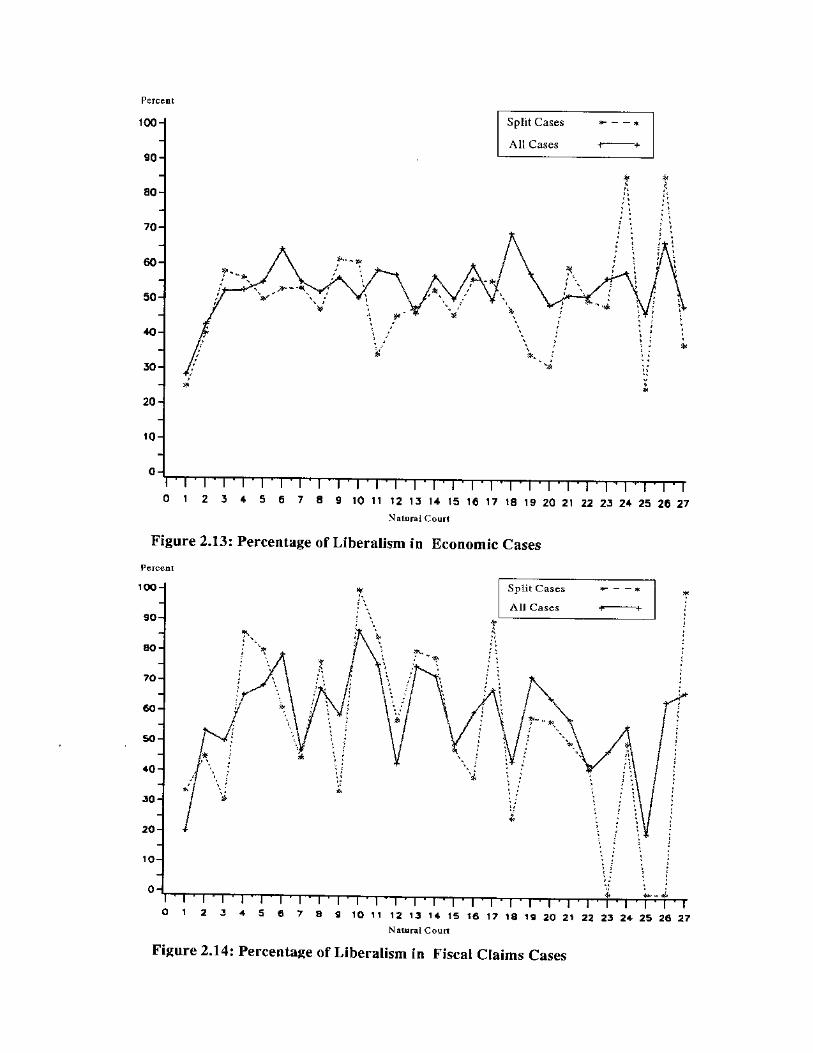
Percent
1 0 0 -
9 0 -
8 0 -
70 -
6 0 -
5 0 -
40 -
30 -
2 0 -
10
0
Split Cases * *
All Cases -f
i • i i i i • i ' i ' i ' i • i • i • i 1 1 • i • i i • i • i • i • i • i • i • i • o 1 2 3 4 5 6 7 8 9 10 11 12 13 14 15 16 17 18 19 20 21 22
Natural Court
Figure 2.13: Percentage of Liberalism in Economic Cases
Percent
100-|
90-
8 0 -
70
60-
50-
40
30-
2 0 -
1 0 -
0-
r r i 23 24 25 26 27
Spl i t C a s e s
TT - 4 -^ <<*> I ' I ' I ' I 1 I 23 24 25 26 27
1 ' 1 " 1 ' ' I I ' I I I ' I ' I ' I ' 1 ' I ' I ' I ' I ' | ' | ' | 0 1 2 3 4 5 6 7 8 9 10 11 12 13 14 15 16 17 18 19 20 21 22
Natural Court
Figure 2.14: Percentage of Liberalism in Fiscal Claims Cases

91
deviation. Natural Court 6's liberal score in unanimous decisions was 71.6%
compared to 52.3% for nonunanimous decisions. Natural court 17's scores were
46.5% and 64.3%, and natural court 24's scores were 49.3% and 79.2%,
respectively.
There are two possible explanations in these differences. First, they could
be the result of a large number of controversial cases. Second, they could be
the result of a difference in level of cohesion in the two opposing blocs, where
members in one bloc have a tendency to vote together more than another bloc
whose members were loosely united together. It is difficult to confirm the first
proposition unless one carefully analyzes the cases decided by the Court. The
test of the second proposition is the subject in Chapter Three.
Liberalism in the Canadian Supreme Court also differs across types of
cases. Figure 2.11 plots the liberalism scores in the three categories for each
natural court. In the individual claims cases, only four courts (natural court 1
was excluded since it has only two cases in this category) showed a liberalism
score above 50%: natural court 12 (1936-1939) with a score of 58.33%; natural
court 13 (1948-1954) with a score of 52.94%; natural court 24 (1981-1882) with
a score of 51.04%; and natural court 25 (1983-1984) with a score of 56.92%.
The mean score for individual claims liberalism is 39.33% . The difference
between this mean and a hypothesized "balance" mean of 50% is statistically
significant at the .05 level (the t-value is -5.54 with a one tail p-value of .000).

92
Their conservatism in individual claims cases was evident especially during
the early period. From 1875 to 1911, they favored individual claims only about
25% of the time. In the twentieth century, however, they were more
sympathetic toward individual as four of the six highest scores belong to natural
courts after 1949, especially toward the end of Chief Justice Laskin's tenure.
The trend, however, was somewhat reversed in the Dickson Court, as the last
two natural courts' liberalism in individual claims cases scores are 43.7% and
37.4%, respectively.
While the Court is more conservative in individual claims cases, its
majority favored liberal interests in economic claims cases. The mean
liberalism is 53.43% and is statistically significant different from the "balanced"
mean of 50% (the t-value is 2.25 with a one tail p-value of .015).
With the exception of the first two natural courts, natural court 25 (1983-
1984), and natural court 27 (1989 -), the Canadian Supreme Court favored the
economic "underdog," with natural court 18 (1960-1962) as a champion with the
liberal score of 69.1%. Despite Justices Cannon's assertion of legal positivism
(see Chapter One), the Supreme Court was instumental in opposing the
government in government regulation cases. The natural court whose time
coincided with the Canadian New Deal in the 1930s and 1940s was liberal
economically but decided in favor of business more than 50 percent during this
period.
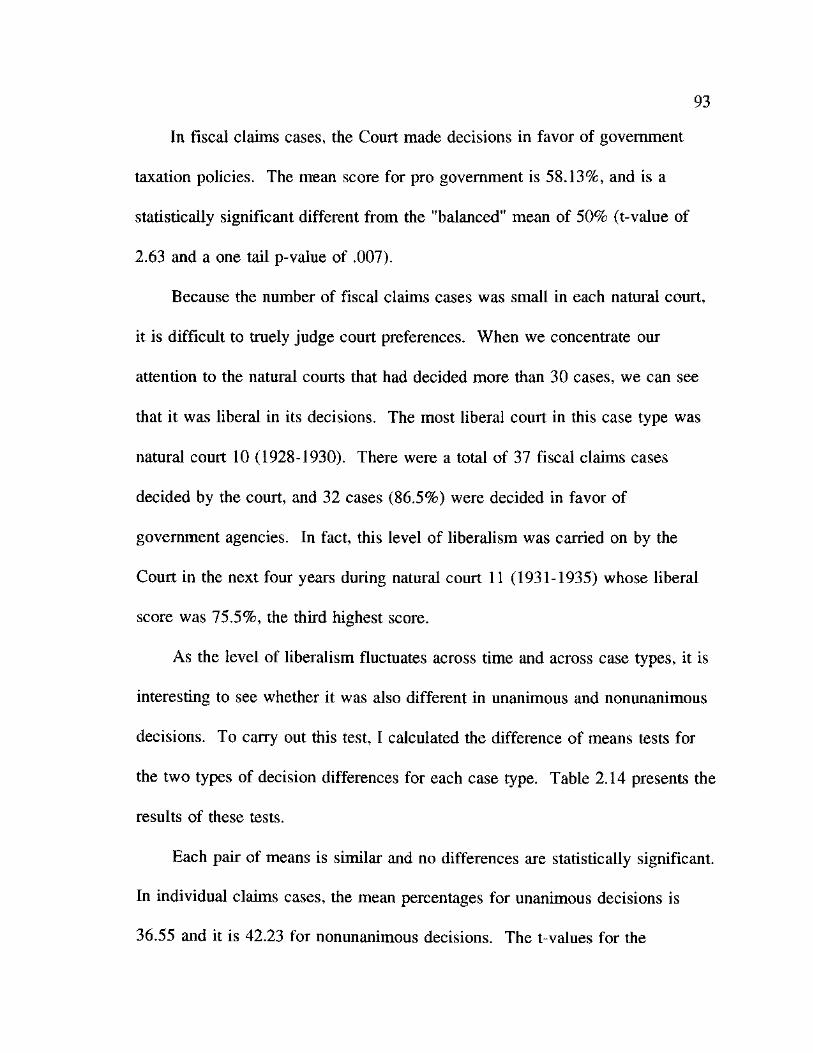
93
In fiscal claims cases, the Court made decisions in favor of government
taxation policies. The mean score for pro government is 58.13%, and is a
statistically significant different from the "balanced" mean of 50% (t-value of
2.63 and a one tail p-value of .007).
Because the number of fiscal claims cases was small in each natural court,
it is difficult to truely judge court preferences. When we concentrate our
attention to the natural courts that had decided more than 30 cases, we can see
that it was liberal in its decisions. The most liberal court in this case type was
natural court 10 (1928-1930). There were a total of 37 fiscal claims cases
decided by the court, and 32 cases (86.5%) were decided in favor of
government agencies. In fact, this level of liberalism was carried on by the
Court in the next four years during natural court 11 (1931-1935) whose liberal
score was 75.5%, the third highest score.
As the level of liberalism fluctuates across time and across case types, it is
interesting to see whether it was also different in unanimous and nonunanimous
decisions. To carry out this test, I calculated the difference of means tests for
the two types of decision differences for each case type. Table 2.14 presents the
results of these tests.
Each pair of means is similar and no differences are statistically significant.
In individual claims cases, the mean percentages for unanimous decisions is
36.55 and it is 42.23 for nonunanimous decisions. The t-values for the
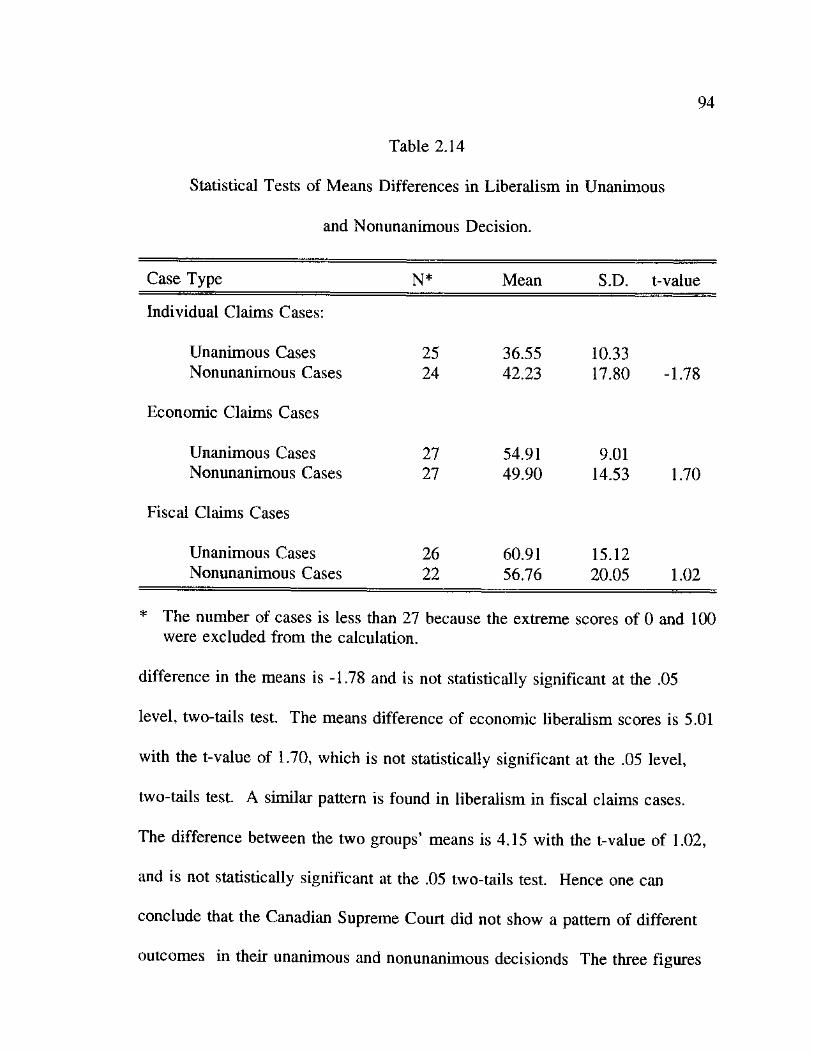
94
Table 2.14
Statistical Tests of Means Differences in Liberalism in Unanimous
and Nonunanimous Decision.
Case Type N* Mean S.D. t-value
Individual Claims Cases:
Unanimous Cases 25 36.55 10.33 Nonunanimous Cases 24 42.23 17.80 -1.78
Economic Claims Cases
Unanimous Cases 27 54.91 9.01 Nonunanimous Cases 27 49.90 14.53 1.70
Fiscal Claims Cases
Unanimous Cases 26 60.91 15.12 Nonunanimous Cases 22 56.76 20.05 1.02
* The number of cases is less than 27 because the extreme scores of 0 and 100 were excluded from the calculation.
difference in the means is -1.78 and is not statistically significant at the .05
level, two-tails test. The means difference of economic liberalism scores is 5.01
with the t-value of 1.70, which is not statistically significant at the .05 level,
two-tails test. A similar pattern is found in liberalism in fiscal claims cases.
The difference between the two groups' means is 4.15 with the t-value of 1.02,
and is not statistically significant at the .05 two-tails test. Hence one can
conclude that the Canadian Supreme Court did not show a pattern of different
outcomes in their unanimous and nonunanimous decisionds The three figures

95
also confirm this conclusion. Although the graphs are not identical, they are
quite similar in shape.11
The comparison is important to the study because it will serve as a basis
for an argument for using only nonunanimous decision in the analyses that will
be presented in the next two chapters.
The successful role of the chief justices and the institutional changes
proved to be a useful in explaining the changes in other aspects of Canadian
Supreme Court decision making. However, they failed to account for the
changes in the direction of the Supreme Court's policy. The intervention
models developed for both factors did not show any statistical significance.
Hence, the fluctuations that occurred in the Court's direction of decision making
resulted from some other factor. One such factor may be ideology. This
ideology, which was balanced overall, differs according to both over time and
with case type. While explanations for these patterns were not actively sought,
it appears likely that the patterns may be due to changes in the Court's
memberships over time.
If personnel changes are the principal explanation for these institutional
changes, it is possible that such significant personnel changes will show up in
the new formation of judicial voting coalition which in turn may increase or
decrease conflict in decision making and change the typical substantive outcome
for certain types of cases. This will be the subject of the next chapter.
96
Endnotes
1. In the Canadian system, references refer to litigation brought to the Supreme Court for opinion and decision in an area involving the Constitution and federal-provincial relationships. References can be referred to the Supreme Court only by the federal government and the Parliament, and need not involve a concrete case or controversy.
2. According to Black's Law Dictionary. Ejusdem generis means of the same kind, class, or nature. In the construction of laws, wills and other instruments, the "ejusdem generis rule" is that where general words follow an enumeration of persons or things, by words of a particular and specific meaning, such general words are not to be construed in their widest extent, but are to be held as applying only to persons or things of the same general kind or class as those specifically mentioned. The rule, however, does not necessarily require that the general provision be limited in its scope to the identical things specifically named. Nor does it apply when the context manifests a contrary intention.
3. British Columbia is often separated from the other western or "prairie" provinces. In this study, however, British Columbia was included in the western provinces in Figure 2.2 for the sake of clarity of presentation. The trend for British Columbia, shown in Figure 2.2, parallels that for all the western provinces combined.
4. The number of issues raised in the cases is greater than 8,417 because there are cases which were coded as having raised more than one issue.
5. The ARIMA (3,1,0) model refers to three different parameters which need to be specified before the model can be analysed. In the Box-Jenkins ARIMA tradition they are denoted as (p,d,q). The p parameter refers to the order of autoregression (AR). In the autoregressive process each value in the time series is a linear function of the preceding value or values. In the first-order regressive process only the single preceding value is used, and in the second-order process two preceding values are used, and so on. The d parameter refers to the number of differencing of the series so that the series are stationary, i.e., the trend or cycle in the time series is removed. The q parameters refers to the moving average (MA). In the moving average process, each value is determined by the average of the current disturbance and one or more previous disturbances. The order of the moving average process specifies how many previous disturbances are averaged into the new value. Hence, the model specified here is the one
97
which includes three order of autoregression, one differencing, and 0 moving averages.
The three parameters are subjectively but empirically specified. This method involves first identifying the stationary of the series through a series plot. In addition to the series stationary, we also need to establish variance stationary. To achieve this property the study transforms the raw data using a natural logarithm. The AR and MA parameters are specified by observing the autocorrelation function (ACF) and partial autocorrelation function (PACF).
After the model has been specified, the intervention variable can be included in the model in the form of binary (0,1), where 0 represents the series prior to intervention and 1 after the intervention. Model details are found in Mccleary and Hay, (1980).
6. Theoretically, the interventions in a time series can take one of four forms of two dimensions, duration and onset. Duration can take a form of either permanent or temporary, and onset can be either abrupt or gradual (McCleary and Hay, Jr. 1980,172.). The rate of the intervention's onset is the Delta (6). In a gradual situation the Delta will range from -1 < 6 <1. The larger the value of 6, the more gradual the intervention's onset. When the value equal to one, the effect does not level out but shows the linear trend (McCleary and Hay, Jr. 1980, 158-159).
7. Since the percentages of public issues cases were transformed using the natural logarithm, the parameter estimates by the model are difficult to interpret relating to the raw score. This percentage change is used in the interpretation. According to McCleary and Hay (1980), this number can be calculated by exponentiating to the value of the parameter for the intervention using the following equation:
%change = (e-*0"x) * 100
Hence, 13.5% = (e-0124 ' l) * 100.
8. See note number 7 above for the calculation of these values.
9. See note number 7 above for the calculation of these values.
10. It is routine in judicial politics analysis to classify case outcomes as liberal
98
or conservative. According to Nagel (1961) the liberal outcomes are likely to favor:
1. the defense in criminal cases; 2. the administrative agency in business regulation cases; 3. the private party in cases involving regulation of nonbusiness
entities; 4. the claimant in unemployment compensation cases; 5. the libertarian position in free speech cases; 6. the finding of constitutional violation in criminal cases; 7. the government in taxation cases; 8. the divorce seeker in divorce cases; 9. the wife in divorce settlement cases;
10. the tenant in landlord-tenant cases; 11. the labor union in union-management cases; 12. the debtor in debt collection cases; 13. the consumer in sales of goods cases; 14. the injured party in motor vehicle accident cases; 15. the employee in employee injury cases.
The conservative outcomes, then, will be the opposite.
11. When looking at these graphs, please ignore the zero or one hundreds percent in the graph, especially that for individual claims and that for fiscal claims cases . They result from a small number of nonunanimous decision in those case types in that particular period.
CHAPTER REFERENCES
Casper, Gerhard and Richard Posner. 1976. The Workload of the Supreme Court. Chicago: American Bar Foundation.
Daniels, Steven. 1982. "Civil Litigation in Illinois Trial Courts: An Exploration of Rural-Urban Differences." Law and Policy Quarterly 4: 190-214.
Daniels, Steven. 1990. "Caseload Dynamics and the Nature of Change: The Civil Business of Trial Courts in Four Illinois Counties." Law and Society Review 24(2): 299-320.
Friedman, Lawrence. 1976. "A Tale of Two Courts: Litigation in Alameda and San Benito Counties." Law and Society Review 10: 267-302.
Haynie, Stacia L. 1992. "Leadership and Consensus on the U.S. Supreme Court." Journal of Politics 54: 1158-69.
Jackson, Robert J., Doreen Jackson, and Nicolas Baxter-Moore. 1986. Politics in Canada: Culture, Institutions, Behavior and Public Politcv. Scarborough, Ontario, CA: Prentice Hall.
McCleary, Richard and Richard A. Hay, Jr. 1980. Applied Time Series Analysis for the Social Science. Beverly Hill, CA: Sage Publications.
Mcintosh, Wayne. 1981. "150 Years of Litigation and Dispute Settlement: A Court Tale." Law and Society Review 15: 823-848.
McLauchlan, William P. 1980. "An Exploratory Analysis of the Supreme Court's Caseload, 1880-1976." Judicature 64: 32-42.
McLauchlan, William P. 1981. "Longitudinal Models of the Supreme Court's Caseload, 1880-1979." Paper presented at the Annual Meeting of the Southern Political Science Association, Memphis, November 5-6.
McLauchlan, William P. 1982. "Spectral Analysis of United States Supreme Court Caseload, 1880-1979." Paper presented to the Annual Meeting of the American Political Science Association, Denver, September 2-5.
99
100
Morton, F.L., Peter H. Russell and Michael J. Withey. 1991. "The Supreme Court's First 100 Charter of Rights Decisions: A Statistical Analysis." Occasional Papers Series, Research Study 6.1, Research Unit for Socio-Legal Studies, University of Calgary.
Nagel, Stuart S. 1961. "Ethnic Affiliations and Judicial Propensities." Journal of Politics 24: 94-110.
Russell, Peter H. 1975. "The Political Role of the Supreme Court of Canada in Its First Century." Canadian Bar Review 53: 576-596.
Russell, Peter H. 1982. "The Effect of a Charter of Rights on the Policy-Making Role of Canada Courts." Canadian Public Administration 25: 1-33.
Sittiwong, Panu. 1985. Canadian Supreme Court Decision-Making: The Personal Attribute Model in Explaining Justices' Pattern of Decision Making. 1949-1980. Master Thesis, North Texas State University.
Tate, C. Neal and Roger Handberg. 1986. "The Decision Making of The United States Supreme Court, 1916-85: A Three Level Perspective." Paper presented to the Annual Meeting of the American political Science Association, Washington D.C., August, 27-31.
Tate, C. Neal and Panu Sittiwong. 1989. "Decision Making in the Canadian Supreme Court: Extending the Personal Attributes Model Across nations." Journal of Politics 51: 900-16.
Tate, C. Neal and Panu Sittiwong. 1992. "The Development of the Decision Making Agenda of the Canadian Supreme Court, 1875-1990: Social and Political Change and Judicial Policy Making." Paper presented to the Annual Meeting of the Western Political Science Association, San Francisco, March 10-13.
Tate, C. Neal and Stacia L. Haynie. 1993. "Authoritarianism and the Functions of Courts: A Time Series Analysis of the Philippine Supreme Court." Law and Society Review 27: 201-234.
Ulmer, S. Sidney. 1985. "Government Litigants, Underdogs, and Civil Liberties in The Supreme Court: 1903-1968 Terms." Journal of Politics 47: 899-909.
101
Van Loon, F. and E. Langerwerf. 1990. "Development and the Evolution of Litigation Rates of Civil Courts in Belgium, 1835-1980." Law & Society Review 24(2): 283-98.
Walker, Thomas G., Lee Epstein, and William J. Dixon. 1988. "On the Mysterious Demise of Consensual Norms in the United States Supreme Court." Journal of Politics 50: 361-89.
CHAPTER 3
GROUP LEVEL PERSPECTIVE
The institutional perspective presented in Chapter Two looks at the court
as a single political institution rendering discrete public policy decisions.
Analyzing a court's decision outcomes allows us to describe the types of public
policy issues considered by a court, conflict in decision making, the directions
of those policies, continuity, and change in patterns of policy outcomes, social
and economic correlates of those policies, and many other interesting and
important phenomena.
While the institutional perspective can provide us an overall picture of
Supreme court decision making outcomes, it obscures the roles of the individual
justices who make up the court in creating that outcome. The institutional
outcomes of the court's decision making are in fact the aggregate behaviors of
those justices. Hence, analyses based on the group and individual level will
provide a further and better understanding of the structure of the decision
making of the Supreme Court.
The main theme in group level analysis is to identify judicial voting
coalitions and the attitude dimensions underlying such coalitions. Supreme
Court justices are viewed as decision makers who interact among themselves in
102
103
order to reach the final decision. The decision outcomes of the Supreme Court,
especially in non-unanimous cases, may represent two or more interacting
groups of justices who reach different consensuses on what the law means when
it is ambiguous or when clear precedents are lacking. Hence, an analysis of the
justices' tendency to form voting coalitions and the attitudes that may underlie
such coalitions may help us explain the changing public policy outcomes
produced by the Supreme Court.
Analyzing Supreme Court decision making at the group level probably is
among the most traditional of all judicial behavior studies. The model was first
suggested by C. Herman Pritchett's The Roosevelt Court in 1948 and later
elaborated in Glendon A. Schubert's psychometric model of Supreme Court
decision making (1965, 1974). Overtime, several method of analysis have been
used to explore group level phenomena, including block analysis, factor
analysis, and multidimensional scaling. In fact, block analysis and cumulative
scaling were used in 35% of all the quantitative judicial studies that were
published in four major political science journals up through the 1970s (Hensley
1981). For the Canadian courts, at least five studies, Peck (1967a, 1967b,
1969), Fouts (1969), and Russell (1970), have employed this method.
According to Glendon Schubert, the psychometric model will show the
differences in and the consistency of the attitudes of a group of persons toward
a single shared value. This model is based on the assumption that "whatever

104
their degrees of complexity, it is possible to represent symbolically the
ideological positions of justices comprising the Supreme Court at any particular
time as a configuration of ideal points in a psychological space of specifiable
dimensionality" (Schubert 1974, 17-18). This model then argues that judges
who share a common ideology toward a particular issue will vote in the same
way. Differences in ideology and attitude will make them vote differently.
Consequently, "by investigating the relationships between and among
issue-vectors and ideal-points in the space of the model, we can learn about
ideological relationships within, between, and among the minds of the justices
who, in the empirical sense, comprise our set of respondents" (19).
The idea behind the model was first introduced in analyzing voting blocs
or voting agreement among justices of the Court (see Pritchett 1948). This
method, however, was criticized by Schubert as lacking sensitivity. He pointed
out that it was sensitive only to "the most striking and extreme patterns of
variance in voting behavior." (Schubert 1972, 118).
Thurstone and Degan (1951) provided the next development of the model.
They demonstated the superiority of using factor analysis over block analysis in
discerning patterns of judicial interagreement. The factor analysis method,
however, could only "describe, not explain, voting patterns [since] the cause of
the observed behavior must be inferred from other evidence" (Flango and Ducat
1977, 43).
105
In fact the first attempt to use factor analysis to discern voting blocs on
the Supreme Court failed because Thurston and Degan were not able to interpret
the factor they produced, and so were reduced to making statements like, "The
Factor A represents something which is shared by Justices Black and Douglas
and which is opposite to what is common to Justices Frankfurter and Roberts"
(Flango and Ducat 1977, 43).
To improve the explanatory power of the model, Schubert (1962, 1965,
1974) presented a psychometric model which combined both factor analysis and,
later on, multidimensional scaling with scalogram analysis. The former was
used to identify voting groups among the Supreme Court justices, and the
scalogram analysis of subsets of cases was used to specify the ideological or
attitudinal dimensions underlying the groups.
In the technical sense, Schubert's method involved the observation of
voting agreement and disagreement across all issues, which may be defined a
priori, among all possible pairs of justices. The Phi coefficients for the fourfold
tables of voting agreement are computed and submitted to factor analysis to
cluster voting groups. Factors are rotated until they roughly correspond to the
plots of cumulative scales from the scalogram analysis. If the correspondence
between the scales and the factorial configuration is high, as measured by a rank
order correlation, Schubert concluded that "by observing how the cumulative
scales correlate with the point configulation which factor analysis determines,
106
we learn how the cumulative scales, the attitudinal variables, are interrelated"
(Schubert 1974, 22).
Schubert's psychometric model was instrumental in providing a theoretical
justification for much research in judicial politics. The model and (some of) its
techniques were applied to courts in various countries, including Canada (Fouts,
1969; Peck, 1967a, 1967b, 1969).
Despite its popularity, the psychometric model was criticized on both
theoretical and methodological grounds. The major theoretical criticism is that
the model is too simple to explain the complex concept, "justices' attitudes." In
addition, "the model allows no test of competing hypotheses and pays little
explicit attention to the microlevel process of attitudinal influence over
behavior" (Gibson 1983, 12).
On methodological grounds, Tanenhaus criticized the use of cumulative
scaling in judicial behavior research. His main argument centers around the
indeterminacy of the placement of judges on scalograms under a variety of
distributions of cases marginals and the relative ease of constructing
"acceptable" scalograms when the number of items greatly exceeds the number
of persons responding to those items (Tanenhaus 1966, 1593).
Tate, further, questions the practical applicability to other courts of
cumulative scaling in Schubert's psychometric model.
107
Evidence of this can be seen in the fact that existing studies that do apply the model outside the [U.S.] Supreme Court do not use cumulative scales as interpretive aids. . . .The problem is that traditional approaches to cumulative scaling require that the analyst be able to identify universes of content into which the "items" being analyzed fit. . . .For other courts and, indeed, for other analysts, this will not be true, and attempts at cumulative scaling in the traditional manner will be frustrating and probably unreliable (Tate 1983, 67).
Research Design
The full psychometric model is difficult to apply to the Canadian Supreme
Court. This is due to the fact that the decision making process in the Supreme
Court does not require all judges to hear a case. A quorum consists of only five
judges.
Mclver (1976) has suggested a procedure for applying scalogram analysis
in courts where cases are not heard by a full bench. Tate, however, points out
that the method "is of limited or no value when the number of non-unanimous
decisions in which all judges participate is small" (Tate 1983, 66). Previous
reseach (Sittiwong 1985, see also Chapter Two of this study) shows that the
Canadian Supreme Court has had a small number of non-unanimous decision in
which all judges participated. Hence, the full psychometric model is of limited
value or inappropriate when applied to the Canadian Supreme Court because it
will not be possible to group justices or construct scalograms reliably.
The inability to apply a model does not mean that the study will abandon
group level analysis. The problem associated with applying the model to the
108
Canadian Supreme Court is mainly directed at the use of scalogram analysis in
the model. It is possible that justices' voting blocs can be identified using
factor analysis or multi-dimentional scaling. Therefore, at the group level, the
analysis will seek to identify justice voting blocs in each natural court. In order
to explain the attitudes underlying each voting bloc, the study will use
information about individual voting behavior.
The study hypothesizes that there is a relationship among the three levels
of analysis. The voting coalitions in the Court may result from individual
justices who share the same ideologies on a particular issue. For example, a
liberal coalition in civil liberties cases may be created informally by judges who
are liberal on this issue. Hence, it is informative to see how well voting
coalitions in the Court can be explained by knowledge about individual voting
behavior. If individual voting behavior can be used as an explanatory variable
in group formation, we will expect judges who share similar views on a
particular issue to have a similar pattern of voting behavior which will lead to a
higher than usual voting agreement, i. e., to belong to the same voting bloc on
that issue.
The analysis will compute a pairwise voting agreement index for all
possible pair of judges in each natural court. All of the indices will be
submitted to multi-dimensional scaling in order to identify voting structures in
each natural court.
109
In order to explain the attitudes underline the voting structures, the study
will compute the justice's liberalism scores and classify them as conservatives
or liberals based on these scores. If the voting structure is determined by
conservative/liberal ideologies, we will expect to see that each cluster consists
only of judges who are classified as either liberal or conservative.
Based on the classification of the outcomes of cases as liberal and
conservative (see Chapter Two for cases classification details), it is possible to
assign a liberal or conservative vote for each judge who participated in a given
decision. Those who assent in cases with liberal outcome cast liberal votes.
Liberal votes are also recorded for dissenting votes in cases which have
conservative outcomes. Conservative votes will be the opposite. A simple
percentage liberal score will be calculated for each justice in each category. For
example, in individual claims cases, a justice's voting behavior is computed as
the percentage liberal votes in individual claims cases constitute of the total
number of individual claims cases that particular judge participated in for the
decisions being analyzed.
Voting Coalitions in the Canadian Supreme Court
Group level analyses of the behavior of the Canadian Supreme Court is
complicated by the fact that the decision making process in the Supreme Court
does not require all judges to hear a case. A quorum consists of only five
110
judges, and decisions are typically, but not exclusively, made in five judge
panels. Nevertheless, using the natural court as the basis for analysis, it is
possible to identify pairs or groups of justices' who consistently agree in voting
by using factor analysis or multi-dimensional scaling, data analysis techniques
which allow one to seek to identify justice voting blocs in each natural court.
To try to interpret the justices' voting coalitions, the study shall use a simple
measure of the justices' individual voting behavior, the percentage of the
nonunanimous cases on which they voted in which they cast a liberal vote.
Table 3.1 presents these data.
Thus to understand the decision making behavior of the Canadian
Supreme Court, the study use information to relate the three levels of analysis,
institutional, group, and individual. Changes in the Court's institutional
behavior are investigated by examining the structure of the voting coalitions in
the Court, and the structure of those voting coalitions is interpreted using
measures of the voting behavior of the individual justices who share the same
voting coalition. For example, a coalition in civil liberties cases may be created
informally by judges who are liberal on this issue. If this coalition is large
enough, it may come to dominate the court's institutional decision making in
controversial civil rights and liberties decisions. Hence, it is informative to see
how well voting coalitions in the Court can be explained by knowledge about
individual voting behavior. If individual voting behavior can be used as an
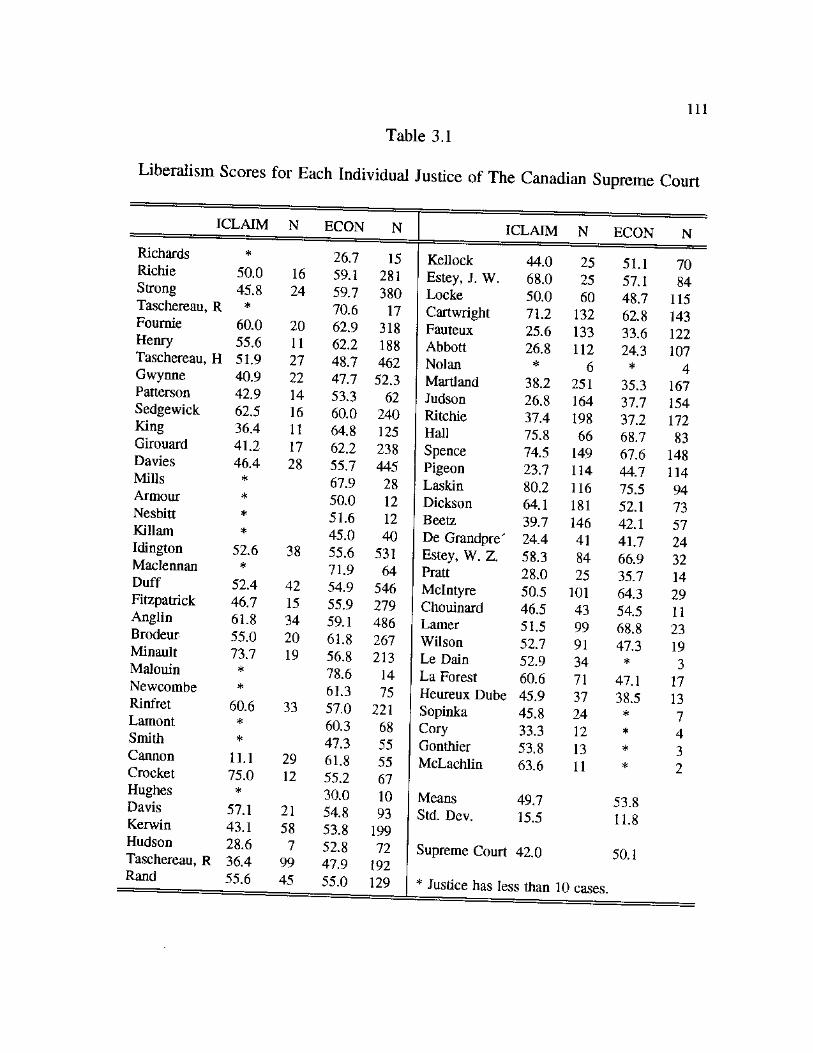
I l l
Table 3.1
Liberalism Scores for Each Individual Justice of The Canadian Supreme Court
ICLAIM N ECON ICLAIM N
Richards Richie 50.0 16 Strong 45.8 24 Taschereau, R *
Fournie 60.0 20 Henry 55.6 11 Taschereau, H 51.9 27 Gwynne 40.9 22 Patterson 42.9 14 Sedgewick 62.5 16 King 36.4 11 Girouard 41.2 17 Davies 46.4 28 Mills *
Armour *
Nesbitt *
Killam *
Idington 52.6 38 Maclennan *
Duff 52.4 42 Fitzpatrick 46.7 15 Anglin 61.8 34 Brodeur 55.0 20 Minault 73.7 19 Malouin *
Newcombe Rinfret Lamont Smith Cannon Crocket Hughes Davis Kerwin Hudson Taschereau, R Rand
60.6 *
*
11.1 75.0 *
57.1 43.1 28.6 36.4 55.6
33
29 12
26.7 59.1 59.7 70.6 62.9 62.2 48.7 47.7 53.3 60.0 64.8 62.2 55.7 67.9 50.0 51.6 45.0 55.6 71.9 54.9 55.9 59.1 61.8 56.8 78.6 61.3 57.0 60.3 47.3 61.8 55.2 30.0 54.8 53.8 52.8 47.9 55.0
15 281 380
17 318 188 462 52.3
62 240 125 238 445 28 12 12 40
531 64
546 279 486 267 213
14 75
221 68 55 55 67 10 93
199 72
192 129
Kellock Estey, J. W. Locke Cartwright Fauteux Abbott Nolan Marti and Judson Ritchie Hall Spence Pigeon Laskin Dickson Beetz De Grandpre' Estey, W. Z. Pratt Mclntyre Chouinard Lamer Wilson Le Dain La Forest Heureux Dube Sopinka Cory Gonthier McLachlin
Means Std. Dev.
44.0 68.0 50.0 71.2 25.6 26.8 *
38.2 26.8 37.4 75.8 74.5 23.7 80.2 64.1 39.7 24.4 58.3 28.0 50.5 46.5 51.5 52.7 52.9 60.6 45.9 45.8 33.3 53.8 63.6
49.7 15.5
N ECON N
25 51.1 70 25 57.1 84 60 48.7 115
132 62.8 143 133 33.6 122 112 24.3 107
6 * 4 251 35.3 167 164 37.7 154 198 37.2 172 66 68.7 83
149 67.6 148 114 44.7 114 116 75.5 94 181 52.1 73 146 42.1 57 41 41.7 24 84 66.9 32 25 35.7 14
101 64.3 29 43 54.5 11 99 68.8 23 91 47.3 19 34 * 3 71 47.1 17 37 38.5 13 24 * 7 12 * 4 13 * 3 11 * 2
53.8 11.8
Supreme Court 42.0
* Justice has less than 10 cases
112
explanatory variable in group formation, we will expect judges who share
similar views on a particular issue to have a similar pattern of voting behavior
which will lead to a higher than usual voting agreement, i. e., to belong to the
same voting coalition.
The data presented in Table 3.1 only includes individual claims and
ecomomic claims in the study since fiscal claims cases were too few to be
analyzed reliably. The study also decided to compute a justice's liberalism
scores if he or she has participated in more than 10 cases in each categories.
Although liberalism in individual claims and economic liberalism are distinctive
behaviors, the voting scores show a moderate to high correlation. The Peason
correlation for the two scores is .60. This level of association is similar to the
one reported for the U.S. Supreme Court justices, but the later shows a bit
higher level of association. The coefficient for the U.S court is .79 (Tate 1981,
357).
The Canadian Supreme Court justices varied substantially in their voting
behavior. The standard deviations for their voting scores reveal that they
differed more on individual claims cases than on economics question. In
individual claims cases the liberalism scores are range from Justice Pigeon's low
of 23.7% to Chief Justice Laskin high of 80.2%. In comparison to the Supreme
Court's norm of 42 percent, 16 justices were more conservative than the
Supreme Court's norm—having their scores less than 42.0 percent—and 39
113
justices were more liberal than the norm—having their scores higher than 42%.
The lowest economic liberal scores belong to Justice Abbott (24.3%), and Chief
Justice Laskin, again, possessed the highest score of 75.5%. In comparison the
Supreme Court's norm is 50.1%. Of the 61 justices who have economic
liberalism scores , 21 justices were more conservative than the norm, and 40
were more liberal.
As the basis for multidimensional scaling analyses of the 27 natural
courts, the study computed voting agreement indices for all possible pairs of
judges serving during each natural court. The voting agreement index,
technically a "similarity" measure, calculates the proportion of the cases on
which a pair of justices both voted in which they agreed, i.e., cast the same
vote. Table 3.2 presents the matrices of similarities for each possible pair of
justices in each natural court.
A cursory examination of those agreement indexes shows the possible
influence of justice's ideology on their voting behavior. For example, Chief
Justices Laskin's extraordinarily position relative to his colleagues demonstrated
this influence. Laskin, who was the most liberal justice in the study,
consistently disagreed with Chief Justice Fauteux, Justices Abbott, Martiand,
Judson, Pigeon, De Grandpre', and Pratt, all of whom were conservatives. On
the other hand, he ageed most frequently with Justices Hall and Spence whom
were nearly as liberal as he. In a similar way, Justices Abbott, who was the
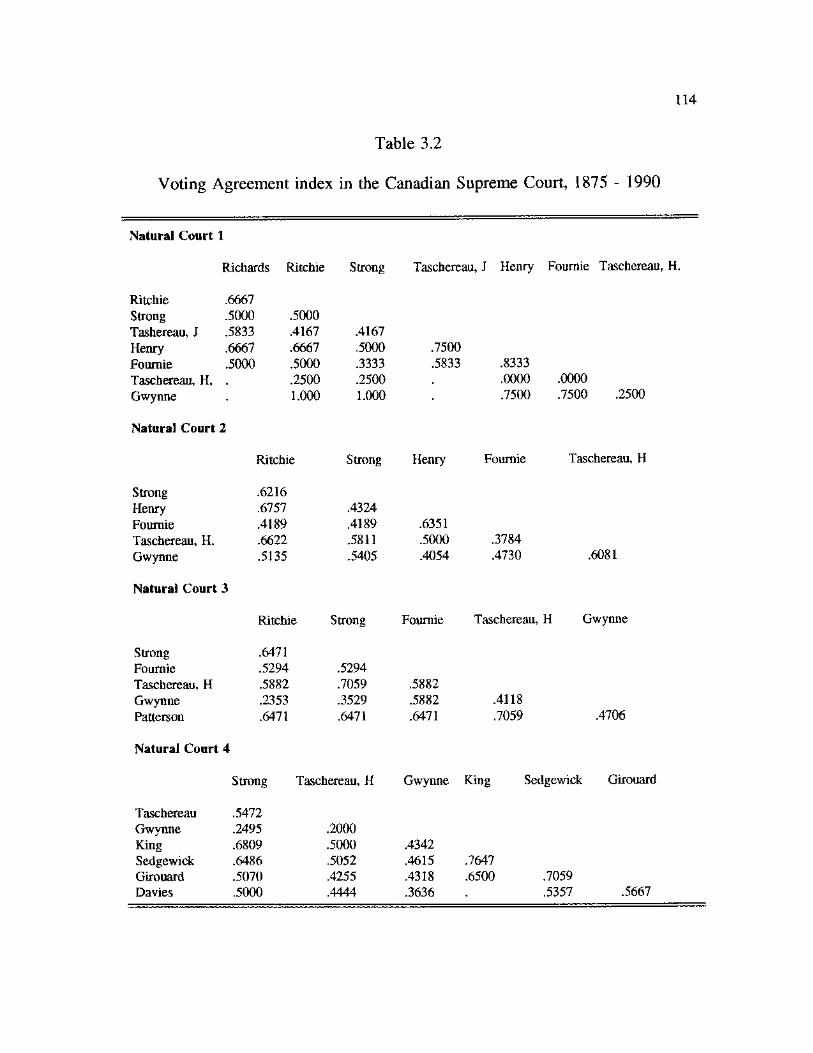
114
Table 3.2
Voting Agreement index in the Canadian Supreme Court, 1875 - 1990
Natural Court 1
Richards Ritchie Strong Taschereau, J Henry Fournie Taschereau, H.
Ritchie .6667 Strong .5000 .5000 Tashereau, J .5833 .4167 .4167 Henry .6667 .6667 .5000 Fournie .5000 .5000 .3333 Taschereau, H, . .2500 .2500 Gwynne . 1.000 1.000
Natural Court 2
.7500
.5833 .8333 .0000 .0000 .7500 .7500 .2500
Ritchie Strong Henry Fournie Taschereau, H
Strong .6216 Henry .6757 .4324 Fournie .4189 .4189 .6351 Taschereau, H. .6622 .5811 .5000 .3784 Gwynne .5135 .5405 .4054 .4730 .6081
Natural Court 3
Ritchie Strong Fournie Taschereau, H Gwynne
Strong .6471 Fournie .5294 .5294 Taschereau, H .5882 .7059 .5882 Gwynne .2353 .3529 .5882 .4118 Patterson .6471 .6471 .6471 .7059 .4706
Natural Court 4
Strong Taschereau, H Gwynne King Sedgewick Girouard
Taschereau .5472 Gwynne .2495 .2000 King .6809 .5000 .4342 Sedgewick .6486 .5052 .4615 .7647 Girouard .5070 .4255 .4318 .6500 .7059 Davies .5000 .4444 .3636 .5357 .5667
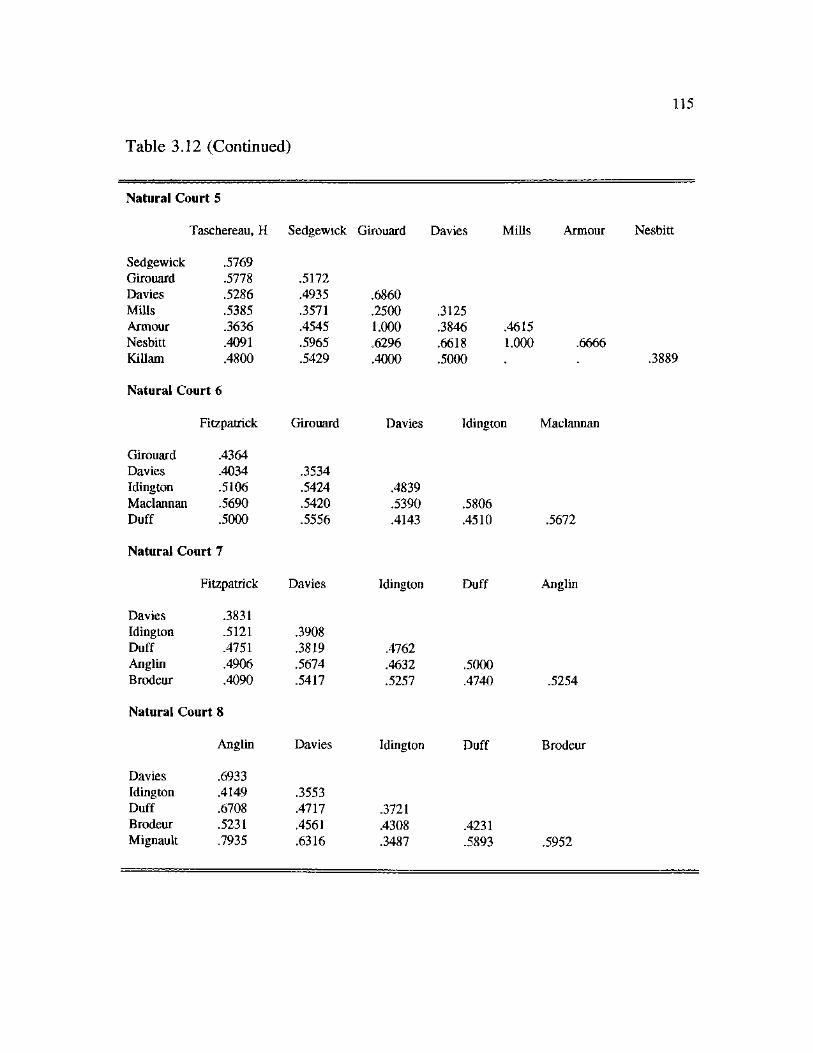
115
Table 3.12 (Continued)
Natural Court 5
Taschereau, H Sedgewick Girouard Davies Mills Armour Nesbitt
Sedgewick .5769 Girouard .5778 .5172 Davies .5286 .4935 .6860 Mills .5385 .3571 .2500 .3125 Armour .3636 .4545 1.000 .3846 .4615 Nesbitt .4091 .5965 .6296 .6618 1.000 .6666 Killam .4800 .5429 .4000 .5000 •
Natural Court 6
Fitzpatrick Girouard Davies Idington Maclannan
Girouard .4364 Davies .4034 .3534 Idington .5106 .5424 .4839 Maclannan .5690 .5420 .5390 .5806 Duff .5000 .5556 .4143 .4510 .5672
Natural Court 7
Fitzpatrick Davies Idington Duff Anglin
Davies .3831 Idington .5121 .3908 Duff .4751 .3819 .4762 Anglin .4906 .5674 .4632 .5000 Brodeur .4090 .5417 .5257 .4740 .5254
Natural Court 8
Anglin Davies Idington Duff Brodeur
Davies .6933 Idington .4149 .3553 Duff .6708 .4717 .3721 Brodeur .5231 .4561 .4308 .4231 Mignault .7935 .6316 .3487 .5893 .5952
.3889
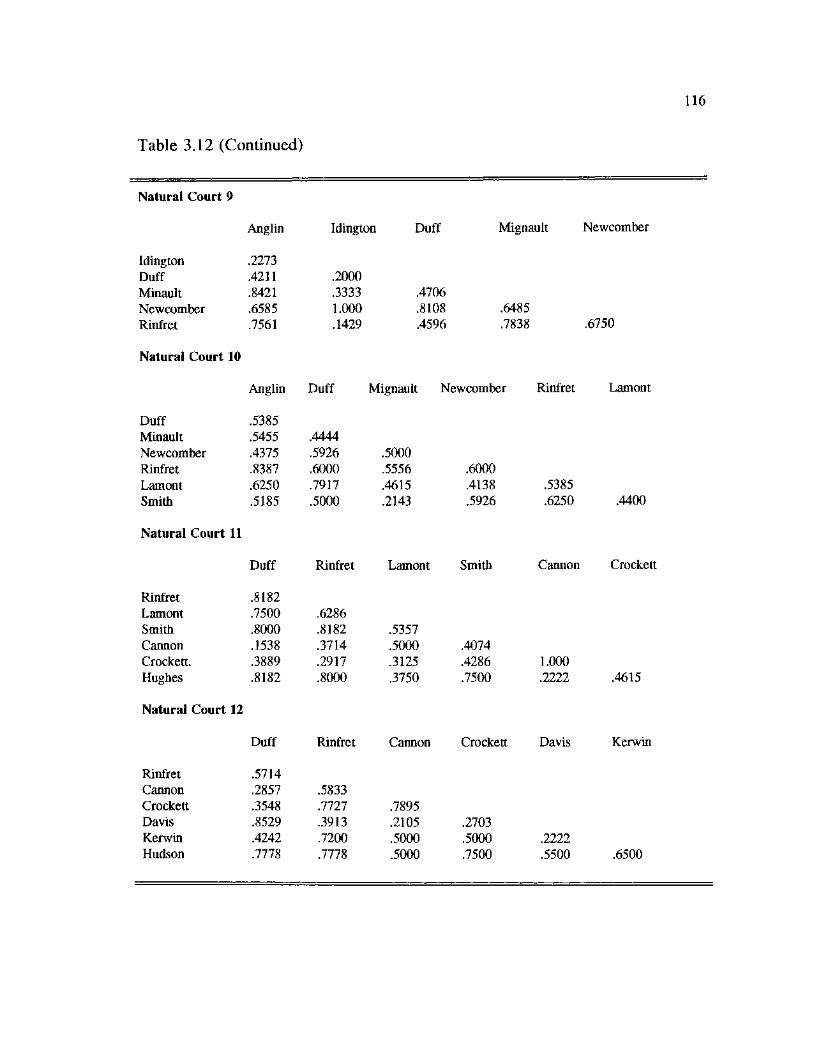
116
Table 3.12 (Continued)
Natural Court 9
Anglin Idington Duff Mignault Newcomber
Idington .2273 Duff .4211 .2000 Minault .8421 .3333 .4706 Newcomber .6585 1.000 .8108 .6485 Rinfiret .7561 .1429 .4596 .7838 .6750
Natural Court 10
Anglin Duff Mignault Newcomber Rinfret Lamont
Duff .5385 Minault .5455 .4444
Newcomber .4375 .5926 .5000 Rinfret .8387 .6000 .5556 .6000 Lamont .6250 .7917 .4615 .4138 .5385 Smith .5185 .5000 .2143 .5926 .6250 .4400
Natural Court 11
Duff Rinfiret Lamont Smith Cannon Crockett
Rinfret .8182 Lamont .7500 .6286 Smith .8000 .8182 .5357 Cannon .1538 .3714 .5000 .4074 Crockett. .3889 .2917 .3125 .4286 1.000 Hughes .8182 .8000 .3750 .7500 .2222 .4615
Natural Court 12
Duff Rinfret Cannon Crockett Davis Kerwin
Rinfret .5714 Cannon .2857 .5833 Crockett .3548 .7727 .7895 Davis .8529 .3913 .2105 .2703 Kerwin .4242 .7200 .5000 .5000 .2222 Hudson .7778 .7778 .5000 .7500 .5500 .6500
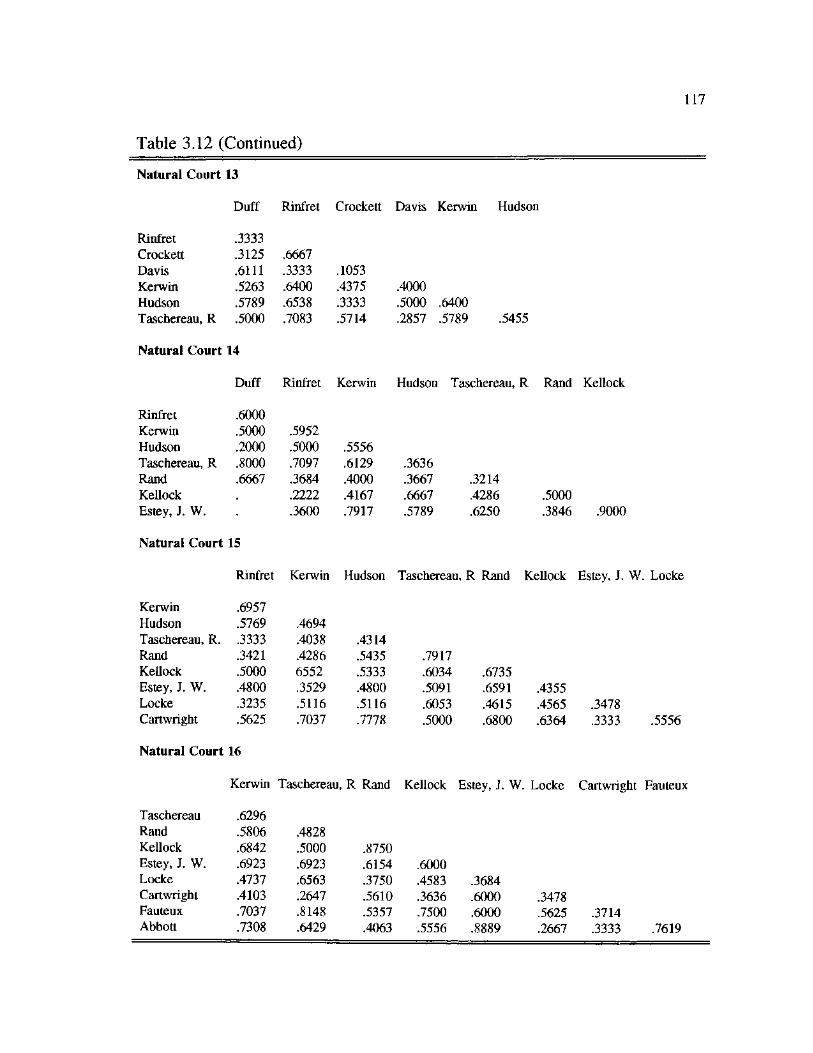
117
Table 3.12 (Continued)
Natural Court 13
Duff Rinfret Crockett Davis Kerwin Hudson
Rinfret .3333 Crockett .3125 .6667 Davis .6111 .3333 .1053 Kerwin .5263 .6400 .4375 .4000 Hudson .5789 .6538 .3333 .5000 .6400 Taschereau, R .5000 .7083 .5714 .2857 .5789 .5455
Natural Court 14
Duff Rinfret Kerwin Hudson Taschereau, R Rand
Rinfret .6000 Kerwin .5000 .5952 Hudson .2000 .5000 .5556 Taschereau, R .8000 .7097 .6129 .3636 Rand .6667 .3684 .4000 .3667 .3214 Kellock .2222 .4167 .6667 .4286 .5000 Estey, J. W. .3600 .7917 .5789 .6250 .3846
Natural Court 15
Rinfret Kerwin Hudson Taschereau, R Rand Kellock
Kerwin .6957 Hudson .5769 .4694 Taschereau, R. .3333 .4038 .4314 Rand .3421 .4286 .5435 .7917 Kellock .5000 6552 .5333 .6034 .6735 Estey, J. W. .4800 .3529 .4800 .5091 .6591 .4355 Locke .3235 .5116 .5116 .6053 .4615 .4565 Cartwright .5625 .7037 .7778 .5000 .6800 .6364
.9000
.3478
.3333 .5556
Natural Court 16
Kerwin Taschereau, R Rand Kellock Estey, J. W. Locke Cartwright Fauteux
Taschereau .6296 Rand .5806 .4828 Kellock .6842 .5000 .8750 Estey, J. W. .6923 .6923 .6154 .6000 Locke .4737 .6563 .3750 .4583 .3684 Cartwright .4103 .2647 .5610 .3636 .6000 .3478 Fauteux .7037 .8148 .5357 .7500 .6000 .5625 Abbott .7308 .6429 .4063 .5556 .8889 .2667
.3714
.3333 .7619
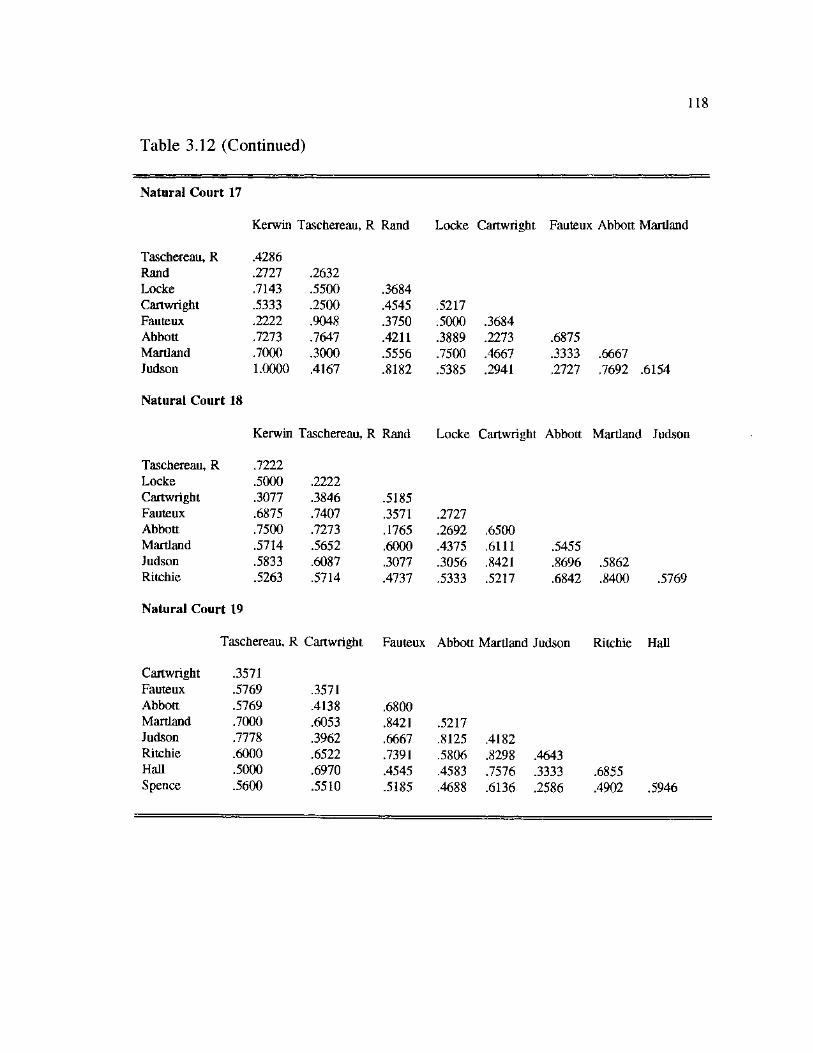
118
Table 3.12 (Continued)
Natural Court 17
Kerwin Taschereau, R Rand Locke Cartwright Fauteux Abbott Martland
Taschereau, R .4286 Rand .2727 .2632 Locke .7143 .5500 .3684 Cartwright .5333 .2500 .4545 .5217 Fauteux .2222 .9048 .3750 .5000 .3684 Abbott .7273 .7647 .4211 .3889 .2273 .6875 Martland .7000 .3000 .5556 .7500 .4667 .3333 .6667 Judson 1.0000 .4167 .8182 .5385 .2941 .2727 .7692 .6154
Natural Court 18
Kerwin Taschereau, R Rand Locke Cartwright Abbott Martland Judson
Taschereau, R .7222 Locke .5000 .2222 Cartwright .3077 .3846 .5185 Fauteux .6875 .7407 .3571 .2727 Abbott .7500 .7273 .1765 .2692 .6500 Martland .5714 .5652 .6000 .4375 .6111 .5455 Judson .5833 .6087 .3077 .3056 .8421 .8696 .5862 Ritchie .5263 .5714 .4737 .5333 .5217 .6842 .8400 .5769
Natural Court 19
Taschereau, R Cartwright Fauteux Abbott Martland Judson Ritchie Hall
Cartwright .3571 Fauteux .5769 .3571 Abbott .5769 .4138 .6800 Martland .7000 .6053 .8421 .5217 Judson .7778 .3962 .6667 .8125 .4182 Ritchie .6000 .6522 .7391 .5806 .8298 .4643 Hall .5000 .6970 .4545 .4583 .7576 .3333 Spence .5600 .5510 .5185 .4688 .6136 .2586
.6855
.4902 .5946
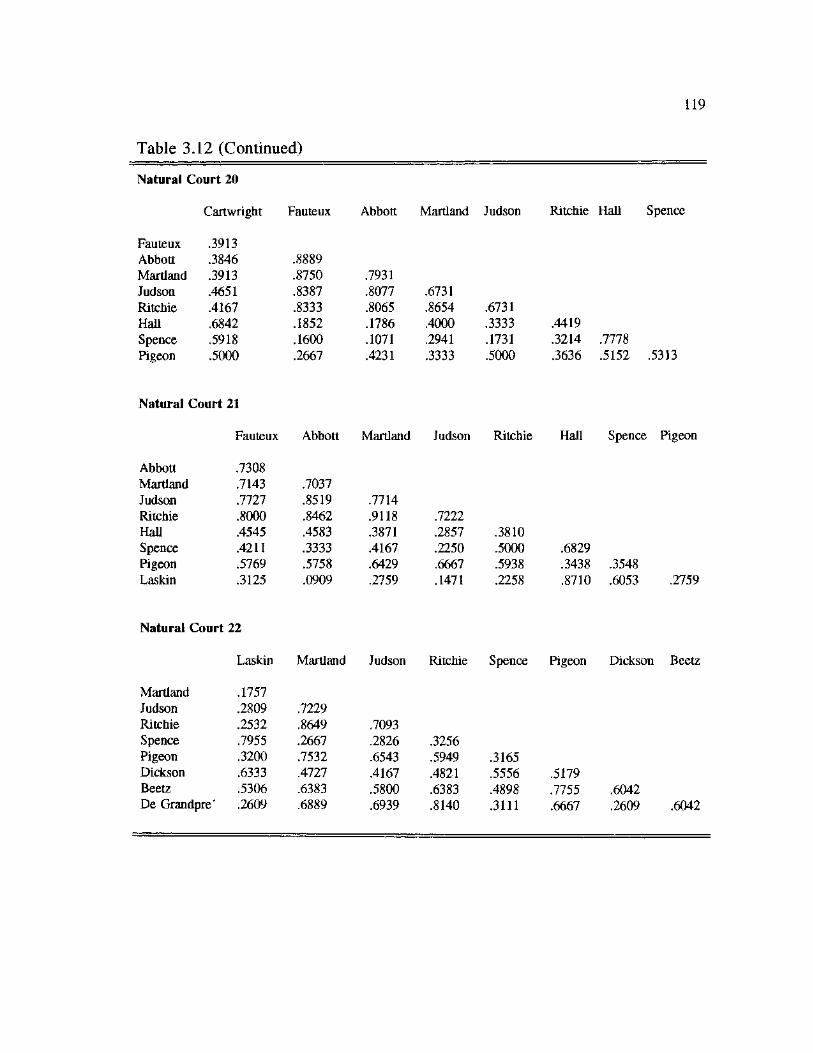
119
Table 3.12 (Continued)
Natural Court 20
Cartwright Fauteux Abbott Martland Judson
Fauteux .3913 Abbott .3846 .8889 Martland .3913 .8750 .7931 Judson .4651 .8387 .8077 .6731 Ritchie .4167 .8333 .8065 .8654 .6731 Hall .6842 .1852 .1786 .4000 .3333 Spence .5918 .1600 .1071 .2941 .1731 Pigeon .5000 .2667 .4231 .3333 .5000
Ritchie Hall Spence
.4419
.3214 .7778
.3636 .5152 .5313
Natural Court 21
Fauteux Abbott Martland Judson Ritchie Hall Spence Pigeon
Abbott .7308 Martland .7143 .7037 Judson .7727 .8519 .7714 Ritchie .8000 .8462 .9118 .7222 Hall .4545 .4583 .3871 .2857 .3810 Spence .4211 .3333 .4167 .2250 .5000 .6829 Pigeon .5769 .5758 .6429 .6667 .5938 .3438 .3548 Laskin .3125 .0909 .2759 .1471 .2258 .8710 .6053 .2759
Natural Court 22
Laskin Martland Judson Ritchie Spence Pigeon Dickson Beetz
Martland .1757 Judson .2809 .7229 Ritchie .2532 .8649 .7093 Spence .7955 .2667 .2826 .3256 Pigeon .3200 .7532 .6543 .5949 .3165 Dickson .6333 .4727 .4167 .4821 .5556 .5179 Beetz .5306 .6383 .5800 .6383 .4898 .7755 .6042 De Grandpre' .2609 .6889 .6939 .8140 .3111 .6667 .2609 .6042
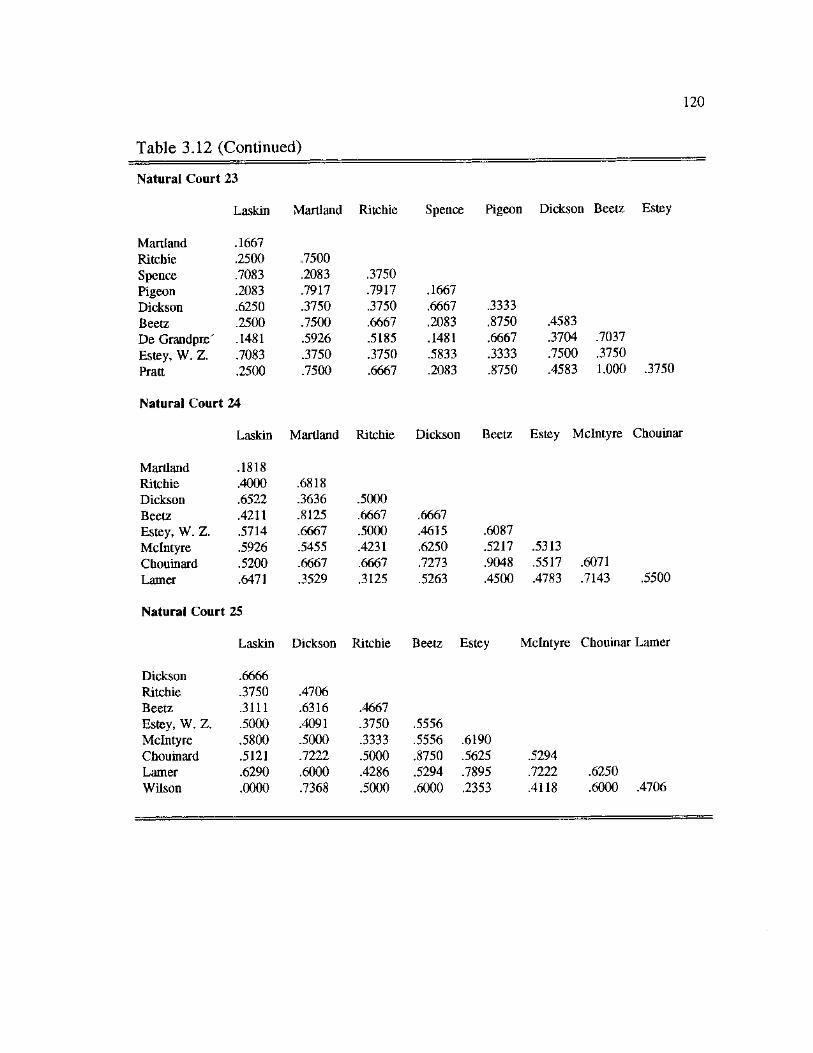
120
Table 3.12 (Continued)
Natural Court 23
Laskin Martiand Ritchie Spence Pigeon Dickson Beetz Estey
Martiand .1667 Ritchie .2500 .7500 Spence .7083 .2083 .3750 Pigeon .2083 .7917 .7917 .1667 Dickson .6250 .3750 .3750 .6667 .3333 Beetz .2500 .7500 .6667 .2083 .8750 .4583 De Grandpre' .1481 .5926 .5185 .1481 .6667 .3704 .7037 Estey, W. Z. .7083 .3750 .3750 .5833 .3333 .7500 .3750 Pratt .2500 .7500 .6667 .2083 .8750 .4583 1.000 .3750
Natural Court 24
Laskin Martiand Ritchie Dickson i Beetz Estey Mclntyre Chouinar
Martiand .1818 Ritchie .4000 .6818 Dickson .6522 .3636 .5000 Beetz .4211 .8125 .6667 .6667 Estey, W. Z. .5714 .6667 .5000 .4615 .6087 Mclntyre .5926 .5455 .4231 .6250 .5217 .5313 Chouinard .5200 .6667 .6667 .7273 .9048 .5517 .6071 Lamer .6471 .3529 .3125 .5263 .4500 .4783 .7143 .5500
Natural Court 25
Laskin Dickson Ritchie Beetz Estey Mclntyre Chouinar Lamer
Dickson .6666 Ritchie .3750 .4706 Beetz .3111 .6316 .4667 Estey, W. Z. .5000 .4091 .3750 .5556 Mclntyre .5800 .5000 .3333 .5556 .6190 Chouinard .5121 .7222 .5000 .8750 .5625 .5294 Lamer .6290 .6000 .4286 .5294 .7895 .7222 .6250 Wilson .0000 .7368 .5000 .6000 .2353 .4118 .6000 .4706
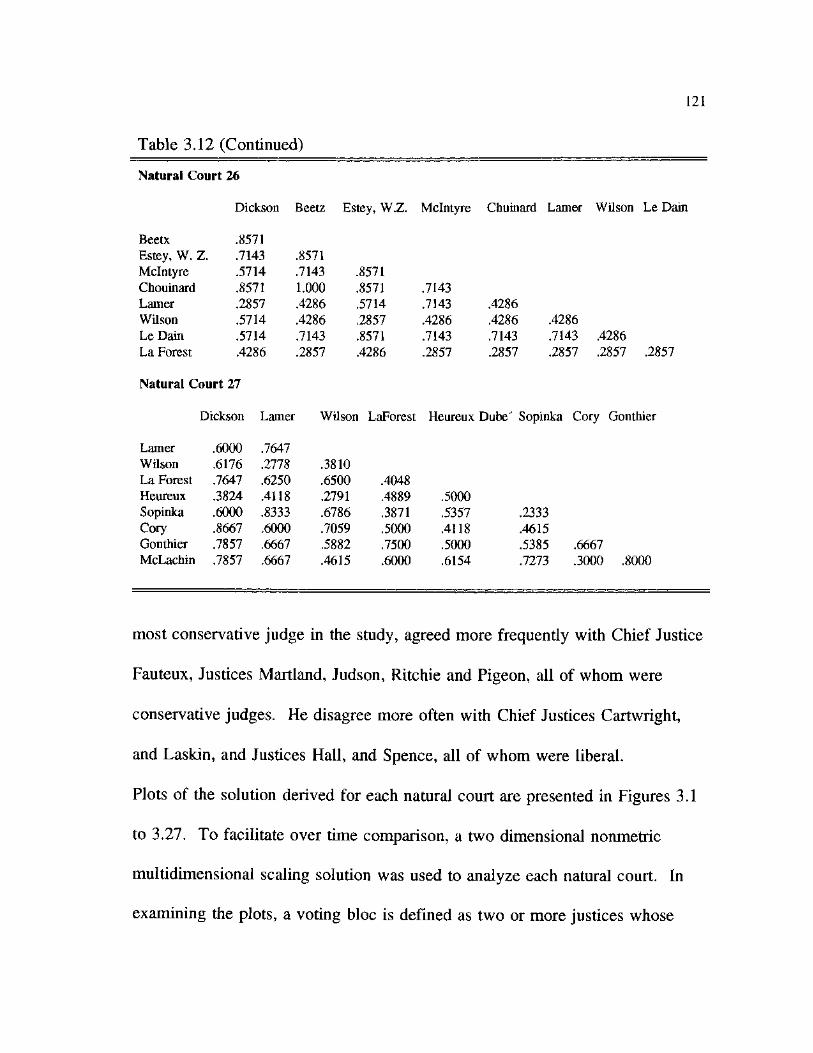
121
Table 3.12 (Continued)
Natural Court 26
Dickson Beetz Estey, W.Z. Mclntyre Chuinard Lamer Wilson Le Dain
Beetx .8571 Estey, W. Z. .7143 .8571 Mclntyre .5714 .7143 .8571 Chouinard .8571 1.000 .8571 .7143 Lamer .2857 .4286 .5714 .7143 .4286 Wilson .5714 .4286 .2857 .4286 .4286 .4286 Le Dain .5714 .7143 .8571 .7143 .7143 .7143 .4286 La Forest .4286 .2857 .4286 .2857 .2857 .2857 .2857 .2857
Natural Court 27
Dickson Lamer Wilson LaForest Heureux Dube' Sopinka
Lamer .6000 .7647 Wilson .6176 .2778 .3810 La Forest .7647 .6250 .6500 .4048 Heureux .3824 .4118 .2791 .4889 .5000 Sopinka .6000 .8333 .6786 .3871 .5357 .2333 Cory .8667 .6000 .7059 .5000 .4118 .4615 Gonthier .7857 .6667 .5882 .7500 .5000 .5385 McLachin .7857 .6667 .4615 .6000 .6154 .7273
.6667
most conservative judge in the study, agreed more frequently with Chief Justice
Fauteux, Justices Martland, Judson, Ritchie and Pigeon, all of whom were
conservative judges. He disagree more often with Chief Justices Cartwright,
and Laskin, and Justices Hall, and Spence, all of whom were liberal.
Plots of the solution derived for each natural court are presented in Figures 3.1
to 3.27. To facilitate over time comparison, a two dimensional nonmetric
multidimensional scaling solution was used to analyze each natural court. In
examining the plots, a voting bloc is defined as two or more justices whose

122
agreement patterns make them visually distinctive. This criterion, admittedly
loose, will be used for natural courts 1 to 14 since they are for Courts
comprised of only six justices. A bloc is defined as three or more justices for
the natural courts after 1949 after the composition of the court increase from six
judges to nine judges. If ideologies are a possible explanation of the voting
bloc, we expect to see that each bloc will consist only of judges who exhibit the
same ideological direction .
Natural court 1, whose dockets were dominated mainly by economic claims
cases, exhibited a strong coalition of three economic liberals: Strong, Richie,
and Jean Thomas Taschereau. One can also see that Justices Henry
Tashchereau and Richards can be viewed as a possible economic conservative
group opposing the former group. The other justices appear to vote
independently.
Natural Court 2 shows a reduced bloc of economic liberals, Justices Henry
and Strong, but no other bloc. Natural court three, on the other hand, did not
show any voting coalition.
Natural court 4 features a voting block consisting of the moderate judges
in the court. It members include justices Gwynne, Henry Taschereau, and
Davies. A formation of an economic liberal bloc was evident again in natural
court 5, the first falling into the Twentieth century, with three or four members
in the coalition (located on the right half of the graph).
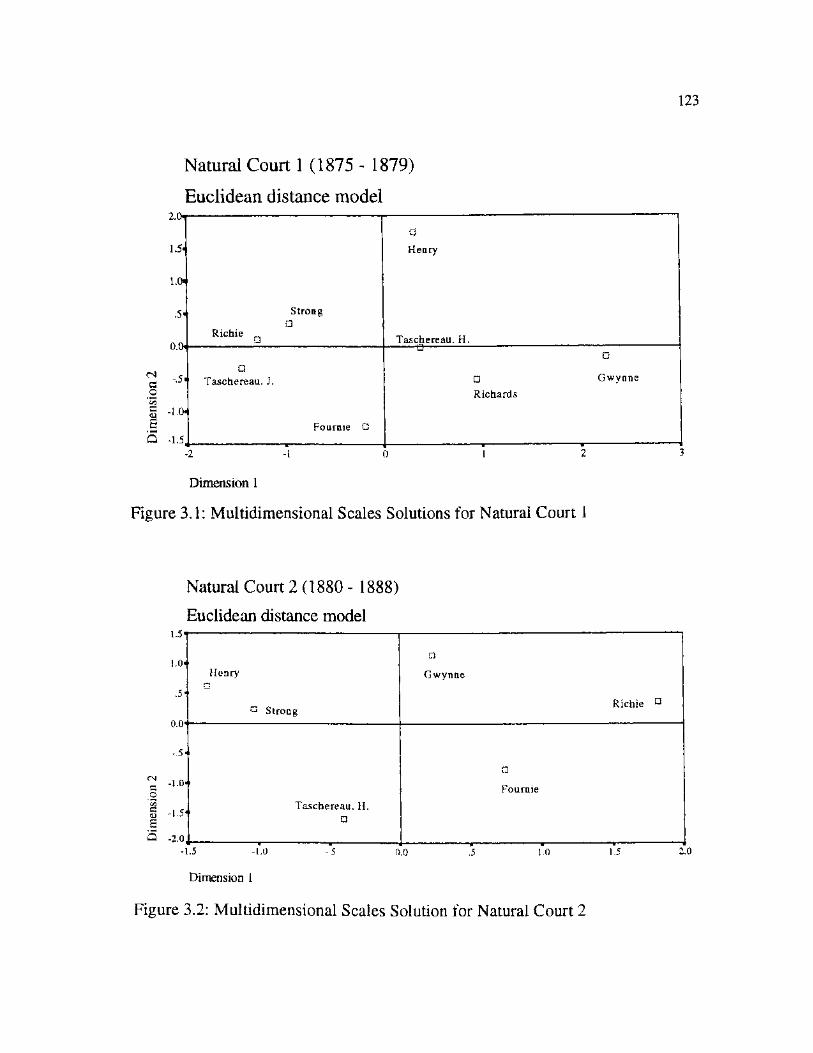
123
Natural Court 1 (1875 - 1879)
Euclidean distance model 2.0
1.5'
c .2 CO
a
S
0.0
-.5-
-1.0
-1.5
;
Strong a
Richie Q
Henry
Taschereau, H.
• 1 Taschereau, J.
a
Fournie G
• & -
O
• Gwynne
Richards
-2
Dimension 1
Figure 3.1: Multidimensional Scales Solutions for Natural Court 1
Natural Court 2 (1880 - 1888)
Euclidean distance model 1 .5"
1 . 0 -
.5*
0.0"
-.5«
CN G O
-1.0«
*00 a <D a
-1.54
5 -2.0,
Henry
a Strong
• Gwynne
Richie a
i
i
Taschereau, H. t
•
a Fournie
-1.5 -1.0
Dimension 1
o.o 1.0 1.5
Figure 3.2: Multidimensional Scales Solution for Natural Court 2
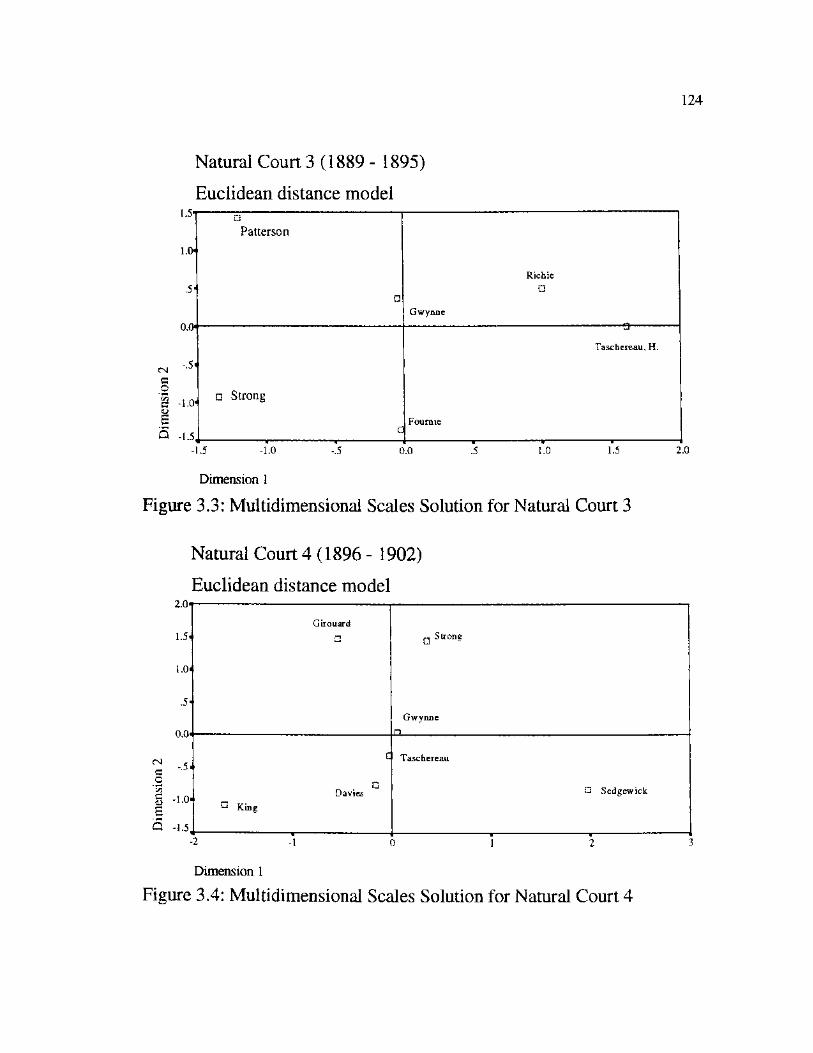
124
Natural Court 3 (1889 - 1895)
Euclidean distance model
CN € O
<• e
Patterson i
0
Richie •
Gwynne
i
, o Strong
G
Taschereau, H.
Fournie
-.5 0.0 .5 1.0 1.5 -1.5 -1.0
Dimension 1
Figure 3.3: Multidimensional Scales Solution for Natural Court 3
Natural Court 4 (1896 - 1902)
Euclidean distance model 2.0<
1.5«
1.0«
.5-
0.0-
2.0
Girouard
•
•
a Strong
Gwynne
n
a
• Davies
G King
Taschereau
• Sedgewick
<N a o "t/D
a S
-.5'
-1.0
-1.5 - 2
Dimension 1
Figure 3.4: Multidimensional Scales Solution for Natural Court 4
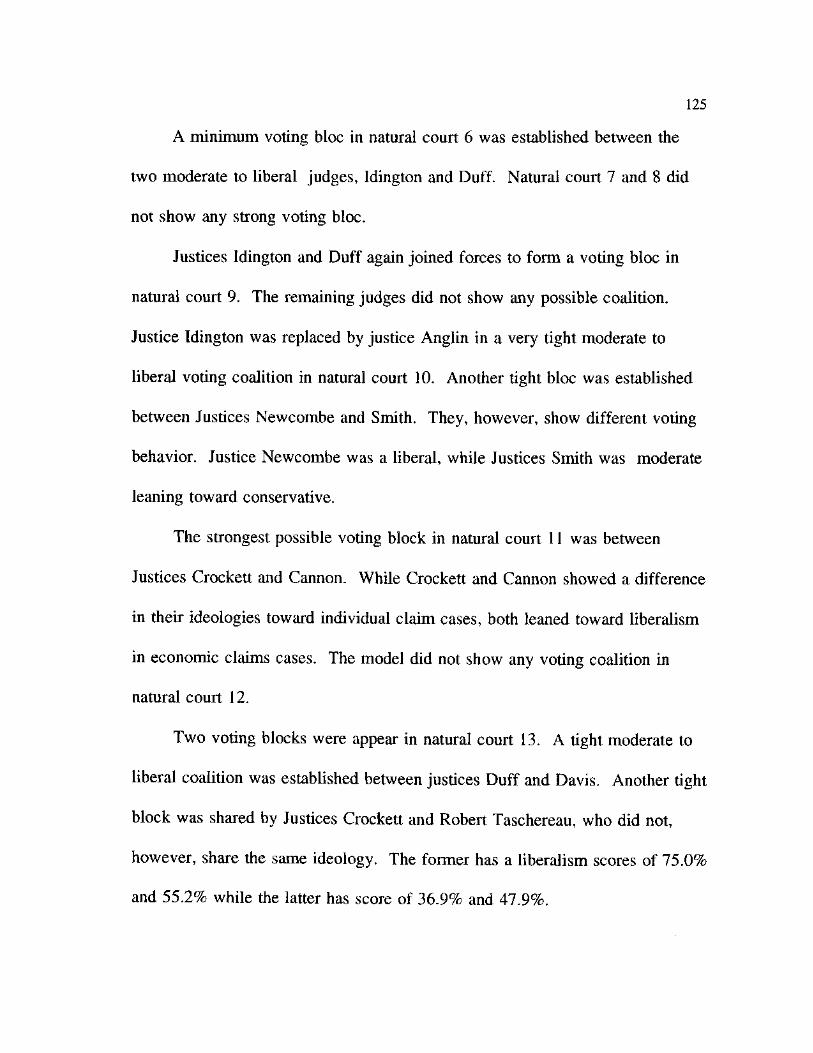
125
A minimum voting bloc in natural court 6 was established between the
two moderate to liberal judges, Idington and Duff. Natural court 7 and 8 did
not show any strong voting bloc.
Justices Idington and Duff again joined forces to form a voting bloc in
natural court 9. The remaining judges did not show any possible coalition.
Justice Idington was replaced by justice Anglin in a very tight moderate to
liberal voting coalition in natural court 10. Another tight bloc was established
between Justices Newcombe and Smith. They, however, show different voting
behavior. Justice Newcombe was a liberal, while Justices Smith was moderate
leaning toward conservative.
The strongest possible voting block in natural court 11 was between
Justices Crockett and Cannon. While Crockett and Cannon showed a difference
in their ideologies toward individual claim cases, both leaned toward liberalism
in economic claims cases. The model did not show any voting coalition in
natural court 12.
Two voting blocks were appear in natural court 13. A tight moderate to
liberal coalition was established between justices Duff and Davis. Another tight
block was shared by Justices Crockett and Robert Taschereau, who did not,
however, share the same ideology. The former has a liberalism scores of 75.0%
and 55.2% while the latter has score of 36.9% and 47.9%.
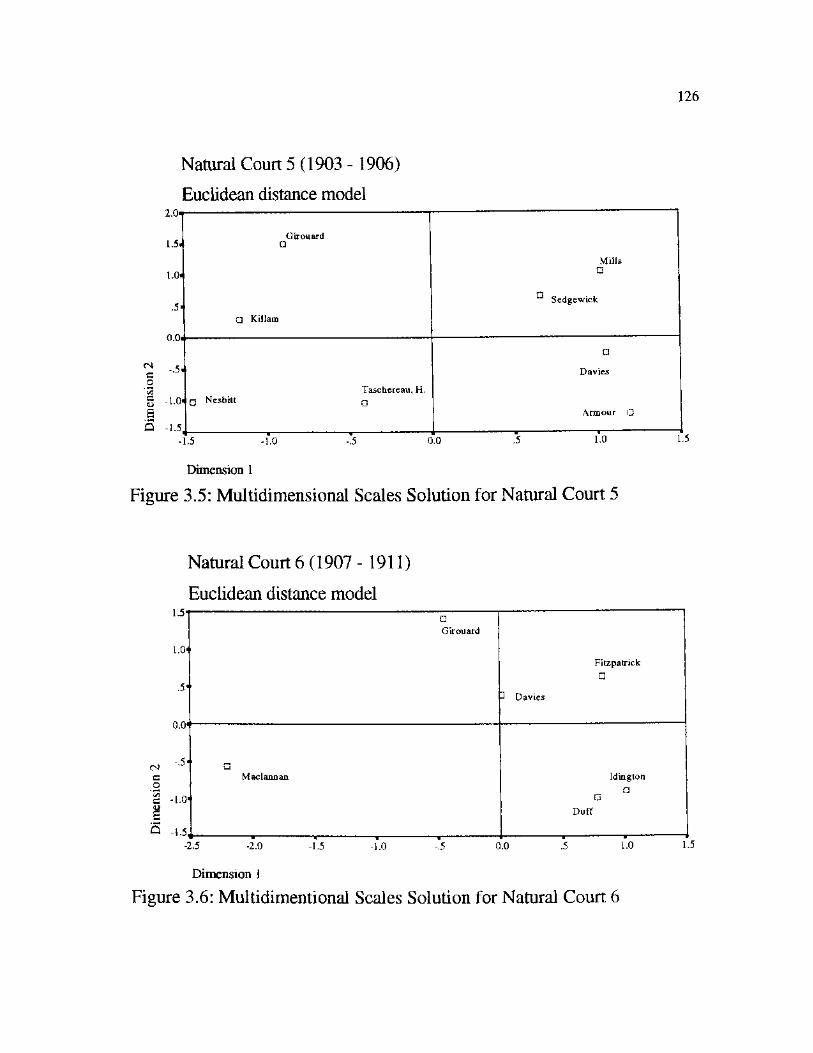
Natural Court 5 (1903 - 1906)
Euclidean distance model 2.0t
1.5.
1.0«
OJ c o
"So e
s
0.0-
-.5
-L0<
-1.5 -1.5 -1.0 -.5 0.0 1.0
Dimension 1
Figure 3.5: Multidimensional Scales Solution for Natural Court 5
126
Girouard •
Mills G
i ^ Sedgewick
• Killam
•
Davies
Taschereau, H. • iQ Nesbitt p.
Armour D
1.5
Natural Court 6 (1907- 1911)
Euclidean distance model 1.5'
1.0
<N G O
0.0'
-.5
G -1.0'
1 5 -1.5
• Girouard
l
1
Fitzpatrick
•
3 Davies
M ac latin an Idington
• G
Duff
-2.5 -2.0 -.5 0.0 -1.5 -1.0
Dimension 1
Figure 3.6: Multidimensional Scales Solution for Natural Court 6
1.0 1.5

127
Natural Court 7 (1912-1918)
Euclidean distance model 1.5'
1.0
.5'
a .2 '33 § a
0.0<
-.5«
-1.0
-1.5'
O -2.0,
• ^ Anglin Brodeur
• Fitzpatrick
G Duff ^ Id in gton
D Da vies
-1.5 -1.0 -.5 0.0 1.0
Dimension 1
Figure 3.7: Multidimensional Scales Solution for Natural Court 7
1.5
Natural Court 8(1919- 1924)
Euclidean distance model
CN a o
<D a
Davies
Duff •
• Brodeur
!
i
O Mignault
O Idington
• Anglin
-1.0 -.5 0.0 .5 1.0 1.5 -2.0 -1.5
Dimension 1
Figure 3.8: Multidimensional Scales Solution for Natural Court 8
2.0
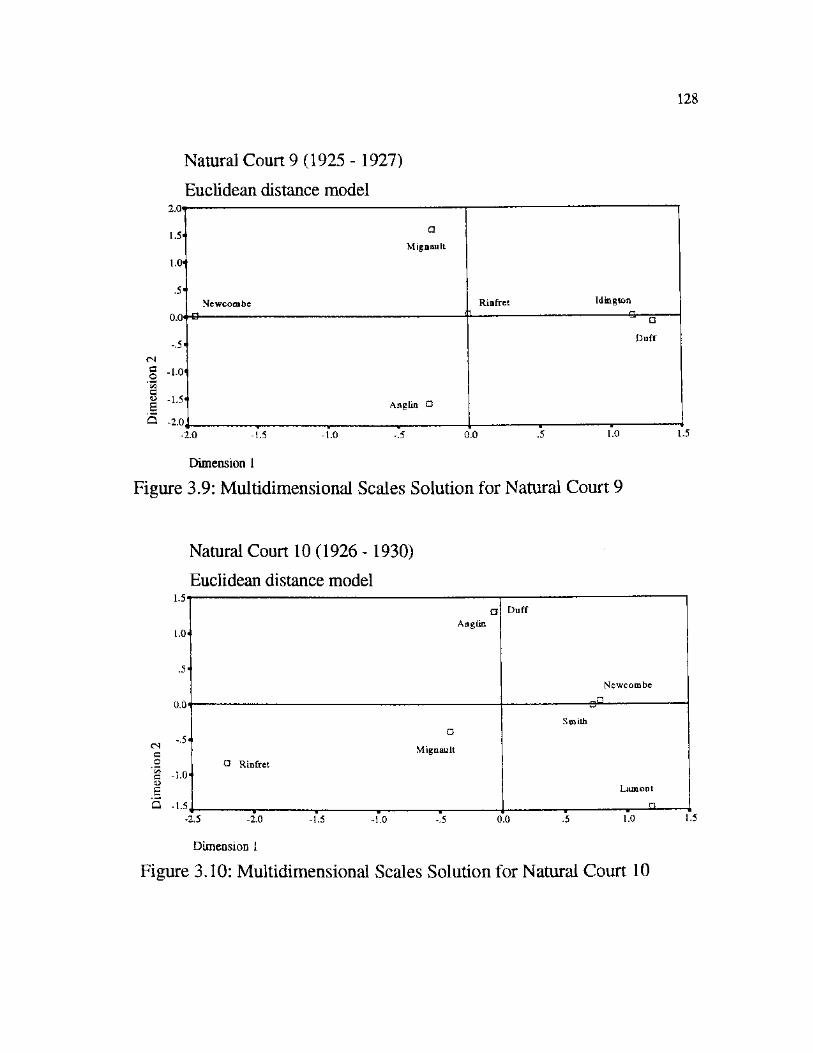
Natural Court 9 (1925 - 1927)
Euclidean distance model
-2.0 -1.5 -1.0 -.5 0.0 1.0
Dimension 1
Figure 3.9: Multidimensional Scales Solution for Natural Court 9
128
2.0"
1.5' a
Mignault
1.0-
.5-Newcombc Rinfret Idington
n 1 "• n 0.CM U •
-5« Duff
-5«
<N
1 "L01
I Anglin •
3 -2.0, , . , 1.5
Natural Court 10 (1926 - 1930)
Euclidean distance model 1.5
1.0-
0.0
- L 0
a Anglin
1
Duff
Newcombe
• Mignault
O Rinfret 1 i
Smith
Lamont
<N a o
£ Q -1.5
-2.5 -2.0 -1.5 -1.0 -.5 0.0 1.0
Dimension i
Figure 3.10: Multidimensional Scales Solution for Natural Court 10

129
Natural Court 11 (1931 - 1935)
Euclidean distance model
CM
o 'c/5 c <D s
2.0-
A Duff 1.5«
1.0«
Cannon .5« . a Rinfret
Crockett a **
A
0.0H
-.5- A Smith
A
-1.0« Lamont Hughes
-1.5 A 1.0 1.5 2.0 -2.0 -1.5 -1.0 -.5 0.0 .5
Dimension 1
Figure 3.11: Multidimensional Scales Solution for Natural Court 11
2.5
Natural Court 12 (1936 - 1939)
Euclidean distance model ! . 5 T
1.0
.5
0.0'
(N G O
-1.0
a <D s
-1.5
O -2.0
T -i & Crockett
•
Kerwin A
Hudson A
A
Davis
A Duff A
1 Cannon
Rinfret A
-1.5 -1.0 -.5 0.0 1.0 1.5
Dimension 1
Figure 3.12: Multidimensional Scales Solution for Natural Court 12
2.0
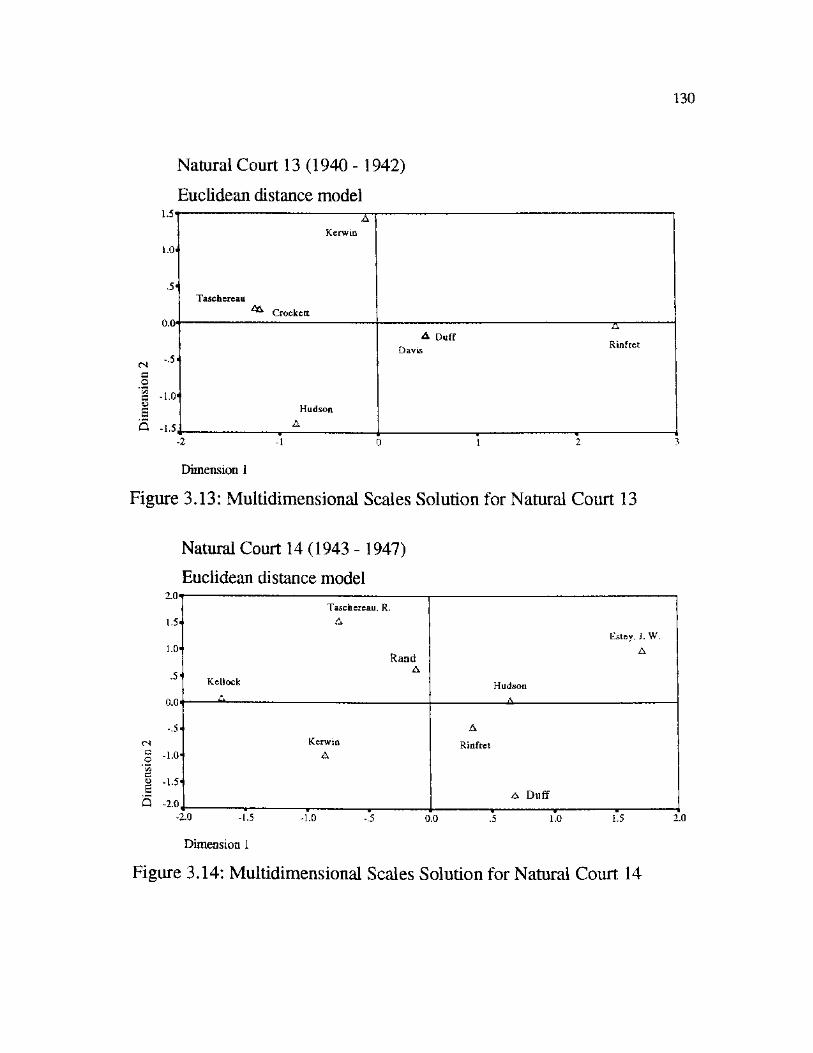
130
Natural Court 13 (1940 - 1942)
Euclidean distance model
<N G .2 C <D s
A Kerwin
<
Taschcrcau ^ Crockett
>•'
Hudson
I ^
A A Duff
~ Rinfret Davis
- 2
Dimension 1
Figure 3.13: Multidimensional Scales Solution for Natural Court 13
Natural Court 14 (1943 - 1947)
Euclidean distance model 2.0<
1.5'
1.0
.5
0.0
-.5 <N a o
*5 § -15
.§
S -2.0
Taschereau, R. i A
1 Rand
A Kellock
, A
Estey, J. W.
A
Hudson A.
«
Kerwin • A
•
— — — — i i
A
Rinfret
A Duff
-1.0 0.0 1.0 1.5 -2.0 -1.5
Dimension 1
Figure 3.14: Multidimensional Scales Solution for Natural Court 14
2.0
131
A moderate to liberal economic coalition emerges again in natural court
14. A loose center voting coalition is comprised of three justices, Rand, Rinfret
and Hudson.
Natural court 15, the first for which three member blocs required, shows a
voting bloc of three justices who are moderate to liberal in individual claims
cases. Its membership includes Justices Locke, Jame Wilfred Estey, and Rand.
Natural Court 16 did not contain a three judge block, but did depict a tight link
between Justices Kerwin and Rand.
Natural Court 17 shows a loose conservative voting block among justices
Fauteux, Locke and Abbott. This court also shows examples of pairwise
coalitions between justice Rand and Kerwin, who are moderate to liberal, and
between Justice Robert Tashchereau and Martland, who are conservative. The
voting pair of justices Kerwin and Rand was a continuation of their previous
association in natural court 16. Natural 18 again did not show any three judges
voting bloc, but did have a pair including justices Cartwright and Locke .
Natural court 19 again shows a loose conservative coalition, this time
among justices Fauteux, Ritchie and Judson. It also depicts a close pair of
conservative judges: Robert Tashereau and Abbott. This block structure
effectively disappears in natural court 20 and 21, which show only two-justice
voting coalitions.
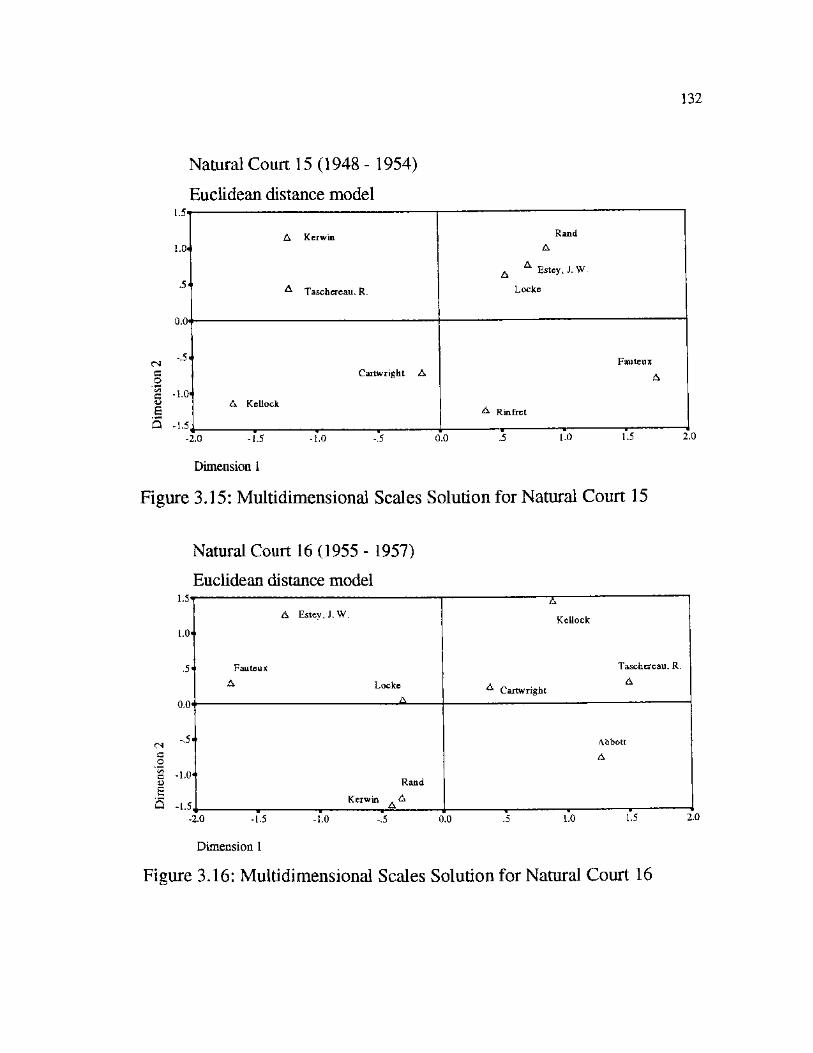
132
Natural Court 15 (1948 - 1954)
Euclidean distance model 1.5«h
1.0-« A Kerwin Rand
A
.5-^ Taschereau, R.
A A Estey, J .W.
Lockc
0.0«
Dim
ensi
on 2
£ 5
?
Cartwright A
A Kcllock
Fauteux
A
^ Rinfret
-2 ;.0 -1.5 -1.0 -.5 0
Dimension 1
.0 .5 l"o L5 2.
Figure 3.15: Multidimensional Scales Solution for Natural Court 15
Natural Court 16 (1955 - 1957)
Euclidean distance model 1.3"
1.0-
A Estey, J.W. A
KeUock O
©
Fauteux
A Lockc
A
Taschercau, R.
/ A
^ Cartwright
O
©
Dim
ensi
on 2
U
b
i
Rand
Kerwin A A A
Abbott
A
0.0 1.0 1.5 -2.0 -1.5 -1.0 -.5
Dimension 1
Figure 3.16: Multidimensional Scales Solution for Natural Court 16
2.0

133
Natural Court 17 (1958 - 1959)
Euclidean distance model 2.0«
1.5-
1.0
.5«
0.0
-.5'
<N § -1.0
§ -1-5' s <3 -2.0,
Abbott Locke . A A
x Fauteux
^ Kerwin
A Rand
Taschereau, R.
• i
A
A
A CarWright Martland
P Judson
-2.0 -1.5 -1.0 0.0 1.0 Dimension 1
Figure 3.17: Multidimensional Scales Solution for Natural Court 17
1.5 2.0
Natural Court 18 (1960 -1962)
Euclidean distance model 1.5«
1,0.
0.0'
c - 5 ' G 0
g - l .o
1 S -1.5
A Fauteux
Cartw right
A
^ Ritchie
^ Kerwin
A * Abbott T ,
Locke
Martland
A
Judson
A
Taschereau, R.
A
0.0 1.0 -2.0 -1.5 -1.0 -.5
Dimension 1
Figure 3.18: Multidimensional Scales Solution for Natural Court 18
1.5 2.0
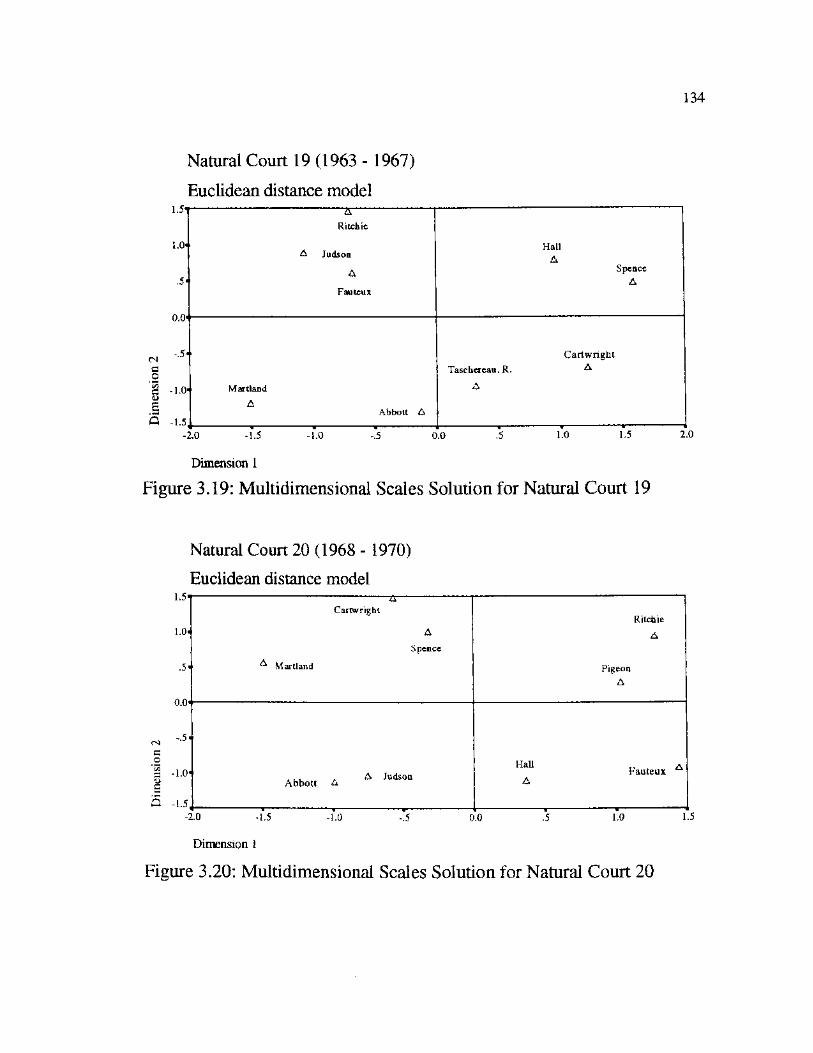
134
Natural Court 19 (1963 - 1967)
Euclidean distance model
G .2 *35 G <D s
A Ritchie
1
A Judson
A i
Fauteux
Hall A
Spence A
I
. Martland
A Abbott A
Cartw right
Taschereau, R. ^
A
-2.0 -1.5 0.0 .5 1.0 1.5 -1.0 -.5
Dimension 1
Figure 3.19: Multidimensional Scales Solution for Natural Court 19
2.0
Natural Court 20 (1968 - 1970)
Euclidean distance model
a
1.5'
1.0'
0.0
-.5
G -1.0
1 3 -1.5
25 Cartw right
A
Spence
^ Martland
Ritchie
A
Pigeon A
'
. , . . A Judson Abbott A
Hall _ A Fauteux A
-2.0 -1.5 -1.0 0.0 1.0 1.5
Dimension 1
Figure 3.20: Multidimensional Scales Solution for Natural Court 20
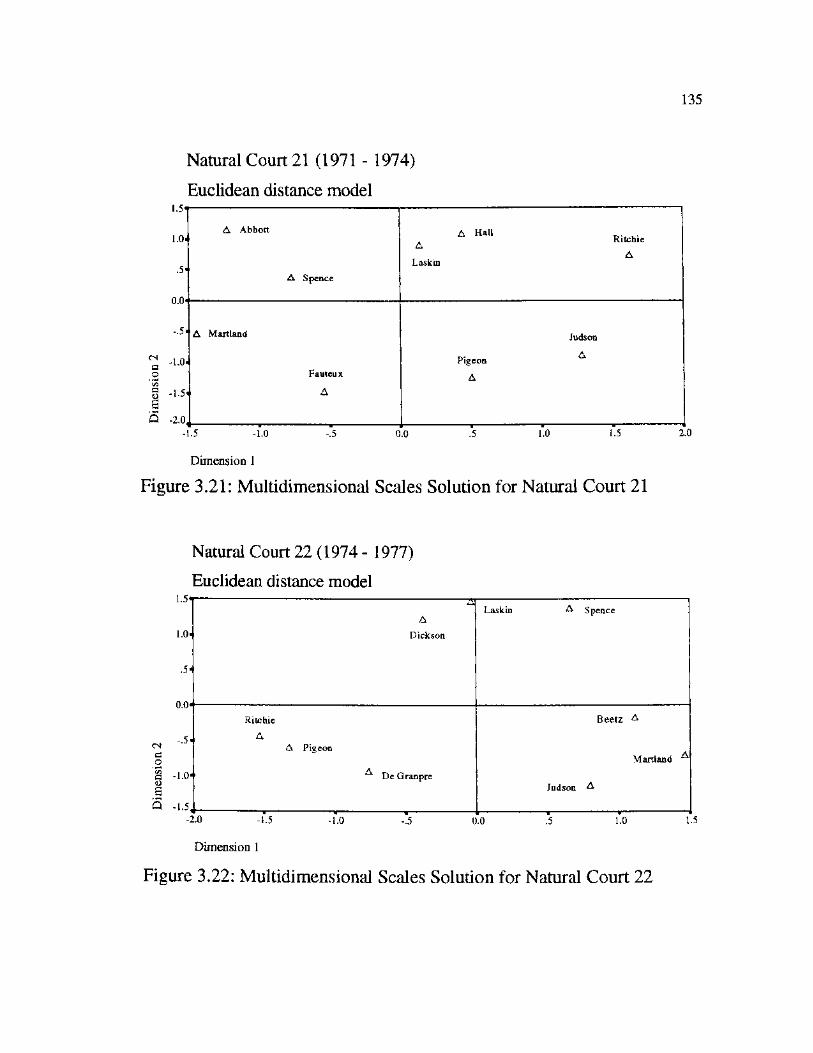
Natural Court 21 (1971 - 1974)
Euclidean distance model 1.5-
1.0<
.5'
0.0'
-.5
(N O o
i Q -2.0
-1.5 -1.0 -.5 0.0 1.0 1.5
Dimension 1
Figure 3.21: Multidimensional Scales Solution for Natural Court 21
135
A Abbott
A S pence
£ Hal1
. Ritchie A
A L ask in
A Martland
Fautcux
• A
Judson
Pigeon ^
A
2.0
Natural Court 22 (1974 - 1977)
Euclidean distance model 1.5-
1.0-
0.0'
cn " 5
a o a -i.o <D S S -1.5
2
A
Dickson
Las kin A S pence
Ritchie
A A Pigeon
^ De Granpre
Beetz A
Martland ^
Judson ^
-2.0 0.0 1.0 -1.5 -L0 -.5
Dimension 1
Figure 3.22: Multidimensional Scales Solution for Natural Court 22
1.5
136
Loose liberal and conservative voting blocs again re-emerge in natural
court 22 with justices Laskin, Dickson and Spence in the liberal group. Two
conservative groups emerge. The first consists of justices Ritchie, Pigeon and
De Granpre'; the second of Beetz, Martland and Judson. This natural court
clearly shows a division based on ideology, as one can see that all the
conservative judges occupied the lower half of the graph and the three liberal
judges occupied the upper portion. This division in the court remain in place in
natural court 23. All three member of the liberal coalition remain together, as
does a conservative coalition comprised of justices Beetz, De Granpre', and
Pratt. The liberal coalition also remain intact in natural court 24 with Justice
Lamer taking over the position of Justice Spence. The conservative block,
however, is reduced to a pair between justice Beetz and Ritchie.
The conservative coalition was completely absence in natural court 25.
There is, however, a shift of the liberal coalition into two block with Laskin,
Wilson and Lamer in one block and Dickson, Estey and Mclntyre in another.
The voting blocs of recent natural courts disappear entirely in natural court 26:
no three judges cluster closely enough together to define a block. Finally,
natural court 27 also shows no clear blocs.
The analysis presented above did not completely structure along the
ideologies dimensions in every natural court. Nonetheless, the results it reached
reveal several things about the nonunanimous decision making of the Canadian
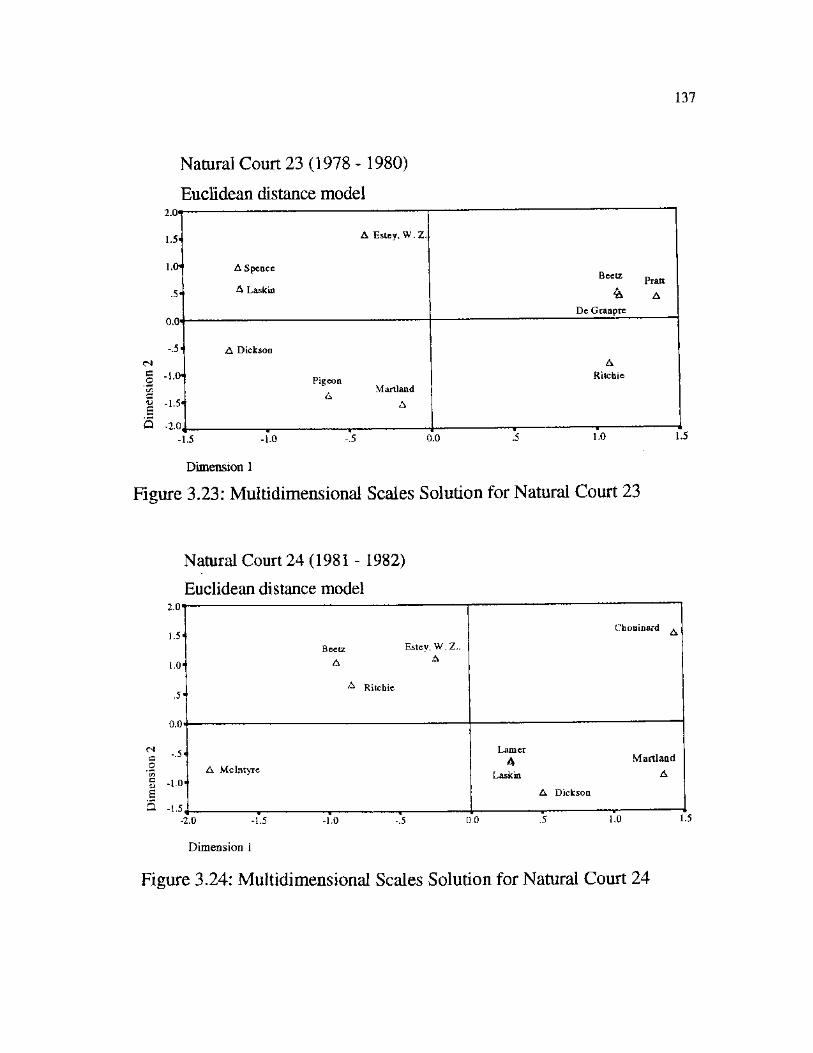
Natural Court 23 (1978 - 1980)
Euclidean distance model 2.0'
0,
-.5
<N |
C/5 C3
s S -2.(
-1.5 -1.0 -.5 0.0 1.0
137
A Estey, W. Z.
ASpcnce
, A Lask in B e e t z Pratt
^ A
De Granpre
A Dickson
Pigeon Martland
A A
A Ritchie
— i
Dimension 1
Figure 3.23: Multidimensional Scales Solution for Natural Court 23
1.5
Natural Court 24 (1981 - 1982)
Euclidean distance model
Beetz Estey, W. Z..
A A
^ Ritchie a
Chouinard ^
i
A Mclntyre
Lamer ^ Martland
Laskin A A Dickson
, .
a .2 *35 c
a S -l :
Dimension 1
Figure 3.24: Multidimensional Scales Solution for Natural Court 24
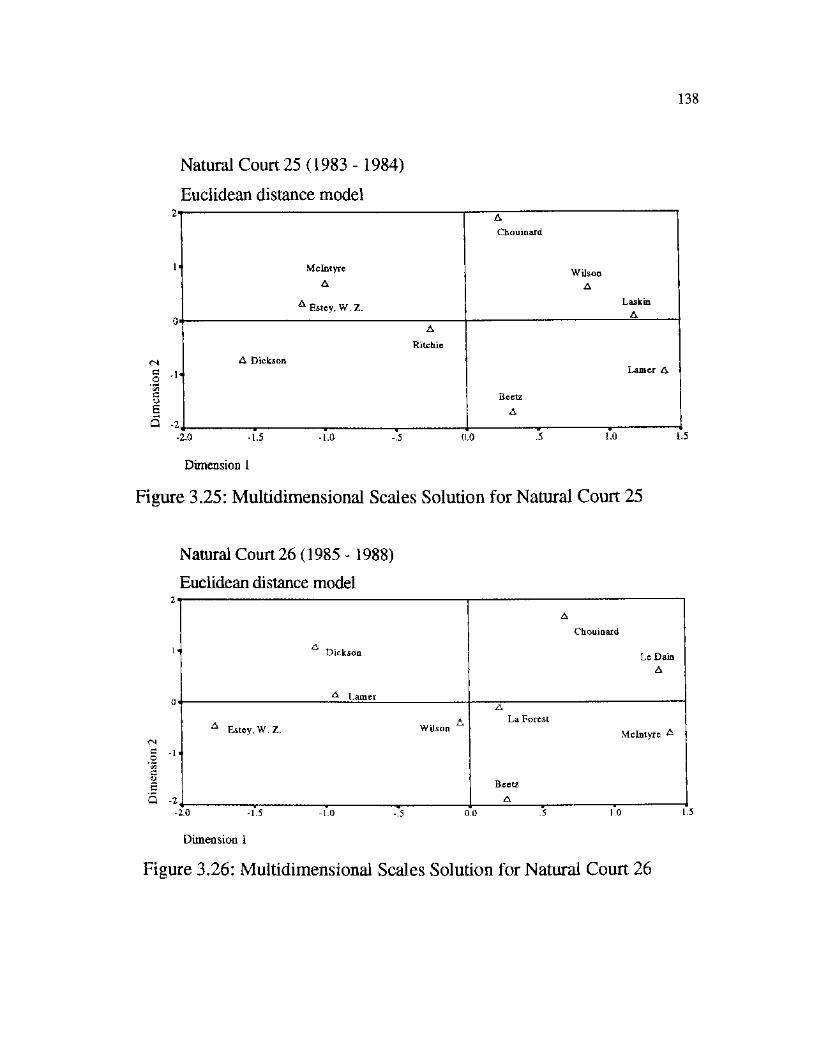
138
Natural Court 25 (1983 - 1984)
Euclidean distance model
CM a .2 G D s 5 -2
Mclntyre
A
A Estey, W. Z.
A
Chouinard
Wilson A
L ask in A
A
Ritchie
A Dickson Lamer A
Beetz
A
0.0 1.0 -2.0 -1.5 -1.0 -.5
Dimension 1
Figure 3.25: Multidimensional Scales Solution for Natural Court 25
1.5
Natural Court 26 (1985 - 1988)
Euclidean distance model
^ Dickson
& Lamer
A
Chouinard
Le Dain A
A
A A La Forest A Estey, W.Z. Wilson
1
Mclntyre &
Beetz
A
§ -1
a S -2
0.0 1.0 -2.0 -1.5 -1.0 -.5
Dimension 1
Figure 3.26: Multidimensional Scales Solution for Natural Court 26
1.5
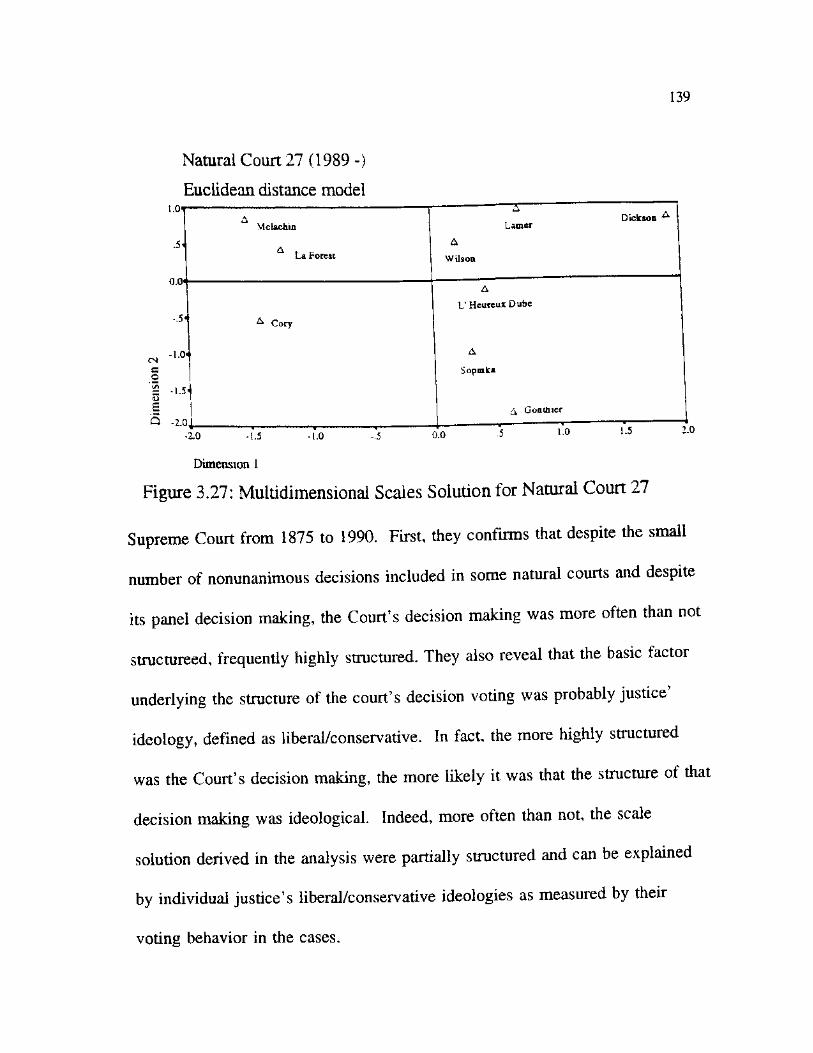
139
Natural Court 27 (1989 -)
Euclidean distance model Dickson
Mclachm
La Forest Wilson
L' Heureux Dube
& Gonthier
Dimension i
Figure 3.27: Multidimensional Scales Solution for Natural Court 27
Supreme Court from 1875 to 1990. First, they confirms that despite the small
number of nonunanimous decisions included in some natural courts and despite
its panel decision making, the Court's decision making was more often than not
structureed, frequently highly structured. They also reveal that the basic factor
underlying the structure of the court's decision voting was probably justice
ideology, defined as liberal/conservative. In fact, the more highly structured
was the Court's decision making, the more likely it was that the structure of that
decision making was ideological. Indeed, more often than not, the scale
solution derived in the analysis were partially structured and can be explained
by individual justice's liberal/conservative ideologies as measured by their
voting behavior in the cases.
140
by individual justice's liberal/conservative ideologies as measured by their
voting behavior in the cases.
The multidimensional scaling analysis also revealed that overall liberal-
conservative ideology was not the only factor structuring the Court's decision
making. Not all the voting coalitions revealed were structured on liberal-
conservative lines. Furthermore, the dimensions resulting from the scaling
analysis were not always clearly defined by liberalism-conservatism, although
frequently one of the two could have been so defined.
What are the other factors that would need to be taken into account to
explain the scaling results? Baum (1992), in his attempt to explain the changes
in policies and decision patterns in the U.S. Supreme Court pointed out three
factors:
1. Membership change;
2. Individual position change; and
3. Issue change (Baum 1992, 5).
This three changes can be conceptually distinguished in dimensional terms using
the /-point, representing justices position on a policy dimension, and the j-point,
representing the places of cases on the dimension shift (5, see also Baum 1988
for full explanation).
The multidimentional scaling analysis presented in this chapter took into
account only membership changes in the shift in the formation of the scale.
CHAPTER REFERENCES
Baum, Lawrence. 1988. "Measuring Policy Change in the U.S. Supreme Court." Amrican Political Science Review 82: 905-12.
Baum, Lawrence. 1989. "Comparing The Policy Positions of Supreme Court Justices From Different Periods." Western Political Quarterly: 509-521.
Baum, Lawrence. 1991. "Membership Change and Collective Voting Change in the United States Supreme Court." Journal of Politics 54: 3-24.
Flango, Victor E. and Craig R. Ducat. 1977. "Toward an Integration of Public Law and Judicial Behavior." The Journal of Politics 39: 41-72.
Fouts, Donald E. 1969. "The Supreme Court of Canada, 1950-1960." In Comparative Judicial Behavior: Cross-Cultural Studies of Political Decision-Making in the East and West, eds. Glendon A. Schubert and David J. Danelski. New York: Oxford University Press.
Gibson, James L. 1983. "From Simplicity to Complexity: The Development of Theory in The Study of Judicial Behavior." Political Behavior 5: 7-49.
Hensley, Thomas R. 1981. "Studying the Studies: Political Science Research on Judicial Politics, 1961-1980." Paper presented to the Annual Meeting of the Midwest Political Science Association, Cincinnati, April 15-18.
Mclver, John P. 1976. "Scaling Judicial Decisions: The Panel Decision making Process of the U.S. Courts of Appeals." American Journal of Political Science 20: 749-61.
Peck, Sydney L. 1967a. "A Behavioral Approach to the Judicial Process: Scalogram Analysis." Osgoode Hall Law Journal 5: 246-70.
Peck, Sydney L. 1967b. "The Supreme Court of Canada (1958-1966): A Search for Policy through Scalogram Analysis." Canadian Bar Review 45: 666-726.
141
142
Peck Sydney L. 1969. "A Scalograme Analysis of the Supreme Court of Canada, 1958-1967." In Comparative Judicial Behavior, Cross-Cultural Studies of Political Decision-Making in the East and West, eds Glendon A. Schubert and David J. Danelski. New York: Oxford University Press.
Pritchett, C. Herman. 1948. The Roosevelt Court: A Study in Judicial Politics and Values, 1939-1947. New York: MacMillan Co.
Russell Peter H. 1970. Supreme Court of Canada as a Bilingual and Bicultural Institution. Ottawa: Information Canada.
Schubert, Glendon A. 1965. The Judicial Mind: Attitudes and Ideologies of Supreme Court Justices. 1946-1964. Evanston, IL: Northwestern University Press.
Schubert, Glendon A. 1969. ed., Judicial Behavior: A Reader in Theory and Research. Chicago: Rand McNally and Co.
Schubert, Glendon A. 1972. "Judicial Process and Behavior, 1963-1971." In Political Science Annual: An International Review, ed. James A. Robinson. Indianapolis: Bobbs-Merrill.
Schubert, Glendon A. 1974. The Judicial Mind Revisited: Psychometric Analysis of Supreme Court Ideology. New York: Oxford University Press.
Schubert Glendon and David Danelski 1969. eds. Comparative Judicial Behavior. Cross-Cultural Studies of Political Decision-Making in the East and West. New York: Oxford University Press.
Sittiwong, Panu. 1985. Canadian Supreme Court Decision-Making: The Personal Attribute Model in Explaining Justices' Patterns of Decision-Making, 1949-1980. Master Thesis, North Texas State University.
Tanenhaus, Joseph. 1966. "The Cumulative Scaling of Judicial Decisions." Harvard Law Review 79: 1583-1594.
Tate, C. Neal. 1983. "The Methodology of Judicial Behavior Research: A Review and Critique." Political Behavior 5: 51-82.
Thurston, Louis and J. W. Degan. 1951. "A Factorial Study of the Supreme Court." Preceeding of the National Academy of Science 37: 628-635 as reprinted in Judicial Behavior: A Reader in Theory and Research, ed. Glendon A. Schubert. 1964. Chicago: Rand McNally.
CHAPTER 4
EXPLAINING INDIVIDUAL JUSTICES' DECISION MAKING
Chapter Two discussed the decision making of the Canadian Supreme
Court as a political institution, and Chapter Three focused on group interaction
in the decision making process. It showed that there were significant
differences in individual justices' liberalism, although the analysis in Chapter
Three did not always show the voting blocks in each natural court falling along
the ideological dimensions. Nonetheless, its results confirm some of the
underlying assumptions concerning the role of justices' ideology in their voting
behavior. More often than not, the scale solutions derived in the analysis were
partially structured and could be partially explained by individual justices'
liberal/conservative ideologies as measured by their voting behavior in the
various kinds of cases. This chapter focuses on an effort to explain the justices'
individual ideology. It does so by assuming that these differences result from
their life experiences or social and personal backgrounds, among other things.
The idea that personal attributes affect judicial decisions has long been
assumed by scholars injudicial politics. In the 1920s Charles G. Haines stated
that:
143
144
There is . . . a marked opportunity for individual influences in the collective judgement such as is rendered by the Supreme Court. As an individual's views in political and legal matters are likely to be in part. . .determined by his interest, training, environment and long-continued associations, it is suggestive [that] personal factors [are] likely to influence judicial decisions (Haines 1922, 49).
He then oudined the personal factors that are likely to influence decision
making: remote and indirect factors such as education in general, legal
education, family and personal associations; and direct factors such as legal and
political experience, political affiliations and opinions, and intellectual and
temperamental traits (49).
Despite his theoretical suggestion, there were no systematic efforts to
measure its validity until the 1960s. Most of the research conducted was
primarily descriptive and involved the collection and organization of a variety of
background data such as age, ethnic and religious affiliations, parental
occupation, career patterns, prior judicial office, party affiliation, education, and
so forth.1 The number of factors being included in these studies was limited
only by the availability of data or the imagination of the researchers (Tate 1972,
317).
Further development was made during the 1960s. The new line of inquiry
involved attempts to relate background characteristics to actual decision patterns.
One of the first systematic efforts was published by John R. Schmidhauser
(1963a). In his study of U.S. Supreme Court voting records between 1837 and
1860, he examined the relationship of regional background to the decisions in

145
52 major cases involving "sectional rivalry." He found that party affiliation and
regional background were significant factors in explaining justices' positions on
a scalogram of "regional divisive" cases (503).
In a second study, Schmidhauser (1963b) sought to find the relationship
between a series of background factors and the propensity of justices of the
Supreme Court to adhere to precedent, to dissent from majority opinions, and to
abandon stare decisis. He concluded that a number of judicial background
characteristics, ~ e.g. family background, regional origins, political party
affiliation, and prior judicial experience — appeared to be related to the tendency
of Supreme Court justices to dissent and to abandon stare decisis (518).
Following Schmidhauser's path breaking efforts, several other similar
studies subsequently appeared.2 In particular, Don Bowen (1965) sought further
to develop the judicial decision making approach. In his study, he not only
asked if there were statistically significant relationships between judges'
background characteristics and voting behavior, he also sought to test the value
of these associations by asking how much of the variation in decisions they
explain. Bowen applied partial and multiple regression in his study. Its results
showed that "the amount of variance explained by any single characteristic is
generally quite low. . . . [However], when all six characteristics are considered
together, the amount of variance explained is much better."
146
Despite all these systematic efforts to measure their explanation potential of
attribute factors, the results were mixed. Some studies found the model
significant in explaining justices' decisions. Success, however, was limited, and
some studies found no significant relationships at all (Tate and Sittiwong 1987,
10).
As a consequence, judicial politics scholars accepted the notion that
personal attribute models were only moderately successful in explaining the
justices' voting behavior. The studies by Ulmer (1973) and Tate (1981),
however, questioned this consensus. Ulmer (1973), in particular, warned against
the "risk of premature disclosure" on the merit of the model (627). Tate's
(1981) finding supported the claim made by Ulmer. In his study of the U.S.
Supreme Court during the 1946-47 term to the 1977-78 term, Tate found that
72-87% of the variation in justices' voting behaviors in civil rights and liberties
and economics could be accounted for by two sets of five and six personal
attribute variables (Tate 1981, 361). The model for liberalism in civil liberty
cases included party identification, appointing president (Truman, Johnson, and
Nixon), region, extent of judicial experience, and type of prosecutorial
experience. The economic liberalism model included party identification,
appointing president (Truman and Nixon), prestige of prelaw education,
appointed from elective office, extent of judicial experience, and type of
prosecutorial experience variables.

147
A later study by Ulmer suggested an important limitation of the model. He
starts by asking the question "Are social background models time-bound?" and
answered "yes" (1986, 965). He found that a single personal attribute model
provides different results when applied to two different time frames (964).
Ulmer's model, however, differed substantially from Tate's models. The
personal attribute variables included whether a justice's father was a state or
federal government officer, whether the justice was a first born child, and the
justice's party affiliation. The only common variable in Ulmer's and Tate's
models is justices' party identification. The dependent variable in the model is
the ratio between a justice's percentage of support of government litigants and
the percentage of each court in such cases. Hence, it was possible that Ulmer
found a different result from Tate since their models are incompatible.
Tate and Handberg, however, sought to qualify Ulmer's finding. By
carefully specifying appropriate case content and personal attributes, they were
able to produce a moderately successful personal attribute model capable of
explaining 47% and 51% of the voting variation for U.S. Supeme Court justices
who served during 1916 to 1988 (1991, 477). Since their model covers a long
period of social, economic, and political changes, Tate and Handberg were able
to confirm that it is possible that students of judicial voting behavior can build a
model independent of the time dimension.

148
All of the research discussed above is parochial in nature because it
focuses solely on the United States judicial system. Virtually no attempt has
been made to expand the model beyond its original cultural context, i.e., to
countries other than the United State. To my knowledge, only two such studies
have been published. Tate (1972) applied Bowen's model and method to the
study of the Philippine Supreme Court. His findings, however, were not quite
as impressive as those he reported for the U.S. Supreme Court. In another study
on the Canadian Supreme Court, Tate and Sittiwong (1989) applied the personal
attribute model to explain liberalism in civil liberties and economic issues cases
for 27 Supreme Court justices who served in the Court during the 1949 to 1985
period. The study found that 73% of variance in justices' liberalism in civil
liberty cases could be explained by four personal attribute factors: a non-
Quebec/Catholic index, Liberal party appointees, appointment by prime minister
Mackenzie King, and prior political office experience. In addition, the study
was able to explain 70% of the variation of justices' liberalism scores in
economic claims cases with a model consisting of three of the personal attribute
factors used in the former model (pp. 911-912). The ability to duplicate Tate
and Handberg's long term study for Canada is important to the develpment of
the personal attribute model across nations and over time.
The analysis in this chapter try to extend the success of the previous study
(Tate and Sittiwong 1989). It will expand the time period to include all justices

149
who served on the Canadian Supreme Court from 1875 to 1990. Its purpose is
to replicate the previous analysis and to specify the structure of a Canadian
Supreme Court personal attribute model that is significant and consistent both
across substantive case types and across time.
Structure of Canadian Personal Attributes Model
Theory in judicial decision making suggests the inclusion of several factors
such as personality, role, and work groups factors in the model in addition to
personal attributes (Gibson 1983; Tate 1981). Such a model, however, will be
difficult to operationalize and measure, especially if one is concerned with the
longitudinal study of justices' decision behavior. A less-than-theoretically-
optimum model can also be useful in such circumstances, especially when it was
carefully constructed and applied. Tate points out that a more carefully
constructed model will probably allow one to approximate the more complex
and theroretical appealing model (1981, 363-365).
The stucture of the Canadian political system and previous studies of the
Canadian Supreme Court suggest the following factors should be important in
explaining judicial voting behavior.
Social Cleavage Measures
Region and Language: The impacts of region and language on the
Canadian political system are enormous. The Atlantic provinces (Newfounland,
New Brunswick, Nova Scotia), Quebec, Ontario, and the prairie and western
150
provinces (Manitoba, Saskatchewan, Alberta, and British Columbia) have
distinctive political cultures that should lead justices from those provinces to
vote differently.3 Table 4.1 presents the provincial representation of Canadian
Supreme Court justices.
Despite the statute mandating three Quebec judges in each natural court,
Ontario has contributed the most justices with 24 (35.8%), while Quebec is
second with 21 judges (32.3%). The Atlantic and prairies and western provinces
share the remaining one-third. The natural court composition from 1949 to
1980 was consistently one judge from the Atlantic provinces, three from Quebec
and Ontario, and two from the prairie and western provinces. As the prairie and
western provinces become more important in Canada, the natural court
composition after 1980 shifted to one judge from the Atlantic provinces, three
judges from Quebec and the prairie and western provinces, and two judges from
Onatario. This regional pattern of appointments of course can be interpreted as
a reflection of the population, sectionalism, and regionalism of Canadian
politics.
Religion: The impact of religious ideologies on politics is widely
understood. In Canada, the impact of the Roman Catholic church was
prominent, especially prior to the 1960s, in Quebec (Jackson, Jackson, and
Baxter-Moore 1986, 98). Also, Quebec Catholics differ from Catholics in other
provinces (Christian 1983, 114). Religious impact, however, is not easy to
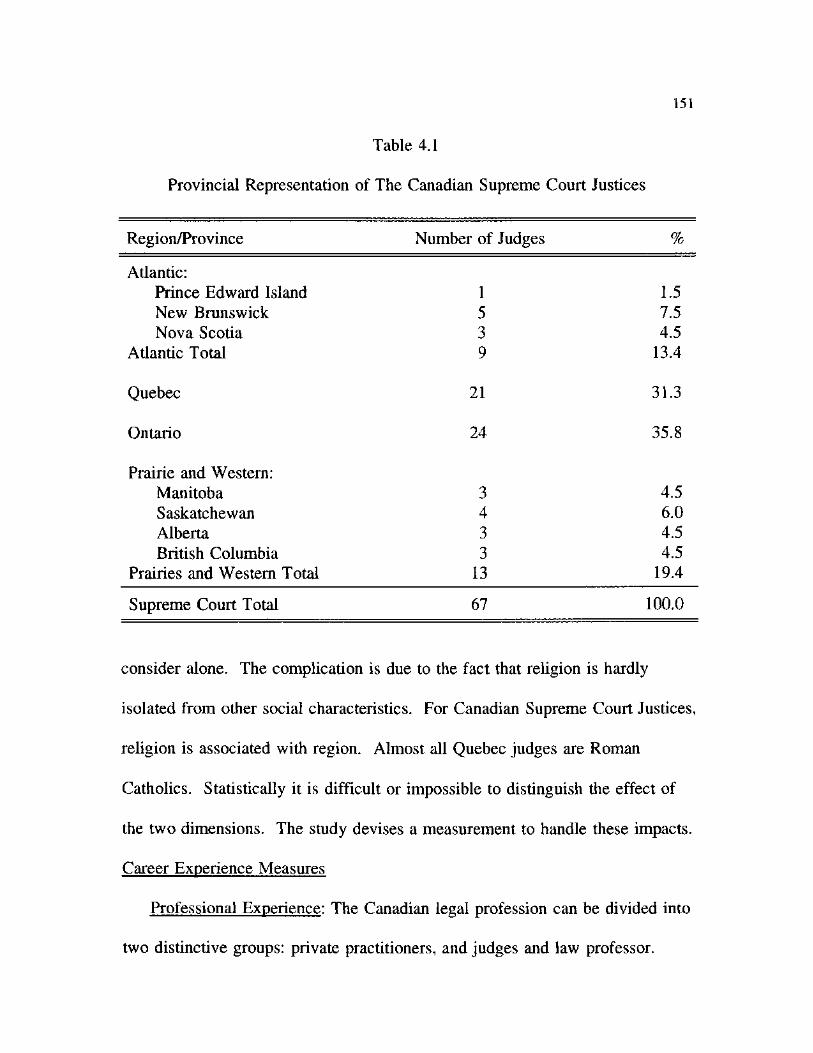
151
Table 4.1
Provincial Representation of The Canadian Supreme Court Justices
Region/Province Number of Judges %
Atlantic: Prince Edward Island 1 1.5 New Brunswick 5 7.5 Nova Scotia 3 4.5
Atlantic Total 9 13.4
Quebec 21 31.3
Ontario 24 35.8
Prairie and Western: Manitoba 3 4.5 Saskatchewan 4 6.0 Alberta 3 4.5 British Columbia 3 4.5
Prairies and Western Total 13 19.4
Supreme Court Total 67 100.0
consider alone. The complication is due to the fact that religion is hardly
isolated from other social characteristics. For Canadian Supreme Court Justices,
religion is associated with region. Almost all Quebec judges are Roman
Catholics. Statistically it is difficult or impossible to distinguish the effect of
the two dimensions. The study devises a measurement to handle these impacts.
Career Experience Measures
Professional Experience: The Canadian legal profession can be divided into
two distinctive groups: private practitioners, and judges and law professor.
152
While some of the Canadian Supreme Court justices engaged in both
professions in their career prior to the appointment, the extent of their practice
in each area was different. This difference will be used to classify judges' prior
experiences. In addition, the study will also look at their last position prior to
the Supreme Court appointment as another criterion. The study hypothesizes
that judges who were private practitioners, whose economic well-being relies on
their services to the wealthy and powerful interests, are rarely likely to litigate
for individuals in civil liberties and the underdog in economic cases. Career
judges and professors, on the other hand, have a professional responsibility to
consider all sides of legal issues, and are not directly dependent upon service to
the wealthy and powerful. Hence, they are hypothesized to have different
patterns of voting behavior than those with private practice experience.
Judicial Experience: Previous research on Canada (Tate and Sittiwong 1989)
and a study on the U.S. Supreme Court (Tate, 1981) found that the extent of
judicial experience has a positive effect on justices' liberalism in their voting
behavior.
Prosecutorial Experience: One would expect that judges who had some
prosecutorial experience would be more conservative in civil liberties cases than
those who did not have such experience. A prosecutor represents the
government in civil liberties cases against those individuals who make a claim
to those rights; hence, they will have to defend the government's rights more
153
than the individual's. In economic cases, on the other hand, they will be more
liberal since they will defend the government in business regulation cases.
Political Experience: Another subset of Canadian Supreme Court justice
appointees came from the political scene, especially in the early period.
Because political activities allow one to interact actively with the masses, they
will tend to increase a justices' sympathy for individual claimants and economic
underdog. The study thus hypothesizes that justices who had some previous
experience in politics will be more sympathetic to liberal interests than those
who did not have any political experience.
Partisanship Measures
Political Party of Appointing Prime Minister: Although the literature on
mass voting behavior and judicial attribute model suggests the relationship
between party affiliation and voting behavior, this study could not find party
identifications for all Supreme Court justices. Literature on the Canadian
Supreme Court, however, showed that each prime minister during 1875 to 1968,
who had a chance to appoint justices to the Supreme Court, was likely to
appoint judges who shared his party affiliation (Adam and Cavalluzzo 1969,
77-8). Adam and Cavalluzzo also note that their findings tend to confirm the
belief of many Canadians that "appointments to the Supreme Court are 'political
gifts' given to old party faithful" (77). Therefore, the use of prime ministers'
political party affiliation as a surrogate to justice's party affiliation is
154
appropriate. The study was able to identify party affiliation of 34 judges.
Eleven judges were members of the Progressive Conservative party, and 7 of
them were appointed to the Supreme Court by the Progressive Conservative
prime ministers. There are 23 judges who identified themself as member of
Liberal party, and 22 of them were appointed to the Court by Prime Ministers
from the Liberal party.
Appointing Prime Minister: If Canadian prime ministers conciously appoint
judges to the Supeme Court partially based on their common party
identification, we can assume that they did so in order to carry out some of their
policy preferences through the Court. Hence, the study hypothesizes that
justices who were appointed by a particular prime minister will have a
distinctive voting behavior compared to other judges.
From 1875 to 1990, sixty seven Supreme Court justices were appointed by
thirteen prime ministers. Table 4.2 presents the list of prime ministers and the
number of justices they appointed.
Overall, despite the domination of the Liberal party in Canadian politics,
prime minister from both parties had almost an equal chance to appoint justices
to the Supreme Court. Thirty-four justices were appointed by prime ministers
from the Liberal party while 33 were Conservative party appointees. Prime
Minister Laurie appointed the most justices (11) to the Court, and Trudeau was
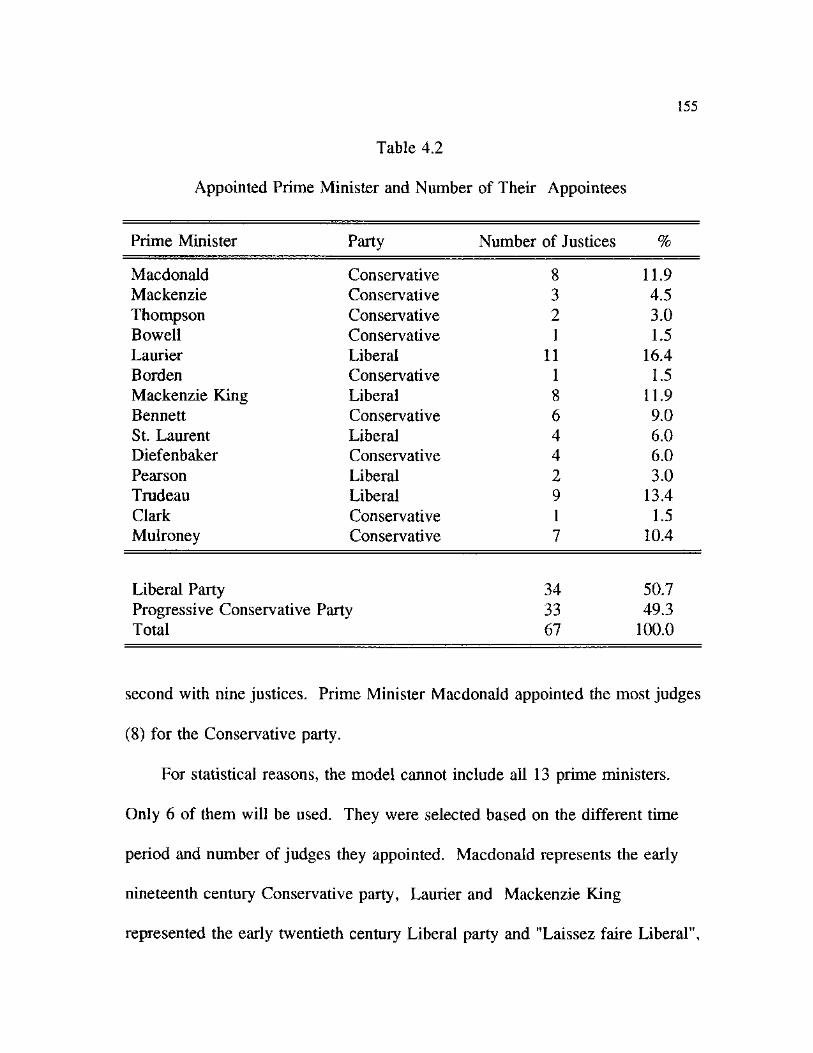
155
Table 4.2
Appointed Prime Minister and Number of Their Appointees
Prime Minister Party Number of Justices %
Macdonald Conservative 8 11.9 Mackenzie Conservative 3 4.5 Thompson Conservative 2 3.0 Bowell Conservative 1 1.5 Laurier Liberal 11 16.4 Borden Conservative 1 1.5 Mackenzie King Liberal 8 11.9 Bennett Conservative 6 9.0 St. Laurent Liberal 4 6.0 Diefenbaker Conservative 4 6.0 Pearson Liberal 2 3.0 Trudeau Liberal 9 13.4 Clark Conservative 1 1.5 Mulroney Conservative 7 10.4
Liberal Party 34 50.7 Progressive Conservative Party 33 49.3 Total 67 100.0
second with nine justices. Prime Minister Macdonald appointed the most judges
(8) for the Conservative party.
For statistical reasons, the model cannot include all 13 prime ministers.
Only 6 of them will be used. They were selected based on the different time
period and number of judges they appointed. Macdonald represents the early
nineteenth century Conservative party, Laurier and Mackenzie King
represented the early twentieth century Liberal party and "Laissez faire Liberal",
156
and Trudeau represents the contemporary Liberal party. Mulroney represents
the contemporary Progressive Conservative party.
The literature on political culture and voting behavior suggests several
other social cleavage factors such as class, gender, education, and urban/rural
distinctions (see Lipset and Rokkan 1967). They are not applicable to the
Canadian Supreme Court justices. In general, they are elites who came from an
upper-class, and whose education was much higher than other common
Canadians due to their special requirements for the position. Gender is barely a
factor since only three women have served on the Supreme Court from 1875 to
1990, and all three were serving in the last natural court. Education experience,
especially legal education, is excluded because it is inherent in the regional
measurement. In addition, previous research (Sittiwong 1985) found that there
is very little variation in the justices' educational background, especially in their
legal education, despite the fact that Canada has two legal cultures, common law
and civil law. All non-Quebec judges graduated from major universities in
English-speaking provinces. Quebec judges usually attended law school within
the province of Quebec and have additional training from Universities in
Ontario. (Sittiwong 1985, 59-61). In addition, when one discuss Quebec/non-
Quebec, it also implies the distinction between French and English language,
and, in legal tradition, a civil and common law legal culture as well. Appendix
C presents the list of all Supreme Court justices and selected personal attributes.
157
Research Design
Dependent and Independent Variables
The dependent variable is individual justices' voting behavior measured as a
percentage of liberalism in individual claims and economics cases. These scores
were reported earlier in Chapter 3.
The independent variables, summarized in Table 4.3, will be operationalized
by measuring various aspects of the personal backgrounds of judges who are
included in the study. Two of the 14 variables (Private Practice and Prior
Judicial Experience) are measured in years, 1 variable (Region and Religion
Index) is assigned on a scale from 1 to 4, and the remaining variables are
measured as dichotomous variables. Most of the variables are straightforward in
their operationalization and do not need any explanation. The Region and
Religion Index, however, requires some discussion. As mentioned above,
religion is correlated with being from Quebec. Their Pearson correlation
coefficient is .57 for the individual claims model and .59 for the economic
model. As expected, Catholicism is positively correlated with liberalism when
one controls for Quebec/non-Quebec origin, and Quebec is negatively correlated
with liberalism. Hence, to control for these collinearities and to properly
represent the relationship between Quebec regional origin, Catholicism and
liberalism in juditial voting behavior, the study constructs a region/religion index
as presented in Table 4.3. The index is scored so that higher values are

158
Table 4.3
Operationalization of Personal Attribute Factors
Variable Operationalization
Social Cleavages Measures:
Western/Eastern
Region and Religion
Professional Experience Measures:
Private Practice Prosecutory Experience
Law Professor
Judicial Experience
Political Experience
Partisanship Measures:
0 = Eastern 1 = Western 1 = Quebec Non-Catholic 2 = Quebec Catholic 3 = Non-Quebec Non-Catholic 4 = Non-Quebec Catholic
Number of years 0 = none 1 = some prosecutory experience 0 = none 1 = some teaching experience Number of years of judicial experience prior to appointment 0 = none 1 = Some political experience
Political Party of Appointing 0 = Conservative Prime Minister 1 = Liberal Appointing Prime Minister 0 = Macdonald 1 = Others
0 = Laurier 1 = Others 0 = Mackenzie King 1 = Others 0 = Bennett. 1 = Others 0 = Trudeau 1 = Others 0 = Mulroney 1 = Others
159
expected to be associated with liberalism, i. e. the score of one is assigned to
non-Catholic Quebecois (the most conservtive), and the highest score of 4 is
assigned to non-Quebecois Catholic (the most liberal).
Methods and Findings
The study employed the Ordinary Least Squares (OLS) regression
estimation technique to fit the models. Three separate models were estimated
for each of the dependent variables. Based on previous study (Tate and
Sittiwong 1989), the first model includes only justices who served during 1949
to 1990, the second model includes justices who served prior to 1949, and the
third model includes all justices. Initially, the study estimated the models by
including all attribute variables. This initial analysis resulted in models that
included six attribute factors as potential predictors of justices' liberalism. The
study then reestimated the model by including only those variables that were
significant. Tables 4.4 to 4.6 presents the OLS estimation of the six models.4
Liberalism in Individual Claims Model: Of the three models estimated for
individual claims scores, only one (for all justices) did not produce a statistically
significant regression in explaining the variation in justices' liberalism scores.
The model for the post-1949 period suggests that liberalism in justices' voting
behavior is a function of being a non-Quebec Catholic judge who has prior
experience in private practice, previously held a political office, previouly served
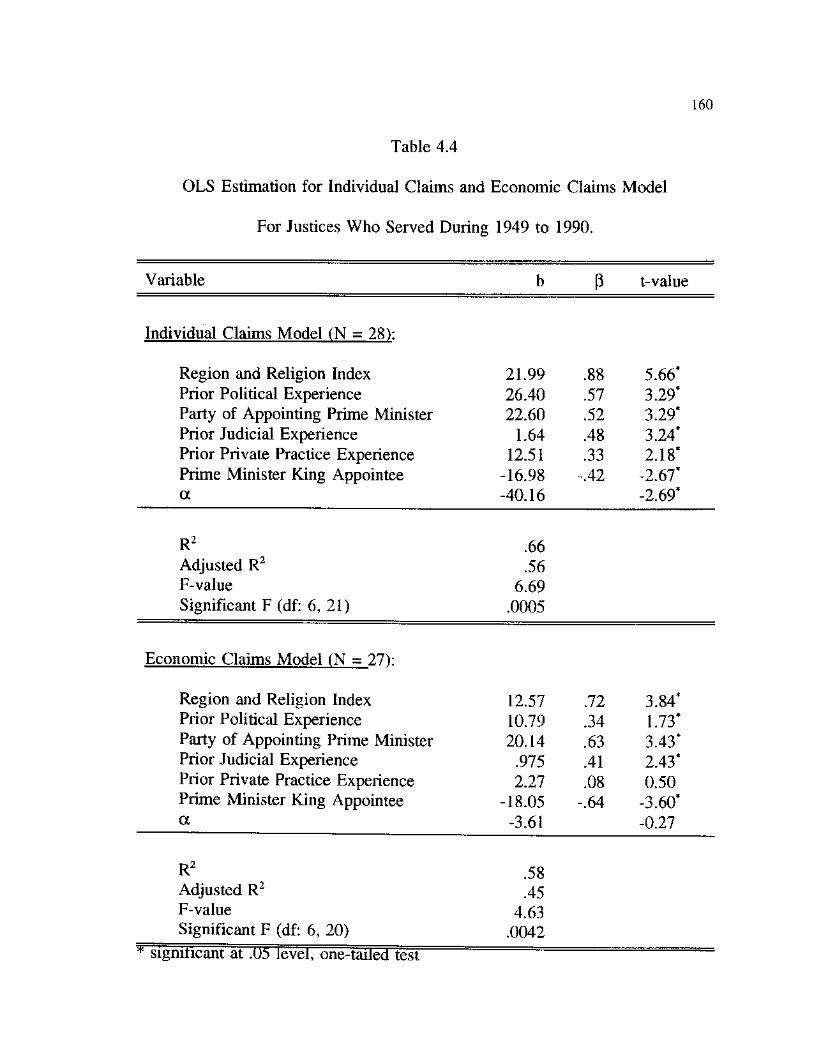
160
Table 4.4
OLS Estimation for Individual Claims and Economic Claims Model
For Justices Who Served During 1949 to 1990.
Variable b P t-value
Individual Claims Model (N = 28):
Region and Religion Index 21.99 .88 5.66* Prior Political Experience 26.40 .57 3.29* Party of Appointing Prime Minister 22.60 .52 3.29* Prior Judicial Experience 1.64 .48 3.24* Prior Private Practice Experience 12.51 .33 2.18* Prime Minister King Appointee -16.98 -.42 -2.67* a -40.16 -2.69*
R2 .66
Adjusted R2 .56 F-value 6.69 Significant F (df: 6, 21) .0005
Economic Claims Model (N = 27):
Region and Religion Index 12.57 .72 3.84* Prior Political Experience 10.79 .34 1.73* Party of Appointing Prime Minister 20.14 .63 3.43* Prior Judicial Experience .975 .41 2.43* Prior Private Practice Experience 2.27 .08 0.50 Prime Minister King Appointee -18.05 -.64 -3.60* a -3.61 -0.27
R2 .58
Adjusted R2 .45
F-value 4.63 Significant F (df: 6, 20) .0042
* significant at .05 level, one-tailed test
161
as judge in another court, was appointed to the court by a Liberal party prime
minister, and was a non-Mackenzie King appointee.
The model predicts the most conservative score as a non-Catholic
Quebecois, who was neither experienced as a lawyer, judge, nor politician.
He/She was appointed to the Supreme Court by a Conservative prime minister
or by Prime Minister King.
The above discussed model successfully explained two-thirds of the
variation in justices' voting score (R2 for the model is .66 with Adjusted R2 of
.55).5 The other two models did not have the same success. The initial
estimation of the pre-1949 model did not produce an equation that was
statistically significant. When the model was reestimated using the same factors
as in the post- 1949 model, it produced a moderate result in predicting
liberalism in individual claims (see Table 4.5). The model produces an R2 of
.27 and the adjusted R2 of .18. Two variables, Region and Religion Index and
Party of Appointing Prime Minister, are statistically significant as the predictors
in the model. This model suggests that the most liberal judge was someone
who was a non-Quebecois Catholic and was appointed to the Supreme Court by
a Liberal party prime minister. The model including all justices, presented in
Table 4.6, failed to produce a result that is statistically significant.
Economic Claims Model: Justices' voting scores in individual claims and
economic issues are moderately correlated (the Peason r-coefficient is .60).
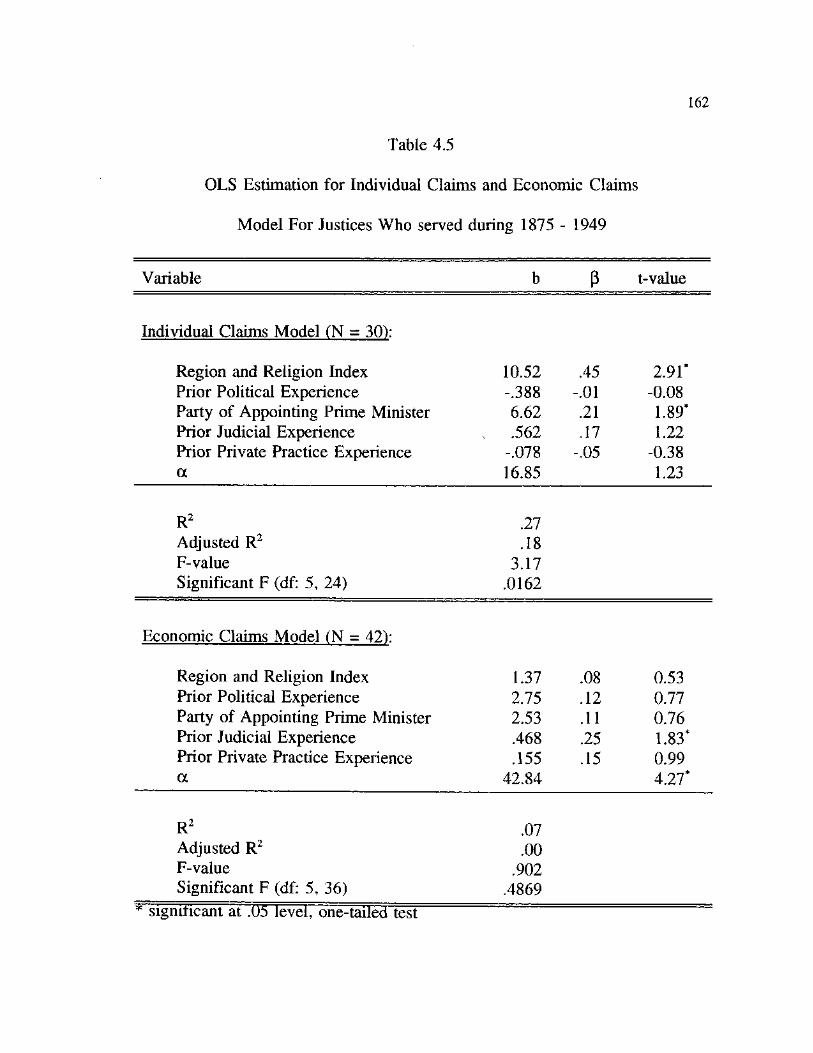
162
Table 4.5
OLS Estimation for Individual Claims and Economic Claims
Model For Justices Who served during 1875 - 1949
Variable b P t-value
Individual Claims Model (N = 30):
Region and Religion Index 10.52 .45 2.91* Prior Political Experience -.388 -.01 -0.08 Party of Appointing Prime Minister 6.62 .21 1.89* Prior Judicial Experience ^ .562 .17 1.22 Prior Private Practice Experience -.078 -.05 -0.38 a 16.85 1.23
R2 .27 Adjusted R2 .18 F-value 3.17 Significant F (df: 5, 24) .0162
Economic Claims Model (N = 42):
Region and Religion Index 1.37 .08 0.53 Prior Political Experience 2.75 .12 0.77 Party of Appointing Prime Minister 2.53 .11 0.76 Prior Judicial Experience .468 .25 1.83* Prior Private Practice Experience .155 .15 0.99 a 42.84 4.27*
R2
Adjusted R2
F-value Significant F (df: 5, 36)
.07
.00 .902
.4869 * significant at .05 level, one-tailed test
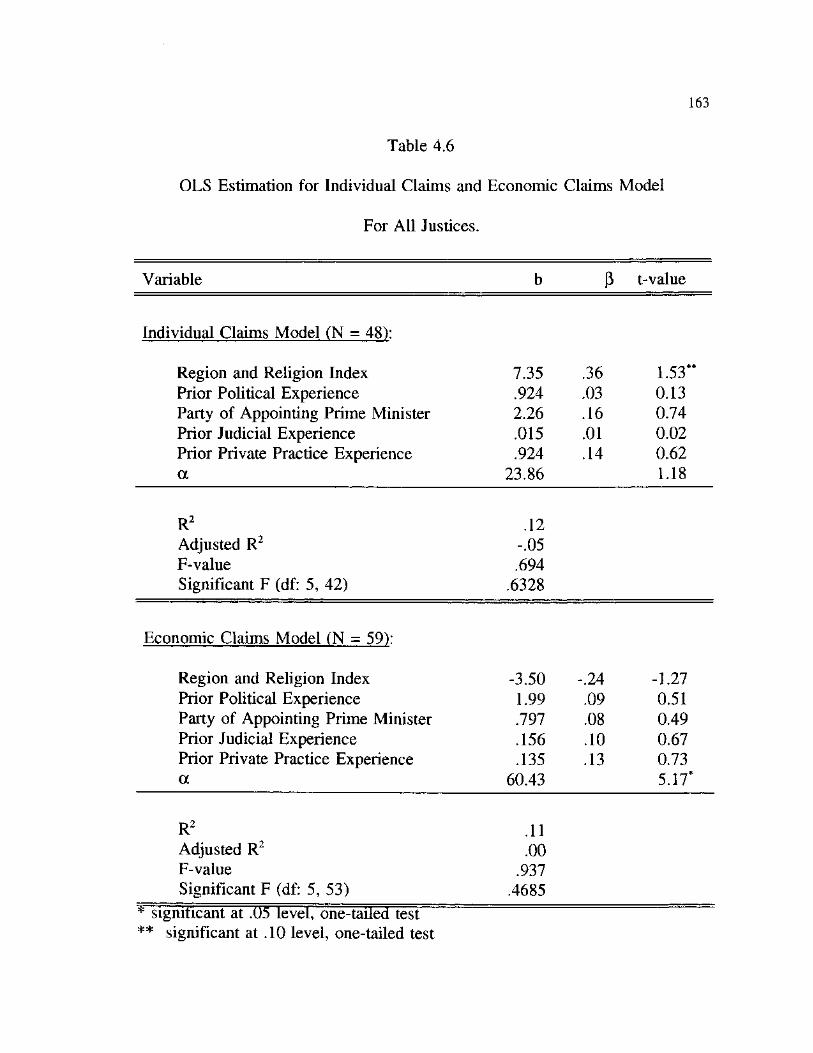
163
Table 4.6
OLS Estimation for Individual Claims and Economic Claims Model
For All Justices.
Variable b P t-value
Individual Claims Model (N = 48):
Region and Religion Index 7.35 .36 1.53** Prior Political Experience .924 .03 0.13 Party of Appointing Prime Minister 2.26 .16 0.74 Prior Judicial Experience .015 .01 0.02 Prior Private Practice Experience .924 .14 0.62 a 23.86 1.18
R2 .12 Adjusted R2 -.05 F-value .694 Significant F (df: 5, 42) .6328
Economic Claims Model (N = 59):
Region and Religion Index -3.50 -.24 -1.27 Prior Political Experience 1.99 .09 0.51 Party of Appointing Prime Minister .797 .08 0.49 Prior Judicial Experience .156 .10 0.67 Prior Private Practice Experience .135 .13 0.73 a 60.43 5.17*
R2 .11 Adjusted R2 .00 F-value .937 Significant F (df: 5, 53) .4685
* significant at .1)5 level, one-tailed test ** significant at .10 level, one-tailed test
164
Hence, the study expected to derive a model similar to the one for individual
claims. In fact, the regression analysis did not show any personal attribute
model to be significant except that for the post-1949 individual claims model.
The post-1949 economic claims model suggests that the most liberal judge was
someone who was a non-Quebecois Catholic who had extensive judicial
experience prior to the appointment to the Supreme Court. He/she was
appointed to the Court by a Liberal party prime minister except, Mackenzie
King. In addition, he/she will have some experience in holding a political
office. The model is moderately successful in explaining the variation in
justices' voting score (the R2 for the model is .58 with Adjusted R2 of .45).
The post-1949 model is the only model that is statistically significant: the other
two models did not produce any statistically significant regression.
In terms of the direction of the relationship between the individual
attribute factor and voting scores, the study found most of their relationship in
the expected direction, with the exception of prior private practice experience.
The study hypothesized that it would have a negative impact on voting score.
The coefficient in both models, however, shows a positive relationship.
The varying results of the personal attribute models estimated in this
study will probably contribute to the debate concerning the time bound nature of
personal attribute models. In the Canadian context, it was expected that the
model for individual claims cases might produce different results for different
165
time periods. Chapter 2 demonstated that individual claims cases were not at all
a significant part of the Canadian Supreme Court case mix in earlier years. It
was not until 1949 that these cases became a regular part of the case mix.
Therefore, it is possible that the available data may not represent a true
expression of justices' ideology in their voting behavior. The average number
of individual claims cases for justices who served prior to 1949 participated in
is 19, and 12 of 37 judges participated in less than 10 cases. This argument,
however, does not explain why the model for economic claims issues did not
successfully explain the variation of justices' voting behavior in the early period
since economic cases were a major part of the Supreme Court case mix.
The possible explanation for economic model may be due partly to the
lack of variation of the justices' voting scores. Table 4.7 presents the
descriptive statistics for justices who served in the pre-1949 and post-1949
period together with the F-values and their level of significant for the analysis of
variance. Figure 4.1 presents the distribution plots of both scores.
From the table and the figure, one can see that justices' scores in
individual claims cases are similar and have the same dispersion, especially
when Justice Cannon's score was excluded. The analysis of variance shows that
they are equal. The distributions of economic claims cases scores, on the other
hand, show two different distributions. The post-1949 scores shows a larger
variation in the justices' liberalism scores. The distribution of the pre-1949

166
Table 4.7
Descriptive Statistics For Liberalism Scores
N Mean Std. Dev. Minimum Maximum Range
Individual Claims Cases:
Pre-1949 29 50.9 13.7 11.1 75.0 63.9 Post-1949 26 48.3 17.4 23.7 80.2 56.5
F-value = .3891
Significant F (df: 1,53) = .5354
Economic Claims Cases:
Pre-1949 41 56.1 9.5 26.7 78.6 51.9 Post-1949 24 49.2 14.8 24.3 75.5 51.2 F-value = 4.8668 Significant F (df: 1,63) = .0310
scores, on the other hand is very compressed. Twenty one scores (50%) in this
period were distributed within an 11 point range. With such a small variation in
the justices' liberalism scores, it is possible that the model failed to capture any
variation in the scores. In another words, there is a very little variation in the
scores that can be explained by the model, regardless of how well it was
specified
The analysis of variance for economic claims cases shows a significant
difference in the variation between the pre-1949 and post-1949 justices' scores
(the F-value is 4.8668 with a p-value of .0313). This suggests that the two
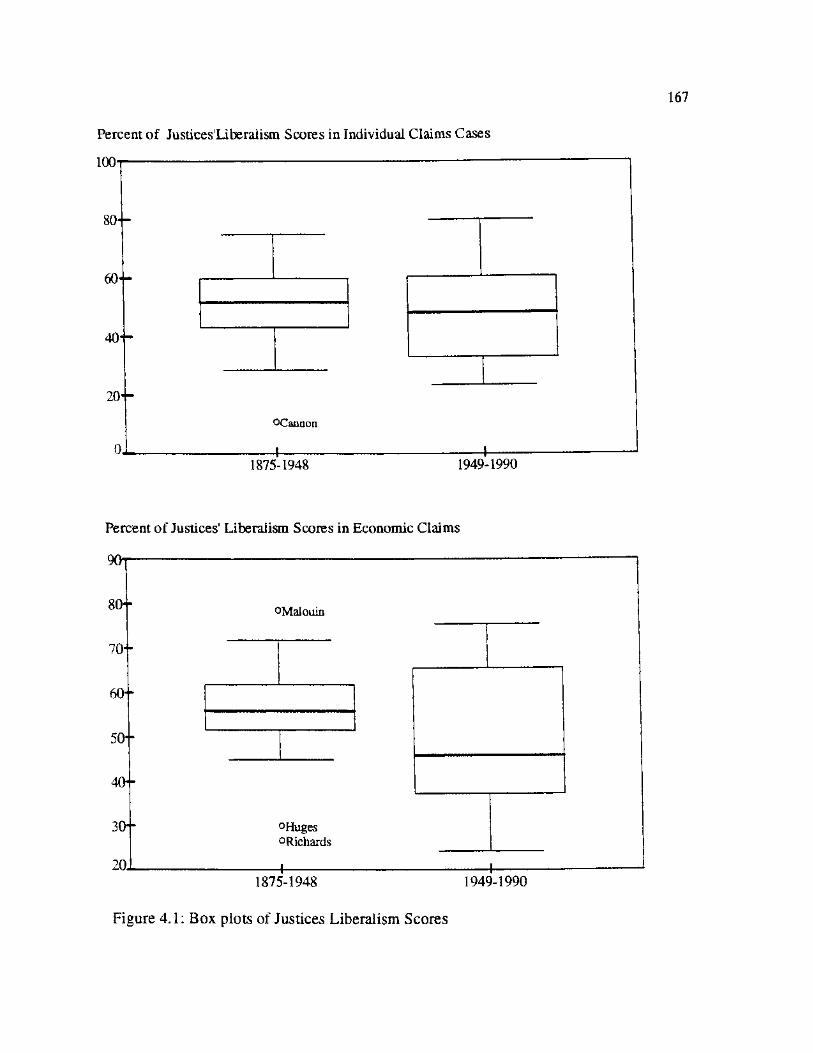
167
Percent of Justices'Liberaiism Scores in Individual Claims Cases
lOOi
80—
60—
40—
20
OCannon
4- 4-1875-1948 1949-1990
Percent of Justices' Liberalism Scores in Economic Claims
90i
8 0 -
70"
6 0 -
50-
40-
30"
20—
°Malouin
°Huges QRichards
4- 4-1875-1948 1949-1990
Figure 4.1: Box plots of Justices Liberalism Scores

168
groups are from two difference populations. Their difference may lead to two
different models that are capable in explaining their respect behaviors.
The question that one need to ask is whether the differences of the two
group of justices resulted from some social or political environments that are
unique to each time period. One such possible factor in the Canadian context is
the influence of the British-style of legal positivism which may play a greater
role in the early period.
The failure of the model to stand the test of time require us to build a
personal attribute models that are appropriate to capture the social changes that
occurred in Canada in the past century, especially a change from European
colonial state to a Western democracy. A better understanding of such changes
may allow one to operationalize the personal attribute factors appropriate to
each time period. This is a line of inquiry that will be pursuited in the future.
The models did not actually fail completely. Two variables which were
included in the models, Region and Religious index and Political Party of
Appointing Prime Minister, proved to be a consistent predictors in explaining
the justice's voting behavior. This is consistent with the earlier studies on the
U.S. Supreme Court where region and political party are consistent predictors of
the U.S. model (see Tate 1981; and Tate and Handberg 1991). Hence, it is
possible that additional research and better model building will allow students
of judicial politics to built a personal attribute model which will be both

169
appropriate crossnationally and not bound by time. The partial success of this
study should help to pave way for such research.
170
Endnotes
1. For research in this line see Schmidhauser (1959). This work is the classic and influential one in the descriptive study of the personal attributes. Schmidhauser tried to collect data on every aspect of the life experiences of the U.S. justices by considering such variables as their fathers's occupations and political activity, place of birth, ethnic origins, religious affiliation, education, and political experiences. His study is influential in that it turned scholars in the field toward work along this line. Following his study, there were several works that concentrated on some other national courts or other American courts. For example see Danelski (1969), Adams and Cavalluzzo (1969).
2. For a summary and review of these studies, see C. Neal Tate (1972).
3. For a discussion of the impacts of region on Canada's political culture and their differences see Michael D. Ornstein, H. Michael Stevenson and A. Paul Williams (1980), Richard Simeon and David J. Elkins (1974).
4. For model comparison purposes, the study decided to include all the factors that were significant in one model even though they were not significant in others.
5. A big drop in adjusted R2 is expected even though all the parameters in the model are significant since the model is estimated with a smaller number of observations (28). The formular for adjusted R2 is:
adj. R2 = 1 - [((n - i)(l - R2) / (n - p)]
Where: n = number of observations; i = 1 when the model has a constant and 0 when otherwise; and p = number of parameters in the model.

CHAPTER REFERENCES
Adams, G. and P. L. Cavalluzzo. 1969. "The Supreme Court of Canada: A Biographical Study." Osgoode Hall Law Journal 7: 61-85.
Bowen, Don. 1965. "The Explanation of Judicial Voting Behavior from Sociological Characteristics of Judges." Ph.D. Dissertation, Yale University.
Christian, William. 1983. "Ideology and Politics in Canada." In Approaches to Canadian Politics, 2nd Edition, ed. John H. Redekop. Scarborogh, Ontario: Prentice-Hall.
Danelski, David J. 1969. "The Supreme Court of Japan: An Exploratory Study." In Comparative Judicial Behavior, Cross-Cultural Studies of Political Decision-Making in the East and West, eds. Glendon A. Schubert and David J. Danelski. New York: Oxford University Press.
Gibson, James L. 1983. "From Simplicity to Complexity: The Development of Theory in the Study of Judicial Behavior." Political Behavior 5: 7-49.
Haines, Charles G. 1922. "General Observations on the Effects of Personal, Political, and Economic Influences in the Decision of Judges." Illinois Law Review 17 as reprinted in Judicial Behavior: A Reader in Theory and Research, ed. Glendon A. Schubert. Chicago: Rand McNally and Co.
Jackson Robert J., Doreen Jackson, and Nicolas Baxter-Moore. 1986. Politics in Canada: Culture, Institutions, Behavior and Public Policy. Scarborough, Ontario:Prentice-Hall.
Lipset, Seymour M. and Stein Rokkan. 1964. "Cleavage Structures, Party Systems and Voting Alignments." In Party Systems and Voter Alignment. eds. Lipset and Rokkan. New York: Free Press.
Ornstein, Michael D., H. Micheal Stevenson and A. Paul Williams. 1980. "Region, Class and Political Culture in Canada." Canadian Journal of Political Science 13: 227-271
171
172
Schmidhauser, John R. 1959. "The Justices of the Supreme Court: A Collective Portrait." Midwest Journal of Political Science 3: 1-50.
Simeon, Richard and David J. Elkins. 1974. "Regional Political Cultures in Canada." Canadian Journal of Political Science 7: 397-437.
Sittiwong, Panu. 1985. "Canadian Supreme Court Decision-Making: The Personal Attribute Model in Explaining Justices' Patterns of Decision-Making, 1949-1980." Master Thesis, North Texas State University.
Tate, C. Neal. 1972. "Social Background and Voting Behavior in the Philippine Supreme Court." LawAsia 3: 316-318.
Tate, C. Neal. 1981. "Personal Attributes Models of the Voting Behavior of U. S. Supreme Court Justices: Liberalism in Civil Liberties and Economic Decisions, 1946-1978." American Political Science Review 75: 355-67.
Tate, C. Neal. and Roger Handberg. 1991. "Time Binding and Theory Building in Personal Attribute Models of Supreme Court Voting Behavior, 1916-88." American Journal of Political Science 35: 460-80.
Tate, C. Neal. and Panu Sittiwong. 1987. "Explaining the Decision-Making of the Canadian Supreme Court: 1949-1985." Paper presented at the 29th
Annual Conference of the Western Canadian Studies Group of the Western Social Science Association, El Paso, Texas, April 25.
Tate, C. Neal. and Panu Sittiwong. 1989. "Decision Making in the Canadian Supreme Court: Extending the Personal Attributes Model across Nations." Journal of Politics 51: 900-16.
Ulmer, S. Sidney. 1973. "Social Background as an Indicator to the Votes of Supreme Court Justices in Criminal Cases: 1947-1956 Terms." American Journal of Political Science 19: 622-30.
Ulmer, S. Sidney. 1986. "Are Social Background Models Time-Bound?" American Political Science Riview 80: 957-67.
CHAPTER 5
CONCLUSION
The Canadian Supreme Court was in the past assumed to be of little policy
significance in national politics. This lack of significane reflected the narrow,
literalist interpretation of the Court's duties shared by its justices as much as it
did the relative supremacy of Parliament and the limited constitutional role the
Court was expected to play. While those who studied the Court's political role
often agreed that it acted so as to minimize its policy significance, others agued
that the Court had a role to play in Canadian politics that required the exercise
of substantial discretion regardless of how its judges chose to define their
political functions.
Whether there were self-imposed or institutionally-imposed limitations on
the policy significance and decision making discretion of the Canadian Supreme
Court in the past, these limitations are largely irrelevant now. According to
Morton, "the Canadian Supreme Court is a text-book example of a court in
transition from an essentially adjudicatory role to a more politically influential
role" (Morton 1986, 1). This transformation has been taking place at least since
the abolition of appeals to the British House of Lords Privy Council in 1949 and
later in 1982, was confirmed by the reforms contained in the new Constitution.
173
174
That act "severely qualifies if it does not actually extinguish the tradition of
parliamentary supremacy in Canada" and has caused the Supreme Court "to
evolve toward a much more explicit and influential role in the Canadian regime"
(Morton 1986, 3). The political significance of the Supreme Court make study
of the Court an integral part of the study of Canadian politics. The understating
of future Canadian politics and policy making will require a much better
understanding of the politics of Supreme Court and the decision making
behavior of its justices.
With that perspective in mind, this dissertation looked at the Supreme
Court's decision making from three different perspective. It looked at Supreme
Court institutional decision making, the role of group interaction in the decision
process, and individual decision making behavior.
At the institutional level, the study first looked at the size and composition
of the Supreme Court's caseload. It found that there was a cyclical trend in the
Court's reported cases. This cyclical trend, however, did not correlate with the
population growth in the country. In fact, the ratio between the number of cases
reported and population showed a decreasing trend.
Within its stable workload, the Supreme Court experienced substantial
shifts in the sources and composition of the cases its reported. The sources of
cases appealed to the Supreme Court showed a trend to shift from Quebec and
Ontario to the western provinces. This shift probably reflects a change in

175
socioeconomic development in Canada where the western provinces become
more important economically.
In term of case composition, the study found a shift in Supreme Court
dockets from private law to public law cases, in particular a significant increase
in appeals involving constitutional/rights issues. The study found that this
changing pattern of the Court's scope of rule adjudication was a result of the
institutional change shaping the Supreme Court. The changes that contributed to
caseload composition shift were the abolition of rights to appeals to the Privy
Council in 1949, and the abolition of rights to appeal in civil cases in 1975.
Statistically, the latter was found to be the most important source of workload
change. It affected both the increase in the constitution/rights cases and the rise
in public law docket. The adoption of the new constitution and the Charter of
Rights in 1982, was not found to be statistically significant influence on
workload composition.
These results support the argument made by those who study the Court that
the Canadian Supreme Court has become an important political actor who will
routinely be involved in formulating public policies in the country, in particular
in the area of individual rights and liberties. The combined affect of the three
changes was to move the Supreme Court away from a general appeal court
toward a constitutional court whose role is to balance the acts of other branches
of government at both the provincial and federal level. Whether the Court
176
carries out this function vigorously will become clearer as more and more
Charter related issues are brough to the Court for decision (see Morton, Russell,
and Withey, 1991).
Another institutional behavior that was analyzed was conflict in decision-
making. It was found that the variation in the rate of dissensus in the Court's
decision making can be explained by the chief justices' tenures. This finding is
similar to the similar study for the U.S. Supreme Court (Walker, Epstein, and
Dixon, 1988; Haynie, 1992).
Finally, the study looked at the direction of the Court's decision-making.
It found that level of liberalism in the Supreme Court varied from one natural
court to another. The study suggested that these differences, among other
things, may be result of shifts in individual justices' ideologies in each natural
court.
This hypothesis was partly confirmed in the analyses carried out in Chapter
Three. The analysis did not always show that the voting blocs in the Supreme
Court were strongly structured along the liberal/conservative ideology
dimension. The results of the multidimensional scaling analysis, however, did
suggest more often than not that the voting blocs were partially structured and
explainable by one of the ideological dimensions.
In the final analysis chapter, the study expanded the previous research to
test the time bound nature of the personal attributes models in explaining

177
justices' liberalism in voting behavior. The results were mixed. While the
regression analysis for both individual claims and economic claims were
successful in explaining the variation in the liberalism scores for justices who
serrved in the Court during 1949-1990, the same models did not succeed or only
partially succeeded in explaining the variation for justices who served during
1875-1949. The sub-period analysis, however, show that the pret-1949 period
scores show only a small variation when compare to the post-1949 period. With
this result, the study concluded that, the personal attributes model will need
more theoretical refinement if it is to be successful in explaining individual
justices' voting behavior in the earlier period. The new model will have to
include factors that will capture the social changes or social phenomena that are
unique to each time period. Such a model may be difficult to achieve and the
debate on the merits of such model will continue.
Despite covering a variety of Canadian Supreme Court behavior, the study
has only scratched a surface of this inquiry. There are several loose-ends that
will need to be tied up in future study, in particular at the institutional level. At
that level, the study failed to develop a theory to explain the Supreme Court's
caseload despite the fact that this is the most frequently studied subject in the
judicial behavior literature. In addition, a more extensive analysis of conflict in
and the direction of the Court's decision making, is still needed if we are going
to have more understanding of the Supreme Court decision making process and
178
its impacts on Canadian society. Such a study may need to emphasize on role
of individual justices in those institutional behaviors.
At a minimum, however, this study has contributed to the ongoing
investigation of the Canadian Supreme Court and its "Judicialization into
politics,"1 and should help rejuvenate the Canadian judicial behavior tradition.
Second, the results, and lack of results will help both contribute to the
understanding of the transformation of the Canadian judiciary that is now
occuring, and open the avenue for furture analysis. The wealth of data that
were used in this study, indeed, promises an optimistic future for further inquiry.
179
Endnotes
1. The words was first used by Russell (1983) in his prediction of the changing role of the Supeme Court in Canadian politics after the adoption of the Charter of Rights.

CHAPTER REFERENCES
Haynie, Stacia L. 1992. "Leadership and Consensus on the U.S. Supreme Court." Journal of Politics 54: 1158-69.
Morton, F. L. 1986. "The Politicization of the Supreme Court of Canada." Paper presented to the Interim Meeting of the Research Committee on Comparative Judicial Studies of the International Political Science Association, Center for the Study of Law and Society, University of California, Berkeley, December 14-15.
Morton, F. L., Peter H. Russell, and Michael J. Withey. 1991. "The Supreme Court's First 100 Charter of Rights Decision: A Statistical Analysis." Occational Papers Series, Research Study 6.1, Research Unit for Socio-Legal Studies, University of Calgary.
Russell, Peter H. 1983. "The Political Purposes of the Canadian Charter of Rights and Freedoms." Canadian Bar Review 61: 31-64.
Walker, Thomas G., Lee Epstein and William J. Dixon. 1988. "On the Mysterious Demise of Consensual Norms in the United States Supreme Court." Journal of Politics 50: 361-89.
180

APPENDIX A
CANADIAN SUPREME COURT DECISION MAKING CODING SHEET
181
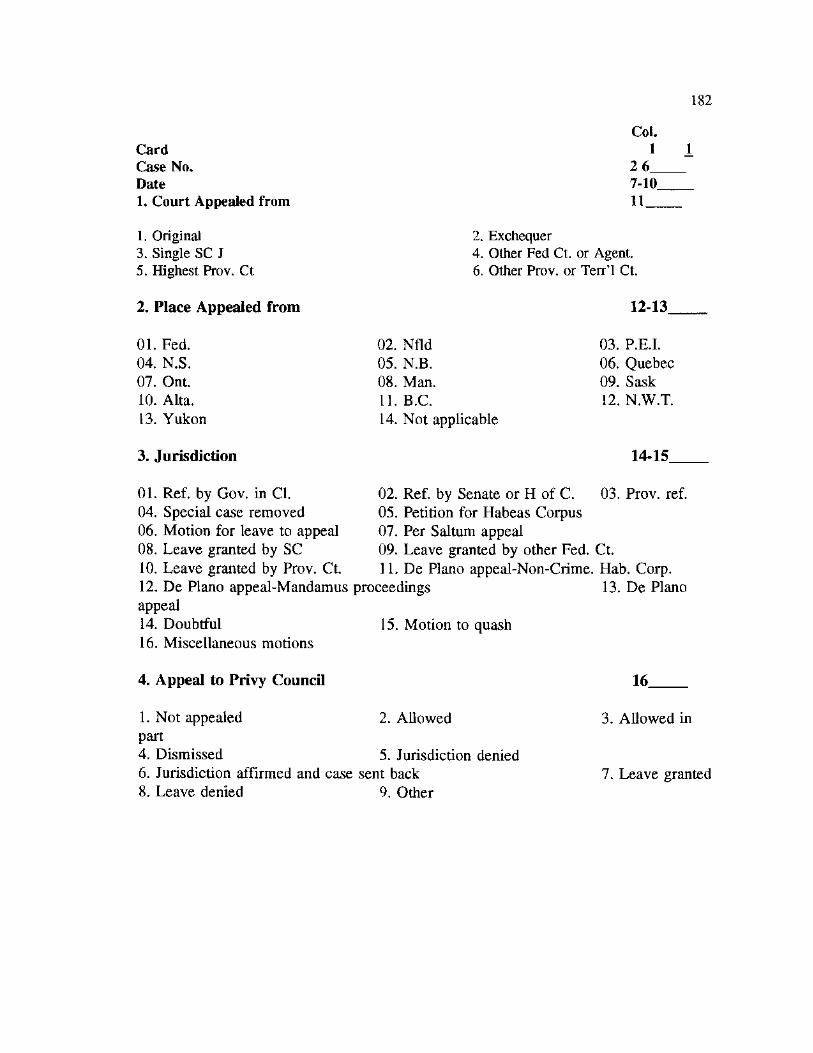
182
Card Case No. Date 1. Court Appealed from
1. Original 3. Single SC J 5. Highest Prov. Ct
2. Place Appealed from
01. Fed. 04. N.S. 07. Ont. 10. Alta. 13. Yukon
3. Jurisdiction
Col. 1
2 6_ 7-10. 11
2. Exchequer 4. Other Fed Ct. or Agent. 6. Other Prov. or Terr'l Ct.
02. Nfld 05. N.B. 08. Man. 11. B.C. 14. Not applicable
12-13
03. P.E.I. 06. Quebec 09. Sask 12. N.W.T.
14-15
01. Ref. by Gov. in CI. 04. Special case removed 06. Motion for leave to appeal 08. Leave granted by SC 10. Leave granted by Prov. Ct. 12. De Piano appeal-Mandamus proceedings appeal 14. Doubtful 15. Motion to quash 16. Miscellaneous motions
02. Ref. by Senate or H of C. 03. Prov. ref. 05. Petition for Habeas Corpus 07. Per Saltum appeal 09. Leave granted by other Fed. Ct. 11. De Piano appeal-Non-Crime. Hab. Corp.
13. De Piano
4. Appeal to Privy Council 16
1. Not appealed 2. Allowed part 4. Dismissed 5. Jurisdiction denied 6. Jurisdiction affirmed and case sent back 8. Leave denied 9. Other
3. Allowed in
7. Leave granted
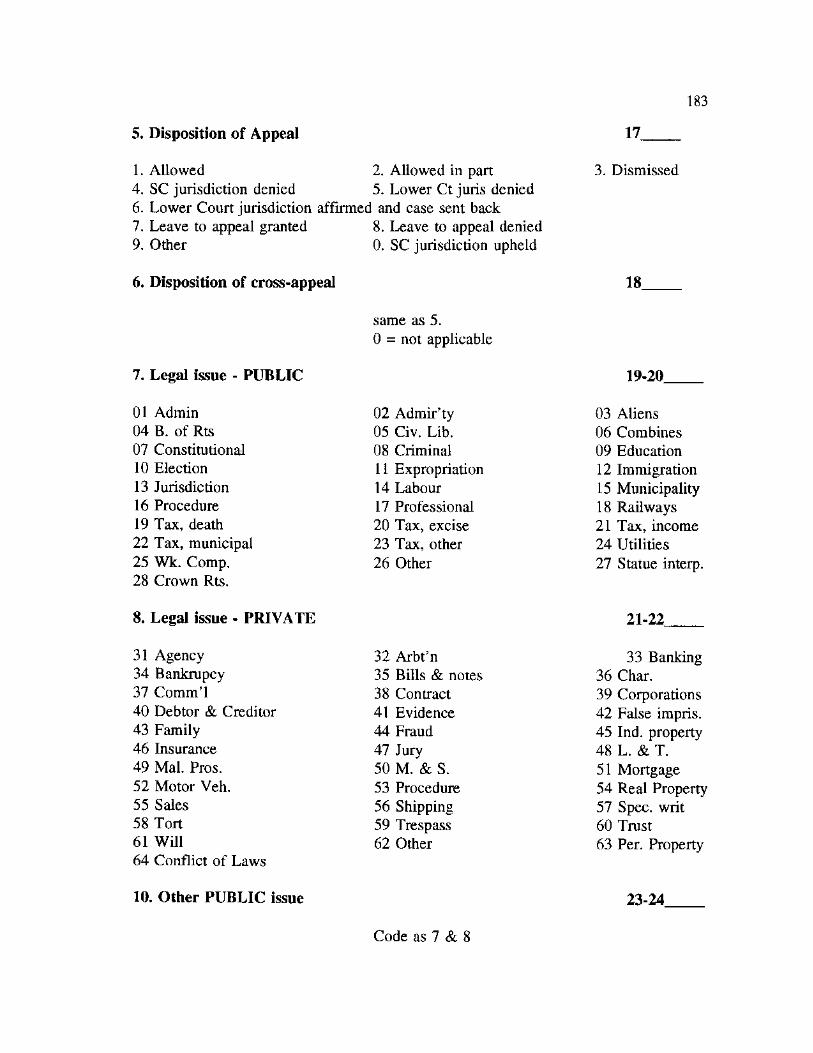
183
5. Disposition of Appeal
1. Allowed 2. Allowed in part 4. SC jurisdiction denied 5. Lower Ct juris denied 6. Lower Court jurisdiction affirmed and case sent back 7. Leave to appeal granted 8. Leave to appeal denied 9. Other 0. SC jurisdiction upheld
6. Disposition of cross-appeal
17
3. Dismissed
18
same as 5. 0 = not applicable
7. Legal issue - PUBLIC 19-20
01 Admin 04 B. of Rts 07 Constitutional 10 Election 13 Jurisdiction 16 Procedure 19 Tax, death 22 Tax, municipal 25 Wk. Comp. 28 Crown Rts.
02 Admir'ty 05 Civ. Lib. 08 Criminal 11 Expropriation 14 Labour 17 Professional 20 Tax, excise 23 Tax, other 26 Other
03 Aliens 06 Combines 09 Education 12 Immigration 15 Municipality 18 Railways 21 Tax, income 24 Utilities 27 Statue interp.
8. Legal issue - PRIVATE
31 Agency 34 Bankrupcy 37 Comm'l 40 Debtor & Creditor 43 Family 46 Insurance 49 Mai. Pros. 52 Motor Veh. 55 Sales 58 Tort 61 Will 64 Conflict of Laws
21-22
32 Arbt'n 35 Bills & notes 38 Contract 41 Evidence 44 Fraud 47 Jury 50 M. & S. 53 Procedure 56 Shipping 59 Trespass 62 Other
33 Banking 36 Char. 39 Corporations 42 False impris. 45 Ind. property 48 L. & T. 51 Mortgage 54 Real Property 57 Spec, writ 60 Trust 63 Per. Property
10. Other PUBLIC issue 23-24
Code as 7 & 8
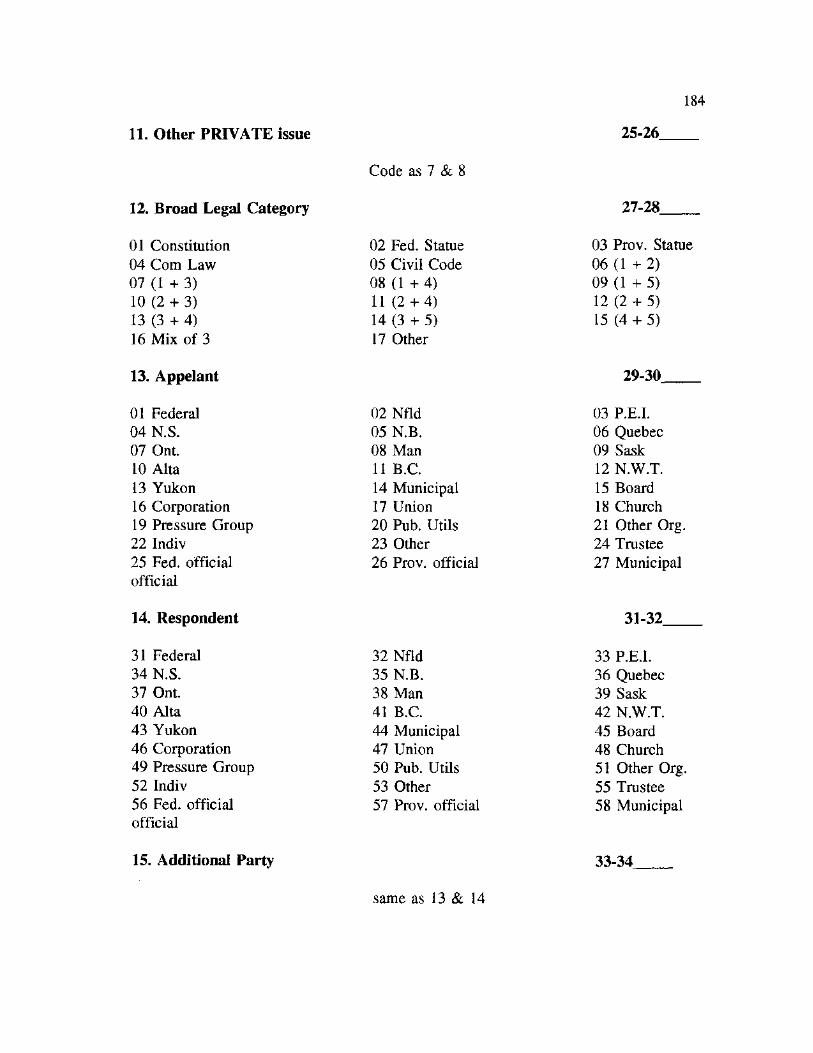
184
11. Other PRIVATE issue 25-26
Code as 7 & 8
12. Broad Legal Category
01 Constitution 04 Com Law 07 (1 + 3) 10 (2 + 3) 13 (3 + 4) 16 Mix of 3
27-28
02 Fed. Statue 05 Civil Code 08 (1 + 4) 11 (2 + 4) 14 (3 + 5) 17 Other
03 Prov. Statue 06 (1 + 2) 09 (1 + 5) 12 (2 + 5) 15 (4 + 5)
13. Appelant
01 Federal 04 N.S. 07 Ont. 10 Alta 13 Yukon 16 Corporation 19 Pressure Group 22 Indiv 25 Fed. official official
29-30
02 Nfld 05 N.B. 08 Man 11 B.C. 14 Municipal 17 Union 20 Pub. Utils 23 Other 26 Prov. official
03 P.E.I. 06 Quebec 09 Sask 12 N.W.T. 15 Board 18 Church 21 Other Org. 24 Trustee 27 Municipal
14. Respondent
31 Federal 34 N.S. 37 Ont. 40 Alta 43 Yukon 46 Corporation 49 Pressure Group 52 Indiv 56 Fed. official official
31-32
32 Nfld 35 N.B. 38 Man 41 B.C. 44 Municipal 47 Union 50 Pub. Utils 53 Other 57 Prov. official
33 P.E.I. 36 Quebec 39 Sask 42 N.W.T. 45 Board 48 Church 51 Other Org. 55 Trustee 58 Municipal
15. Additional Party 33-34
same as 13 & 14
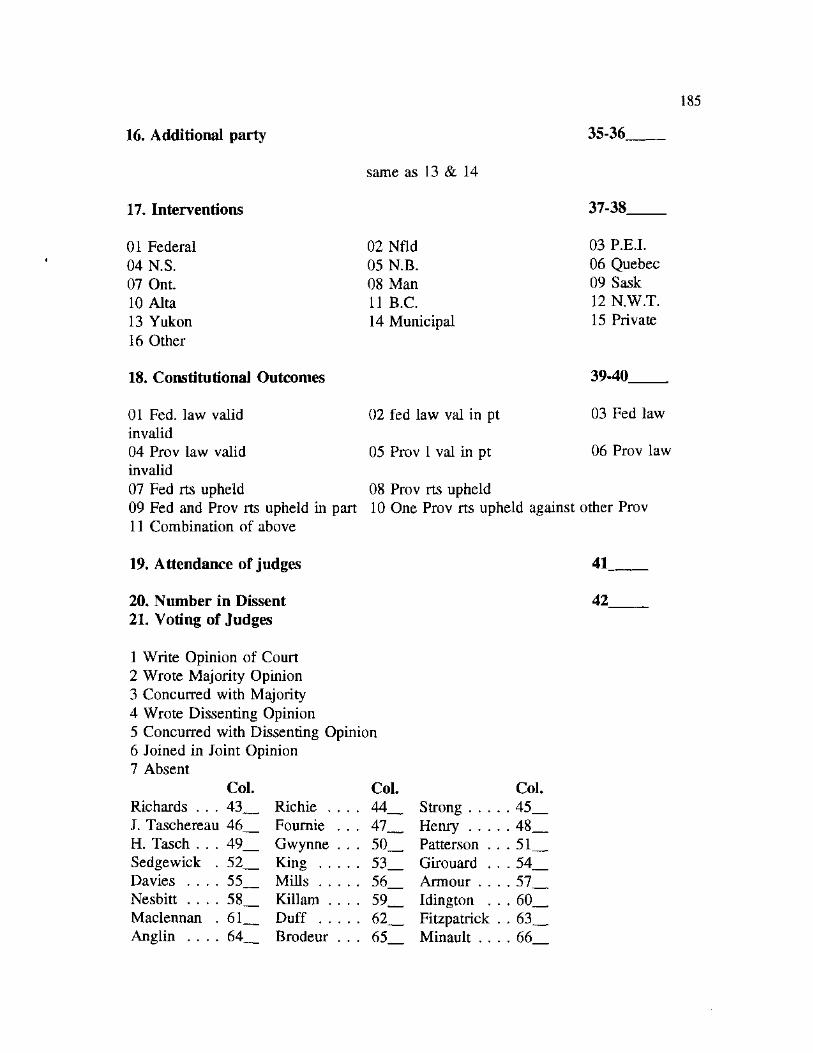
16. Additional party
same as 13 & 14
185
35-36
17. Interventions
01 Federal 04 N.S. 07 Ont. 10 Alta 13 Yukon 16 Other
18. Constitutional Outcomes
37-38
02 Nfld 05 N.B. 08 Man 11 B.C. 14 Municipal
03 P.E.I. 06 Quebec 09 Sask 12 N.W.T. 15 Private
39-40
02 fed law val in pt
05 Prov 1 val in pt
03 Fed law
06 Prov law
01 Fed. law valid invalid 04 Prov law valid invalid 07 Fed rts upheld 08 Prov rts upheld 09 Fed and Prov rts upheld in part 10 One Prov rts upheld against other Prov 11 Combination of above
19. Attendance of judges
20. Number in Dissent 21. Voting of Judges
1 Write Opinion of Court 2 Wrote Majority Opinion 3 Concurred with Majority 4 Wrote Dissenting Opinion 5 Concurred with Dissenting Opinion 6 Joined in Joint Opinion 7 Absent
Col. Col. Col. Richards . . . 43 Richie . . . 44 Strong , . . 45 J. Taschereau 46 Fournie . . 47 Henry . . . 48 H. Tasch . . . 49 Gwynne . . 50 Patterson . . 51 Sedgewick . 52 King . . . 53 Girouard . . 54 Davies . . . . 55 Mills 56 Armour . . . 57 Nesbitt . . . . 58 Killam . . • 59 Idington . . 60 Maclennan . 61 Duff 62 Fitzpatrick . 63 Anglin . . . . 64 Brodeur . . 65 Minault . . . 66
41_
42
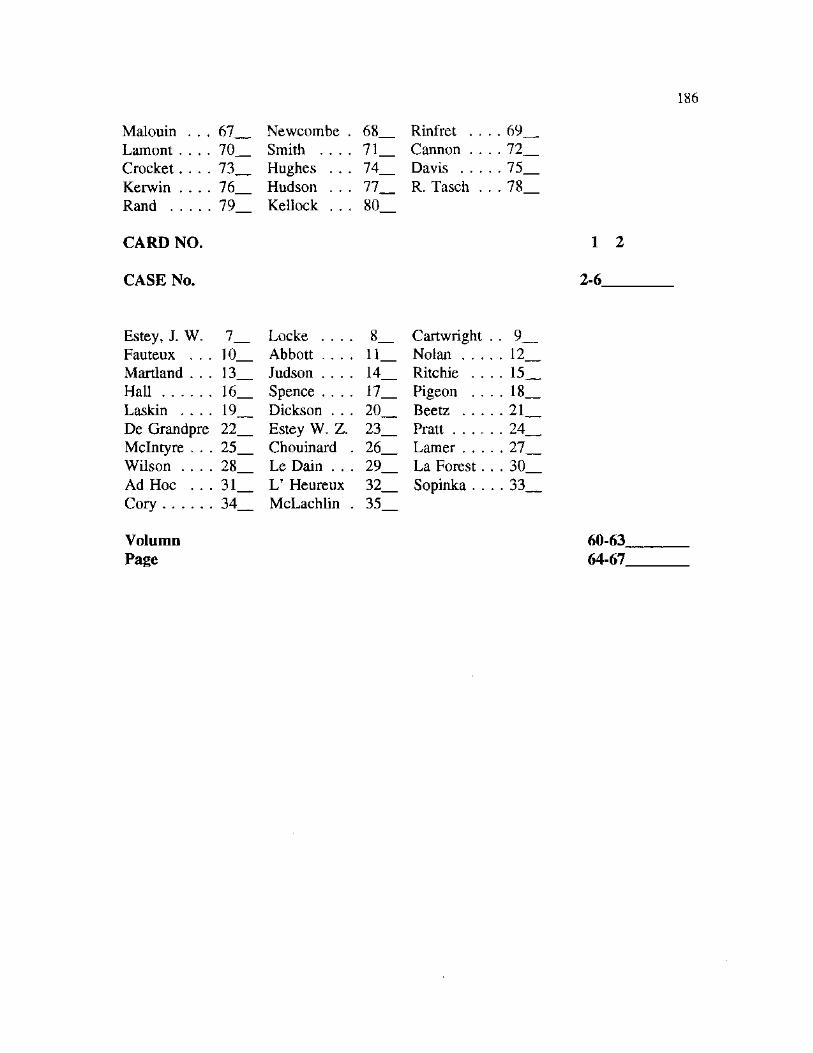
186
Malouin . . . 67 Newcorabe . 68 Rinfret . . . • 69 Lamon t . . . . 70 Smith . . . . 71 Cannon . . . . 72 Crocket . . . . 73 Hughes . . . 74 Davis . . . . 75 Kerwin . . . . 76 Hudson . . . 77 R. Tasch . . • 78 Rand 79 Kellock . . . 80
CARD NO.
CASE No.
Estey, J. W. 7 Locke . . . . 8 Cartwright . 9 Fauteux . . . 10_ Abbott . . . . 11_ Nolan . . . 12 Martland . . . 13 Judson . . . . 14 Ritchie . . • 15 Hall 16 Spence . . . . 17 Pigeon . . . 18 Laskin 19 Dickson . . . 20 Beetz . . . 21 De Grandpre 22 Estey W. Z. 23 Pratt . . . . 24 Mclntyre . . . 25 Chouinard . 26 Lamer . . . 27 Wilson . . . . 28 Le Dain . . . 29 La Forest. . 30 Ad Hoc 31 L' Heureux 32 Sopinka . . . 33 Cory 34 McLachlin . 35
Volumn Page
1 2
2-6
60-63_ 64-67
APPENDIX B
THE NATURAL COURT DIVISION IN THE CANADIAN
SUPREME COURT, 1875-1990
187
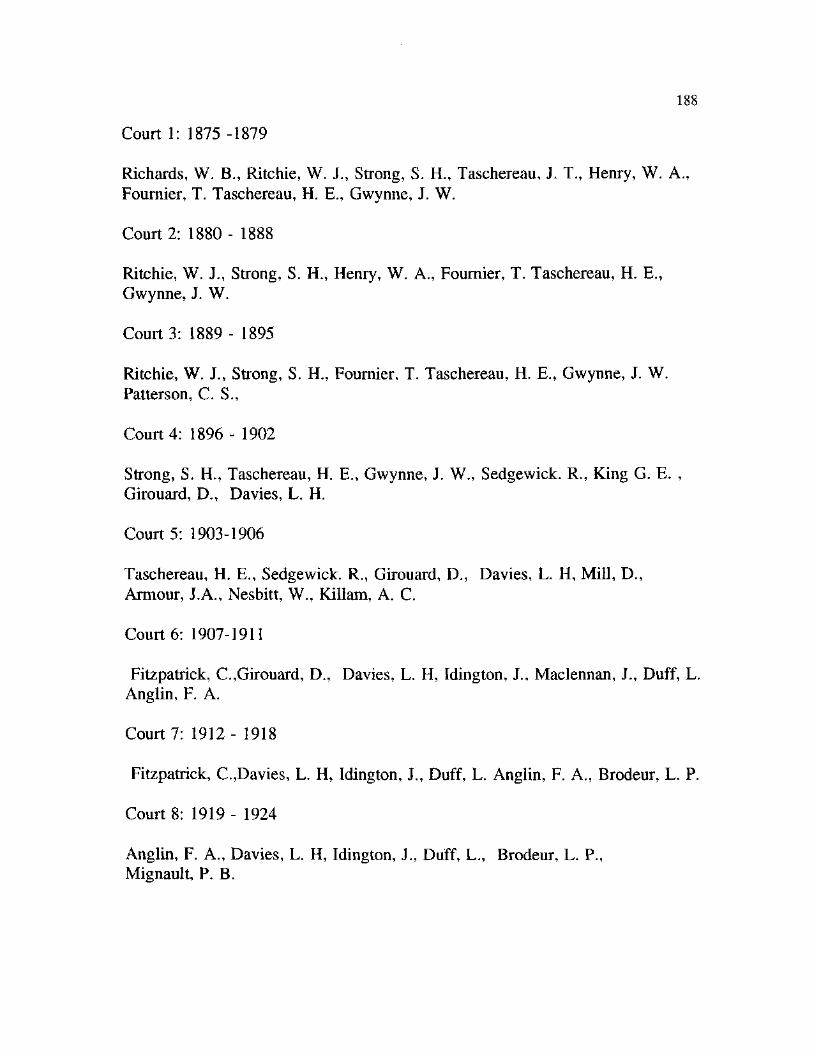
188
Court 1: 1875 -1879
Richards, W. B., Ritchie, W. J., Strong, S. H., Taschereau, J. T., Henry, W. A., Fournier, T. Taschereau, H. E., Gwynne, J. W.
Court 2: 1880 - 1888
Ritchie, W. J., Strong, S. H., Henry, W. A., Fournier, T. Taschereau, H. E., Gwynne, J. W.
Court 3: 1889 - 1895
Ritchie, W. J., Strong, S. H., Fournier, T. Taschereau, H. E., Gwynne, J. W. Patterson, C. S.,
Court 4: 1896 - 1902
Strong, S. H., Taschereau, H. E., Gwynne, J. W., Sedgewick. R., King G. E. , Girouard, D., Davies, L. H.
Court 5: 1903-1906
Taschereau, H. E., Sedgewick. R., Girouard, D., Davies, L. H, Mill, D., Armour, J.A., Nesbitt, W., Killam, A. C.
Court 6: 1907-1911
Fitzpatrick, C.,Girouard, D., Davies, L. H, Idington, J., Maclennan, J., Duff, L. Anglin, F. A.
Court 7: 1912 - 1918
Fitzpatrick, C.,Davies, L. H, Idington, J., Duff, L. Anglin, F. A., Brodeur, L. P.
Court 8: 1919 - 1924
Anglin, F. A., Davies, L. H, Idington, J., Duff, L., Brodeur, L. P., Mignault, P. B.
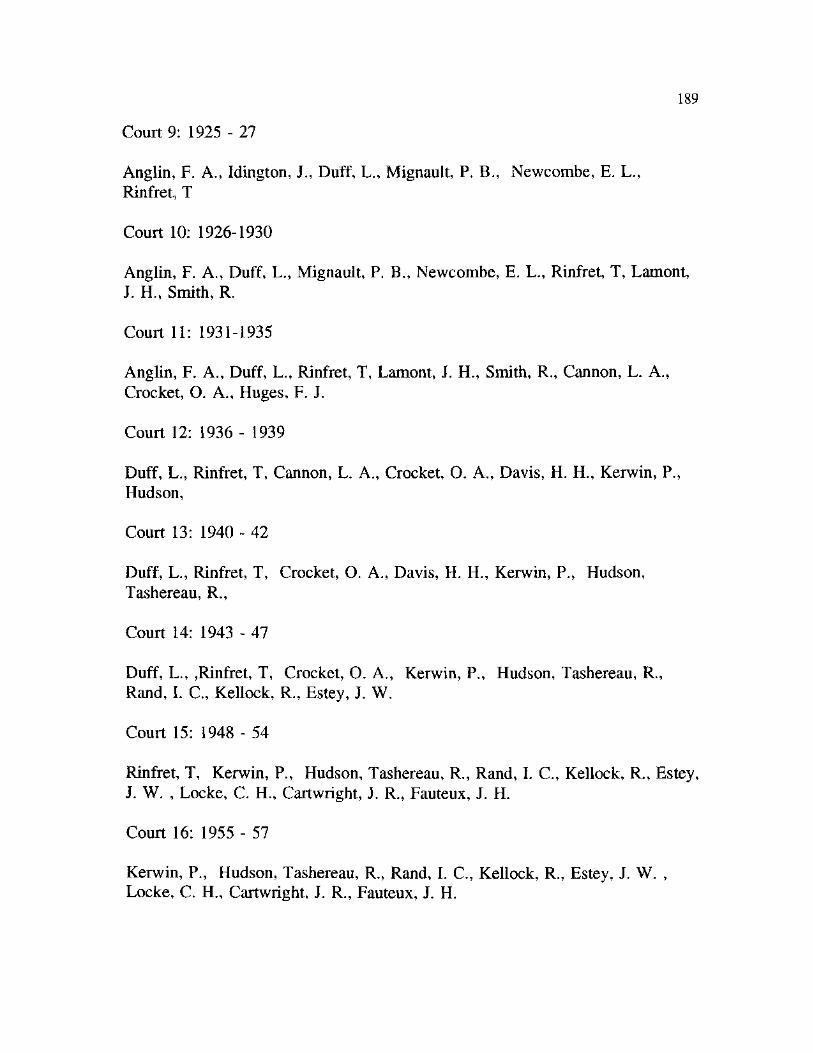
189
Court 9: 1925 - 27
Anglin, F. A., Idington, J., Duff, L., Mignault, P. B., Newcombe, E. L., Rinfret, T
Court 10: 1926-1930
Anglin, F. A., Duff, L., Mignault, P. B., Newcombe, E. L., Rinfret, T, Lamont, J. H., Smith, R.
Court 11: 1931-1935
Anglin, F. A., Duff, L., Rinfret, T, Lamont, J. H., Smith, R., Cannon, L. A., Crocket, O. A., Huges, F. J.
Court 12: 1936 - 1939
Duff, L., Rinfret, T, Cannon, L. A., Crocket, O. A., Davis, H. H., Kerwin, P., Hudson,
Court 13: 1940 - 42
Duff, L., Rinfret, T, Crocket, O. A., Davis, H. H., Kerwin, P., Hudson, Tashereau, R.,
Court 14: 1943 - 47
Duff, L., ,Rinfret, T, Crocket, O. A., Kerwin, P., Hudson, Tashereau, R., Rand, I. C., Kellock, R., Estey, J. W.
Court 15: 1948 - 54
Rinfret, T, Kerwin, P., Hudson, Tashereau, R., Rand, I. C., Kellock, R., Estey, J. W. , Locke, C. H., Cartwright, J. R., Fauteux, J. H.
Court 16: 1955 - 57
Kerwin, P., Hudson, Tashereau, R., Rand, I. C., Kellock, R., Estey, J. W. , Locke, C. H., Cartwright, J. R., Fauteux, J. H.
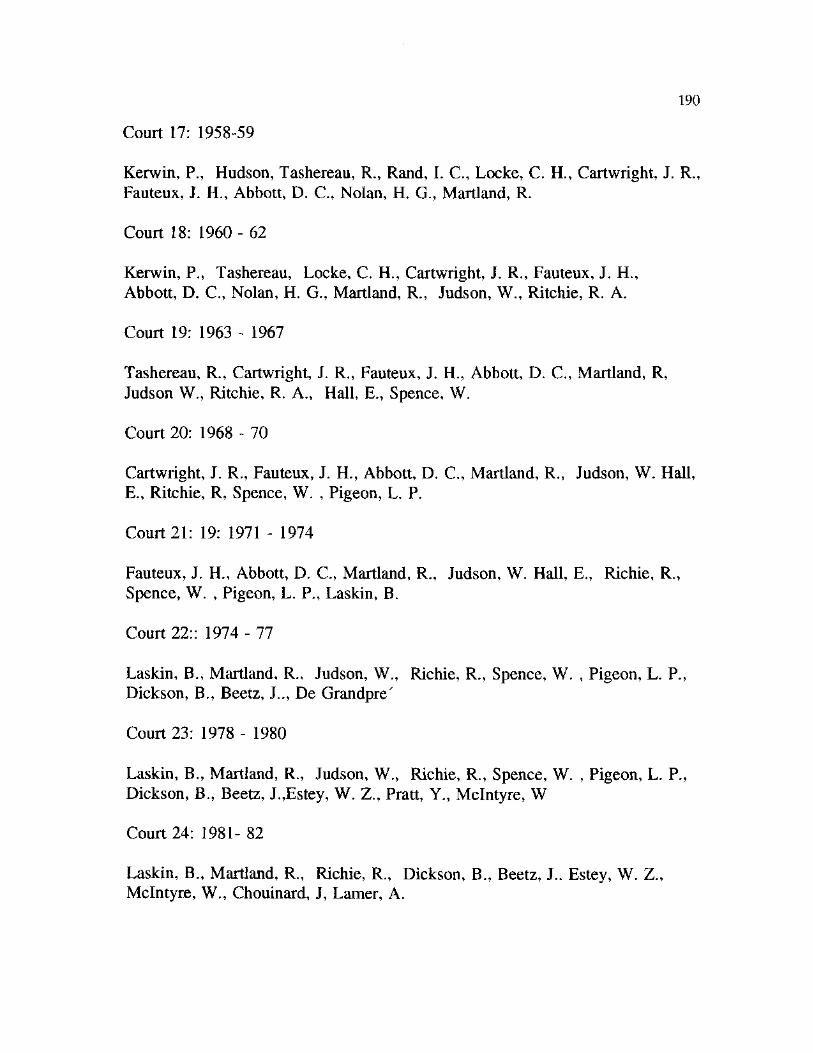
190
Court 17: 1958-59
Kerwin, P., Hudson, Tashereau, R., Rand, I. C., Locke, C. H., Cartwright, J. R., Fauteux, J. H., Abbott, D. C., Nolan, H. G., Marti and, R.
Court 18: 1960 - 62
Kerwin, P., Tashereau, Locke, C. H., Cartwright, J. R., Fauteux, J. H., Abbott, D. C., Nolan, H. G., Martland, R., Judson, W., Ritchie, R. A.
Court 19: 1963 - 1967
Tashereau, R., Cartwright, J. R., Fauteux, J. H., Abbott, D. C., Martland, R, Judson W., Ritchie, R. A., Hall, E., Spence, W.
Court 20: 1968 - 70
Cartwright, J. R., Fauteux, J. H., Abbott, D. C., Martland, R., Judson, W. Hall, E., Ritchie, R, Spence, W. , Pigeon, L. P.
Court 21: 19: 1971 - 1974
Fauteux, J. H., Abbott, D. C., Martland, R., Judson, W. Hall, E., Richie, R., Spence, W. , Pigeon, L. P., Laskin, B.
Court 22:: 1974 - 77
Laskin, B., Martland, R., Judson, W., Richie, R., Spence, W. , Pigeon, L. P., Dickson, B., Beetz, J.., De Grandpre'
Court 23: 1978 - 1980
Laskin, B., Martland, R., Judson, W., Richie, R., Spence, W. , Pigeon, L. P., Dickson, B., Beetz, J.,Estey, W. Z., Pratt, Y., Mclntyre, W
Court 24: 1981- 82
Laskin, B., Martland, R., Richie, R., Dickson, B., Beetz, J.. Estey, W. Z., Mclntyre, W., Chouinard, J, Lamer, A.
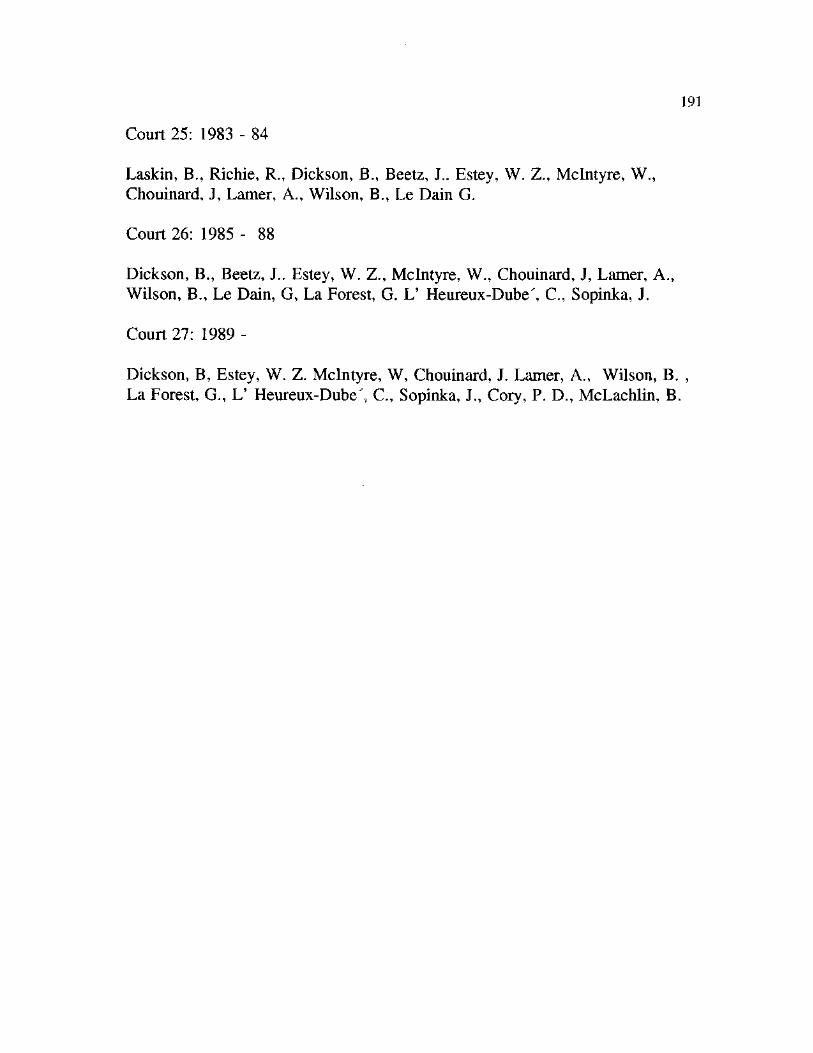
191
Court 25: 1983 - 84
Laskin, B., Richie, R., Dickson, B., Beetz, J.. Estey, W. Z., Mclntyre, W., Chouinard, J, Lamer, A., Wilson, B., Le Dain G.
Court 26: 1985 - 88
Dickson, B., Beetz, J.. Estey, W. Z., Mclntyre, W., Chouinard, J, Lamer, A., Wilson, B., Le Dain, G, La Forest, G. L' Heureux-Dube', C., Sopinka, J.
Court 27: 1989 -
Dickson, B, Estey, W. Z. Mclntyre, W, Chouinard, J. Lamer, A., Wilson, B. , La Forest, G., L' Heureux-Dube', C., Sopinka, J., Cory, P. D., McLachlin, B.
APPENDIX C
CANADIAN SUPREME COURT AND THEIR SELECTED PERSONAL ATTRIBUTES
192
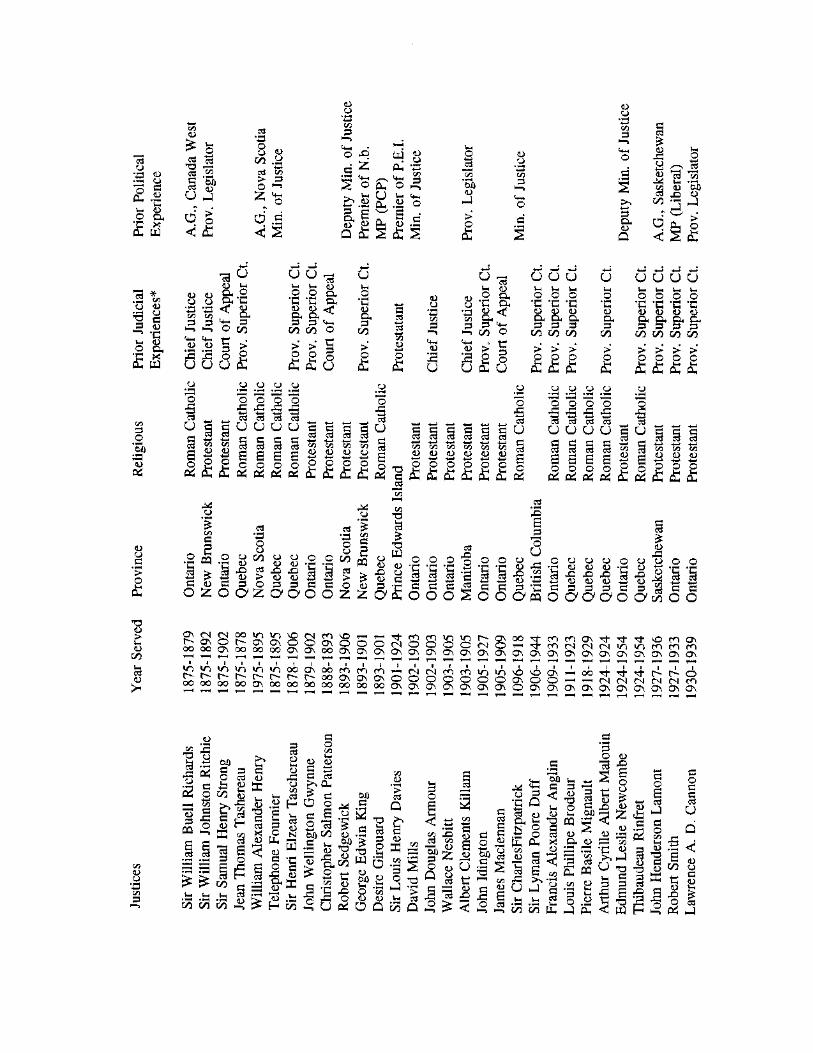
as CJ ••J3 ^
£ VH O
u §
"S
& w
CO w
£ S
3 * « .22 S °o O J
°- I < £
03 *13
S <t> CO £
> § o •-» z ^
* °
d « < §
o O •J3 co 53
>* I o
M w jd
Z tii OH*
CD U +3
0 cd 1 1
«+H o ST
<+H o
CO 53 >—5
CO ?p
VH <D
S
u VH C4-H
o
a J
> p Pi P
C4-H
o
a O d: § £ § £
<L> Q *•+3 CO 3 <D CJO
.2 % Q <U
« a 5 S ^ *n Uh <D o &
53 O &0
04
<D
I
<D Q •43 CO S3
•a w
& O S ' G < g, <+H £ O CO
a a
O <D fa a a § a u u
a <2
> £
0
1 U
1 U
£
o o *a -a
a a 3" 5* CO CO > >
-a o 04 £
o u
U u O
"S §•
CO >
& o cj o y
5 Ji m 1 u u
§ U a a Q q t Gi o£ £
§ Is to <l> 4-» <§
•M "M +-> +-> § S S § +mJ 4J 4-
o
3 a
-4—> 4-* CO CO <D <D -*••* -4_>
<D CJ
'S S3
<D
B
u 73 fa ^
« 5 & u c & *=
-*— — s 2 S q ^ £ C D2J |
<D O CO <D +->
(S
u o a <j u u u u
Oh !=t M-t CO O
•§ o 9 5 2 o U £ U
CO
B
£
y CO <D <D <L> <D
<U <D O O 3 *C z z a £ a a o
C « o o
u w< v-» O O O •a *c *n <D <D <D & & & 53 53 53 CO CO CO
> > >
o
"S §•
CO >
(§
o
"8
CO >
£
Vh i-H WH o o o *a *a *a <D <D O & & & 53 53 53 CO CO CO
^ 2 2 8 £ £ £
i U
<D <D a (3
a «vH
1 5 O U
o _, o U U Q o
<D Xi -r* <u t) <D ^ X) S£ fa ,0 ,S jo c3 - 3 s cS _ 3 ' C fl s s s a a w o a a o o
a a O O
T3 <D &
CO
c3 Q
O N C S f N O O i n ^ ^ O M c n v O r , i > a \ o o c h a \ o o c r \ o o O CN
CO CO *T) T) o o o o 8
! C ! C ! C ! £ } ! C ) ^ ? £ ? a v 0 ® f , l l t , L ' ^ ^ < N < N c o c n « r ) i A O O O O O O O O O N O O O O O O O O O O O O O O O N O x O N a ^ g g g
3 CO CO ON Tj" Tf T|" vo CO ON "T CO CN CN (N CO CO CO
o\ ON G\ ON ON ON ON ON ON ON T—* r-4 1—4 tH r-H *—t r-H
VD crs rl* oo T}" 1 rf Tf
i r>
1 o
i o
O O r-H T—H CN (N CM CN CN CO ON Q\ ON ON ON ON ON ON ON ON
1—» T—( r-H 1—4 T-H r-H 1—4 r-H
CJ *Z3 CO 53
0> <D *c3
CO 53
'O CD
<l> [2 .g co W Q
pq CJ -g
CO CO CO CO o <L> <D Vh
O Q 35

Q * -c W <D O Cu ££
I *a> *3) o hJ > £
03 43 O U a CQ
£ J8 a JS S3 CO
*2 «Sh > I ^1 ^ J d % d d < £ < «J
<D U a §
s Oh -§ a
Vh O V2 '>
s a* cl § u o 8. CO
u *3 nt o £
CZ) £> 8 I m
u o *a §• CO >
(S
13 &« 9- o *3 5 B ^ o 2 o u
13 <D & £
O U
u V-o "S & CO > o
u o "S §• CO > £
<D CJ *£3
O 3 u
a> & CO > o £
*3 *3 13 <D O <L> & & & < < <3 t+H M-H <4-H o o o IB o o O U o U
c> ^ o o +3 •£? oo « 3 ^
13 *3 13 13 o <d o o & & & & < < < <
^ o o o o
o o 2 3 _ o U U
B £ . . £ o o o a u u
00 2 O • H ca> ;=i 04
_CJ CJ u u a u ^ n n § H H ^
! ? ! ? ! ? ! ! i ! l ? i i l i i ? i ? 1^51
o H U t» s w o 2 o ^ a ti P o P
« <D I s
£££££££££i£a:£fi£i£i£££££ O O O O O g ^ S P
«5 flj CO CO C/3 a> <D <D
c« fl-> p O p O O Z3 <•«
<D w i u e o &
a cj Jj J; C3 S * e a s q o 8 OS £
<D *> £ W^ti ^3!UBfli i:B335SCO
2 o o o 2 a z o K « o o a ^ o z aaoamaao
T3 <U > Wi <D CO c3 a) >H
co *o <r> ON rf CO vo 1" VO *r> On on ON a\ o\ ON ON 1—4 t-h *— 1 T—• i—4 *—<
CN CO *n *o VO vo CO co m m CO CO CO ON G\ ON On ON On ON T-H 1—H *—•i T—1 T-h r-H
a\ x vo (N C O C O t > C N * n C O t > o tJ- o o r - O O O N O O O O o t > *n o o t > 0 0 l > o o o o o o r^- o o t > O O 0 0 O N G\ O N O N G\ O N O N O N O N OS O N o \ O N O N O N On t-h r—1 t"h r—» *-"» t-h T-h *—' T-h T-h *-H t-h T-H l-H l > v o o o O O CP\ C N C O
I
o 1 C O
T f
I !>
1
l > 1 O N
i O N
i o
i
C N
3 " *n »r> * o * o m VO v o V O t > r^> r- r - l> C-o o o o O N O N On On O N On On O N On O N On O N On On O N O N O N O N O N
r-H t-h t—i T - 1
t-h T-H T—H t-h t-h T-H T-H t-H t-h r-H
a CJ 'Z3
CO 22
—1 CQ
2 u
1 <D CSX) o
a 3 1 a S P4 £ J 1 u o •a a 1
P-H U
o •a a cd
6 <D
m
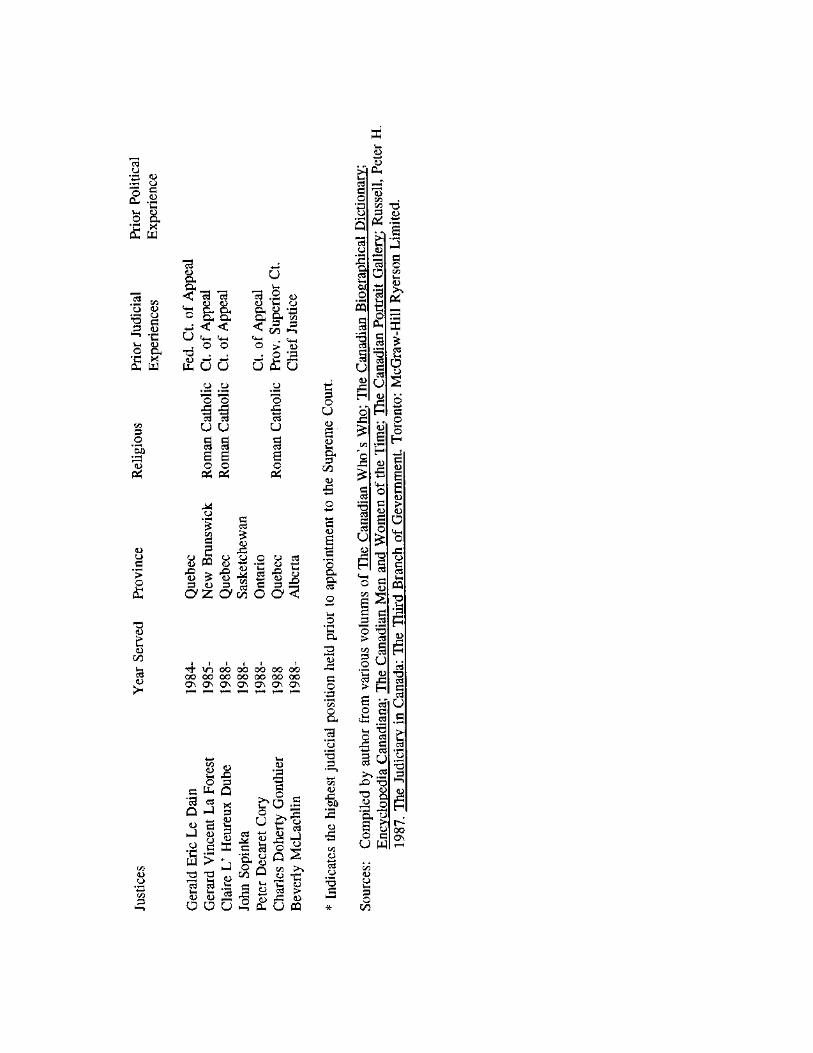
o
o PL,
u
8
I W
.2 ^ g
Vh <D 2 ^
s i S
p o W)
izzj *3 0 4
0> §
* > o
* 3
<C * 3 * 3
* g & c L
^ < W <4-* <4-4
. O O T 3 . . flj -M 4 J
PL, u V
O ZJ
1 1 n i u u
§ § a 6 o o
0 4 0£J
M . H £ cw a
8 m 8 • §
•+—» u
o o *G cd O Vh U
& 8 . " S
^ W S (j .j
O > 1 3
j B S u £ o
O
1 3 u
£
J B
a ^ r>-> £ « ^
6
( §
o u
" S I t s <u
X> S3 & 53 5§ a S3 S
a z a S o
t ; J3 O
U <D
s £
Qh
£ a <D
s
o & &
"O
£ ; <D
0 0
o3 <D
>H
T t * n o o o o o o o o o o OO CO CO OO GO CO GO Q\ 0\ 0\ G\ Q\ G\ Q\
&
J §
a o
*£3 • »H c« o o <
- 3
<D
<D o
T 3 CO S3
a * 3 Q
<D J
o
s
<ZJ
o u u
03 h J
€ o
c
C3
0 • §
Q
X S3
1 <u
S3
i i i i o 5
o o u
> > s
u
5 1 a g
6 8 - Q Q
<D
I o 0 . 3
> , 2
£ 1
GO
5 «5 r2 +-* O ^
H-S OH
<u • §
Q
Cfl <D
c3 x s
• d
<D > <D
T 3 S3
oo <D
W)
2 0
s CO
1
' • 3 a
U
U CO
c« <D
a S3 O
0 0
BIBLIOGRAPHY
Adams G. and P. L. Cavalluzzo. 1969. "The Supreme Court of Canada: A Biographical Study." Osgoode Hall Law Journal 7: 61-86.
Bowen, Don. 1965. "The Explanation of Judicial Voting Behavior from Sociological Characteristics of Judges." Ph.D. Dissertation, Yale University.
Baum, Lawrence. 1988. "Measuring Policy Change in the U.S. Supreme Court." Amrican Political Science Review 82: 905-12.
Baum, Lawrence. 1989. "Comparing The Policy Positions of Supreme Court Justices From Different Periods." Western Political Quarterly: 509-521.
Baum, Lawrence. 1991. "Membership Change and Collective Voting Change in the United States Supreme Court." Journal of Politics 54: 3-24.
Casper, Gerhard and Richard Posner. 1976. The Workload of the Supreme Court. Chicago: American Bar Foundation.
Campbell, Colin. 1977. Canadian Political Facts 1945-1976. Toronto: Methuen Publications.
Cheffins, Ronald I. 1966. The Supreme Court of Canada: The Quiet Court in an Unquiet Country." Osgoode Hall Law Journal 4: 259-275.
Christian, William. 1983. "Ideology and Politics in Canada" In Approaches to Canadian Politics. 2nd Edition, ed. John H. Redekop. Scarborogh, Ontario: Prentice-Hall.
Clokie, H. McD. 1942. "Judicial Review, Federalism, and the Canadian Constitution." Canadian Journal of Economics and Political Science 8: 537-56.
Corry, J. A. 1967. "Precedent and Policy In the Supreme Court." Canadian Bar Review 45: 627-666.
196
197
Danelski, David J. 1969. "The Supreme Court of Japan: An Exploratory Study." In Comparative Judicial Behavior, eds. Schubert and Danelski. New York: Oxford University Press.
Daniels, Steven. 1982. "Civil Litigation in Illinois Trial Courts: An Exploration of Rural-Urban Differences." Law and Polity Quarterly 4: 190-214.
Daniels, Steven. 1990. "Caseload Dynamics and the Nature of Change: The Civil Business of Trial Courts in Four Illinois Counties." Law and Society Review 24(2): 299-320.
Dickson, Brian. 1980. "Operations and Practices, A Comparison." Canada-United States Law Journal, (Conferences on "Comparison of the Role of the Supreme Court in Canada and the United States", Case Western Reserve University, Cleveland, Ohio, October 20, 1979) 3: 86-94.
Editors, Osgoode Hall Law Journal. 1964. "Historical Sketch of the Supreme Court of Canada." Osgoode Hall Law Journal 3: 171-74.
Fouts, Donald R. 1969. "Policy-Making in the Supreme Court of Canada." In Comparative Judicial Behavior: Cross-Cultural Studies in Political Decision-Making in the East and West, eds. Glendon A Schubert and David J. Danelski. New York: Oxford University Press.
Flango, Victor E. and Craig R. Ducat. 1977. "Toward an Integration of Public Law and Judicial Behavior." The Journal of Politics 39: 41-72.
Friedman, Lawrence. 1976. "A Tale of Two Courts: Litigation in Alameda and San Benito Counties." Law and Society Review 10: 267-302.
Gibson, James L. 1983. "From Simplicity to Complexity: The Development of Theory in the Study of Judicial Behavior." Political Behavior 5: 7-49
Government of Canada 1981. Canada Handbook. 1980-81. Ottawa: Canadian Government Publishing Centre.
Haines, Charles G. 1922. "General Observations on the Effects of Personal, Political, and Economic Influences in the Decisions of Judges." Illinois Law Review 17 As reprinted in Judicial Behavior: A Reader in Theory and Research, ed. Glendon A. Schubert. Chicago: Rand McNally and Co.
198
Hensley, Thomas R. (1981). "Studying the Studies: Political Science Research on Judicial Politics, 1961-1980." Paper presented at the Annual Meeting of the Midwest Political Science Association, Cincinnati, April 15-18.
Hogg, Peter H. 1980. "Jurisdiction of the Court, the Supreme Court of Canada." Canada-United States Law Journal (Conference on "Comparison of the Role of the Supreme Court in Canada and the United States", Case Western Reserve University, Cleverland, Ohio, October 20, 1979) 3: 39-55.
Jackson Robert J., Doreen Jackson, and Nicolas Baxter-Moore. 1986. Politics in Canada: Culture, Institutions, Behavior and Public Policy. Scarborough, Ontario: Prentice-Hall Canada Inc.
Laskin, Bora. 1951. "The Supreme Court of Canada, A Final Court of Appeal of and for Canadians." Canadian Bar Review 64: 1038-79.
Laskin, Bora. 1975. "The Supreme Court of Canada, The First One Hundred Years: A Capsule Institutional History." The Canadian Bar Review 53: 459-68.
Lipset, Seymour M. and Stein Rokkan. 1964. "Cleavage Structures, Party Systems and Voting Alignments." In Party Systems and Voter Alignment. eds. Seymour M. Lipset and Stein Rokkan. New York: Free Press.
Livingston, William S. 1950. "Abolition of Appeals from Canadian Courts to Privy Council." Harvard Law Review 64: 104-12.
MacKinnon, Frank. 1946. "The Establishment of the Supreme Court of Canada." The Canadian Historical Review 27: 258-74.
McCleary, Richard and Richard A. Hay, Jr. 1980. Applied Time Series Analysis for the Social Science. Beverly Hill, CA: Sage Publications.
Mcintosh, Wayne. 1981. "150 Years of Litigation and Dispute Settlement: A Court Tale." Law and Society Review 15: 823-848.
Mclver, John P. 1976. "Scaling Judicial Decisions: The Panel Decision making Process of the U.S. Courts of Appeals." American Journal of Political Science 20: 749-61.
McLauchlan, William P. 1980. "An Exploratory Analysis of the Supreme Court's Caseload, 1880-1976." Judicature 64: 32-42.
199
McLauchlan, William P. 1981. "Longitudinal Models of the Supreme Court's Caseload, 1880-1979." Paper presented at the Annual Meeting of the Southern Political Science Association, Memphis, November 5-6.
McLauchlan, William P. 1982. "Spectral Analysis of United States Supreme Court Caseload, 1880-1979." Paper presented to the Annual Meeting of the American Political Science Association, Denver, September 2-5.
McWhinney, Edward. 1974. The Political Impact of the Canadian Supreme Court." Notre Dame Lawyer 49: 1000-11.
Morton, F. L. 1986. "The Politicization of the Supreme Court of Canada." Paper presented to the Interim Meeting of the Research Committee on Comparative Judicial Studies of the International Political Science Association, Center for the Study of Law and Society, University of California, Berkeley, Diecember 14-15, 1986.
Morton, F. L. 1987. "The Political Impact of the Canadian Charter of Rights and Freedoms." Canadian Journal of Political Science 18: 31- 54.
Morton, F. L., Peter H. Russell and Michael J. Withey. 1991. "The Supreme Court's First 100 Charter of Rights Decisions: A Statistical Analysis." Occasional Papers Series, Research Study 6.1, Research Unit for Socio-Legal Studies, University of Calgary.
Nagel, Stuart S. 1961. "Ethnic Affiliations and Judicial Propensities." Journal of Politics 24: 94-110.
Ornstein, Michael D., H. Micheal Stevenson and A. Paul Williams. 1980. "Region, Class and Political Culture in Canada." Canadian Journal of Political Science 13: 227-271
Peck, Sydney L. 1967a. "A Behavioral Approach to the Judicial Process: Scalogram Analysis." Osgoode Hall Law Journal 5: 246-70.
Peck, Sydney L. 1967b. "The Supreme Court of Canada (1958-1966): A Search for Policy through Scalogram Analysis." Canadian Bar Review 45: 666-726.
Peck, Sidney L. 1969. "A Scalogram Analysis of the Supreme Court of Canada, 1958-1967." In Comparative Judicial Behavior, eds., Glendon A. Schubert and David J. Danelski. New York: Oxford University Press.
200
Peck, Sydney L. 1987. "A Analytical Framework for an Application of the Canadian Charter of Rights and Freedoms." Osgoode Hall Law Journal 25:1-23
Pritchett, C. Herman. 1948. The Roosevelt Court: A Study in Judicial Politics and Values, 1939-1947. New York: MacMillan Co.
Redekop, John H. 1983. ed. Approaches to Canadian Politics. 2nd edition. Scarborough, Ontario: Prentice-Hall Inc.
Russell, Peter H. 1970. The Supreme Court of Canada as a Bilingual and Bicultural Institution. Ottawa: Information Canada.
Russell, Peter H. 1975. "The Political Role of the Supreme Court of Canada in Its First Century." Canadian Bar Review 53: 576-596.
Russell, Peter H. 1980. "Introduction, History and Development of the Court in National Society: The Canadian Supreme Court." Canada-United States Law Journal (Conference on "Comparison of the Role of the Supreme Court in Canada and the United States", Case Western Reserve University, Cleveland, Ohio, October 20, 1979) 3: 4-14.
Russell, Peter H. 1982. "The Effect of a Charter of Rights on the Policy-Making Role of Canadian Courts." Canadian Public Administration 25:1-33.
Russell, Peter H. 1983. "The Political Purposes of the Canadian Charter of Rights and Freedoms." Canadian Bar Review 61:30-55.
Russell, Peter H. 1984. "Constitutional Reform of the Judicial Bench: Symbolic vs Operational Considernations." Canadian Journal of Political Science 17 (June):227-52.
Russell, Peter H. 1985. "The Supreme Court and Federal-Provincial Relations: The Political Use of Legal Resources." Canadian Public Policy 11, #2, 161-70.
Russell, Peter H. 1986. "Comment on the 'Critics of the Judicial Committee of the Privy Council: The New Orthodoxy and an Alternative Explanation.'" Canadian Journal of Political Science 19:532-37.
201
Russell, Peter H. 1987. The Judiciary in Canada: The Third Branch of Government. Toronto: McGraw-Hill.
Russell, Peter H. 1990. "The Diffusion of Judicial Review: The Commonwealth, the United States, and the Canadian Case." In "Symposium on Judicial Review and Public Policy in Comparative Perspective," eds., Jackson and Tate. Policy Studies Journal 19: 116-126.
Schubert, Glendon A. 1962. "A Solution to the Indeterminate Factorial Resolution of Thurstone and Degan's Study of the Supreme Court." Behavior Science 7: 448-58.
Schubert, Glendon A. 1965. The Judicial Mind: Attitudes and Ideologies of Supreme Court Justices, 1946-1964. Evanston, IL: Northwestern University Press.
Schubert, Glendon A. 1969. ed. Judicial Behavior: A Reader in Theory and Research. Chicago: Rand McNally and Co.
Schubert, Glendon A. 1972. "Judicial Process and Behavior, 1963-1971." In Political Science Annual: An International Review ed. James A. Robinson. Indianapolis: Bobbs-Merrill.
Schubert, Glendon A. 1974. The Judicial Mind Revisited: Psychometric Analysis of Supreme Court Ideology. New York: Oxford University Press.
Schubert, Glendon A. and David J. Danelski, eds. 1969. Comparative Judicial Behavior: Cross-Cultural Studies in Political Decision-Making in the East and West. New York: Oxford University Press.
Schmidhauser, John R. 1959. "The Justices of the Supreme Court: A Collective Portrait." Midwest Journal of Political Science 3: 1-50.
Simeon, Richard and David J. Elkins. 1974. "Regional Political Cultures in Canada." Canadian Journal of Political Science 7: 397-437.
Shapiro, Martin. 1975. "Courts." In Handbook of Political Science, vol. 5, Governmental Institutions and Processes, eds., Fred I. Greenstein and Nelson W. Polsby. Boston: Addison-Wesley.
202
Sittiwong, Panu. 1985. "Canadian Supreme Court Decision-Making: The Personal Attribute Model in Explaining Justices' Patterns of Decision-Making, 1949-1980." Master Thesis, North Texas State University.
Sittiwong, Panu and C. Neal Tate. 1989. "Conflict and Decision Making in the Canadian Supreme Court, 1949-1985." Paper presented to the Biennial Meeting of the Association for Canadian Studies in The United States, San Francisco, November 17-20.
Tanenhaus, Joseph. 1966. "The Cumulative Scaling of Judicial Decisions." Harvard Law Review 79: 1583-1594.
Tate, C. Neal. 1972. "Social Background and Voting Behavior in the Philippine Supreme Court." Law Asia 3: 317-338.
Tate, C. Neal. 1977. "Martial Law and Decision-Making in The Philippines Supreme Court: An Empirical Analysis." In Selected Papers in Asian Studies, Vol. II. 163-174.
Tate, C. Neal. 1981. "Personal Attribute Models of the Voting Behavior of U.S. Supreme Court Justices: Liberalism in Civil Liberties and Economic Decisions, 1946-1978." American Political Science Review 75: 355-67.
Tate, C. Neal. 1983. "The Methodology of Judicial Behavior Research: A Review and Critique." Political Behavior 5: 51-82.
Tate, C. Neal. 1987. "Judicial Institutions in Cross-National Perspective, Toward Integrating Courts into the Comparative Study of Politics." In Comparative Cross National Judicial Systems, ed. John R. Schmidhauser, London: Butterworths.
Tate, C. Neal. and Roger Handberg. 1991. "Time Binding and Theory Building in Personal Attribute Models of Supreme Court Voting Behavior, 1916-88." American Journal of Political Science 35: 460-80.
Tate, C. Neal and Panu Sittiwong. 1987. "Explaining the Decision-Making of the Canadian Supreme Court: 1949-1985." Paper presented at the 29th
Annual Conference of the Western Canadian Studies Group of the Western Social Science Association, El Paso, Texas, April 25.
203
Tate, C. Neal and Panu Sittiwong. 1989. "Decision Making in the Canadian Supreme Court: Extending the Personal Attributes Model Across Nations." Journal of Politics 51:900-16.
Tate, C. Neal and Stacia L. Haynie. 1993. "Authoritarianism and the Functions of Courts: A Time Series Analysis of the Philippine Supreme Court." Law and Society Review 27: 201-234.
Thurston, Louis and J. W. Degan. 1951. "A Factorial Study of the Supreme Court." Preceeding of the National Academy of Science 37: 628-635 as reprinted in Judicial Behavior: A Reader in Theory and Research, ed. Glendon A. Schubert, Chicago: Rand McNally.
Ulmer, Sidney. 1973. "Social Background as an Indicator to the Votes of Supreme Court justices in Criminal Cases." Midwest Journal of Political Science 17: 622-30.
Ulmer, Sidney. 1985. "Government Litigants, Underdogs, and Civil Liberties in The Supreme Court: 1903-1968 Terms." Journal of Politics 47: 899-909.
Ulmer, Sidney. 1986. "Are Social Background Models Time Bound?" American Political Science Review 80: 957-68.
Van Loon, F. and E. Langerwerf. 1990. "Development and the Evolution of Litigation Rates of Civil Courts in Belgium, 1835-1980." Law & Society Review 24(2): 283-98.
Walker, Thomas G, Lee Epstein, and William J. Dixon. 1988. "On the Mysterious Demise of Consensual Norms in the United States Supreme Court." Journal of Politics 50: 361-89.
Weiler, Paul. 1974. In the Last Resort: A Critical Study of the Supreme Court of Canada. Toronto: Carswell.
Whittington, Michael S. and Glen Williams, eds. 1984. Canadian Politics in the 1980s 2nd edition. Toronto: Methuen.