Embed Size (px)
Citation preview
IN COLLABORATION WITH THE PULP AND PAPER RESEARCHINSTITUTE OF CANADA
BENCHMARKING ENERGY USE IN
CANADIAN PULP AND PAPER MILLS
For more information or to receive additional copies of this publication, contact
Canadian Industry Program for Energy Conservationc/o Natural Resources Canada580 Booth Street, 18th FloorOttawa ON K1A 0E4Tel.: 613-995-6839Fax: 613-992-3161E-mail: [email protected] site: oee.nrcan.gc.ca/cipec
or
Pulp and Paper Research Institute of Canada570 St-Jean BoulevardPointe-Claire QC H9R 3J9Tel.: 514-630-4101E-mail: [email protected] site: www.paprican.ca
Library and Archives Canada Cataloguing in Publication
Benchmarking energy use in Canadian Pulp and Paper Mills
Text in English and French on inverted pages.Title on added t.p.: Analyse comparative de la consommation d'énergie dans lesecteur canadien des pâtes et papiers
ISBN 0-662-69589-5Cat. No. M144-121/2006
1. Pulp mills – Energy consumption – Canada.2. Paper mills – Energy consumption – Canada.I. Pulp and Paper Research Institute of Canada.II. Canada. Natural Resources Canada.III. Title: Analyse comparative de la consommation d'énergie dans le secteur canadien des
pâtes et papiers.
TJ163.5.P37B46 2006 333.79’65 C2006-980017-0E
1. Photo courtesy of the Pulp and Paper Research Institute of Canada2. Photo courtesy of Catalyst Paper Corporation
© Her Majesty the Queen in Right of Canada, 2008
Recycled paper
Natural Resources Canada’s Office of Energy EfficiencyLeading Canadians to Energy Efficiency at Home, at Work and on the Road
TABLE OF CONTENTS
FOREWORD . . . . . . . . . . . . . . . . . . . . . . . . . . . . . . . . . . . . . . . . . . . . . . . . . . . . . . . . . .1
1. INTRODUCTION . . . . . . . . . . . . . . . . . . . . . . . . . . . . . . . . . . . . . . . . . . . . . . . . . . . . . .4
2. METHODOLOGY . . . . . . . . . . . . . . . . . . . . . . . . . . . . . . . . . . . . . . . . . . . . . . . . . . . . .8
3. RESULTS . . . . . . . . . . . . . . . . . . . . . . . . . . . . . . . . . . . . . . . . . . . . . . . . . . . . . . . . .14
4. DISCUSSION . . . . . . . . . . . . . . . . . . . . . . . . . . . . . . . . . . . . . . . . . . . . . . . . . . . . . .28
5. INTERPRETATION OF THE RESULTS . . . . . . . . . . . . . . . . . . . . . . . . . . . . . . . . . . . . . . . .34
5.1 How do the results affect my mill? . . . . . . . . . . . . . . . . . . . . . . . . . . . . . . . . . . .35
5.2 What steps do I take? . . . . . . . . . . . . . . . . . . . . . . . . . . . . . . . . . . . . . . . . . . . . .36
6. REFERENCES . . . . . . . . . . . . . . . . . . . . . . . . . . . . . . . . . . . . . . . . . . . . . . . . . . . . . .40
APPENDICES . . . . . . . . . . . . . . . . . . . . . . . . . . . . . . . . . . . . . . . . . . . . . . . . . . . . . . . .41
APPENDIX A. AREA DEFINITIONS . . . . . . . . . . . . . . . . . . . . . . . . . . . . . . . . . . . . . . . . . . .42
APPENDIX B. SAMPLE CALCULATION . . . . . . . . . . . . . . . . . . . . . . . . . . . . . . . . . . . . . . . .50
APPENDIX C. ENERGY BENCHMARKING SURVEY INSTRUCTIONS . . . . . . . . . . . . . . . . . . . . .56
DISCLAIMER
The information contained in Benchmarking Energy Use in Canadian Pulp and Paper Mills and the EnergyBenchmarking Survey Tool on the CD-ROM is intended to be used solely as an educational tool to help companiesdetermine approximately how their facility compares against industry averages. The information is not intended toreplace the findings of a formal energy benchmarking study at a facility. Under no circumstances will theGovernment of Canada or the Pulp and Paper Research Institute of Canada (Paprican) be liable either directly orindirectly to any person who uses such information.
BENCHMARKING ENERGY USE IN CANADIAN PULP AND PAPER MILLS
List of Figures
Figure 1-1 Energy inputs and outputs of a pulp and paper mill . . . . . . . . . . . . . . . . .4
Figure 2-1 Energy conversion areas and manufacturing areas of thepulp and paper mill . . . . . . . . . . . . . . . . . . . . . . . . . . . . . . . . . . . . . . . . .9
Figure 2-2 Energy and fibre inputs and outputs for a mechanical pulping area . . . .10
Figure 3-1 Electricity consumption for a mechanical pulping area producingTMP for newsprint . . . . . . . . . . . . . . . . . . . . . . . . . . . . . . . . . . . . . . . .17
Figure 3-2 Fuel consumption for a kraft recausticizing area . . . . . . . . . . . . . . . . . . .18
Figure 3-3 Thermal energy consumption of a kraft pulping area with acontinuous digester . . . . . . . . . . . . . . . . . . . . . . . . . . . . . . . . . . . . . . . .19
Figure 3-4 Thermal energy consumption of a kraft pulping area with abatch digester . . . . . . . . . . . . . . . . . . . . . . . . . . . . . . . . . . . . . . . . . . . .19
Figure 3-5 Thermal energy consumption for a kraft pulp bleaching area forsoftwood pulp . . . . . . . . . . . . . . . . . . . . . . . . . . . . . . . . . . . . . . . . . . . .20
Figure 3-6 Net thermal energy production for a mechanical pulping areaproducing TMP for newsprint . . . . . . . . . . . . . . . . . . . . . . . . . . . . . . . .21
Figure 3-7 Thermal energy consumption for a paper machine area producingnewsprint . . . . . . . . . . . . . . . . . . . . . . . . . . . . . . . . . . . . . . . . . . . . . . . .22
Figure 3-8 Thermal energy consumption for a paper machine area producinguncoated groundwood specialties . . . . . . . . . . . . . . . . . . . . . . . . . . . . . .22
Figure 4-1 Electricity consumption for manufacturing bleached kraftmarket pulp . . . . . . . . . . . . . . . . . . . . . . . . . . . . . . . . . . . . . . . . . . . . . .30
Figure 4-2 Fuel consumption for manufacturing bleached kraft market pulp . . . . . .30
Figure 4-3 Thermal energy consumption for manufacturing bleached kraftmarket pulp . . . . . . . . . . . . . . . . . . . . . . . . . . . . . . . . . . . . . . . . . . . . . .31
Figure 4-4 Electricity consumption for manufacturing newsprint from TMP . . . . . .32
Figure 4-5 Net thermal energy consumption for manufacturing newsprintfrom TMP . . . . . . . . . . . . . . . . . . . . . . . . . . . . . . . . . . . . . . . . . . . . . . .32
Figure B-1 Energy conversion and manufacturing areas of a mill producingnewsprint from TMP . . . . . . . . . . . . . . . . . . . . . . . . . . . . . . . . . . . . . . .50
BENCHMARKING ENERGY USE IN CANADIAN PULP AND PAPER MILLS
List of Tables
Table 3-1 Distribution of mills by pulping process and product type . . . . . . . . . . .14
Table 3-2 Data quality . . . . . . . . . . . . . . . . . . . . . . . . . . . . . . . . . . . . . . . . . . . . . .15
Table 3-3 Electricity consumption of pulp manufacturing areas . . . . . . . . . . . . . . .16
Table 3-4 Fuel consumption of pulp manufacturing areas . . . . . . . . . . . . . . . . . . .17
Table 3-5 Thermal energy consumption of pulp manufacturing areas . . . . . . . . . . .18
Table 3-6 Thermal energy production of pulp manufacturing areas . . . . . . . . . . . .20
Table 3-7 Electricity consumption of product manufacturing areas . . . . . . . . . . . .21
Table 3-8 Fuel consumption of product manufacturing areas . . . . . . . . . . . . . . . . .22
Table 3-9 Thermal energy consumption of product manufacturing areas . . . . . . . .23
Table 3-10 Electricity consumption of common areas . . . . . . . . . . . . . . . . . . . . . . .23
Table 3-11 Fuel consumption of common areas . . . . . . . . . . . . . . . . . . . . . . . . . . . .23
Table 3-12 Thermal energy consumption of common areas . . . . . . . . . . . . . . . . . . .24
Table 3-13 Electricity consumption of boiler areas . . . . . . . . . . . . . . . . . . . . . . . . . .24
Table 3-14 Fuel consumption of boiler areas . . . . . . . . . . . . . . . . . . . . . . . . . . . . . .24
Table 3-15 Thermal energy consumption of boiler areas . . . . . . . . . . . . . . . . . . . . .25
Table 3-16 Electricity consumption of kraft recovery boilers . . . . . . . . . . . . . . . . . .25
Table 3-17 Fuel consumption of kraft recovery boilers . . . . . . . . . . . . . . . . . . . . . .25
Table 3-18 Net thermal energy production of kraft recovery boilers . . . . . . . . . . . .25
Table 3-19 Thermal energy consumption of generators . . . . . . . . . . . . . . . . . . . . . .26
Table 3-20 Steam consumption of deaerators . . . . . . . . . . . . . . . . . . . . . . . . . . . . .26
Table 4-1 Energy consumption and production for unbleached kraft pulp . . . . . . .28
Table 4-2 Energy consumption and production for bleached kraft pulp . . . . . . . . .29
Table 4-3 Energy consumption and production for manufacturing bleachedkraft market pulp . . . . . . . . . . . . . . . . . . . . . . . . . . . . . . . . . . . . . . . . . .29
Table 4-4 Energy consumption and production for manufacturing newsprint . . . .31
Table A-1 Technology descriptors–pulp manufacturing areas . . . . . . . . . . . . . . . . .42
Table A-2 Technology descriptors–product manufacturing areas . . . . . . . . . . . . . . .45
Table A-3 Technology descriptors–common areas . . . . . . . . . . . . . . . . . . . . . . . . .47
Table A-4 Technology descriptors–energy conversion areas . . . . . . . . . . . . . . . . . .48
Table B-1 Energy data for a newsprint mill . . . . . . . . . . . . . . . . . . . . . . . . . . . . . .52
Table B-2 Reconciled energy data for a newsprint mill . . . . . . . . . . . . . . . . . . . . . .53
Table B-3 Specific energy data for a newsprint mill . . . . . . . . . . . . . . . . . . . . . . . .55
Table B-4 Energy consumption of the power boiler . . . . . . . . . . . . . . . . . . . . . . . .55

BENCHMARKING ENERGY USE IN CANADIAN PULP AND PAPER MILLS
FOREWORD
1FOREWORD
The Canadian pulp and paper sector, founded 200 years ago, has become an importantcomponent of the Canadian economy. Pulp and paper manufacturing is highly integratedwith its allied sectors in the forest products industry—forestry and wood products.
The forest products industry contributes 3 percent of Canada’s gross domestic product.The industry operates in communities throughout Canada, providing direct employmentfor 360 000 Canadians.
The pulp and paper sector is one of the most energy-intensive sectors, consumingapproximately 30 percent of the industrial energy used in Canada. Because energy is asignificant production-cost component (about 25 percent), the sector has made efforts toreduce its fuel costs by switching to renewable biomass sources (by-products of theproduction process) and energy efficiency improvements.
Pulp and paper manufacturing is unique among manufacturing sectors in that it sources57 percent of its energy consumption from biomass. As well, the sector reduced its energyuse by an average of 1 percent annually since 1990 through improvements in energyefficiency. These achievements have been well documented by the industry and throughinitiatives such as the Canadian Industry Program for Energy Conservation (CIPEC).
Although its progress on energy conservation is impressive, the pulp and paper sector wantsand needs to go further. The sector aims to produce all the energy it requires, to ensure itslong-term competitiveness in the global market. In fact, the industry has the potential tobecome a net exporter of energy. It has the largest industrial cogeneration capacity inCanada and has the potential for further installations.
How can the industry become more energy efficient? It must implement both proven andnew technology. However, mills must understand how they use energy before they adoptnew energy sources or technology.
That is where energy benchmarking can help. This benchmarking study, conducted by thePulp and Paper Research Institute of Canada (Paprican), shows how the sector uses energy.The study found causes of wasted energy, but also revealed that sector best practices arenear the theoretical minimums for certain process segments.
Its results will help Canada’s pulp and paper manufacturers adopt today’s best practicesmore consistently across the sector while investigating the best practices of tomorrow.


INTRODUCTION1
4
BENCHMARKING ENERGY USE IN CANADIAN PULP AND PAPER MILLS
1 INTRODUCTION
1. INTRODUCTION
A benchmarking study compares the performance of a mill with its competitors or with amodel mill that has new technology.
The results can be a valuable motivating force for change, both in operating practice andcapital investment. A mill can assess its operating costs (energy) and environmental impact(greenhouse gas emissions) relative to its competitors and relative to the lowest values thatcan be obtained practically.
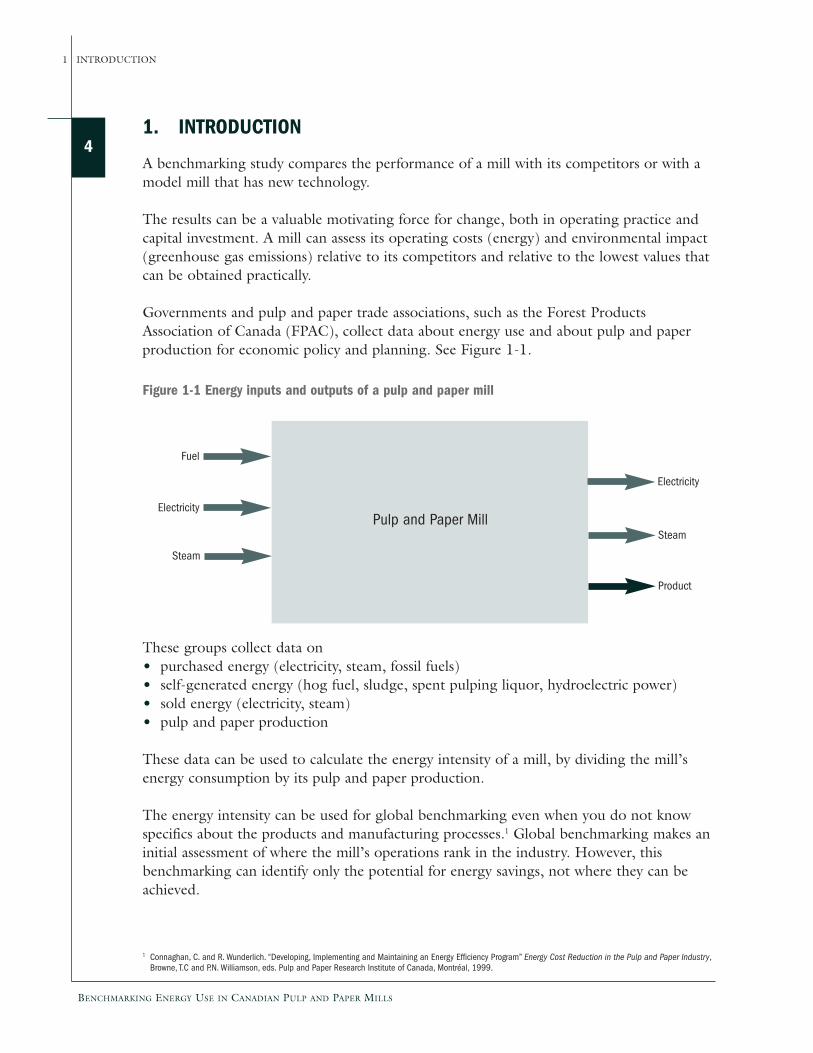
Governments and pulp and paper trade associations, such as the Forest ProductsAssociation of Canada (FPAC), collect data about energy use and about pulp and paperproduction for economic policy and planning. See Figure 1-1.
These groups collect data on• purchased energy (electricity, steam, fossil fuels)• self-generated energy (hog fuel, sludge, spent pulping liquor, hydroelectric power)• sold energy (electricity, steam)• pulp and paper production
These data can be used to calculate the energy intensity of a mill, by dividing the mill’senergy consumption by its pulp and paper production.
The energy intensity can be used for global benchmarking even when you do not knowspecifics about the products and manufacturing processes.1 Global benchmarking makes aninitial assessment of where the mill’s operations rank in the industry. However, thisbenchmarking can identify only the potential for energy savings, not where they can beachieved.
Figure 1-1 Energy inputs and outputs of a pulp and paper mill
Fuel
Pulp and Paper MillElectricity
Steam
Electricity
Steam
Product
1 Connaghan, C. and R. Wunderlich. “Developing, Implementing and Maintaining an Energy Efficiency Program” Energy Cost Reduction in the Pulp and Paper Industry,Browne, T.C and P.N. Williamson, eds. Pulp and Paper Research Institute of Canada, Montréal, 1999.
BENCHMARKING ENERGY USE IN CANADIAN PULP AND PAPER MILLS
INTRODUCTION 1
5To identify where process improvements and energy savings can be achieved, benchmarkingcomparisons should be made for individual process areas in the mill.
For example, in a thermomechanical pulp (TMP) newsprint mill, the total steam demand isdetermined by the performance of both the TMP reboiler and the paper machine dryer.High steam consumption can result from poor performance of the reboiler or the dryer,and a global benchmarking survey cannot determine which area requires improvement.However, by comparing these two individual process areas you can determine which arearequires improvement.
In this report, the Pulp and Paper Research Institute of Canada (Paprican) describes amethod for benchmarking the energy use for process areas in pulp and paper mills.Paprican then presents the results of a benchmarking survey of energy use in Canadian pulpand paper operations.
In “Methodology,” the benchmarking method is explained. Energy use in pulp and papermills was analysed by examining energy conversion areas and manufacturing areas.
In “Results,” the results of the detailed data analysis in manufacturing areas and energyconversion areas from 49 mills are presented.
In “Discussion,” the energy consumption to produce two product grades, kraft pulp andnewsprint, from TMP is determined by combining the relevant manufacturing areas at millsites.
In “Interpretation of the Results,” reasons are given for why the results for each areabenchmarked may differ.
“How do the results affect my mill?” presents information about how to use the resultsfrom the benchmarking study.
“What steps do I take?” provides a seven-step process explaining how you can start to findopportunities for energy efficiency improvements.
“Appendix A. Area definitions” lists the definitions for the process areas in the pulp andpaper mill.
Sample calculations are described in “Appendix B. Sample calculation.”
“Appendix C. Energy benchmarking survey instructions” concludes the report withinstructions on how to benchmark your facility using the enclosed CD-ROM, whichincludes an Excel workbook. The workbook contains spreadsheets (six visible and onehidden) with step-by-step instructions. The information is not intended to replace thefindings of a formal energy benchmarking study at a facility.

METHODOLOGY2
8
BENCHMARKING ENERGY USE IN CANADIAN PULP AND PAPER MILLS
2 METHODOLOGY
2. METHODOLOGY
The Pulp and Paper Research Institute of Canada (Paprican) developed a methodology tobenchmark the energy use in pulp and paper mills by process area.2
This method is based on the approach developed by the International Energy Agency(IEA) Programme on Advanced Energy-Efficient Technologies for the Pulp and PaperIndustry for life-cycle studies.3
Data are collected on• purchased energy• self-generated energy• sold energy• pulp and paper production
With this information, you can make global benchmarking comparisons for mill operations.The energy and fibre resources are allocated to areas. This allows benchmarkingcomparisons for individual areas in a mill and for product grades.
The benchmarking method has four steps:• establish process areas• collect data• allocate and reconcile data• calculate energy consumption
Establish process areasThe first step is to divide the pulp and paper mill into process areas. The areas are describedin Appendix A.
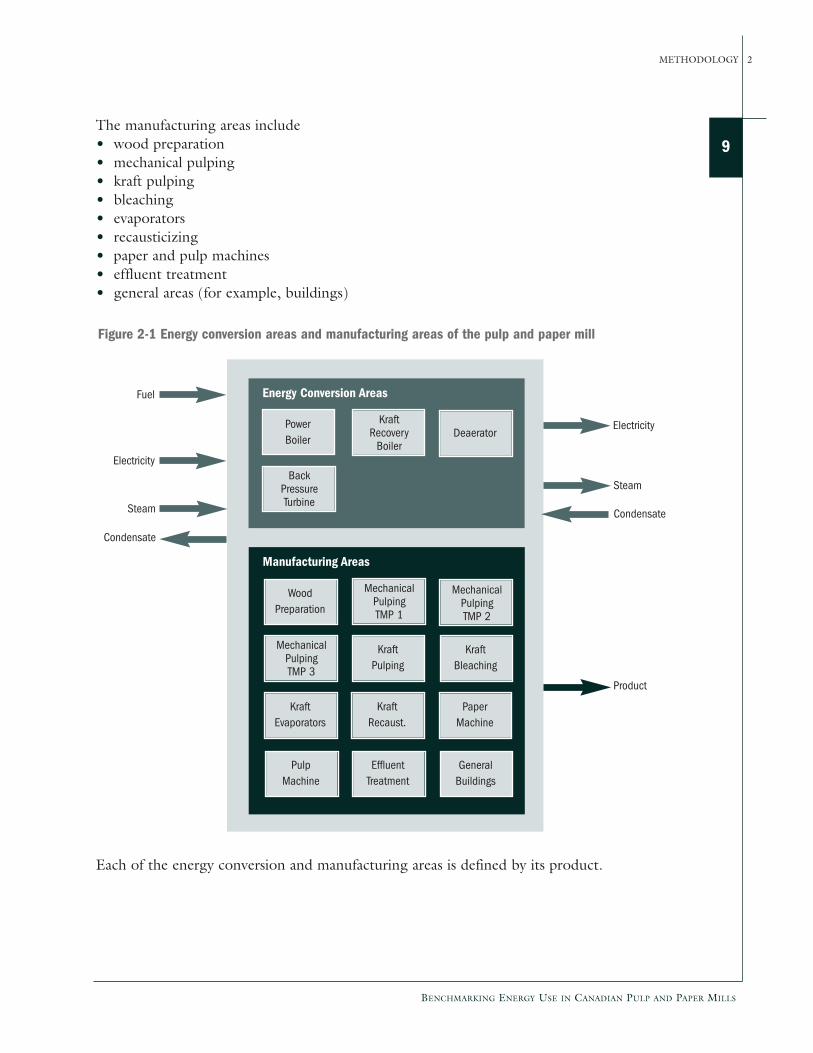
Figure 2-1 shows the process areas of a mill that produce newsprint and kraft market pulpfrom TMP and kraft pulp.
There are two kinds of process areas: energy conversion areas and pulp and papermanufacturing areas. In the energy conversion areas, purchased and self-generated energyare converted to steam and electricity for use in the manufacturing areas or for sale. Theenergy conversion areas include power and recovery boilers, a backpressure turbine and adeaerator.
In the manufacturing areas of pulp and paper manufacturing operations, energy resources(fuel, steam and electricity) and fibre resources are used to produce newsprint and kraftmarket pulp.
2 Francis, D.W. Method for Benchmarking Energy Usage in Pulp and Paper Operations, PAPTAC Midwest Branch Meeting, Thunder Bay, Ontario, September 25–27, 2002.
3 IEA Programme on Advanced Energy-Efficient Technologies for the Pulp and Paper Industry. “Recommended Methods for Energy Reporting in Pulp and Paper Industry,Summary Report” Assessment of Life-Cycle-Wide Energy-Related Environmental Impacts in the Pulp and Paper Industry, IEA, 1999.
BENCHMARKING ENERGY USE IN CANADIAN PULP AND PAPER MILLS
METHODOLOGY 2
9The manufacturing areas include• wood preparation• mechanical pulping• kraft pulping• bleaching• evaporators• recausticizing• paper and pulp machines• effluent treatment• general areas (for example, buildings)
Figure 2-1 Energy conversion areas and manufacturing areas of the pulp and paper mill
Fuel
Electricity
Steam
Electricity
Steam
Product
Condensate
Condensate
Energy Conversion Areas
PowerBoiler
KraftRecoveryBoiler
Deaerator
BackPressureTurbine
Manufacturing Areas
MechanicalPulpingTMP 1
WoodPreparation
MechanicalPulpingTMP 2
MechanicalPulpingTMP 3
KraftPulping
KraftBleaching
KraftRecaust.
PaperMachine
KraftEvaporators
EffluentTreatment
GeneralBuildings
PulpMachine
Each of the energy conversion and manufacturing areas is defined by its product.
10
BENCHMARKING ENERGY USE IN CANADIAN PULP AND PAPER MILLS
2 METHODOLOGY
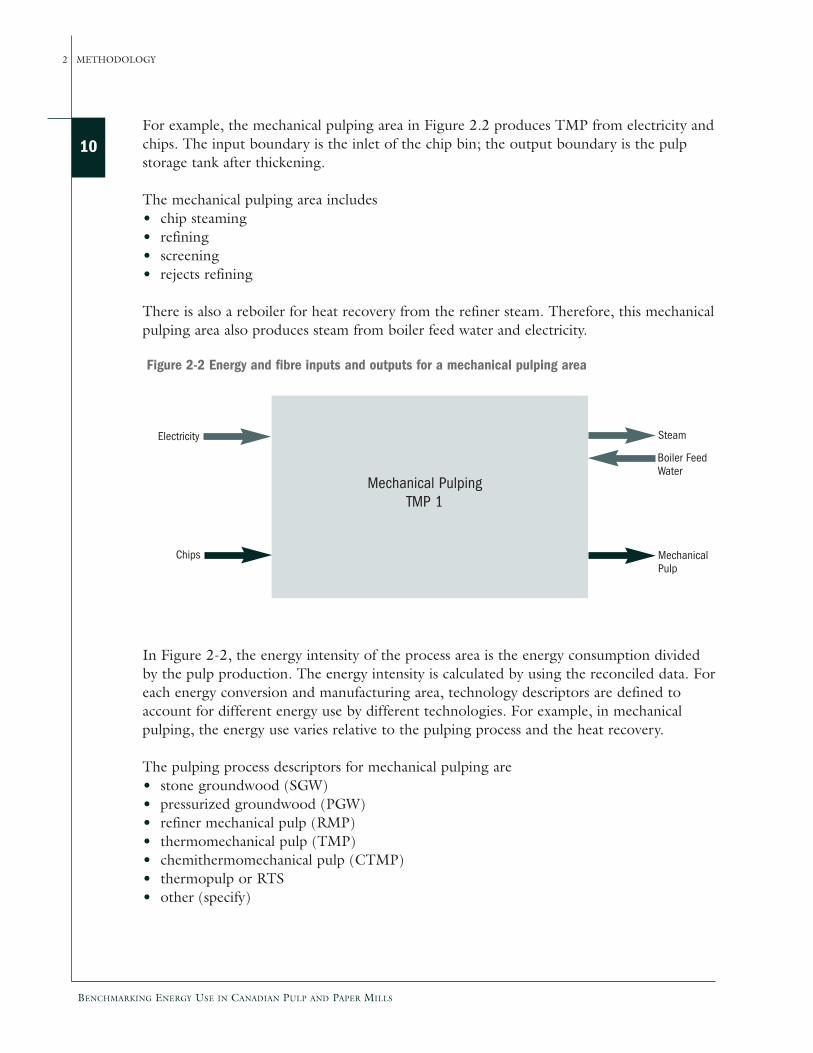
For example, the mechanical pulping area in Figure 2.2 produces TMP from electricity andchips. The input boundary is the inlet of the chip bin; the output boundary is the pulpstorage tank after thickening.
The mechanical pulping area includes• chip steaming• refining• screening• rejects refining
There is also a reboiler for heat recovery from the refiner steam. Therefore, this mechanicalpulping area also produces steam from boiler feed water and electricity.
Figure 2-2 Energy and fibre inputs and outputs for a mechanical pulping area
Mechanical PulpingTMP 1
Electricity
Chips
Boiler FeedWater
Steam
MechanicalPulp
In Figure 2-2, the energy intensity of the process area is the energy consumption dividedby the pulp production. The energy intensity is calculated by using the reconciled data. Foreach energy conversion and manufacturing area, technology descriptors are defined toaccount for different energy use by different technologies. For example, in mechanicalpulping, the energy use varies relative to the pulping process and the heat recovery.
The pulping process descriptors for mechanical pulping are• stone groundwood (SGW)• pressurized groundwood (PGW)• refiner mechanical pulp (RMP)• thermomechanical pulp (TMP)• chemithermomechanical pulp (CTMP)• thermopulp or RTS• other (specify)
BENCHMARKING ENERGY USE IN CANADIAN PULP AND PAPER MILLS
METHODOLOGY 2
11The heat recovery descriptors are• primary refiners only• mainline refiners only• mainline and reject refiners• none
These technology descriptors allow you to make benchmarking comparisons among areaswith the same technology (for example, TMP lines) or between areas with differenttechnologies (for example, between SGW lines and TMP lines). Similar technologydescriptors are defined for the other energy conversion and manufacturing areas. SeeAppendix A.
Collect dataThe second step is to collect data on energy inputs and outputs for the mill and for pulpand paper production. This is the same information that is collected in globalbenchmarking studies.
For the mill in Figure 2-1, the energy inputs can include fuel (purchased fossil fuel, self-generated spent pulping liquor), electricity and steam. The energy outputs can includeelectricity and steam.
Data are also collected on condensate input and output because the thermal energy inputto the mill is the steam input (for example, from a cogeneration plant) minus thecondensate returned to the steam supplier.
At most mills, engineers from Paprican visited the mill site for several days to collect theenergy and production data from mill staff and mill information systems. This practiceensures a consistent method for the allocation of energy and fibre resources to the energyconversion and manufacturing areas. However, for a few mills, the mill staff, in consultationwith a Paprican engineer, recorded the data.
At all mills, the data were recorded in a spreadsheet tool to facilitate data checking and datareconciliation. Paprican collected data from 51 mills: 49 mills in Canada and 2 mills in theUnited States that were similar to the Canadian operations of the same companies. Thesemills represent 55 percent of Canadian production capacity and provided data for themajor pulping processes and product grades of the Canadian pulp and paper industry.
Allocate and reconcile dataThe third step is to allocate the energy and fibre resources to the energy conversion andmanufacturing areas. For each area, data are collected on energy inputs and outputs and onfibre inputs and outputs.
12
BENCHMARKING ENERGY USE IN CANADIAN PULP AND PAPER MILLS
2 METHODOLOGY
For the mechanical pulping area in Figure 2-2, the energy inputs are electricity and the feedwater to the reboiler; the energy output is the reboiler steam. The fibre input is chips fromwood preparation; the fibre output is TMP.
Ideally, all the energy inputs to the mill would be allocated to areas in the mill and to anyenergy sales. That is, energy inputs and outputs would balance. Realistically, there will notbe a perfect energy balance because of instrument measurement errors and estimationswhen measurements are unavailable.
The quality of the data is recorded when the energy and fibre data are collected:• A–reliable instrumentation with good calibration• B–less reliable instrumentation• C–calculated by heat and material balance from measured values• D–estimated when measurements are unavailable
This information is used to weight the corrections needed to reconcile the energy and fibredata.
Calculate energy consumptionThe fourth step is to calculate the specific energy consumption for each area from itsenergy consumption and fibre production, by using the reconciled data. These results allowthe mill staff to identify where their operations are least efficient and thereby to identifyareas that require changes in operating procedures or capital investments. A samplecalculation for a newsprint mill is shown in Appendix B.
RESULTS3
14
BENCHMARKING ENERGY USE IN CANADIAN PULP AND PAPER MILLS
3 RESULTS
3. RESULTS
The Pulp and Paper Research Institute of Canada (Paprican) collected energy andproduction data from 51 mills on a quarterly basis. For most mills, Paprican collected datafor four consecutive quarters. For two mills, Paprican could collect data for only onequarter. The data for these two mills were excluded from the analysis, leaving 49 mills inthe data set. This section presents the results of the energy benchmarking survey for themanufacturing and energy conversion areas of the 49 pulp and paper mills.
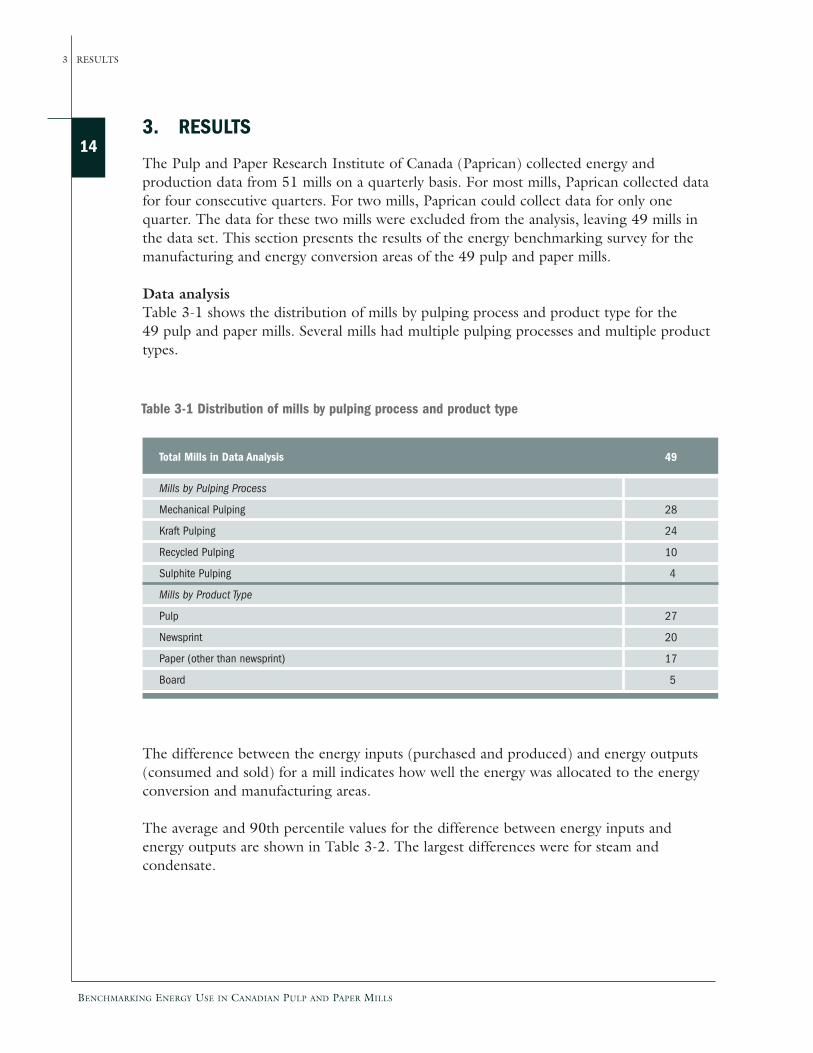
Data analysisTable 3-1 shows the distribution of mills by pulping process and product type for the49 pulp and paper mills. Several mills had multiple pulping processes and multiple producttypes.
Table 3-1 Distribution of mills by pulping process and product type
Total Mills in Data Analysis
Mills by Pulping Process
Mechanical Pulping
Kraft Pulping
Recycled Pulping
Sulphite Pulping
Mills by Product Type
Pulp
Newsprint
Paper (other than newsprint)
Board
49
28
24
10
4
27
20
17
5
The difference between the energy inputs (purchased and produced) and energy outputs(consumed and sold) for a mill indicates how well the energy was allocated to the energyconversion and manufacturing areas.
The average and 90th percentile values for the difference between energy inputs andenergy outputs are shown in Table 3-2. The largest differences were for steam andcondensate.
BENCHMARKING ENERGY USE IN CANADIAN PULP AND PAPER MILLS
RESULTS 3
15
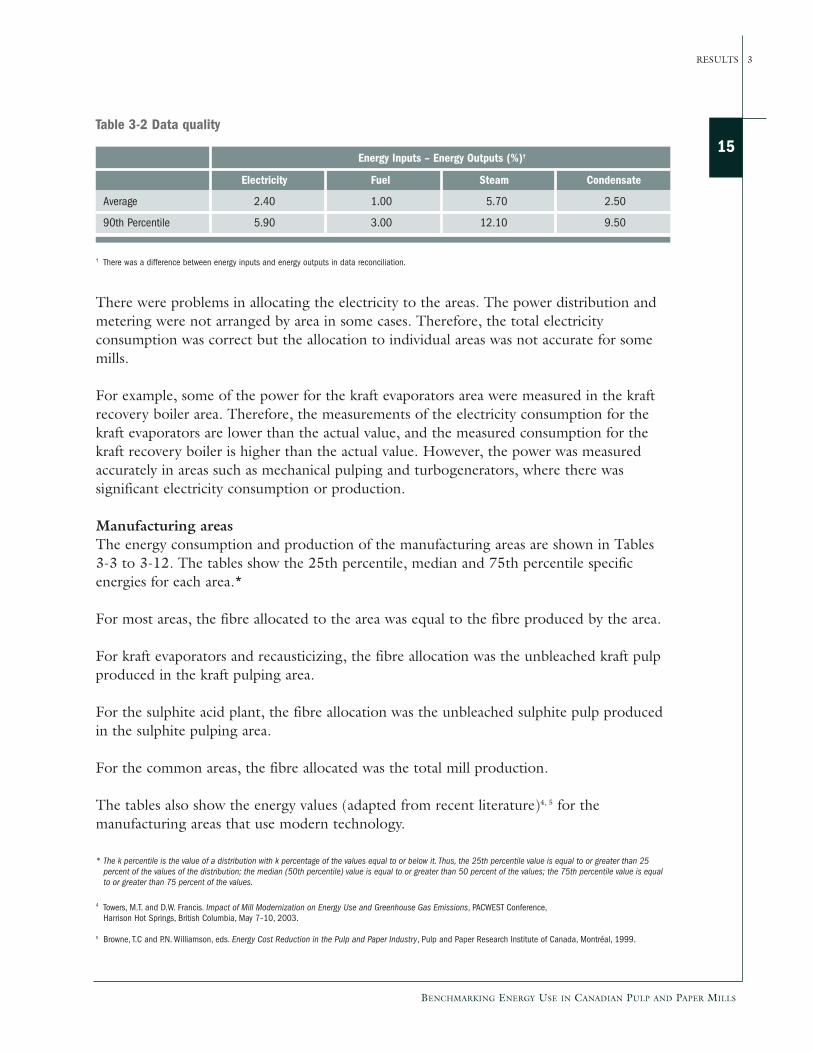
There were problems in allocating the electricity to the areas. The power distribution andmetering were not arranged by area in some cases. Therefore, the total electricityconsumption was correct but the allocation to individual areas was not accurate for somemills.
For example, some of the power for the kraft evaporators area were measured in the kraftrecovery boiler area. Therefore, the measurements of the electricity consumption for thekraft evaporators are lower than the actual value, and the measured consumption for thekraft recovery boiler is higher than the actual value. However, the power was measuredaccurately in areas such as mechanical pulping and turbogenerators, where there wassignificant electricity consumption or production.
Manufacturing areasThe energy consumption and production of the manufacturing areas are shown in Tables3-3 to 3-12. The tables show the 25th percentile, median and 75th percentile specificenergies for each area.*
For most areas, the fibre allocated to the area was equal to the fibre produced by the area.
For kraft evaporators and recausticizing, the fibre allocation was the unbleached kraft pulpproduced in the kraft pulping area.
For the sulphite acid plant, the fibre allocation was the unbleached sulphite pulp producedin the sulphite pulping area.
For the common areas, the fibre allocated was the total mill production.
The tables also show the energy values (adapted from recent literature)4, 5 for themanufacturing areas that use modern technology.
Table 3-2 Data quality
Electricity Fuel Steam Condensate
Average 2.40 1.00 5.70 2.50
90th Percentile 5.90 3.00 12.10 9.50
Energy Inputs – Energy Outputs (%)†
† There was a difference between energy inputs and energy outputs in data reconciliation.
* The k percentile is the value of a distribution with k percentage of the values equal to or below it. Thus, the 25th percentile value is equal to or greater than 25percent of the values of the distribution; the median (50th percentile) value is equal to or greater than 50 percent of the values; the 75th percentile value is equalto or greater than 75 percent of the values.
4 Towers, M.T. and D.W. Francis. Impact of Mill Modernization on Energy Use and Greenhouse Gas Emissions, PACWEST Conference,Harrison Hot Springs, British Columbia, May 7–10, 2003.
5 Browne, T.C and P.N. Williamson, eds. Energy Cost Reduction in the Pulp and Paper Industry, Pulp and Paper Research Institute of Canada, Montréal, 1999.
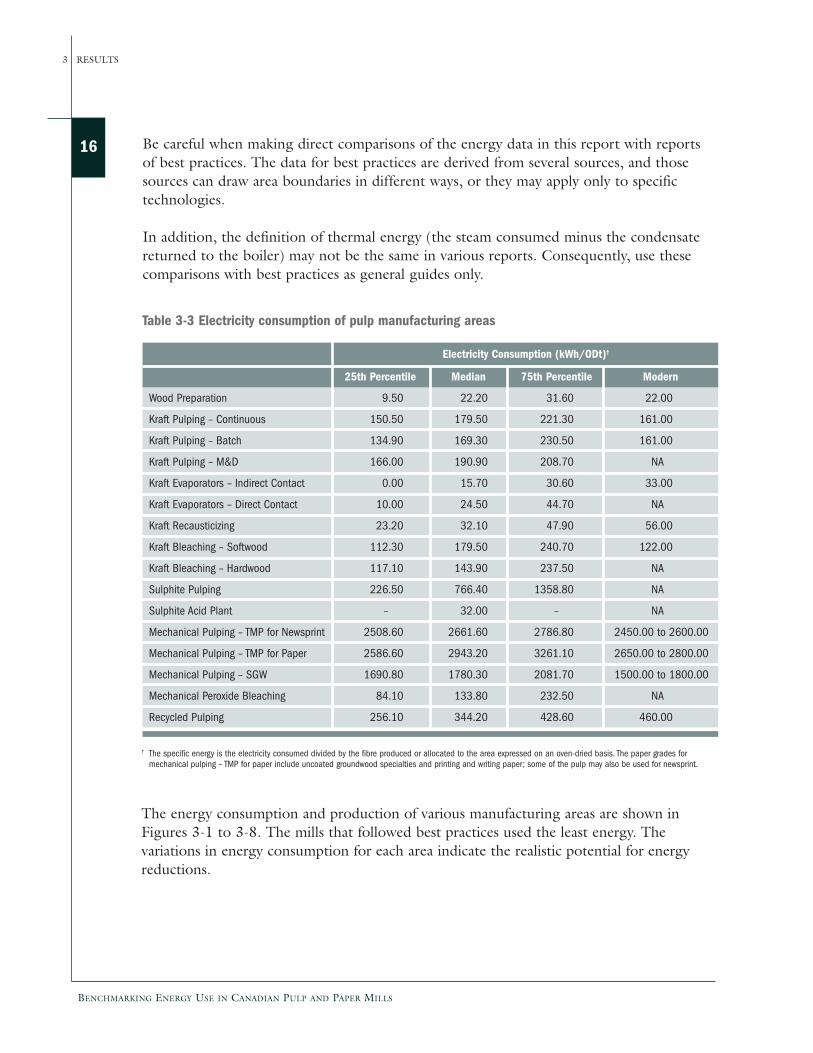
Be careful when making direct comparisons of the energy data in this report with reportsof best practices. The data for best practices are derived from several sources, and thosesources can draw area boundaries in different ways, or they may apply only to specifictechnologies.
In addition, the definition of thermal energy (the steam consumed minus the condensatereturned to the boiler) may not be the same in various reports. Consequently, use thesecomparisons with best practices as general guides only.
16
BENCHMARKING ENERGY USE IN CANADIAN PULP AND PAPER MILLS
3 RESULTS
Table 3-3 Electricity consumption of pulp manufacturing areas
25th Percentile Median 75th Percentile Modern
Wood Preparation 9.50 22.20 31.60 22.00
Kraft Pulping – Continuous 150.50 179.50 221.30 161.00
Kraft Pulping – Batch 134.90 169.30 230.50 161.00
Kraft Pulping – M&D 166.00 190.90 208.70 NA
Kraft Evaporators – Indirect Contact 0.00 15.70 30.60 33.00
Kraft Evaporators – Direct Contact 10.00 24.50 44.70 NA
Kraft Recausticizing 23.20 32.10 47.90 56.00
Kraft Bleaching – Softwood 112.30 179.50 240.70 122.00
Kraft Bleaching – Hardwood 117.10 143.90 237.50 NA
Sulphite Pulping 226.50 766.40 1358.80 NA
Sulphite Acid Plant – 32.00 – NA
Mechanical Pulping – TMP for Newsprint 2508.60 2661.60 2786.80 2450.00 to 2600.00
Mechanical Pulping – TMP for Paper 2586.60 2943.20 3261.10 2650.00 to 2800.00
Mechanical Pulping – SGW 1690.80 1780.30 2081.70 1500.00 to 1800.00
Mechanical Peroxide Bleaching 84.10 133.80 232.50 NA
Recycled Pulping 256.10 344.20 428.60 460.00
Electricity Consumption (kWh/ODt)†
† The specific energy is the electricity consumed divided by the fibre produced or allocated to the area expressed on an oven-dried basis. The paper grades formechanical pulping – TMP for paper include uncoated groundwood specialties and printing and writing paper; some of the pulp may also be used for newsprint.
The energy consumption and production of various manufacturing areas are shown inFigures 3-1 to 3-8. The mills that followed best practices used the least energy. Thevariations in energy consumption for each area indicate the realistic potential for energyreductions.
BENCHMARKING ENERGY USE IN CANADIAN PULP AND PAPER MILLS
RESULTS 3
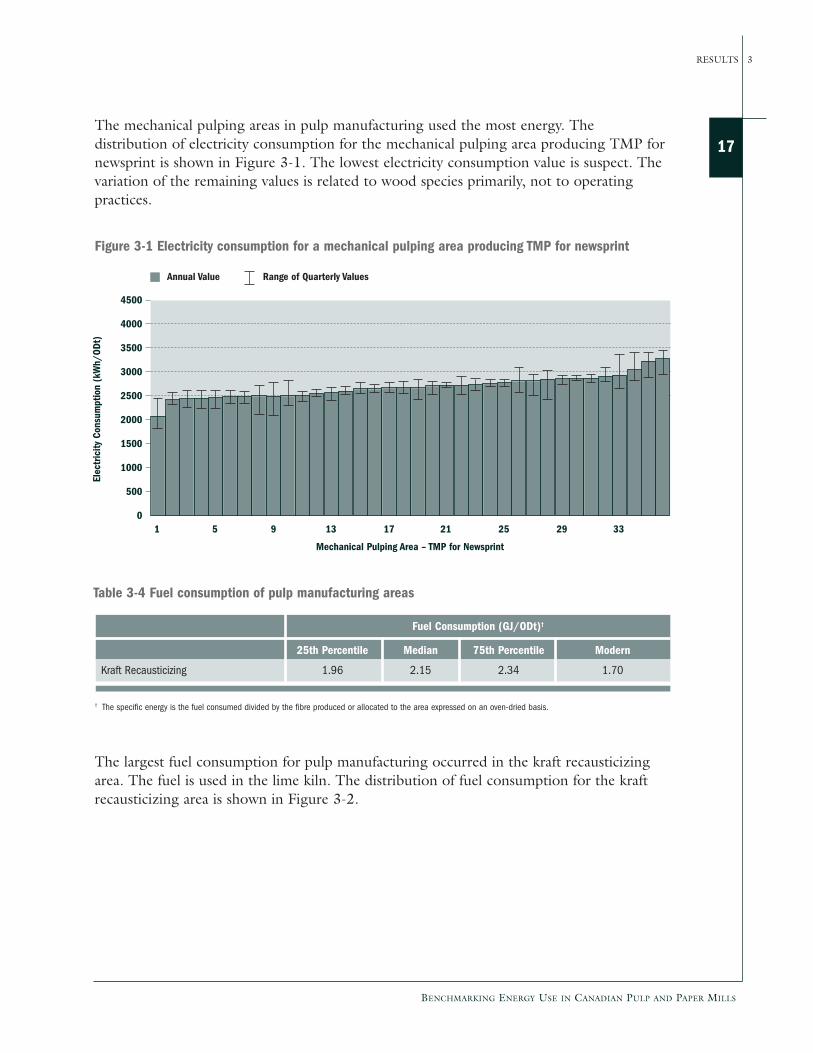
17The mechanical pulping areas in pulp manufacturing used the most energy. Thedistribution of electricity consumption for the mechanical pulping area producing TMP fornewsprint is shown in Figure 3-1. The lowest electricity consumption value is suspect. Thevariation of the remaining values is related to wood species primarily, not to operatingpractices.
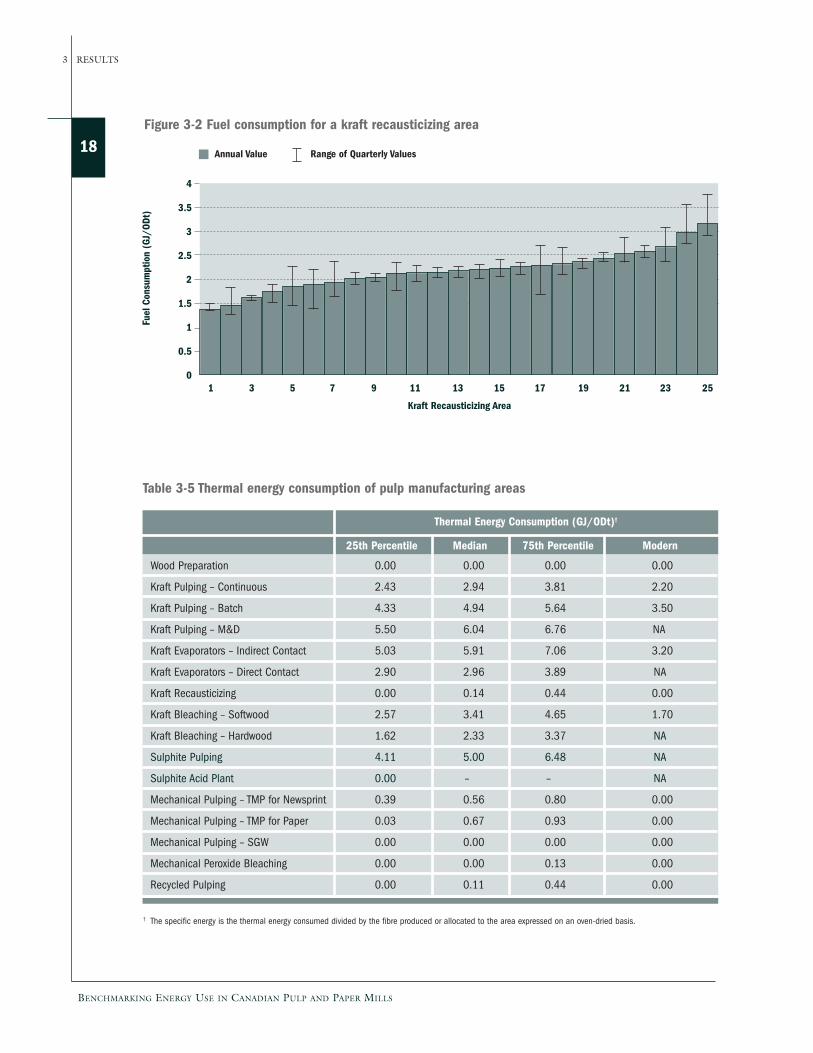
The largest fuel consumption for pulp manufacturing occurred in the kraft recausticizingarea. The fuel is used in the lime kiln. The distribution of fuel consumption for the kraftrecausticizing area is shown in Figure 3-2.
4500
4000
3500
3000
2500
2000
1500
1000
500
0
Electricity
Consum
ption(kWh/ODt)
Mechanical Pulping Area – TMP for Newsprint
1 5 9 13 17 21 25 29 33
Figure 3-1 Electricity consumption for a mechanical pulping area producing TMP for newsprint
Table 3-4 Fuel consumption of pulp manufacturing areas
25th Percentile Median 75th Percentile Modern
Kraft Recausticizing 1.96 2.15 2.34 1.70
Fuel Consumption (GJ/ODt)†
† The specific energy is the fuel consumed divided by the fibre produced or allocated to the area expressed on an oven-dried basis.
Annual Value Range of Quarterly Values
18
BENCHMARKING ENERGY USE IN CANADIAN PULP AND PAPER MILLS
3 RESULTS
4
3.5
3
2.5
2
1.5
1
0.5
0
FuelConsum
ption(GJ/ODt)
Kraft Recausticizing Area
1 3 5 7 9 11 13 15 17 19 21 23 25
Figure 3-2 Fuel consumption for a kraft recausticizing area
Table 3-5 Thermal energy consumption of pulp manufacturing areas
25th Percentile Median 75th Percentile Modern
Wood Preparation 0.00 0.00 0.00 0.00
Kraft Pulping – Continuous 2.43 2.94 3.81 2.20
Kraft Pulping – Batch 4.33 4.94 5.64 3.50
Kraft Pulping – M&D 5.50 6.04 6.76 NA
Kraft Evaporators – Indirect Contact 5.03 5.91 7.06 3.20
Kraft Evaporators – Direct Contact 2.90 2.96 3.89 NA
Kraft Recausticizing 0.00 0.14 0.44 0.00
Kraft Bleaching – Softwood 2.57 3.41 4.65 1.70
Kraft Bleaching – Hardwood 1.62 2.33 3.37 NA
Sulphite Pulping 4.11 5.00 6.48 NA
Sulphite Acid Plant 0.00 – – NA
Mechanical Pulping – TMP for Newsprint 0.39 0.56 0.80 0.00
Mechanical Pulping – TMP for Paper 0.03 0.67 0.93 0.00
Mechanical Pulping – SGW 0.00 0.00 0.00 0.00
Mechanical Peroxide Bleaching 0.00 0.00 0.13 0.00
Recycled Pulping 0.00 0.11 0.44 0.00
Thermal Energy Consumption (GJ/ODt)†
† The specific energy is the thermal energy consumed divided by the fibre produced or allocated to the area expressed on an oven-dried basis.
Annual Value Range of Quarterly Values
BENCHMARKING ENERGY USE IN CANADIAN PULP AND PAPER MILLS
RESULTS 3
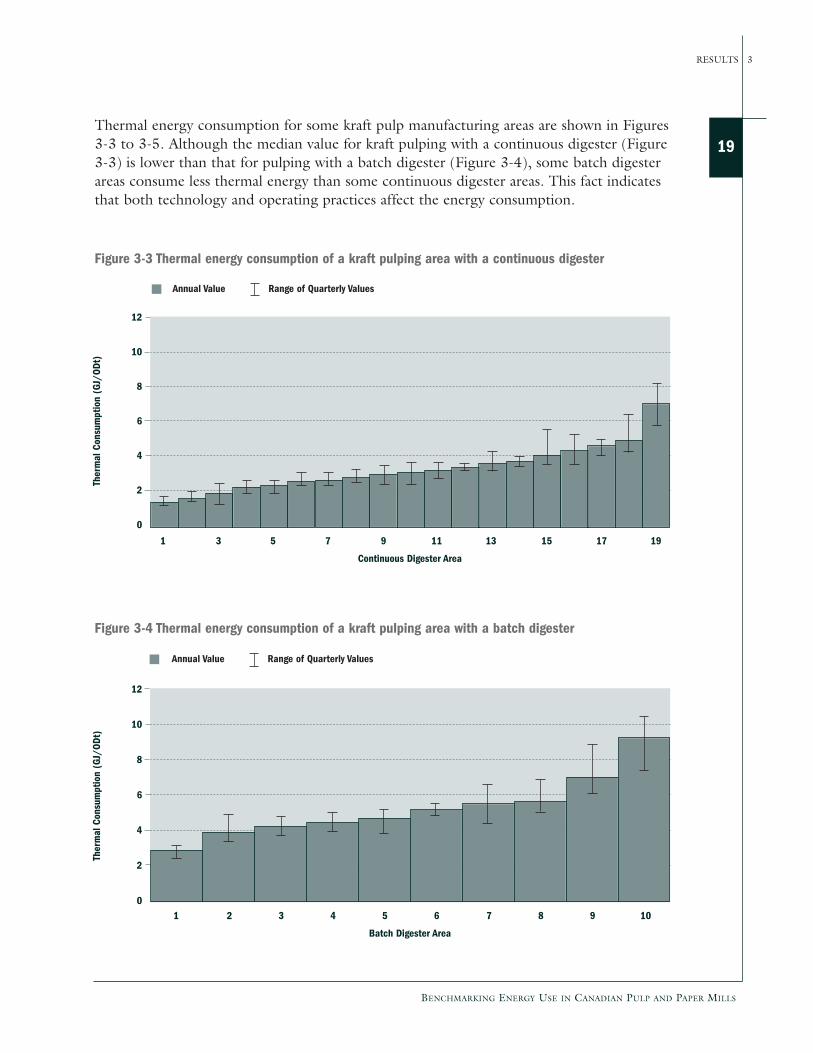
19Thermal energy consumption for some kraft pulp manufacturing areas are shown in Figures3-3 to 3-5. Although the median value for kraft pulping with a continuous digester (Figure3-3) is lower than that for pulping with a batch digester (Figure 3-4), some batch digesterareas consume less thermal energy than some continuous digester areas. This fact indicatesthat both technology and operating practices affect the energy consumption.
12
10
8
6
4
2
0
ThermalConsum
ption(GJ/ODt)
Continuous Digester Area
1 3 5 7 9 11 13 15 17 19
Figure 3-3 Thermal energy consumption of a kraft pulping area with a continuous digester
12
10
8
6
4
2
0
ThermalConsum
ption(GJ/ODt)
Batch Digester Area
1 2 3 4 5 6 7 8 9 10
Figure 3-4 Thermal energy consumption of a kraft pulping area with a batch digester
Annual Value Range of Quarterly Values
Annual Value Range of Quarterly Values
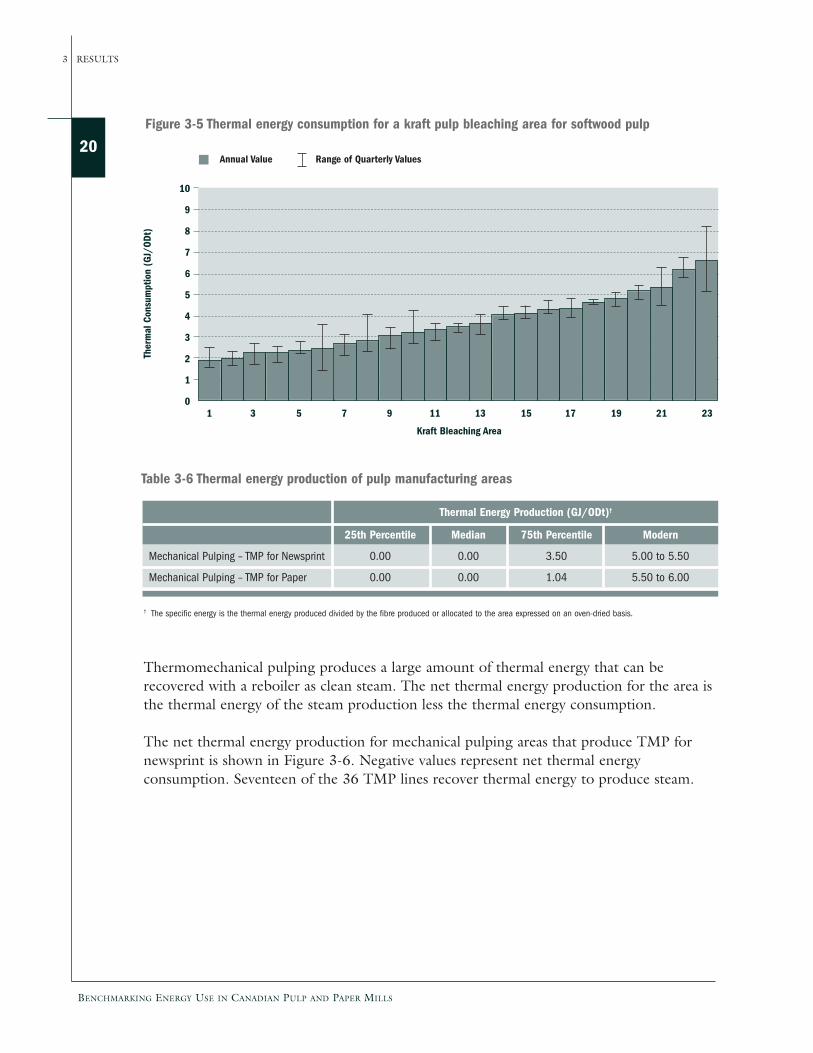
Thermomechanical pulping produces a large amount of thermal energy that can berecovered with a reboiler as clean steam. The net thermal energy production for the area isthe thermal energy of the steam production less the thermal energy consumption.
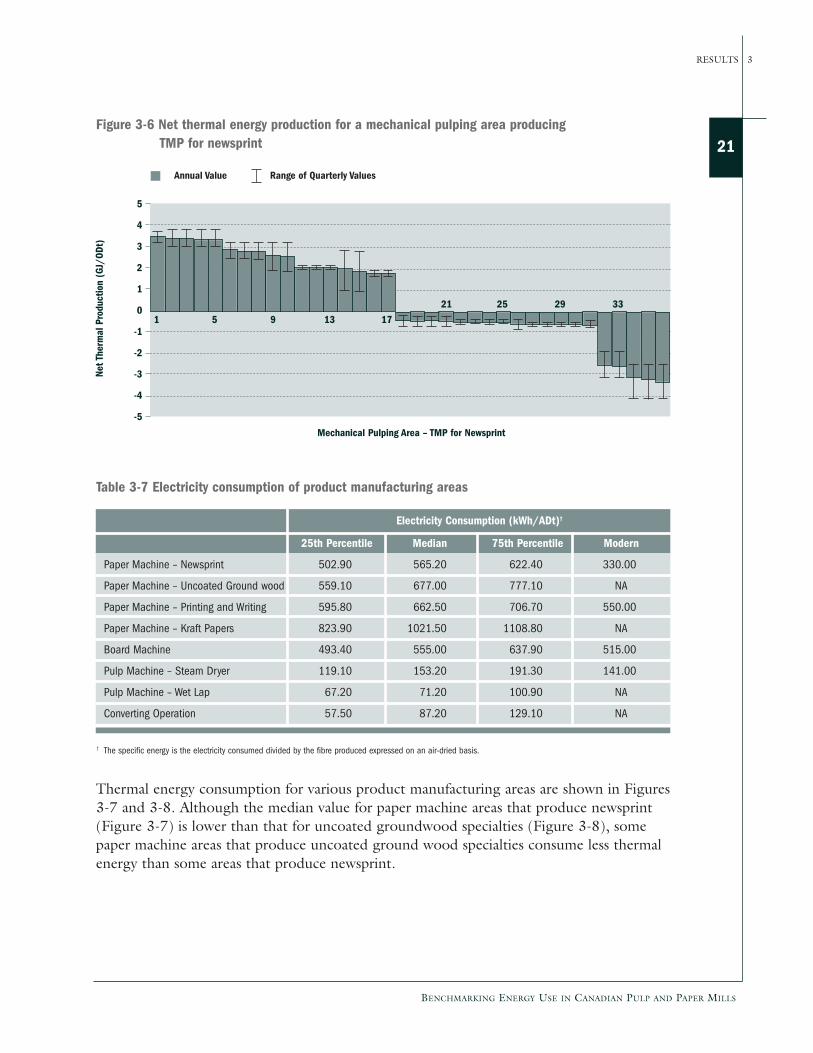
The net thermal energy production for mechanical pulping areas that produce TMP fornewsprint is shown in Figure 3-6. Negative values represent net thermal energyconsumption. Seventeen of the 36 TMP lines recover thermal energy to produce steam.
20
BENCHMARKING ENERGY USE IN CANADIAN PULP AND PAPER MILLS
3 RESULTS
10
9
8
7
6
5
4
3
2
1
0
ThermalConsum
ption(GJ/ODt)
Kraft Bleaching Area
1 3 5 7 9 11 13 15 17 19 21 23
Figure 3-5 Thermal energy consumption for a kraft pulp bleaching area for softwood pulp
Table 3-6 Thermal energy production of pulp manufacturing areas
25th Percentile Median 75th Percentile Modern
Mechanical Pulping – TMP for Newsprint 0.00 0.00 3.50 5.00 to 5.50
Mechanical Pulping – TMP for Paper 0.00 0.00 1.04 5.50 to 6.00
Thermal Energy Production (GJ/ODt)†
† The specific energy is the thermal energy produced divided by the fibre produced or allocated to the area expressed on an oven-dried basis.
Annual Value Range of Quarterly Values
BENCHMARKING ENERGY USE IN CANADIAN PULP AND PAPER MILLS
RESULTS 3
21
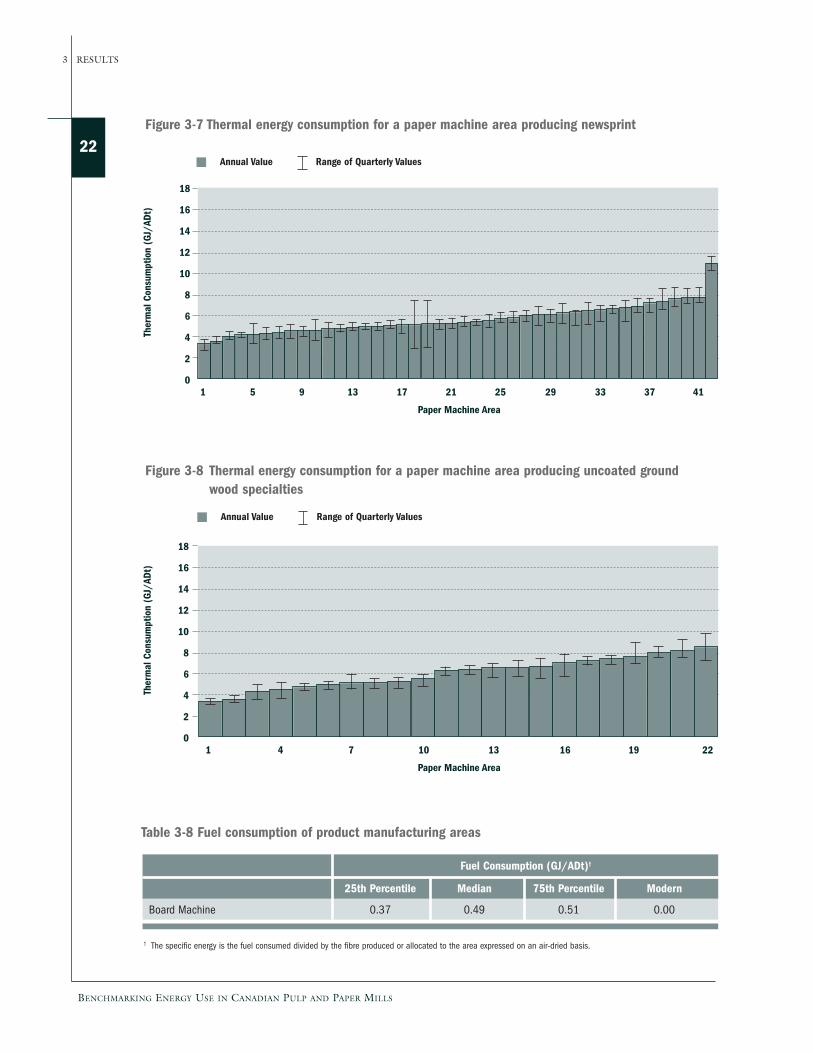
Thermal energy consumption for various product manufacturing areas are shown in Figures3-7 and 3-8. Although the median value for paper machine areas that produce newsprint(Figure 3-7) is lower than that for uncoated groundwood specialties (Figure 3-8), somepaper machine areas that produce uncoated ground wood specialties consume less thermalenergy than some areas that produce newsprint.
5
4
3
2
1
0
-1
-2
-3
-4
-5
NetThermalProduction(GJ/ODt)
Mechanical Pulping Area – TMP for Newsprint
1 5 9 13 17
Figure 3-6 Net thermal energy production for a mechanical pulping area producingTMP for newsprint
21 25 29 33
Table 3-7 Electricity consumption of product manufacturing areas
25th Percentile Median 75th Percentile Modern
Paper Machine – Newsprint 502.90 565.20 622.40 330.00
Paper Machine – Uncoated Ground wood 559.10 677.00 777.10 NA
Paper Machine – Printing and Writing 595.80 662.50 706.70 550.00
Paper Machine – Kraft Papers 823.90 1021.50 1108.80 NA
Board Machine 493.40 555.00 637.90 515.00
Pulp Machine – Steam Dryer 119.10 153.20 191.30 141.00
Pulp Machine – Wet Lap 67.20 71.20 100.90 NA
Converting Operation 57.50 87.20 129.10 NA
Electricity Consumption (kWh/ADt)†
† The specific energy is the electricity consumed divided by the fibre produced expressed on an air-dried basis.
Annual Value Range of Quarterly Values
22
BENCHMARKING ENERGY USE IN CANADIAN PULP AND PAPER MILLS
3 RESULTS
18
16
14
12
10
8
6
4
2
0
ThermalConsum
ption(GJ/ADt)
Paper Machine Area
1 5 9 13 17 21 25 29 33 37 41
Figure 3-7 Thermal energy consumption for a paper machine area producing newsprint
18
16
14
12
10
8
6
4
2
0
ThermalConsum
ption(GJ/ADt)
Paper Machine Area
1 4 7 10 13 16 19 22
Figure 3-8 Thermal energy consumption for a paper machine area producing uncoated groundwood specialties
Table 3-8 Fuel consumption of product manufacturing areas
25th Percentile Median 75th Percentile Modern
Board Machine 0.37 0.49 0.51 0.00
Fuel Consumption (GJ/ADt)†
† The specific energy is the fuel consumed divided by the fibre produced or allocated to the area expressed on an air-dried basis.
Annual Value Range of Quarterly Values
Annual Value Range of Quarterly Values
BENCHMARKING ENERGY USE IN CANADIAN PULP AND PAPER MILLS
RESULTS 3
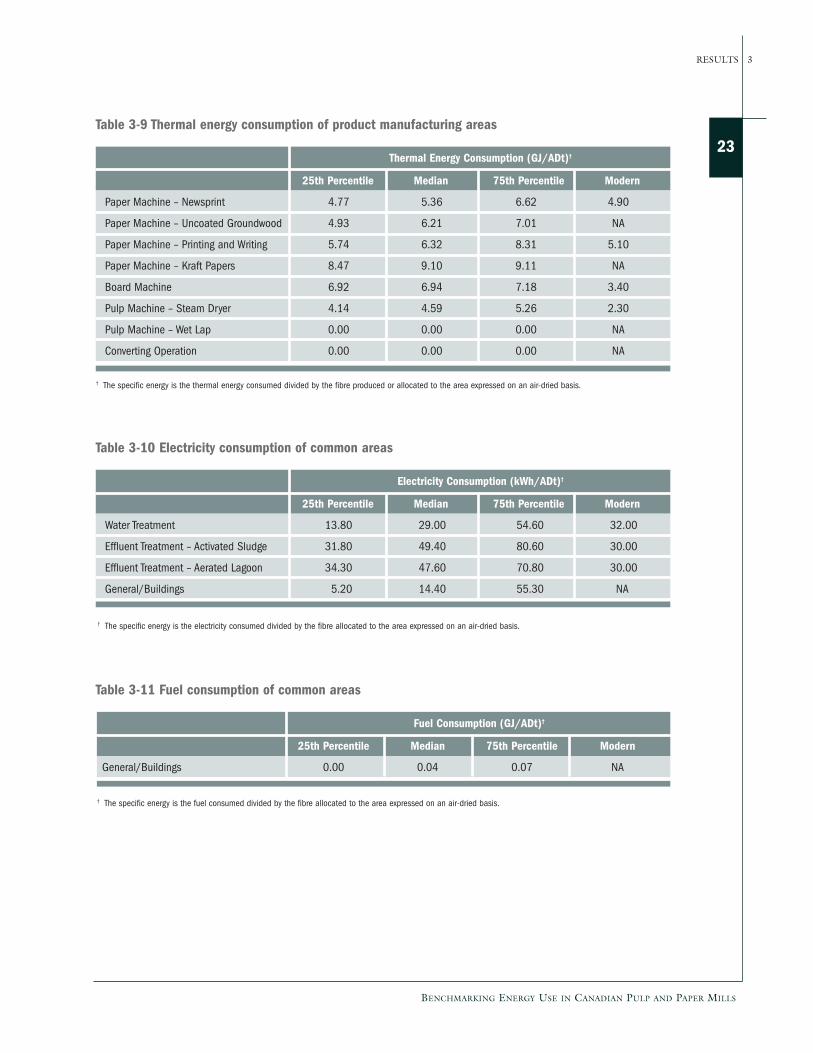
23Table 3-9 Thermal energy consumption of product manufacturing areas
25th Percentile Median 75th Percentile Modern
Paper Machine – Newsprint 4.77 5.36 6.62 4.90
Paper Machine – Uncoated Groundwood 4.93 6.21 7.01 NA
Paper Machine – Printing and Writing 5.74 6.32 8.31 5.10
Paper Machine – Kraft Papers 8.47 9.10 9.11 NA
Board Machine 6.92 6.94 7.18 3.40
Pulp Machine – Steam Dryer 4.14 4.59 5.26 2.30
Pulp Machine – Wet Lap 0.00 0.00 0.00 NA
Converting Operation 0.00 0.00 0.00 NA
Thermal Energy Consumption (GJ/ADt)†
† The specific energy is the thermal energy consumed divided by the fibre produced or allocated to the area expressed on an air-dried basis.
Table 3-10 Electricity consumption of common areas
25th Percentile Median 75th Percentile Modern
Water Treatment 13.80 29.00 54.60 32.00
Effluent Treatment – Activated Sludge 31.80 49.40 80.60 30.00
Effluent Treatment – Aerated Lagoon 34.30 47.60 70.80 30.00
General/Buildings 5.20 14.40 55.30 NA
Electricity Consumption (kWh/ADt)†
† The specific energy is the electricity consumed divided by the fibre allocated to the area expressed on an air-dried basis.
Table 3-11 Fuel consumption of common areas
25th Percentile Median 75th Percentile Modern
General/Buildings 0.00 0.04 0.07 NA
Fuel Consumption (GJ/ADt)†
† The specific energy is the fuel consumed divided by the fibre allocated to the area expressed on an air-dried basis.
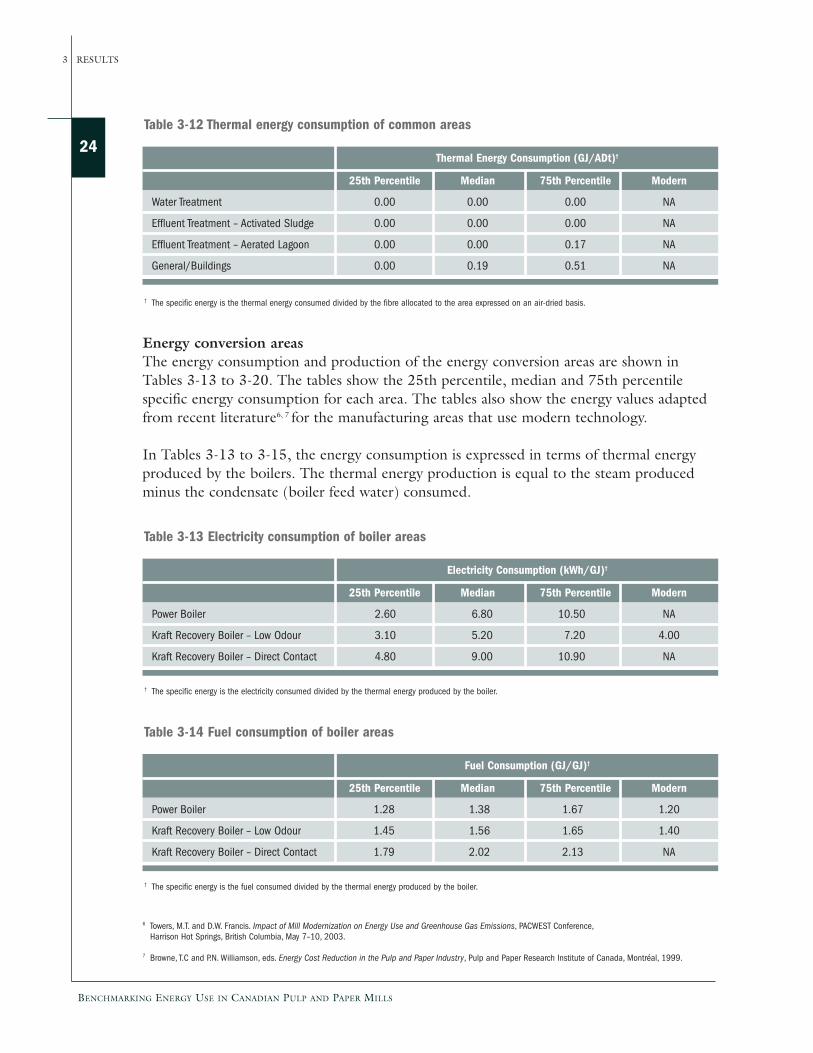
Energy conversion areasThe energy consumption and production of the energy conversion areas are shown inTables 3-13 to 3-20. The tables show the 25th percentile, median and 75th percentilespecific energy consumption for each area. The tables also show the energy values adaptedfrom recent literature6, 7 for the manufacturing areas that use modern technology.
In Tables 3-13 to 3-15, the energy consumption is expressed in terms of thermal energyproduced by the boilers. The thermal energy production is equal to the steam producedminus the condensate (boiler feed water) consumed.
24
BENCHMARKING ENERGY USE IN CANADIAN PULP AND PAPER MILLS
3 RESULTS
Table 3-12 Thermal energy consumption of common areas
25th Percentile Median 75th Percentile Modern
Water Treatment 0.00 0.00 0.00 NA
Effluent Treatment – Activated Sludge 0.00 0.00 0.00 NA
Effluent Treatment – Aerated Lagoon 0.00 0.00 0.17 NA
General/Buildings 0.00 0.19 0.51 NA
Thermal Energy Consumption (GJ/ADt)†
† The specific energy is the thermal energy consumed divided by the fibre allocated to the area expressed on an air-dried basis.
6 Towers, M.T. and D.W. Francis. Impact of Mill Modernization on Energy Use and Greenhouse Gas Emissions, PACWEST Conference,Harrison Hot Springs, British Columbia, May 7–10, 2003.
7 Browne, T.C and P.N. Williamson, eds. Energy Cost Reduction in the Pulp and Paper Industry, Pulp and Paper Research Institute of Canada, Montréal, 1999.
Table 3-13 Electricity consumption of boiler areas
25th Percentile Median 75th Percentile Modern
Power Boiler 2.60 6.80 10.50 NA
Kraft Recovery Boiler – Low Odour 3.10 5.20 7.20 4.00
Kraft Recovery Boiler – Direct Contact 4.80 9.00 10.90 NA
Electricity Consumption (kWh/GJ)†
† The specific energy is the electricity consumed divided by the thermal energy produced by the boiler.
Table 3-14 Fuel consumption of boiler areas
25th Percentile Median 75th Percentile Modern
Power Boiler 1.28 1.38 1.67 1.20
Kraft Recovery Boiler – Low Odour 1.45 1.56 1.65 1.40
Kraft Recovery Boiler – Direct Contact 1.79 2.02 2.13 NA
Fuel Consumption (GJ/GJ)†
† The specific energy is the fuel consumed divided by the thermal energy produced by the boiler.
BENCHMARKING ENERGY USE IN CANADIAN PULP AND PAPER MILLS
RESULTS 3
25
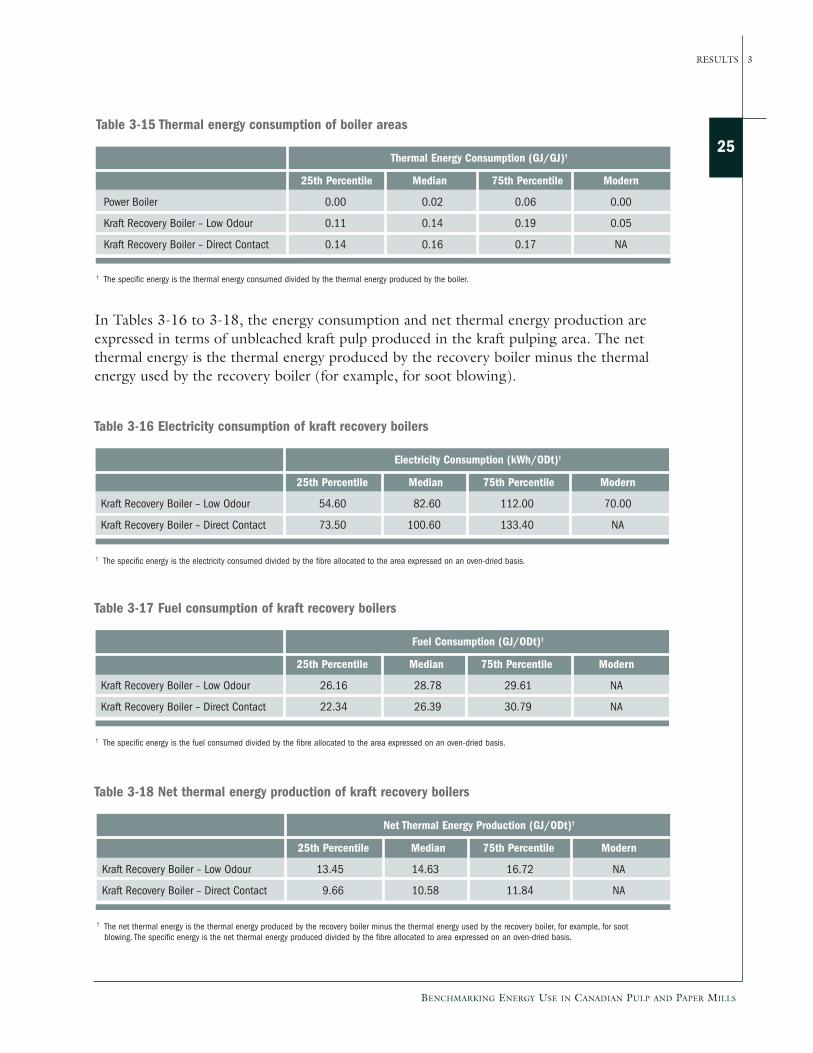
In Tables 3-16 to 3-18, the energy consumption and net thermal energy production areexpressed in terms of unbleached kraft pulp produced in the kraft pulping area. The netthermal energy is the thermal energy produced by the recovery boiler minus the thermalenergy used by the recovery boiler (for example, for soot blowing).
Table 3-15 Thermal energy consumption of boiler areas
25th Percentile Median 75th Percentile Modern
Power Boiler 0.00 0.02 0.06 0.00
Kraft Recovery Boiler – Low Odour 0.11 0.14 0.19 0.05
Kraft Recovery Boiler – Direct Contact 0.14 0.16 0.17 NA
Thermal Energy Consumption (GJ/GJ)†
† The specific energy is the thermal energy consumed divided by the thermal energy produced by the boiler.
Table 3-16 Electricity consumption of kraft recovery boilers
25th Percentile Median 75th Percentile Modern
Kraft Recovery Boiler – Low Odour 54.60 82.60 112.00 70.00
Kraft Recovery Boiler – Direct Contact 73.50 100.60 133.40 NA
Electricity Consumption (kWh/ODt)†
† The specific energy is the electricity consumed divided by the fibre allocated to the area expressed on an oven-dried basis.
Table 3-17 Fuel consumption of kraft recovery boilers
25th Percentile Median 75th Percentile Modern
Kraft Recovery Boiler – Low Odour 26.16 28.78 29.61 NA
Kraft Recovery Boiler – Direct Contact 22.34 26.39 30.79 NA
Fuel Consumption (GJ/ODt)†
† The specific energy is the fuel consumed divided by the fibre allocated to the area expressed on an oven-dried basis.
Table 3-18 Net thermal energy production of kraft recovery boilers
25th Percentile Median 75th Percentile Modern
Kraft Recovery Boiler – Low Odour 13.45 14.63 16.72 NA
Kraft Recovery Boiler – Direct Contact 9.66 10.58 11.84 NA
Net Thermal Energy Production (GJ/ODt)†
† The net thermal energy is the thermal energy produced by the recovery boiler minus the thermal energy used by the recovery boiler, for example, for sootblowing. The specific energy is the net thermal energy produced divided by the fibre allocated to area expressed on an oven-dried basis.
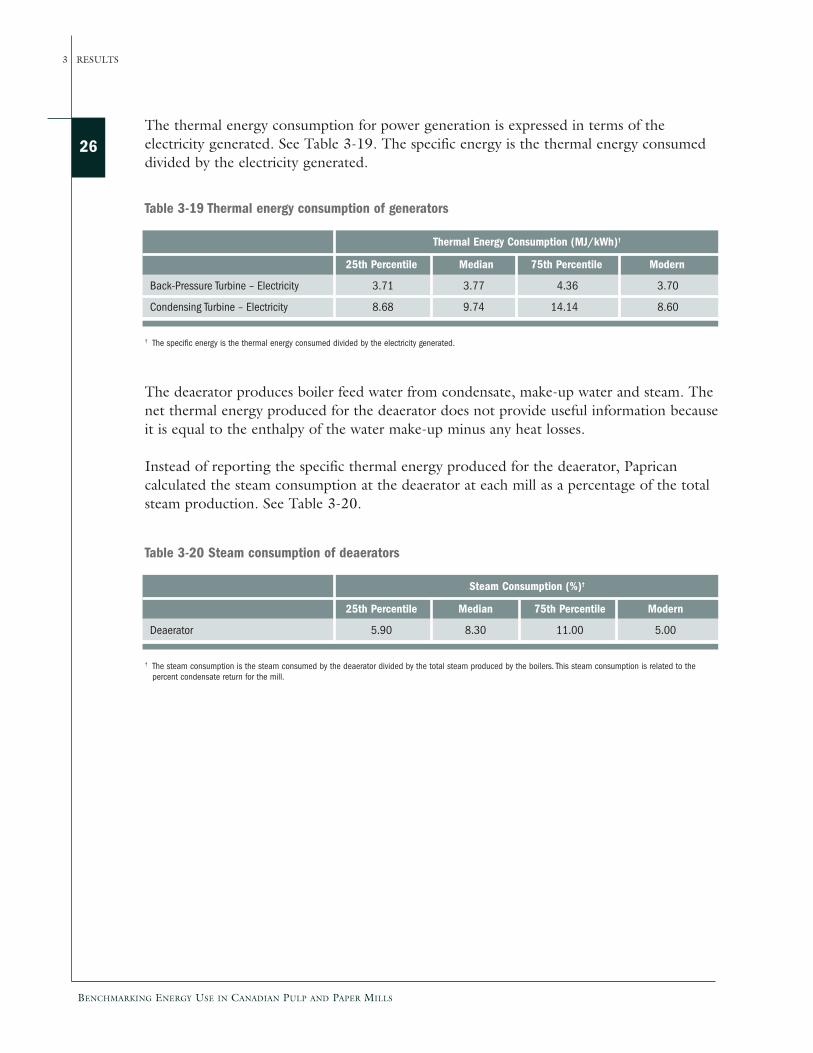
The thermal energy consumption for power generation is expressed in terms of theelectricity generated. See Table 3-19. The specific energy is the thermal energy consumeddivided by the electricity generated.
26
BENCHMARKING ENERGY USE IN CANADIAN PULP AND PAPER MILLS
3 RESULTS
Table 3-19 Thermal energy consumption of generators
25th Percentile Median 75th Percentile Modern
Back-Pressure Turbine – Electricity 3.71 3.77 4.36 3.70
Condensing Turbine – Electricity 8.68 9.74 14.14 8.60
Thermal Energy Consumption (MJ/kWh)†
† The specific energy is the thermal energy consumed divided by the electricity generated.
Table 3-20 Steam consumption of deaerators
25th Percentile Median 75th Percentile Modern
Deaerator 5.90 8.30 11.00 5.00
Steam Consumption (%)†
† The steam consumption is the steam consumed by the deaerator divided by the total steam produced by the boilers. This steam consumption is related to thepercent condensate return for the mill.
The deaerator produces boiler feed water from condensate, make-up water and steam. Thenet thermal energy produced for the deaerator does not provide useful information becauseit is equal to the enthalpy of the water make-up minus any heat losses.
Instead of reporting the specific thermal energy produced for the deaerator, Papricancalculated the steam consumption at the deaerator at each mill as a percentage of the totalsteam production. See Table 3-20.

DISCUSSION4
28
BENCHMARKING ENERGY USE IN CANADIAN PULP AND PAPER MILLS
4 DISCUSSION
4. DISCUSSION
The mill staff can use the energy data to make meaningful benchmarking comparisons ofenergy use by area. Comparisons can be made among areas that produce the same productwith the same technology, even though the mills use different product mixes andtechnologies.
The variations in energy consumption for each area indicate the realistic potential forenergy reductions.
Additional insights on mill energy use can be made by combining areas at mill sites thatproduce similar products to allocate the energy consumption to product grades. Thisprocess can be done for mills that produce a single product and for mills that producemultiple products, because the energy and fibre data are available by area. The energyallocation to two products, kraft pulp and newsprint from TMP, is discussed in thefollowing sections.
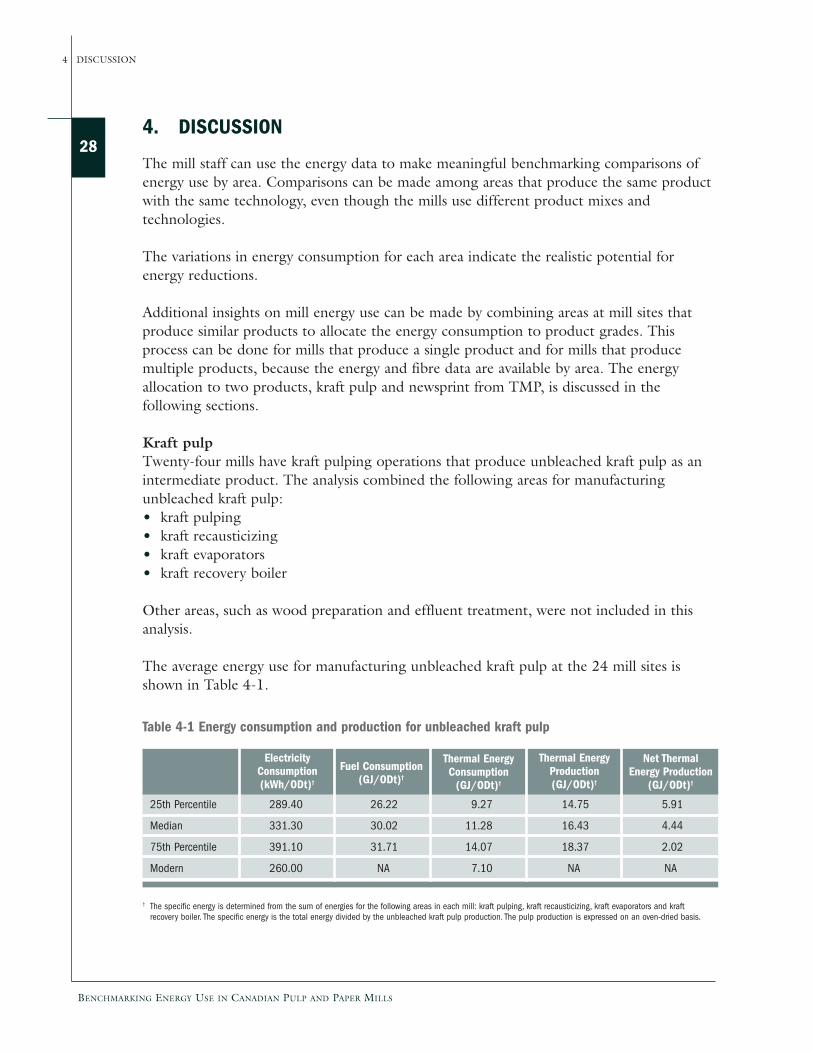
Kraft pulpTwenty-four mills have kraft pulping operations that produce unbleached kraft pulp as anintermediate product. The analysis combined the following areas for manufacturingunbleached kraft pulp:• kraft pulping• kraft recausticizing• kraft evaporators• kraft recovery boiler
Other areas, such as wood preparation and effluent treatment, were not included in thisanalysis.
The average energy use for manufacturing unbleached kraft pulp at the 24 mill sites isshown in Table 4-1.
Table 4-1 Energy consumption and production for unbleached kraft pulp
25th Percentile 289.40 26.22 9.27 14.75 5.91
Median 331.30 30.02 11.28 16.43 4.44
75th Percentile 391.10 31.71 14.07 18.37 2.02
Modern 260.00 NA 7.10 NA NA
† The specific energy is determined from the sum of energies for the following areas in each mill: kraft pulping, kraft recausticizing, kraft evaporators and kraftrecovery boiler. The specific energy is the total energy divided by the unbleached kraft pulp production. The pulp production is expressed on an oven-dried basis.
ElectricityConsumption(kWh/ODt)†
Fuel Consumption(GJ/ODt)†
Thermal EnergyConsumption(GJ/ODt)†
Thermal EnergyProduction(GJ/ODt)†
Net ThermalEnergy Production
(GJ/ODt)†
BENCHMARKING ENERGY USE IN CANADIAN PULP AND PAPER MILLS
DISCUSSION 4
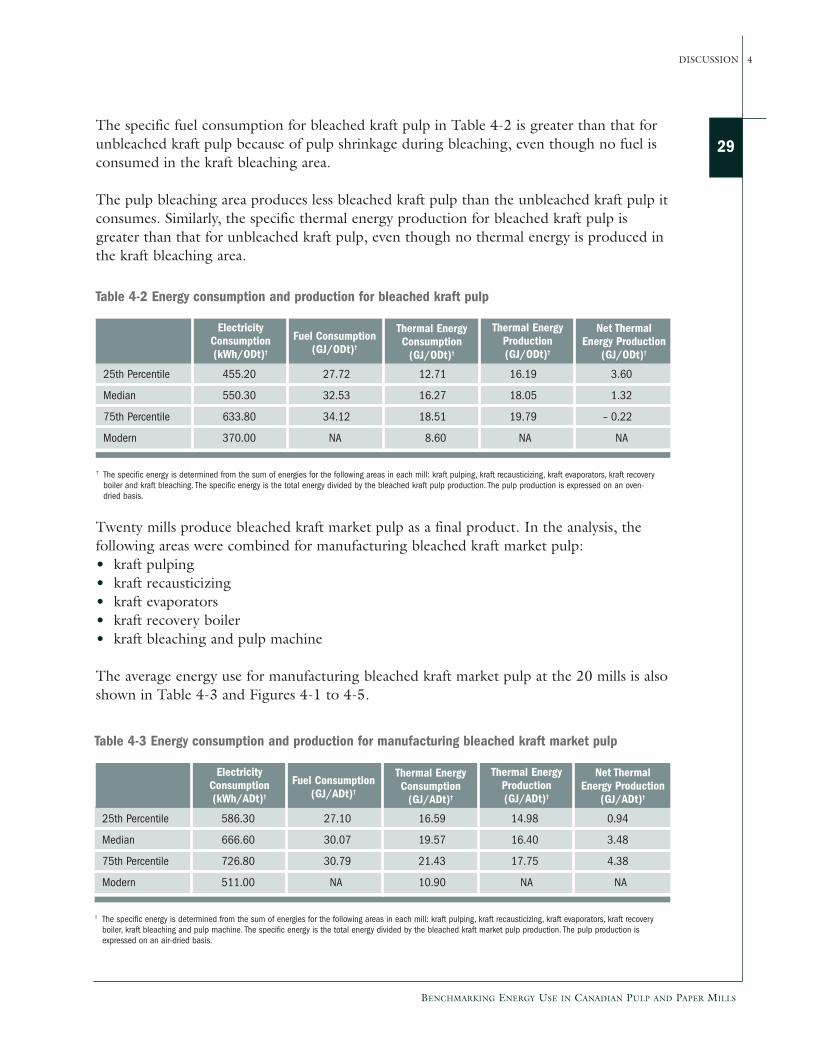
29The specific fuel consumption for bleached kraft pulp in Table 4-2 is greater than that forunbleached kraft pulp because of pulp shrinkage during bleaching, even though no fuel isconsumed in the kraft bleaching area.
The pulp bleaching area produces less bleached kraft pulp than the unbleached kraft pulp itconsumes. Similarly, the specific thermal energy production for bleached kraft pulp isgreater than that for unbleached kraft pulp, even though no thermal energy is produced inthe kraft bleaching area.
Table 4-2 Energy consumption and production for bleached kraft pulp
25th Percentile 455.20 27.72 12.71 16.19 3.60
Median 550.30 32.53 16.27 18.05 1.32
75th Percentile 633.80 34.12 18.51 19.79 – 0.22
Modern 370.00 NA 8.60 NA NA
† The specific energy is determined from the sum of energies for the following areas in each mill: kraft pulping, kraft recausticizing, kraft evaporators, kraft recoveryboiler and kraft bleaching. The specific energy is the total energy divided by the bleached kraft pulp production. The pulp production is expressed on an oven-dried basis.
ElectricityConsumption(kWh/ODt)†
Fuel Consumption(GJ/ODt)†
Thermal EnergyConsumption(GJ/ODt)†
Thermal EnergyProduction(GJ/ODt)†
Net ThermalEnergy Production
(GJ/ODt)†
Twenty mills produce bleached kraft market pulp as a final product. In the analysis, thefollowing areas were combined for manufacturing bleached kraft market pulp:• kraft pulping• kraft recausticizing• kraft evaporators• kraft recovery boiler• kraft bleaching and pulp machine
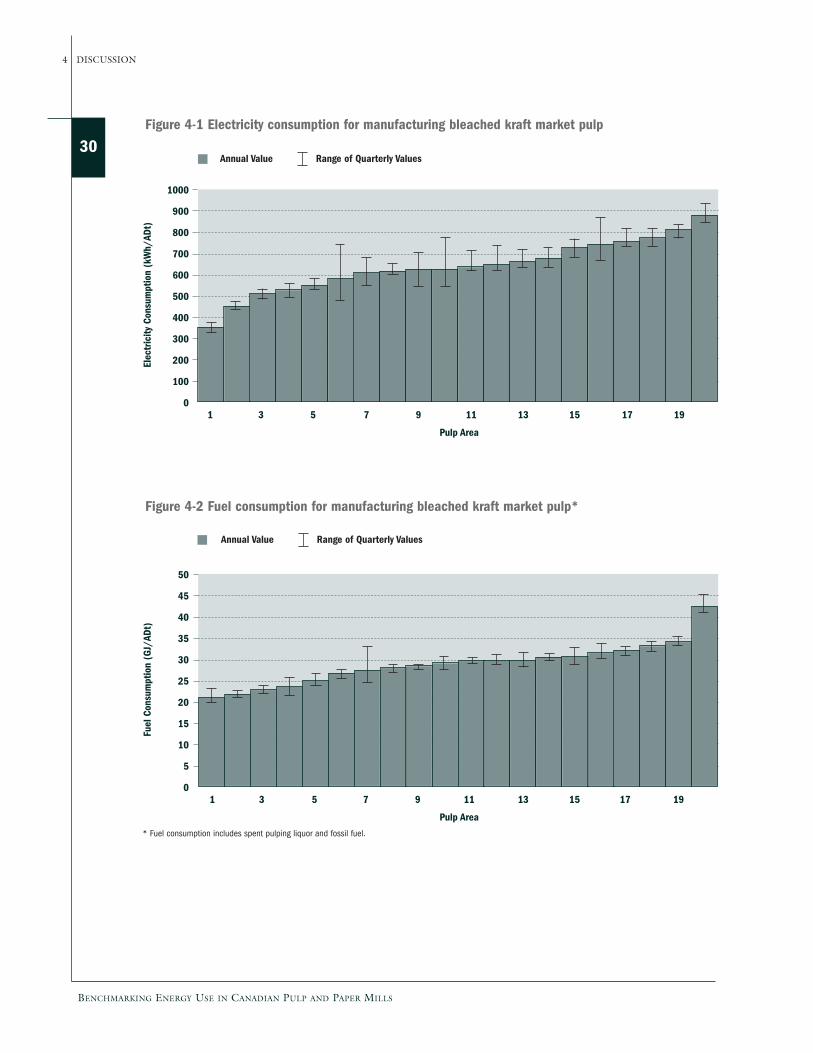
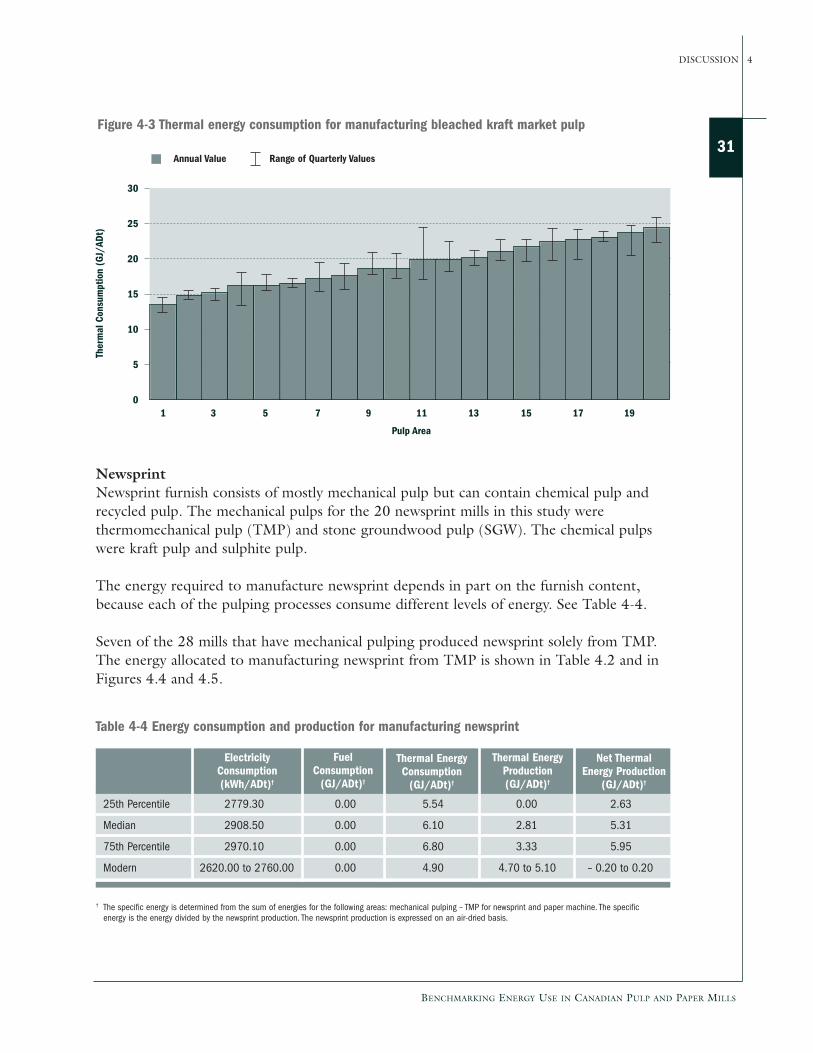
The average energy use for manufacturing bleached kraft market pulp at the 20 mills is alsoshown in Table 4-3 and Figures 4-1 to 4-5.
Table 4-3 Energy consumption and production for manufacturing bleached kraft market pulp
25th Percentile 586.30 27.10 16.59 14.98 0.94
Median 666.60 30.07 19.57 16.40 3.48
75th Percentile 726.80 30.79 21.43 17.75 4.38
Modern 511.00 NA 10.90 NA NA
† The specific energy is determined from the sum of energies for the following areas in each mill: kraft pulping, kraft recausticizing, kraft evaporators, kraft recoveryboiler, kraft bleaching and pulp machine. The specific energy is the total energy divided by the bleached kraft market pulp production. The pulp production isexpressed on an air-dried basis.
ElectricityConsumption(kWh/ADt)†
Fuel Consumption(GJ/ADt)†
Thermal EnergyConsumption(GJ/ADt)†
Thermal EnergyProduction(GJ/ADt)†
Net ThermalEnergy Production
(GJ/ADt)†
30
BENCHMARKING ENERGY USE IN CANADIAN PULP AND PAPER MILLS
4 DISCUSSION
1000
900
800
700
600
500
400
300
200
100
0
Electricity
Consum
ption(kWh/ADt)
Pulp Area
1 3 5 7 9 11 13 15 17 19
Figure 4-1 Electricity consumption for manufacturing bleached kraft market pulp
Annual Value Range of Quarterly Values
50
45
40
35
30
25
20
15
10
5
0
FuelConsum
ption(GJ/ADt)
Pulp Area
1 3 5 7 9 11 13 15 17 19
Figure 4-2 Fuel consumption for manufacturing bleached kraft market pulp*
Annual Value Range of Quarterly Values
* Fuel consumption includes spent pulping liquor and fossil fuel.
BENCHMARKING ENERGY USE IN CANADIAN PULP AND PAPER MILLS
DISCUSSION 4
31
NewsprintNewsprint furnish consists of mostly mechanical pulp but can contain chemical pulp andrecycled pulp. The mechanical pulps for the 20 newsprint mills in this study werethermomechanical pulp (TMP) and stone groundwood pulp (SGW). The chemical pulpswere kraft pulp and sulphite pulp.
The energy required to manufacture newsprint depends in part on the furnish content,because each of the pulping processes consume different levels of energy. See Table 4-4.
Seven of the 28 mills that have mechanical pulping produced newsprint solely from TMP.The energy allocated to manufacturing newsprint from TMP is shown in Table 4.2 and inFigures 4.4 and 4.5.
30
25
20
15
10
5
0
ThermalConsum
ption(GJ/ADt)
Pulp Area
1 3 5 7 9 11 13 15 17 19
Figure 4-3 Thermal energy consumption for manufacturing bleached kraft market pulp
Annual Value Range of Quarterly Values
Table 4-4 Energy consumption and production for manufacturing newsprint
25th Percentile 2779.30 0.00 5.54 0.00 2.63
Median 2908.50 0.00 6.10 2.81 5.31
75th Percentile 2970.10 0.00 6.80 3.33 5.95
Modern 2620.00 to 2760.00 0.00 4.90 4.70 to 5.10 – 0.20 to 0.20
† The specific energy is determined from the sum of energies for the following areas: mechanical pulping – TMP for newsprint and paper machine. The specificenergy is the energy divided by the newsprint production. The newsprint production is expressed on an air-dried basis.
ElectricityConsumption(kWh/ADt)†
FuelConsumption(GJ/ADt)†
Thermal EnergyConsumption(GJ/ADt)†
Thermal EnergyProduction(GJ/ADt)†
Net ThermalEnergy Production
(GJ/ADt)†
32
BENCHMARKING ENERGY USE IN CANADIAN PULP AND PAPER MILLS
4 DISCUSSION
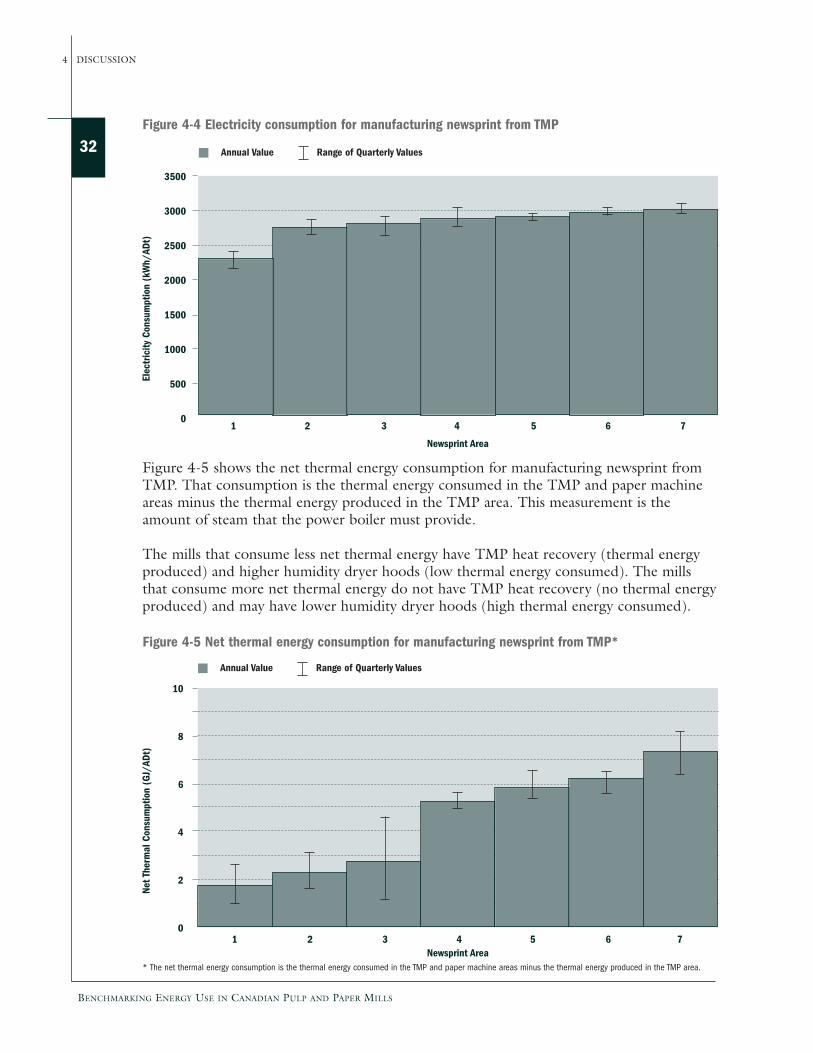
Figure 4-5 shows the net thermal energy consumption for manufacturing newsprint fromTMP. That consumption is the thermal energy consumed in the TMP and paper machineareas minus the thermal energy produced in the TMP area. This measurement is theamount of steam that the power boiler must provide.
The mills that consume less net thermal energy have TMP heat recovery (thermal energyproduced) and higher humidity dryer hoods (low thermal energy consumed). The millsthat consume more net thermal energy do not have TMP heat recovery (no thermal energyproduced) and may have lower humidity dryer hoods (high thermal energy consumed).
3500
3000
2500
2000
1500
1000
500
0
Electricity
Consum
ption(kWh/ADt)
Newsprint Area
1 2 3 4 5 6 7
Figure 4-4 Electricity consumption for manufacturing newsprint from TMP
Annual Value Range of Quarterly Values
10
8
6
4
2
0
NetThermalConsum
ption(GJ/ADt)
Newsprint Area1 2 3 4 5 6 7
Figure 4-5 Net thermal energy consumption for manufacturing newsprint from TMP*
* The net thermal energy consumption is the thermal energy consumed in the TMP and paper machine areas minus the thermal energy produced in the TMP area.
Annual Value Range of Quarterly Values
INTERPRETATION OFTHE RESULTS5
34
BENCHMARKING ENERGY USE IN CANADIAN PULP AND PAPER MILLS
5 INTERPRETATION OF THE RESULTS
5. INTERPRETATION OF THE RESULTS
Reasons for the range of values obtained from the benchmarking study will vary from millto mill:
• The data collecting process did not consider where water is heated in the mill. A millwhere steam is used for water heating in the paper machine area will report higher levelsof steam use there, even though the hot water might be used elsewhere, than a millwhere steam heating of water takes place in the pulp mill.
Consequently, this second mill will appear to be inefficient in the pulping area. Thus,high consumption in one area may be offset by low consumption elsewhere, because ofreasons that have little to do with basic process requirements. Mill staff need to considerthe entire site, as well as each process area, independently.
• Production rate and efficiency affect the benchmarking results. Low paper machineefficiency leads to high energy use, because finished, dried paper is reslushed and driedagain.
• Downtime for market reasons affects energy use.
• Smaller production lines require more energy per tonne of product than larger mills.
The energy consumption for a process area is determined by three factors:• product requirements• technology used• operating practices
Producing certain products is more energy-intensive than for others, and this will be part ofthe cost of doing business in that particular market niche.
Some products require more energy to achieve product quality. For example, makingthermomechanical pulp (TMP) for printing papers uses more electrical energy than makingTMP for newsprint. Mechanical grades for newsprint do not need as much refining poweras for Light Weight Coated (LWC) or Super Calendered (SC) grades. After the base stockis dried, coated grades require an extra drying stage for the coating formulation. Theseproduct-based constraints also impose limits on energy use reduction.
Different technologies use varying amounts of energy to make the same product.
For example, kraft pulping with batch digesters uses more thermal energy than kraftpulping with continuous digesters. Even the best batch digesters are better than old andinefficient continuous digesters.
BENCHMARKING ENERGY USE IN CANADIAN PULP AND PAPER MILLS
INTERPRETATION OF THE RESULTS 5
35For example, only limited energy savings can be achieved with open dryer hoods, olderpress sections or dryer siphon systems, atmospheric-discharge refiners, or TMP plants thatdo not have heat recovery equipment, unless a significant capital investment is made. Bycomparing the energy consumption for different technologies that make the same product,mill staff can determine the potential for energy reductions from major capital investments.
For an individual process area defined by its product and technology, the variation inenergy consumption results from how the technology is applied and from operatingpractices. By determining the settings on valves, water temperatures, and soot blowers,mills can identify the energy use and base efficiency of the operation. Leaking valves,malfunctioning steam traps, mechanical seals and packings, and improper maintenance canall have an impact on the energy efficiency of mill operations.
The study revealed that best practices are near the theoretical minimum for certain processareas. The variations in energy consumption for each area indicate the realistic potential forenergy reductions.
5.1 How do the results affect my mill?
Mill staff can use the energy data to make meaningful benchmarking comparisons of energyuse by area. Comparisons can be made between areas that produce the same product withthe same technology, even though the mills might differ in their product mix. Thiscomparison allows mill staff to identify where their operations are less efficient and therebyidentify areas that require changes in operating procedures or capital investments.
Benchmarking can prompt questions such as “Why is the energy use for my kraft pulpingarea so much higher than in other mills?” or more general questions such as, “Where doesmy mill stand?” or “Why is my mill’s performance poor in one area and best in class inanother area?”
It is in answering these questions that mill staff can make the appropriate changes in theiroperations to reduce energy consumption. These answers are site specific, depending onthe reasons for the high energy consumption.
36
BENCHMARKING ENERGY USE IN CANADIAN PULP AND PAPER MILLS
5 INTERPRETATION OF THE RESULTS
5.2 What steps do I take?
You must analyse the results of the benchmarking to determine how to improve energyefficiency in your mill. The following steps suggest how to proceed.
Step 1a. Compare your facility to other facilitiesExternal comparisons help to determine how your level of energyconsumption compares to other mill operations. If you did not participatein this benchmarking study, use the described benchmarking method todetermine the energy consumption for your own process areas. Refer to theattached CD for instructions on how to benchmark your own mill.Consider the reasons for high energy use listed in Section 5, and see whichones apply to your situation. Compare your mill’s process areas to see whereyou stand relative to others; this will identify the biggest gaps. What level ofconsumption is achievable with the best operating practices and industrybenchmarks? These external comparisons will be valuable in developingrealistic initial savings expectations.
Step 1b. Compare your facility to itselfInternally, you may be able to perform historical comparisons with data thatis already available. Variation from month to month in your level of energyefficiency is easily identifiable. Determining the cause of and minimizing thisvariation will yield savings. Ongoing analysis and strategic communicationwill sustain your improvements and assist in refining your continuingsavings expectations.
Step 2. Establish an energy-management programTake a structured approach to setting up an energy-management program.This involves identifying key staff and giving them the tools and authorityto make changes. Nominating an energy champion to create awareness, settargets, develop action plans, monitor progress, implement projects,communicate results, and celebrate success will demonstrate to allemployees the importance of an energy-management program. This energychampion and the team must develop an energy policy that is aligned withthe company’s strategic goals and set priority objectives that are publicizedto all staff.
BENCHMARKING ENERGY USE IN CANADIAN PULP AND PAPER MILLS
INTERPRETATION OF THE RESULTS 5
37Step 3. Understand when energy is used
The cost of electricity is affected by the level of demand and the time of day.The electrical demand profile shows the rate of electricity consumption overtime. This electrical fingerprint is a critical element in understanding usepatterns. As well, understanding the demand for gas, steam and compressedair over time provides valuable insight into how theses energies can also bemanaged effectively.
Step 4. Understand where energy is usedTreat energy as you do any other purchased commodity. Building aninventory of your electrical loads and uses of thermal energy will help youfocus on the largest and, consequently, the most expensive, consumers.
Some suggestions to help you understand how and when energy is used inyour mill are: renewing instrumentation; updating metering equipment; andrewiring to study energy flows by operation. This will help a mill to identifythe specific consumption of key equipment centres and determine theassociated energy costs.
Step 5. Eliminate wasteThe first and most important step in realizing savings opportunities is tomatch what you use to what is required. The key considerations here are theduration of use and magnitude of use. Waste may occur in many formsincluding excess operating time, volume and in quality such as pressure andtemperature.
Step 6. Maximize (system) efficiencyAfter the need and use are matched properly, the next step is to ensure thatthe components of the system that meet the need are operating as efficientlyas possible. In this step, the impact of operating conditions, maintenanceand equipment/technology are considered.
Looking at efficiency from a systems perspective is critical in this step.Mills can consider larger process optimization studies using Pinch analysis toidentify energy reduction projects. Mills can also look at boiler optimizationstudies, which can lead to improvements in steam generated from blackliquor and wood waste. These improvements allow a reduction in fossil fueluse, increased throughput and higher thermal efficiencies.
38
BENCHMARKING ENERGY USE IN CANADIAN PULP AND PAPER MILLS
5 INTERPRETATION OF THE RESULTS
Step 7. Optimize the energy supplySteps 5 and 6 will reduce your requirement for energy. Step 7 seeks theoptimum source or sources for your overall energy requirement. This caninclude considerations such as heat recovery systems, alternative ratestructures, alternative fuels, or even larger measures such as co-generation.
Continuous effort is required to maintain the energy savings after the projects areimplemented. Thus, the ending of the energy savings process, Step 7, leads into thebeginning of the next energy savings process, Step 1.
REFERENCES6
40
BENCHMARKING ENERGY USE IN CANADIAN PULP AND PAPER MILLS
6 REFERENCES
6. REFERENCES
Connaghan, C. and R. Wunderlich. “Developing, Implementing and Maintaining anEnergy Efficiency Program” Energy Cost Reduction in the Pulp and Paper Industry,Browne, T.C and P.N. Williamson, eds. Pulp and Paper Research Institute of Canada,Montréal, 1999.
Francis, D.W. Method for Benchmarking Energy Usage in Pulp and Paper Operations,PAPTAC Midwest Branch Meeting, Thunder Bay, Ontario, September 25–27, 2002.
IEA Programme on Advanced Energy-Efficient Technologies for the Pulp and PaperIndustry. “Recommended Methods for Energy Reporting in Pulp and Paper Industry,Summary Report” Assessment of Life-Cycle-Wide Energy-Related Environmental Impacts inthe Pulp and Paper Industry, IEA, 1999.
Towers, M.T. and D.W. Francis. Impact of Mill Modernization on Energy Use andGreenhouse Gas Emissions, PACWEST Conference, Harrison Hot Springs, BritishColumbia, May 7–10, 2003.
Browne, T.C and P.N. Williamson, eds. Energy Cost Reduction in the Pulp and PaperIndustry, Pulp and Paper Research Institute of Canada, Montréal, 1999.
APPENDICES
42
BENCHMARKING ENERGY USE IN CANADIAN PULP AND PAPER MILLS
APPENDICES
APPENDIX A. AREA DEFINITIONS
This appendix lists the definitions for the process areas in the pulp and paper mill.
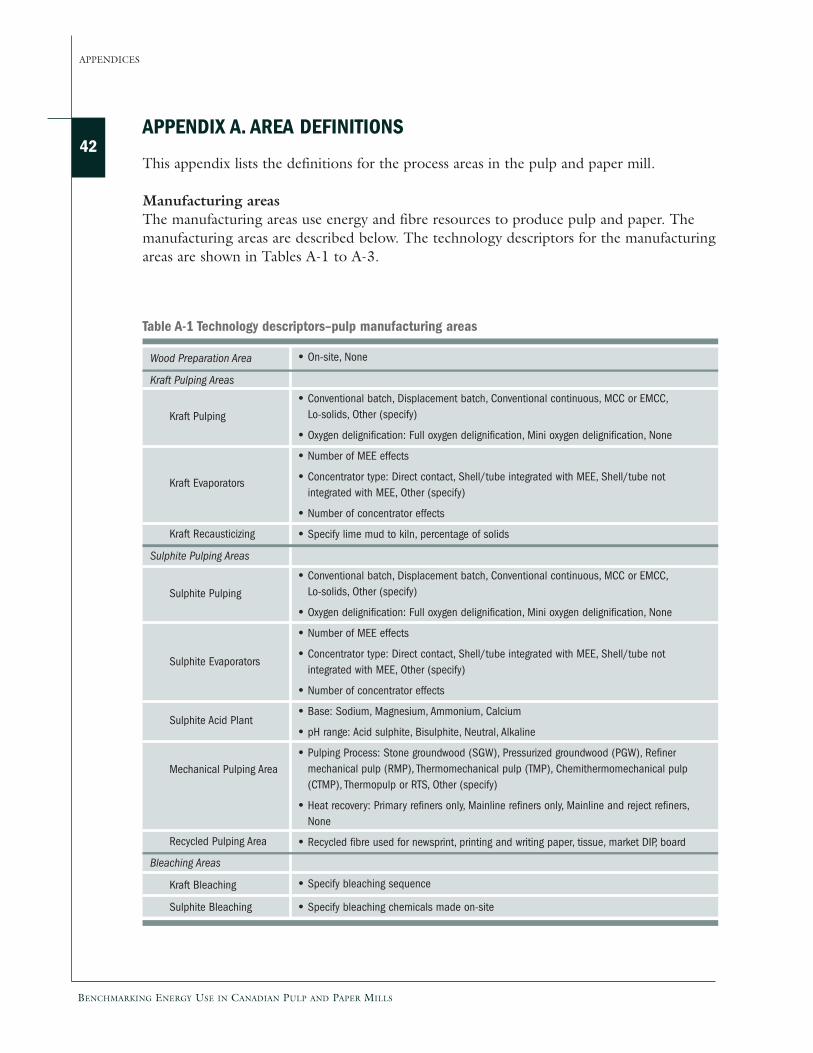
Manufacturing areasThe manufacturing areas use energy and fibre resources to produce pulp and paper. Themanufacturing areas are described below. The technology descriptors for the manufacturingareas are shown in Tables A-1 to A-3.
Table A-1 Technology descriptors–pulp manufacturing areas
Kraft Pulping Areas
Kraft Pulping
Kraft Evaporators
Kraft Recausticizing
Sulphite Pulping Areas
Sulphite Pulping
Sulphite Evaporators
Sulphite Acid Plant
Mechanical Pulping Area
Recycled Pulping Area
Bleaching Areas
Kraft Bleaching
Sulphite Bleaching
• On-site, None
• Conventional batch, Displacement batch, Conventional continuous, MCC or EMCC,Lo-solids, Other (specify)
• Oxygen delignification: Full oxygen delignification, Mini oxygen delignification, None
• Number of MEE effects
• Concentrator type: Direct contact, Shell/tube integrated with MEE, Shell/tube notintegrated with MEE, Other (specify)
• Number of concentrator effects
• Specify lime mud to kiln, percentage of solids
• Conventional batch, Displacement batch, Conventional continuous, MCC or EMCC,Lo-solids, Other (specify)
• Oxygen delignification: Full oxygen delignification, Mini oxygen delignification, None
• Number of MEE effects
• Concentrator type: Direct contact, Shell/tube integrated with MEE, Shell/tube notintegrated with MEE, Other (specify)
• Number of concentrator effects
• Base: Sodium, Magnesium, Ammonium, Calcium
• pH range: Acid sulphite, Bisulphite, Neutral, Alkaline
• Pulping Process: Stone groundwood (SGW), Pressurized groundwood (PGW), Refinermechanical pulp (RMP), Thermomechanical pulp (TMP), Chemithermomechanical pulp(CTMP), Thermopulp or RTS, Other (specify)
• Heat recovery: Primary refiners only, Mainline refiners only, Mainline and reject refiners,None
• Recycled fibre used for newsprint, printing and writing paper, tissue, market DIP, board
• Specify bleaching sequence
• Specify bleaching chemicals made on-site
Wood Preparation Area
BENCHMARKING ENERGY USE IN CANADIAN PULP AND PAPER MILLS
APPENDICES
43Wood preparation areaWood is received and prepared for pulping in the wood preparation area. The chiphandling area produces screened chips and hog fuel from wood (or chips). The inputboundary is the wood receiving facility. The output boundary is the inlet of the chip bin.The area includes chip piles and chip screening.
Kraft and sulphite pulpingThe chemical pulping area produces brown stock pulp and black or spent sulphite liquorfrom wood chips and pulping liquor. The input boundaries are the inlet of the chip bin andthe outlet of the pulping liquor storage tank. The output boundaries are the brown stockstorage tank and the black or spent sulphite liquor tank. The area includes the digester, thebrown stock washer, the screening and the brown stock decker.
The following equipment and processes can consume thermal energy:• chip bin• pre-steaming vessel• indirect liquor heaters• direct steam injection in the digester• oxygen delignification reactor
Chemical pulping areas that use best practices would use thermal energy only in thedigester liquor heaters and in oxygen delignification. The thermal energy for a chip bin andpre-steaming vessel would come from secondary heat.
Kraft and sulphite evaporatorsThe kraft and sulphite evaporators concentrate black liquor or spent sulphite liquor. Theinput boundary is the outlet of the black or spent sulphite liquor tank. The outputboundary is the concentrated black or spent sulphite liquor tank. The area includesevaporators, concentrators and a soap skimmer.
Steam is used in both the multiple-effect evaporator train and the concentrators. It is alsoused in the ejectors. How much thermal energy is used depends on the number ofevaporator effects. Steam economy for evaporator lines is calculated as steam divided by thewater evaporated, measured in kilograms. According to best practices, the best steameconomy is 0.8 times the number of effects.
Kraft recausticizingThe kraft recausticizing area produces white liquor from green liquor. The input boundaryis the outlet of the smelt-dissolving tank in the recovery boiler area. The output boundaryis the white liquor storage tank. The area includes the causticizer, green liquor clarifier,white liquor clarifier, lime mud filter and lime kiln.
44
BENCHMARKING ENERGY USE IN CANADIAN PULP AND PAPER MILLS
APPENDICES
The lime kiln uses fuel. Kraft recausticizing uses only a small amount of thermal energy.Possible users include green liquor heaters and mud filter water heaters. Best practices forthermal energy use in recausticizing is to not use steam during normal operation.
Sulphite acid plantThe sulphite acid plant produces pulping liquor from recovered chemicals and sulphur. Thespecific manner of chemical recovery depends on which sulphite process is used. Forexample, the choice of base affects the choice of chemical recovery.
The input boundary is the outlet of the smelt- or ash-dissolving tank in the recovery boiler(furnace) area. The output boundary is the pulping liquor storage tank. The area includesthe liquor clarifier, sulphur burner and absorption tower.
Mechanical pulping areaThe mechanical pulping area produces mechanical pulp (unbleached and bleached) fromchips and electricity. It also produces steam if heat recovery is practised. The inputboundary is the inlet of the chip bin. The outlet boundaries are the screened accepts chestand bleached pulp storage tank. The area includes chip steaming, impregnation, refining,screening and bleaching.
Mechanical pulping is the largest consumer of electricity of all the pulp processes. Howmuch electricity is used is determined by the pulping technology, the wood species and thepaper grade being manufactured.
For TMP, thermal energy can be used by chip pre-treatment and the pre-steaming bins.TMP lines that use best practices use refiner steam for thermal demands and use a reboilerto recover heat from refiner steam to produce clean steam for use in other manufacturingareas.
Recycled pulping areaThe recycled pulping area produces recycled pulp from waste paper. The input boundary isthe waste paper storage. The outlet boundary is the recycled pulp storage tank. The areaincludes pulping, flotation, screening, bleaching and dispersion.
Thermal energy can be consumed for pulping, dispersion and bleaching. How muchthermal energy is used for pulping depends on how much fresh water is used and whetherthe mill is integrated. Integrated mills that use best practices use no thermal energy forpulping, because the required heat comes from the paper machine whitewater.
BENCHMARKING ENERGY USE IN CANADIAN PULP AND PAPER MILLS
APPENDICES
45Kraft and sulphite bleachingThe kraft and sulphite bleaching area produces bleached pulp from brown stock pulp. Theinput boundary is the outlet of the brown stock storage tank. The output boundary is thebleached stock storage tank. The area includes oxygen delignification, the bleaching stagesand washers, and bleaching chemical preparation.
The following equipment uses thermal energy:• bleach plant stock steam mixer• water heater• bleach plant scrubbers• chlorine dioxide generator reboiler• chlorine dioxide generator ejectors
Mills that use best practices use secondary heat for heating water instead of using steam.
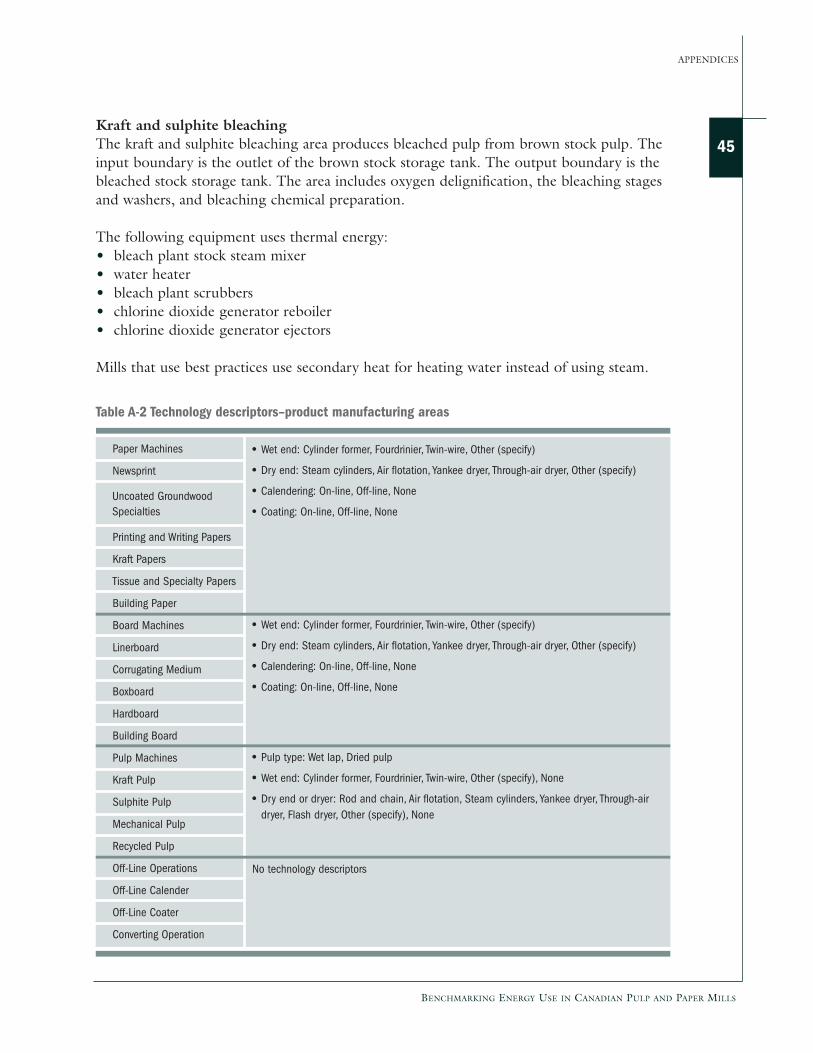
Table A-2 Technology descriptors–product manufacturing areas
Paper Machines
Newsprint
Printing and Writing Papers
Kraft Papers
Tissue and Specialty Papers
Building Paper
Board Machines
Linerboard
Corrugating Medium
Boxboard
Hardboard
Building Board
Pulp Machines
Kraft Pulp
Sulphite Pulp
Mechanical Pulp
Recycled Pulp
Off-Line Operations
Off-Line Calender
Off-Line Coater
Converting Operation
• Wet end: Cylinder former, Fourdrinier, Twin-wire, Other (specify)
• Dry end: Steam cylinders, Air flotation, Yankee dryer, Through-air dryer, Other (specify)
• Calendering: On-line, Off-line, None
• Coating: On-line, Off-line, None
• Wet end: Cylinder former, Fourdrinier, Twin-wire, Other (specify)
• Dry end: Steam cylinders, Air flotation, Yankee dryer, Through-air dryer, Other (specify)
• Calendering: On-line, Off-line, None
• Coating: On-line, Off-line, None
• Pulp type: Wet lap, Dried pulp
• Wet end: Cylinder former, Fourdrinier, Twin-wire, Other (specify), None
• Dry end or dryer: Rod and chain, Air flotation, Steam cylinders, Yankee dryer, Through-airdryer, Flash dryer, Other (specify), None
No technology descriptors
Uncoated GroundwoodSpecialties
46
BENCHMARKING ENERGY USE IN CANADIAN PULP AND PAPER MILLS
APPENDICES
Paper and board machinesThe paper machine area produces finished paper from chemical, mechanical and recycledpulps. Similarly, the board machine area produces board.
The input boundaries are the• outlet of the bleached stock storage tank (chemical pulp)• outlet of the screened accepts chest and bleached storage tank (mechanical pulp)• outlet of the recycled pulp storage tank
The output boundary is the paper warehouse. For mills that have off-line finishingoperations, the output boundary is the paper machine reel.
Paper and board machines use thermal energy mainly for drying paper. Some thermalenergy is used for warm water heating, steam showers, silo whitewater heating and calenderheating.
Paper machines that use best practices have high-humidity dryer hoods, stationary siphonsand use only a small amount of fresh water. Heat recovered from the dryer exhaust air isused to preheat incoming dryer air and to meet some of the demands for warm water andwhitewater heating.
Fuel is used to dry coatings in infrared dryers.
Pulp machinesThe pulp machine area produces finished market pulp from bleached pulp. The inputboundary is the outlet of the bleached stock storage tank. The output boundary is the pulpwarehouse. The area includes the pulp machine, pulp dryer and pulp finishing.
Pulp machines with steam cylinders or air flotation dryers use thermal energy mainly forpaper drying. Some thermal energy may be used for warm water heating, steam showersand silo whitewater heating. Fuel is used to dry pulp in flash dryers.
Off-line operationsFor some mills, the product is not finished on the paper machine but on an off-linecalender or coater. Some mills also have converting operations, such as cutting paper rollsinto sheets. The input boundary is the paper machine reel. The output boundary is thepulp warehouse.
BENCHMARKING ENERGY USE IN CANADIAN PULP AND PAPER MILLS
APPENDICES
47
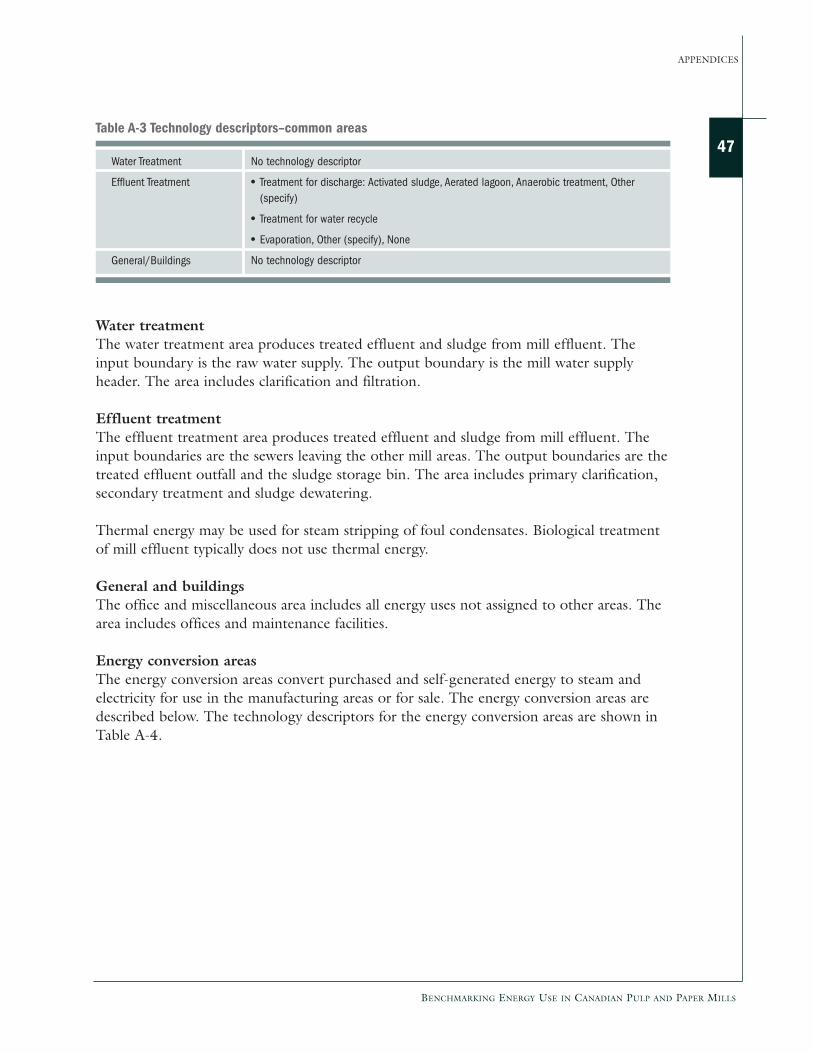
Water treatmentThe water treatment area produces treated effluent and sludge from mill effluent. Theinput boundary is the raw water supply. The output boundary is the mill water supplyheader. The area includes clarification and filtration.
Effluent treatmentThe effluent treatment area produces treated effluent and sludge from mill effluent. Theinput boundaries are the sewers leaving the other mill areas. The output boundaries are thetreated effluent outfall and the sludge storage bin. The area includes primary clarification,secondary treatment and sludge dewatering.
Thermal energy may be used for steam stripping of foul condensates. Biological treatmentof mill effluent typically does not use thermal energy.
General and buildingsThe office and miscellaneous area includes all energy uses not assigned to other areas. Thearea includes offices and maintenance facilities.
Energy conversion areasThe energy conversion areas convert purchased and self-generated energy to steam andelectricity for use in the manufacturing areas or for sale. The energy conversion areas aredescribed below. The technology descriptors for the energy conversion areas are shown inTable A-4.
Table A-3 Technology descriptors–common areas
Water Treatment
Effluent Treatment
General/Buildings
No technology descriptor
• Treatment for discharge: Activated sludge, Aerated lagoon, Anaerobic treatment, Other(specify)
• Treatment for water recycle
• Evaporation, Other (specify), None
No technology descriptor
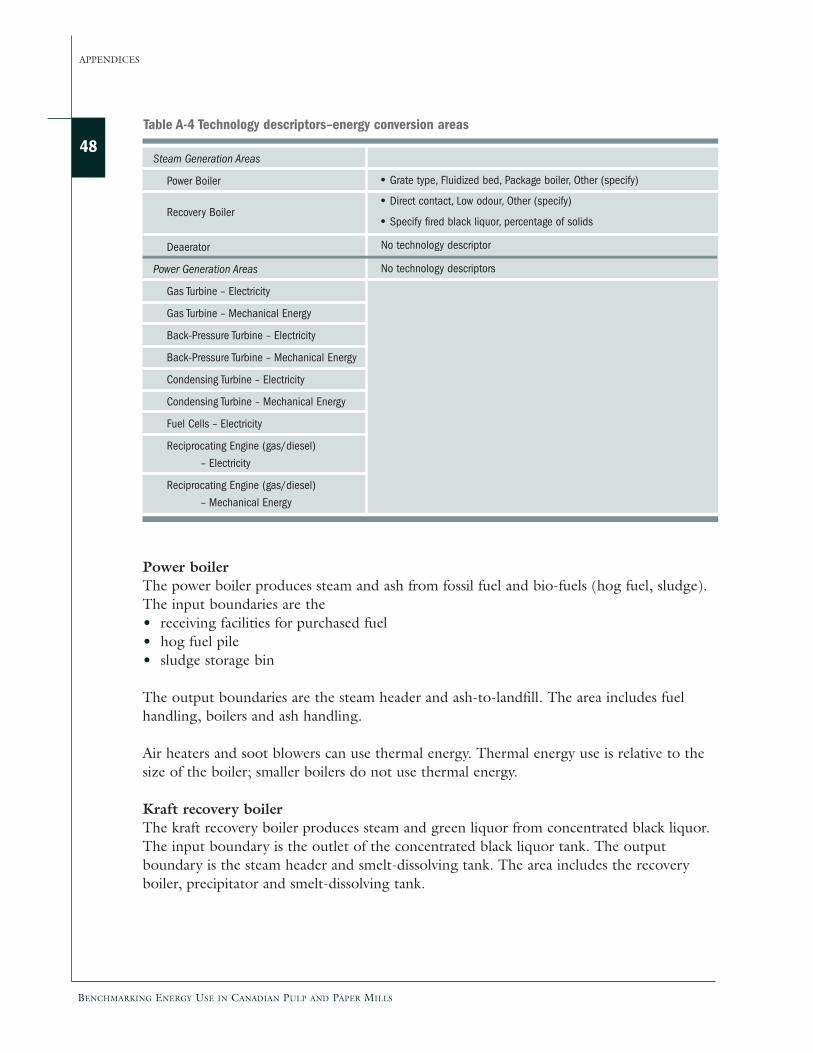
48
BENCHMARKING ENERGY USE IN CANADIAN PULP AND PAPER MILLS
APPENDICES
Power boilerThe power boiler produces steam and ash from fossil fuel and bio-fuels (hog fuel, sludge).The input boundaries are the• receiving facilities for purchased fuel• hog fuel pile• sludge storage bin
The output boundaries are the steam header and ash-to-landfill. The area includes fuelhandling, boilers and ash handling.
Air heaters and soot blowers can use thermal energy. Thermal energy use is relative to thesize of the boiler; smaller boilers do not use thermal energy.
Kraft recovery boilerThe kraft recovery boiler produces steam and green liquor from concentrated black liquor.The input boundary is the outlet of the concentrated black liquor tank. The outputboundary is the steam header and smelt-dissolving tank. The area includes the recoveryboiler, precipitator and smelt-dissolving tank.
Table A-4 Technology descriptors–energy conversion areas
Steam Generation Areas
Power Boiler
Recovery Boiler
Deaerator
Power Generation Areas
Gas Turbine – Electricity
Gas Turbine – Mechanical Energy
Back-Pressure Turbine – Electricity
Back-Pressure Turbine – Mechanical Energy
Condensing Turbine – Electricity
Condensing Turbine – Mechanical Energy
Fuel Cells – Electricity
Reciprocating Engine (gas/diesel)
– Electricity
Reciprocating Engine (gas/diesel)
– Mechanical Energy
• Grate type, Fluidized bed, Package boiler, Other (specify)
• Direct contact, Low odour, Other (specify)
• Specify fired black liquor, percentage of solids
No technology descriptor
No technology descriptors
BENCHMARKING ENERGY USE IN CANADIAN PULP AND PAPER MILLS
APPENDICES
49Thermal energy is consumed by• soot blowers• air heaters• fired black liquor heater• smelt shatter jets• steam drives on boiler fans or the feed water pump
Recovery boilers that use best practices use 5 percent of the steam generation for sootblowing.
Sulphite recovery boiler (furnace)The sulphite recovery boiler (or furnace) produces steam, smelt or ash, and flue gas fromconcentrated spent sulphite liquor. The specific manner of incineration depends on thesulphite process employed. For example, the choice of base affects the choice ofincineration method. The input boundary is the outlet of the concentrated spent sulphiteliquor tank. The outlet boundary is the steam header and the smelt- or ash-dissolving tank.The area includes the recovery boiler (furnace), precipitator and dissolving tank.
DeaeratorThe deaerator produces boiler feed water from condensate, water make-up and steam. Thethermal energy consumption depends on the amount of overall condensate return as well ason the use of secondary heat to preheat the make-up boiler feed water and/or the returnedcondensate before they enter the deaerator.
Power generation areasIn the power generation areas, fuel and steam are used to produce electricity andmechanical energy.
Fuel is used by gas turbines, fuel cells and reciprocating engines. The input boundary forthese areas is the fuel supply (for example, gas main, oil tank). The output boundary is theproduced electricity or mechanical energy.
Steam is used by back-pressure and condensing turbines. The input boundary for thesesteam turbines is the steam header. The output boundary is the produced electricity ormechanical energy. The exhaust steam from the back-pressure turbine is recovered and usedin the process. The exhaust steam from the condensing turbine is condensed.
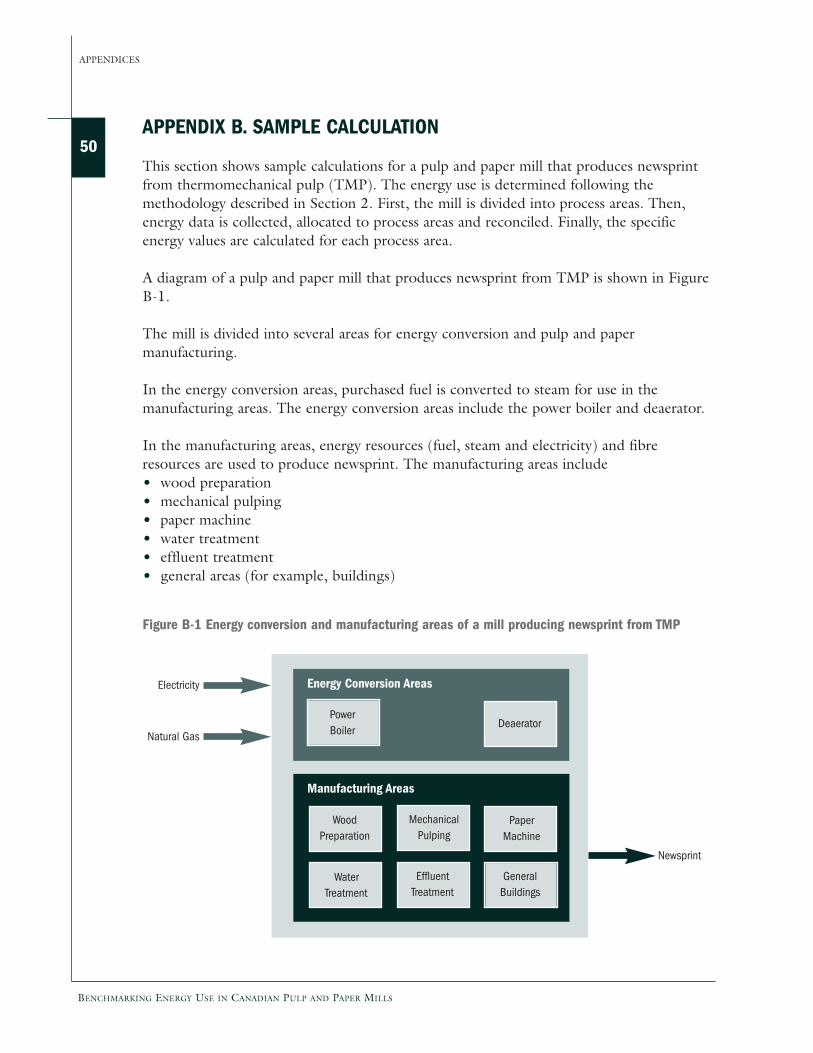
50
BENCHMARKING ENERGY USE IN CANADIAN PULP AND PAPER MILLS
APPENDICES
APPENDIX B. SAMPLE CALCULATION
This section shows sample calculations for a pulp and paper mill that produces newsprintfrom thermomechanical pulp (TMP). The energy use is determined following themethodology described in Section 2. First, the mill is divided into process areas. Then,energy data is collected, allocated to process areas and reconciled. Finally, the specificenergy values are calculated for each process area.
A diagram of a pulp and paper mill that produces newsprint from TMP is shown in FigureB-1.
The mill is divided into several areas for energy conversion and pulp and papermanufacturing.
In the energy conversion areas, purchased fuel is converted to steam for use in themanufacturing areas. The energy conversion areas include the power boiler and deaerator.
In the manufacturing areas, energy resources (fuel, steam and electricity) and fibreresources are used to produce newsprint. The manufacturing areas include• wood preparation• mechanical pulping• paper machine• water treatment• effluent treatment• general areas (for example, buildings)
Figure B-1 Energy conversion and manufacturing areas of a mill producing newsprint from TMP
Electricity
Natural Gas
Newsprint
Energy Conversion Areas
PowerBoiler
Deaerator
Manufacturing Areas
MechanicalPulping
WoodPreparation
PaperMachine
WaterTreatment
EffluentTreatment
GeneralBuildings
BENCHMARKING ENERGY USE IN CANADIAN PULP AND PAPER MILLS
APPENDICES
51The raw data, reconciled data and specific energies for a mill that produces newsprint areshown in Tables B-1 to B-3.
In Table B-1, along with the energy and fibre data, the quality of the data (A, B, C or D) isreported:• A–reliable instrumentation with good calibration• B–less reliable instrumentation• C–calculated by heat and material balance from measured values• D–estimated when measurements unavailable
The actual fibre productions are given for the wood preparation, mechanical pulping andpaper machine areas. The total mill production is used to calculate the specific energies forthe remaining areas.
The purchased energies (electricity and natural gas) are energy inputs in Table B-1. Thedata quality for these energy inputs is A because they are measured with reliableinstrumentation with good calibration.
The data qualities for the energy produced and consumed by the manufacturing and energyconversion areas range from A to D.
The total energy supply is the sum of the energy inputs and energy produced by the areas.The total energy demand is the sum of the energy consumed by the areas. The total energysupply is not equal to the total energy demand for electricity, steam and condensate becauseof instrument measurement errors and estimates being used when measurements areunavailable.
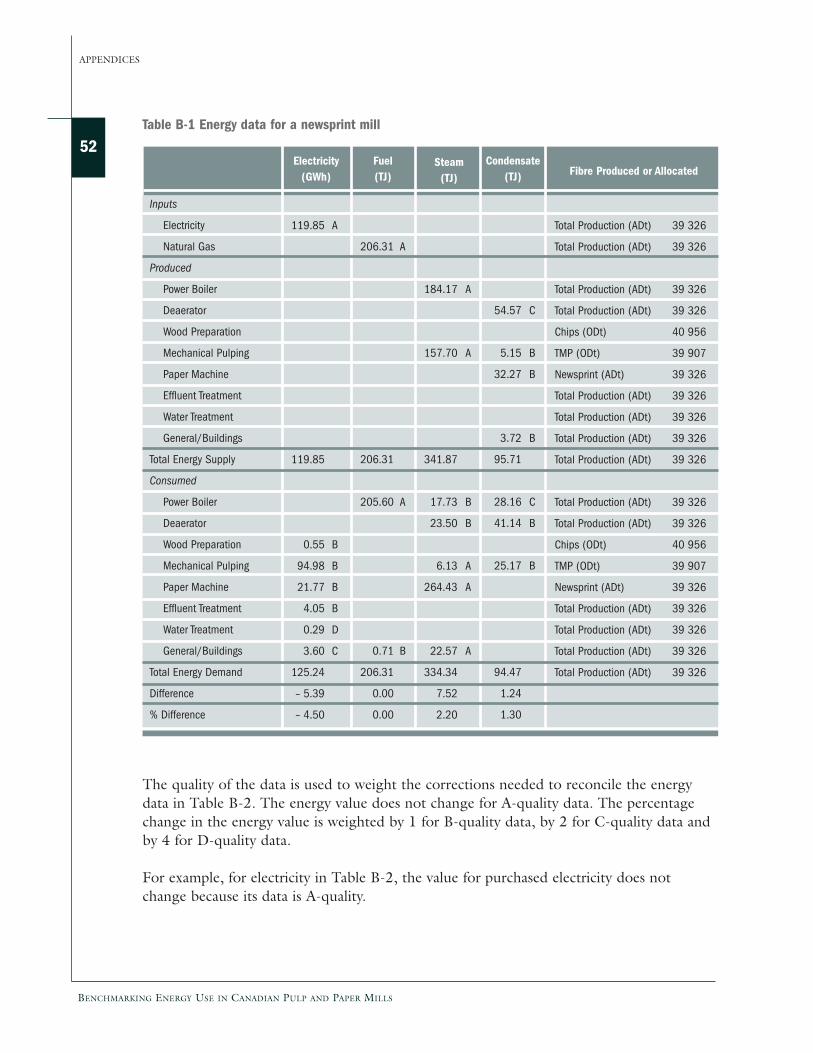
52
BENCHMARKING ENERGY USE IN CANADIAN PULP AND PAPER MILLS
APPENDICES
Table B-1 Energy data for a newsprint mill
Electricity(GWh)
119.85 A
119.85
0.55 B
94.98 B
21.77 B
4.05 B
0.29 D
3.60 C
125.24
– 5.39
– 4.50
Inputs
Electricity
Natural Gas
Produced
Power Boiler
Deaerator
Wood Preparation
Mechanical Pulping
Paper Machine
Effluent Treatment
Water Treatment
General/Buildings
Total Energy Supply
Consumed
Power Boiler
Deaerator
Wood Preparation
Mechanical Pulping
Paper Machine
Effluent Treatment
Water Treatment
General/Buildings
Total Energy Demand
Difference
% Difference
Fuel(TJ)
206.31 A
206.31
205.60 A
0.71 B
206.31
0.00
0.00
Steam(TJ)
184.17 A
157.70 A
341.87
17.73 B
23.50 B
6.13 A
264.43 A
22.57 A
334.34
7.52
2.20
Condensate(TJ)
54.57 C
5.15 B
32.27 B
3.72 B
95.71
28.16 C
41.14 B
25.17 B
94.47
1.24
1.30
Fibre Produced or Allocated
Total Production (ADt) 39 326
Total Production (ADt) 39 326
Total Production (ADt) 39 326
Total Production (ADt) 39 326
Chips (ODt) 40 956
TMP (ODt) 39 907
Newsprint (ADt) 39 326
Total Production (ADt) 39 326
Total Production (ADt) 39 326
Total Production (ADt) 39 326
Total Production (ADt) 39 326
Total Production (ADt) 39 326
Total Production (ADt) 39 326
Chips (ODt) 40 956
TMP (ODt) 39 907
Newsprint (ADt) 39 326
Total Production (ADt) 39 326
Total Production (ADt) 39 326
Total Production (ADt) 39 326
Total Production (ADt) 39 326
The quality of the data is used to weight the corrections needed to reconcile the energydata in Table B-2. The energy value does not change for A-quality data. The percentagechange in the energy value is weighted by 1 for B-quality data, by 2 for C-quality data andby 4 for D-quality data.
For example, for electricity in Table B-2, the value for purchased electricity does notchange because its data is A-quality.
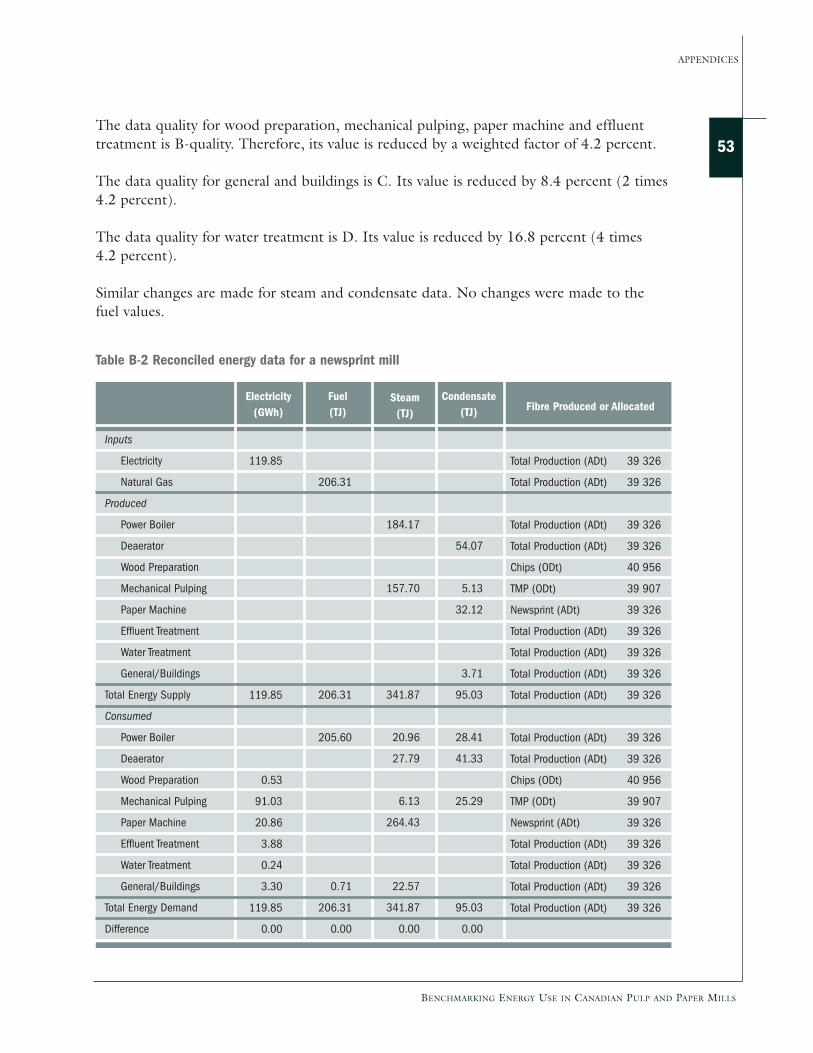
BENCHMARKING ENERGY USE IN CANADIAN PULP AND PAPER MILLS
APPENDICES
53The data quality for wood preparation, mechanical pulping, paper machine and effluenttreatment is B-quality. Therefore, its value is reduced by a weighted factor of 4.2 percent.
The data quality for general and buildings is C. Its value is reduced by 8.4 percent (2 times4.2 percent).
The data quality for water treatment is D. Its value is reduced by 16.8 percent (4 times4.2 percent).
Similar changes are made for steam and condensate data. No changes were made to thefuel values.
Table B-2 Reconciled energy data for a newsprint mill
Electricity(GWh)
119.85
119.85
0.53
91.03
20.86
3.88
0.24
3.30
119.85
0.00
Inputs
Electricity
Natural Gas
Produced
Power Boiler
Deaerator
Wood Preparation
Mechanical Pulping
Paper Machine
Effluent Treatment
Water Treatment
General/Buildings
Total Energy Supply
Consumed
Power Boiler
Deaerator
Wood Preparation
Mechanical Pulping
Paper Machine
Effluent Treatment
Water Treatment
General/Buildings
Total Energy Demand
Difference
Fuel(TJ)
206.31
206.31
205.60
0.71
206.31
0.00
Steam(TJ)
184.17
157.70
341.87
20.96
27.79
6.13
264.43
22.57
341.87
0.00
Condensate(TJ)
54.07
5.13
32.12
3.71
95.03
28.41
41.33
25.29
95.03
0.00
Fibre Produced or Allocated
Total Production (ADt) 39 326
Total Production (ADt) 39 326
Total Production (ADt) 39 326
Total Production (ADt) 39 326
Chips (ODt) 40 956
TMP (ODt) 39 907
Newsprint (ADt) 39 326
Total Production (ADt) 39 326
Total Production (ADt) 39 326
Total Production (ADt) 39 326
Total Production (ADt) 39 326
Total Production (ADt) 39 326
Total Production (ADt) 39 326
Chips (ODt) 40 956
TMP (ODt) 39 907
Newsprint (ADt) 39 326
Total Production (ADt) 39 326
Total Production (ADt) 39 326
Total Production (ADt) 39 326
Total Production (ADt) 39 326
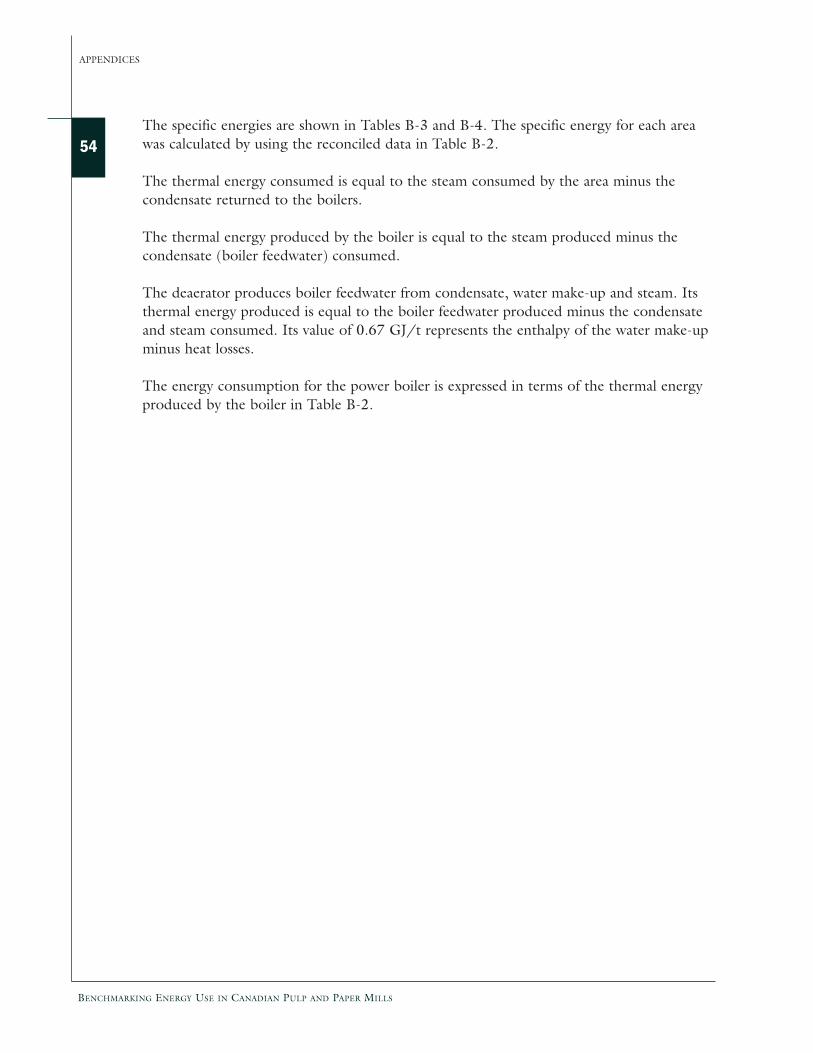
54
BENCHMARKING ENERGY USE IN CANADIAN PULP AND PAPER MILLS
APPENDICES
The specific energies are shown in Tables B-3 and B-4. The specific energy for each areawas calculated by using the reconciled data in Table B-2.
The thermal energy consumed is equal to the steam consumed by the area minus thecondensate returned to the boilers.
The thermal energy produced by the boiler is equal to the steam produced minus thecondensate (boiler feedwater) consumed.
The deaerator produces boiler feedwater from condensate, water make-up and steam. Itsthermal energy produced is equal to the boiler feedwater produced minus the condensateand steam consumed. Its value of 0.67 GJ/t represents the enthalpy of the water make-upminus heat losses.
The energy consumption for the power boiler is expressed in terms of the thermal energyproduced by the boiler in Table B-2.
BENCHMARKING ENERGY USE IN CANADIAN PULP AND PAPER MILLS
APPENDICES
55Table B-3 Specific energy data for a newsprint mill
Electricity(kWh/t)
3,047.51
12.94
2,280.97
530.56
98.78
6.11
83.88
Inputs
Electricity
Natural Gas
Produced
Power Boiler
Deaerator
Wood Preparation
Mechanical Pulping
Paper Machine
Effluent Treatment
Water Treatment
General/Buildings
Consumed
Power Boiler
Deaerator
Wood Preparation
Mechanical Pulping
Paper Machine
Effluent Treatment
Water Treatment
General/Buildings
Fuel(GJ/t)
5.25
5.23
0.02
Steam(GJ/t)
3.96
0.67
3.32
0.53
0.02
5.91
0.48
Fibre Produced or Allocated
Total Production (ADt) 39 326
Total Production (ADt) 39 326
Total Production (ADt) 39 326
Total Production (ADt) 39 326
Chips (ODt) 40 956
TMP (ODt) 39 907
Newsprint (ADt) 39 326
Total Production (ADt) 39 326
Total Production (ADt) 39 326
Total Production (ADt) 39 326
Total Production (ADt) 39 326
Total Production (ADt) 39 326
Chips (ODt) 40 956
TMP (ODt) 39 907
Newsprint (ADt) 39 326
Total Production (ADt) 39 326
Total Production (ADt) 39 326
Total Production (ADt) 39 326
Table B-4 Energy consumption of the power boiler
Electricity Consumption (kWh/GJ)†
0.00
Fuel Consumption (GJ/GJ)†
1.32
Thermal Energy Consumption (GJ/GJ)†
0.13
† The specific energy is the energy consumed divided by the thermal energy produced.
56
BENCHMARKING ENERGY USE IN CANADIAN PULP AND PAPER MILLS
APPENDICES
APPENDIX C. PAPRICAN ENERGY BENCHMARKING SURVEYINSTRUCTIONS
This appendix describes the survey worksheets and data codes, and explains how to enterthe data into the worksheets to complete the Energy Benchmarking survey.
Survey worksheets
The Excel workbook for the Energy Benchmarking survey contains the followingworksheets:
1. Process Description – Use this worksheet to specify the mill’s inputs (i.e. energy),outputs (i.e. fibre) and process areas.
2. Technology Descriptors – Use this worksheet to enter the technology descriptors ofthe process areas as defined in the Process Description worksheet.
3. Data – Use this worksheet to enter the energy and fibre amounts for the mill’s inputs,produced outputs, and process areas.
4. Reconciled Data – This worksheet displays the reconciled data based on theinformation provided in the first three worksheets.
5. Specific Energy – This worksheet calculates and displays specific energies using datafrom the Reconciled Data worksheet.
6. Summary – This worksheet displays the energy balance for the mill.
You will enter data in the first three worksheets – Process Description, TechnologyDescriptors and Data. In turn, the data you entered will populate the latter threeworksheets – Reconciled Data, Specific Energy and Summary, providing you with thesurvey results.
BENCHMARKING ENERGY USE IN CANADIAN PULP AND PAPER MILLS
APPENDICES
571. Process Description worksheet
The Process Description worksheet contains two sections:• Inputs and Outputs• Process Areas
Each section contains a series of codes that pertain to a mill’s activities as shown in thefollowing subsections.
1.1 Inputs and outputs
Under the Inputs and Outputs section of the worksheet, enter the types of pulp and paperthe mill produces and its energy inputs and outputs as described below.
Codes A.1 to A.15 Pulp and Paper Production• For each product type produced by the mill, click the
corresponding cell in column C; from the drop-down menu,select Yes.
Codes A.16 to A.19 Purchased Pulp• For each pulp type purchased by the mill, click the
corresponding cell in column C; from the drop-down menu,select Yes.
Codes B.1 to B.18 Purchased Energy• For each energy type purchased by the mill, click the
corresponding cell in column C; from the drop-down menu,select Yes.
Codes B.20 to B.25 Self-Generated Energy• Self-generated energy consists of biofuels generated in the mill
(e.g. spent pulping liquor and hydraulic energy). It does notinclude steam and power produced in the energy conversionareas.
• For each energy type that is self-generated by the mill, click thecorresponding cell in column C; from the drop-down menu,select Yes.
• If spent pulping liquor (Code B.22) is self-generated, click thecorresponding cell in column D; from the drop-down menu,select the chemical pulping type used by the mill.
Codes B.27 and B.28 Sold Energy• For each energy type sold by the mill, click the corresponding
cell in column C; from the drop-down menu, select Yes.
2. Technology Descriptors worksheet
The Technology Descriptors worksheet contains the technology descriptors for each of themill’s energy conversion areas and process areas. These areas are identified by their code,type and name (see columns A to C) as previously defined in the Process Descriptionworksheet. The technology descriptor types are listed in the worksheet in columns D, F, Hand J alongside codes C.1 to F.25.
58
BENCHMARKING ENERGY USE IN CANADIAN PULP AND PAPER MILLS
APPENDICES
1.2 Process Areas
Under the Process Areas section of the worksheet, enter information into each of the four areasas described below.
Codes C.1 to C.25 Energy Conversion Areas• In column B, click the first cell; from the drop-down menu, select
one type of energy conversion area used by the mill.• Repeat previous step for each energy conversion type or area used
by the mill.• For each entry made in column B, select the corresponding cell in
column C and type the name of the area.
Codes D.1 to D.25 Pulping Process Areas• Select the type of pulping process area from the list in the drop-
down menu in the corresponding yellow cells in column B.• Input the area name in the corresponding yellow cells in column D.• Select the fibre produced or allocated (wood, pulp) from the drop
down menu in the corresponding yellow cells in column D.• Some areas, such as kraft evaporators, do not produce fibre
products. The product for these areas is the fibre product associatedwith their operation. Therefore the product for kraft evaporators isthe unbleached kraft pulping produced in making black liquor.
Codes E.1 to E.25 Finishing Process Areas• Select the type of finishing process area from the drop-down menu
in the corresponding yellow cells in column B.• Input the area name from the drop-down menu in the
corresponding yellow cells in column C.• Select the fibre produced or allocated (paper, board, pulp) from the
drop-down menu in the corresponding yellow cells in column D.
Codes F.1 to F.25 Common Process Areas• Select the type of common process area from the drop-down menu
in the corresponding yellow cells in column B.• Input the area name from the drop-down menu in the
corresponding yellow cells in column C.
BENCHMARKING ENERGY USE IN CANADIAN PULP AND PAPER MILLS
APPENDICES
59For each technology descriptor type listed in columns D, F, H and J, click thecorresponding yellow cell in columns E, G, H and I and select a technology descriptorentry from the drop-down menu or enter the requested value. If you select optionOther (specify), specify a value.
3. Data worksheet
The Data worksheet contains the energy and fibre data and is subdivided into two sections:
• Data – Inputs and Produced• Data – Inputs and Consumed
The inputs, outputs and process areas are identified by their code, type and name (seecolumns A to C) as previously defined in the Process Description worksheet. Process areasthat produce and consume energy will have data in both sections.
Enter the reporting period in row 2 of this worksheet as follows:
• click cell E2; from the drop-down menu, select the quarter• click cell F2; from the drop-down menu, select the year
Then, enter data in each section of the worksheet: Data – Inputs and Produced (see row 2)and Data – Outputs and Consumed (see row 149) as described below.
3.1 Data – Inputs and Produced
The energy and fibre types listed in the Data – Inputs and Produced section of theworksheet (codes A.16 to F.25) match those specified in the Process Descriptionworksheet.
In each of the yellow-highlighted cells, enter the energy or fibre value. For each entry witha drop-down menu, select the data quality. Also, enter the following information:
• in columns D to K, enter energy data• in columns L to BS, enter fibre data• in columns BT to CA, enter purchased fibre• in columns CB to CM, enter allocated fibre
The chemical pulp evaporators, recovery boiler and recausticizing areas do not producefibre products. The value of allocated fibre for these areas is the unbleached chemical pulpproduction that is associated with the processed spent pulping liquor.
60
BENCHMARKING ENERGY USE IN CANADIAN PULP AND PAPER MILLS
APPENDICES
3.2 Data – Outputs and Consumed
Complete the Data – Outputs and Consumed section of the worksheet (codes A.1 to F.25)as follows:
• in columns D to K, enter energy data• in columns L to BS, enter fibre data• in columns BT to CA, enter purchased fibre• in columns CB to CM, enter allocated fibre
4. Reconciled Data worksheet
The Reconciled Data worksheet displays the reconciled data. No data entry is required forthis worksheet.
5. Specific Energy worksheet
The Specific Energy worksheet calculates and displays the specific energies using thereconciled data from the Reconciled Data worksheet. No data entry is required for thisworksheet.
6. Summary worksheet
The Summary worksheet displays the energy balance for the mill.
DISCLAIMER
Although care has been taken in compiling and structuring the information in the spreadsheet, Natural ResourcesCanada and FPInnovations Paprican Division are not responsible for any omissions, errors or inaccuracies that mayoccur in the final results. Conclusions drawn from data are the responsibility of the users.