Embed Size (px)
Citation preview
Canadian Journal of Law andSociety / Revue Canadienne Droit etSociétéhttp://journals.cambridge.org/CLS
Additional services for Canadian Journal of Lawand Society / Revue Canadienne Droit etSociété:
Email alerts: Click hereSubscriptions: Click hereCommercial reprints: Click hereTerms of use : Click here
The Limits of Observation for UnderstandingMass Violence
Megan Price and Patrick Ball
Canadian Journal of Law and Society / Revue Canadienne Droit et Société / FirstView Article/ June 2015, pp 1 - 21DOI: 10.1017/cls.2015.24, Published online: 23 June 2015
Link to this article: http://journals.cambridge.org/abstract_S0829320115000241
How to cite this article:Megan Price and Patrick Ball The Limits of Observation for Understanding MassViolence. Canadian Journal of Law and Society / Revue Canadienne Droit etSociété, Available on CJO 2015 doi:10.1017/cls.2015.24
Request Permissions : Click here
Downloaded from http://journals.cambridge.org/CLS, IP address: 162.129.44.17 on 24 Jun 2015
Canadian Journal of Law and Society / Revue Canadienne Droit et Société , 2015, Page 1 of 21 . doi:10.1017/cls.2015.24
The Limits of Observation for Understanding Mass Violence
Megan Price and Patrick Ball *
Abstract
Quantitative analyses have the potential to contribute to transitional justice mech-anisms, via empirical evidence supporting the memory of victims, allocating pro-portional responsibility among perpetrators, determining legal responsibility, and supporting historical memory and clarity. However, most data available in transi-tional justice settings are incomplete. Conducting quantitative analyses relying solely on what is observable and knowable leads to not only incomplete but oft en incorrect analytical results. Th is can harm rather than contribute to transitional justice mechanisms. Th is article outlines diff erent types of data, the ways in which observable data, on their own, are insuffi cient for most quantitative analyses of interest, presents these limitations via a case study from Syria, and introduces sta-tistical methods to overcome these limitations.
Keywords : counting casualties , missing data , transitional justice , convenience samples , human rights
Résumé
Les analyses quantitatives peuvent contribuer aux mécanismes de justice transi-tionnelle corroborant le souvenir des victimes grâce à des preuves empiriques, en répartissant la responsabilité proportionnellement parmi les agresseurs, en attribuant la responsabilité légale et en appuyant la mémoire et la clarté historiques. Toutefois, la plupart des données disponibles en contexte de justice transitionnelle sont incom-plètes. Les analyses quantitatives fondées uniquement sur les preuves susceptibles d’être observées ou connues peuvent aboutir à des résultats analytiques non seulement incomplets mais aussi incorrects. Ce phénomène peut faire plus de tort que de bien aux mécanismes de justice transitionnelle. Cet article explique comment les données susceptibles d’être observées sont insuffi santes à elles seules pour produire des analy-ses quantitatives dignes d’intérêt, illustre ces limites par une étude de cas en Syrie, et présente des méthodes statistiques susceptibles de surmonter ces problèmes.
Mots clés : décompte des victimes , données manquantes , justice transitionnelle , échantillons de commodité , droits de la personne
* Th e materials contained herein represent the opinions of the authors and should not be construed to be the view of HRDAG, any of HRDAG’s constituent projects, the HRDAG Board of Advisers, or the donors to HRDAG.
2 Megan Price and Patrick Ball
1. Introduction
Transitional justice encompasses criminal prosecutions, reparations, institutional
reform, truth commissions, commissions of inquiry, and memorialization, among
other measures. Each of these processes endeavors to determine accurately what
happened in the past. Respect for the memory of victims, allocation of propor-
tional responsibility among perpetrators, and determination of legal responsi-
bility all depend upon an accurate historical memory built on empirical evidence.
Quantitative analysis of the patterns and magnitude of past violence is a small but
critical piece of this process. Statistical evidence can contribute to this process, as
it did, for example, in the 2013 trial of General José Efraín Ríos Montt. Statistical
analyses indicated that members of the indigenous population were eight times
more likely to be killed by the army than their non-indigenous neighbors. Th e
judges found this to be compelling evidence consistent with the charge of geno-
cide. Perhaps most importantly, the judges noted that the statistical evidence con-
fi rmed, “in numerical form, what the victims said.” 1
In the best of cases, this is precisely what quantitative analyses can off er: both
confi rmation and generalization of individual experiences. John Hagan, Heather
Schoenfeld, and Alberto Palloni describe how the establishment of casualty counts
can contribute specifi cally in the context of international criminal law: “Th e struc-
ture of international criminal law ... holds to the dictum ‘no body, no crime.’ Th is
presents signifi cant problems for lawyers investigating or prosecuting heads of
state for crimes against humanity that can be hidden behind the doctrine of state
autonomy. To establish legal responsibility, either bodies must be uncovered from
mass graves and identifi ed, as was done in Srebrenica, or the number of deaths
must be otherwise convincingly established.” 2 Later in that same piece the authors
describe Ball’s presentation of statistical analyses and results 3 to the International
Criminal Tribunal for the Former Yugoslavia (ICTY) and optimistically conclude
that “[t]his testimony is likely to play a signifi cant role in the judicial panel’s deci-
sion about the Kosovo phase of the Miloševi ć case.” 4
1 In their conclusion, the judges wrote, “[Patrick’s] expert report provides evidentiary support for
the following reasons: a) It shows in statistical form that from April 1982 to July 1983, the army killed 5.5% of the indigenous people in the Ixil area. b) It confi rms, in numerical form, what the victims said. c) It explains thoroughly the equation, analysis, and the procedure used to obtain the indicated result. d) The report establishes that the greatest number of indigenous deaths occurred during the period April 1982 to July 1983 when José Efraín Ríos Montt governed. e) Th e expert is a person with extensive experience in statistics.” Translation provided by Patrick Ball. A link to the complete opinion, in Spanish, is available via HRDAG’s website, https://hrdag.org/hat-tip-from-guatemala-judges/ .
2 John Hagan , Heather Schoenfeld , and Alberto Palloni , “ The Science of Human Rights, War
Crimes, and Humanitarian Emergencies ,” Annual Review of Sociology 32 ( 2006 ): 329 –49. Also see Helge Brunborg about the ways in which a demographer can contribute to a war crimes trial based on his experiences at the International Criminal Tribunal for the Former Yugoslavia in “Contribution of Statistical Analysis to the Investigations of the International Criminal Tribunals,” Statistical Journal of the United Nations (2001).
3 Patrick Ball, Wendy Betts, Fritz Scheuren, Jana Dudukovic, and Jana Asher, “Killings and Refugee
Flow in Kosovo, March-June 1999 (A Report to ICTY),” published by the American Association for the Advancement of Science and the American Bar Association Central and East European Law Initiative (2002).
4 Hagan, Schoenfeld, and Palloni, “The Science of Human Rights,” 329–49. Note that Miloševi ć
died before his trial was complete, so there was no verdict.
Understanding Mass Violence 3
For statistical evidence to contribute to historical clarifi cation, the statistics
have to be right. Relying solely on what was observed to draw quantitative com-
parisons and conclusions is insuffi cient. Th is paper focuses on the role statistical
analyses of patterns of fatal violence can play in transitional justice mechanisms,
and the limitations and potential pitfalls that exist when such analyses are unsup-
ported by the available data.
Th e remaining sections of this paper outline the kinds of quantitative compari-
sons that are frequently of interest in transitional justice and why and how most
unadjusted observed data is insuffi cient for these kinds of comparisons, and briefl y
introduce how to adjust for limitations in observed data and conduct appropriate
analyses using the kinds of data sources that are frequently available to researchers
and advocates in a transitional justice setting.
2. Using Observed Data to Draw Conclusions About Unobserved Data
Emerging technology has provided new ways to record and publicize observed
human rights violations. 5 But we remain limited by what is observable, and many
human rights violations are either unobserved or unrecorded. An individual shot
in the woods may leave behind only the perpetrator as witness. A child who
escaped the massacre of her village may be too traumatized and fearful to be able
to talk about what she witnessed. Communities living in remote areas may not
be reached by documentation eff orts. People of a marginalized ethnicity may not
trust journalists or even human rights activists from other ethnicities. Th ere are
countless other scenarios in which there is no record of a homicide.
Yet we must do our best to account for these missing stories if we plan to
use quantitative analyses as inputs to transitional justice mechanisms. As noted
above, statistical analyses can contribute evidence to transitional justice processes.
When we base these analyses solely on unadjusted observed data, we are implicitly
assuming that any violations we did not observe are the same as the violations we
did observe.
To be more explicit, using only observed data makes a strong but oft en unspo-
ken statistical assumption that either every single violation was observed and
recorded, or that observed, recorded violations represent (in a statistical sense)
those violations that were either unobserved or unrecorded (this is discussed in
more detail below). Th ese are both strong assumptions and are generally unmet in
transitional justice (among other) settings. Using raw data as a proxy for statistical
patterns is very likely to misinterpret patterns of violations. Worse yet, by ignoring
the unrecorded violations, we do a disservice to victims whose stories have not yet
been told. Perversely, the worst events may leave the fewest witnesses, and conse-
quently, these events have the lowest probability of being reported. 6
Transitional justice mechanisms may be served by asking questions such as:
“Did violence increase or decrease when control of a region shift ed from one armed
group to another?” “Has the indigenous population experienced more violations
5 For many examples, see Patrick Meier’s blog: http://irevolution.net/ .
6 As just one example, see Mark Danner’s book Th e Massacre at El Mozote (New York: Vintage, 1994).
4 Megan Price and Patrick Ball
than the non-indigenous population, consistent with patterns of ethnic targeting
or genocide?” “Which armed group is responsible for the majority of violations?” 7
Answers to such questions can inform determination of legal responsibility, allo-
cation of proportional responsibility among perpetrators, and more generally help
to accurately depict the ebb and fl ow of confl ict over time and geographic space.
All of the above examples require statistical inference, that is, drawing conclu-
sions about a population based on an observed sample of that population.
Statistical inference is only appropriate if one of three conditions is true: (1) when
the entire population has been observed, that is, the sample is a complete census;
(2) when there is a mathematically known probability relationship between the
sample and the population, usually satisfi ed by drawing a sample randomly; or
(3) when the sample is adjusted by one of a set of post-sampling techniques,
including raking and multiple systems estimation (MSE), among others. MSE will
be discussed in detail in the following sections.
When we use observed, recorded violations to answer such questions, we are
assuming either that observed, recorded violations are a complete set of all the
violations that have occurred (i.e., that condition (1) is met), or that they are rep-
resentative, in a statistical sense, of all violations (i.e., that condition (2) is met).
In some rare circumstances, one of these assumptions may be true. For instance,
there are examples of attempts to completely enumerate victims. 8 However, it
should be noted that in each of those cases assumptions must still be made regard-
ing whether or not every victim has been counted. Philip Verwimp (2010) and
Romesh Silva and Patrick Ball (2006) each discuss this challenge directly. 9 In the
case of both the Bosnian Book of the Dead and the Kosovo Memory Book , addi-
tional data sources were available to enable evaluations of completeness. 10 , 11
Additionally, there are many examples of surveys, 12
which use random sam-
ples to represent the underlying population of victims. Many of these include
7 Susanne Karstedt proposes similar questions in her section on contextualizing extreme violence
in “Contextualizing Mass Atrocity Crimes: Moving Toward a Relational Approach,” Annual Review of Law and Social Science, 9 (2013): 383–404.
8 Such as the data collected by Rwandan organization IBUKA in the Kibuye Prefecture as described
in Philip Verwimp, “Machetes and Firearms: Th e Organization of Massacres in Rwanda,” Journal of Peace Research 43 (2006): 5–22; the Bosnian Book of the Dead as prepared by the Research and Documentation Center in Sarajevo; the Kosovo Memory Book database, as prepared by the Humanitarian Law Center, available at http://www.hlc-rdc.org/ .
9 Philip Verwimp , “ Death and Survival During the 1994 Genocide in Rwanda ,” Population Studies ,
58 ( 2010 ): 233 –45 ; Romesh Silva and Patrick Ball, “Th e Profi le of Human Rights Violations in Timor-Leste, 1974–1999: A Report by the Benetech Human Rights Data Analysis Group to the Commission on Reception, Truth and Reconciliation of Timor-Leste,” published in 2006 and available at https://hrdag.org/content/timorleste/Benetech-Report-to-CAVR.pdf , see particularly their discussion of the incompleteness of the cemetery records.
10
Patrick Ball, Ewa Tabeau, and Philip Verwimp, “Th e Bosnian Book of Dead: Assessment of the Database (Full Report)” HiCN Research Design Note 5, June 17, 2007.
11
Jule Krüger and Patrick Ball, “Evaluation of the Database of the Kosovo Memory Book,” published in 2014 and available at https://hrdag.org/wp-content/uploads/2013/01/Evaluation_of_the_Database_KMB-2014.pdf .
12
Th e Households in Confl ict Network provides an in-depth description of diff erent types of sur-veys and proposes ways to improve existing questionnaires to better understand violent confl ict; see Tilman Brück, Patricia Justino, Philip Verwimp, and Alexandra Avdeenko, “Identifying Confl ict and Violence in Micro-Level Surveys,” HiCN Working Paper 79 (2010).
Understanding Mass Violence 5
questions used to calculate estimates of direct confl ict mortality and/or excess
mortality. 13 , 14
Complete enumeration is very time consuming and expensive. For example,
the projects in Bosnia and Kosovo each required over a decade to complete and
depended on extensive pre-confl ict literacy and population registration, as well as
sustained attention by research teams supported by farsighted donors. Surveys to
estimate mortality in violence are technically challenging and potentially fraught
with errors. 15
It is rarely feasible for transitional justice projects to attempt a complete enu-
meration or to conduct a survey. Consequently, many human rights researchers
rely on another type of data: convenience samples. Th ese samples include an
unknown proportion of the population and have an unknown probability rela-
tionship to the population. A census is a list of every possible element in the popu-
lation; a survey samples a fraction at random; convenience samples include all
other kinds of data.
Th e key diff erence between random and convenience samples is the way in
which the data are collected. Records in a random sample are selected via a proba-
bilistic mechanism. Every member of the population has a known probability of
being selected. When properly implemented, random selection produces samples
that are representative of the population of interest. Th is means that the sample
accurately refl ects important features of the population, such as the proportion of
males to females, children to adults, urban versus rural households, etc.
Th ere are a number of ways to select a random sample: a computer can gener-
ate a series of random numbers; dice or playing cards can be used to randomly
select events or individuals; or every k th
house can be selected from a random
starting point, for example. Th e important feature of random selection is that the
sample does not include people based on the subjective choices of the researcher
or choices by the individuals to be included or excluded in the sample. Th erefore,
random samples can be used to mathematically calculate the probability of selec-
tion for every person selected in the sample. Th is probability of selection then
tells us how many elements in the population our sampled record represents.
In other words, random samples are incomplete in the sense that they do not
include the entire population, but they are incomplete in a predictable, measurable
13
It is worth noting here the discussion in chapter 8 of the Human Security Report 2009/2010 on the limitations and challenges of calculating excess mortality, particularly when data on baseline mortality rates may be out of date or unavailable.
14
An illustrative and by no means complete or representative list of examples includes: Paul B Spiegel and Peter Salama, “War and Mortality in Kosovo, 1998–99: An Epidemiological Testimony,” Th e Lancet 355 (2000); D. de Walque and P. Verwimp, “Th e Demographic and Socio-Economic Distribution of Excess Mortality during the 1994 Genocide in Rwanda,” Journal of African Economies 0 (2010): 1–22; John Hagan and Joshua Kaiser, “A Separate Peace: Explaining War, Crime, Violence, and Security During and Aft er the Surge in Iraq,” May 16, 2013; Damien de Walque, “Selective Mortality During the Khmer Rouge Period in Cambodia,” Population and Development Review 31 (2005): 351–68; John Hagan, Wenona Rymond-Richmond, and Patricia Parker, “Th e Criminology of Genocide: the Death and Rape of Darfur,” Criminology 43 (2005); and Silva and Ball, “Th e Profi le of Human Rights Violations in Timor-Leste.”
15
See Human Security Report 2009/2010 and N. Johnson , M. Spagat , S. Gourley , J. Onnela , and G. Reinert , “ Bias in Epidemiological Studies of Confl ict Mortality ,” Journal of Peace Research 45 ( 2008 ): 653 –64.
6 Megan Price and Patrick Ball
way—assuming the random sample was collected correctly. 16
Th is makes random
samples appropriate for the kinds of quantitative comparisons described earlier.
Despite the name, most convenience samples are very diffi cult to collect, and
many are collected very systematically and rigorously. Examples of convenience
samples in human rights work include testimonies to truth commissions, press
reports, border crossing records maintained by officials, bureaucratic records
kept by police and other security forces, SMS messages sent to an activist network,
human rights non-governmental organization (NGO) reports, and messages sent
via social media. Countless examples of convenience samples are the result of
excellent, well-designed data collection projects conducted under incredibly dif-
fi cult and harrowing circumstances. Th ese are valuable, important projects.
Unfortunately for statistics, disciplined, systematic, meticulous data collection
is not a replacement for random data selection. No matter how rigorously it is
managed, human rights data from non-random samples is not representative of all
the human rights violations that occur during a confl ict, except by coincidence.
We may be able to speculate about potential diff erences between the kinds of vio-
lations included and excluded in a convenience sample, but without additional
data sources and appropriate statistical analyses, it is impossible to know in any
rigorous way what is missing from a convenience sample.
Non-random human rights data are valuable sources of information and con-
tain important contextual, qualitative details, but at the same time entail certain
biases 17
that make them unsuitable for generalization. For example, individuals
who are aware that a truth commission has been formed and choose to tell their
stories may not have had the same experiences as those who choose not to or are
unable to tell their stories. 18
Events that are covered by the media may diff er from
events that are not deemed newsworthy but nonetheless involve the same kinds of
violence. 19
An unknown subset of the population may have internet access, and
even more importantly, of those who have internet or cell phone access, a diff erent
fraction may feel comfortable using such technology to tell their story.
None of the above concerns implies that these are not important sources of
information. Again: all of these are valuable data collection mechanisms. However,
convenience sample data does not support conclusions about patterns of vio-
lence. Conclusions based on patterns observed in convenience sample data tell us
about patterns of reports of violence. But since convenience samples contain an
unknown proportion of the population, and bear an unknown relationship to the
16
Many introductory statistics texts cover this material in depth. Both Gerald van Belle, Statistical Rules of Th umb (New York: Wiley, 2002) and Sergey Dorofeev and Peter Grant, Statistics for Real-Life Sample Surveys (Cambridge: Cambridge University Press, 2006) are good places to start. Th e classic, and in our opinion still the most readable work on sampling is Leslie Kish, Survey Sampling (New York: Wiley, 1995), still in print aft er fi ft y years.
17
It is important to note that “bias” is not meant to connote judgement, but rather is used here in the statistical sense, meaning an empirical diff erence between what is observed and the complete picture of all events, were that knowable.
18
As an example, according to Vinck et al,’s 2011 study (available at http://www.peacebuildingdata.org/liberia/map ), nationwide, only 2 percent of the population took part in the Liberian Truth Commission.
19
See M. Price and P. Ball , “ Big Data, Selection Bias, and the Statistical Patterns of Mortality in Confl ict ,” SAIS Review 34 ( 2014 ): 9 – 20 .
Understanding Mass Violence 7
population, there is no scientifi c or mathematical basis on which to draw quantita-
tive conclusions from those observed reporting patterns about patterns of actual
violence. When we use convenience sample data to infer that more violence occurred
in this area than that area, or that this group is responsible for more violence than
that group, we are discounting the portions of the population not included in the
convenience sample. As a result, we run the risk of drawing the wrong conclu-
sions, making the wrong decisions. And in transitional justice research, that has
real implications for policy decisions, resource allocation, and accountability.
Notably, this limitation of observed data has long been understood within the
fi eld of criminology. Beginning in the late nineteenth century, there has been an
extensive body of literature on the unobserved “dark fi gure” of crime and the eff ect
this has on observed patterns: “Because of the partial and selective nature of the
police data, comparisons based on them of variations in ‘actual crime’ over time,
between places, and among components of the population, are all held to be grossly
invalid.” 20 , 21
Police data are a record of crime that is “known to police,” a precise
example of a convenience sample. As a result, research in criminology has looked
for alternative data sources and analytical methods to account and adjust for miss-
ing data. Approaches include victim surveys (which have their own challenges and
limitations 22
) and MSE, the statistical method introduced in section 5. 23
When we use a single convenience sample to compare violence committed
by groups A and B to conclude, for example, that more violence was committed by
group A than B, we are implicitly assuming that violence committed by group A
was reported at the same rate as violence committed by group B. Otherwise, diff er-
ences in observed rates of violence might be an artifact of diff erences in rates at
which violence was reported and attributed to each group. Th is is the challenge we
encountered in our work with the Peruvian Comisión de la Verdad y Reconciliación
(CVR), where one of the key questions was what proportion of the violence was
perpetrated by the guerrillas of the Shining Path and what proportion was perpe-
trated by agents of the state. Analyses conducted by the American Association for
the Advancement of Science (AAAS) used testimonies collected by the CVR and
databases collected by the governmental Defensoria del Pueblo and by human
rights NGOs. Th ese analyses found that Shining Path were identifi ed as perpetra-
tors in slightly less than half of the total number of testimonies collected by the
CVR and a much smaller proportion (between 5% and 16%) in the other data
sources. 24
Th ese fi ndings suggest a diff erent reporting rate for Shining Path and
20
A.D. Biderman and A.J. Reiss Jr. , “ On Exploring the ‘Dark Figure’ of Crime ,” Annals of the American Academy of Political and Social Science 374 ( 1967 ): 1 – 15 . Also see William Douglas Morrison , “ Th e Interpretation of Criminal Statistics ,” Journal of the Royal Statistical Society 60 ( 1897 ): 1 – 32 .
21
See also Matthieu de Castelbajac, “Brooding Over the Dark Figure of Crime,” British Journal of Criminology 54 (2014): 928-45, and C.J. Mosher , T.D. Miethe , and T.C. Hart , Th e Mismeasure of Crime ( Th ousand Oaks, CA : Sage , 2011 ) for more in-depth analyses of this topic in criminology.
22
See Castelbajac, “Brooding Over the Dark Figure of Crime.” 23
Duren Banks, Lance Couzens, Caroline Blanton, and Devon Cribb, “Arrest-Related Deaths Program Assessment,” A technical report published by RTI International (2015) available at http://www.bjs.gov/content/pub/pdf/ardpatr.pdf .
24
Patrick Ball, Jana Asher, David Sulmont, and Daniel Manrique, “How Many Peruvians Have Died?” Report published by the American Association for the Advancement of Science (2003).
8 Megan Price and Patrick Ball
state agents across the diff erent sources. However, without access to multiple data
sources and appropriate statistical techniques, this would be impossible to detect
and adequately adjust for. Ultimately, the AAAS researchers combined the multi-
ple data sources (using a method similar to the one described in section 4) and
conducted statistical analyses (similar to the method introduced in section 5) to
conclude that 46 percent of all confl ict-related deaths were perpetrated by the
Shining Path and 30 percent by agents of the Peruvian state. 25
It is fundamentally
the task of a truth commission to tell the truth, and these statistical fi ndings
enabled the CVR to make a much clearer argument about the relative responsibility
for gross human rights violations of the Shining Path relative to the Peruvian State.
Th e remainder of this paper presents a case study from the ongoing confl ict in
Syria to highlight several sources of convenience data (in the absence of complete
or randomly selected data) and introduce statistical methods necessary to use
such data to draw quantitative comparisons.
3. Case Study—Syria
On the heels of the Arab Spring revolutions beginning in December 2010, armed
confl icts began in Syria in March 2011. What started as protests demanding that
President Bashar al-Assad resign soon saw the Syrian Army deployed to stop the
civilian uprising. Since then, violence has escalated across Syria. Amid this con-
tinuing violence and humanitarian crisis, local human rights activists and citizen
journalists risk their lives to document human rights violations. Th e grave chal-
lenges they face are compounded by the regime’s active suppression of informa-
tion flow out of the country. Updated census or other vital statistics are not
available, and the current environment makes it extremely dangerous and diffi cult
(if not impossible) to administer a survey (though some information is being col-
lected in refugee camps 26
). As a result, there is considerable uncertainty about the
total number of violations and their patterns over time and location.
In early 2012, the United Nations Office for the High Commissioner for
Human Rights (OHCHR) commissioned the Human Rights Data Analysis Group
(HRDAG) to examine multiple convenience samples collected by Syrian NGOs
relying primarily on local networks to document confl ict-related deaths in Syria.
Three earlier reports 27
provide in-depth descriptions of these sources. In this
example, we focus on four sources (lists of deaths) that cover the entire length of
25
Ibid. 26
See the Syria Regional Refugee Response Inter-Agency Information Sharing Portal at http://data.unhcr.org/syrianrefugees/regional.php .
27
Megan Price, Jeff Klingner, and Patrick Ball, “Preliminary Statistical Analysis of Documentation of Killings in the Syrian Arab Republic,” published by the Benetech Human Rights Program, com-missioned by the United Nations Offi ce of the High Commissioner for Human Rights (2013); Megan Price, Jeff Klingner, Anas Qtiesh, and Patrick Ball, “Full Updated Statistical Analysis of Documentation of Killings in the Syrian Arab Republic,” published by the Human Rights Data Analysis Group, commissioned by the United Nations Offi ce of the High Commissioner for Human Rights (2013); Megan Price, Anita Gohdes, and Patrick Ball, “Updated Statistical Analysis of Documentation of Killings in the Syrian Arab Republic,” published by the Human Rights Data Analysis Group, commissioned by the United Nations Offi ce of the High Commissioner for Human Rights (2014).
Understanding Mass Violence 9
the ongoing confl ict and have continued to share with OHCHR and HRDAG
updated records of victims:
• the Syrian Center for Statistics and Research 28
(CSR-SY)
• the Syrian Network for Human Rights 29
(SNHR)
• the Syria Shuhada Website 30
(SS)
• the Violations Documentation Centre 31
(VDC)
For brevity, each list will be referred to by its acronym throughout the following
sections.
We conducted basic descriptive statistics looking at each of the datasets sepa-
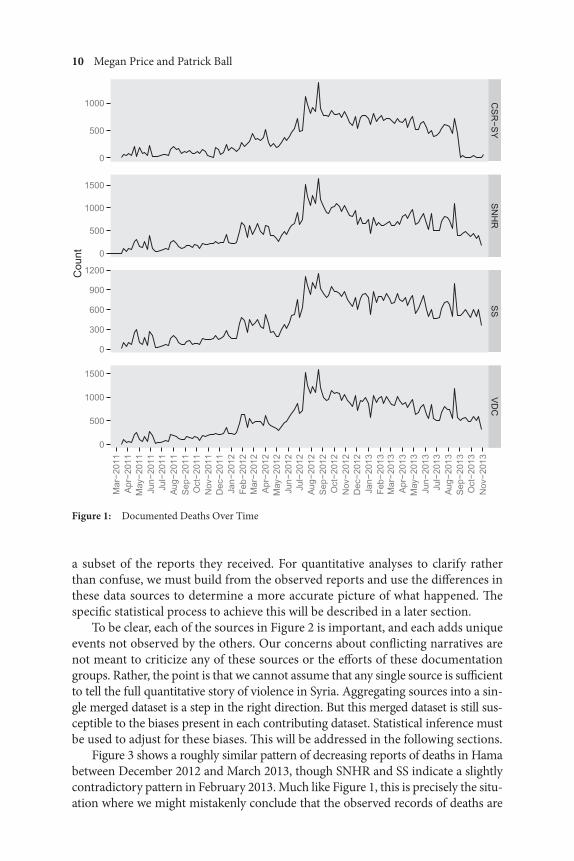
rately. As indicated in Figure 1 , the distribution of recorded deaths over time looks
quite similar for these documentation groups. However, note the very diff erent
magnitudes of the respective y-axes for each group.
Th is appearance of broad agreement across the multiple sources, when aggre-
gated across the entire country, creates the impression that the Syrian confl ict is a
thoroughly well-documented confl ict. And indeed it is, thanks in large part to a
highly literate, technologically savvy population willing and able to document the
violence occurring in their country. Yet despite this immense work, it is important
not to be misled by the apparent consistency into mistakenly relying on any one of
these sources to draw conclusions about patterns of violence. Expansion of our
comparisons to specifi c times and locations of interest reveal confl icting patterns in
the observed data. Furthermore, comparing the observed patterns with estimates of
the total deaths shows that the observed patterns can ignore peaks and increases at
key historical moments, and thereby present exactly the wrong picture. Th ese pat-
terns are the background form, the “macro-truth” that can inform transitional jus-
tice mechanisms. 32
Th is will be elaborated in the following examples and sections.
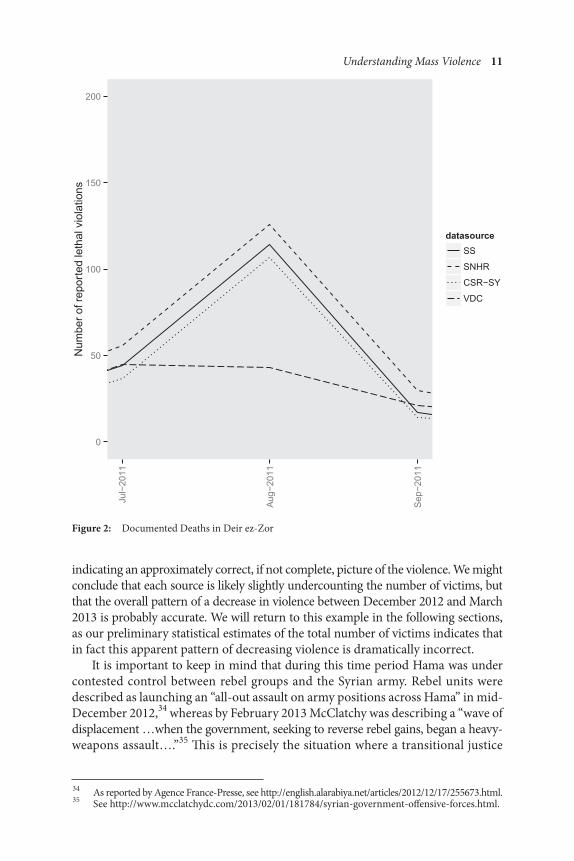
In Figure 2 , three sources (CSR-SY, SNHR, and SS) all indicate a rise in reports
of violence in Deir ez-Zor in August 2011. Records from VDC do not indicate this
rise in reports of violence. Th is time period corresponds with reports of protests
and government off ensives. 33
As in the example of the Ríos Montt case in the introduction, quantitative
analyses have the potential to support victim narratives. But individual conve-
nience samples may tell confl icting narratives, since each data source captures dif-
ferent snapshots of the violence. During the chaos of August 2011 in Deir ez-Zor,
it is entirely possible that each of these documentation groups had access to diff erent
segments of the community, were told diff erent stories, or were only able to verify
28
http://www.csr-sy.com/ . 29
http://www.syrianhr.org/ . 30
http://syrianshuhada.com/ . 31
http://www.vdc-sy.info/ . 32
On “macro-truth,” see Audrey Chapman and Patrick Ball , “ Th e Truth of Truth Commissions: Com-parative Lessons from Haiti, South Africa, and Guatemala ,” Human Rights Quarterly 23 ( 2001 ): 1 – 42 .
33
As reported by The Guardian ( http://www.theguardian.com/world/2011/aug/07/syrian-government-forces-storm-central-town ) and Al Jazeera ( http://www.aljazeera.com/news/middleeast/2011/08/20118613846890458.html , http://www.aljazeera.com/news/middleeast/2011/08/20118785421245255.html ).
10 Megan Price and Patrick Ball
Figure 1: Documented Deaths Over Time
a subset of the reports they received. For quantitative analyses to clarify rather
than confuse, we must build from the observed reports and use the diff erences in
these data sources to determine a more accurate picture of what happened. Th e
specifi c statistical process to achieve this will be described in a later section.
To be clear, each of the sources in Figure 2 is important, and each adds unique
events not observed by the others. Our concerns about confl icting narratives are
not meant to criticize any of these sources or the eff orts of these documentation
groups. Rather, the point is that we cannot assume that any single source is suffi cient
to tell the full quantitative story of violence in Syria. Aggregating sources into a sin-
gle merged dataset is a step in the right direction. But this merged dataset is still sus-
ceptible to the biases present in each contributing dataset. Statistical inference must
be used to adjust for these biases. Th is will be addressed in the following sections.
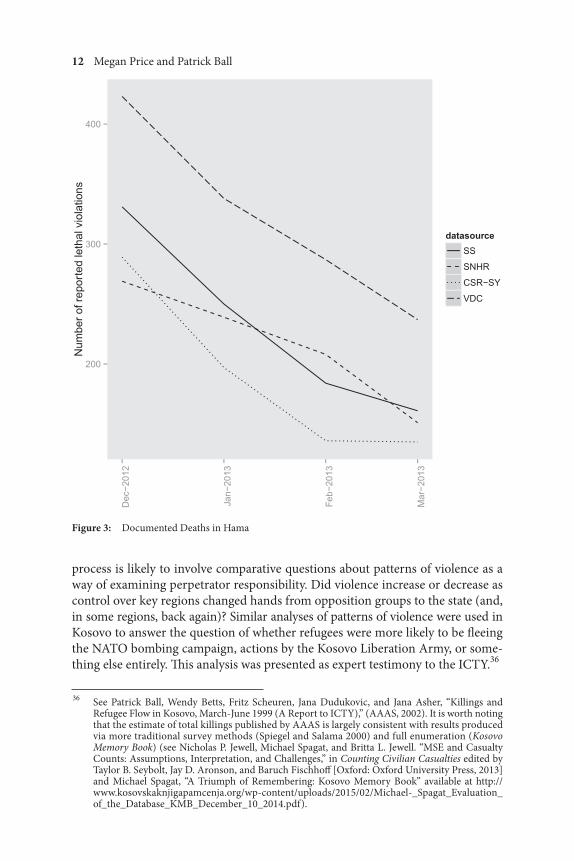
Figure 3 shows a roughly similar pattern of decreasing reports of deaths in Hama
between December 2012 and March 2013, though SNHR and SS indicate a slightly
contradictory pattern in February 2013. Much like Figure 1 , this is precisely the situ-
ation where we might mistakenly conclude that the observed records of deaths are
Understanding Mass Violence 11
Figure 2: Documented Deaths in Deir ez-Zor
indicating an approximately correct, if not complete, picture of the violence. We might
conclude that each source is likely slightly undercounting the number of victims, but
that the overall pattern of a decrease in violence between December 2012 and March
2013 is probably accurate. We will return to this example in the following sections,
as our preliminary statistical estimates of the total number of victims indicates that
in fact this apparent pattern of decreasing violence is dramatically incorrect.
It is important to keep in mind that during this time period Hama was under
contested control between rebel groups and the Syrian army. Rebel units were
described as launching an “all-out assault on army positions across Hama” in mid-
December 2012, 34
whereas by February 2013 McClatchy was describing a “wave of
displacement …when the government, seeking to reverse rebel gains, began a heavy-
weapons assault….” 35
Th is is precisely the situation where a transitional justice
34
As reported by Agence France-Presse, see http://english.alarabiya.net/articles/2012/12/17/255673.html . 35
See http://www.mcclatchydc.com/2013/02/01/181784/syrian-government-off ensive-forces.html .
12 Megan Price and Patrick Ball
Figure 3: Documented Deaths in Hama
process is likely to involve comparative questions about patterns of violence as a
way of examining perpetrator responsibility. Did violence increase or decrease as
control over key regions changed hands from opposition groups to the state (and,
in some regions, back again)? Similar analyses of patterns of violence were used in
Kosovo to answer the question of whether refugees were more likely to be fl eeing
the NATO bombing campaign, actions by the Kosovo Liberation Army, or some-
thing else entirely. Th is analysis was presented as expert testimony to the ICTY. 36
36
See Patrick Ball, Wendy Betts, Fritz Scheuren, Jana Dudukovic, and Jana Asher, “Killings and Refugee Flow in Kosovo, March-June 1999 (A Report to ICTY),” (AAAS, 2002). It is worth noting that the estimate of total killings published by AAAS is largely consistent with results produced via more traditional survey methods (Spiegel and Salama 2000) and full enumeration ( Kosovo Memory Book ) (see Nicholas P. Jewell, Michael Spagat, and Britta L. Jewell. “MSE and Casualty Counts: Assumptions, Interpretation, and Challenges,” in Counting Civilian Casualties edited by Taylor B. Seybolt, Jay D. Aronson, and Baruch Fischhoff [Oxford: Oxford University Press, 2013] and Michael Spagat, “A Triumph of Remembering: Kosovo Memory Book” available at http://www.kosovskaknjigapamcenja.org/wp-content/uploads/2015/02/Michael-_Spagat_Evaluation_of_the_Database_KMB_December_10_2014.pdf ).
Understanding Mass Violence 13
4. Aggregating Multiple Sources
Combining multiple sources into a single convenience sample has been a popular
approach in human rights work for decades; we have listed here only a few of the
hundreds of projects that have used this approach. Truth commissions have incor-
porated external information at least since the Salvadoran Truth Commission
published Anexo II as part of their 1993 report, in which they combined databases
from approximately six governmental and non-governmental sources. 37
Many
human rights NGOs around the world have used this technique. For example, the
International Center for Human Rights Research in Guatemala (CIIDH) in the
1990s, and the Colombian Commission of Jurists (CCJ) in Colombia in the 2000s
combined victim testimonies, other NGOs’ reports, and press sources, and calcu-
lated statistics from the combined database. 38
Many academic projects have com-
bined maps, household surveys, archives, and victim testimonies. 39
Various media
monitoring projects have integrated multiple publicly available sources via human
or automated methods. 40
Automated (or semi-automated) procedures for identifying multiple records
that refer to the same individual, potentially within the same source or across
multiple sources, is an active topic of research in statistics and computer science;
it is referred to variably as record linkage, database deduplication, or matching. 41
Not only must multiple records that describe the same individual victim be
identified and merged into a single, complete record, but information about
which source(s) contributed the original record(s) must also be maintained.
Th is last piece of information is key to the fi nal step, modeling the documenta-
tion patterns.
To determine whether multiple records refer to the same individual, we begin
with records with suffi ciently identifi able information. For this case study, we used
records that include the name of the victim, and date and location of his or her
death. Additional demographic variables, such as age (or date of birth), sex, and
location of birth may be used for the record linkage process. In our experience, at
a minimum, a record must include a name, date, and location to be considered
suffi ciently identifi able for the record linkage process. Unfortunately, this means
discarding a large number of records because there is no reliable way to determine
37
See “De la Locura a la Esperanza: La guerra de 12 años en El Salvador,” (United Nations, 1993). 38
For the CIIDH, see P. Ball, P. Kobrak, and H.F. Spirer, State Violence in Guatemala (AAAS, 1999). For CCJ, see “Cómo procesa su información la Comisión Colombiana de Juristas,” (no date) available online at http://www.coljuristas.org/documentos/adicionales/como_procesa_su_informacion_la_ccj.pdf , as well as the CCJ’s periodic iterations of the “Informe sobre la situación de derechos humanos” reports published throughout the late 1990s and 2000s.
39
See for example, Hagan et al., “Neighborhood Sectarian Displacement and the Battle for Baghdad: A Self-Fulfi lling Prophecy of Crimes against Humanity in Iraq,” and Philip Verwimp, “Testing the Double-Genocide Th esis for Central and Southern Rwanda,” Journal of Confl ict Resolution 47 (2003).
40
For example, see the Iraq Body Count, https://www.iraqbodycount.org/ , and the Computational Event Data System, http://eventdata.parusanalytics.com/index.html .
41
For reviews of the problem see William E. Winkler , “ Overview of Record Linkage and Current Research Directions ,” a technical report for the Statistical Research Division, US Census Bureau (2006) and Th omas N. Herzog , Fritz J. Scheuren , and William E. Winkler , Data Quality and Record Linkage Techniques ( New York : Springer , 2007 ).
14 Megan Price and Patrick Ball
42
Peter Christen’s 2012 book Data Matching—Concepts and Techniques for Record Linkage, Entity Resolution, and Duplicate Detection (Springer) is currently the canonical reference for this class of problems.
43
See Matthew Michelson and Craig A. Knoblock, “Learning Blocking Schemes for Record Linkage,” in Proceedings of the 21st National Conference on Artifi cial Intelligence (2006).
44
It is worth noting that there are many diff erent ways to compare names, and many of these ways are project specifi c. For example, diff erent documentation eff orts may record a diff erent number of names (family name, father’s name) in a diff erent order, so name comparisons may be made across different combinations of recorded names. Additionally, “Muhammad” (with various spellings) is a very common name in Syria, so comparisons may be calculated both including and excluding this name.
45
Sunita Sarawagi and Anuradha Bhamidipaty, “Interactive Deduplication Using Active Learning,” in Proceedings of the eighth ACM SIGKDD International Conference on Knowledge Discovery and Data Mining (2002).
46
See Price et al., “Full Updated Statistical Analysis of Documentation of Killings,” and Price, Gohdes, and Ball “Updated Statistical Analysis of Documentation of Killings,” for an in-depth description of record linkage for this case study, including the high level of agreement between diff erent individuals reviewing records in diff erent languages (English and Arabic).
if, for example, an unnamed body reported by source A in fact refers to a named
victim included in source B. It is impossible to reliably match records that lack suf-
fi cient identifying information. Th is also highlights the importance of the fi nal
step, estimation, to account for these unidentifi ed victims.
Determining whether multiple records refer to the same victim using semi-
automated methods involves drawing many comparisons between many pairs
of records. 42
Th e size of this problem scales rapidly with the number of initial
records to consider—specifi cally, if we compare every possible pair of records,
we must conduct (n 2 ) / 2 comparisons, where n is the number of records across
all sources. For the Syria case study, we currently have approximately half a
million records, resulting in more than a hundred billion possible comparisons.
Th is can be reduced somewhat by comparing only those pairs within certain
blocks of records (e.g., only comparing pairs of records from the same geo-
graphic area or period of time), but generally this still requires tens or hundreds
of millions of comparisons. Choosing which records should be compared can be
challenging. 43
Many kinds of comparisons are then calculated for each pair. For example,
some comparison metrics might include the distance between the location of
death for each record, the number of days between the reported dates of death,
or how phonetically similar the two names are. 44
Importantly, these are but a
few examples; many comparisons are calculated for each pair. A classification
model then uses these comparisons to calculate the probability that any two
records refer to the same individual. A threshold is selected, and pairs of records
with a match probability above this value are considered to refer to the same
individual.
Another key step in this process is human review in which a person reviews
a subset of pairs and labels each pair as referring to the same individual or not.
Th ese labeled pairs are used to train the classifi cation model. Th is is also an itera-
tive process. 45
Following each run of the classifi cation model a human will review
and label another subset of pairs until the decisions made by the classifi cation
model match the decisions made by the human. 46
Th is makes it possible to scale
Understanding Mass Violence 15
the record linkage process to millions of pairs. A human cannot review that many
pairs, but a human can train a computer to mimic their decision process and thus
label millions of pairs.
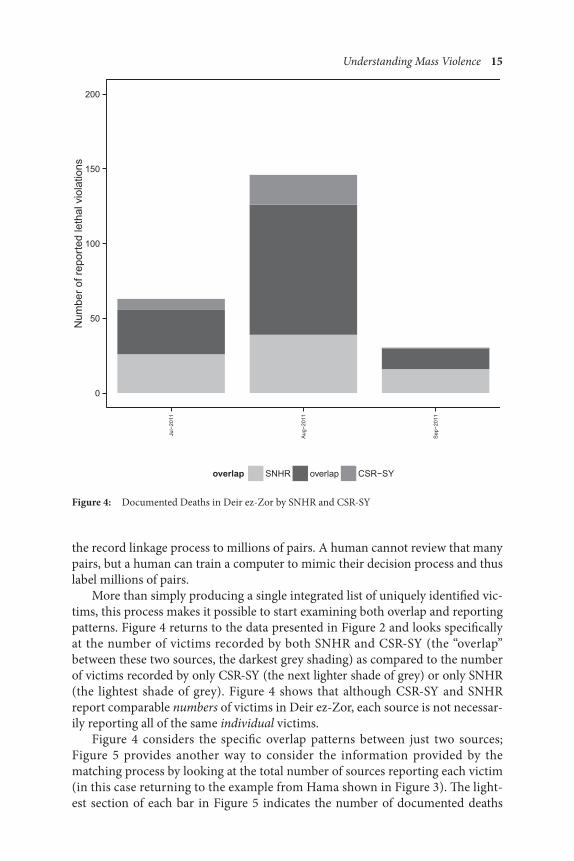
More than simply producing a single integrated list of uniquely identifi ed vic-
tims, this process makes it possible to start examining both overlap and reporting
patterns. Figure 4 returns to the data presented in Figure 2 and looks specifi cally
at the number of victims recorded by both SNHR and CSR-SY (the “overlap”
between these two sources, the darkest grey shading) as compared to the number
of victims recorded by only CSR-SY (the next lighter shade of grey) or only SNHR
(the lightest shade of grey). Figure 4 shows that although CSR-SY and SNHR
report comparable numbers of victims in Deir ez-Zor, each source is not necessar-
ily reporting all of the same individual victims.
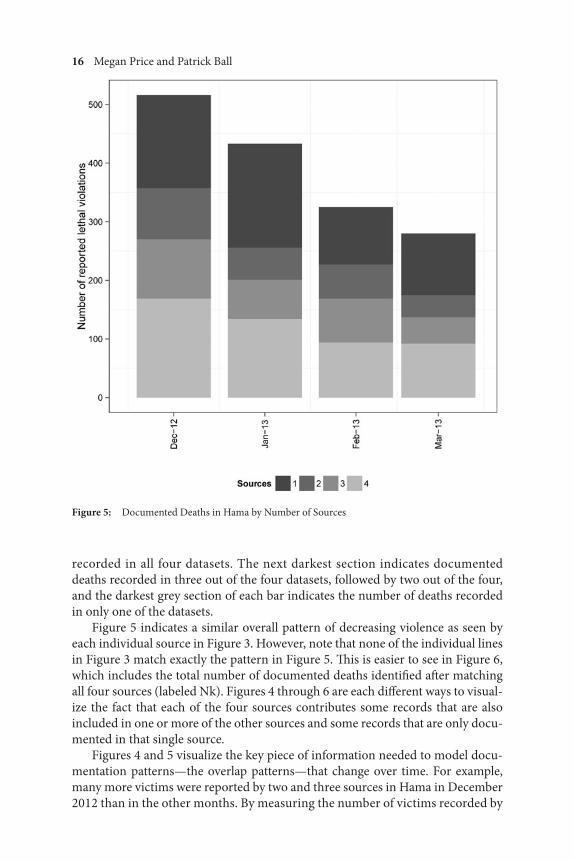
Figure 4 considers the specifi c overlap patterns between just two sources;
Figure 5 provides another way to consider the information provided by the
matching process by looking at the total number of sources reporting each victim
(in this case returning to the example from Hama shown in Figure 3 ). Th e light-
est section of each bar in Figure 5 indicates the number of documented deaths
Figure 4: Documented Deaths in Deir ez-Zor by SNHR and CSR-SY
16 Megan Price and Patrick Ball
Figure 5: Documented Deaths in Hama by Number of Sources
recorded in all four datasets. The next darkest section indicates documented
deaths recorded in three out of the four datasets, followed by two out of the four,
and the darkest grey section of each bar indicates the number of deaths recorded
in only one of the datasets.
Figure 5 indicates a similar overall pattern of decreasing violence as seen by
each individual source in Figure 3 . However, note that none of the individual lines
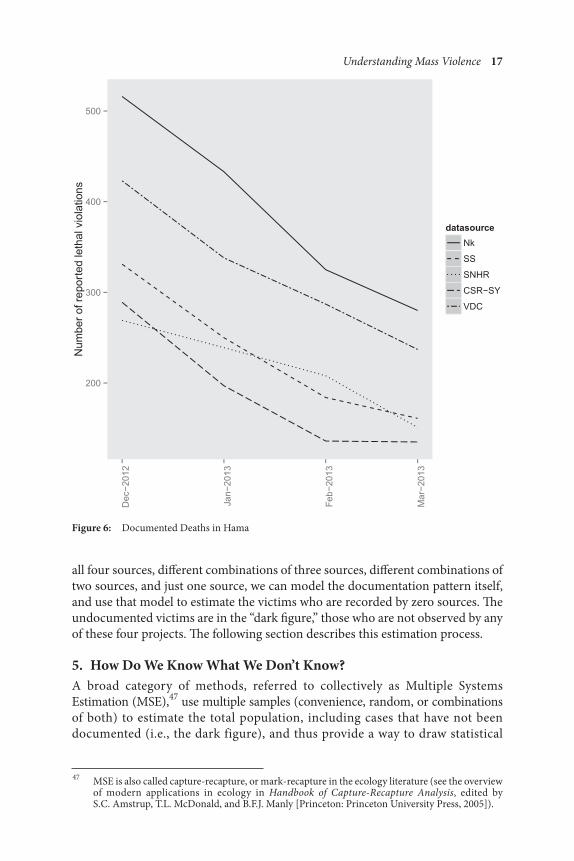
in Figure 3 match exactly the pattern in Figure 5 . Th is is easier to see in Figure 6 ,
which includes the total number of documented deaths identifi ed aft er matching
all four sources (labeled Nk). Figures 4 through 6 are each diff erent ways to visual-
ize the fact that each of the four sources contributes some records that are also
included in one or more of the other sources and some records that are only docu-
mented in that single source.
Figures 4 and 5 visualize the key piece of information needed to model docu-
mentation patterns—the overlap patterns—that change over time. For example,
many more victims were reported by two and three sources in Hama in December
2012 than in the other months. By measuring the number of victims recorded by
Understanding Mass Violence 17
Figure 6: Documented Deaths in Hama
all four sources, diff erent combinations of three sources, diff erent combinations of
two sources, and just one source, we can model the documentation pattern itself,
and use that model to estimate the victims who are recorded by zero sources. Th e
undocumented victims are in the “dark fi gure,” those who are not observed by any
of these four projects. Th e following section describes this estimation process.
5. How Do We Know What We Don’t Know?
A broad category of methods, referred to collectively as Multiple Systems
Estimation (MSE), 47
use multiple samples (convenience, random, or combinations
of both) to estimate the total population, including cases that have not been
documented (i.e., the dark figure), and thus provide a way to draw statistical
47
MSE is also called capture-recapture, or mark-recapture in the ecology literature (see the overview of modern applications in ecology in Handbook of Capture-Recapture Analysis , edited by S.C. Amstrup, T.L. McDonald, and B.F.J. Manly [Princeton: Princeton University Press, 2005]).
18 Megan Price and Patrick Ball
48
C.G.J. Petersen , “ Th e Yearly Immigration of Young Plaice Into the Limfj ord from the German Sea ,” Report of the Danish Biological Station(1895) 6 (1896): 5 – 84 .
49
F.C. Lincoln , “ Calculating Waterfowl Abundance on the Basis of Banding Returns ,” Circular 118 ( 1930 ): 1 – 4 .
50
C. Chandra Sekar and W. Edwards Deming , “ On a Method of Estimating Birth and Death Rates and the Extent of Registration ,” Journal of the American Statistical Association 245 ( 1949 ): 101 –15.
51
G.A.F. Seber , “ A Note on the Multiple Recapture Census ,” Biometrika 52 ( 1965 ): 249 –59. 52
Eli S. Marks , William Seltzer , and Karol J. Krótki , Population Growth Estimation: A Handbook of Vital Statistics Measurement (published by Th e Population Council, 1974 ).
53
John N. Darroch , Stephen E. Fienberg , Gary F. V. Glonek , and Brian W. Junker , “ A Th ree-Sample Multiple-Recapture Approach to Census Population Estimation with Heterogeneous Catchability ,” Journal of the American Statistical Association 88 ( 1993 ): 1137 –48.
54
Janet T. Wittes and Victor W. Sidel , “ A Generalization of the Simple Capture-Recapture Model with Applications to Epidemiological Research ,” Journal of Chronic Disease 21 ( 1968 ): 287 – 301 .
55
Janet T. Wittes , Th eodore Colton , and Victor W. Sidel , “ Capture-Recapture Methods for Assessing the Completeness of Case Ascertainment When Using Multiple Information Sources ,” Journal of Chronic Disease 27 ( 1974 ): 25 – 36 .
56
International Working Group for Disease Monitoring and Forecasting, “Capture-Recapture and Multiple-Record Systems Estimation I: History and Th eoretical Development,” American Journal of Epidemiology 142 (1995): 1047–58.
57
International Working Group for Disease Monitoring and Forecasting, “Capture-Recapture and Multiple-Record Systems Estimation II: Applications in Human Diseases,” American Journal of Epidemiology 142 (1995): 1059–68.
58
E.B. Hook and R.R. Regal , “ Accuracy of Alternative Approaches to Capture-Recapture Estimates of Disease Frequency: Internal Validity Analysis of Data from Five Sources ,” American Journal of Epidemiology 152 ( 2000 ): 771 –79.
59
George A.F. Seber , John T. Huakau , and David Simmons , “ Capture-Recapture, Epidemiology, and List Mismatches: Two Lists ,” Biometrics 56 ( 2000 ): 1227 –32.
60
Ball et al., “Killings and Refugee Flow in Kosovo, March-June 1999.” 61
Ball et al., “How Many Peruvians Have Died?” 62
Helge Brunborg , Torkild Hovde Lynstad , and Henrik Urdal , “ Accounting for Genocide: How Many Were Killed in Srebrenica? ” European Journal of Population 19 ( 2003 ): 229 –48.
63
Kristian Lum , Megan Price , Tamy Guberek , and Patrick Ball , “ Measuring Elusive Populations with Bayesian Model Averaging for Multiple Systems Estimation: A Case Study on Lethal Violations in Casanare, 1998–2007 ,” Statistics, Politics, and Policy 1 ( 2010 ).
64
Jan Zwierzchowski and Ewa Tabeau, “Th e Global Costs of Confl ict,” paper presented at the International Research Workshop, Berlin (2010).
65
D. Manrique-Vallier and S. Fienberg , “ Population Size Estimation Using Individual Level Mixture Models ,” Biometrical Journal 50 ( 2008 ): 1051 –63.
inferences. MSE has been developed over the past century in a variety of fi elds,
from ecology 48 , 49
to demography 50 , 51 , 52 , 53
to epidemiology 54 , 55 , 56 , 57 , 58 , 59
to human
rights. 60 , 61 , 62 , 63 , 64 , 65
This diversity of fields all rely on MSE methods to use the
observed pattern of overlaps, that is, events recorded in two or more samples, to
model the underlying population.
The work was initially developed in ecology as a way to estimate the size
of animal populations. Imagine wanting to know how many fish are in a lake,
denoted N. It certainly would not be reasonable to catch and count every single
individual fi sh, and it would be impossible to confi rm that every fi sh had been
caught. But it is possible to cast a net into the lake, catch some number of
fish, x, tag them, and throw them back. Repeating this process the following
day, we catch y fi sh. But of the y fi sh caught on the second day, some portion, z,
bear the tags from the previous day. Th ese three numbers, x, y, and z, can be used
to calculate an estimate of the total number of fi sh in the lake: N̂ = (x·y)/z (the
“hat” on the N indicates that it is an estimate). Th is total estimate will include all
those fish caught on either day as well as those never caught. In other words,
Understanding Mass Violence 19
the estimated total includes both observed and unobserved members of the
population.
Th is estimate, called the Lincoln-Petersen estimator (aft er the original research-
ers who derived it) assumes just two samples and requires some additional strong
assumptions, which are typically not met in human rights (or many other) applica-
tions. Fortunately, as described above, the broad category of MSE methods have
been expanded to apply to problems in a variety of fields, and this expansion
includes methods appropriate for three or more sources and allow for more
realistic assumptions (as well as ways to test how sensitive substantive conclusions
are to potential violations of those assumptions). 66
As these methods have been
applied in demography, public health, and ultimately human rights, multiple lists
of individuals have replaced the idea of captured animals. Th e process of linking
records, to determine whether multiple records refer to the same individual, has
replaced the idea of tagged animals. But the underlying mathematical theory
remains the same: patterns of overlapping observed records can be used to esti-
mate the size of an entire population.
MSE analyses provide estimates of the entire population, both observed and
unobserved. In doing so, the estimates control for many of the biases present in
the contributing sources. MSE estimates of the entire population are therefore
appropriate for precisely the kinds of comparative analyses described in the
preceding sections. With proper statistical inference, accounting for the undocu-
mented victims, we are able to determine if observed reporting patterns refl ect the
true pattern of violence.
Complete MSE analyses are still under development using a number of sources
documenting killings in Syria, including those described in the previous sections.
But our preliminary analyses, 67
much like our analyses of confl icts in other coun-
tries, 68
indicate that even in a seemingly well-documented confl ict, there are acts
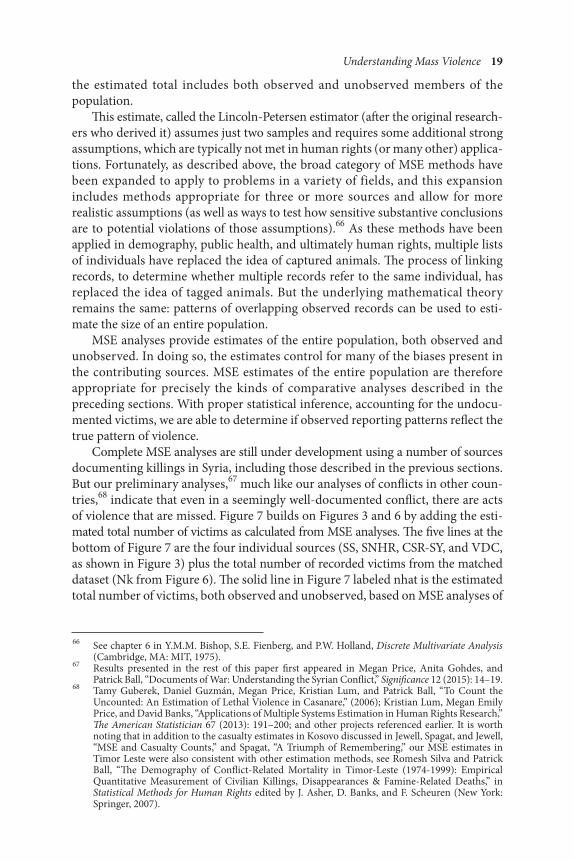
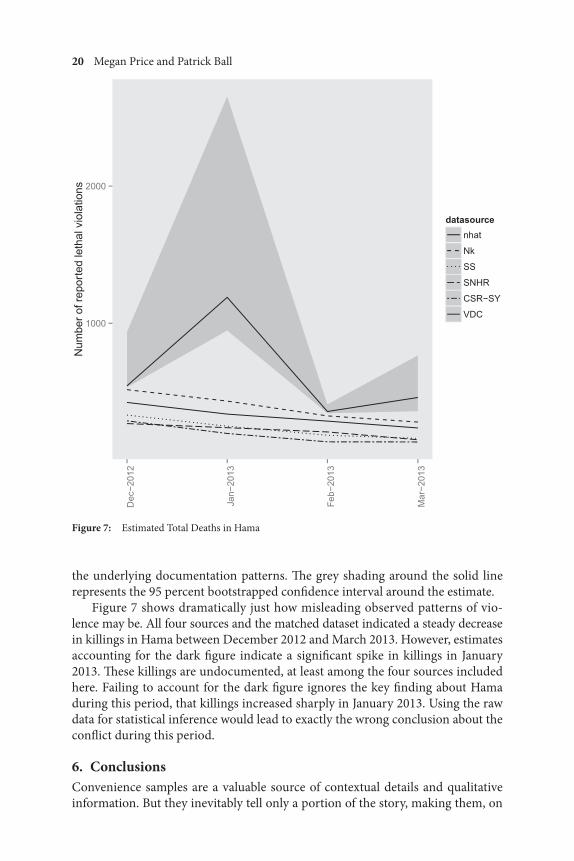
of violence that are missed. Figure 7 builds on Figures 3 and 6 by adding the esti-
mated total number of victims as calculated from MSE analyses. Th e fi ve lines at the
bottom of Figure 7 are the four individual sources (SS, SNHR, CSR-SY, and VDC,
as shown in Figure 3 ) plus the total number of recorded victims from the matched
dataset (Nk from Figure 6 ). Th e solid line in Figure 7 labeled nhat is the estimated
total number of victims, both observed and unobserved, based on MSE analyses of
66
See chapter 6 in Y.M.M. Bishop , S.E. Fienberg , and P.W. Holland , Discrete Multivariate Analysis ( Cambridge, MA : MIT , 1975 ).
67
Results presented in the rest of this paper fi rst appeared in Megan Price, Anita Gohdes, and Patrick Ball, “Documents of War: Understanding the Syrian Confl ict,” Signifi cance 12 (2015): 14–19.
68
Tamy Guberek, Daniel Guzmán, Megan Price, Kristian Lum, and Patrick Ball, “To Count the Uncounted: An Estimation of Lethal Violence in Casanare,” (2006); Kristian Lum, Megan Emily Price, and David Banks, “Applications of Multiple Systems Estimation in Human Rights Research,” Th e American Statistician 67 (2013): 191–200; and other projects referenced earlier. It is worth noting that in addition to the casualty estimates in Kosovo discussed in Jewell, Spagat, and Jewell, “MSE and Casualty Counts,” and Spagat, “A Triumph of Remembering,” our MSE estimates in Timor Leste were also consistent with other estimation methods, see Romesh Silva and Patrick Ball , “ Th e Demography of Confl ict-Related Mortality in Timor-Leste (1974-1999): Empirical Quantitative Measurement of Civilian Killings, Disappearances & Famine-Related Deaths ,” in Statistical Methods for Human Rights edited by J. Asher , D. Banks , and F. Scheuren ( New York : Springer , 2007 ).
20 Megan Price and Patrick Ball
the underlying documentation patterns. Th e grey shading around the solid line
represents the 95 percent bootstrapped confi dence interval around the estimate.
Figure 7 shows dramatically just how misleading observed patterns of vio-
lence may be. All four sources and the matched dataset indicated a steady decrease
in killings in Hama between December 2012 and March 2013. However, estimates
accounting for the dark fi gure indicate a signifi cant spike in killings in January
2013. Th ese killings are undocumented, at least among the four sources included
here. Failing to account for the dark fi gure ignores the key fi nding about Hama
during this period, that killings increased sharply in January 2013. Using the raw
data for statistical inference would lead to exactly the wrong conclusion about the
confl ict during this period.
6. Conclusions
Convenience samples are a valuable source of contextual details and qualitative
information. But they inevitably tell only a portion of the story, making them, on
Figure 7: Estimated Total Deaths in Hama
Understanding Mass Violence 21
their own, insuffi cient for the kinds of comparisons that are frequently of interest
to transitional justice researchers. Notably, collectors of convenience samples are
nearly always knowledgeable and forthright about the incompleteness of their
datasets. For example, reports from SNHR frequently include the following state-
ment: “It is noteworthy that there are many cases that we were unable to reach and
document particularly in the case of massacres and besieged areas where the
Syrian government frequently blocks communication.” Estimation provides a way
to include these undocumented victims in transitional justice mechanisms. If we
cannot name all the victims, the least we can do is count them.
Appropriate quantitative analyses that account for the hidden dark fi gure of
violence have the potential to contribute to transitional justice mechanisms via
empirical evidence supporting the memory of victims, allocating proportional
responsibility among perpetrators, determining legal responsibility, and develop-
ing historical memory and clarity. Such comparisons are only supported by
complete data (e.g., a census), randomly selected data (such as a survey), or
projections from multiple sources via statistical modeling (such as MSE or other
post-stratifi cation methods).
Although examples of censuses and randomly sampled data exist in the fi elds
of human rights and transitional justice research, they are rare and relatively
expensive. We should not abandon quantitative analyses when the only available
data are convenience samples, but we also should not naïvely treat these samples
as if they are complete or predictably incomplete. Inadequate data analyses that
fail to account for what is missing in observed data can confuse decision-making.
As demonstrated in the example above from Hama, bad statistics are worse than
no statistics. They hide what we do not know behind a presentation of seduc-
tive but false precision. Questions driven by transitional justice goals are too
important to get wrong; we owe it to victims, witnesses, and communities transi-
tioning out of confl ict to apply the best methods of all of our disciplines to get
these answers right.
Megan Price
Director of Research
Human Rights Data Analysis Group
Patrick Ball
Executive Director
Human Rights Data Analysis Group