Embed Size (px)
Citation preview
at SciVerse ScienceDirect
Social Science & Medicine 75 (2012) 1811e1819
Contents lists available
Social Science & Medicine
journal homepage: www.elsevier .com/locate/socscimed
Canadian family physicians’ decision to collaborate: Age, period and cohort effects
Sisira Sarma a,*, Rose Anne Devlin b, Amardeep Thind a,c, Man-Kee Chu d
aDepartment of Epidemiology and Biostatistics, University of Western Ontario, London, ON, CanadabDepartment of Economics, University of Ottawa, Ottawa, ON, CanadacDepartment of Family Medicine, University of Western Ontario, London, ON, CanadadDepartment of Statistical and Actuarial Sciences, University of Western Ontario, London, ON, Canada
a r t i c l e i n f o
Article history:Available online 4 August 2012
Keywords:Primary careCollaborationInter-professional teamMultivariate probitCanada
* Corresponding author. Department of EpidemiUniversity of Western Ontario, Kresge Building, RoomN6A 5C1. Tel.: þ1 519 661 2111x87583; fax: þ1 519 6
E-mail addresses: [email protected] (S. Sa(R.A. Devlin), [email protected] (A. Thind), mchu5@uw
0277-9536/$ e see front matter � 2012 Elsevier Ltd.http://dx.doi.org/10.1016/j.socscimed.2012.07.028
a b s t r a c t
One of the core primary care reform initiatives seen across provinces in Canada is the introduction ofinter-professional primary healthcare teams in which family physicians are encouraged to collaboratewith other health professionals. Although a higher proportion of physicians are collaborating withvarious health professionals now compared to the previous decade, a substantial number of physiciansstill do not work in a collaborative setting. The objective of this paper is to examine the age, period andcohort effects of Canadian family physicians’ decisions to collaborate with seven types of healthprofessionals: specialists, nurse practitioners, nurses, dieticians, physiotherapists, psychologists andoccupational therapists. To this end, this paper employs a multivariate probit model consisting of sevenequations and a cross-classified fixed-effects strategy to explain the collaborative decisions of familyphysicians. Utilizing three cross-sectional physician surveys from Canada over the 2001e2007 period,cohorts are defined over five-year intervals according to their year of graduation from medical school.We find that newer cohorts of physicians are more likely to collaborate with dieticians, physiotherapists,psychologists and occupational therapists; newer female cohorts are more likely to collaborate withnurses while newer male cohorts are less likely to collaborate with nurses but more likely to collaboratewith specialists. Older physicians are more likely to collaborate with specialists, physiotherapists,psychologists, and occupational therapists; the age effect for nurses is U-shaped for male physicianswhile it is inverse U-shaped for females. Family physicians are collaborating more with all seven healthprofessionals in 2004 and 2007 compared to 2001. Belonging to a group practice has a largely positiveinfluence on collaborations; and being paid by a fee-for-service remuneration scheme exerts a negativeinfluence on collaboration, ceteris paribus. The findings suggest that combining a non-fee-for-serviceremuneration arrangement with a group practice structure would facilitate effective collaboration.
� 2012 Elsevier Ltd. All rights reserved.
Introduction
The Canadian healthcare system is publicly financed throughtaxation but privately delivered; patients pay none of the costs atthe point of care. The management and delivery of health servicesto the general population are the responsibility of the respectiveprovincial/territorial governments. The healthcare system, knownas Medicare, is partially financed by the federal government andgoverned by national principles of universality, comprehensive-ness, equitable access, public administration, and portability. Inpractice, comprehensiveness is restricted to the vast majority of
ology and Biostatistics, TheK201, London, ON, Canada
61 3766.rma), [email protected] (M.-K. Chu).
All rights reserved.
medically necessary services provided by physicians and hospitals(Marchildon, 2005). Public coverage for pharmaceuticals, homecare, long-term care, and non-physicians’ services is limited withvarying degrees of generosity across jurisdictions. Family physi-cians or general practitioners are typically the initial contact personfor most patients. A fee-for-service physician payment system hasdominated the Canadian landscape since the inception of Medicarein 1966. However, by the 1990s, a host of problems emerged in thehealthcare system, including increased costs, longer wait-times,lack of access to family physicians’ services, especially after-hoursand weekend care (Hutchison, Levesque, Strumpf, & Coyle, 2011).As a result, primary healthcare reform was introduced in early2000s in order to ensure around the clock access to essentialmedical services by the most appropriate provider in the mostappropriate settings, and effective coordination of healthcareservices to achieve health promotion, illness prevention, andchronic disease management (HCC, 2009).

S. Sarma et al. / Social Science & Medicine 75 (2012) 1811e18191812
One important aspect of recent primary healthcare reforminitiatives across Canadian provinces has been the fostering ofcollaborative interdisciplinary teams. The impetus for such reformsstems, at least in part, from two high-profile national reports,Romanow (2002) and Kirby (2002), from which emerged thePrimary Health Care Transition Fund and the financing of theinterdisciplinary collaboration designed to enhance the prospectsand options for more collaborative primary healthcare across thecountry (EICP, 2006). This initiative targeted the core elements thataffect interdisciplinary collaboration with the view to encouragingthe formation of healthcare teams consisting of family physicians,specialists, nurses, nurse practitioners, pharmacists, dieticians,physiotherapists and psychologists, and the like, in order toenhance the delivery of high quality primary care (Barrett, Curran,Glynn, & Godwin, 2007; Pringle, Levitt, Horsburgh, Wilson, &Whittaker, 2000).
Although some studies in the literature find only negligibleeffects of collaborative practice on patient outcomes (Gene-Badiaet al., 2008; Grumbach & Bodenheimer, 2004; Howard, Goertzen,Hutchison, Kaczorowski, & Morris, 2007; Tourigny et al., 2010),collaboration is generally viewed positively in the delivery ofprimary healthcare services to the population. Collaborative teamshave been linked to a wide range of benefits to patients such asimproved access to comprehensive primary care, better coordina-tion of care, continuity of care, patient-centered care, better chronicdisease management, and higher levels of satisfaction amongpatients and providers, as well as the efficient use of healthcareservices (Barrett et al., 2007; Berendsen et al., 2006; Ezekowitz, vanWalraven, McAlister, Armstrong, & Kaul, 2005; Grumbach &Bodenheimer, 2004; Khan, McIntosh, Sanmartin, Watson, & Leeb,2008; Taylor, Oberle, Crutcher, & Norton, 2005; Tourigny et al.,2010). Consequently, all provinces in Canada have taken measuresto encourage family physicians to collaborate with other healthcareprofessionals.
Over the period of interest to this paper, 2001e2007, the formalcollaborative-based primary care models introduced in the prov-inces of Ontario, Quebec and Alberta came with substantial finan-cial incentives to motivate physicians to join a team. For instance,the Primary Care Network was introduced in Alberta in 2005 inwhich physicians collaborate with nurses, dieticians, socialworkers, mental health workers and pharmacists; by January 2011,39 of these Networks, with an average of 58 physicians each, werein operation (Hutchison et al., 2011). Similarly, Quebec has seen theemergence of 219 Family Medicine Groups involving 3177 familyphysicians since 2002; since 2005 physicians in Ontario haveformed some 200 Family Health Teams comprising over 1700family physicians and more than1400 allied health professionals(Hutchison et al., 2011; MOHLTC, 2002). To date, all provinces haveintroduced some form of collaborative practice models (CFPC,2009; HCC, 2009).
Early evidence suggests that team-based models of primary carehave had a positive impact on accessibility, coordination of care,comprehensiveness of care and delivery of preventive healthcareservices (Hutchison et al., 2011). Evidence from Ontario suggeststhat the advent of Family Health Teams has resulted in a substantialincrease in the average net income of participating family physi-cians: from an average of $180,000 to $250,000 for practices with1400 patients (Rosser, Colwill, Kasperski, & Wilson, 2011). Asidefrom better financial incentives embedded in these team-basedprimary care delivery models, there may be other, non-financial,factors influencing physicians’ decisions to collaborate. Becausethe formation of a team is driven primarily by family physicians, it isimportant to understand the factors influencing their collaborationdecisions. This paper focuses on the key role played by individualfamily physicians in the implementation of interdisciplinary teams.
One potentially important factor which to date has been largelyignored in the literature is the influence of cohort on the practicedecisions of physicians: the behavior of the group of physicians thatgraduated in 1980 for example, is likely to be different from thosewho graduated in 2000, controlling for all other influences. Thesecohort effects are to be distinguished from the effect of the age ofthe physician on practice choices. Finally, the time period in ques-tion may also affect behavior, especially over the past decade or sowhen important government initiatives have influenced physicianchoices. The primary objective of this study, therefore, is to examinethese cohort, age and period effects on the decision of familyphysicians to collaborate with one or more of seven types of healthprofessionals (specialists, nurse practitioners, nurses, dieticians/nutritionists, physiotherapists, psychologists, and occupationaltherapists) while accounting for other contextual factors.
Why collaborate?
Several papers have looked at the pros and cons associated withthe development and successful implementation of interdisci-plinary teams. Inter-professional collaboration requires mutualunderstanding of the roles played by different disciplines, witheach seeing different facets of the patients’ needs and the type ofresponses necessary to address these needs (D’amour & Oandasan,2005). Successful collaborations can lead to improved care(Berendsen, Benneker, Meyboom-de Jong, Klazinga, & Schuling,2007; Berendsen et al., 2006): it was found, for instance, thatpatients with heart failure receive significantly better care whenfollowed by a family physician working collaboratively witha specialist (Ezekowitz et al., 2005). Taylor et al. (2005) report thatthe quality-of-life of type 2 diabetes patients may improve whenthey receive care from a nurse and consultation with a nutritionistin addition to standard medical care. Other benefits potentiallyarising from collaborative care include decreased wait-times anddecreased pressure on physician’s time (Berendsen et al., 2006).
From the perspective of the healthcare professional, working inan interdisciplinary team can promote innovative ways ofapproaching patient care (D’amour & Oandasan, 2005). It has alsopurported to lead to less isolation and burnout, and increased worksatisfaction and quality of work life (Herbert et al., 2007). However,successful collaborations are not always easy. Difficulties in collab-oration include issues around team dynamics, the contributions ofthe team members, scheduling and revenue sharing (Berendsenet al., 2007; Delva et al., 2008; Kvarnstrom, 2008; Oandasan et al.,2009). In interdisciplinary teams, professional boundaries canbecome problematic as they may promote a competitive mindsetamong professionals rather than creating a cooperative spirit(D’amour & Oandasan, 2005); disputes may arise when teammembers overstep professional boundaries (Kvarnstrom, 2008).
Data and methods
Our study focuses on the responses from family physicians in the2001 National Family PhysicianWorkforce Survey (NFPWS) and the2004 and 2007 National Physician Surveys (NPS). Since the NFPWSand NPS micro data without personal information were requested,ethics approval was not required by the NPS data agreement. Theresponse rates for 2001 NFPWS, 2004 NPS and 2007 NPS were 51%,36% and 32%, respectively. Data are weighted to account for anynon-response bias in the NFPWS and 2007 NPS. The pooled datafrom these three surveys contain information from 33,583 familyphysicians in 10 provinces. (Appendix A of Sarma, Thind, & Chu,2011 provides a detailed description of these three surveys.)
We excluded 907 records with missing information on year ofgraduation from medical schools, missing values for age (234

Table 1Distribution of observations by year and cohort (n ¼ 20,710).
Cohort 2001 2004 2007
Male Female Male Female Male Female
1960e1964 165 33 30 13 0 01965e1969 558 114 356 77 73 211970e1974 963 247 730 204 275 651975e1979 1173 518 855 432 322 1621980e1984 1000 762 778 591 323 2411985e1989 839 797 707 645 265 2711990e1994 614 751 621 607 231 2261995e1999 309 484 503 702 170 2232000e2004 0 0 135 229 101 199
Total 5621 3706 4715 3500 1760 1408
S. Sarma et al. / Social Science & Medicine 75 (2012) 1811e1819 1813
observations), marital status (213 observations), internationalmedical graduate status (516 observations), fee-for-service (870observations) and practicing province (20 observations). Wedropped 8761 records with missing information on any collabora-tion indicator variable in any survey year. 143 observations wereexcluded because the age cohort contained fewer than 20 obser-vations. We limited our analysis to physicians between 25 and 64years old, resulting in the exclusion of 1209 additional records. Ourfinal sample used in this analysis has 20,710 observations (12,096males and 8614 females).
As we are particularly interested in examining the cohort effectsof the decision to collaborate on the part of family physicians,cohorts were created by gender according to the year of graduation
Table 2Variable definitions.
Variable Definition
Outcome variablesSpecialist Collaborates with specialists ¼ 1, otherwise ¼ 0Nurse practitioner Collaborates with nurse practitioners ¼ 1, otherwise ¼ 0Nurse (any type) Collaborates with registered nurses or other nurses ¼ 1,Dieticians Collaborates with dieticians or nutritionists ¼ 1, otherwPhysiotherapist Collaborates with physiotherapists ¼ 1, otherwise ¼ 0Psychologist Collaborates with psychologists ¼ 1, otherwise ¼ 0Occupational therapist Collaborates with occupational therapists ¼ 1, otherwise
Explanatory variablesAge Age in completed years (age group: 25e64)2004 2004 survey year ¼ 1, 2001 survey year ¼ 02007 2007 survey year ¼ 1, 2001 survey year ¼ 01965e1969 Cohort: graduated during 1965e1969 ¼ 1, graduated du1970e1974 Cohort: graduated during 1970e74 ¼ 1, graduated durin1975e1979 Cohort: graduated during 1975e1979 ¼ 1, graduated du1980e1985 Cohort: graduated during 1980e1985 ¼ 1, graduated du1985e1989 Cohort: graduated during 1985e1989 ¼ 1, graduated du1990e1994 Cohort: graduated during 1990e1994 ¼ 1, graduated du1995e1999 Cohort: graduated during 1995e1999 ¼ 1, graduated du2000e2004 Cohort: graduated during 2000e2004 ¼ 1, graduated duFemale Female ¼ 1, male ¼ 0Married Married/living with partner ¼ 1, single or separated or dIMG International medical graduate ¼ 1, Canadian medical grGroup Group physician practice ¼ 1, solo practice ¼ 0Unknown Practice type was not stated or missing ¼ 1, solo practicFFS 90%þ of income is obtained from fee-for-service ¼ 1, othRural Population served by the physician’s practice is small toOther Population served by the physician’s practice is neitherNL Newfoundland and Labrador ¼ 1, Ontario ¼ 0PEI Prince Edward Island ¼ 1, Ontario ¼ 0NS Nova Scotia ¼ 1, Ontario ¼ 0NB New Brunswick ¼ 1, Ontario ¼ 0Que Quebec ¼ 1, Ontario ¼ 0MB Manitoba ¼ 1, Ontario ¼ 0SK Saskatchewan ¼ 1, Ontario ¼ 0AB Alberta ¼ 1, Ontario ¼ 0BC British Columbia ¼ 1, Ontario ¼ 0
from medical school in five-year intervals from 1960 to 2000 (forphysicians between 25 and 64 years old in each survey year). Thesample sizes of the cohorts by survey year and gender are reportedin Table 1. It is of course striking, but not surprising, to see theevolution of the gender distribution of these cohorts: 83% ofphysicians belonging to the 1960e1964 cohort were male in the2001 survey, while the 2000e2004 cohort contains almost twice asmany female physicians as males in the 2007 survey.
In addition to the three main variables of interest e the age ofthe physician, cohort and period e our analysis includes a numberof contextual variables, such as gender, marital status, whether ornot physician is an international medical school graduate, whetherthe physician worked in a group with other family physicians ora solo practice, his or hermode of remuneration and the province ofpractice location. Table 2 provides the definitions of all of thevariables used in the analysis, and Table 3 provides the corre-sponding descriptive statistics.
Several trends are apparent in our dataset. The proportion ofphysicians collaborating with each type of health professional isincreasing over the years, consistent with the primary care reformsinitiated across the provinces. As expected, our data show that thephysician population is aging. The proportion of family physiciansobtaining 90% or more of their professional income from a fee-for-service payment declined from 69% to 47% during this period e atrend reflecting the shift toward alternative to fee-for-servicepayments in Canada’s healthcare system (CIHI, 2008). Most of theother physician demographics and practice characteristics arerelatively stable over the 2001e2007 period.
otherwise ¼ 0ise ¼ 0
¼ 0
ring 1960e1964 ¼ 0g 1960e64 ¼ 0ring 1960e1964 ¼ 0ring 1960e1964 ¼ 0ring 1960e1964 ¼ 0ring 1960e1964 ¼ 0ring 1960e1964 ¼ 0ring 1960e1964 ¼ 0
ivorced ¼ 0aduate ¼ 0
e ¼ 0erwise ¼ 0
wn, rural, geographically isolated/remote ¼ 1, inner city or urban/suburban ¼ 0urban nor rural (i.e., undefined or missing) ¼ 1, inner city or urban/suburban ¼ 0
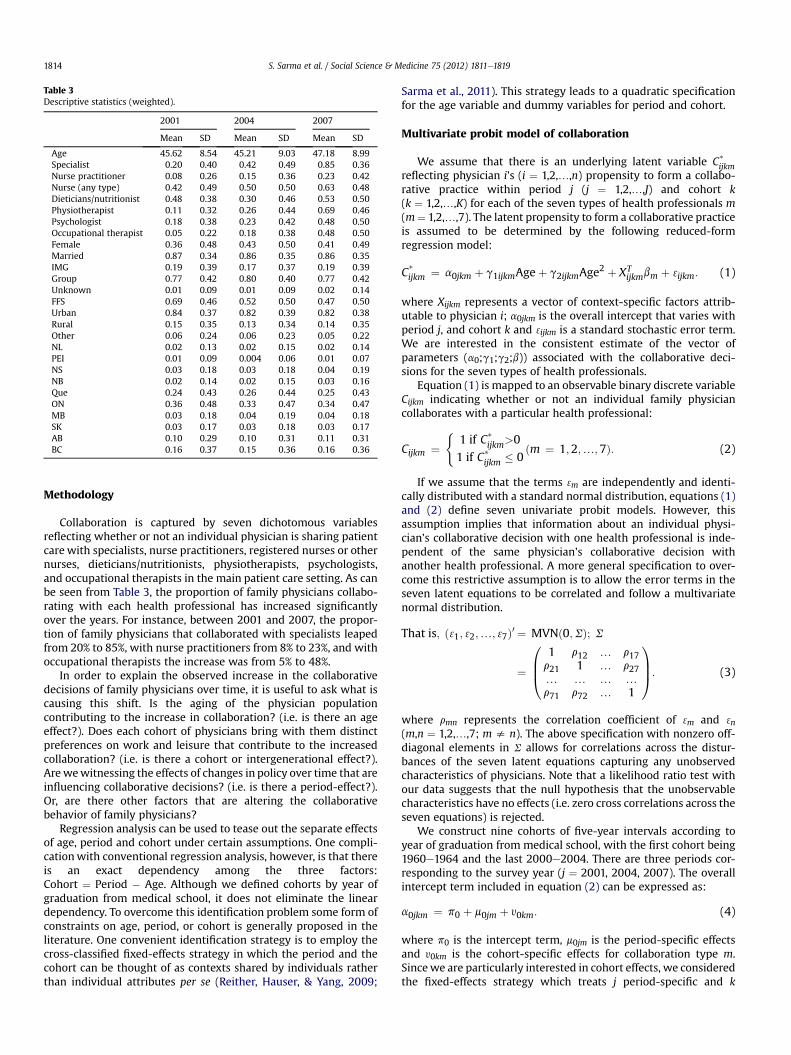
Table 3Descriptive statistics (weighted).
2001 2004 2007
Mean SD Mean SD Mean SD
Age 45.62 8.54 45.21 9.03 47.18 8.99Specialist 0.20 0.40 0.42 0.49 0.85 0.36Nurse practitioner 0.08 0.26 0.15 0.36 0.23 0.42Nurse (any type) 0.42 0.49 0.50 0.50 0.63 0.48Dieticians/nutritionist 0.48 0.38 0.30 0.46 0.53 0.50Physiotherapist 0.11 0.32 0.26 0.44 0.69 0.46Psychologist 0.18 0.38 0.23 0.42 0.48 0.50Occupational therapist 0.05 0.22 0.18 0.38 0.48 0.50Female 0.36 0.48 0.43 0.50 0.41 0.49Married 0.87 0.34 0.86 0.35 0.86 0.35IMG 0.19 0.39 0.17 0.37 0.19 0.39Group 0.77 0.42 0.80 0.40 0.77 0.42Unknown 0.01 0.09 0.01 0.09 0.02 0.14FFS 0.69 0.46 0.52 0.50 0.47 0.50Urban 0.84 0.37 0.82 0.39 0.82 0.38Rural 0.15 0.35 0.13 0.34 0.14 0.35Other 0.06 0.24 0.06 0.23 0.05 0.22NL 0.02 0.13 0.02 0.15 0.02 0.14PEI 0.01 0.09 0.004 0.06 0.01 0.07NS 0.03 0.18 0.03 0.18 0.04 0.19NB 0.02 0.14 0.02 0.15 0.03 0.16Que 0.24 0.43 0.26 0.44 0.25 0.43ON 0.36 0.48 0.33 0.47 0.34 0.47MB 0.03 0.18 0.04 0.19 0.04 0.18SK 0.03 0.17 0.03 0.18 0.03 0.17AB 0.10 0.29 0.10 0.31 0.11 0.31BC 0.16 0.37 0.15 0.36 0.16 0.36
S. Sarma et al. / Social Science & Medicine 75 (2012) 1811e18191814
Methodology
Collaboration is captured by seven dichotomous variablesreflecting whether or not an individual physician is sharing patientcare with specialists, nurse practitioners, registered nurses or othernurses, dieticians/nutritionists, physiotherapists, psychologists,and occupational therapists in the main patient care setting. As canbe seen from Table 3, the proportion of family physicians collabo-rating with each health professional has increased significantlyover the years. For instance, between 2001 and 2007, the propor-tion of family physicians that collaborated with specialists leapedfrom 20% to 85%, with nurse practitioners from 8% to 23%, and withoccupational therapists the increase was from 5% to 48%.
In order to explain the observed increase in the collaborativedecisions of family physicians over time, it is useful to ask what iscausing this shift. Is the aging of the physician populationcontributing to the increase in collaboration? (i.e. is there an ageeffect?). Does each cohort of physicians bring with them distinctpreferences on work and leisure that contribute to the increasedcollaboration? (i.e. is there a cohort or intergenerational effect?).Arewewitnessing the effects of changes in policy over time that areinfluencing collaborative decisions? (i.e. is there a period-effect?).Or, are there other factors that are altering the collaborativebehavior of family physicians?
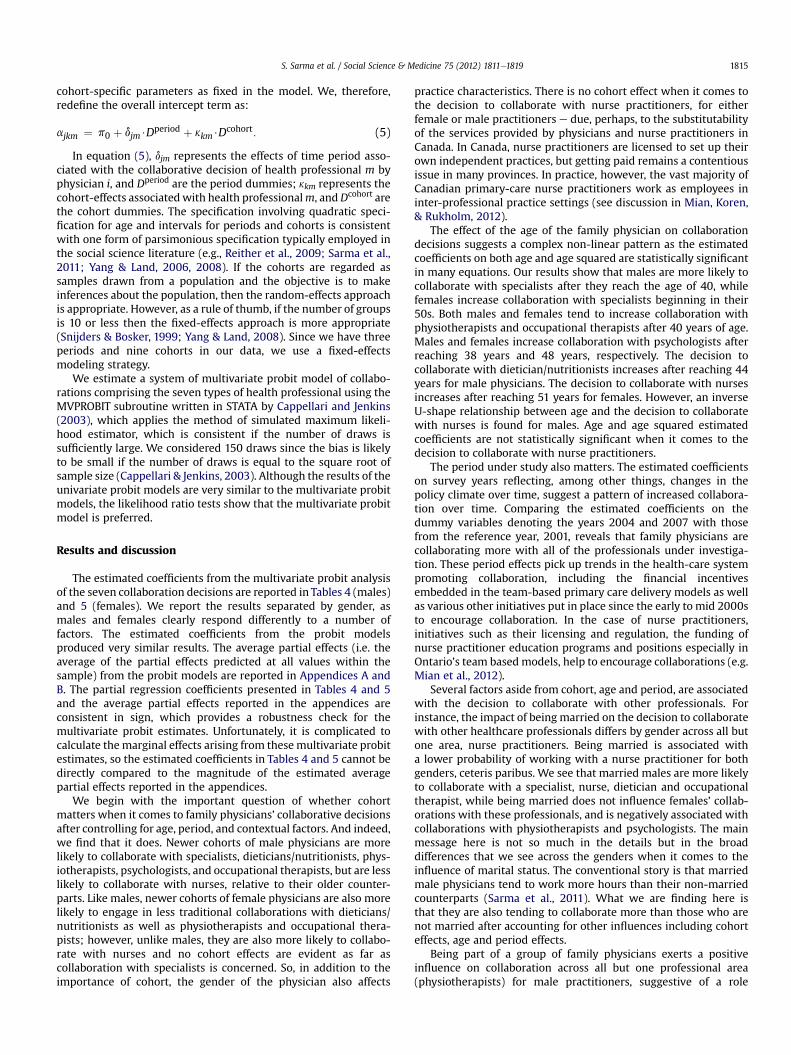
Regression analysis can be used to tease out the separate effectsof age, period and cohort under certain assumptions. One compli-cationwith conventional regression analysis, however, is that thereis an exact dependency among the three factors:Cohort ¼ Period � Age. Although we defined cohorts by year ofgraduation from medical school, it does not eliminate the lineardependency. To overcome this identification problem some form ofconstraints on age, period, or cohort is generally proposed in theliterature. One convenient identification strategy is to employ thecross-classified fixed-effects strategy in which the period and thecohort can be thought of as contexts shared by individuals ratherthan individual attributes per se (Reither, Hauser, & Yang, 2009;
Sarma et al., 2011). This strategy leads to a quadratic specificationfor the age variable and dummy variables for period and cohort.
Multivariate probit model of collaboration
We assume that there is an underlying latent variable C*ijkm
reflecting physician i’s (i ¼ 1,2,.,n) propensity to form a collabo-rative practice within period j (j ¼ 1,2,.,J) and cohort k(k ¼ 1,2,.,K) for each of the seven types of health professionals m(m¼ 1,2,.,7). The latent propensity to form a collaborative practiceis assumed to be determined by the following reduced-formregression model:
C*ijkm ¼ a0jkm þ g1ijkmAgeþ g2ijkmAge
2 þ XTijkmbm þ 3ijkm: (1)
where Xijkm represents a vector of context-specific factors attrib-utable to physician i; a0jkm is the overall intercept that varies withperiod j, and cohort k and 3ijkm is a standard stochastic error term.We are interested in the consistent estimate of the vector ofparameters (a0;g1;g2;b)) associated with the collaborative deci-sions for the seven types of health professionals.
Equation (1) is mapped to an observable binary discrete variableCijkm indicating whether or not an individual family physiciancollaborates with a particular health professional:
Cijkm ¼(
1 if C*ijkm>0
1 if C*ijkm � 0
ðm ¼ 1;2;.;7Þ: (2)
If we assume that the terms 3m are independently and identi-cally distributed with a standard normal distribution, equations (1)and (2) define seven univariate probit models. However, thisassumption implies that information about an individual physi-cian’s collaborative decision with one health professional is inde-pendent of the same physician’s collaborative decision withanother health professional. A more general specification to over-come this restrictive assumption is to allow the error terms in theseven latent equations to be correlated and follow a multivariatenormal distribution.
That is; ð 31; 32;.; 37Þ0 ¼ MVNð0;SÞ; S
¼
0BB@
1 r12 . r17r21 1 . r27. . . .r71 r72 . 1
1CCA: (3)
where rmn represents the correlation coefficient of 3m and 3n
(m,n ¼ 1,2,.,7; m s n). The above specification with nonzero off-diagonal elements in S allows for correlations across the distur-bances of the seven latent equations capturing any unobservedcharacteristics of physicians. Note that a likelihood ratio test withour data suggests that the null hypothesis that the unobservablecharacteristics have no effects (i.e. zero cross correlations across theseven equations) is rejected.
We construct nine cohorts of five-year intervals according toyear of graduation from medical school, with the first cohort being1960e1964 and the last 2000e2004. There are three periods cor-responding to the survey year (j ¼ 2001, 2004, 2007). The overallintercept term included in equation (2) can be expressed as:
a0jkm ¼ p0 þ m0jm þ y0km: (4)
where p0 is the intercept term, m0jm is the period-specific effectsand y0km is the cohort-specific effects for collaboration type m.Sincewe are particularly interested in cohort effects, we consideredthe fixed-effects strategy which treats j period-specific and k
S. Sarma et al. / Social Science & Medicine 75 (2012) 1811e1819 1815
cohort-specific parameters as fixed in the model. We, therefore,redefine the overall intercept term as:
ajkm ¼ p0 þ djm$Dperiod þ kkm$D
cohort: (5)
In equation (5), djm represents the effects of time period asso-ciated with the collaborative decision of health professional m byphysician i, and Dperiod are the period dummies; kkm represents thecohort-effects associatedwith health professionalm, andDcohort arethe cohort dummies. The specification involving quadratic speci-fication for age and intervals for periods and cohorts is consistentwith one form of parsimonious specification typically employed inthe social science literature (e.g., Reither et al., 2009; Sarma et al.,2011; Yang & Land, 2006, 2008). If the cohorts are regarded assamples drawn from a population and the objective is to makeinferences about the population, then the random-effects approachis appropriate. However, as a rule of thumb, if the number of groupsis 10 or less then the fixed-effects approach is more appropriate(Snijders & Bosker, 1999; Yang & Land, 2008). Since we have threeperiods and nine cohorts in our data, we use a fixed-effectsmodeling strategy.
We estimate a system of multivariate probit model of collabo-rations comprising the seven types of health professional using theMVPROBIT subroutine written in STATA by Cappellari and Jenkins(2003), which applies the method of simulated maximum likeli-hood estimator, which is consistent if the number of draws issufficiently large. We considered 150 draws since the bias is likelyto be small if the number of draws is equal to the square root ofsample size (Cappellari & Jenkins, 2003). Although the results of theunivariate probit models are very similar to the multivariate probitmodels, the likelihood ratio tests show that the multivariate probitmodel is preferred.
Results and discussion
The estimated coefficients from the multivariate probit analysisof the seven collaboration decisions are reported in Tables 4 (males)and 5 (females). We report the results separated by gender, asmales and females clearly respond differently to a number offactors. The estimated coefficients from the probit modelsproduced very similar results. The average partial effects (i.e. theaverage of the partial effects predicted at all values within thesample) from the probit models are reported in Appendices A andB. The partial regression coefficients presented in Tables 4 and 5and the average partial effects reported in the appendices areconsistent in sign, which provides a robustness check for themultivariate probit estimates. Unfortunately, it is complicated tocalculate the marginal effects arising from these multivariate probitestimates, so the estimated coefficients in Tables 4 and 5 cannot bedirectly compared to the magnitude of the estimated averagepartial effects reported in the appendices.
We begin with the important question of whether cohortmatters when it comes to family physicians’ collaborative decisionsafter controlling for age, period, and contextual factors. And indeed,we find that it does. Newer cohorts of male physicians are morelikely to collaborate with specialists, dieticians/nutritionists, phys-iotherapists, psychologists, and occupational therapists, but are lesslikely to collaborate with nurses, relative to their older counter-parts. Like males, newer cohorts of female physicians are also morelikely to engage in less traditional collaborations with dieticians/nutritionists as well as physiotherapists and occupational thera-pists; however, unlike males, they are also more likely to collabo-rate with nurses and no cohort effects are evident as far ascollaboration with specialists is concerned. So, in addition to theimportance of cohort, the gender of the physician also affects
practice characteristics. There is no cohort effect when it comes tothe decision to collaborate with nurse practitioners, for eitherfemale or male practitioners e due, perhaps, to the substitutabilityof the services provided by physicians and nurse practitioners inCanada. In Canada, nurse practitioners are licensed to set up theirown independent practices, but getting paid remains a contentiousissue in many provinces. In practice, however, the vast majority ofCanadian primary-care nurse practitioners work as employees ininter-professional practice settings (see discussion in Mian, Koren,& Rukholm, 2012).
The effect of the age of the family physician on collaborationdecisions suggests a complex non-linear pattern as the estimatedcoefficients on both age and age squared are statistically significantin many equations. Our results show that males are more likely tocollaborate with specialists after they reach the age of 40, whilefemales increase collaboration with specialists beginning in their50s. Both males and females tend to increase collaboration withphysiotherapists and occupational therapists after 40 years of age.Males and females increase collaboration with psychologists afterreaching 38 years and 48 years, respectively. The decision tocollaborate with dietician/nutritionists increases after reaching 44years for male physicians. The decision to collaborate with nursesincreases after reaching 51 years for females. However, an inverseU-shape relationship between age and the decision to collaboratewith nurses is found for males. Age and age squared estimatedcoefficients are not statistically significant when it comes to thedecision to collaborate with nurse practitioners.
The period under study also matters. The estimated coefficientson survey years reflecting, among other things, changes in thepolicy climate over time, suggest a pattern of increased collabora-tion over time. Comparing the estimated coefficients on thedummy variables denoting the years 2004 and 2007 with thosefrom the reference year, 2001, reveals that family physicians arecollaborating more with all of the professionals under investiga-tion. These period effects pick up trends in the health-care systempromoting collaboration, including the financial incentivesembedded in the team-based primary care delivery models as wellas various other initiatives put in place since the early to mid 2000sto encourage collaboration. In the case of nurse practitioners,initiatives such as their licensing and regulation, the funding ofnurse practitioner education programs and positions especially inOntario’s team basedmodels, help to encourage collaborations (e.g.Mian et al., 2012).
Several factors aside from cohort, age and period, are associatedwith the decision to collaborate with other professionals. Forinstance, the impact of being married on the decision to collaboratewith other healthcare professionals differs by gender across all butone area, nurse practitioners. Being married is associated witha lower probability of working with a nurse practitioner for bothgenders, ceteris paribus. We see that married males are more likelyto collaborate with a specialist, nurse, dietician and occupationaltherapist, while being married does not influence females’ collab-orations with these professionals, and is negatively associated withcollaborations with physiotherapists and psychologists. The mainmessage here is not so much in the details but in the broaddifferences that we see across the genders when it comes to theinfluence of marital status. The conventional story is that marriedmale physicians tend to work more hours than their non-marriedcounterparts (Sarma et al., 2011). What we are finding here isthat they are also tending to collaborate more than those who arenot married after accounting for other influences including cohorteffects, age and period effects.
Being part of a group of family physicians exerts a positiveinfluence on collaboration across all but one professional area(physiotherapists) for male practitioners, suggestive of a role

Table 4Family physicians’ collaborative practice decision: multivariate probit estimates (males: 25e64 years old).
Variables (1) Specialist (2) Nursepractitioner
(3) Nurse(any type)
(4) Dietician/nutritionist
(5) Physiotherapist (6) Psychologisttherapist
(7) Occupational
AgeAge �0.040*** (0.012) �0.005 (0.015) 0.019* (0.011) �0.061*** (0.012) �0.081*** (0.012) �0.053*** (0.013) �0.131*** (0.013)Age squared 0.0005*** (0.0001) 0.0001 (0.0002) �0.0003** (0.0001) 0.0007*** (0.0001) 0.0009*** (0.0001) 0.0007*** (0.0001) 0.0015*** (0.0001)
Cohort1960e1964
(reference)1965e1969 0.131 (0.081) 0.066 (0.114) �0.182*** (0.069) 0.285*** (0.084) 0.138 (0.096) 0.357*** (0.095) 0.516*** (0.107)1970e1974 0.122 (0.082) 0.118 (0.114) �0.325*** (0.070) 0.446*** (0.085) 0.295*** (0.096) 0.422*** (0.096) 0.696*** (0.107)1975e1979 0.255*** (0.086) 0.057 (0.118) �0.281*** (0.075) 0.492*** (0.089) 0.400*** (0.100) 0.581*** (0.100) 0.764*** (0.111)1980e1984 0.291*** (0.092) 0.105 (0.124) �0.277*** (0.080) 0.514*** (0.095) 0.399*** (0.105) 0.625*** (0.104) 0.813*** (0.116)1985e1989 0.285*** (0.096) 0.121 (0.128) �0.249*** (0.084) 0.523*** (0.098) 0.414*** (0.109) 0.579*** (0.109) 0.855*** (0.120)1990e1994 0.350*** (0.099) 0.155 (0.132) �0.206** (0.087) 0.365*** (0.103) 0.350*** (0.113) 0.504*** (0.112) 0.808*** (0.123)1995e1999 0.356*** (0.103) 0.175 (0.136) �0.171* (0.091) 0.495*** (0.106) 0.431*** (0.116) 0.492*** (0.116) 0.892*** (0.127)2000e2004 0.187* (0.112) 0.182 (0.144) �0.174* (0.101) 0.386*** (0.114) 0.172 (0.123) 0.222* (0.126) 0.465*** (0.135)
Year2001 (reference)2004 0.639*** (0.018) 0.300*** (0.025) 0.086*** (0.017) 0.306*** (0.019) 0.508*** (0.020) 0.223*** (0.021) 0.577*** (0.024)2007 1.888*** (0.023) 0.686*** (0.027) 0.488*** (0.020) 1.023*** (0.022) 1.742*** (0.023) 1.026*** (0.023) 1.623*** (0.026)
DemographicMarried 0.120*** (0.024) �0.110*** (0.025) 0.096*** (0.021) 0.075*** (0.023) 0.010 (0.022) 0.014 (0.024) 0.052** (0.024)IMG 0.107*** (0.018) 0.282*** (0.020) �0.107*** (0.017) 0.042** (0.018) �0.033* (0.019) �0.014 (0.019) 0.085*** (0.019)
PracticeSolo (reference)Group 0.127*** (0.017) 0.304*** (0.022) 0.236*** (0.016) 0.166*** (0.018) �0.011 (0.018) 0.164*** (0.018) �0.040** (0.018)Unknown 0.327*** (0.078) 0.101 (0.079) 0.558*** (0.065) �0.030 (0.071) �0.126* (0.070) �0.022 (0.071) 0.018 (0.074)FFS �0.086*** (0.015) �0.586*** (0.017) �0.333*** (0.014) �0.226*** (0.015) �0.117*** (0.015) �0.016 (0.015) �0.281*** (0.015)Urban (reference)Rural �0.341*** (0.020) 0.185*** (0.022) 0.104*** (0.019) 0.039** (0.019) 0.000 (0.020) �0.088*** (0.020) �0.064*** (0.021)Other 0.087*** (0.030) 0.059* (0.036) 0.043 (0.029) �0.032 (0.030) 0.017 (0.031) 0.003 (0.031) �0.136*** (0.036)
ProvinceNL 0.053 (0.046) 0.324*** (0.047) �0.248*** (0.045) 0.365*** (0.046) 0.207*** (0.050) 0.097* (0.050) 0.313*** (0.049)PEI 0.357*** (0.091) �0.955*** (0.159) 0.511*** (0.092) �0.271*** (0.099) 0.118 (0.091) �0.077 (0.104) 0.115 (0.103)NS 0.230*** (0.041) �0.286*** (0.052) �0.133*** (0.038) �0.151*** (0.042) 0.119*** (0.041) 0.427*** (0.039) 0.189*** (0.043)NB 0.247*** (0.046) �0.122** (0.056) 0.172*** (0.045) 0.142*** (0.048) 0.112** (0.050) 0.388*** (0.047) 0.359*** (0.050)Que 0.501*** (0.020) 0.397*** (0.022) �0.122*** (0.018) 0.766*** (0.019) 0.558*** (0.019) 1.144*** (0.020) 0.762*** (0.020)ON (reference)MB 0.387*** (0.040) �0.001 (0.042) 0.010 (0.034) 0.234*** (0.035) 0.264*** (0.038) 0.094** (0.038) 0.522*** (0.038)SK 0.152*** (0.039) 0.065 (0.045) 0.089** (0.038) 0.211*** (0.040) 0.296*** (0.039) 0.060 (0.043) 0.297*** (0.044)AB 0.050** (0.025) 0.023 (0.029) 0.175*** (0.024) �0.002 (0.024) �0.038 (0.026) 0.077*** (0.026) 0.198*** (0.027)BC �0.059*** (0.021) �0.306*** (0.028) �0.147*** (0.020) �0.165*** (0.022) 0.026 (0.022) �0.078*** (0.023) 0.072*** (0.023)Constant �0.558* (0.289) �1.623*** (0.354) �0.214 (0.269) �0.485* (0.290) 0.086 (0.293) �1.090*** (0.318) 0.244 (0.315)Log likelihood ¼ �1,15,189.53
Estimated S
r 1 r 2 r 3 r 4 r 5 r 6 r 7r 1 0.220*** (0.011) 0.321*** (0.008) 0.550*** (0.008) 0.625*** (0.007) 0.491*** (0.008) 0.557*** (0.008)r 2 0.286*** (0.010) 0.372*** (0.009) 0.268*** (0.010) 0.251*** (0.010) 0.309*** (0.010)r 3 0.449*** (0.008) 0.435*** (0.008) 0.266*** (0.009) 0.495*** (0.008)r 4 0.778*** (0.005) 0.668*** (0.006) 0.765*** (0.005)r 5 0.673*** (0.006) 0.904*** (0.003)r 6 0.631*** (0.007)
Likelihood ratio test of r 21 ¼ r 31 ¼ r 41 ¼ r 51 ¼ r 61 ¼ r 71 ¼ r 32 ¼ r 42 ¼ r 52 ¼ r 62 ¼ r 72 ¼ r 43 ¼ r 53 ¼ r 63 ¼ r 73 ¼ r 54 ¼ r 64 ¼ r 74 ¼ r 65 ¼ r 75 ¼ r 76 ¼ 0: c2
(21) ¼ 44,295 Prob > c2 ¼ 0.0000.Obs. ¼ 39,272.Robust standard errors in parentheses.***p < 0.01, **p < 0.05, *p < 0.1.
S. Sarma et al. / Social Science & Medicine 75 (2012) 1811e18191816
played by group membership on collaboration. Either the fact thatthe individual physician is part of a group reflects his proclivity towork with others, or being part of a group renders it more desir-able/less costly to collaborate across disciplines. One can easilyimagine that if, say, a psychologist collaborates with physician Athen it would be straightforward for him or her to collaborate withphysician B who is part of the same practice group. Female physi-cians who are in a group practice are a bit less swayed to collaboratefurther e for these doctors, membership in a group is associatedwith collaborations with nurse practitioners, nurses and dieticiansonly, and not with the other health professionals.
Virtually across the board, physicians paid by a fee-for-servicescheme are less likely to work with other professionals relative tothose paid in another manner. This result holds for both men andwomen. These findings confirm that the mode of physician remu-neration significantly impacts collaboration with other healthprofessionals. In order to promote collaborations for fee-for-servicephysicians, at least in the Canadian context, additional incentivesare required. In fact, this appears to be one of the important reasonsas to why the province of Ontario introduced a variety of newprimary care delivery models in which fee-for-service familyphysicians were given financial incentives geared at encouraging
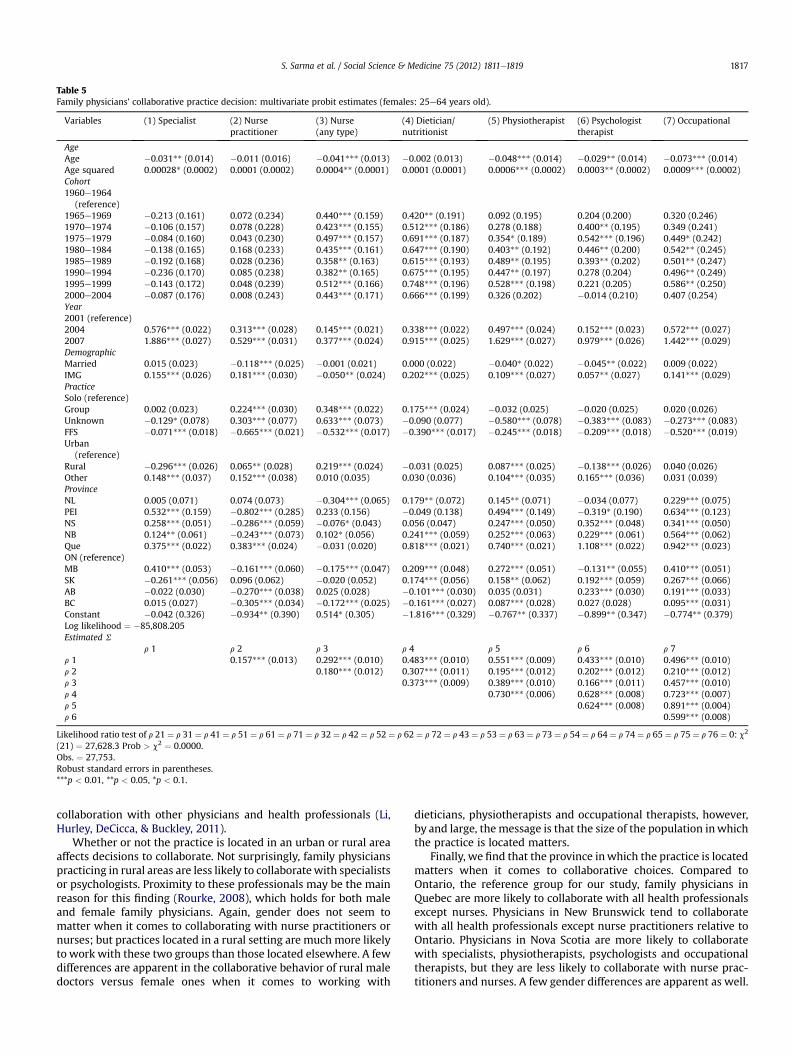
Table 5Family physicians’ collaborative practice decision: multivariate probit estimates (females: 25e64 years old).
Variables (1) Specialist (2) Nursepractitioner
(3) Nurse(any type)
(4) Dietician/nutritionist
(5) Physiotherapist (6) Psychologisttherapist
(7) Occupational
AgeAge �0.031** (0.014) �0.011 (0.016) �0.041*** (0.013) �0.002 (0.013) �0.048*** (0.014) �0.029** (0.014) �0.073*** (0.014)Age squared 0.00028* (0.0002) 0.0001 (0.0002) 0.0004** (0.0001) 0.0001 (0.0001) 0.0006*** (0.0002) 0.0003** (0.0002) 0.0009*** (0.0002)Cohort1960e1964
(reference)1965e1969 �0.213 (0.161) 0.072 (0.234) 0.440*** (0.159) 0.420** (0.191) 0.092 (0.195) 0.204 (0.200) 0.320 (0.246)1970e1974 �0.106 (0.157) 0.078 (0.228) 0.423*** (0.155) 0.512*** (0.186) 0.278 (0.188) 0.400** (0.195) 0.349 (0.241)1975e1979 �0.084 (0.160) 0.043 (0.230) 0.497*** (0.157) 0.691*** (0.187) 0.354* (0.189) 0.542*** (0.196) 0.449* (0.242)1980e1984 �0.138 (0.165) 0.168 (0.233) 0.435*** (0.161) 0.647*** (0.190) 0.403** (0.192) 0.446** (0.200) 0.542** (0.245)1985e1989 �0.192 (0.168) 0.028 (0.236) 0.358** (0.163) 0.615*** (0.193) 0.489** (0.195) 0.393** (0.202) 0.501** (0.247)1990e1994 �0.236 (0.170) 0.085 (0.238) 0.382** (0.165) 0.675*** (0.195) 0.447** (0.197) 0.278 (0.204) 0.496** (0.249)1995e1999 �0.143 (0.172) 0.048 (0.239) 0.512*** (0.166) 0.748*** (0.196) 0.528*** (0.198) 0.221 (0.205) 0.586** (0.250)2000e2004 �0.087 (0.176) 0.008 (0.243) 0.443*** (0.171) 0.666*** (0.199) 0.326 (0.202) �0.014 (0.210) 0.407 (0.254)Year2001 (reference)2004 0.576*** (0.022) 0.313*** (0.028) 0.145*** (0.021) 0.338*** (0.022) 0.497*** (0.024) 0.152*** (0.023) 0.572*** (0.027)2007 1.886*** (0.027) 0.529*** (0.031) 0.377*** (0.024) 0.915*** (0.025) 1.629*** (0.027) 0.979*** (0.026) 1.442*** (0.029)DemographicMarried 0.015 (0.023) �0.118*** (0.025) �0.001 (0.021) 0.000 (0.022) �0.040* (0.022) �0.045** (0.022) 0.009 (0.022)IMG 0.155*** (0.026) 0.181*** (0.030) �0.050** (0.024) 0.202*** (0.025) 0.109*** (0.027) 0.057** (0.027) 0.141*** (0.029)PracticeSolo (reference)Group 0.002 (0.023) 0.224*** (0.030) 0.348*** (0.022) 0.175*** (0.024) �0.032 (0.025) �0.020 (0.025) 0.020 (0.026)Unknown �0.129* (0.078) 0.303*** (0.077) 0.633*** (0.073) �0.090 (0.077) �0.580*** (0.078) �0.383*** (0.083) �0.273*** (0.083)FFS �0.071*** (0.018) �0.665*** (0.021) �0.532*** (0.017) �0.390*** (0.017) �0.245*** (0.018) �0.209*** (0.018) �0.520*** (0.019)Urban
(reference)Rural �0.296*** (0.026) 0.065** (0.028) 0.219*** (0.024) �0.031 (0.025) 0.087*** (0.025) �0.138*** (0.026) 0.040 (0.026)Other 0.148*** (0.037) 0.152*** (0.038) 0.010 (0.035) 0.030 (0.036) 0.104*** (0.035) 0.165*** (0.036) 0.031 (0.039)ProvinceNL 0.005 (0.071) 0.074 (0.073) �0.304*** (0.065) 0.179** (0.072) 0.145** (0.071) �0.034 (0.077) 0.229*** (0.075)PEI 0.532*** (0.159) �0.802*** (0.285) 0.233 (0.156) �0.049 (0.138) 0.494*** (0.149) �0.319* (0.190) 0.634*** (0.123)NS 0.258*** (0.051) �0.286*** (0.059) �0.076* (0.043) 0.056 (0.047) 0.247*** (0.050) 0.352*** (0.048) 0.341*** (0.050)NB 0.124** (0.061) �0.243*** (0.073) 0.102* (0.056) 0.241*** (0.059) 0.252*** (0.063) 0.229*** (0.061) 0.564*** (0.062)Que 0.375*** (0.022) 0.383*** (0.024) �0.031 (0.020) 0.818*** (0.021) 0.740*** (0.021) 1.108*** (0.022) 0.942*** (0.023)ON (reference)MB 0.410*** (0.053) �0.161*** (0.060) �0.175*** (0.047) 0.209*** (0.048) 0.272*** (0.051) �0.131** (0.055) 0.410*** (0.051)SK �0.261*** (0.056) 0.096 (0.062) �0.020 (0.052) 0.174*** (0.056) 0.158** (0.062) 0.192*** (0.059) 0.267*** (0.066)AB �0.022 (0.030) �0.270*** (0.038) 0.025 (0.028) �0.101*** (0.030) 0.035 (0.031) 0.233*** (0.030) 0.191*** (0.033)BC 0.015 (0.027) �0.305*** (0.034) �0.172*** (0.025) �0.161*** (0.027) 0.087*** (0.028) 0.027 (0.028) 0.095*** (0.031)Constant �0.042 (0.326) �0.934** (0.390) 0.514* (0.305) �1.816*** (0.329) �0.767** (0.337) �0.899** (0.347) �0.774** (0.379)Log likelihood ¼ �85,808.205Estimated S
r 1 r 2 r 3 r 4 r 5 r 6 r 7r 1 0.157*** (0.013) 0.292*** (0.010) 0.483*** (0.010) 0.551*** (0.009) 0.433*** (0.010) 0.496*** (0.010)r 2 0.180*** (0.012) 0.307*** (0.011) 0.195*** (0.012) 0.202*** (0.012) 0.210*** (0.012)r 3 0.373*** (0.009) 0.389*** (0.010) 0.166*** (0.011) 0.457*** (0.010)r 4 0.730*** (0.006) 0.628*** (0.008) 0.723*** (0.007)r 5 0.624*** (0.008) 0.891*** (0.004)r 6 0.599*** (0.008)
Likelihood ratio test of r 21 ¼ r 31 ¼ r 41 ¼ r 51 ¼ r 61 ¼ r 71 ¼ r 32 ¼ r 42 ¼ r 52 ¼ r 62 ¼ r 72 ¼ r 43 ¼ r 53 ¼ r 63 ¼ r 73 ¼ r 54 ¼ r 64 ¼ r 74 ¼ r 65 ¼ r 75 ¼ r 76 ¼ 0: c2
(21) ¼ 27,628.3 Prob > c2 ¼ 0.0000.Obs. ¼ 27,753.Robust standard errors in parentheses.***p < 0.01, **p < 0.05, *p < 0.1.
S. Sarma et al. / Social Science & Medicine 75 (2012) 1811e1819 1817
collaboration with other physicians and health professionals (Li,Hurley, DeCicca, & Buckley, 2011).
Whether or not the practice is located in an urban or rural areaaffects decisions to collaborate. Not surprisingly, family physicianspracticing in rural areas are less likely to collaboratewith specialistsor psychologists. Proximity to these professionals may be the mainreason for this finding (Rourke, 2008), which holds for both maleand female family physicians. Again, gender does not seem tomatter when it comes to collaborating with nurse practitioners ornurses; but practices located in a rural setting are much more likelyto work with these two groups than those located elsewhere. A fewdifferences are apparent in the collaborative behavior of rural maledoctors versus female ones when it comes to working with
dieticians, physiotherapists and occupational therapists, however,by and large, the message is that the size of the population inwhichthe practice is located matters.
Finally, we find that the province inwhich the practice is locatedmatters when it comes to collaborative choices. Compared toOntario, the reference group for our study, family physicians inQuebec are more likely to collaborate with all health professionalsexcept nurses. Physicians in New Brunswick tend to collaboratewith all health professionals except nurse practitioners relative toOntario. Physicians in Nova Scotia are more likely to collaboratewith specialists, physiotherapists, psychologists and occupationaltherapists, but they are less likely to collaborate with nurse prac-titioners and nurses. A few gender differences are apparent as well.
S. Sarma et al. / Social Science & Medicine 75 (2012) 1811e18191818
Since the effects of policy changes over time are being picked up bythe period-effect, the associations with respect to the provincesmay arise primarily because of geographical heterogeneity at theprovincial level.
A few caveats should be kept in mind as one interprets theresults. Due to the limitations of the NPS surveys, we do not haveany patient level data and are therefore unable to control for anypatient levels factors that could potentially affect the collaborativebehavior of physicians. For example, if the patient population isaging, it is more likely to develop multiple morbidities, thusrequiring greater collaboration with specialists. Another limitationis that we had to restrict our analysis of collaborations to thoseprofessionals for which we had information across the threesample years: 2001, 2004 and 2007. Thus, we did not look atcollaborations with, for instance, midwifes and social workers asthis information was not available in the earlier surveys. Moreover,our collaboration variable is restricted to whether or not a familyphysician shares patient care within the main patient care setting,and the collaboration questions have subtly evolved over the yearswhichmay introduce some bias. Nonetheless, we are confident thatthe intent of the questions and our interpretation and use toconstruct the collaboration variables is broadly congruent.Although our collaboration variables pick up important elements ofthe inter-professional practice pattern, they may not include all ofthose components of collaboration that focus on the sharing ofclinical records and the development of guidelines and protocolswithin and beyond the main patient care setting. Finally, the surveyresponse rates are generally low which is typical with physiciansurveys. We are certain that the respondents have similar demo-graphic characteristics to the physician population, but someunknown bias with respect to the sample of physicians respondingto the questionnaire in each survey may exist.
Policy implications and conclusions
In Canada, we have observed a push toward encouraging familyphysicians to work in groups and/or collaborate more closely witha large variety of health professionals e a push that seems to haveemanated in large part from healthcare reform initiatives (Kirby,2002; Romanow, 2002). Here, we have focused on the role playedby the family physician in facilitating such collaborationwith sevenhealthcare professions. We employ econometric techniques to helpus untangle the effects of a variety of influences on the familyphysician e and in particular, on the role played by cohort, age andthe period under study.
The cohort in which the physician graduated does indeedinfluence his or her collaborative decisions. It may come as nosurprise to learn that newer physicians are more likely to collabo-rate with a much wider variety of professionals in comparison tothose who graduated earlier from medical school. From a policyperspective, this means that the take up rate for initiatives gearedat changing theway inwhich practices operate is likely to be higherfor the newer physicians. It could also indicate that a ‘virtuous’ cycleis at work, inwhich trainee physicians are taught by physicians whoare collaborating with other providers, and so the trainees seecollaboration as the norm, and thus incorporate it in their practices.Interestingly, even when we control for cohort, the age of thephysician also has an impact on collaborative decisions. So whileyounger cohorts are more likely to collaborate, once we take thiseffect into account, it is physicians aged around 40e50 years whoare more inclined to work with other professionals.
Since we had access to three physician surveys, we were able tolook at how collaboration has evolved over the period 2001e2007e and have found a clear, upward trend in collaboration betweenphysicians and all seven professional groups. In this sense, reforms
geared at encouraging collaborative behavior would appear to besuccessful. Of course, we have not been able to say anything aboutthe impact on patient care and outcomes as a result of thesereforms.
A key question for future research is the extent to which theinvestments in teams and collaboration have paid off in terms ofimproved patient outcomes. More collaborations appear to bebetter in some of the literature. Future research that is able tofollow the care provided by collaborative teams would providemuch needed input into the debate about investments in primarycare.
Acknowledgments
We would like to thank three anonymous reviewers for theirhelpful suggestions and comments which have improved themanuscript. Michael Lebenbaum provided capable research assis-tance. This study utilizes the 2001 National Family PhysicianWorkforce Survey (NFPWS), and the 2004 and 2007 NationalPhysician Surveys (NPS) micro data. The NPS project is co-led by theCollege of Family Physicians of Canada (CFPC), the CanadianMedical Association (CMA) and the Royal College of Physicians andSurgeons of Canada, and supported by the Canadian Institute forHealth Information, and Health Canada. Funding for researchthrough a MOHLTC Career Scientist Award given to Sisira Sarma isgratefully acknowledged. The views expressed in this paper,however, are those of the authors and do not necessarily reflect theviews of any affiliated organization.
Appendix A. Supplementary data
Supplementary data related to this article can be found at doi:10.1016/j.socscimed.2012.07.028.
References
Barrett, J., Curran, V., Glynn, L., & Godwin, M. (2007). CHSRF synthesis: Interprofes-sional collaboration and quality primary healthcare. Ottawa, Ontario, Canada:Canadian Health Services Research Foundation.
Berendsen, A., Benneker, W., Meyboom-de Jong, B., Klazinga, N., & Schuling, J.(2007). Motives and preferences of general practitioners for new collaborationmodels with medical specialists: a qualitative study. BMC Health ServicesResearch, 7(4).
Berendsen, A., Benneker, W., Schuling, J., Rijkers-Koorn, N., Slaets, J., & Meyboom-deJong, B. (2006). Collaboration with general practitioners: preferences of medicalspecialists e a qualitative study. BMC Health Services Research, 6(155).
Canadian Institute for Health Information (CIHI). (2008). Physicians in Canada: Thestatus of alternative payment programs, 2005e2006. Ottawa, Ontario, Canada:Canadian Institute for Health Information.
Cappellari, L., & Jenkins, S. (2003). Multivariate probit regression using simulatedmaximum likelihood. The Stata Journal, 3(3), 278e294.
College of Family Physicians of Canada (2009). Patient-centred primary care inCanada: Bring it on home, Discussion Paper, Ottawa, ON.
D’amour, D., & Oandasan, I. (2005). Interprofessionality as the field of interprofes-sional practice and interprofessional education: an emerging concept. Journal ofInterprofessional Care, 19(2), 8e20.
Delva, D., Tomalty, L., Macrae, K., Payne, P., Plain, E., & Rowe, W. (2008). A newmodel for collaborative continuing professional development. Journal of Inter-professional Care, 22(S1), 91e100.
Enhancing Interdisciplinary Collaboration in Primary Health Care (EICP) Initiative.(2006). Primary health care: A framework that fits. http://www.eicp.ca/en/.
Ezekowitz, J., van Walraven, C., McAlister, F., Armstrong, P., & Kaul, P. (2005). Impactof specialist follow-up in outpatients with congestive heart failure. CanadianMedical Association Journal, 172(2), 189e194.
Gene-Badia, J., Ascaso, C., Escaramis-Babiano, G., Catalan-Ramos, A., Pujol-Ribera, E.,& Sampietro-Colom, L. (2008). Population and primary health-care teamcharacteristics explain the quality of the service. Health Policy, 86, 335e344.
Grumbach, K., & Bodenheimer, T. (2004). Can health care teams improve primarycare practice? Journal of American Medical Association, 291(10), 1246e1251.
Health Council Canada (HCC). (2009). Teams in action: Primary health care teams forCanadians. www.healthcouncilcanada.ca.
Herbert, C., Bainbridge, L., Bickford, J., Baptiste, S., Brajtman, S., Dryden, T., et al.(2007). Factors that influence engagement in collaborative practice. CanadianFamily Physician, 53(8), 1318e1325.
S. Sarma et al. / Social Science & Medicine 75 (2012) 1811e1819 1819
Howard, M., Goertzen, J., Hutchison, B., Kaczorowski, J., & Morris, K. (2007). Patientsatisfaction with care for urgent health problems: a survey of family practicepatients. Annals of Family Medicine, 5(5), 419e424.
Hutchison, B., Levesque, J., Strumpf, E., & Coyle, N. (2011). Primary health care inCanada: systems in motion. Milbank Quarterly, 89(2), 256e288.
Khan, S., McIntosh, C., Sanmartin, C., Watson, D., & Leeb, K. (2008). Primary healthcare teams and their impact on processes and outcomes of care. Health Infor-mation and Research Division, Statistics Canada, 82-622-X No. 002.
Kirby, M. (October 2002). The health of CanadiansdThe federal role. Recommenda-tions for reform. Ottawa, Ontario, Canada: Standing Senate Committee on SocialAffairs, Science and Technology.
Kvarnstrom, S. (2008). Difficulties in collaboration: a critical incident study ofinterprofessional healthcare teamwork. Journal of Interprofessional Care, 22(2),191e203.
Li, J., Hurley, J., DeCicca, P., & Buckley, G. (2011). Physician response to pay-for-performancee evidencefromanaturalexperiment.NBERWorkingPaperNo.16909.
Marchildon, G. P. (2005). Health systems in transition: Canada. Copenhagen: WHORegional Office for Europe on Behalf of the European Observatory on HealthSystems and Policies.
Mian, O., Koren, I., & Rukholm, E. (2012). Nurse practitioners in Ontario primaryhealthcare: referral patterns and collaboration with other healthcare profes-sionals. Journal of Interprofessional Care, 26(3), 232e239.
Ministry of Health and Long-Term Care (MOHLTC). (2002). Family health teams.http://www.health.gov.on.ca/transformation/fht/fht_mn.html.
Oandasan, I., Conn, L., Lingard, L., Karim, A., Jakubovicz, D., Whitehead, C., et al.(2009). The impact of space and time on interprofessional teamwork in Cana-dian primary health care settings: implications for health care reform. PrimaryHealth Care Research and Development, 10, 151e162.
Pringle, D., Levitt, C., Horsburgh, M., Wilson, R., & Whittaker, M. (2000). Interdis-ciplinary collaboration and primary health care reform: statement from the
Ontario chairs of family medicine and the council of Ontario Universityprograms in nursing. Canadian Family Physician, 46, 763e765.
Reither, E., Hauser, R., & Yang, Y. (2009). Do birth cohorts matter?Ageeperiodecohort analyses of the obesity epidemic in the United States. SocialScience & Medicine, 69(10), 1439e1448.
Romanow, R. (November 2002). Building on values: The future of health care inCanada: Final report. Saskatoon, Saskatchewan, Canada: Commission on theFuture of Health Care.
Rosser, W., Colwill, J., Kasperski, J., & Wilson, L. (2011). Progress of Ontario’s familyhealth team model: a patient-centered medical home. Annals of Family Medi-cine, 9(2), 165e171.
Rourke, J. (2008). Increasing the number of rural physicians. Canadian MedicalAssociation Journal, 178(3), 322e324.
Sarma, S., Thind, A., & Chu, M. K. (2011). Do new cohorts of family physicians workless compared to their older predecessors? The evidence from Canada. SocialScience & Medicine, 72(12), 2049e2058.
Snijders, T., & Bosker, R. (1999). Multilevel analysis: An introduction to basic andadvanced multilevel modeling. Thousand Oaks, CA: Sage.
Taylor, K., Oberle, M., Crutcher, R., & Norton, P. (2005). Promoting health in type 2diabetes: nurseephysician collaboration in primary care. Biological Research forNursing, 6(3), 207e215.
Tourigny, A., Aubin, M., Haggerty, J., Bonin, L., Morin, D., Reinharz, D., et al. (2010).Patients’ perceptions of the quality of care after primary care reform. CanadianFamily Physician, 56(7), e273ee282.
Yang, Y., & Land, K. (2006). A mixed models approach to the ageeperiodecohortanalysis of repeated cross-section surveys, with an application to data on trendsin verbal test scores. Sociological Methodology, 36, 75e97.
Yang, Y., & Land, K. (2008). Ageeperiodecohort analysis of repeated cross-sectionsurveys: fixed or random effects? Sociological Methods and Research, 36(3),297e326.