Embed Size (px)
Citation preview

Quarterly Newsletter - April 2016
THE OPTIONS PLAYBOOK
Long Gold usingthe iShares Gold Bullion ETF (CGL)
Covered Calls onFranco Nevada (FNV)
p.6
MANAGER’SCOMMENTARY
p.3
CANADIAN EQUITYDERIVATIVES

2
2016 Trading Calendar
Patrick CeresnaPatrick Ceresna is the Chief Derivative Market Strategist for Learn To Trade Global (LTTG) and optionsource.net and has been a content provider and speaker for the Montreal Exchange for over 5 years. Patrick is a Chartered Market Technician (CMT), Derivative Market Specialist (DMS) and Canadian Investment Manager (CIM) by designation. Prior to becoming a partner at LTTG, Patrick spent ten years working at key financial firms in numerous trading roles including the trading of a large fund dedicated exclusively to options writing. Patrick specializes in analyzing the intermarket relationships of the broader derivatives market and the impact those trends have on trading and investment decision making.
GENERAL INFORMATION
For more information, please contactJosiane Lanoue, Senior Manager, Business Development, Equity Derivatives [email protected] or 514 871-3539
Expiration
Last trading day
Listing
Equity & ETFs options
Weekly options
Options on the US Dollar (USX)
S&P/TSX 60 Index Options (SXO)
A P R I L M A Y J U N E
S M T W T F SM T W T F S S M T W T FS S
10 11 12 13 14 15 16
3 4 5 6 7 8 9
1 2
17 18 19 20 21 22 23
24 25 26 27 28 29 30
15 16 17 18 19 20 21
8 9 10 11 12 13 14
1 2 3 4 5 6 7
22 23 24 25 26 27 28
12 13 14 15 16 17 18
5 6 7 8 9 10 11
1 2 3 4
19 20 21 22 23 24 25
26 27 28 29 3029 30 31

By Patrick Ceresna
3
THE MANAGER’S COMMENTARY
The hyper volatility in the currency markets have ushered in a heightened uncertainty about the future direction of the U.S. Dollar. No one currency pair exemplified the volatility more than the $0.10 swing lower and subsequently higher in the Canadian Dollar over the last 6 months. This has many Canadians asking “is the U.S. Dollar bull market over”?
Sep. Oct. Nov. Dec.
$0.6800
$0.7800
Jan. Feb. Mar. Apr. May
0.6700
0.6900
0.6800
0.7000
0.7100
0.7200
0.7300
0.7400
0.7500
0.7600
0.7700
0.7800
0.7900
Our evidence does not support it.
Our hypothesis is founded in the macro fundamental landscape of the slowing global economy and crisis’ that is forming around the world. What is that landscape?
1. A China credit bubble that has burst
2. Economic deterioration in Japan
3. Deflation and geopolitical uncertainty in Europe
3

44
THE MANAGER’S COMMENTARY
4. A commodity bear market driven by geopolitical uncertainly in the global energy markets
5. Emerging markets under material stress
So what is Janet Yellen to do? We have now seen a substantial shift at the Federal Open Market Committee (FOMC) driven by a changing narrative from a domestic employment and inflation focus to a narrative now focused on the deteriorating conditions in the global economy. This is no surprise to us. Many people assume a central bank is a central bank, but the American Federal Reserve is a special animal. It is special because the U.S. dollar remains the global reserve currency and the primary currency of global trade. Unlike any other central bank, the FOMC has substantial global implications for their monetary policy.
Understanding U.S. Considerations
Fact #1 – Over the last 70 years, the U.S. has designed and spearheaded a global financial system of trade centered on its currency.
Fact #2 – In order to spur global growth and trade, the U.S. must supply sufficient U.S. dollars to the world for that global trade to be conducted. The primary method of distribution of those U.S. dollars has traditionally been through America running a trade deficit, largely through the import of oil and basic goods. The alternative method of providing those dollars was through U.S. dollar denominated debt, often to emerging markets.
The divergent monetary policy between the FOMC vs. almost all other central banks around the world has ushered an unprecedented U.S. Dollar rally over the last 2 years, that has stressed the global economic system. Today, there is substantial stress coming from many emerging markets that are being required to maintain interest and principle repayments on their U.S. Dollar denominated debt in a substantially devalued domestic currency. But the biggest imbalance is very much centered on China. With China maintaining a fixed exchange rate to the U.S. dollar, it has endured a very strong currency for the last few years that has resulted in nothing short of a crisis in mainland China. This has led to an unprecedented decline in China’s reserves as reports have suggested the capital outflow has surpassed $1 trillion dollars in 2015. This capital outflow is evidence that market participants, particularly Chinese citizens know the situation is untenable and are very active in moving and investing as much money internationally while the Chinese government foolishly leaves the currency peg at unsustainably high levels.
The Bottom Line
1. The FOMC must balance the needs of the global market place with the needs of the domestic economy.
2. The FOMC is in a lose/lose scenario that will end badly. It needs to raise interest rates to maintain its credibility and the confidence of participants. However, at the same time, it cannot inadvertently cause a global crisis by not respecting the complexity of the global landscape and particularly China’s vulnerability.
So what has Janet Yellen and company done? They are trying to find the middle road, by weakening the U.S. dollar to give much needed relief the global players. Will it work? It is our opinion that this will fail.
55
THE MANAGER’S COMMENTARY
5
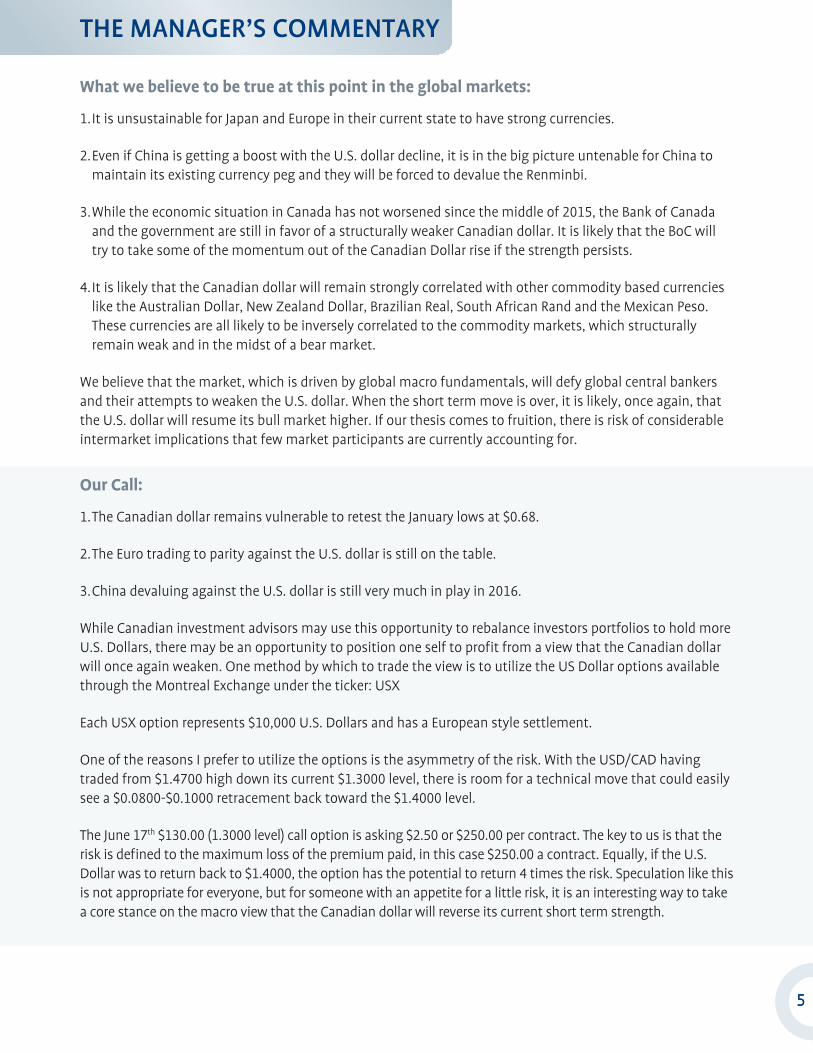
What we believe to be true at this point in the global markets:
1. It is unsustainable for Japan and Europe in their current state to have strong currencies.
2. Even if China is getting a boost with the U.S. dollar decline, it is in the big picture untenable for China to maintain its existing currency peg and they will be forced to devalue the Renminbi.
3. While the economic situation in Canada has not worsened since the middle of 2015, the Bank of Canada and the government are still in favor of a structurally weaker Canadian dollar. It is likely that the BoC will try to take some of the momentum out of the Canadian Dollar rise if the strength persists.
4. It is likely that the Canadian dollar will remain strongly correlated with other commodity based currencies like the Australian Dollar, New Zealand Dollar, Brazilian Real, South African Rand and the Mexican Peso. These currencies are all likely to be inversely correlated to the commodity markets, which structurally remain weak and in the midst of a bear market.
We believe that the market, which is driven by global macro fundamentals, will defy global central bankers and their attempts to weaken the U.S. dollar. When the short term move is over, it is likely, once again, that the U.S. dollar will resume its bull market higher. If our thesis comes to fruition, there is risk of considerable intermarket implications that few market participants are currently accounting for.
Our Call:
1. The Canadian dollar remains vulnerable to retest the January lows at $0.68.
2. The Euro trading to parity against the U.S. dollar is still on the table.
3. China devaluing against the U.S. dollar is still very much in play in 2016.
While Canadian investment advisors may use this opportunity to rebalance investors portfolios to hold more U.S. Dollars, there may be an opportunity to position one self to profit from a view that the Canadian dollar will once again weaken. One method by which to trade the view is to utilize the US Dollar options available through the Montreal Exchange under the ticker: USX
Each USX option represents $10,000 U.S. Dollars and has a European style settlement.
One of the reasons I prefer to utilize the options is the asymmetry of the risk. With the USD/CAD having traded from $1.4700 high down its current $1.3000 level, there is room for a technical move that could easily see a $0.0800-$0.1000 retracement back toward the $1.4000 level.
The June 17th $130.00 (1.3000 level) call option is asking $2.50 or $250.00 per contract. The key to us is that the risk is defined to the maximum loss of the premium paid, in this case $250.00 a contract. Equally, if the U.S. Dollar was to return back to $1.4000, the option has the potential to return 4 times the risk. Speculation like this is not appropriate for everyone, but for someone with an appetite for a little risk, it is an interesting way to take a core stance on the macro view that the Canadian dollar will reverse its current short term strength.

THE OPTIONS PLAYBOOK
Long Gold using the iShares Gold Bullion ETF (CGL)
With gold having had one of the strongest starts to a year in recent history, many investors are asking
the question “Does this represents the end of the 4-year bear market? Has the tide turned?” Many gold
enthusiasts are convinced that the current rally is just the beginning of what should be a meaningful
rally toward $1,400 an ounce. Equally, the skeptics are quick to try to instill doubt suggesting that this
short term rally was technical in nature and that the bigger picture fundamentals leave room for gold to
return back to $1,000.
What is an investor to do?
This is where the asymmetry of options can allow an investor to take a risk defined position. In this
example, the idea is to buy a deeper in-the-money call option on the iShares Gold Bullion ETF (CGL).
• The iShares Gold Bullion ETF is trading at $10.98 (April 8, 2016)
• The $10.00 September 16th 2016 call option is asking $1.30 ($130 a contract)
• The option represents $0.98 intrinsic value (equity) and $0.32 of time value
The rationale behind choosing that strike has to do with the high delta. Delta is the rate of change in the
option relative to the underlying stock move. By buying a higher delta option, we have the opportunity
to participate almost dollar for dollar on the upside. If you feel gold has upside and want to define your
risk, this option may be the right way to participate.
Covered Calls on Franco Nevada (FNV)
Throughout the gold bear market, Franco Nevada has been in a class of its own. The gold-focused
royalty stream company has not only been able to weather the storm but able to make new 52 week
highs in 3 consecutive calendar years over 2014, 2015 and 2016. With conditions becoming better in
the gold mining space, Franco Nevada looks poised to be able to remain a solid investment.
While many investors are looking at the stock from a perspective of further upside gain, I, on the other
hand see an opportunity to secure a solid income from the stock utilizing a covered call.
How does the trade look?
• Investor buys shares of Franco Nevada at $84.77
• Investor sells the October 21st 2016 $86.00 covered call which is bidding $7.65
• This represents a 6-month cash flow of 9.02% (annualizing around 18.00%)
While many investors are looking purely at the upside potential, the stock represents an interesting
proposition where we can attain a very lucrative income return without needing the stock to appreciate.
The additional value is the protection one gains by having received the call premium. By having received
the $7.65 in premium up front, it reduces the breakeven of the investment to $77.12 ($84.77 - $7.65).
None the less, in a low yield environment, securing a lucrative 9.02% income over 6 months is an
interesting way of adding some potential portfolio returns.
6

Options
Canadian
WEEKLY
Bank of Montreal*
Bank of Nova Scotia (The)*
Barrick Gold Corporation*
Baytex Energy Corp.*
BCE Inc.
BlackBerry Limited
Canadian Imperial Bank of Commerce*
Canadian National Railway Company
Canadian Natural Resources Limited
Crescent Point Energy Corp.*
Detour Gold Corp.*
Enbridge Income Fund Holdings Inc.
Enbridge Inc.
Encana Corporation
First Quantum Minerals Ltd.
Goldcorp Inc.*
Husky Energy Inc.
iShares S&P/TSX 60 Index ETF
National Bank of Canada
Potash Corporation of Saskatchewan Inc.
Royal Bank of Canada*
Suncor Energy Inc.
Teck Resources Limited., Cl. B
Toronto-Dominion Bank (The)*
TransCanada Corporation
*Multiple weekly expiries
8
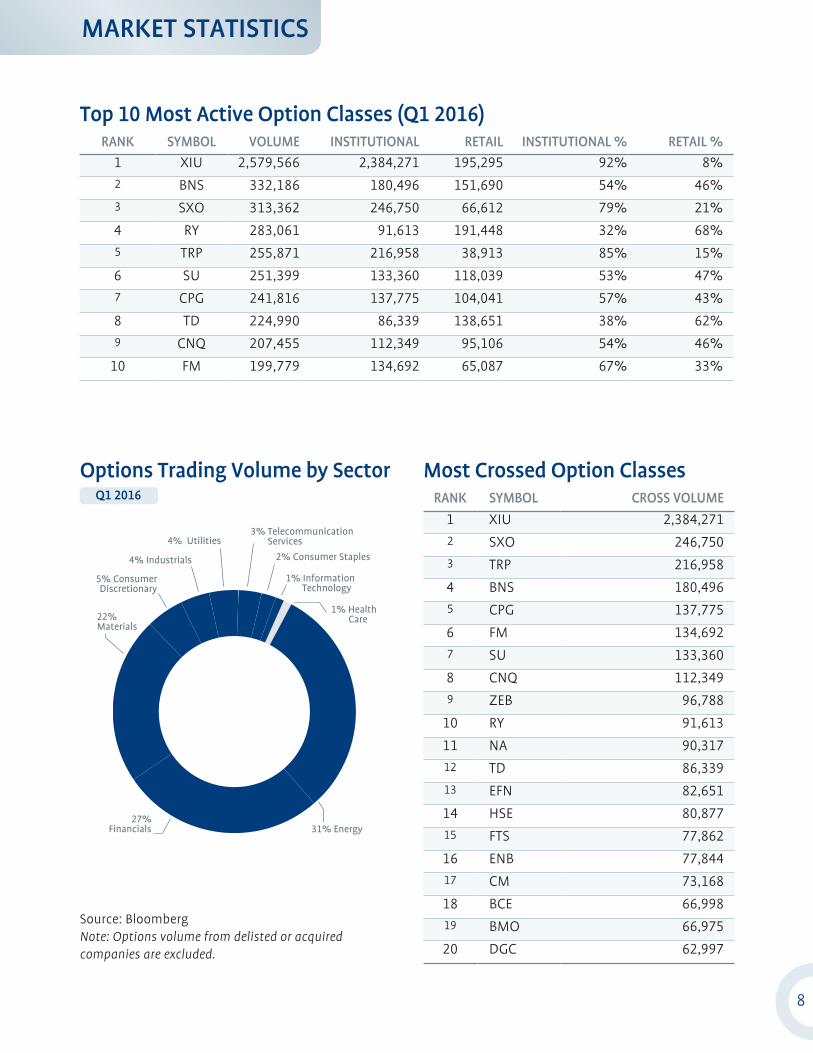
Top 10 Most Active Option Classes (Q1 2016)
Options Trading Volume by Sector Q1 2016
Most Crossed Option Classes
RANK SYMBOL VOLUME INSTITUTIONAL RETAIL INSTITUTIONAL % RETAIL %1 XIU 2,579,566 2,384,271 195,295 92% 8%
2 BNS 332,186 180,496 151,690 54% 46%
3 SXO 313,362 246,750 66,612 79% 21%
4 RY 283,061 91,613 191,448 32% 68%
5 TRP 255,871 216,958 38,913 85% 15%
6 SU 251,399 133,360 118,039 53% 47%
7 CPG 241,816 137,775 104,041 57% 43%
8 TD 224,990 86,339 138,651 38% 62%
9 CNQ 207,455 112,349 95,106 54% 46%
10 FM 199,779 134,692 65,087 67% 33%
RANK SYMBOL CROSS VOLUME
1 XIU 2,384,271
2 SXO 246,750
3 TRP 216,958
4 BNS 180,496
5 CPG 137,775
6 FM 134,692
7 SU 133,360
8 CNQ 112,349
9 ZEB 96,788
10 RY 91,613
11 NA 90,317
12 TD 86,339
13 EFN 82,651
14 HSE 80,877
15 FTS 77,862
16 ENB 77,844
17 CM 73,168
18 BCE 66,998
19 BMO 66,975
20 DGC 62,997
Source: Bloomberg Note: Options volume from delisted or acquired companies are excluded.
MARKET STATISTICS
31% Energy27%
Financials
22%Materials
4% Industrials
4% Utilities3% Telecommunication2% Services
5% ConsumerDiscretionary
2% Consumer Staples
1% Information Technology
1% Health Care

0
500,000
250,000
0
750,000
1,000,000
1,250,000
1,500,000
1,750,000
2,000,000
20,000
30,000
40,000
50,000
60,000
70,000
10,000
80,000
Average Daily Volume Open Interest
2012 2013 2014 2015 2016YTD
July Aug Sept Oct Nov Dec Jan Fev MarApr May Jun
Average Daily Volume Open Interest
60,000
70,000
80,000
90,000
100,000
110,000
120,000
1,000,000
1,500,000
2,000,000
2,500,000
3,000,000
3,500,000
4,000,000
2012 2013 2014 2015 2016YTD
July Aug Sept Oct Nov Dec Jan Fev MarApr May Jun
9
Equity Average Daily Volume and Open Interest
ETF Average Daily Volume and Open Interest
MARKET STATISTICS
OVER A 5 YEAR PERIOD
OVER A 5 YEAR PERIOD
OVER A 12 MONTH PERIOD (2015-2016)
OVER A 12 MONTH PERIOD (2015-2016)
© 2016 Bourse de Montréal Inc.
This document is sent to you on a general information basis only. The information provided in this document, including financial and economic data, quotes and any analysis or interpretation thereof, is provided solely on an information basis and shall not be interpreted in any jurisdiction as an advice or a recommendation with respect to the purchase or sale of any derivative instrument, underlying security or any other financial instrument or as a legal, accounting, tax, financial or investment advice. Bourse de Montréal Inc. recommends that you consult your own advisors in accordance with your needs. All references in this document to specifications, rules and obligations concerning a product are subject to the Rules and Policies of Bourse de Montréal Inc. and its clearinghouse, the Canadian Derivatives Clearing Corporation. Although care has been taken in the preparation of this document, Bourse de Montréal Inc. and/or its affiliates take no responsibility for errors or omissions and reserve the right to amend or review, at any time and without prior notice, the content of this document. Bourse de Montréal Inc., its affiliates, directors, officers, employees and agents will not be liable for damages, losses or costs incurred as a result of the use of any information appearing in this document.
Standard & Poor’s and S&P are registered trademarks of Standard & Poor’s Financial Services LLC (“S&P”) and have been licensed for use by S&P Dow Jones Indices LLC and sublicensed for certain purposes by Bourse de Montréal Inc. TSX is a registered trademark of TSX Inc., and has been licensed for use by S&P Dow Jones Indices LLC and Bourse de Montréal Inc. The S&P/TSX 60 Index is a product of S&P Dow Jones Indices LLC, and has been licensed for use by Bourse de Montréal Inc. The products mentioned in this document are not sponsored, endorsed, sold or promoted by S&P Dow Jones Indices LLC, Dow Jones, S&P, their respective affiliates, or TSX Inc. and neither S&P Dow Jones Indices LLC, Dow Jones, S&P, their respective affiliates or TSX Inc., make any representation regarding the advisability of investing in such product(s).
“BAX®”, “OBX®”, “ONX®”, “OIS-MX™”, “CGZ®”, “CGF®”, “CGB®”, “LGB®”, “OGB®”, “SXO™”, “SXF™”, “SXM™”, “SCF™”, “SXA™”, “SXB™”, “SXH™”, and “SXY™” are trademarks of Bourse de Montréal Inc.
Montréal Exchange, Montréal Exchange logo, Converge, and Converge logo are trademarks of Bourse de Montréal Inc.
OptionMatters.ca
m-x.ca/rssm-x.ca/linkedinm-x.ca/facebook
m-x.ca/twitterm-x.tv
Trading Tools
Useful Links
GUIDES MX INDICES OTHERS
» Equity derivatives
» Index derivatives
» Currency derivatives
» Equity options tax regime
» S&P/TSX 60 VIX Index (VIXC)
» MX Covered Straddle Writers’ Index (MPCX)
» MX Covered Call Writers’ Index (MCWX)
» Options List
» Put/Call Ratios