Embed Size (px)
Citation preview

Canadian Engineers for Tomorrow:
Engineers Canada is the national organization of the 12 provincial and territorial associations that regulate the profession of engineering in Canada and license the country’s more than 270,000 members of the engineering profession. Together, we advance the profession in the public interest.
Engineers Canada advances the competency, integrity, and public accountability of the profession.
First Publication: November 2014 Copyright © Engineers Canada, 2014 ISBN No: 978-1-894284-45-5
* The terms ENGINEER, ENGINEERING, and P.ENG. are official marks owned by Engineers Canada.
Engineers Canada encourages the dissemination and reproduction of statistics contained in this report under strict authority and acknowledgement of Engineers Canada. Should you wish to reproduce any portion of this document through any media format, you are asked to seek the permission of Engineers Canada at:
Canadian Engineers for Tomorrow: Trends in Engineering Enrolment and Degrees Awarded is produced and published by Engineers Canada.
With the objective of monitoring the availability of engineering resources, Engineers Canada has collected national data on enrolment and degrees awarded since the 1970s, and has published the research findings through various documents, technical reports and research papers.
Canadian Engineers for Tomorrow: Trends in Engineering Enrolment and Degrees Awarded contains data collected from universities on accredited engineering programs across Canada, as well as analysis and interpretation of this data.
Engineers Canada strives to ensure accuracy and consistency of all information presented. However, due to variations in survey methodology, interpretation and student classifications at universities across the country, the volunteers and staff of Engineers Canada cannot guarantee the accuracy of data provided by the universities.
The reader is advised that the information presented herein, including the analyses and assessments of the data, does not represent an endorsement by Engineers Canada of any particular university, or the likelihood of a person obtaining employment in any particular engineering discipline.
Students of engineering are reminded that the accumulation of skills within a particular field of engineering, along with strong communications, organizational, and leadership abilities are essential to a progressive career in engineering.
Engineers Canada 1100-180 Elgin Street, Ottawa, Ontario K2P 2K3 Tel.: 613.232.2474 Fax: 613.230.5759 email: [email protected]
Trends in Engineering Enrolment and Degrees Awarded 2009-2013
Trends in Engineering Enrolment and Degrees Awarded 2009-2013
Prepared by: Prism Economics and Analysis October 2014
Canadian Engineers for Tomorrow:

ii
Message from the Chief Executive Officer Engineers Canada is pleased to publish its summary of trends in engineering education in Canada. The report includes results for all academic terms from the calendar year 2009 through 2013.
Enrolment in engineering programs continues to grow, enrolment in accredited undergraduate programs reached 73,035 in 2013, an increase of 4.0% from 2012 and 24.1% since 2009. In 2013, there were 23,486 post-graduate students in engineering, an increase of 27.5% since 2009. Visa students accounted for more than 90% of this increase.
Canadian engineering programs continue to be a popular choice for international students. From 2009 to 2013 the share of visa students in undergraduate enrolment rose from 11.8% to 14.7%. For post-graduate visa students, the share is considerably larger, growing from 36.6% in 2009 to 47.3% in 2013.
The share of women in undergraduate enrolments peaked in 1999 at 20.6% and declined thereafter to 17.1% in 2008. Since then, female representation has increased each year accounting for 18.9% of total enrolments in 2013. The proportion of women in post-graduate enrolment is slightly higher, reaching 23.4% in 2013.
A total of 13,363 undergraduate degrees in engineering were awarded in 2013. This was an increase of 7.9% from 2012. Since 2009, degrees awarded have increased by 23.9%. For post-graduate degrees awarded, master’s degrees awarded have increased by 45.6% compared to 13.1% percent of PhD’s awarded during that same period.
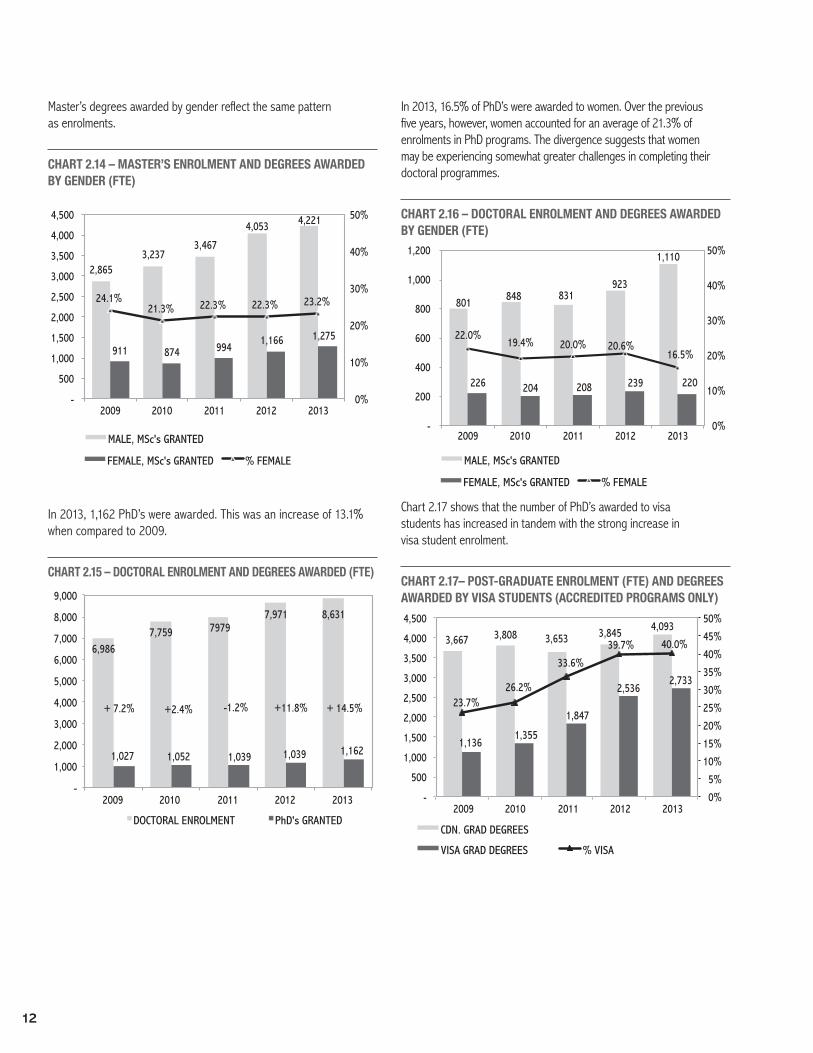
In 2013, 16.5% of PhD’s were awarded to women. Over the previous five years, however, women accounted for an average of 21.3% of enrolments in PhD programs. The divergence suggests that women may be experiencing somewhat greater challenges in completing their doctoral programmes.
Altogether, the report highlights another stable year.
Kim Allen, FEC, P.Eng.
Chief exeCutive OffiCer engineers Canada

iii
Table of ContentsMessage from the Chief Executive Officer . . . . . . . . . . . . . . . . . . . . . . . . . . . . . . . . . . . . . . . . . . . . . . . . . ii
Acknowledgements . . . . . . . . . . . . . . . . . . . . . . . . . . . . . . . . . . . . . . . . . . . . . . . . . . . . . . . . . . . . . . . . . iv
Foreward . . . . . . . . . . . . . . . . . . . . . . . . . . . . . . . . . . . . . . . . . . . . . . . . . . . . . . . . . . . . . . . . . . . . . . . . iv
Highlights. . . . . . . . . . . . . . . . . . . . . . . . . . . . . . . . . . . . . . . . . . . . . . . . . . . . . . . . . . . . . . . . . . . . . . . . v
Undergraduate Student Enrolment and Degrees Awarded . . . . . . . . . . . . . . . . . . . . . . . . . . . . . . . . . . . . . 1Undergraduate Student Enrolment . . . . . . . . . . . . . . . . . . . . . . . . . . . . . . . . . . . . . . . . . . . . . . . . . . . . . . . . . . . . . . . . . . . . . 1Undergraduate Student Enrolment by Program . . . . . . . . . . . . . . . . . . . . . . . . . . . . . . . . . . . . . . . . . . . . . . . . . . . . . . . . . . . 2Trends in Undergraduate Student Enrolment by Province . . . . . . . . . . . . . . . . . . . . . . . . . . . . . . . . . . . . . . . . . . . . . . . . . . . 3Female Undergraduate Enrolment . . . . . . . . . . . . . . . . . . . . . . . . . . . . . . . . . . . . . . . . . . . . . . . . . . . . . . . . . . . . . . . . . . . . . 3Undergraduate Enrolment of International (Visa) Students . . . . . . . . . . . . . . . . . . . . . . . . . . . . . . . . . . . . . . . . . . . . . . . . . . 5Undergraduate Degrees Awarded. . . . . . . . . . . . . . . . . . . . . . . . . . . . . . . . . . . . . . . . . . . . . . . . . . . . . . . . . . . . . . . . . . . . . . 5
Post-Graduate Enrolment and Degrees Awarded . . . . . . . . . . . . . . . . . . . . . . . . . . . . . . . . . . . . . . . . . . . . 7Foreword . . . . . . . . . . . . . . . . . . . . . . . . . . . . . . . . . . . . . . . . . . . . . . . . . . . . . . . . . . . . . . . . . . . . . . . . . . . . . . . . . . . . . . . . . 7Number of Graduate Students. . . . . . . . . . . . . . . . . . . . . . . . . . . . . . . . . . . . . . . . . . . . . . . . . . . . . . . . . . . . . . . . . . . . . . . . . 7Master’s Students . . . . . . . . . . . . . . . . . . . . . . . . . . . . . . . . . . . . . . . . . . . . . . . . . . . . . . . . . . . . . . . . . . . . . . . . . . . . . . . . . . 7Doctoral Students . . . . . . . . . . . . . . . . . . . . . . . . . . . . . . . . . . . . . . . . . . . . . . . . . . . . . . . . . . . . . . . . . . . . . . . . . . . . . . . . . . 8Post-Graduate Enrolment by Discipline . . . . . . . . . . . . . . . . . . . . . . . . . . . . . . . . . . . . . . . . . . . . . . . . . . . . . . . . . . . . . . . . . . 8Post-Graduate Enrolment of International (Visa) Students. . . . . . . . . . . . . . . . . . . . . . . . . . . . . . . . . . . . . . . . . . . . . . . . . . . 9Post-Graduate Enrolment by Gender . . . . . . . . . . . . . . . . . . . . . . . . . . . . . . . . . . . . . . . . . . . . . . . . . . . . . . . . . . . . . . . . . . . 10Post-Graduate Degrees Awarded . . . . . . . . . . . . . . . . . . . . . . . . . . . . . . . . . . . . . . . . . . . . . . . . . . . . . . . . . . . . . . . . . . . . . . 11
Appendix A. . . . . . . . . . . . . . . . . . . . . . . . . . . . . . . . . . . . . . . . . . . . . . . . . . . . . . . . . . . . . . . . . . . . . . . 14
Data Tabulations – Engineering Enrolment and Degrees Awarded . . . . . . . . . . . . . . . . . . . . . . . . . . . . . . . 14School Name and Acronyms . . . . . . . . . . . . . . . . . . . . . . . . . . . . . . . . . . . . . . . . . . . . . . . . . . . . . . . . . . . . . . . . . . . . . . . . . . 14Province name and Abbreviation . . . . . . . . . . . . . . . . . . . . . . . . . . . . . . . . . . . . . . . . . . . . . . . . . . . . . . . . . . . . . . . . . . . . . . 15A.1. Undergraduate Enrolment . . . . . . . . . . . . . . . . . . . . . . . . . . . . . . . . . . . . . . . . . . . . . . . . . . . . . . . . . . . . . . . . . . . . . . . . 15
U.1. National . . . . . . . . . . . . . . . . . . . . . . . . . . . . . . . . . . . . . . . . . . . . . . . . . . . . . . . . . . . . . . . . . . . . . . . . . . . . . . . . . . 15U.2. Provincial . . . . . . . . . . . . . . . . . . . . . . . . . . . . . . . . . . . . . . . . . . . . . . . . . . . . . . . . . . . . . . . . . . . . . . . . . . . . . . . . . 17U.3. Institutional . . . . . . . . . . . . . . . . . . . . . . . . . . . . . . . . . . . . . . . . . . . . . . . . . . . . . . . . . . . . . . . . . . . . . . . . . . . . . . . 19
A.2. Undergraduate Degrees Awarded . . . . . . . . . . . . . . . . . . . . . . . . . . . . . . . . . . . . . . . . . . . . . . . . . . . . . . . . . . . . . . . . . . 22UD.1. National . . . . . . . . . . . . . . . . . . . . . . . . . . . . . . . . . . . . . . . . . . . . . . . . . . . . . . . . . . . . . . . . . . . . . . . . . . . . . . . . . 22UD.2. Provincial. . . . . . . . . . . . . . . . . . . . . . . . . . . . . . . . . . . . . . . . . . . . . . . . . . . . . . . . . . . . . . . . . . . . . . . . . . . . . . . . 22UD.3. Institutional . . . . . . . . . . . . . . . . . . . . . . . . . . . . . . . . . . . . . . . . . . . . . . . . . . . . . . . . . . . . . . . . . . . . . . . . . . . . . . 24
A.3. Post Graduate Student Enrolment . . . . . . . . . . . . . . . . . . . . . . . . . . . . . . . . . . . . . . . . . . . . . . . . . . . . . . . . . . . . . . . . . . 27G.1. National . . . . . . . . . . . . . . . . . . . . . . . . . . . . . . . . . . . . . . . . . . . . . . . . . . . . . . . . . . . . . . . . . . . . . . . . . . . . . . . . . . 27G.2. Provincial . . . . . . . . . . . . . . . . . . . . . . . . . . . . . . . . . . . . . . . . . . . . . . . . . . . . . . . . . . . . . . . . . . . . . . . . . . . . . . . . . 29G.3. Institutional . . . . . . . . . . . . . . . . . . . . . . . . . . . . . . . . . . . . . . . . . . . . . . . . . . . . . . . . . . . . . . . . . . . . . . . . . . . . . . . 31
A.4. Post Graduate Degrees Awarded. . . . . . . . . . . . . . . . . . . . . . . . . . . . . . . . . . . . . . . . . . . . . . . . . . . . . . . . . . . . . . . . . . . 37GD.1. National . . . . . . . . . . . . . . . . . . . . . . . . . . . . . . . . . . . . . . . . . . . . . . . . . . . . . . . . . . . . . . . . . . . . . . . . . . . . . . . . . 37GD.2. Provincial. . . . . . . . . . . . . . . . . . . . . . . . . . . . . . . . . . . . . . . . . . . . . . . . . . . . . . . . . . . . . . . . . . . . . . . . . . . . . . . . 38GD.3. Institutional . . . . . . . . . . . . . . . . . . . . . . . . . . . . . . . . . . . . . . . . . . . . . . . . . . . . . . . . . . . . . . . . . . . . . . . . . . . . . . 41
A.5. Faculty Members by Institution and Discipline. . . . . . . . . . . . . . . . . . . . . . . . . . . . . . . . . . . . . . . . . . . . . . . . . . . . . . . . . 45F.1. Faculty Composition . . . . . . . . . . . . . . . . . . . . . . . . . . . . . . . . . . . . . . . . . . . . . . . . . . . . . . . . . . . . . . . . . . . . . . . . . 45
A.6. Co-op, Internship and Professional Experience Programs . . . . . . . . . . . . . . . . . . . . . . . . . . . . . . . . . . . . . . . . . . . . . . . 46C.1. Industry Experience Options by Institution . . . . . . . . . . . . . . . . . . . . . . . . . . . . . . . . . . . . . . . . . . . . . . . . . . . . . . . 46
Appendix B. . . . . . . . . . . . . . . . . . . . . . . . . . . . . . . . . . . . . . . . . . . . . . . . . . . . . . . . . . . . . . . . . . . . . . . 47Accredited Engineering Programs by Institution. . . . . . . . . . . . . . . . . . . . . . . . . . . . . . . . . . . . . . . . . . . . . . . . . . . . . . . . . . . 47
Appendix C . . . . . . . . . . . . . . . . . . . . . . . . . . . . . . . . . . . . . . . . . . . . . . . . . . . . . . . . . . . . . . . . . . . . . . . 53Canadian Discipline Categories As Used In This Report . . . . . . . . . . . . . . . . . . . . . . . . . . . . . . . . . . . . . . . . . . . . . . . . . . . . . 53
Appendix D. . . . . . . . . . . . . . . . . . . . . . . . . . . . . . . . . . . . . . . . . . . . . . . . . . . . . . . . . . . . . . . . . . . . . . . 56Associated Universities Explained. . . . . . . . . . . . . . . . . . . . . . . . . . . . . . . . . . . . . . . . . . . . . . . . . . . . . . . . . . . . . . . . . . . . . . 56
Appendix E. . . . . . . . . . . . . . . . . . . . . . . . . . . . . . . . . . . . . . . . . . . . . . . . . . . . . . . . . . . . . . . . . . . . . . . 57Survey Procedures and Data Compilation Methodology. . . . . . . . . . . . . . . . . . . . . . . . . . . . . . . . . . . . . . . . . . . . . . . . . . . . . 57

iv
AcknowledgementsEngineers Canada gratefully acknowledges the contribution of data and information from the deans and associate deans of the engineering and applied science faculties at Canadian universities.
ForewordEach year, Engineers Canada gathers data on student enrolments and graduations from Canada’s universities. This report analyzes trends in engineering student enrolment within accredited engineering programs across the nation.
Understanding these trends enables Engineers Canada and other members of the profession to:
• Compare patterns in the changing number of students who enroll in and graduate from the various engieneering programs offered in the provinces,
• Assess the number of women and visa students who are pursuing engineering education, and
• Exchange pertinent information about similar and distinctly different trends across disciplines and institutions.
v
HighlightsUndergraduate Enrolment Trends:
• Undergraduate enrolments increased by 4.0% in 2013. Since 2009, undergraduate enrolments have increased by 24.1%. See Table U.1.1.
• Since 2009, the most rapidly growing engineering disciplines have been: mining or mineral (51.6%), environmental (46.6%), software (41.8%), biosystems (41.6%) and geological (31.3%). The fields which have grown mostly slowly have been: materials or metallurgical (-0.3%), computer (11.5%), industrial or manufacturing (12.5%) and electrical (13.4%). See Table U.1.1.
• In 2013, mechanical engineering accounted for 21.2% of total undergraduate enrolments, followed by civil engineering (16.6%) and electrical engineering (14.6%). See Table U.1.1.
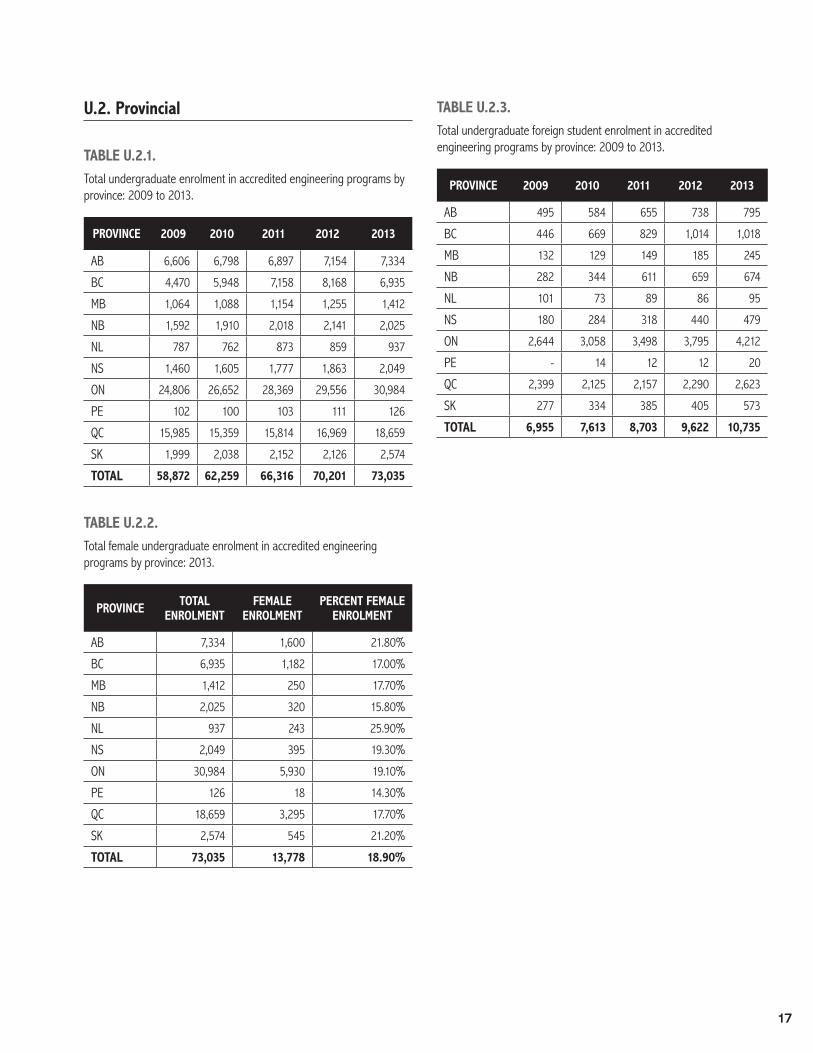
• Over the period 2009 to 2013, undergraduate enrolments increased most rapidly in British Columbia (55.1%) and Nova Scotia (40.3%). The slowest increase in enrolments were in Alberta (11.0%) and Quebec (16.7%). See Table U.2.1.
• Ontario accounted for 42.2% of 2013 undergraduate enrolments, followed by Quebec (25.5%) and Alberta (10.0%). See Table U.2.1.
Share of Women in Undergraduate Enrolments:
• The share of women in undergraduate enrolments increased from 17.3% in 2009 to 18.9% in 2013. The share of women in undergraduate enrolments peaked in 1999 at 20.6% and declined thereafter to 17.1% in 2008. Since 2008, the share of women in undergraduate enrolments has increased. See Table U.1.2.
• Compared to men, women are significantly more likely to enrol in biosystems and environmental engineering than mechanical engineering or computer engineering.
• There are differences across provinces in the share of women in undergraduate enrolments. In 2013, Newfoundland and Labrador had the highest share of women in undergraduate enrolments (25.9%), followed by Alberta (21.8%) and Saskatchewan (21.2%). The lowest shares were in New Brunswick (15.8%) and Prince Edward Island (14.3%). See Table U.2.3.
Visa Students (Undergraduate):
• In 2013, visa students accounted for 14.7% of undergraduate enrolments. This compares with 11.8% in 2009. See Chart 1.12.
Post-Graduate Enrolment Trends:
• In 2013, there were 23,486 full-time and part-time post-graduate students in engineering programs. This was an increase of 27.5% compared with 2009. Visa students accounted for more than 90% of this increase.
• Visa students represented 47.3% of post-graduate enrolments in 2013. This compares with 36.6% in 2009.
• In 2012, the share of women in post-graduate enrolments was 23.4%. This compares with 21.3% in 2009 and exceeds the proportion of women in undergraduate programs.

vi
ENGINEERINGVisions of things to come
1
Undergraduate Student Enrolment and Degrees Awarded
UNDERGRADUATE STUDENT ENROLMENTIn 2013, 49 universities provided information on their enrolment, programs and degrees awarded.1
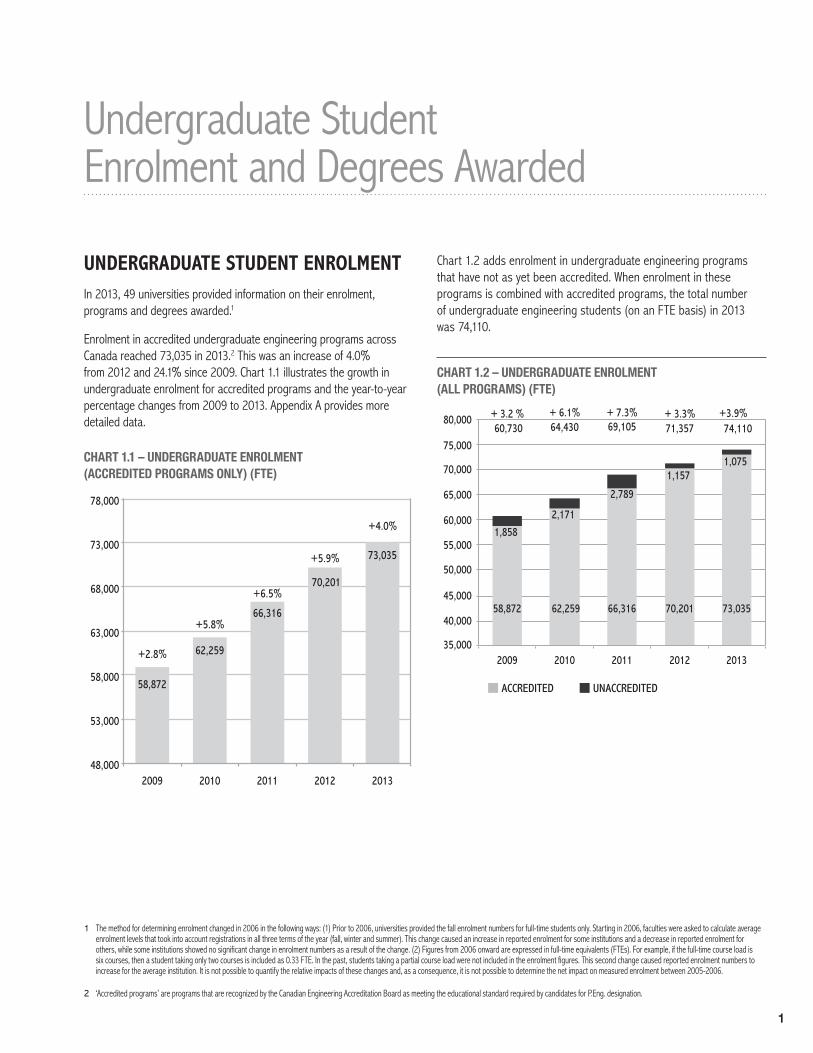
Enrolment in accredited undergraduate engineering programs across Canada reached 73,035 in 2013.2 This was an increase of 4.0% from 2012 and 24.1% since 2009. Chart 1.1 illustrates the growth in undergraduate enrolment for accredited programs and the year-to-year percentage changes from 2009 to 2013. Appendix A provides more detailed data.
CHART 1.1 – UNDERGRADUATE ENROLMENT (ACCREDITED PROGRAMS ONLY) (FTE)
58,872
62,259
66,316
70,201
+2.8%
+5.8%
+6.5%
+5.9%
48,000
53,000
58,000
63,000
68,000
73,000
78,000
2009 2010 2011 2012 2013
73,035
+4.0%
Chart 1.2 adds enrolment in undergraduate engineering programs that have not as yet been accredited. When enrolment in these programs is combined with accredited programs, the total number of undergraduate engineering students (on an FTE basis) in 2013 was 74,110.
CHART 1.2 – UNDERGRADUATE ENROLMENT (ALL PROGRAMS) (FTE)
UNACCREDITEDACCREDITED
58,872 62,259 66,316 70,201 73,035
1,858
2,171
2,789
1,157 1,075
+ 3.2 % + 6.1% + 7.3% + 3.3% 60,730 64,430 69,105 71,357 74,110
35,000
40,000
45,000
50,000
55,000
60,000
65,000
70,000
75,000
80,000
2009 2010 2011 2012 2013
+3.9%
1 The method for determining enrolment changed in 2006 in the following ways: (1) Prior to 2006, universities provided the fall enrolment numbers for full-time students only. Starting in 2006, faculties were asked to calculate average enrolment levels that took into account registrations in all three terms of the year (fall, winter and summer). This change caused an increase in reported enrolment for some institutions and a decrease in reported enrolment for others, while some institutions showed no significant change in enrolment numbers as a result of the change. (2) Figures from 2006 onward are expressed in full-time equivalents (FTEs). For example, if the full-time course load is six courses, then a student taking only two courses is included as 0.33 FTE. In the past, students taking a partial course load were not included in the enrolment figures. This second change caused reported enrolment numbers to increase for the average institution. It is not possible to quantify the relative impacts of these changes and, as a consequence, it is not possible to determine the net impact on measured enrolment between 2005-2006.
2 ‘Accredited programs’ are programs that are recognized by the Canadian Engineering Accreditation Board as meeting the educational standard required by candidates for P.Eng. designation.
2
UNDERGRADUATE STUDENT ENROLMENT BY PROGRAM3
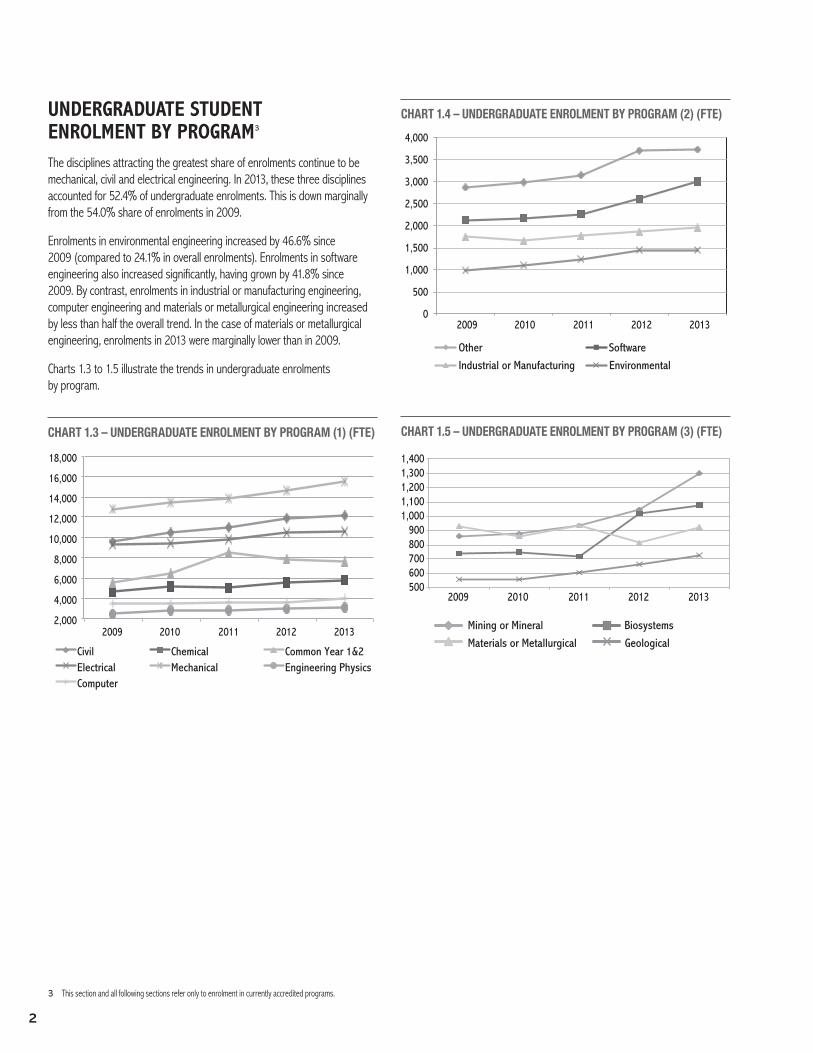
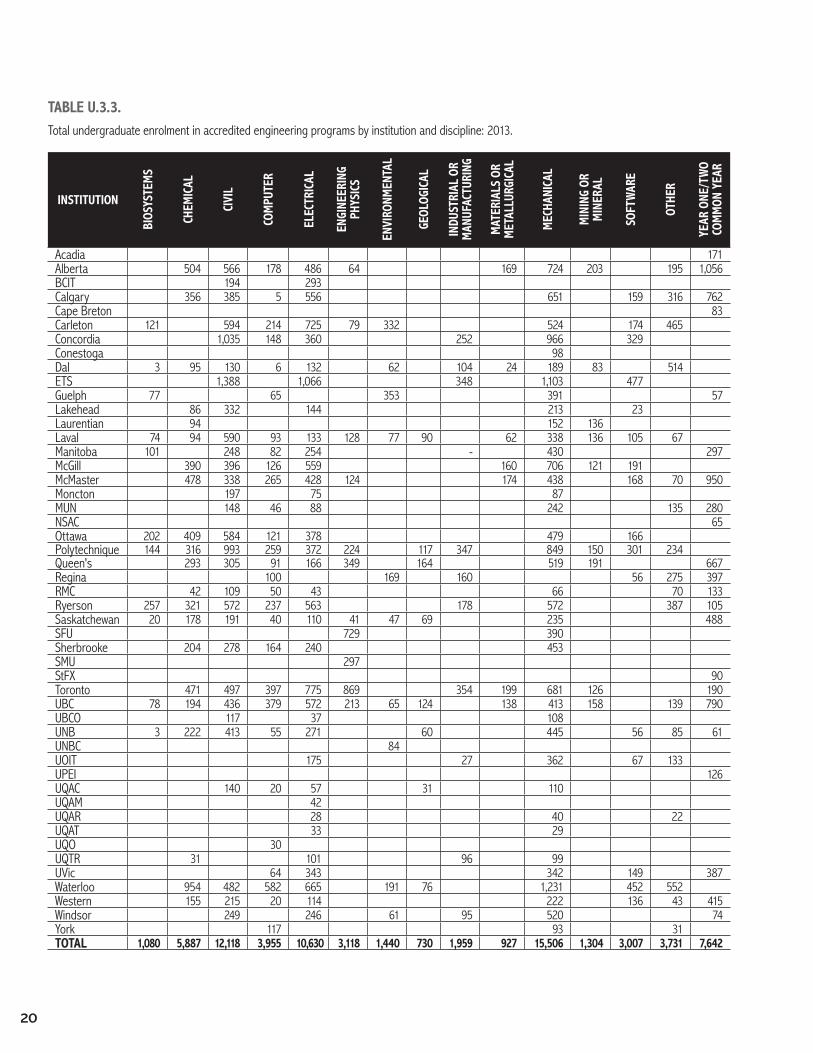
The disciplines attracting the greatest share of enrolments continue to be mechanical, civil and electrical engineering. In 2013, these three disciplines accounted for 52.4% of undergraduate enrolments. This is down marginally from the 54.0% share of enrolments in 2009.
Enrolments in environmental engineering increased by 46.6% since 2009 (compared to 24.1% in overall enrolments). Enrolments in software engineering also increased significantly, having grown by 41.8% since 2009. By contrast, enrolments in industrial or manufacturing engineering, computer engineering and materials or metallurgical engineering increased by less than half the overall trend. In the case of materials or metallurgical engineering, enrolments in 2013 were marginally lower than in 2009.
Charts 1.3 to 1.5 illustrate the trends in undergraduate enrolments by program.
CHART 1.3 – UNDERGRADUATE ENROLMENT BY PROGRAM (1) (FTE)
Civil Chemical Common Year 1&2 Electrical Mechanical Engineering Physics Computer
2,000
4,000
6,000
8,000
10,000
12,000
14,000
16,000
18,000
2009 2010 2011 2012 2013
CHART 1.4 – UNDERGRADUATE ENROLMENT BY PROGRAM (2) (FTE)
Other Software
Industrial or Manufacturing Environmental
0
500
1,000
1,500
2,000
2,500
3,000
3,500
4,000
2009 2010 2011 2012 2013
CHART 1.5 – UNDERGRADUATE ENROLMENT BY PROGRAM (3) (FTE)
Mining or Mineral Biosystems
Materials or Metallurgical Geological
500 600 700 800 900
1,000 1,100 1,200 1,300 1,400
2009 2010 2011 2012 2013
3 This section and all following sections refer only to enrolment in currently accredited programs.
3
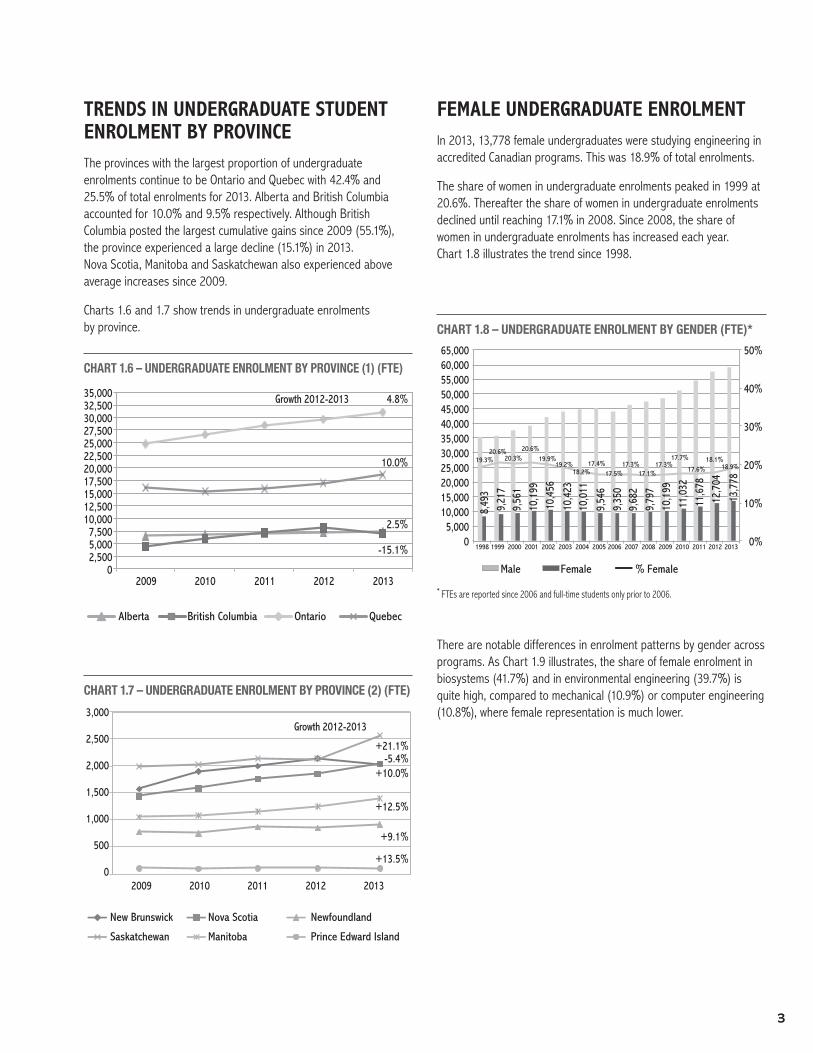
TRENDS IN UNDERGRADUATE STUDENT ENROLMENT BY PROVINCEThe provinces with the largest proportion of undergraduate enrolments continue to be Ontario and Quebec with 42.4% and 25.5% of total enrolments for 2013. Alberta and British Columbia accounted for 10.0% and 9.5% respectively. Although British Columbia posted the largest cumulative gains since 2009 (55.1%), the province experienced a large decline (15.1%) in 2013. Nova Scotia, Manitoba and Saskatchewan also experienced above average increases since 2009.
Charts 1.6 and 1.7 show trends in undergraduate enrolments by province.
CHART 1.6 – UNDERGRADUATE ENROLMENT BY PROVINCE (1) (FTE)
Alberta British Columbia Ontario Quebec
Growth 2012-2013
0 2,500 5,000 7,500
10,000 12,500 15,000 17,500 20,000 22,500 25,000 27,500 30,000 32,500 35,000
2009 2010 2011 2012 2013
4.8%
10.0%
2.5%
-15.1%
CHART 1.7 – UNDERGRADUATE ENROLMENT BY PROVINCE (2) (FTE)
New Brunswick Nova Scotia Newfoundland
Saskatchewan Manitoba Prince Edward Island
+13.5%
+9.1%
+12.5%
+10.0%-5.4%
+21.1%
Growth 2012-2013
2009 2010 2011 2012 2013
3,000
2,500
2,000
1,500
1,000
500
0
FEMALE UNDERGRADUATE ENROLMENTIn 2013, 13,778 female undergraduates were studying engineering in accredited Canadian programs. This was 18.9% of total enrolments.
The share of women in undergraduate enrolments peaked in 1999 at 20.6%. Thereafter the share of women in undergraduate enrolments declined until reaching 17.1% in 2008. Since 2008, the share of women in undergraduate enrolments has increased each year. Chart 1.8 illustrates the trend since 1998.
CHART 1.8 – UNDERGRADUATE ENROLMENT BY GENDER (FTE)*
Male Female % Female
8,49
3 9,
217
9,56
1 10
,199
10
,456
10,4
23
10,0
11
9,54
6 9,
350
9,68
2 9,
797
10,1
99
11,0
32
11,6
78
12,7
04
13,7
78
19.3% 20.6%
20.3% 20.6%
19.9% 19.2%
18.2% 17.4%
17.5% 17.3%
17.1% 17.3%
17.7%
17.6% 18.1%
18.9%
0%
10%
20%
30%
40%
50%
0 5,000
10,000 15,000 20,000 25,000 30,000 35,000 40,000 45,000 50,000 55,000 60,000 65,000
1998 1999 2001 2002 2003 2004 2005 2006 2007 2008 2009 2010 2011 2012 20132000
* FTEs are reported since 2006 and full-time students only prior to 2006.
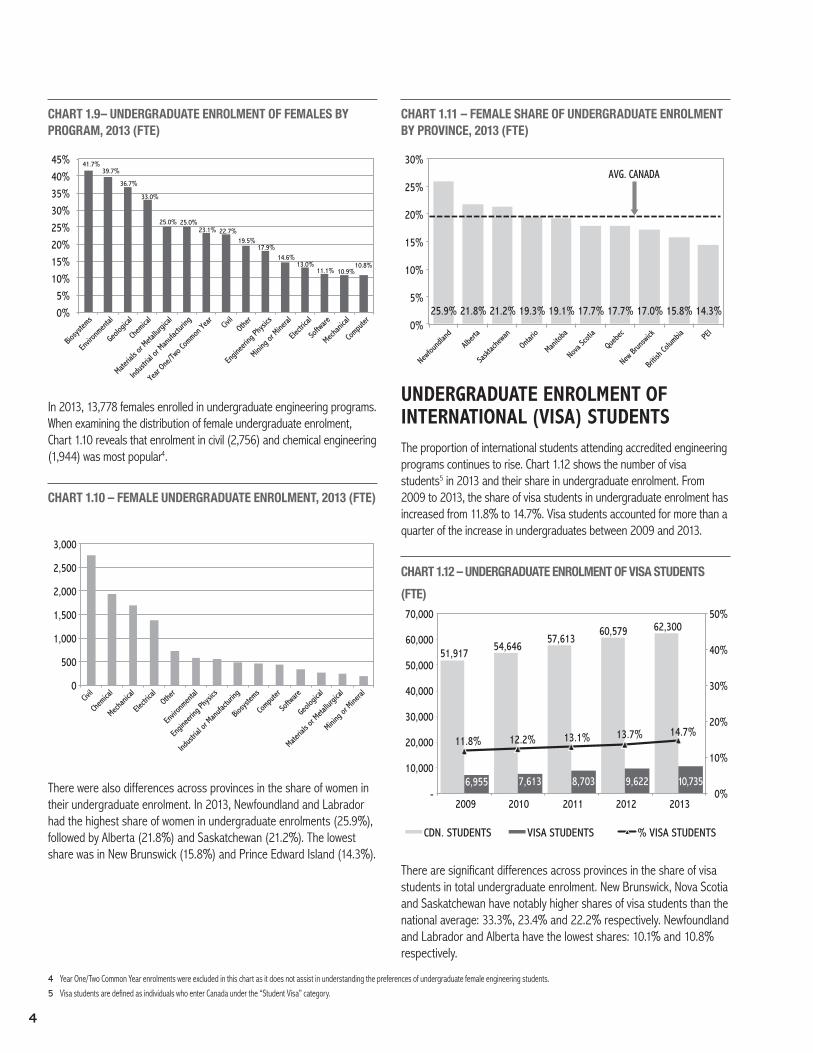
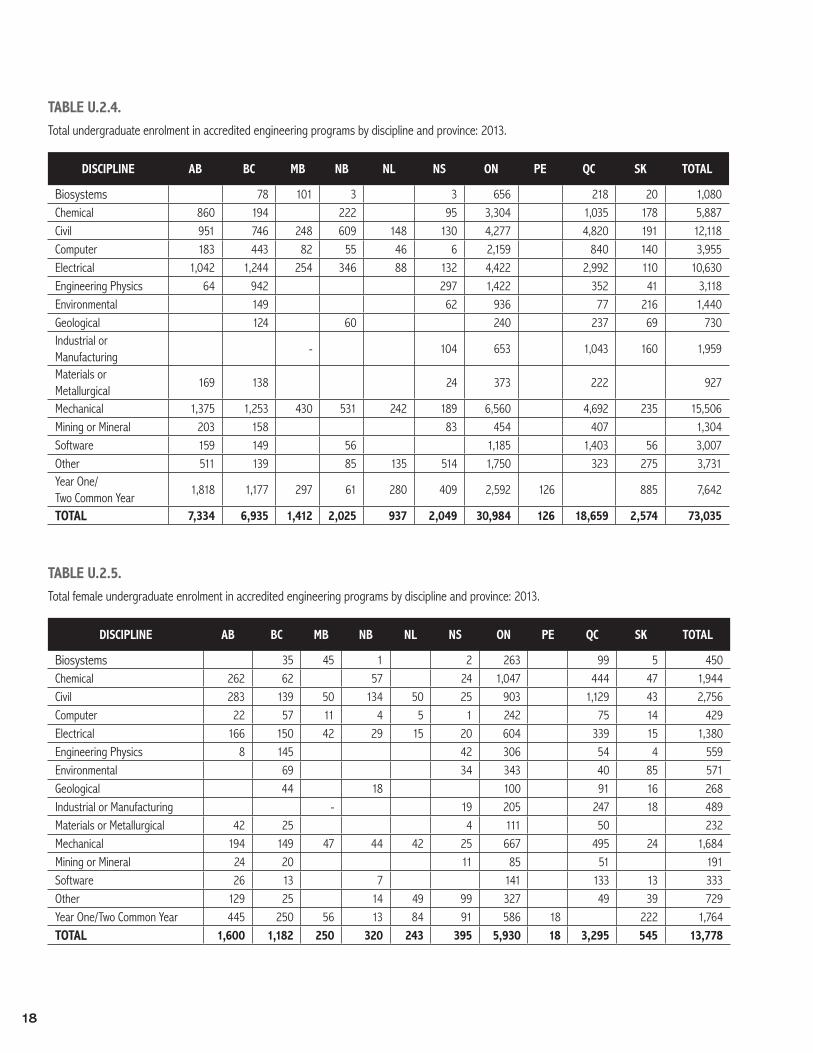
There are notable differences in enrolment patterns by gender across programs. As Chart 1.9 illustrates, the share of female enrolment in biosystems (41.7%) and in environmental engineering (39.7%) is quite high, compared to mechanical (10.9%) or computer engineering (10.8%), where female representation is much lower.
4
CHART 1.9– UNDERGRADUATE ENROLMENT OF FEMALES BY PROGRAM, 2013 (FTE)
41.7% 39.7%
36.7%
33.0%
25.0% 25.0% 23.1% 22.7%
19.5% 17.9%
14.6% 13.0%
11.1% 10.9% 10.8%
0%5%
10%15%20%25%30%35%40%45%
Biosys
tems
Envir
onmen
tal
Geolo
gical
Chem
ical
Materia
ls or
Metallu
rgical
Indus
trial o
r Man
ufactu
ring
Year
One/Tw
o Com
mon Ye
ar Civil
Other
Engin
eerin
g Phy
sics
Mining
or M
ineral
Electr
ical
Softw
are
Mechan
ical
Compu
ter
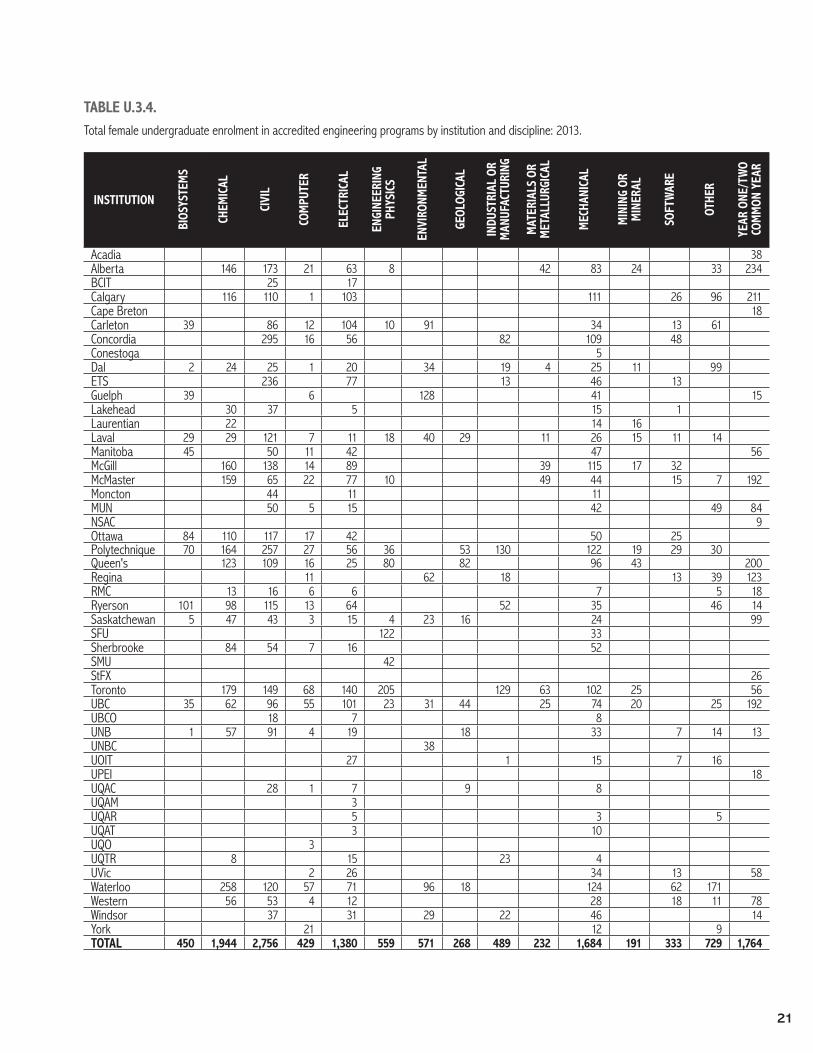
In 2013, 13,778 females enrolled in undergraduate engineering programs. When examining the distribution of female undergraduate enrolment, Chart 1.10 reveals that enrolment in civil (2,756) and chemical engineering (1,944) was most popular4.
CHART 1.10 – FEMALE UNDERGRADUATE ENROLMENT, 2013 (FTE)
0
500
1,000
1,500
2,000
2,500
3,000
Civil
Chem
ical
Mechan
ical
Electr
ical
Other
Envir
onmen
tal
Engin
eerin
g Phy
sics
Indus
trial o
r Man
ufactu
ring
Biosys
tems
Compu
ter
Softw
are
Geolo
gical
Materia
ls or
Metallu
rgical
Mining
or M
ineral
There were also differences across provinces in the share of women in their undergraduate enrolment. In 2013, Newfoundland and Labrador had the highest share of women in undergraduate enrolments (25.9%), followed by Alberta (21.8%) and Saskatchewan (21.2%). The lowest share was in New Brunswick (15.8%) and Prince Edward Island (14.3%).
CHART 1.11 – FEMALE SHARE OF UNDERGRADUATE ENROLMENT BY PROVINCE, 2013 (FTE)
0%
5%
10%
15%
20%
25%
30% AVG. CANADA
25.9% 21.8% 21.2% 19.3% 19.1% 17.7% 17.7% 17.0% 15.8% 14.3%
Newfou
ndlan
d
Albert
a
Saskt
achew
an
Ontario
Manito
ba
Nova S
cotia
Quebe
c
New Br
unsw
ick
Britis
h Colu
mbia PEI
UNDERGRADUATE ENROLMENT OF INTERNATIONAL (VISA) STUDENTSThe proportion of international students attending accredited engineering programs continues to rise. Chart 1.12 shows the number of visa students5 in 2013 and their share in undergraduate enrolment. From 2009 to 2013, the share of visa students in undergraduate enrolment has increased from 11.8% to 14.7%. Visa students accounted for more than a quarter of the increase in undergraduates between 2009 and 2013.
CHART 1.12 – UNDERGRADUATE ENROLMENT OF VISA STUDENTS
(FTE)
51,917 54,646
57,613 60,579 62,300
6,955 7,613 8,703 9,622 10,735
11.8% 12.2% 13.1% 13.7% 14.7%
0%
10%
20%
30%
40%
50%
-
10,000
20,000
30,000
40,000
50,000
60,000
70,000
2009 2010 2011 2012 2013
CDN. STUDENTS VISA STUDENTS % VISA STUDENTS
There are significant differences across provinces in the share of visa students in total undergraduate enrolment. New Brunswick, Nova Scotia and Saskatchewan have notably higher shares of visa students than the national average: 33.3%, 23.4% and 22.2% respectively. Newfoundland and Labrador and Alberta have the lowest shares: 10.1% and 10.8% respectively.
4 Year One/Two Common Year enrolments were excluded in this chart as it does not assist in understanding the preferences of undergraduate female engineering students.
5 Visa students are defined as individuals who enter Canada under the “Student Visa” category.
5
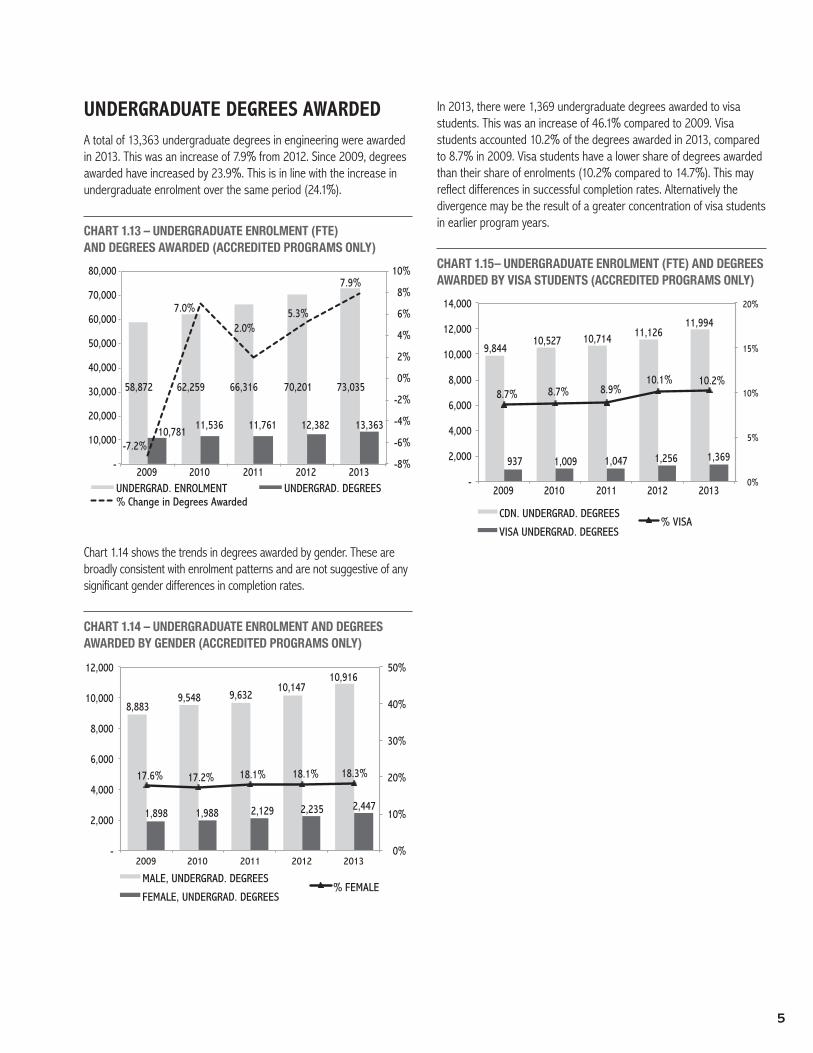
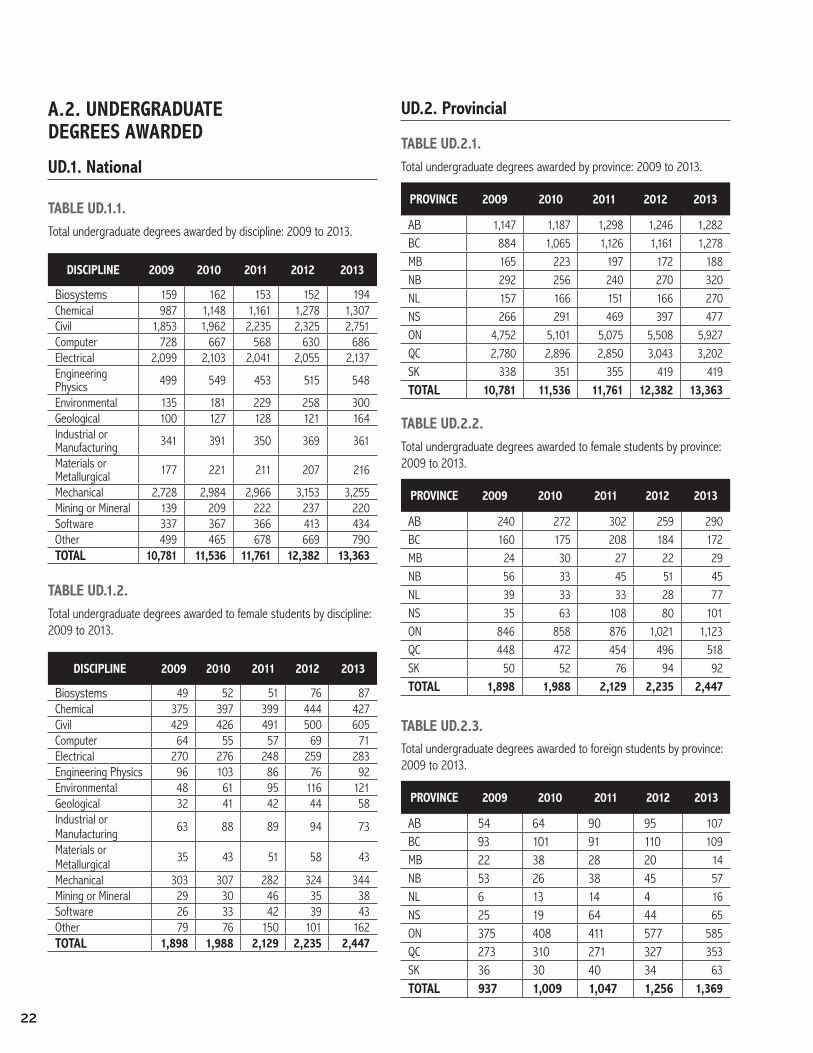
UNDERGRADUATE DEGREES AWARDED A total of 13,363 undergraduate degrees in engineering were awarded in 2013. This was an increase of 7.9% from 2012. Since 2009, degrees awarded have increased by 23.9%. This is in line with the increase in undergraduate enrolment over the same period (24.1%).
CHART 1.13 – UNDERGRADUATE ENROLMENT (FTE) AND DEGREES AWARDED (ACCREDITED PROGRAMS ONLY)
58,872 62,259 66,316 70,201 73,035
10,781 11,536 11,761 12,382 13,363
-7.2%
7.0%
2.0% 5.3%
7.9%
-8%
-6%
-4%
-2%
0%
2%
4%
6%
8%
10%
-
10,000
20,000
30,000
40,000
50,000
60,000
70,000
80,000
2009 2010 2011 2012 2013 UNDERGRAD. ENROLMENT UNDERGRAD. DEGREES % Change in Degrees Awarded
Chart 1.14 shows the trends in degrees awarded by gender. These are broadly consistent with enrolment patterns and are not suggestive of any significant gender differences in completion rates.
CHART 1.14 – UNDERGRADUATE ENROLMENT AND DEGREES AWARDED BY GENDER (ACCREDITED PROGRAMS ONLY)
8,883 9,548 9,632
10,147 10,916
1,898 1,988 2,129 2,235
17.6% 17.2% 18.1% 18.1% 18.3%
0%
10%
20%
30%
40%
50%
-
2,000
4,000
6,000
8,000
10,000
12,000
2009 2010 2011 2012 2013
MALE, UNDERGRAD. DEGREES
FEMALE, UNDERGRAD. DEGREES % FEMALE
2,447
In 2013, there were 1,369 undergraduate degrees awarded to visa students. This was an increase of 46.1% compared to 2009. Visa students accounted 10.2% of the degrees awarded in 2013, compared to 8.7% in 2009. Visa students have a lower share of degrees awarded than their share of enrolments (10.2% compared to 14.7%). This may reflect differences in successful completion rates. Alternatively the divergence may be the result of a greater concentration of visa students in earlier program years.
CHART 1.15– UNDERGRADUATE ENROLMENT (FTE) AND DEGREES AWARDED BY VISA STUDENTS (ACCREDITED PROGRAMS ONLY)
9,844 10,527 10,714 11,126
11,994
937 1,009 1,047 1,256 1,369
8.7% 8.7% 8.9% 10.1% 10.2%
0%
5%
10%
15%
20%
-
2,000
4,000
6,000
8,000
10,000
12,000
14,000
2009 2010 2011 2012 2013
CDN. UNDERGRAD. DEGREES
VISA UNDERGRAD. DEGREES % VISA
6
Promoting high standards and mobility for the Canadian
ENGINEER
7
Post-Graduate Enrolment and Degrees Awarded
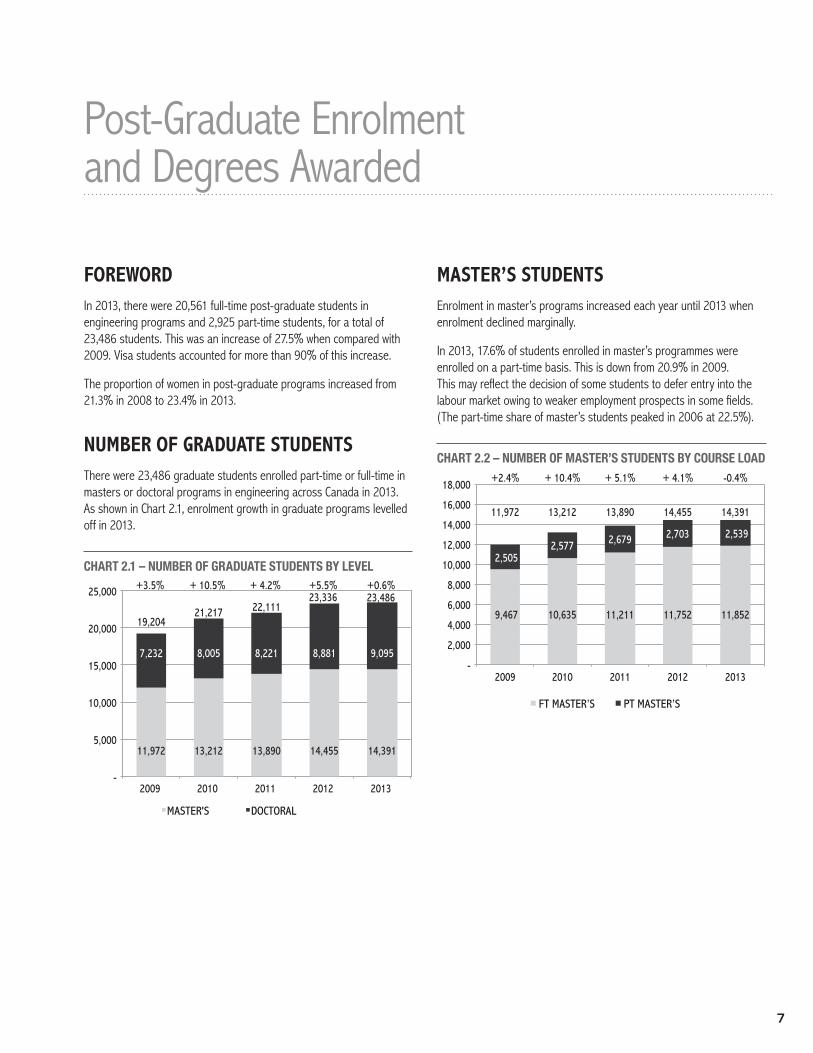
FOREWORDIn 2013, there were 20,561 full-time post-graduate students in engineering programs and 2,925 part-time students, for a total of 23,486 students. This was an increase of 27.5% when compared with 2009. Visa students accounted for more than 90% of this increase.
The proportion of women in post-graduate programs increased from 21.3% in 2008 to 23.4% in 2013.
NUMBER OF GRADUATE STUDENTSThere were 23,486 graduate students enrolled part-time or full-time in masters or doctoral programs in engineering across Canada in 2013. As shown in Chart 2.1, enrolment growth in graduate programs levelled off in 2013.
CHART 2.1 – NUMBER OF GRADUATE STUDENTS BY LEVEL
11,972 13,212 13,890 14,455 14,391
7,232 8,005 8,221 8,881 9,095
+3.5% + 10.5% + 4.2% +5.5% +0.6%
19,204 21,217 22,111
23,336
-
5,000
10,000
15,000
20,000
25,000
2009 2010 2011 2012 2013
MASTER'S DOCTORAL
23,486
MASTER’S STUDENTSEnrolment in master’s programs increased each year until 2013 when enrolment declined marginally.
In 2013, 17.6% of students enrolled in master’s programmes were enrolled on a part-time basis. This is down from 20.9% in 2009. This may reflect the decision of some students to defer entry into the labour market owing to weaker employment prospects in some fields. (The part-time share of master’s students peaked in 2006 at 22.5%).
CHART 2.2 – NUMBER OF MASTER’S STUDENTS BY COURSE LOAD
PT MASTER’SFT MASTER’S
9,467 10,635 11,211 11,752 11,852
2,505 2,577 2,679 2,703 2,539
+2.4% + 10.4% + 5.1% + 4.1% -0.4%
-
2,000
4,000
6,000
8,000
10,000
12,000
14,000
16,000
18,000
2009 2010 2011 2012 2013
11,972 13,212 13,890 14,455 14,391
8
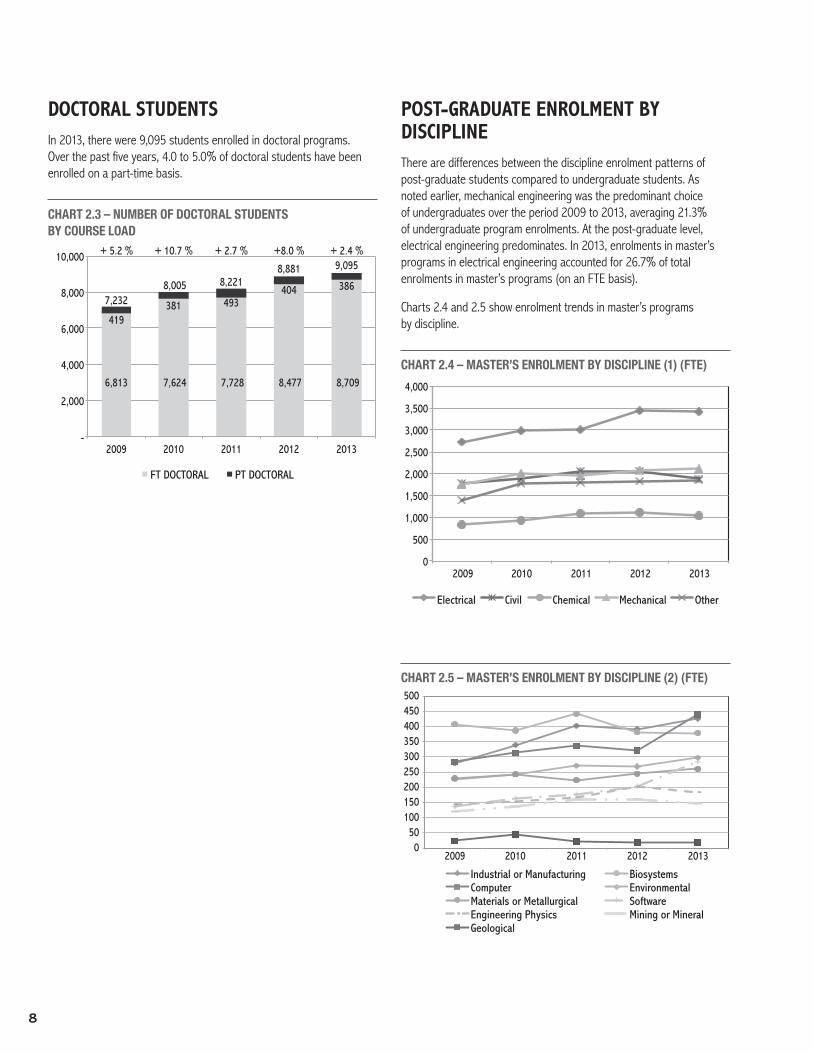
DOCTORAL STUDENTSIn 2013, there were 9,095 students enrolled in doctoral programs. Over the past five years, 4.0 to 5.0% of doctoral students have been enrolled on a part-time basis.
CHART 2.3 – NUMBER OF DOCTORAL STUDENTS BY COURSE LOAD
6,813 7,624 7,728 8,477 8,709
419381 493
404 386
+8.0 % + 2.4 %+ 5.2 % + 10.7 % + 2.7 %9,095
7,232 8,005 8,221
8,881
-
2,000
4,000
6,000
8,000
10,000
2009 2010 2011 2012 2013
PT DOCTORALFT DOCTORAL
POST-GRADUATE ENROLMENT BY DISCIPLINEThere are differences between the discipline enrolment patterns of post-graduate students compared to undergraduate students. As noted earlier, mechanical engineering was the predominant choice of undergraduates over the period 2009 to 2013, averaging 21.3% of undergraduate program enrolments. At the post-graduate level, electrical engineering predominates. In 2013, enrolments in master’s programs in electrical engineering accounted for 26.7% of total enrolments in master’s programs (on an FTE basis).
Charts 2.4 and 2.5 show enrolment trends in master’s programs by discipline.
CHART 2.4 – MASTER’S ENROLMENT BY DISCIPLINE (1) (FTE)
0
500
1,000
1,500
2,000
2,500
3,000
3,500
4,000
2009 2010 2011 2012 2013
Electrical Civil Chemical Mechanical Other
CHART 2.5 – MASTER’S ENROLMENT BY DISCIPLINE (2) (FTE)
0 50
100 150 200 250 300 350 400 450 500
2009 2010 2011 2012 2013
Industrial or Manufacturing Biosystems Computer Environmental Materials or Metallurgical Software Engineering Physics Mining or Mineral Geological
9
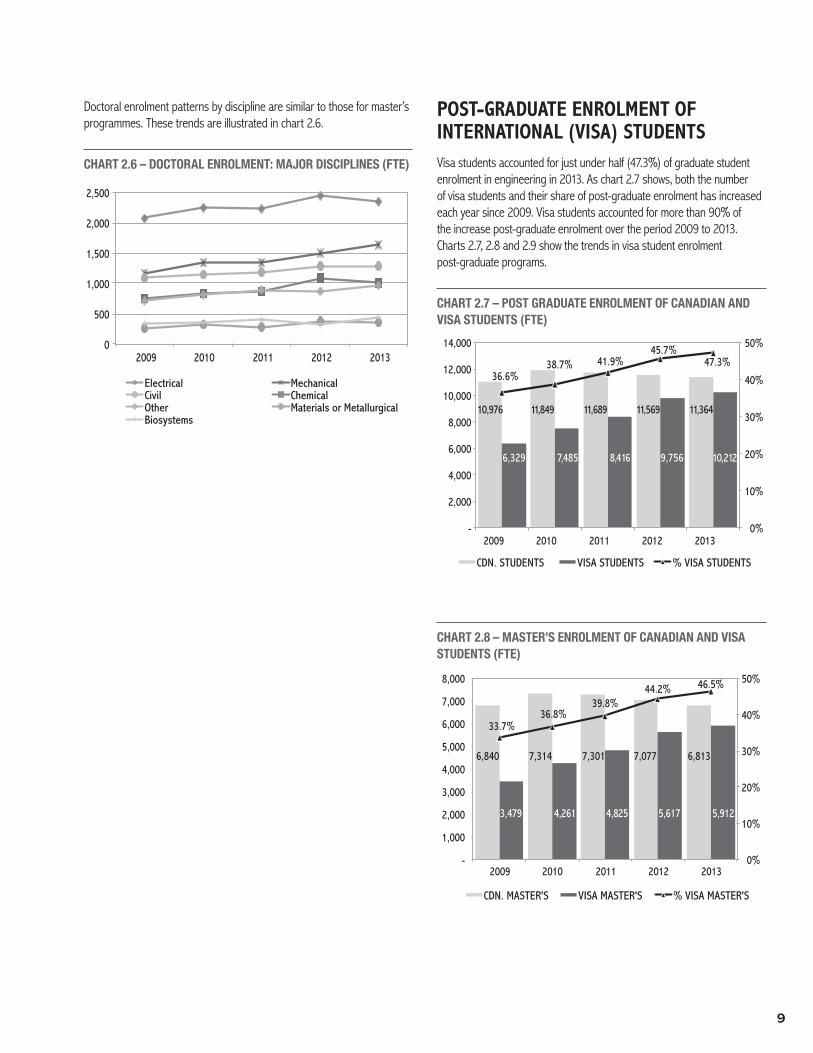
Doctoral enrolment patterns by discipline are similar to those for master’s programmes. These trends are illustrated in chart 2.6.
CHART 2.6 – DOCTORAL ENROLMENT: MAJOR DISCIPLINES (FTE)
0
500
1,000
1,500
2,000
2,500
2009 2010 2011 2012 2013
Electrical Mechanical Civil Chemical Other Materials or Metallurgical Biosystems
POST-GRADUATE ENROLMENT OF INTERNATIONAL (VISA) STUDENTSVisa students accounted for just under half (47.3%) of graduate student enrolment in engineering in 2013. As chart 2.7 shows, both the number of visa students and their share of post-graduate enrolment has increased each year since 2009. Visa students accounted for more than 90% of the increase post-graduate enrolment over the period 2009 to 2013. Charts 2.7, 2.8 and 2.9 show the trends in visa student enrolment post-graduate programs.
CHART 2.7 – POST GRADUATE ENROLMENT OF CANADIAN AND VISA STUDENTS (FTE)
10,976 11,849 11,689 11,569 11,364
6,329 7,485 8,416 9,756 10,212
36.6%38.7% 41.9%
45.7%
0%
10%
20%
30%
40%
50%
-
2,000
4,000
6,000
8,000
10,000
12,000
14,000
2009 2010 2011 2012 2013
CDN. STUDENTS VISA STUDENTS % VISA STUDENTS
47.3%
CHART 2.8 – MASTER’S ENROLMENT OF CANADIAN AND VISA STUDENTS (FTE)
6,840 7,314 7,301 7,077 6,813
3,479 4,261 4,825 5,617 5,912
33.7% 36.8%
39.8% 44.2% 46.5%
0%
10%
20%
30%
40%
50%
-
1,000
2,000
3,000
4,000
5,000
6,000
7,000
8,000
2009 2010 2011 2012 2013
CDN. MASTER'S VISA MASTER'S % VISA MASTER'S
10
CHART 2.9 – DOCTORAL ENROLMENT OF CANADIAN AND VISA STUDENTS (FTE)
4,136 4,535 4,388 4,492 4,551
2,850 3,224 3,591 4,139 4,300
40.8% 41.6% 45.0%
48.0% 48.6%
0%
10%
20%
30%
40%
50%
-
500
1,000
1,500
2,000
2,500
3,000
3,500
4,000
4,500
5,000
2009 2010 2011 2012 2013
CDN. DOCTORAL VISA DOCTORAL % VISA DOCTORAL
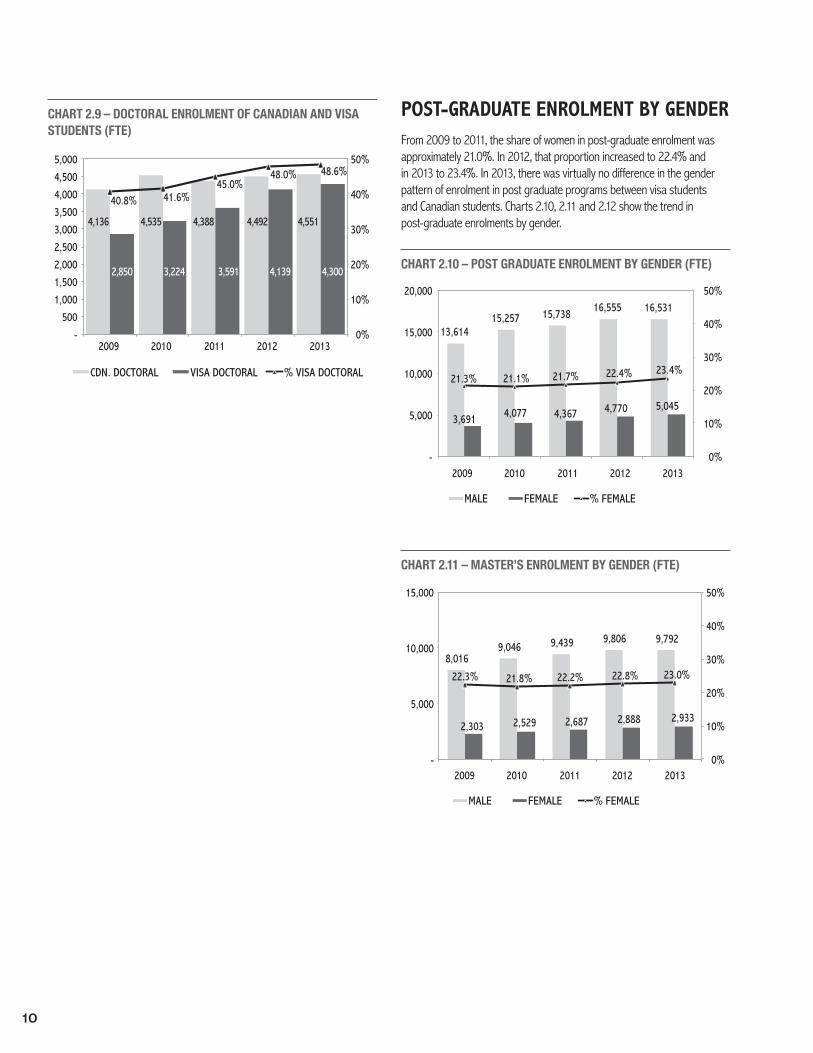
POST-GRADUATE ENROLMENT BY GENDERFrom 2009 to 2011, the share of women in post-graduate enrolment was approximately 21.0%. In 2012, that proportion increased to 22.4% and in 2013 to 23.4%. In 2013, there was virtually no difference in the gender pattern of enrolment in post graduate programs between visa students and Canadian students. Charts 2.10, 2.11 and 2.12 show the trend in post-graduate enrolments by gender.
CHART 2.10 – POST GRADUATE ENROLMENT BY GENDER (FTE)
2009 2010 2011 2012 2013
13,614 15,257 15,738 16,555 16,531
3,691 4,077 4,367 4,770 5,045
21.3% 21.1% 21.7% 22.4% 23.4%
0%
10%
20%
30%
40%
50%
-
5,000
10,000
15,000
20,000
MALE FEMALE % FEMALE
CHART 2.11 – MASTER’S ENROLMENT BY GENDER (FTE)
8,016 9,046 9,439 9,806 9,792
2,303 2,529 2,687 2,888 2,933
22.3% 21.8% 22.2% 22.8% 23.0%
0%
10%
20%
30%
40%
50%
-
5,000
10,000
15,000
MALE FEMALE % FEMALE
2009 2010 2011 2012 2013
11
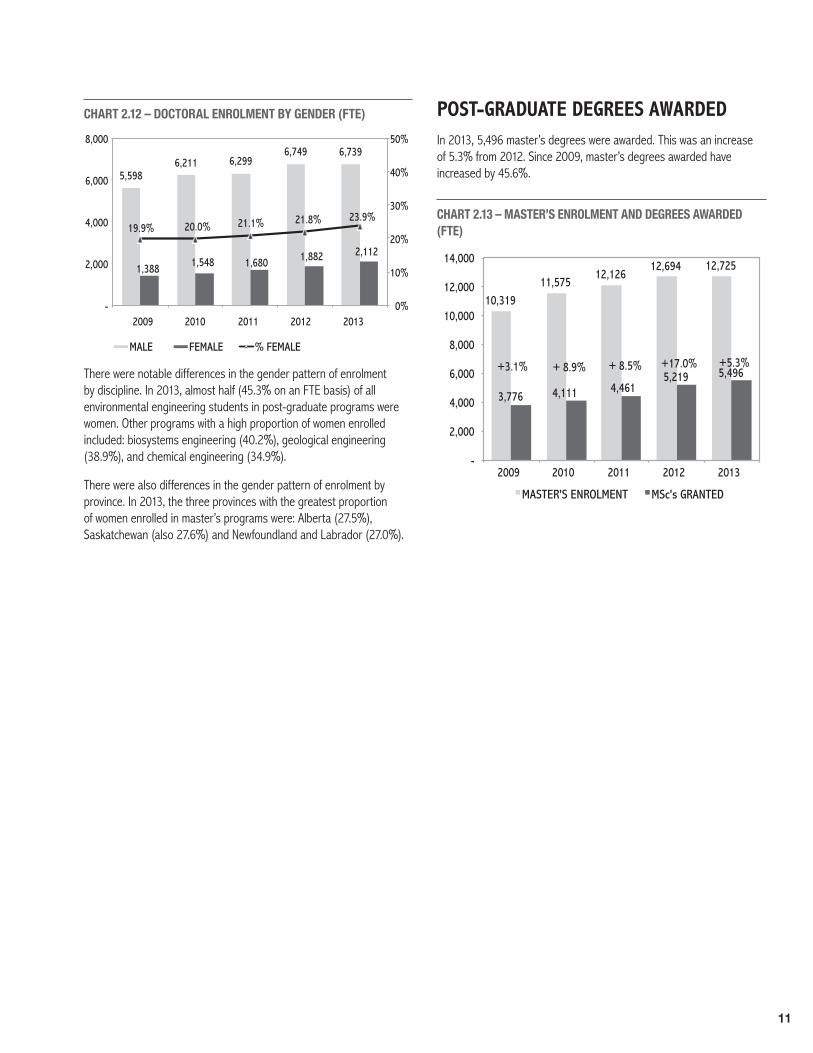
CHART 2.12 – DOCTORAL ENROLMENT BY GENDER (FTE)
5,598 6,211 6,299
6,749 6,739
1,388 1,548 1,680 1,882 2,112
19.9% 20.0% 21.1% 21.8% 23.9%
0%
10%
20%
30%
40%
50%
-
2,000
4,000
6,000
8,000
MALE FEMALE % FEMALE
2009 2010 2011 2012 2013
There were notable differences in the gender pattern of enrolment by discipline. In 2013, almost half (45.3% on an FTE basis) of all environmental engineering students in post-graduate programs were women. Other programs with a high proportion of women enrolled included: biosystems engineering (40.2%), geological engineering (38.9%), and chemical engineering (34.9%).
There were also differences in the gender pattern of enrolment by province. In 2013, the three provinces with the greatest proportion of women enrolled in master’s programs were: Alberta (27.5%), Saskatchewan (also 27.6%) and Newfoundland and Labrador (27.0%).
POST-GRADUATE DEGREES AWARDEDIn 2013, 5,496 master’s degrees were awarded. This was an increase of 5.3% from 2012. Since 2009, master’s degrees awarded have increased by 45.6%.
CHART 2.13 – MASTER’S ENROLMENT AND DEGREES AWARDED (FTE)
10,319 11,575
12,126 12,694 12,725
3,776 4,111 4,461 5,219 5,496 +3.1% + 8.9% + 8.5%
-
2,000
4,000
6,000
8,000
10,000
12,000
14,000
2009 2010 2011 2012 2013
MASTER'S ENROLMENT MSc's GRANTED
+17.0% +5.3%
12
Master’s degrees awarded by gender reflect the same pattern as enrolments.
CHART 2.14 – MASTER’S ENROLMENT AND DEGREES AWARDED BY GENDER (FTE)
911 874 994 1,166 1,275
24.1% 21.3% 22.3% 22.3% 23.2%
0%
10%
20%
30%
40%
50%
-
500
1,000
1,500
2,000
2,500
3,000
3,500
4,000
4,500
2009 2010 2011 2012 2013
MALE, MSc's GRANTED
FEMALE, MSc's GRANTED % FEMALE
2,865 3,237
3,467
4,053 4,221
In 2013, 1,162 PhD’s were awarded. This was an increase of 13.1% when compared to 2009.
CHART 2.15 – DOCTORAL ENROLMENT AND DEGREES AWARDED (FTE)
6,986 7,759 7979
7,971 8,631
1,027 1,052 1,039 1,039 1,162
+ 14.5% + 7.2% +2.4% -1.2% +11.8%
-
1,000
2,000
3,000
4,000
5,000
6,000
7,000
8,000
9,000
2009 2010 2011 2012 2013
DOCTORAL ENROLMENT PhD's GRANTED
In 2013, 16.5% of PhD’s were awarded to women. Over the previous five years, however, women accounted for an average of 21.3% of enrolments in PhD programs. The divergence suggests that women may be experiencing somewhat greater challenges in completing their doctoral programmes.
CHART 2.16 – DOCTORAL ENROLMENT AND DEGREES AWARDED BY GENDER (FTE)
801 848 831 923
1,110
226 204 208 239 220
22.0% 19.4% 20.0% 20.6%
16.5%
0%
10%
20%
30%
40%
50%
-
200
400
600
800
1,000
1,200
2009 2010 2011 2012 2013
MALE, MSc's GRANTED
FEMALE, MSc's GRANTED % FEMALE
Chart 2.17 shows that the number of PhD’s awarded to visa students has increased in tandem with the strong increase in visa student enrolment.
CHART 2.17– POST-GRADUATE ENROLMENT (FTE) AND DEGREES AWARDED BY VISA STUDENTS (ACCREDITED PROGRAMS ONLY)
3,667 3,808 3,653 3,845 4,093
1,136 1,355
1,847
2,536 2,733
23.7% 26.2%
33.6%
39.7% 40.0%
0%
5%
10%
15%
20%
25%
30%
35%
40%
45%
50%
-
500
1,000
1,500
2,000
2,500
3,000
3,500
4,000
4,500
2009 2010 2011 2012 2013
CDN. GRAD DEGREES
VISA GRAD DEGREES % VISA

13
APPENDICES
14
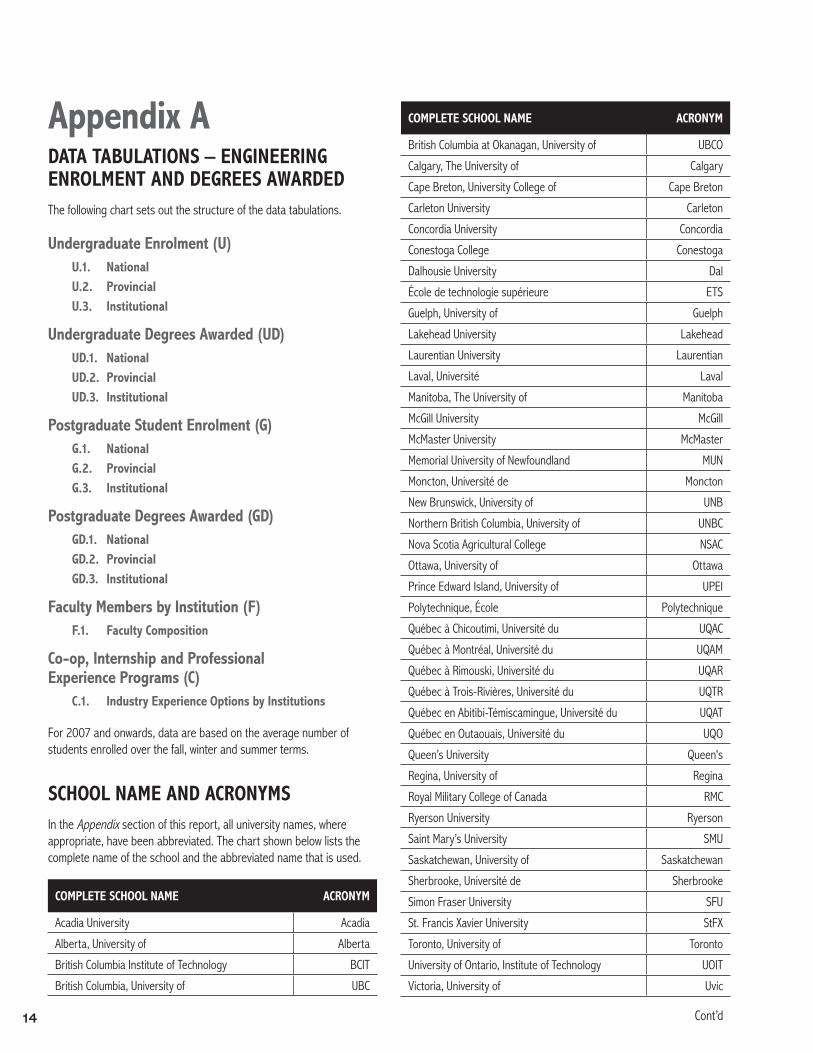
Appendix ADATA TABULATIONS – ENGINEERING ENROLMENT AND DEGREES AWARDEDThe following chart sets out the structure of the data tabulations.
Undergraduate Enrolment (U)U.1. NationalU.2. ProvincialU.3. Institutional
Undergraduate Degrees Awarded (UD)UD.1. NationalUD.2. ProvincialUD.3. Institutional
Postgraduate Student Enrolment (G)G.1. NationalG.2. ProvincialG.3. Institutional
Postgraduate Degrees Awarded (GD)GD.1. NationalGD.2. ProvincialGD.3. Institutional
Faculty Members by Institution (F)F.1. Faculty Composition
Co-op, Internship and Professional Experience Programs (C)
C.1. Industry Experience Options by Institutions
For 2007 and onwards, data are based on the average number of students enrolled over the fall, winter and summer terms.
SCHOOL NAME AND ACRONYMS In the Appendix section of this report, all university names, where appropriate, have been abbreviated. The chart shown below lists the complete name of the school and the abbreviated name that is used.
COMPLETE SCHOOL NAME ACRONYM
Acadia University Acadia
Alberta, University of Alberta
British Columbia Institute of Technology BCIT
British Columbia, University of UBC
COMPLETE SCHOOL NAME ACRONYM
British Columbia at Okanagan, University of UBCO
Calgary, The University of Calgary
Cape Breton, University College of Cape Breton
Carleton University Carleton
Concordia University Concordia
Conestoga College Conestoga
Dalhousie University Dal
École de technologie supérieure ETS
Guelph, University of Guelph
Lakehead University Lakehead
Laurentian University Laurentian
Laval, Université Laval
Manitoba, The University of Manitoba
McGill University McGill
McMaster University McMaster
Memorial University of Newfoundland MUN
Moncton, Université de Moncton
New Brunswick, University of UNB
Northern British Columbia, University of UNBC
Nova Scotia Agricultural College NSAC
Ottawa, University of Ottawa
Prince Edward Island, University of UPEI
Polytechnique, École Polytechnique
Québec à Chicoutimi, Université du UQAC
Québec à Montréal, Université du UQAM
Québec à Rimouski, Université du UQAR
Québec à Trois-Rivières, Université du UQTR
Québec en Abitibi-Témiscamingue, Université du UQAT
Québec en Outaouais, Université du UQO
Queen’s University Queen's
Regina, University of Regina
Royal Military College of Canada RMC
Ryerson University Ryerson
Saint Mary’s University SMU
Saskatchewan, University of Saskatchewan
Sherbrooke, Université de Sherbrooke
Simon Fraser University SFU
St. Francis Xavier University StFX
Toronto, University of Toronto
University of Ontario, Institute of Technology UOIT
Victoria, University of Uvic
Cont’d
15
COMPLETE SCHOOL NAME ACRONYM
Waterloo, University of Waterloo
Western Ontario, University of Western
Windsor, University of Windsor
York University York
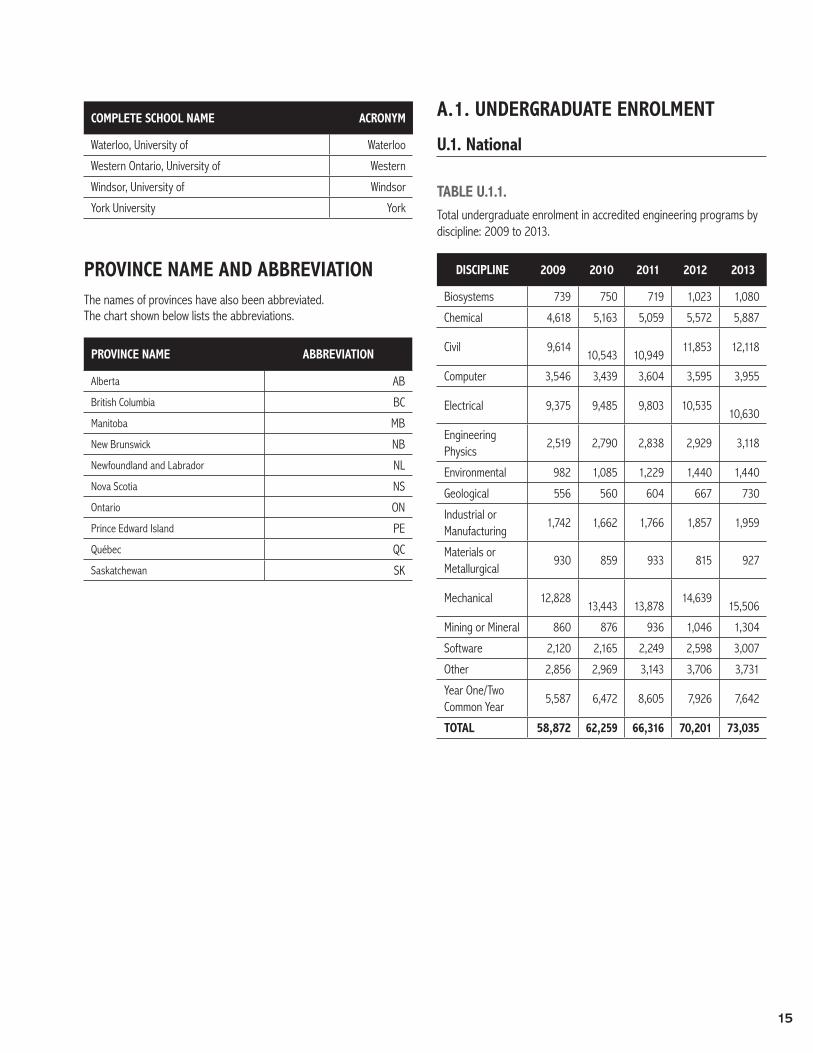
PROVINCE NAME AND ABBREVIATIONThe names of provinces have also been abbreviated. The chart shown below lists the abbreviations.
PROVINCE NAME ABBREVIATION
Alberta AB
British Columbia BC
Manitoba MB
New Brunswick NB
Newfoundland and Labrador NL
Nova Scotia NS
Ontario ON
Prince Edward Island PE
Québec QC
Saskatchewan SK
A.1. UNDERGRADUATE ENROLMENT
U.1. National
TABLE U.1.1. Total undergraduate enrolment in accredited engineering programs by discipline: 2009 to 2013.
DISCIPLINE 2009 2010 2011 2012 2013
Biosystems 739 750 719 1,023 1,080
Chemical 4,618 5,163 5,059 5,572 5,887
Civil 9,614
10,543
10,949 11,853 12,118
Computer 3,546 3,439 3,604 3,595 3,955
Electrical 9,375 9,485 9,803 10,535
10,630
Engineering Physics
2,519 2,790 2,838 2,929 3,118
Environmental 982 1,085 1,229 1,440 1,440
Geological 556 560 604 667 730
Industrial or Manufacturing
1,742 1,662 1,766 1,857 1,959
Materials or Metallurgical
930 859 933 815 927
Mechanical 12,828
13,443
13,878 14,639
15,506
Mining or Mineral 860 876 936 1,046 1,304
Software 2,120 2,165 2,249 2,598 3,007
Other 2,856 2,969 3,143 3,706 3,731
Year One/Two Common Year
5,587 6,472 8,605 7,926 7,642
TOTAL 58,872 62,259 66,316 70,201 73,035
16
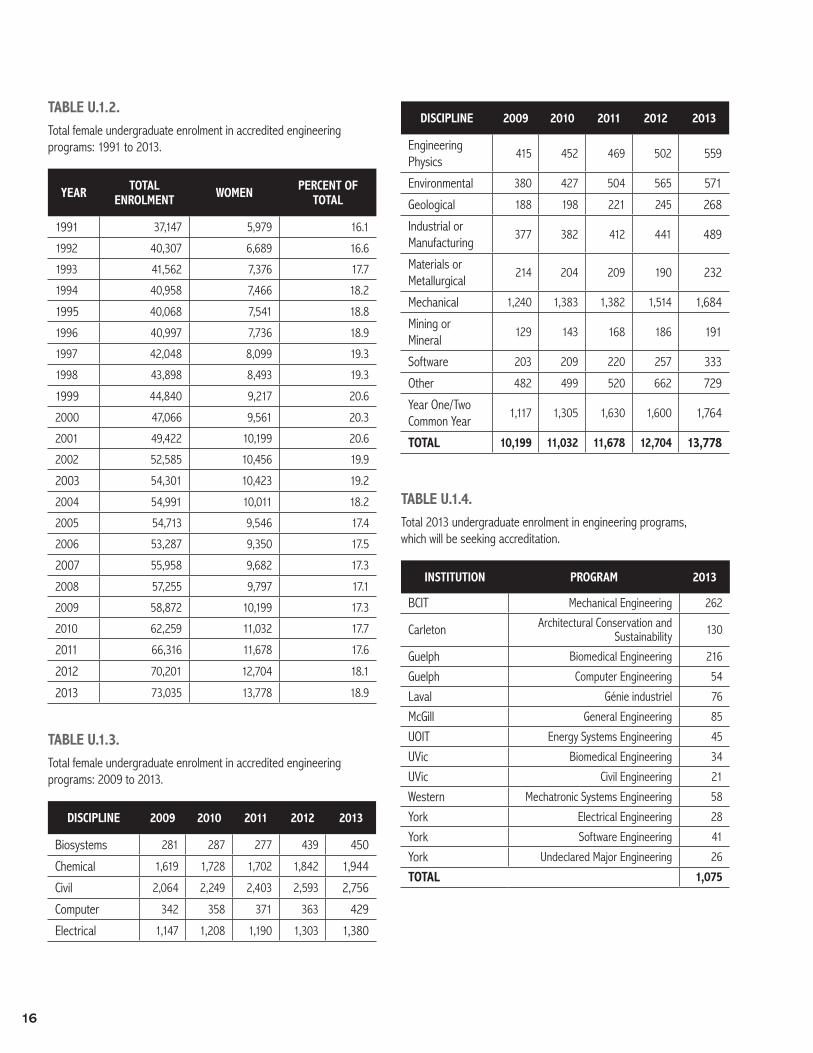
TABLE U.1.2. Total female undergraduate enrolment in accredited engineering programs: 1991 to 2013.
YEAR TOTAL ENROLMENT WOMEN PERCENT OF
TOTAL
1991 37,147 5,979 16.1
1992 40,307 6,689 16.6
1993 41,562 7,376 17.7
1994 40,958 7,466 18.2
1995 40,068 7,541 18.8
1996 40,997 7,736 18.9
1997 42,048 8,099 19.3
1998 43,898 8,493 19.3
1999 44,840 9,217 20.6
2000 47,066 9,561 20.3
2001 49,422 10,199 20.6
2002 52,585 10,456 19.9
2003 54,301 10,423 19.2
2004 54,991 10,011 18.2
2005 54,713 9,546 17.4
2006 53,287 9,350 17.5
2007 55,958 9,682 17.3
2008 57,255 9,797 17.1
2009 58,872 10,199 17.3
2010 62,259 11,032 17.7
2011 66,316 11,678 17.6
2012 70,201 12,704 18.1
2013 73,035 13,778 18.9
TABLE U.1.3. Total female undergraduate enrolment in accredited engineering programs: 2009 to 2013.
DISCIPLINE 2009 2010 2011 2012 2013
Biosystems 281 287 277 439 450
Chemical 1,619 1,728 1,702 1,842 1,944
Civil 2,064 2,249 2,403 2,593 2,756
Computer 342 358 371 363 429
Electrical 1,147 1,208 1,190 1,303 1,380
DISCIPLINE 2009 2010 2011 2012 2013
Engineering Physics
415 452 469 502 559
Environmental 380 427 504 565 571
Geological 188 198 221 245 268
Industrial or Manufacturing
377 382 412 441 489
Materials or Metallurgical
214 204 209 190 232
Mechanical 1,240 1,383 1,382 1,514 1,684
Mining or Mineral
129 143 168 186 191
Software 203 209 220 257 333
Other 482 499 520 662 729
Year One/Two Common Year
1,117 1,305 1,630 1,600 1,764
TOTAL 10,199 11,032 11,678 12,704 13,778
TABLE U.1.4. Total 2013 undergraduate enrolment in engineering programs, which will be seeking accreditation.
INSTITUTION PROGRAM 2013
BCIT Mechanical Engineering 262
Carleton Architectural Conservation and Sustainability 130
Guelph Biomedical Engineering 216
Guelph Computer Engineering 54
Laval Génie industriel 76
McGill General Engineering 85
UOIT Energy Systems Engineering 45
UVic Biomedical Engineering 34
UVic Civil Engineering 21
Western Mechatronic Systems Engineering 58
York Electrical Engineering 28
York Software Engineering 41
York Undeclared Major Engineering 26
TOTAL 1,075
17
U.2. Provincial
TABLE U.2.1. Total undergraduate enrolment in accredited engineering programs by province: 2009 to 2013.
PROVINCE 2009 2010 2011 2012 2013
AB 6,606 6,798 6,897 7,154 7,334
BC 4,470 5,948 7,158 8,168 6,935
MB 1,064 1,088 1,154 1,255 1,412
NB 1,592 1,910 2,018 2,141 2,025
NL 787 762 873 859 937
NS 1,460 1,605 1,777 1,863 2,049
ON 24,806 26,652 28,369 29,556 30,984
PE 102 100 103 111 126
QC 15,985 15,359 15,814 16,969 18,659
SK 1,999 2,038 2,152 2,126 2,574
TOTAL 58,872 62,259 66,316 70,201 73,035
TABLE U.2.2. Total female undergraduate enrolment in accredited engineering programs by province: 2013.
PROVINCE TOTAL ENROLMENT
FEMALE ENROLMENT
PERCENT FEMALE ENROLMENT
AB 7,334 1,600 21.80%
BC 6,935 1,182 17.00%
MB 1,412 250 17.70%
NB 2,025 320 15.80%
NL 937 243 25.90%
NS 2,049 395 19.30%
ON 30,984 5,930 19.10%
PE 126 18 14.30%
QC 18,659 3,295 17.70%
SK 2,574 545 21.20%
TOTAL 73,035 13,778 18.90%
TABLE U.2.3. Total undergraduate foreign student enrolment in accredited engineering programs by province: 2009 to 2013.
PROVINCE 2009 2010 2011 2012 2013
AB 495 584 655 738 795
BC 446 669 829 1,014 1,018
MB 132 129 149 185 245
NB 282 344 611 659 674
NL 101 73 89 86 95
NS 180 284 318 440 479
ON 2,644 3,058 3,498 3,795 4,212
PE - 14 12 12 20
QC 2,399 2,125 2,157 2,290 2,623
SK 277 334 385 405 573
TOTAL 6,955 7,613 8,703 9,622 10,735
18
TABLE U.2.4. Total undergraduate enrolment in accredited engineering programs by discipline and province: 2013.
DISCIPLINE AB BC MB NB NL NS ON PE QC SK TOTAL
Biosystems 78 101 3 3 656 218 20 1,080 Chemical 860 194 222 95 3,304 1,035 178 5,887 Civil 951 746 248 609 148 130 4,277 4,820 191 12,118 Computer 183 443 82 55 46 6 2,159 840 140 3,955 Electrical 1,042 1,244 254 346 88 132 4,422 2,992 110 10,630 Engineering Physics 64 942 297 1,422 352 41 3,118 Environmental 149 62 936 77 216 1,440 Geological 124 60 240 237 69 730 Industrial or Manufacturing
- 104 653 1,043 160 1,959
Materials or Metallurgical
169 138 24 373 222 927
Mechanical 1,375 1,253 430 531 242 189 6,560 4,692 235 15,506 Mining or Mineral 203 158 83 454 407 1,304 Software 159 149 56 1,185 1,403 56 3,007 Other 511 139 85 135 514 1,750 323 275 3,731 Year One/ Two Common Year
1,818 1,177 297 61 280 409 2,592 126 885 7,642
TOTAL 7,334 6,935 1,412 2,025 937 2,049 30,984 126 18,659 2,574 73,035
TABLE U.2.5. Total female undergraduate enrolment in accredited engineering programs by discipline and province: 2013.
DISCIPLINE AB BC MB NB NL NS ON PE QC SK TOTAL
Biosystems 35 45 1 2 263 99 5 450 Chemical 262 62 57 24 1,047 444 47 1,944 Civil 283 139 50 134 50 25 903 1,129 43 2,756 Computer 22 57 11 4 5 1 242 75 14 429 Electrical 166 150 42 29 15 20 604 339 15 1,380 Engineering Physics 8 145 42 306 54 4 559 Environmental 69 34 343 40 85 571 Geological 44 18 100 91 16 268 Industrial or Manufacturing - 19 205 247 18 489 Materials or Metallurgical 42 25 4 111 50 232 Mechanical 194 149 47 44 42 25 667 495 24 1,684 Mining or Mineral 24 20 11 85 51 191 Software 26 13 7 141 133 13 333 Other 129 25 14 49 99 327 49 39 729 Year One/Two Common Year 445 250 56 13 84 91 586 18 222 1,764 TOTAL 1,600 1,182 250 320 243 395 5,930 18 3,295 545 13,778
19
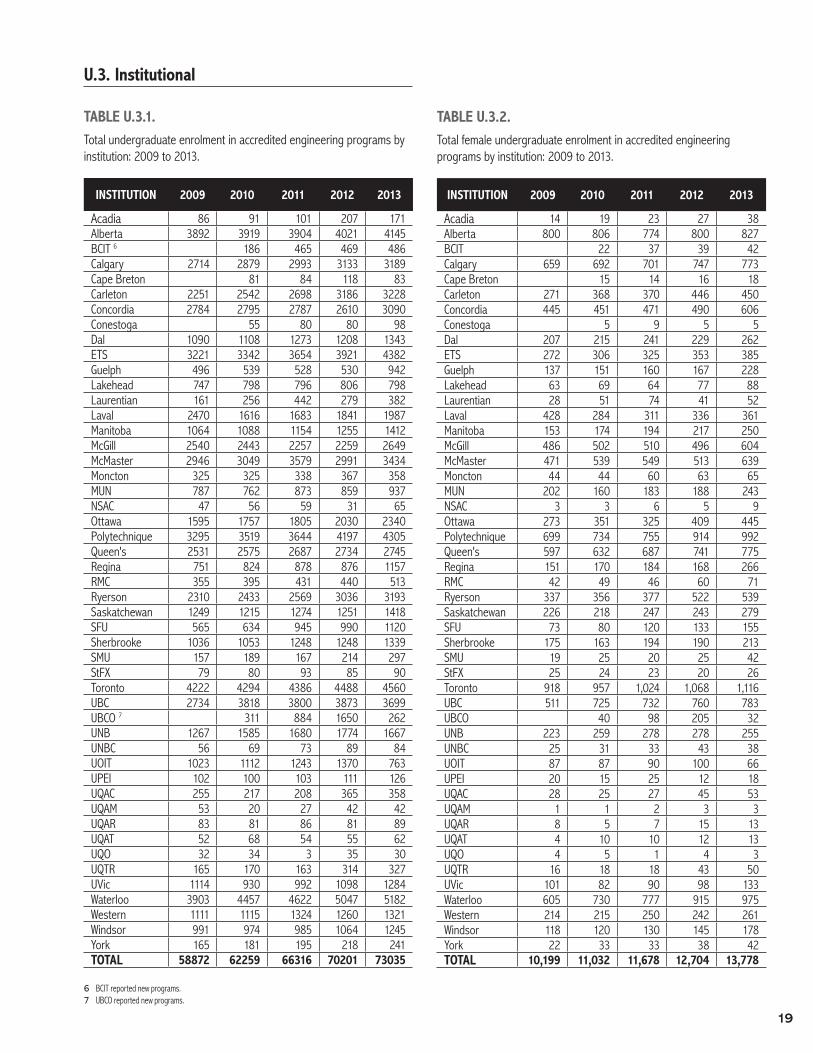
U.3. Institutional
TABLE U.3.1. Total undergraduate enrolment in accredited engineering programs by institution: 2009 to 2013.
INSTITUTION 2009 2010 2011 2012 2013
Acadia 86 91 101 207 171Alberta 3892 3919 3904 4021 4145BCIT 6 186 465 469 486Calgary 2714 2879 2993 3133 3189Cape Breton 81 84 118 83Carleton 2251 2542 2698 3186 3228Concordia 2784 2795 2787 2610 3090Conestoga 55 80 80 98Dal 1090 1108 1273 1208 1343ETS 3221 3342 3654 3921 4382Guelph 496 539 528 530 942Lakehead 747 798 796 806 798Laurentian 161 256 442 279 382Laval 2470 1616 1683 1841 1987Manitoba 1064 1088 1154 1255 1412McGill 2540 2443 2257 2259 2649McMaster 2946 3049 3579 2991 3434Moncton 325 325 338 367 358MUN 787 762 873 859 937NSAC 47 56 59 31 65Ottawa 1595 1757 1805 2030 2340Polytechnique 3295 3519 3644 4197 4305Queen's 2531 2575 2687 2734 2745Regina 751 824 878 876 1157RMC 355 395 431 440 513Ryerson 2310 2433 2569 3036 3193Saskatchewan 1249 1215 1274 1251 1418SFU 565 634 945 990 1120Sherbrooke 1036 1053 1248 1248 1339SMU 157 189 167 214 297StFX 79 80 93 85 90Toronto 4222 4294 4386 4488 4560UBC 2734 3818 3800 3873 3699UBCO 7 311 884 1650 262UNB 1267 1585 1680 1774 1667UNBC 56 69 73 89 84UOIT 1023 1112 1243 1370 763UPEI 102 100 103 111 126UQAC 255 217 208 365 358UQAM 53 20 27 42 42UQAR 83 81 86 81 89UQAT 52 68 54 55 62UQO 32 34 3 35 30UQTR 165 170 163 314 327UVic 1114 930 992 1098 1284Waterloo 3903 4457 4622 5047 5182Western 1111 1115 1324 1260 1321Windsor 991 974 985 1064 1245York 165 181 195 218 241TOTAL 58872 62259 66316 70201 73035
TABLE U.3.2. Total female undergraduate enrolment in accredited engineering programs by institution: 2009 to 2013.
INSTITUTION 2009 2010 2011 2012 2013
Acadia 14 19 23 27 38 Alberta 800 806 774 800 827 BCIT 22 37 39 42 Calgary 659 692 701 747 773 Cape Breton 15 14 16 18 Carleton 271 368 370 446 450 Concordia 445 451 471 490 606 Conestoga 5 9 5 5 Dal 207 215 241 229 262 ETS 272 306 325 353 385 Guelph 137 151 160 167 228 Lakehead 63 69 64 77 88 Laurentian 28 51 74 41 52 Laval 428 284 311 336 361 Manitoba 153 174 194 217 250 McGill 486 502 510 496 604 McMaster 471 539 549 513 639 Moncton 44 44 60 63 65 MUN 202 160 183 188 243 NSAC 3 3 6 5 9 Ottawa 273 351 325 409 445 Polytechnique 699 734 755 914 992 Queen's 597 632 687 741 775 Regina 151 170 184 168 266 RMC 42 49 46 60 71 Ryerson 337 356 377 522 539 Saskatchewan 226 218 247 243 279 SFU 73 80 120 133 155 Sherbrooke 175 163 194 190 213 SMU 19 25 20 25 42 StFX 25 24 23 20 26 Toronto 918 957 1,024 1,068 1,116 UBC 511 725 732 760 783 UBCO 40 98 205 32 UNB 223 259 278 278 255 UNBC 25 31 33 43 38 UOIT 87 87 90 100 66 UPEI 20 15 25 12 18 UQAC 28 25 27 45 53 UQAM 1 1 2 3 3 UQAR 8 5 7 15 13 UQAT 4 10 10 12 13 UQO 4 5 1 4 3 UQTR 16 18 18 43 50 UVic 101 82 90 98 133 Waterloo 605 730 777 915 975 Western 214 215 250 242 261 Windsor 118 120 130 145 178 York 22 33 33 38 42 TOTAL 10,199 11,032 11,678 12,704 13,778
6 BCIT reported new programs. 7 UBCO reported new programs.
20
TABLE U.3.3. Total undergraduate enrolment in accredited engineering programs by institution and discipline: 2013.
INSTITUTION
BIOS
YSTE
MS
CHEM
ICAL
CIVI
L
COM
PUTE
R
ELEC
TRIC
AL
ENGI
NEER
ING
PHYS
ICS
ENVI
RONM
ENTA
L
GEOL
OGIC
AL
INDU
STRI
AL O
R M
ANUF
ACTU
RING
MAT
ERIA
LS O
R M
ETAL
LURG
ICAL
MEC
HANI
CAL
MIN
ING
OR
MIN
ERAL
SOFT
WAR
E
OTHE
R
YEAR
ONE
/TW
O CO
MM
ON Y
EAR
Acadia 171 Alberta 504 566 178 486 64 169 724 203 195 1,056 BCIT 194 293 Calgary 356 385 5 556 651 159 316 762 Cape Breton 83 Carleton 121 594 214 725 79 332 524 174 465 Concordia 1,035 148 360 252 966 329 Conestoga 98 Dal 3 95 130 6 132 62 104 24 189 83 514 ETS 1,388 1,066 348 1,103 477 Guelph 77 65 353 391 57 Lakehead 86 332 144 213 23 Laurentian 94 152 136 Laval 74 94 590 93 133 128 77 90 62 338 136 105 67 Manitoba 101 248 82 254 - 430 297 McGill 390 396 126 559 160 706 121 191 McMaster 478 338 265 428 124 174 438 168 70 950 Moncton 197 75 87 MUN 148 46 88 242 135 280 NSAC 65 Ottawa 202 409 584 121 378 479 166 Polytechnique 144 316 993 259 372 224 117 347 849 150 301 234 Queen's 293 305 91 166 349 164 519 191 667 Regina 100 169 160 56 275 397 RMC 42 109 50 43 66 70 133 Ryerson 257 321 572 237 563 178 572 387 105 Saskatchewan 20 178 191 40 110 41 47 69 235 488 SFU 729 390 Sherbrooke 204 278 164 240 453 SMU 297 StFX 90 Toronto 471 497 397 775 869 354 199 681 126 190 UBC 78 194 436 379 572 213 65 124 138 413 158 139 790 UBCO 117 37 108 UNB 3 222 413 55 271 60 445 56 85 61 UNBC 84 UOIT 175 27 362 67 133 UPEI 126 UQAC 140 20 57 31 110 UQAM 42 UQAR 28 40 22 UQAT 33 29 UQO 30 UQTR 31 101 96 99 UVic 64 343 342 149 387 Waterloo 954 482 582 665 191 76 1,231 452 552 Western 155 215 20 114 222 136 43 415 Windsor 249 246 61 95 520 74 York 117 93 31 TOTAL 1,080 5,887 12,118 3,955 10,630 3,118 1,440 730 1,959 927 15,506 1,304 3,007 3,731 7,642
21
TABLE U.3.4. Total female undergraduate enrolment in accredited engineering programs by institution and discipline: 2013.
INSTITUTIONBI
OSYS
TEM
S
CHEM
ICAL
CIVI
L
COM
PUTE
R
ELEC
TRIC
AL
ENGI
NEER
ING
PHYS
ICS
ENVI
RONM
ENTA
L
GEOL
OGIC
AL
INDU
STRI
AL O
R M
ANUF
ACTU
RING
MAT
ERIA
LS O
R M
ETAL
LURG
ICAL
MEC
HANI
CAL
MIN
ING
OR
MIN
ERAL
SOFT
WAR
E
OTHE
R
YEAR
ONE
/TW
O CO
MM
ON Y
EAR
Acadia 38 Alberta 146 173 21 63 8 42 83 24 33 234 BCIT 25 17 Calgary 116 110 1 103 111 26 96 211 Cape Breton 18 Carleton 39 86 12 104 10 91 34 13 61 Concordia 295 16 56 82 109 48 Conestoga 5 Dal 2 24 25 1 20 34 19 4 25 11 99 ETS 236 77 13 46 13 Guelph 39 6 128 41 15 Lakehead 30 37 5 15 1 Laurentian 22 14 16 Laval 29 29 121 7 11 18 40 29 11 26 15 11 14 Manitoba 45 50 11 42 47 56 McGill 160 138 14 89 39 115 17 32 McMaster 159 65 22 77 10 49 44 15 7 192 Moncton 44 11 11 MUN 50 5 15 42 49 84 NSAC 9 Ottawa 84 110 117 17 42 50 25 Polytechnique 70 164 257 27 56 36 53 130 122 19 29 30 Queen's 123 109 16 25 80 82 96 43 200 Regina 11 62 18 13 39 123 RMC 13 16 6 6 7 5 18 Ryerson 101 98 115 13 64 52 35 46 14 Saskatchewan 5 47 43 3 15 4 23 16 24 99 SFU 122 33 Sherbrooke 84 54 7 16 52 SMU 42 StFX 26 Toronto 179 149 68 140 205 129 63 102 25 56 UBC 35 62 96 55 101 23 31 44 25 74 20 25 192 UBCO 18 7 8 UNB 1 57 91 4 19 18 33 7 14 13 UNBC 38 UOIT 27 1 15 7 16 UPEI 18 UQAC 28 1 7 9 8 UQAM 3 UQAR 5 3 5 UQAT 3 10 UQO 3 UQTR 8 15 23 4 UVic 2 26 34 13 58 Waterloo 258 120 57 71 96 18 124 62 171 Western 56 53 4 12 28 18 11 78 Windsor 37 31 29 22 46 14 York 21 12 9 TOTAL 450 1,944 2,756 429 1,380 559 571 268 489 232 1,684 191 333 729 1,764
22
A.2. UNDERGRADUATE DEGREES AWARDED
UD.1. National
TABLE UD.1.1. Total undergraduate degrees awarded by discipline: 2009 to 2013.
DISCIPLINE 2009 2010 2011 2012 2013
Biosystems 159 162 153 152 194 Chemical 987 1,148 1,161 1,278 1,307 Civil 1,853 1,962 2,235 2,325 2,751 Computer 728 667 568 630 686 Electrical 2,099 2,103 2,041 2,055 2,137 Engineering Physics 499 549 453 515 548
Environmental 135 181 229 258 300 Geological 100 127 128 121 164 Industrial or Manufacturing 341 391 350 369 361
Materials or Metallurgical 177 221 211 207 216
Mechanical 2,728 2,984 2,966 3,153 3,255 Mining or Mineral 139 209 222 237 220 Software 337 367 366 413 434 Other 499 465 678 669 790 TOTAL 10,781 11,536 11,761 12,382 13,363
TABLE UD.1.2.Total undergraduate degrees awarded to female students by discipline: 2009 to 2013.
DISCIPLINE 2009 2010 2011 2012 2013
Biosystems 49 52 51 76 87 Chemical 375 397 399 444 427 Civil 429 426 491 500 605 Computer 64 55 57 69 71 Electrical 270 276 248 259 283 Engineering Physics 96 103 86 76 92 Environmental 48 61 95 116 121 Geological 32 41 42 44 58 Industrial or Manufacturing 63 88 89 94 73
Materials or Metallurgical 35 43 51 58 43
Mechanical 303 307 282 324 344 Mining or Mineral 29 30 46 35 38 Software 26 33 42 39 43 Other 79 76 150 101 162 TOTAL 1,898 1,988 2,129 2,235 2,447
UD.2. Provincial
TABLE UD.2.1. Total undergraduate degrees awarded by province: 2009 to 2013.
PROVINCE 2009 2010 2011 2012 2013
AB 1,147 1,187 1,298 1,246 1,282 BC 884 1,065 1,126 1,161 1,278 MB 165 223 197 172 188 NB 292 256 240 270 320 NL 157 166 151 166 270 NS 266 291 469 397 477 ON 4,752 5,101 5,075 5,508 5,927 QC 2,780 2,896 2,850 3,043 3,202 SK 338 351 355 419 419 TOTAL 10,781 11,536 11,761 12,382 13,363
TABLE UD.2.2. Total undergraduate degrees awarded to female students by province: 2009 to 2013.
PROVINCE 2009 2010 2011 2012 2013
AB 240 272 302 259 290 BC 160 175 208 184 172 MB 24 30 27 22 29 NB 56 33 45 51 45 NL 39 33 33 28 77 NS 35 63 108 80 101 ON 846 858 876 1,021 1,123 QC 448 472 454 496 518 SK 50 52 76 94 92 TOTAL 1,898 1,988 2,129 2,235 2,447
TABLE UD.2.3. Total undergraduate degrees awarded to foreign students by province: 2009 to 2013.
PROVINCE 2009 2010 2011 2012 2013
AB 54 64 90 95 107 BC 93 101 91 110 109 MB 22 38 28 20 14 NB 53 26 38 45 57 NL 6 13 14 4 16 NS 25 19 64 44 65 ON 375 408 411 577 585 QC 273 310 271 327 353 SK 36 30 40 34 63 TOTAL 937 1,009 1,047 1,256 1,369
23
TABLE UD.2.4. Total undergraduate degrees awarded by province and discipline: 2013.
DISCIPLINE AB BC MB NB NL NS ON QC SK
Biosystems 22 22 5 6 99 34 6
Chemical 220 53 43 32 718 185 56
Civil 269 236 58 88 64 64 999 906 67
Computer 38 104 9 15 21 8 348 120 23
Electrical 208 232 21 43 22 29 973 570 39
Engineering Physics 18 147 318 53 12
Environmental 18 47 160 17 58
Geological 28 7 65 37 27
Industrial or Manufacturing 1 32 116 179 33
Materials or Metallurgical 40 33 22 91 30
Mechanical 314 330 77 94 95 77 1,416 792 60
Mining or Mineral 32 34 13 101 40
Software 24 13 3 200 188 6
Other 119 28 22 68 147 323 51 32
TOTAL 1,282 1,278 188 320 270 477 5,927 3,202 419
TABLE UD.2.5. Total undergraduate degrees awarded to women by province and discipline: 2013.
DISCIPLINE AB BC MB NB NL NS ON QC SK
Biosystems 9 7 2 3 48 15 3
Chemical 67 15 18 10 239 67 11
Civil 77 33 14 10 28 10 214 204 15
Computer 2 9 3 2 40 10 5
Electrical 38 23 3 2 4 5 139 59 10
Engineering Physics 3 14 62 11 2
Environmental 10 20 62 7 22
Geological 10 1 26 14 7
Industrial or Manufacturing 6 26 38 3
Materials or Metallurgical 11 6 3 18 5
Mechanical 54 31 5 9 20 9 142 64 10
Mining or Mineral 8 7 1 17 5
Software 5 24 14
Other 25 5 3 22 32 66 5 4
TOTAL 290 172 29 45 77 101 1,123 518 92
24
UD.3. Institutional
TABLE UD.3.1. Total undergraduate degrees awarded by institution: 2009 to 2013.
INSTITUTION 2009 2010 2011 2012 2013
Alberta 702 739 836 805 760 BCIT 18 27 36 41 52 Calgary 445 448 462 441 522 Carleton 403 409 395 401 427 Concordia 407 421 350 402 462 Conestoga 10 9 11 11 Dal 266 291 469 397 477 ETS 680 620 724 681 828 Guelph 90 69 95 87 104 Lakehead 257 251 223 282 302 Laurentian 22 35 118 132 249 Laval 258 400 347 327 300 Manitoba 165 223 197 172 188 McGill 439 500 456 513 487 McMaster 504 569 582 583 590 Moncton 32 50 30 45 67 MUN 157 166 151 166 270 Ottawa 317 286 252 254 286 Polytechnique 502 576 583 659 686 Queen's 500 543 507 620 641 Regina 83 99 104 128 123 RMC 74 40 77 72 93 Ryerson 439 402 409 442 514 Saskatchewan 255 252 251 291 296 SFU 81 90 94 112 142 Sherbrooke 305 264 284 291 279 Toronto 836 931 893 962 960 UBC 640 726 723 716 764 UBCO - 56 103 118 142 UNB 260 206 210 225 253 UNBC 6 8 19 14 14 UOIT 140 225 158 196 228 UQAC 42 37 44 42 65 UQAM 10 7 4 9 9 UQAR 17 17 15 14 16 UQAT 21 27 18 11 7 UQO 6 6 1 35 7 UQTR 93 21 24 59 56 UVic 139 158 151 160 164 Waterloo 785 862 950 990 1,082 Western 247 246 208 232 249 Windsor 103 203 184 222 191 York 35 20 15 22 TOTAL 10,781 11,536 11,761 12,382 13,363
TABLE UD.3.2. Total undergraduate degrees awarded to female students by institution: 2009 to 2013.
INSTITUTION 2009 2010 2011 2012 2013
Alberta 142 158 186 150 159BCIT 3 2 2 1 1Calgary 98 114 116 109 131Carleton 48 58 54 69 74Concordia 76 71 51 63 88Conestoga 0 0 1 1Dal 35 63 108 80 101ETS 56 50 68 54 90Guelph 22 17 22 35 30Lakehead 18 20 22 20 28Laurentian 2 7 24 27 33Laval 36 81 60 61 49Manitoba 24 30 27 22 29McGill 102 82 91 112 75McMaster 117 90 98 100 104Moncton 6 2 0 8 8MUN 39 33 33 28 77Ottawa 51 48 44 40 57Polytechnique 99 128 127 157 148Queen's 106 129 120 154 170Regina 10 14 34 29 23RMC 15 8 14 4 11Ryerson 77 59 54 80 92Saskatchewan 40 38 42 65 69SFU 13 15 14 13 12Sherbrooke 55 50 51 35 46Toronto 175 206 175 227 207UBC 128 124 152 135 128UBCO 0 9 19 13 11UNB 50 31 45 43 37UNBC 2 3 10 7 8UOIT 15 25 12 21 21UQAC 7 2 2 6 8UQAM 1 1 0 0 0UQAR 2 3 1 1 0UQAT 3 2 1 1 2UQO 0 1 0 4 2UQTR 11 1 2 2 10UVic 14 22 11 15 12Waterloo 122 134 162 156 218Western 50 36 48 49 48Windsor 25 21 23 33 29York 3 0 4 5TOTAL 1,898 1,988 2,129 2,235 2,447
25
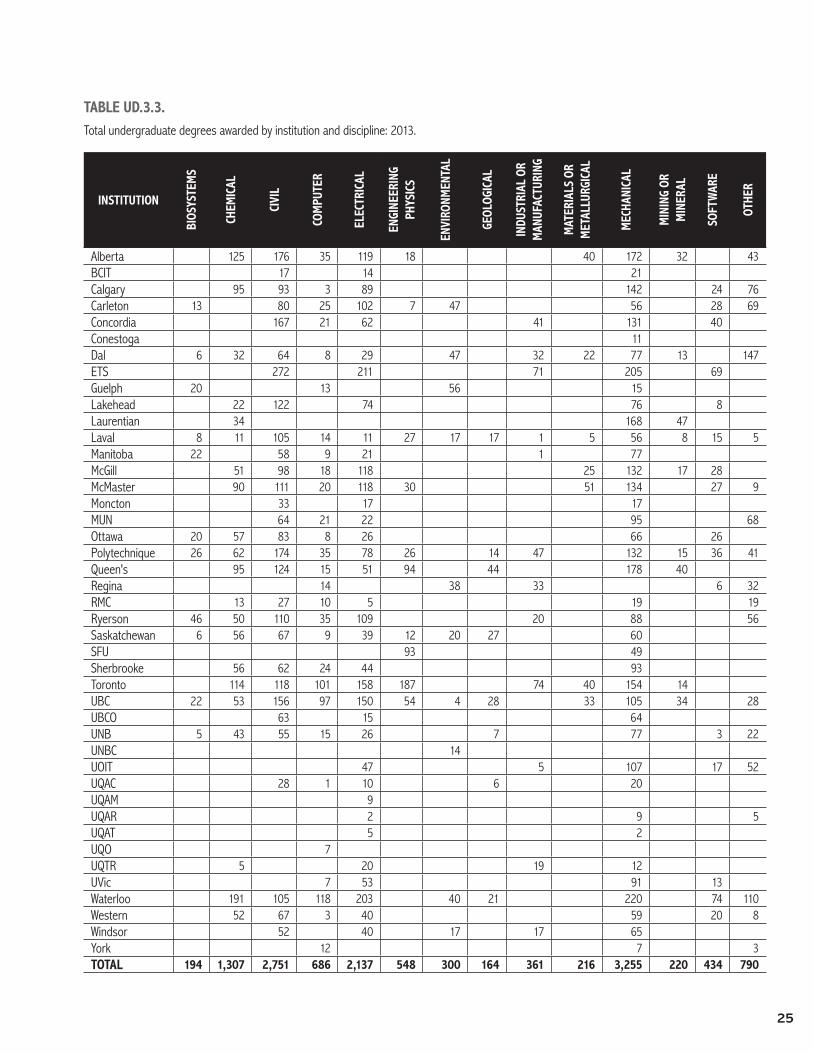
TABLE UD.3.3.Total undergraduate degrees awarded by institution and discipline: 2013.
INSTITUTIONBI
OSYS
TEM
S
CHEM
ICAL
CIVI
L
COM
PUTE
R
ELEC
TRIC
AL
ENGI
NEER
ING
PHYS
ICS
ENVI
RONM
ENTA
L
GEOL
OGIC
AL
INDU
STRI
AL O
R M
ANUF
ACTU
RING
MAT
ERIA
LS O
R M
ETAL
LURG
ICAL
MEC
HANI
CAL
MIN
ING
OR
MIN
ERAL
SOFT
WAR
E
OTHE
R
Alberta 125 176 35 119 18 40 172 32 43 BCIT 17 14 21 Calgary 95 93 3 89 142 24 76 Carleton 13 80 25 102 7 47 56 28 69 Concordia 167 21 62 41 131 40 Conestoga 11 Dal 6 32 64 8 29 47 32 22 77 13 147 ETS 272 211 71 205 69 Guelph 20 13 56 15 Lakehead 22 122 74 76 8 Laurentian 34 168 47 Laval 8 11 105 14 11 27 17 17 1 5 56 8 15 5 Manitoba 22 58 9 21 1 77 McGill 51 98 18 118 25 132 17 28 McMaster 90 111 20 118 30 51 134 27 9 Moncton 33 17 17 MUN 64 21 22 95 68 Ottawa 20 57 83 8 26 66 26 Polytechnique 26 62 174 35 78 26 14 47 132 15 36 41 Queen's 95 124 15 51 94 44 178 40 Regina 14 38 33 6 32 RMC 13 27 10 5 19 19 Ryerson 46 50 110 35 109 20 88 56 Saskatchewan 6 56 67 9 39 12 20 27 60 SFU 93 49 Sherbrooke 56 62 24 44 93 Toronto 114 118 101 158 187 74 40 154 14 UBC 22 53 156 97 150 54 4 28 33 105 34 28 UBCO 63 15 64 UNB 5 43 55 15 26 7 77 3 22 UNBC 14 UOIT 47 5 107 17 52 UQAC 28 1 10 6 20 UQAM 9 UQAR 2 9 5 UQAT 5 2 UQO 7 UQTR 5 20 19 12 UVic 7 53 91 13 Waterloo 191 105 118 203 40 21 220 74 110 Western 52 67 3 40 59 20 8 Windsor 52 40 17 17 65 York 12 7 3TOTAL 194 1,307 2,751 686 2,137 548 300 164 361 216 3,255 220 434 790

26
TABLE UD.3.4.Total undergraduate degrees awarded to women by institution and discipline: 2013.
INSTITUTION
BIOS
YSTE
MS
CHEM
ICAL
CIVI
L
COM
PUTE
R
ELEC
TRIC
AL
ENGI
NEER
ING
PHYS
ICS
ENVI
RONM
ENTA
L
GEOL
OGIC
AL
INDU
STRI
AL O
R M
ANUF
ACTU
RING
MAT
ERIA
LS O
R M
ETAL
LURG
ICAL
MEC
HANI
CAL
MIN
ING
OR
MIN
ERAL
SOFT
WAR
E
OTHE
R
Alberta 34 45 2 22 3 11 28 8 6BCIT 1Calgary 33 32 16 26 5 19Carleton 5 8 1 27 17 2 3 11Concordia 46 1 8 12 14 7Conestoga 1Dal 3 10 10 2 5 20 6 3 9 1 32ETS 55 18 3 11 3Guelph 11 1 15 3Lakehead 5 14 4 4 1Laurentian 10 17 6Laval 3 4 20 1 1 5 7 4 2 1 1Manitoba 7 14 3 5McGill 14 30 12 5 14McMaster 33 23 1 25 2 7 9 4Moncton 6 2MUN 28 3 4 20 22Ottawa 13 11 15 2 11 5Polytechnique 12 28 36 5 14 6 7 19 11 3 3 4Queen's 41 38 1 4 23 21 33 9Regina 4 12 3 4RMC 3 3 1 2 2Ryerson 19 14 29 4 14 2 4 6Saskatchewan 3 11 15 1 10 2 10 7 10SFU 8 4Sherbrooke 19 14 1 3 9Toronto 41 34 17 30 37 19 11 16 2UBC 9 15 25 9 18 6 2 10 6 16 7 5UBCO 7 4UNB 2 18 4 1 9 3UNBC 8UOIT 3 4 3 11UQAC 3 3 2UQAMUQARUQAT 1 1UQO 2UQTR 2 2 4 2UVic 5 7Waterloo 65 23 14 23 21 5 22 7 38Western 16 21 4 6 1Windsor 6 1 9 5 8York 1 3 1TOTAL 87 427 605 71 283 92 121 58 73 43 344 38 43 162
27
A.3. POST GRADUATE STUDENT ENROLMENT
G.1. National
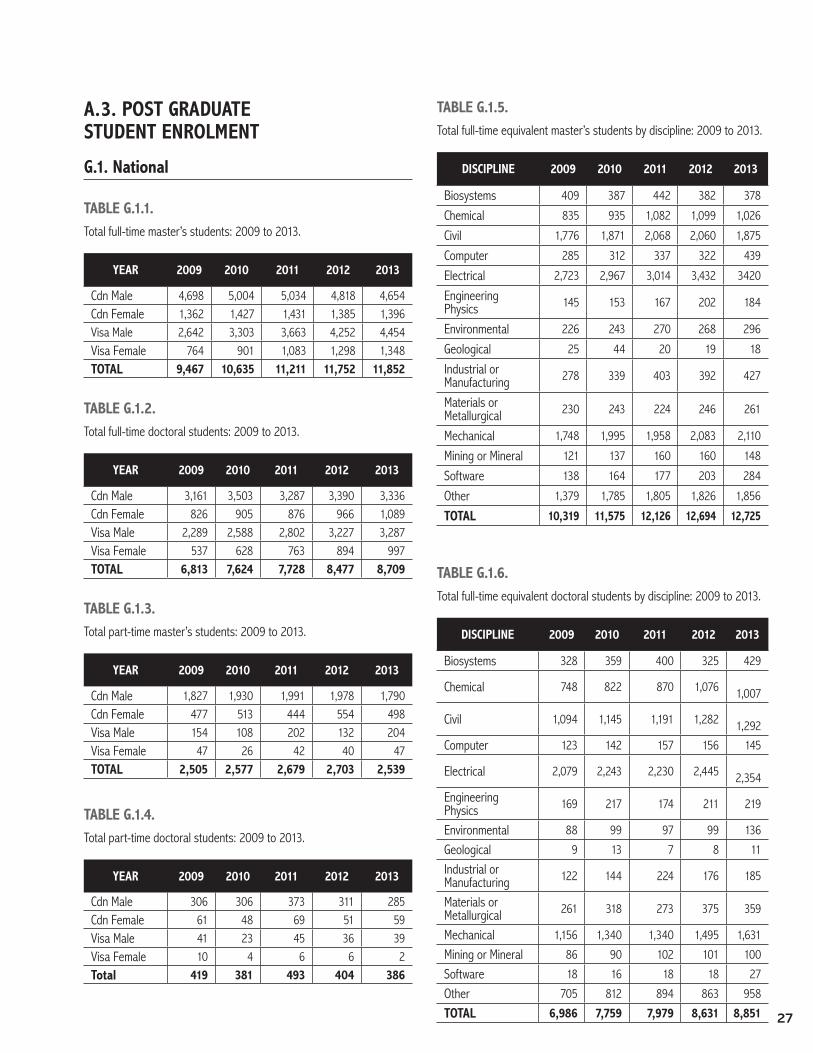
TABLE G.1.1.Total full-time master’s students: 2009 to 2013.
YEAR 2009 2010 2011 2012 2013
Cdn Male 4,698 5,004 5,034 4,818 4,654 Cdn Female 1,362 1,427 1,431 1,385 1,396 Visa Male 2,642 3,303 3,663 4,252 4,454 Visa Female 764 901 1,083 1,298 1,348 TOTAL 9,467 10,635 11,211 11,752 11,852
TABLE G.1.2.Total full-time doctoral students: 2009 to 2013.
YEAR 2009 2010 2011 2012 2013
Cdn Male 3,161 3,503 3,287 3,390 3,336 Cdn Female 826 905 876 966 1,089 Visa Male 2,289 2,588 2,802 3,227 3,287 Visa Female 537 628 763 894 997 TOTAL 6,813 7,624 7,728 8,477 8,709
TABLE G.1.3.Total part-time master’s students: 2009 to 2013.
YEAR 2009 2010 2011 2012 2013
Cdn Male 1,827 1,930 1,991 1,978 1,790Cdn Female 477 513 444 554 498Visa Male 154 108 202 132 204Visa Female 47 26 42 40 47TOTAL 2,505 2,577 2,679 2,703 2,539
TABLE G.1.4.Total part-time doctoral students: 2009 to 2013.
YEAR 2009 2010 2011 2012 2013
Cdn Male 306 306 373 311 285Cdn Female 61 48 69 51 59Visa Male 41 23 45 36 39Visa Female 10 4 6 6 2Total 419 381 493 404 386
TABLE G.1.5.Total full-time equivalent master’s students by discipline: 2009 to 2013.
DISCIPLINE 2009 2010 2011 2012 2013
Biosystems 409 387 442 382 378
Chemical 835 935 1,082 1,099 1,026
Civil 1,776 1,871 2,068 2,060 1,875
Computer 285 312 337 322 439
Electrical 2,723 2,967 3,014 3,432 3420
Engineering Physics 145 153 167 202 184
Environmental 226 243 270 268 296
Geological 25 44 20 19 18
Industrial or Manufacturing 278 339 403 392 427
Materials or Metallurgical 230 243 224 246 261
Mechanical 1,748 1,995 1,958 2,083 2,110
Mining or Mineral 121 137 160 160 148
Software 138 164 177 203 284
Other 1,379 1,785 1,805 1,826 1,856
TOTAL 10,319 11,575 12,126 12,694 12,725
TABLE G.1.6.Total full-time equivalent doctoral students by discipline: 2009 to 2013.
DISCIPLINE 2009 2010 2011 2012 2013
Biosystems 328 359 400 325 429
Chemical 748 822 870 1,076 1,007
Civil 1,094 1,145 1,191 1,282 1,292
Computer 123 142 157 156 145
Electrical 2,079 2,243 2,230 2,445 2,354
Engineering Physics 169 217 174 211 219
Environmental 88 99 97 99 136
Geological 9 13 7 8 11
Industrial or Manufacturing 122 144 224 176 185
Materials or Metallurgical 261 318 273 375 359
Mechanical 1,156 1,340 1,340 1,495 1,631
Mining or Mineral 86 90 102 101 100
Software 18 16 18 18 27
Other 705 812 894 863 958
TOTAL 6,986 7,759 7,979 8,631 8,851
28
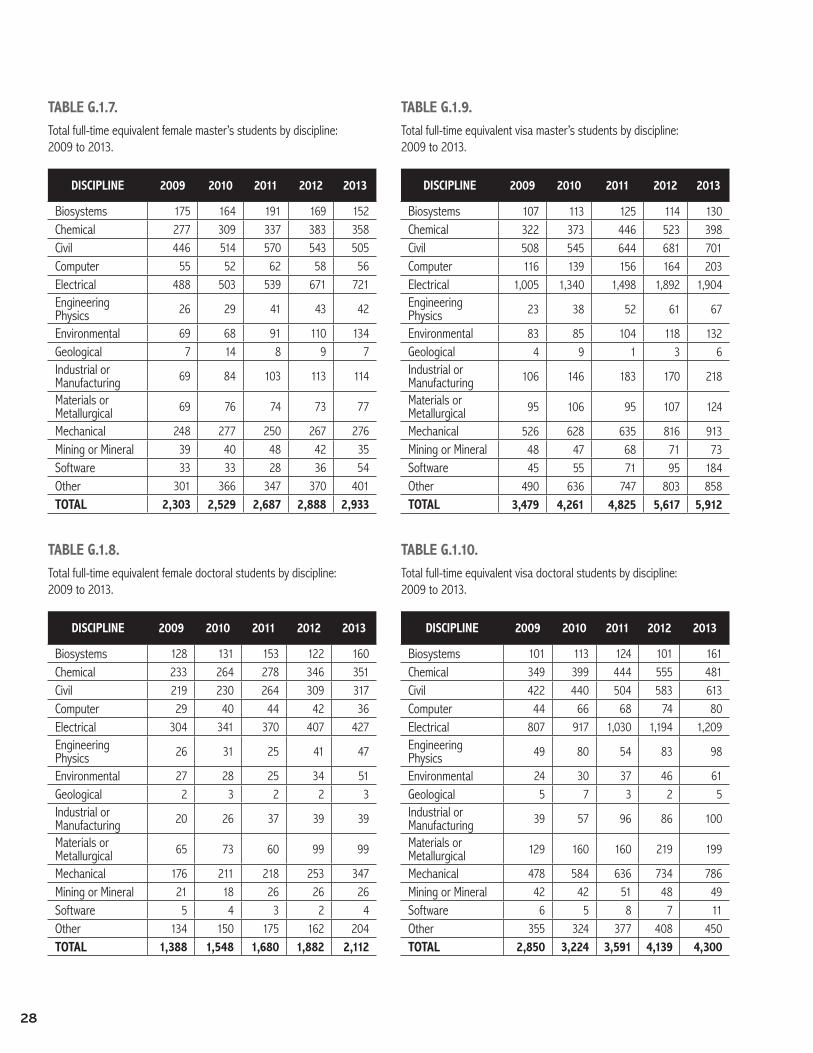
TABLE G.1.7.Total full-time equivalent female master’s students by discipline: 2009 to 2013.
DISCIPLINE 2009 2010 2011 2012 2013
Biosystems 175 164 191 169 152Chemical 277 309 337 383 358Civil 446 514 570 543 505Computer 55 52 62 58 56Electrical 488 503 539 671 721Engineering Physics 26 29 41 43 42
Environmental 69 68 91 110 134Geological 7 14 8 9 7Industrial or Manufacturing 69 84 103 113 114
Materials or Metallurgical 69 76 74 73 77
Mechanical 248 277 250 267 276Mining or Mineral 39 40 48 42 35Software 33 33 28 36 54Other 301 366 347 370 401TOTAL 2,303 2,529 2,687 2,888 2,933
TABLE G.1.8.Total full-time equivalent female doctoral students by discipline: 2009 to 2013.
DISCIPLINE 2009 2010 2011 2012 2013
Biosystems 128 131 153 122 160Chemical 233 264 278 346 351Civil 219 230 264 309 317Computer 29 40 44 42 36Electrical 304 341 370 407 427Engineering Physics 26 31 25 41 47
Environmental 27 28 25 34 51Geological 2 3 2 2 3Industrial or Manufacturing 20 26 37 39 39
Materials or Metallurgical 65 73 60 99 99
Mechanical 176 211 218 253 347Mining or Mineral 21 18 26 26 26Software 5 4 3 2 4Other 134 150 175 162 204TOTAL 1,388 1,548 1,680 1,882 2,112
TABLE G.1.9.Total full-time equivalent visa master’s students by discipline: 2009 to 2013.
DISCIPLINE 2009 2010 2011 2012 2013
Biosystems 107 113 125 114 130Chemical 322 373 446 523 398Civil 508 545 644 681 701Computer 116 139 156 164 203Electrical 1,005 1,340 1,498 1,892 1,904Engineering Physics 23 38 52 61 67
Environmental 83 85 104 118 132Geological 4 9 1 3 6Industrial or Manufacturing 106 146 183 170 218
Materials or Metallurgical 95 106 95 107 124
Mechanical 526 628 635 816 913Mining or Mineral 48 47 68 71 73Software 45 55 71 95 184Other 490 636 747 803 858TOTAL 3,479 4,261 4,825 5,617 5,912
TABLE G.1.10.Total full-time equivalent visa doctoral students by discipline: 2009 to 2013.
DISCIPLINE 2009 2010 2011 2012 2013
Biosystems 101 113 124 101 161Chemical 349 399 444 555 481Civil 422 440 504 583 613Computer 44 66 68 74 80Electrical 807 917 1,030 1,194 1,209Engineering Physics 49 80 54 83 98
Environmental 24 30 37 46 61Geological 5 7 3 2 5Industrial or Manufacturing 39 57 96 86 100
Materials or Metallurgical 129 160 160 219 199
Mechanical 478 584 636 734 786Mining or Mineral 42 42 51 48 49Software 6 5 8 7 11Other 355 324 377 408 450TOTAL 2,850 3,224 3,591 4,139 4,300
29
G.2. Provincial
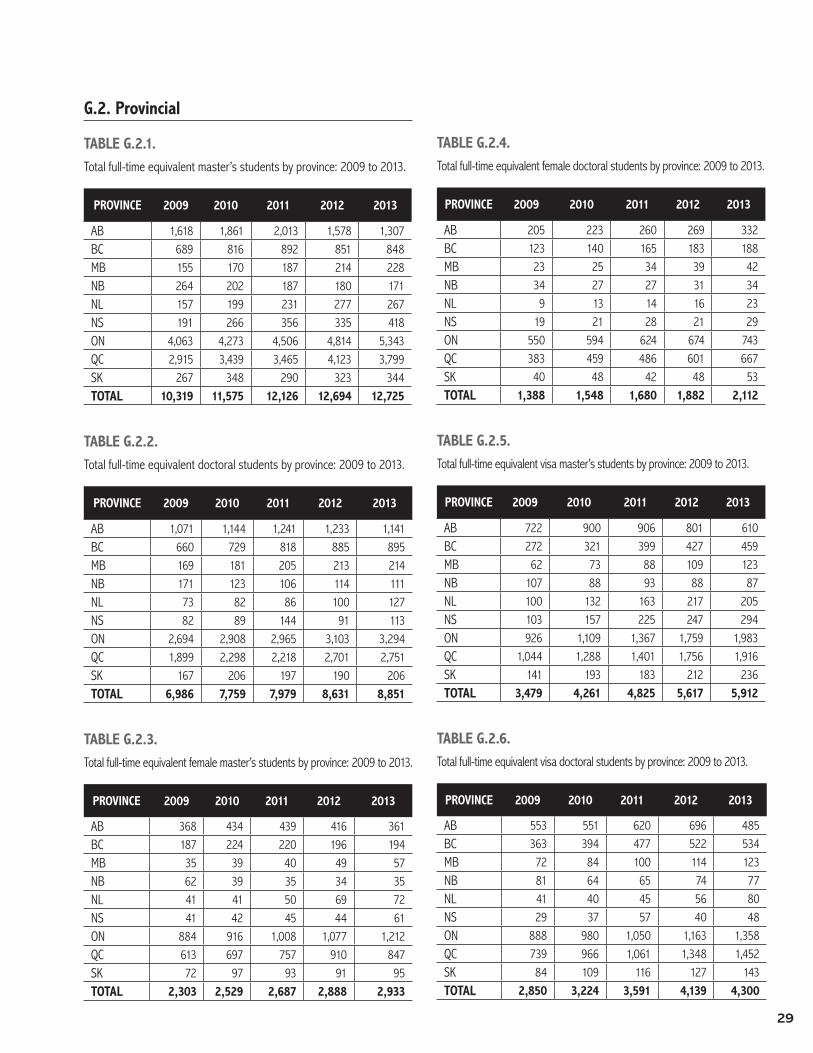
TABLE G.2.1.Total full-time equivalent master’s students by province: 2009 to 2013.
PROVINCE 2009 2010 2011 2012 2013
AB 1,618 1,861 2,013 1,578 1,307 BC 689 816 892 851 848 MB 155 170 187 214 228 NB 264 202 187 180 171 NL 157 199 231 277 267 NS 191 266 356 335 418 ON 4,063 4,273 4,506 4,814 5,343 QC 2,915 3,439 3,465 4,123 3,799 SK 267 348 290 323 344 TOTAL 10,319 11,575 12,126 12,694 12,725
TABLE G.2.2.Total full-time equivalent doctoral students by province: 2009 to 2013.
PROVINCE 2009 2010 2011 2012 2013
AB 1,071 1,144 1,241 1,233 1,141 BC 660 729 818 885 895 MB 169 181 205 213 214 NB 171 123 106 114 111 NL 73 82 86 100 127 NS 82 89 144 91 113 ON 2,694 2,908 2,965 3,103 3,294 QC 1,899 2,298 2,218 2,701 2,751 SK 167 206 197 190 206 TOTAL 6,986 7,759 7,979 8,631 8,851
TABLE G.2.3.Total full-time equivalent female master’s students by province: 2009 to 2013.
PROVINCE 2009 2010 2011 2012 2013
AB 368 434 439 416 361BC 187 224 220 196 194MB 35 39 40 49 57NB 62 39 35 34 35NL 41 41 50 69 72NS 41 42 45 44 61ON 884 916 1,008 1,077 1,212QC 613 697 757 910 847SK 72 97 93 91 95TOTAL 2,303 2,529 2,687 2,888 2,933
TABLE G.2.4.Total full-time equivalent female doctoral students by province: 2009 to 2013.
PROVINCE 2009 2010 2011 2012 2013
AB 205 223 260 269 332BC 123 140 165 183 188MB 23 25 34 39 42NB 34 27 27 31 34NL 9 13 14 16 23NS 19 21 28 21 29ON 550 594 624 674 743QC 383 459 486 601 667SK 40 48 42 48 53TOTAL 1,388 1,548 1,680 1,882 2,112
TABLE G.2.5.Total full-time equivalent visa master’s students by province: 2009 to 2013.
PROVINCE 2009 2010 2011 2012 2013
AB 722 900 906 801 610BC 272 321 399 427 459MB 62 73 88 109 123NB 107 88 93 88 87NL 100 132 163 217 205NS 103 157 225 247 294ON 926 1,109 1,367 1,759 1,983QC 1,044 1,288 1,401 1,756 1,916SK 141 193 183 212 236TOTAL 3,479 4,261 4,825 5,617 5,912
TABLE G.2.6.Total full-time equivalent visa doctoral students by province: 2009 to 2013.
PROVINCE 2009 2010 2011 2012 2013
AB 553 551 620 696 485 BC 363 394 477 522 534 MB 72 84 100 114 123 NB 81 64 65 74 77 NL 41 40 45 56 80 NS 29 37 57 40 48 ON 888 980 1,050 1,163 1,358 QC 739 966 1,061 1,348 1,452 SK 84 109 116 127 143 TOTAL 2,850 3,224 3,591 4,139 4,300
30
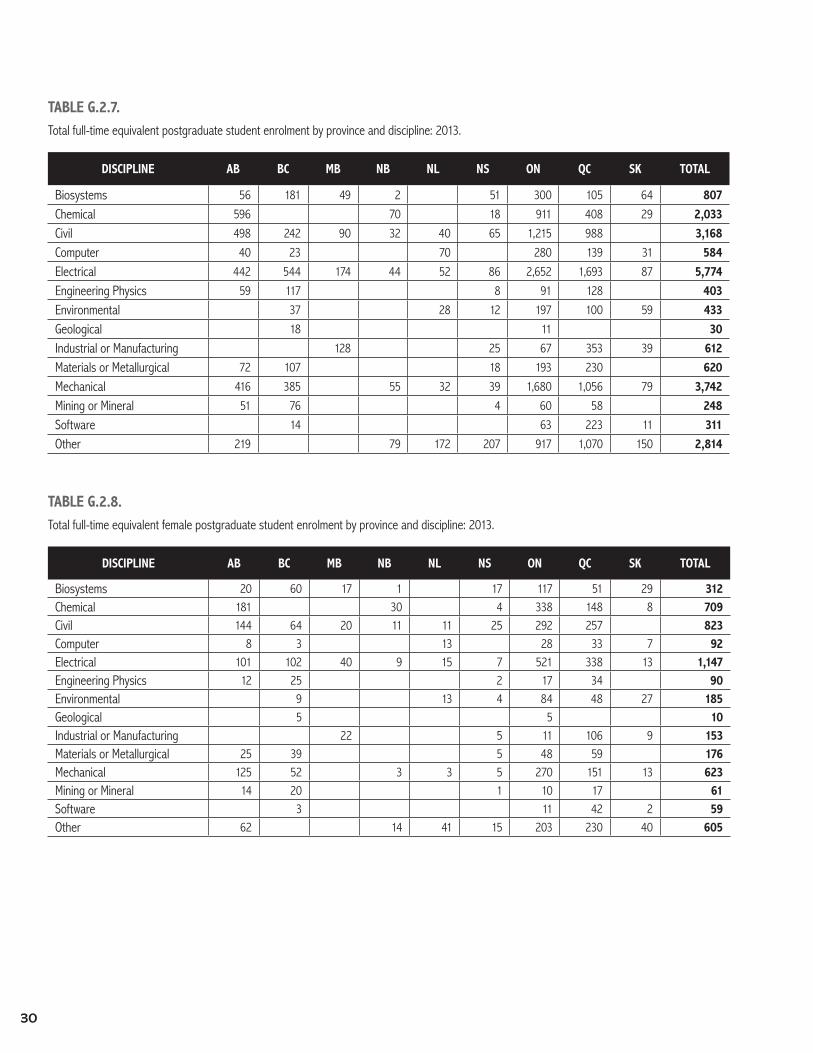
TABLE G.2.7.Total full-time equivalent postgraduate student enrolment by province and discipline: 2013.
DISCIPLINE AB BC MB NB NL NS ON QC SK TOTAL
Biosystems 56 181 49 2 51 300 105 64 807
Chemical 596 70 18 911 408 29 2,033
Civil 498 242 90 32 40 65 1,215 988 3,168
Computer 40 23 70 280 139 31 584
Electrical 442 544 174 44 52 86 2,652 1,693 87 5,774
Engineering Physics 59 117 8 91 128 403
Environmental 37 28 12 197 100 59 433
Geological 18 11 30
Industrial or Manufacturing 128 25 67 353 39 612
Materials or Metallurgical 72 107 18 193 230 620
Mechanical 416 385 55 32 39 1,680 1,056 79 3,742
Mining or Mineral 51 76 4 60 58 248
Software 14 63 223 11 311
Other 219 79 172 207 917 1,070 150 2,814
TABLE G.2.8.Total full-time equivalent female postgraduate student enrolment by province and discipline: 2013.
DISCIPLINE AB BC MB NB NL NS ON QC SK TOTAL
Biosystems 20 60 17 1 17 117 51 29 312 Chemical 181 30 4 338 148 8 709 Civil 144 64 20 11 11 25 292 257 823 Computer 8 3 13 28 33 7 92 Electrical 101 102 40 9 15 7 521 338 13 1,147 Engineering Physics 12 25 2 17 34 90 Environmental 9 13 4 84 48 27 185 Geological 5 5 10 Industrial or Manufacturing 22 5 11 106 9 153 Materials or Metallurgical 25 39 5 48 59 176 Mechanical 125 52 3 3 5 270 151 13 623 Mining or Mineral 14 20 1 10 17 61 Software 3 11 42 2 59 Other 62 14 41 15 203 230 40 605
31
G.3. Institutional
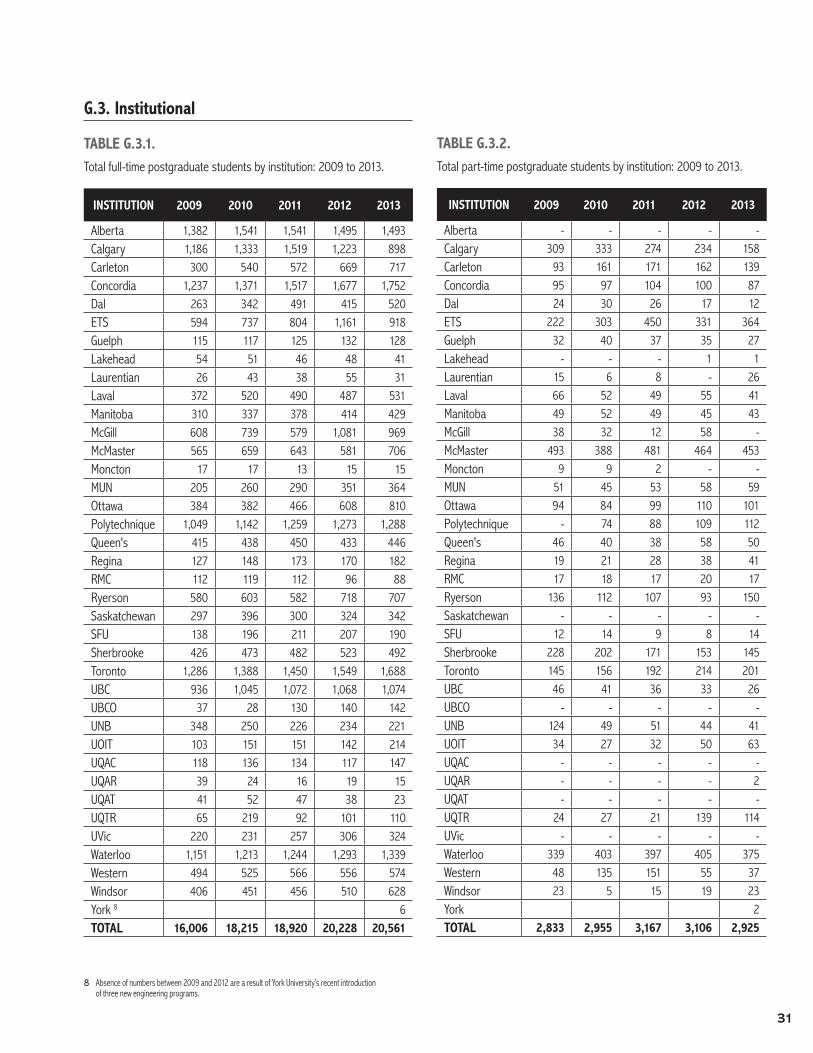
TABLE G.3.1.Total full-time postgraduate students by institution: 2009 to 2013.
INSTITUTION 2009 2010 2011 2012 2013
Alberta 1,382 1,541 1,541 1,495 1,493 Calgary 1,186 1,333 1,519 1,223 898 Carleton 300 540 572 669 717 Concordia 1,237 1,371 1,517 1,677 1,752 Dal 263 342 491 415 520 ETS 594 737 804 1,161 918 Guelph 115 117 125 132 128 Lakehead 54 51 46 48 41 Laurentian 26 43 38 55 31 Laval 372 520 490 487 531 Manitoba 310 337 378 414 429 McGill 608 739 579 1,081 969 McMaster 565 659 643 581 706 Moncton 17 17 13 15 15 MUN 205 260 290 351 364 Ottawa 384 382 466 608 810 Polytechnique 1,049 1,142 1,259 1,273 1,288 Queen's 415 438 450 433 446 Regina 127 148 173 170 182 RMC 112 119 112 96 88 Ryerson 580 603 582 718 707 Saskatchewan 297 396 300 324 342 SFU 138 196 211 207 190 Sherbrooke 426 473 482 523 492 Toronto 1,286 1,388 1,450 1,549 1,688 UBC 936 1,045 1,072 1,068 1,074 UBCO 37 28 130 140 142 UNB 348 250 226 234 221 UOIT 103 151 151 142 214 UQAC 118 136 134 117 147 UQAR 39 24 16 19 15 UQAT 41 52 47 38 23 UQTR 65 219 92 101 110 UVic 220 231 257 306 324 Waterloo 1,151 1,213 1,244 1,293 1,339 Western 494 525 566 556 574 Windsor 406 451 456 510 628 York 8 6 TOTAL 16,006 18,215 18,920 20,228 20,561
TABLE G.3.2.Total part-time postgraduate students by institution: 2009 to 2013.
INSTITUTION 2009 2010 2011 2012 2013
Alberta - - - - - Calgary 309 333 274 234 158 Carleton 93 161 171 162 139 Concordia 95 97 104 100 87 Dal 24 30 26 17 12 ETS 222 303 450 331 364 Guelph 32 40 37 35 27 Lakehead - - - 1 1 Laurentian 15 6 8 - 26 Laval 66 52 49 55 41 Manitoba 49 52 49 45 43 McGill 38 32 12 58 - McMaster 493 388 481 464 453 Moncton 9 9 2 - - MUN 51 45 53 58 59 Ottawa 94 84 99 110 101 Polytechnique - 74 88 109 112 Queen's 46 40 38 58 50 Regina 19 21 28 38 41 RMC 17 18 17 20 17 Ryerson 136 112 107 93 150 Saskatchewan - - - - - SFU 12 14 9 8 14 Sherbrooke 228 202 171 153 145 Toronto 145 156 192 214 201 UBC 46 41 36 33 26 UBCO - - - - - UNB 124 49 51 44 41 UOIT 34 27 32 50 63 UQAC - - - - - UQAR - - - - 2 UQAT - - - - - UQTR 24 27 21 139 114 UVic - - - - - Waterloo 339 403 397 405 375 Western 48 135 151 55 37 Windsor 23 5 15 19 23 York 2 TOTAL 2,833 2,955 3,167 3,106 2,925
8 Absence of numbers between 2009 and 2012 are a result of York University’s recent introduction of three new engineering programs.
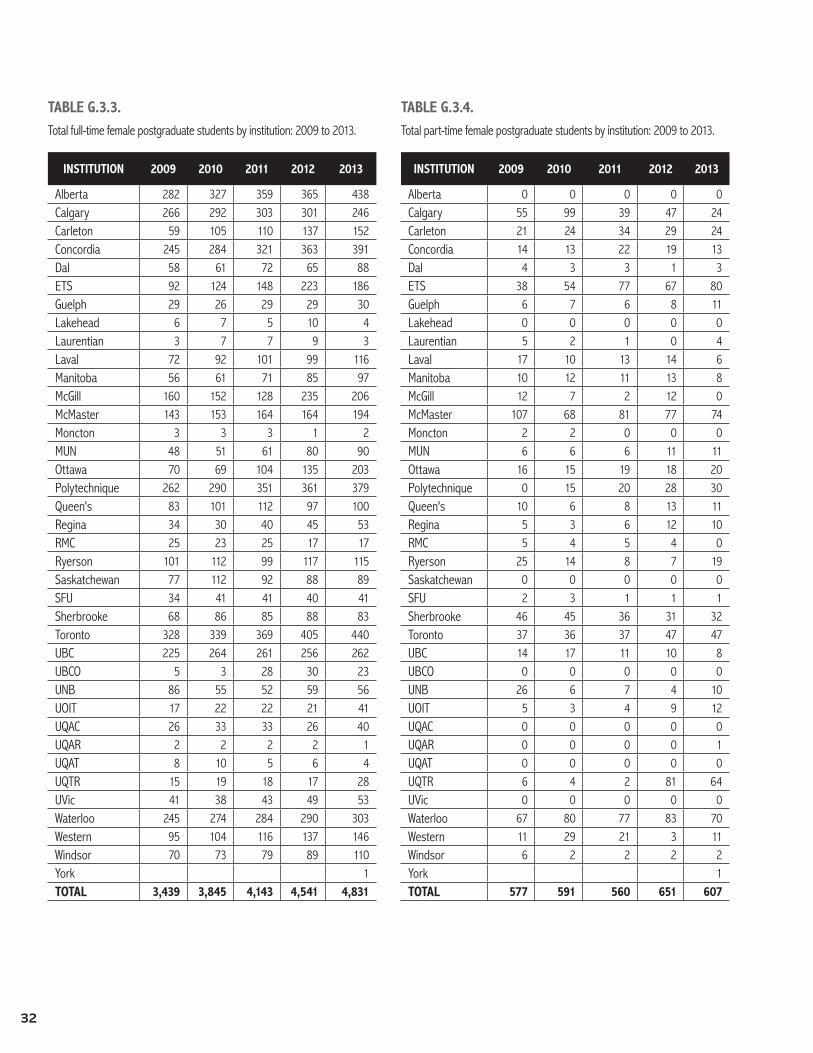
32
TABLE G.3.3.Total full-time female postgraduate students by institution: 2009 to 2013.
INSTITUTION 2009 2010 2011 2012 2013
Alberta 282 327 359 365 438 Calgary 266 292 303 301 246 Carleton 59 105 110 137 152 Concordia 245 284 321 363 391 Dal 58 61 72 65 88 ETS 92 124 148 223 186 Guelph 29 26 29 29 30 Lakehead 6 7 5 10 4 Laurentian 3 7 7 9 3 Laval 72 92 101 99 116 Manitoba 56 61 71 85 97 McGill 160 152 128 235 206 McMaster 143 153 164 164 194 Moncton 3 3 3 1 2 MUN 48 51 61 80 90 Ottawa 70 69 104 135 203 Polytechnique 262 290 351 361 379 Queen's 83 101 112 97 100 Regina 34 30 40 45 53 RMC 25 23 25 17 17 Ryerson 101 112 99 117 115 Saskatchewan 77 112 92 88 89 SFU 34 41 41 40 41 Sherbrooke 68 86 85 88 83 Toronto 328 339 369 405 440 UBC 225 264 261 256 262 UBCO 5 3 28 30 23 UNB 86 55 52 59 56 UOIT 17 22 22 21 41 UQAC 26 33 33 26 40 UQAR 2 2 2 2 1 UQAT 8 10 5 6 4 UQTR 15 19 18 17 28 UVic 41 38 43 49 53 Waterloo 245 274 284 290 303 Western 95 104 116 137 146 Windsor 70 73 79 89 110 York 1 TOTAL 3,439 3,845 4,143 4,541 4,831
TABLE G.3.4.Total part-time female postgraduate students by institution: 2009 to 2013.
INSTITUTION 2009 2010 2011 2012 2013
Alberta 0 0 0 0 0Calgary 55 99 39 47 24Carleton 21 24 34 29 24Concordia 14 13 22 19 13Dal 4 3 3 1 3ETS 38 54 77 67 80Guelph 6 7 6 8 11Lakehead 0 0 0 0 0Laurentian 5 2 1 0 4Laval 17 10 13 14 6Manitoba 10 12 11 13 8McGill 12 7 2 12 0McMaster 107 68 81 77 74Moncton 2 2 0 0 0MUN 6 6 6 11 11Ottawa 16 15 19 18 20Polytechnique 0 15 20 28 30Queen's 10 6 8 13 11Regina 5 3 6 12 10RMC 5 4 5 4 0Ryerson 25 14 8 7 19Saskatchewan 0 0 0 0 0SFU 2 3 1 1 1Sherbrooke 46 45 36 31 32Toronto 37 36 37 47 47UBC 14 17 11 10 8UBCO 0 0 0 0 0UNB 26 6 7 4 10UOIT 5 3 4 9 12UQAC 0 0 0 0 0UQAR 0 0 0 0 1UQAT 0 0 0 0 0UQTR 6 4 2 81 64UVic 0 0 0 0 0Waterloo 67 80 77 83 70Western 11 29 21 3 11Windsor 6 2 2 2 2York 1TOTAL 577 591 560 651 607
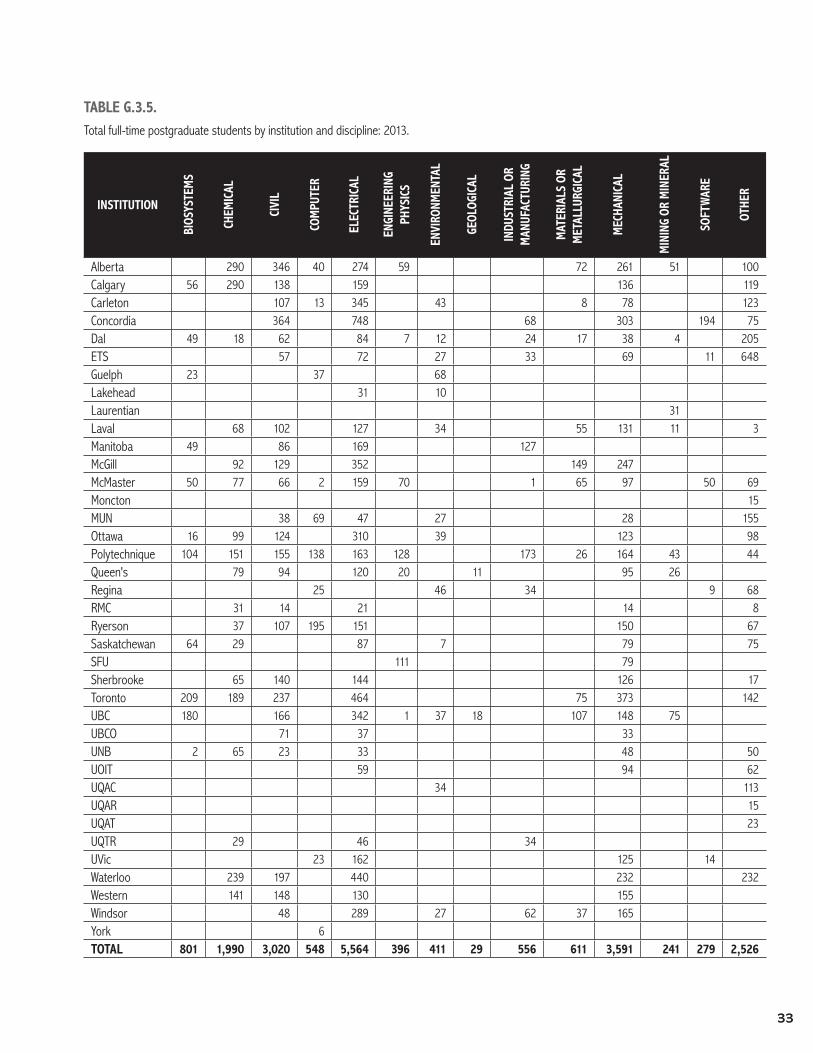
33
TABLE G.3.5.Total full-time postgraduate students by institution and discipline: 2013.
INSTITUTIONBI
OSYS
TEM
S
CHEM
ICAL
CIVI
L
COM
PUTE
R
ELEC
TRIC
AL
ENGI
NEER
ING
PHYS
ICS
ENVI
RONM
ENTA
L
GEOL
OGIC
AL
INDU
STRI
AL O
R M
ANUF
ACTU
RING
MAT
ERIA
LS O
R M
ETAL
LURG
ICAL
MEC
HANI
CAL
MIN
ING
OR M
INER
AL
SOFT
WAR
E
OTHE
R
Alberta 290 346 40 274 59 72 261 51 100 Calgary 56 290 138 159 136 119 Carleton 107 13 345 43 8 78 123 Concordia 364 748 68 303 194 75 Dal 49 18 62 84 7 12 24 17 38 4 205 ETS 57 72 27 33 69 11 648 Guelph 23 37 68 Lakehead 31 10 Laurentian 31 Laval 68 102 127 34 55 131 11 3 Manitoba 49 86 169 127 McGill 92 129 352 149 247 McMaster 50 77 66 2 159 70 1 65 97 50 69 Moncton 15 MUN 38 69 47 27 28 155 Ottawa 16 99 124 310 39 123 98 Polytechnique 104 151 155 138 163 128 173 26 164 43 44 Queen's 79 94 120 20 11 95 26 Regina 25 46 34 9 68 RMC 31 14 21 14 8 Ryerson 37 107 195 151 150 67 Saskatchewan 64 29 87 7 79 75 SFU 111 79 Sherbrooke 65 140 144 126 17 Toronto 209 189 237 464 75 373 142 UBC 180 166 342 1 37 18 107 148 75 UBCO 71 37 33 UNB 2 65 23 33 48 50 UOIT 59 94 62 UQAC 34 113 UQAR 15 UQAT 23 UQTR 29 46 34 UVic 23 162 125 14 Waterloo 239 197 440 232 232 Western 141 148 130 155 Windsor 48 289 27 62 37 165 York 6 TOTAL 801 1,990 3,020 548 5,564 396 411 29 556 611 3,591 241 279 2,526

34
TABLE G.3.6.Total part-time postgraduate students by institution and discipline: 2013.
INSTITUTION
BIOS
YSTE
MS
CHEM
ICAL
CIVI
L
COM
PUTE
R
ELEC
TRIC
AL
ENGI
NEER
ING
PHYS
ICS
ENVI
RONM
ENTA
L
GEOL
OGIC
AL
INDU
STRI
AL O
R M
ANUF
ACTU
RING
MAT
ERIA
LS O
R M
ETAL
LURG
ICAL
MEC
HANI
CAL
MIN
ING
OR M
INER
AL
SOFT
WAR
E
OTHE
R
AlbertaCalgary 0 37 48 28 44 2Carleton 27 2 75 6 1 10 1 17Concordia 17 31 1 8 17 13Dal 2 2 2 1 1 1 1 2ETS 48 22 10 12 20 21 230Guelph 2 7 18Lakehead 1Laurentian 26Laval 13 10 1 2 2 3 10Manitoba 2 16 20 6McGillMcMaster 3 4 35 2 71 3 3 18 89 38 187MonctonMUN 3 3 11 1 7 34Ottawa 2 5 20 29 4 13 29Polytechnique 4 4 20 9 5 45 12 14Queen's 2 17 10 12 10Regina 7 10 10 3 11RMC 3 3 11Ryerson 6 17 64 34 24 5SaskatchewanSFU 14Sherbrooke 145Toronto 14 45 60 3 73 6UBC 1 15 7 1 1 1UBCOUNB 5 9 11 7 9UOIT 13 22 28UQACUQAR 2UQATUQTR 6 13 96UVicWaterloo 24 46 153 62 90Western 4 12 6 7 8Windsor 4 5 1 3 2 10York 2TOTAL 16 112 416 96 626 18 51 1 185 27 426 37 80 835
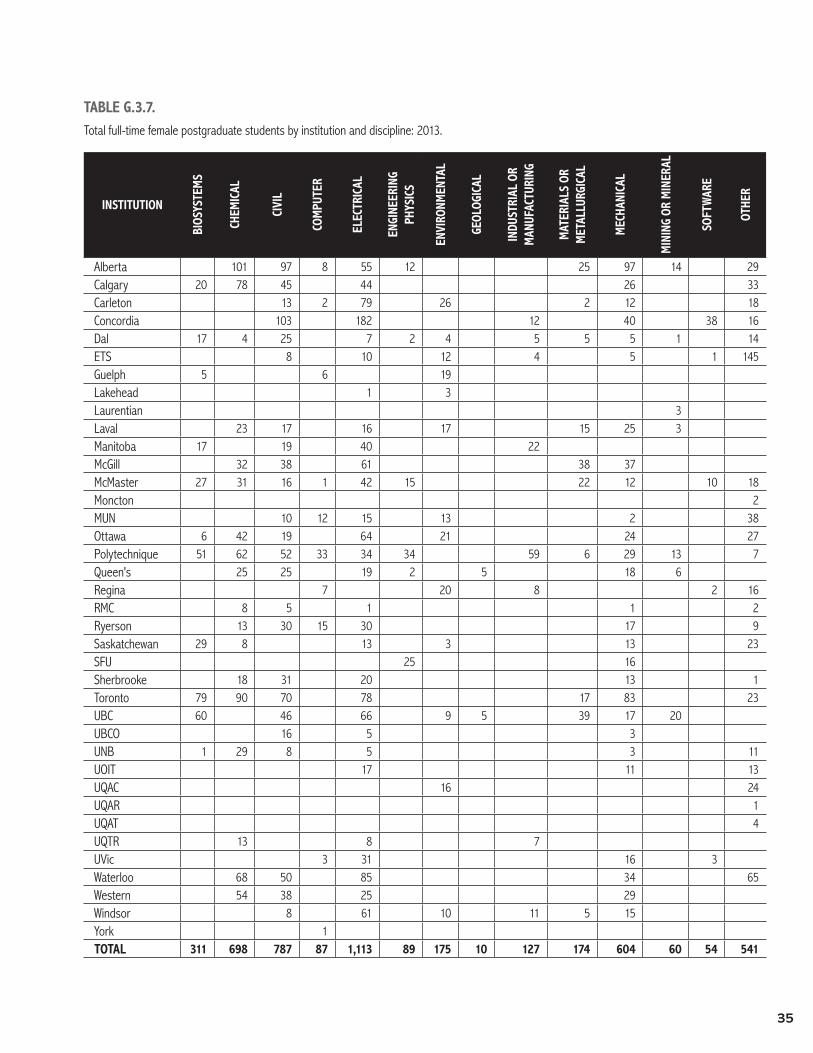
35
TABLE G.3.7.Total full-time female postgraduate students by institution and discipline: 2013.
INSTITUTIONBI
OSYS
TEM
S
CHEM
ICAL
CIVI
L
COM
PUTE
R
ELEC
TRIC
AL
ENGI
NEER
ING
PHYS
ICS
ENVI
RONM
ENTA
L
GEOL
OGIC
AL
INDU
STRI
AL O
R M
ANUF
ACTU
RING
MAT
ERIA
LS O
R M
ETAL
LURG
ICAL
MEC
HANI
CAL
MIN
ING
OR M
INER
AL
SOFT
WAR
E
OTHE
R
Alberta 101 97 8 55 12 25 97 14 29 Calgary 20 78 45 44 26 33 Carleton 13 2 79 26 2 12 18 Concordia 103 182 12 40 38 16 Dal 17 4 25 7 2 4 5 5 5 1 14 ETS 8 10 12 4 5 1 145 Guelph 5 6 19 Lakehead 1 3 Laurentian 3 Laval 23 17 16 17 15 25 3 Manitoba 17 19 40 22 McGill 32 38 61 38 37 McMaster 27 31 16 1 42 15 22 12 10 18 Moncton 2 MUN 10 12 15 13 2 38 Ottawa 6 42 19 64 21 24 27 Polytechnique 51 62 52 33 34 34 59 6 29 13 7 Queen's 25 25 19 2 5 18 6 Regina 7 20 8 2 16 RMC 8 5 1 1 2 Ryerson 13 30 15 30 17 9 Saskatchewan 29 8 13 3 13 23 SFU 25 16 Sherbrooke 18 31 20 13 1 Toronto 79 90 70 78 17 83 23 UBC 60 46 66 9 5 39 17 20 UBCO 16 5 3 UNB 1 29 8 5 3 11 UOIT 17 11 13 UQAC 16 24 UQAR 1 UQAT 4 UQTR 13 8 7 UVic 3 31 16 3 Waterloo 68 50 85 34 65 Western 54 38 25 29 Windsor 8 61 10 11 5 15 York 1 TOTAL 311 698 787 87 1,113 89 175 10 127 174 604 60 54 541
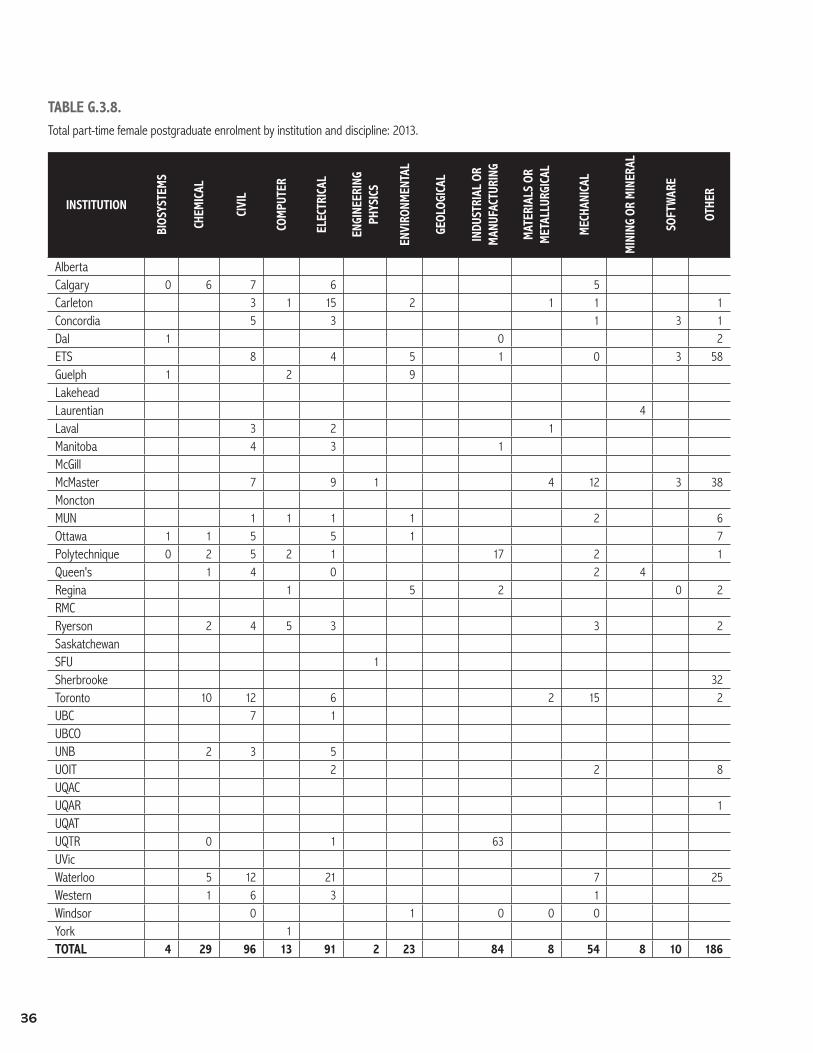
36
TABLE G.3.8.Total part-time female postgraduate enrolment by institution and discipline: 2013.
INSTITUTION
BIOS
YSTE
MS
CHEM
ICAL
CIVI
L
COM
PUTE
R
ELEC
TRIC
AL
ENGI
NEER
ING
PHYS
ICS
ENVI
RONM
ENTA
L
GEOL
OGIC
AL
INDU
STRI
AL O
R M
ANUF
ACTU
RING
MAT
ERIA
LS O
R M
ETAL
LURG
ICAL
MEC
HANI
CAL
MIN
ING
OR M
INER
AL
SOFT
WAR
E
OTHE
R
AlbertaCalgary 0 6 7 6 5Carleton 3 1 15 2 1 1 1Concordia 5 3 1 3 1Dal 1 0 2ETS 8 4 5 1 0 3 58Guelph 1 2 9LakeheadLaurentian 4Laval 3 2 1Manitoba 4 3 1McGillMcMaster 7 9 1 4 12 3 38MonctonMUN 1 1 1 1 2 6Ottawa 1 1 5 5 1 7Polytechnique 0 2 5 2 1 17 2 1Queen's 1 4 0 2 4Regina 1 5 2 0 2RMCRyerson 2 4 5 3 3 2SaskatchewanSFU 1Sherbrooke 32Toronto 10 12 6 2 15 2UBC 7 1UBCOUNB 2 3 5UOIT 2 2 8UQACUQAR 1UQATUQTR 0 1 63UVicWaterloo 5 12 21 7 25Western 1 6 3 1Windsor 0 1 0 0 0York 1TOTAL 4 29 96 13 91 2 23 84 8 54 8 10 186
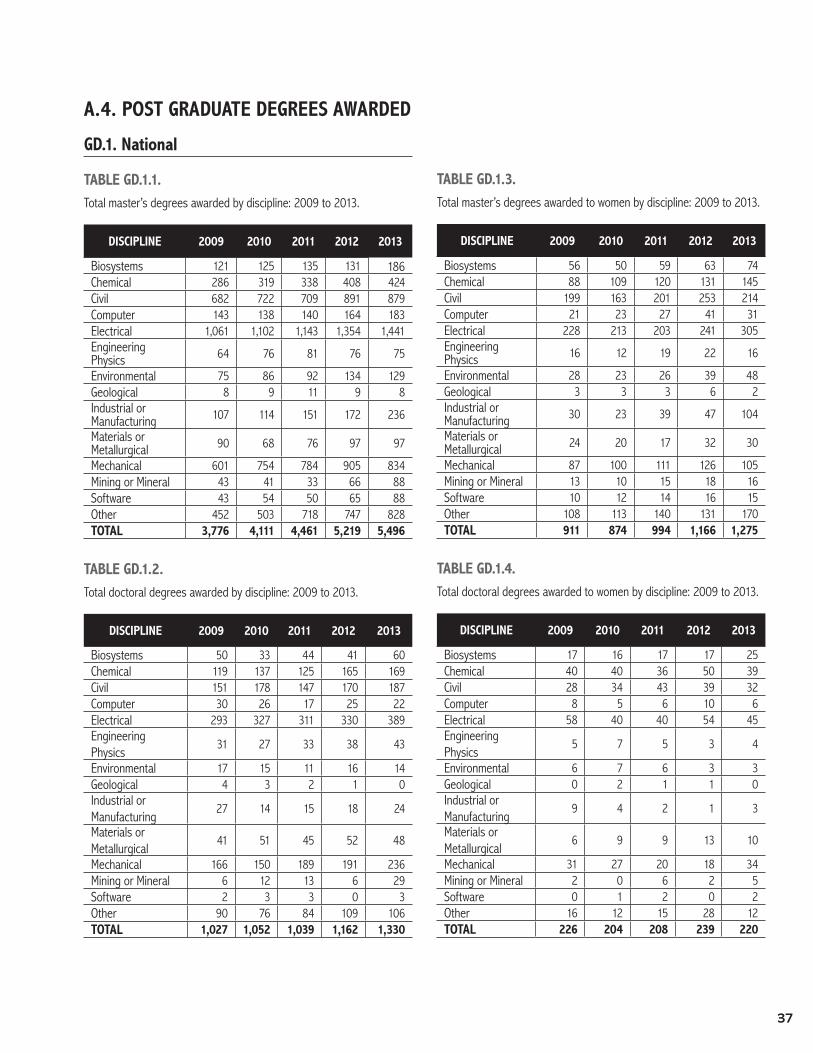
37
A.4. POST GRADUATE DEGREES AWARDED
GD.1. National
TABLE GD.1.1.Total master’s degrees awarded by discipline: 2009 to 2013.
DISCIPLINE 2009 2010 2011 2012 2013
Biosystems 121 125 135 131 186Chemical 286 319 338 408 424Civil 682 722 709 891 879Computer 143 138 140 164 183Electrical 1,061 1,102 1,143 1,354 1,441Engineering Physics 64 76 81 76 75
Environmental 75 86 92 134 129Geological 8 9 11 9 8Industrial or Manufacturing 107 114 151 172 236
Materials or Metallurgical 90 68 76 97 97
Mechanical 601 754 784 905 834Mining or Mineral 43 41 33 66 88Software 43 54 50 65 88Other 452 503 718 747 828TOTAL 3,776 4,111 4,461 5,219 5,496
TABLE GD.1.2.Total doctoral degrees awarded by discipline: 2009 to 2013.
DISCIPLINE 2009 2010 2011 2012 2013
Biosystems 50 33 44 41 60Chemical 119 137 125 165 169Civil 151 178 147 170 187Computer 30 26 17 25 22Electrical 293 327 311 330 389Engineering Physics
31 27 33 38 43
Environmental 17 15 11 16 14Geological 4 3 2 1 0Industrial or Manufacturing
27 14 15 18 24
Materials or Metallurgical
41 51 45 52 48
Mechanical 166 150 189 191 236Mining or Mineral 6 12 13 6 29Software 2 3 3 0 3Other 90 76 84 109 106TOTAL 1,027 1,052 1,039 1,162 1,330
TABLE GD.1.3.Total master’s degrees awarded to women by discipline: 2009 to 2013.
DISCIPLINE 2009 2010 2011 2012 2013
Biosystems 56 50 59 63 74Chemical 88 109 120 131 145Civil 199 163 201 253 214Computer 21 23 27 41 31Electrical 228 213 203 241 305Engineering Physics 16 12 19 22 16
Environmental 28 23 26 39 48Geological 3 3 3 6 2Industrial or Manufacturing 30 23 39 47 104
Materials or Metallurgical 24 20 17 32 30
Mechanical 87 100 111 126 105Mining or Mineral 13 10 15 18 16Software 10 12 14 16 15Other 108 113 140 131 170TOTAL 911 874 994 1,166 1,275
TABLE GD.1.4.Total doctoral degrees awarded to women by discipline: 2009 to 2013.
DISCIPLINE 2009 2010 2011 2012 2013
Biosystems 17 16 17 17 25Chemical 40 40 36 50 39Civil 28 34 43 39 32Computer 8 5 6 10 6Electrical 58 40 40 54 45Engineering Physics
5 7 5 3 4
Environmental 6 7 6 3 3Geological 0 2 1 1 0Industrial or Manufacturing
9 4 2 1 3
Materials or Metallurgical
6 9 9 13 10
Mechanical 31 27 20 18 34Mining or Mineral 2 0 6 2 5Software 0 1 2 0 2Other 16 12 15 28 12TOTAL 226 204 208 239 220

38
TABLE GD.1.5.Total master’s degrees awarded to visa students by discipline: 2009 to 2013.
DISCIPLINE 2009 2010 2011 2012 2013
Biosystems 32 32 33 32 61Chemical 97 104 106 183 156Civil 120 156 200 320 269Computer 38 23 40 76 74Electrical 282 368 482 724 756Engineering Physics
19 20 22 25 24
Environmental 21 32 34 48 69Geological 1 1 2 0 2Industrial or Manufacturing
32 35 70 75 83
Materials or Metallurgical
28 25 35 47 48
Mechanical 141 152 264 325 314Mining or Mineral 16 14 11 36 38Software 13 20 19 26 51Other 112 152 305 340 426TOTAL 952 1,134 1,623 2,257 2,371
TABLE GD.1.6.Total doctoral degrees awarded to visa students by discipline: 2009 to 2013.
DISCIPLINE 2009 2010 2011 2012 2013
Biosystems 13 6 3 3 13Chemical 27 31 42 45 56Civil 25 39 23 33 35Computer 9 2 5 7 6Electrical 36 69 55 89 110Engineering Physics
4 2 6 9 11
Environmental 4 3 6 3 4Geological 2 0 0 0 0Industrial or Manufacturing
7 0 2 6 5
Materials or Metallurgical
8 13 11 14 20
Mechanical 31 33 47 36 60Mining or Mineral
2 6 3 1 9
Software 0 2 0 0 2Other 16 15 21 33 31TOTAL 184 221 224 279 362
GD.2. Provincial
TABLE GD.2.1.Total master’s degrees awarded by province: 2009 to 2013.
PROVINCE 2009 2010 2011 2012 2013
AB 418 369 505 644 460 BC 220 259 344 404 340 MB 30 49 45 62 62 NB 52 45 59 65 50 NL 50 47 68 79 103 NS 86 105 114 128 173 ON 1,769 2,106 2,173 2,323 2,652 QC 1,067 1,030 1,053 1,394 1,537 SK 84 101 100 120 119 TOTAL 3,776 4,111 4,461 5,219 5,496
TABLE GD.2.2.Total doctoral degrees awarded by province: 2009 to 2013.
PROVINCE 2009 2010 2011 2012 2013
AB 116 120 130 154 203BC 90 95 106 98 126MB 17 21 27 39 28NB 17 11 6 13 18NL 9 12 10 7 12NS 30 12 14 11 16ON 438 471 463 500 552QC 279 276 259 313 354SK 31 34 24 27 21TOTAL 1,027 1,052 1,039 1,162 1,330
TABLE GD.2.3.Total master’s degrees awarded to women by province: 2009 to 2013.
PROVINCE 2009 2010 2011 2012 2013
AB 84 63 112 159 106BC 62 62 111 101 87MB 5 13 11 15 14NB 14 11 10 9 12NL 14 17 11 19 28NS 23 21 16 24 27ON 449 450 474 496 578QC 240 223 221 308 389SK 20 14 28 35 34TOTAL 911 874 994 1,166 1,275
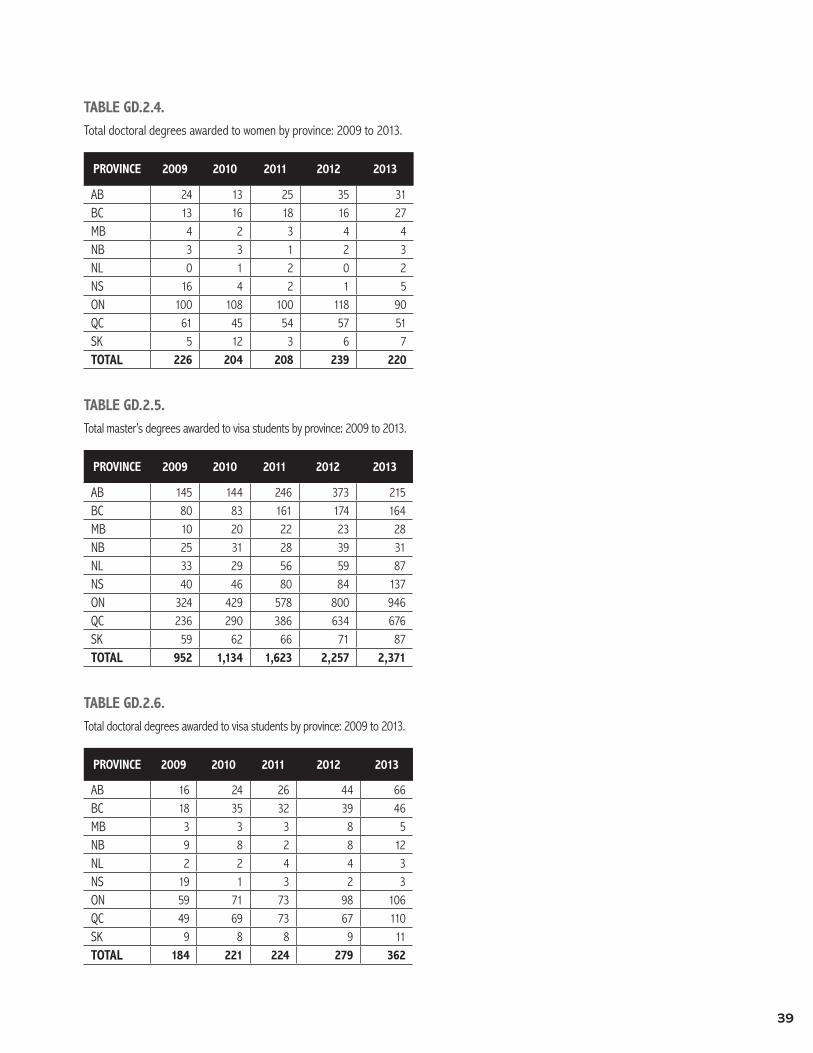
39
TABLE GD.2.4.Total doctoral degrees awarded to women by province: 2009 to 2013.
PROVINCE 2009 2010 2011 2012 2013
AB 24 13 25 35 31BC 13 16 18 16 27MB 4 2 3 4 4NB 3 3 1 2 3NL 0 1 2 0 2NS 16 4 2 1 5ON 100 108 100 118 90QC 61 45 54 57 51SK 5 12 3 6 7TOTAL 226 204 208 239 220
TABLE GD.2.5.Total master’s degrees awarded to visa students by province: 2009 to 2013.
PROVINCE 2009 2010 2011 2012 2013
AB 145 144 246 373 215BC 80 83 161 174 164MB 10 20 22 23 28NB 25 31 28 39 31NL 33 29 56 59 87NS 40 46 80 84 137ON 324 429 578 800 946QC 236 290 386 634 676SK 59 62 66 71 87TOTAL 952 1,134 1,623 2,257 2,371
TABLE GD.2.6.Total doctoral degrees awarded to visa students by province: 2009 to 2013.
PROVINCE 2009 2010 2011 2012 2013
AB 16 24 26 44 66BC 18 35 32 39 46MB 3 3 3 8 5NB 9 8 2 8 12NL 2 2 4 4 3NS 19 1 3 2 3ON 59 71 73 98 106QC 49 69 73 67 110SK 9 8 8 9 11TOTAL 184 221 224 279 362
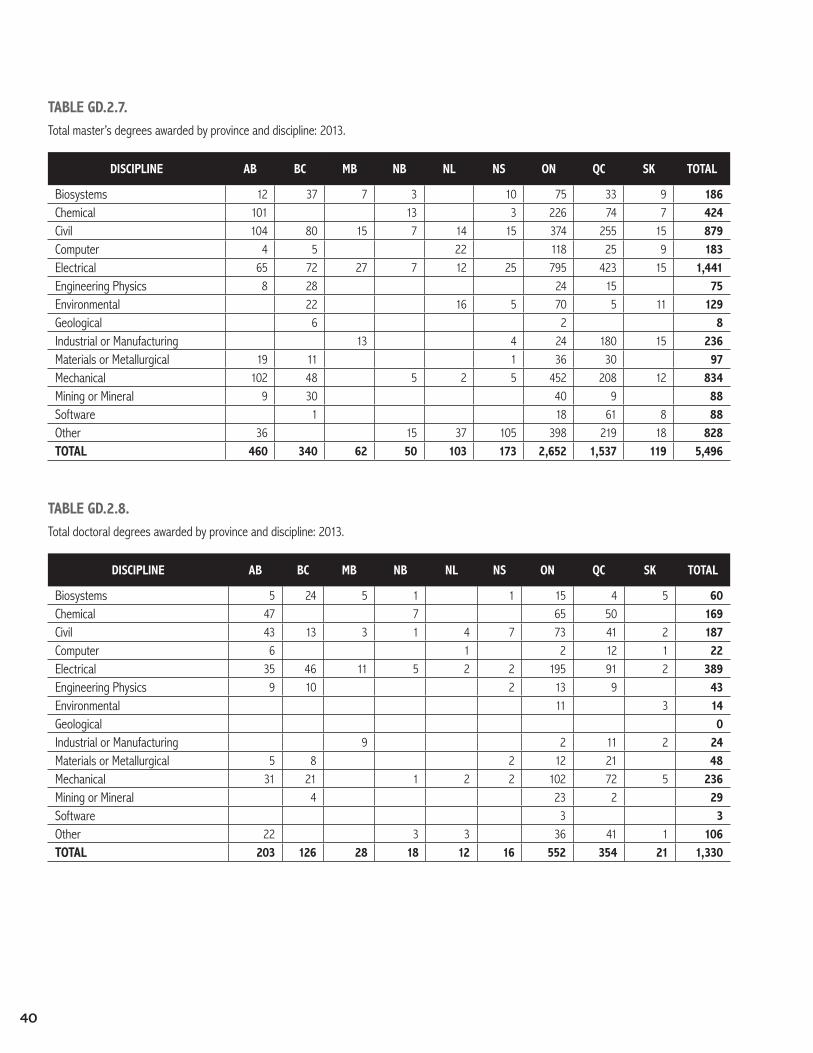
40
TABLE GD.2.7.Total master’s degrees awarded by province and discipline: 2013.
DISCIPLINE AB BC MB NB NL NS ON QC SK TOTAL
Biosystems 12 37 7 3 10 75 33 9 186Chemical 101 13 3 226 74 7 424Civil 104 80 15 7 14 15 374 255 15 879Computer 4 5 22 118 25 9 183Electrical 65 72 27 7 12 25 795 423 15 1,441Engineering Physics 8 28 24 15 75Environmental 22 16 5 70 5 11 129Geological 6 2 8Industrial or Manufacturing 13 4 24 180 15 236Materials or Metallurgical 19 11 1 36 30 97Mechanical 102 48 5 2 5 452 208 12 834Mining or Mineral 9 30 40 9 88Software 1 18 61 8 88Other 36 15 37 105 398 219 18 828TOTAL 460 340 62 50 103 173 2,652 1,537 119 5,496
TABLE GD.2.8.Total doctoral degrees awarded by province and discipline: 2013.
DISCIPLINE AB BC MB NB NL NS ON QC SK TOTAL
Biosystems 5 24 5 1 1 15 4 5 60Chemical 47 7 65 50 169Civil 43 13 3 1 4 7 73 41 2 187Computer 6 1 2 12 1 22Electrical 35 46 11 5 2 2 195 91 2 389Engineering Physics 9 10 2 13 9 43Environmental 11 3 14Geological 0Industrial or Manufacturing 9 2 11 2 24Materials or Metallurgical 5 8 2 12 21 48Mechanical 31 21 1 2 2 102 72 5 236Mining or Mineral 4 23 2 29Software 3 3Other 22 3 3 36 41 1 106TOTAL 203 126 28 18 12 16 552 354 21 1,330
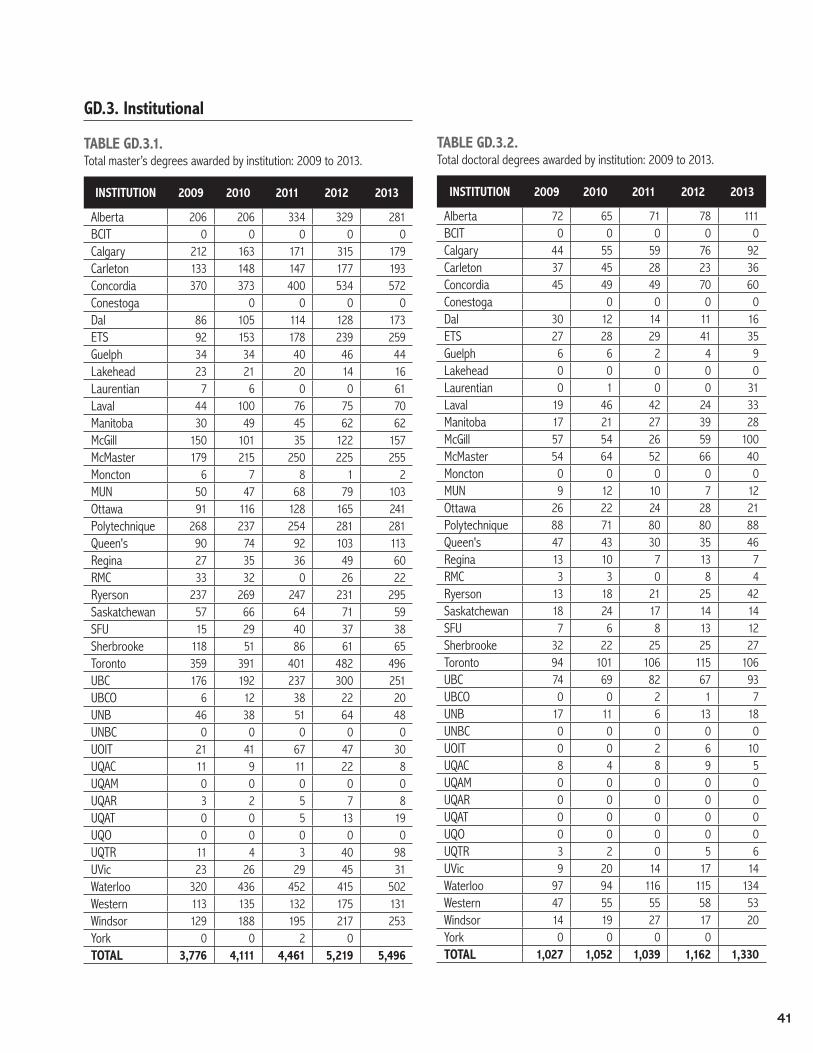
41
GD.3. Institutional
TABLE GD.3.1.Total master’s degrees awarded by institution: 2009 to 2013.
INSTITUTION 2009 2010 2011 2012 2013
Alberta 206 206 334 329 281BCIT 0 0 0 0 0Calgary 212 163 171 315 179Carleton 133 148 147 177 193Concordia 370 373 400 534 572Conestoga 0 0 0 0Dal 86 105 114 128 173ETS 92 153 178 239 259Guelph 34 34 40 46 44Lakehead 23 21 20 14 16Laurentian 7 6 0 0 61Laval 44 100 76 75 70Manitoba 30 49 45 62 62McGill 150 101 35 122 157McMaster 179 215 250 225 255Moncton 6 7 8 1 2MUN 50 47 68 79 103Ottawa 91 116 128 165 241Polytechnique 268 237 254 281 281Queen's 90 74 92 103 113Regina 27 35 36 49 60RMC 33 32 0 26 22Ryerson 237 269 247 231 295Saskatchewan 57 66 64 71 59SFU 15 29 40 37 38Sherbrooke 118 51 86 61 65Toronto 359 391 401 482 496UBC 176 192 237 300 251UBCO 6 12 38 22 20UNB 46 38 51 64 48UNBC 0 0 0 0 0UOIT 21 41 67 47 30UQAC 11 9 11 22 8UQAM 0 0 0 0 0UQAR 3 2 5 7 8UQAT 0 0 5 13 19UQO 0 0 0 0 0UQTR 11 4 3 40 98UVic 23 26 29 45 31Waterloo 320 436 452 415 502Western 113 135 132 175 131Windsor 129 188 195 217 253York 0 0 2 0TOTAL 3,776 4,111 4,461 5,219 5,496
TABLE GD.3.2.Total doctoral degrees awarded by institution: 2009 to 2013.
INSTITUTION 2009 2010 2011 2012 2013
Alberta 72 65 71 78 111BCIT 0 0 0 0 0Calgary 44 55 59 76 92Carleton 37 45 28 23 36Concordia 45 49 49 70 60Conestoga 0 0 0 0Dal 30 12 14 11 16ETS 27 28 29 41 35Guelph 6 6 2 4 9Lakehead 0 0 0 0 0Laurentian 0 1 0 0 31Laval 19 46 42 24 33Manitoba 17 21 27 39 28McGill 57 54 26 59 100McMaster 54 64 52 66 40Moncton 0 0 0 0 0MUN 9 12 10 7 12Ottawa 26 22 24 28 21Polytechnique 88 71 80 80 88Queen's 47 43 30 35 46Regina 13 10 7 13 7RMC 3 3 0 8 4Ryerson 13 18 21 25 42Saskatchewan 18 24 17 14 14SFU 7 6 8 13 12Sherbrooke 32 22 25 25 27Toronto 94 101 106 115 106UBC 74 69 82 67 93UBCO 0 0 2 1 7UNB 17 11 6 13 18UNBC 0 0 0 0 0UOIT 0 0 2 6 10UQAC 8 4 8 9 5UQAM 0 0 0 0 0UQAR 0 0 0 0 0UQAT 0 0 0 0 0UQO 0 0 0 0 0UQTR 3 2 0 5 6UVic 9 20 14 17 14Waterloo 97 94 116 115 134Western 47 55 55 58 53Windsor 14 19 27 17 20York 0 0 0 0TOTAL 1,027 1,052 1,039 1,162 1,330
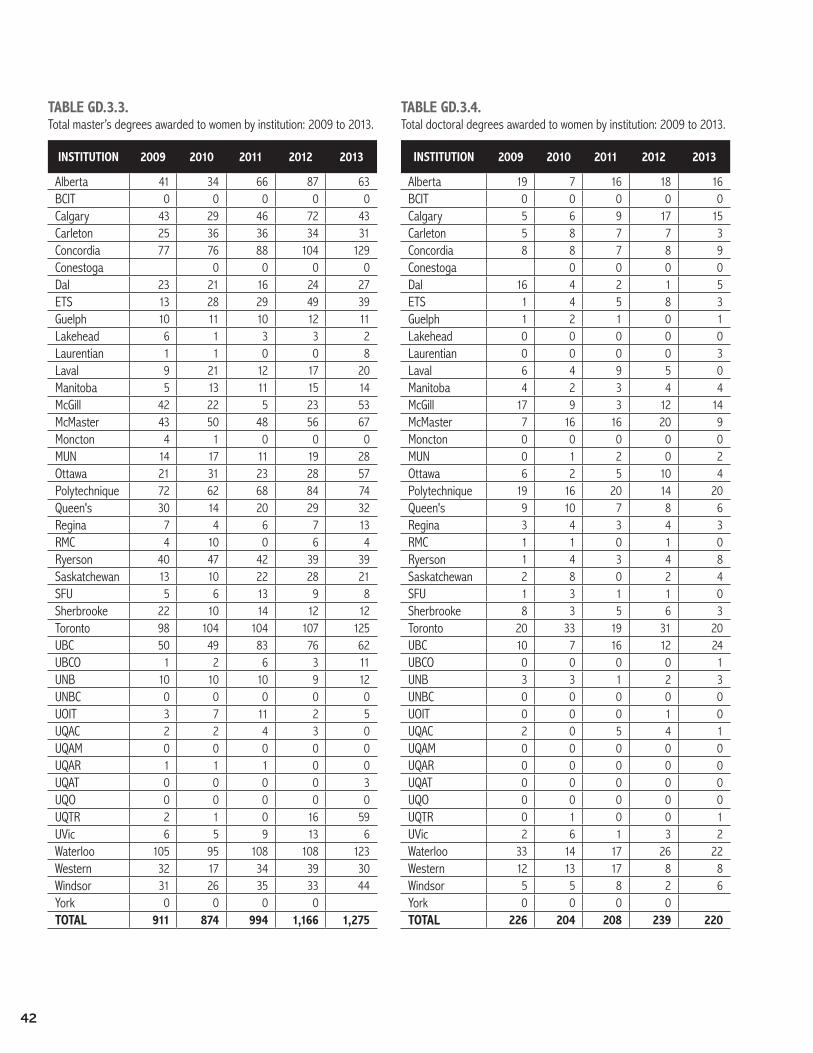
42
TABLE GD.3.3.Total master’s degrees awarded to women by institution: 2009 to 2013.
INSTITUTION 2009 2010 2011 2012 2013
Alberta 41 34 66 87 63BCIT 0 0 0 0 0Calgary 43 29 46 72 43Carleton 25 36 36 34 31Concordia 77 76 88 104 129Conestoga 0 0 0 0Dal 23 21 16 24 27ETS 13 28 29 49 39Guelph 10 11 10 12 11Lakehead 6 1 3 3 2Laurentian 1 1 0 0 8Laval 9 21 12 17 20Manitoba 5 13 11 15 14McGill 42 22 5 23 53McMaster 43 50 48 56 67Moncton 4 1 0 0 0MUN 14 17 11 19 28Ottawa 21 31 23 28 57Polytechnique 72 62 68 84 74Queen's 30 14 20 29 32Regina 7 4 6 7 13RMC 4 10 0 6 4Ryerson 40 47 42 39 39Saskatchewan 13 10 22 28 21SFU 5 6 13 9 8Sherbrooke 22 10 14 12 12Toronto 98 104 104 107 125UBC 50 49 83 76 62UBCO 1 2 6 3 11UNB 10 10 10 9 12UNBC 0 0 0 0 0UOIT 3 7 11 2 5UQAC 2 2 4 3 0UQAM 0 0 0 0 0UQAR 1 1 1 0 0UQAT 0 0 0 0 3UQO 0 0 0 0 0UQTR 2 1 0 16 59UVic 6 5 9 13 6Waterloo 105 95 108 108 123Western 32 17 34 39 30Windsor 31 26 35 33 44York 0 0 0 0TOTAL 911 874 994 1,166 1,275
TABLE GD.3.4.Total doctoral degrees awarded to women by institution: 2009 to 2013.
INSTITUTION 2009 2010 2011 2012 2013
Alberta 19 7 16 18 16BCIT 0 0 0 0 0Calgary 5 6 9 17 15Carleton 5 8 7 7 3Concordia 8 8 7 8 9Conestoga 0 0 0 0Dal 16 4 2 1 5ETS 1 4 5 8 3Guelph 1 2 1 0 1Lakehead 0 0 0 0 0Laurentian 0 0 0 0 3Laval 6 4 9 5 0Manitoba 4 2 3 4 4McGill 17 9 3 12 14McMaster 7 16 16 20 9Moncton 0 0 0 0 0MUN 0 1 2 0 2Ottawa 6 2 5 10 4Polytechnique 19 16 20 14 20Queen's 9 10 7 8 6Regina 3 4 3 4 3RMC 1 1 0 1 0Ryerson 1 4 3 4 8Saskatchewan 2 8 0 2 4SFU 1 3 1 1 0Sherbrooke 8 3 5 6 3Toronto 20 33 19 31 20UBC 10 7 16 12 24UBCO 0 0 0 0 1UNB 3 3 1 2 3UNBC 0 0 0 0 0UOIT 0 0 0 1 0UQAC 2 0 5 4 1UQAM 0 0 0 0 0UQAR 0 0 0 0 0UQAT 0 0 0 0 0UQO 0 0 0 0 0UQTR 0 1 0 0 1UVic 2 6 1 3 2Waterloo 33 14 17 26 22Western 12 13 17 8 8Windsor 5 5 8 2 6York 0 0 0 0TOTAL 226 204 208 239 220
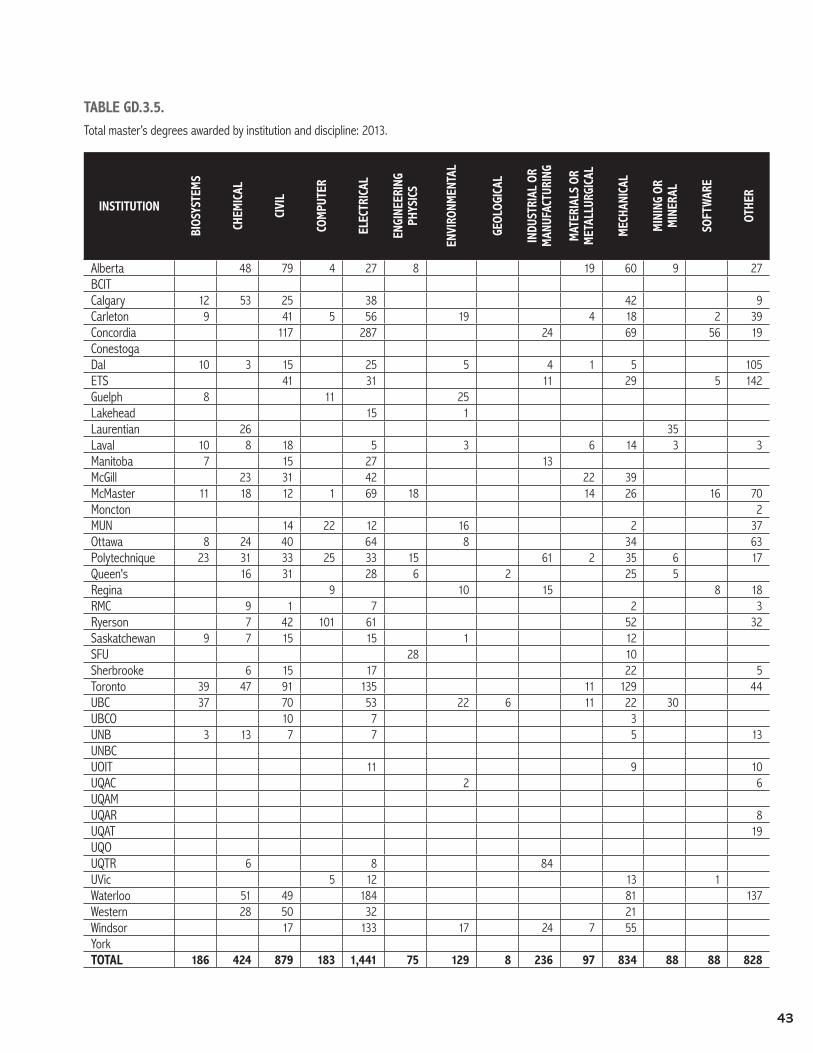
43
TABLE GD.3.5.Total master’s degrees awarded by institution and discipline: 2013.
INSTITUTIONBI
OSYS
TEM
S
CHEM
ICAL
CIVI
L
COM
PUTE
R
ELEC
TRIC
AL
ENGI
NEER
ING
PHYS
ICS
ENVI
RONM
ENTA
L
GEOL
OGIC
AL
INDU
STRI
AL O
R M
ANUF
ACTU
RING
MAT
ERIA
LS O
R M
ETAL
LURG
ICAL
MEC
HANI
CAL
MIN
ING
OR
MIN
ERAL
SOFT
WAR
E
OTHE
R
Alberta 48 79 4 27 8 19 60 9 27 BCIT Calgary 12 53 25 38 42 9 Carleton 9 41 5 56 19 4 18 2 39 Concordia 117 287 24 69 56 19 Conestoga Dal 10 3 15 25 5 4 1 5 105 ETS 41 31 11 29 5 142 Guelph 8 11 25 Lakehead 15 1 Laurentian 26 35 Laval 10 8 18 5 3 6 14 3 3 Manitoba 7 15 27 13 McGill 23 31 42 22 39 McMaster 11 18 12 1 69 18 14 26 16 70 Moncton 2 MUN 14 22 12 16 2 37 Ottawa 8 24 40 64 8 34 63 Polytechnique 23 31 33 25 33 15 61 2 35 6 17 Queen's 16 31 28 6 2 25 5 Regina 9 10 15 8 18 RMC 9 1 7 2 3 Ryerson 7 42 101 61 52 32 Saskatchewan 9 7 15 15 1 12 SFU 28 10 Sherbrooke 6 15 17 22 5 Toronto 39 47 91 135 11 129 44 UBC 37 70 53 22 6 11 22 30 UBCO 10 7 3 UNB 3 13 7 7 5 13 UNBC UOIT 11 9 10 UQAC 2 6 UQAM UQAR 8 UQAT 19 UQO UQTR 6 8 84 UVic 5 12 13 1 Waterloo 51 49 184 81 137 Western 28 50 32 21 Windsor 17 133 17 24 7 55 YorkTOTAL 186 424 879 183 1,441 75 129 8 236 97 834 88 88 828
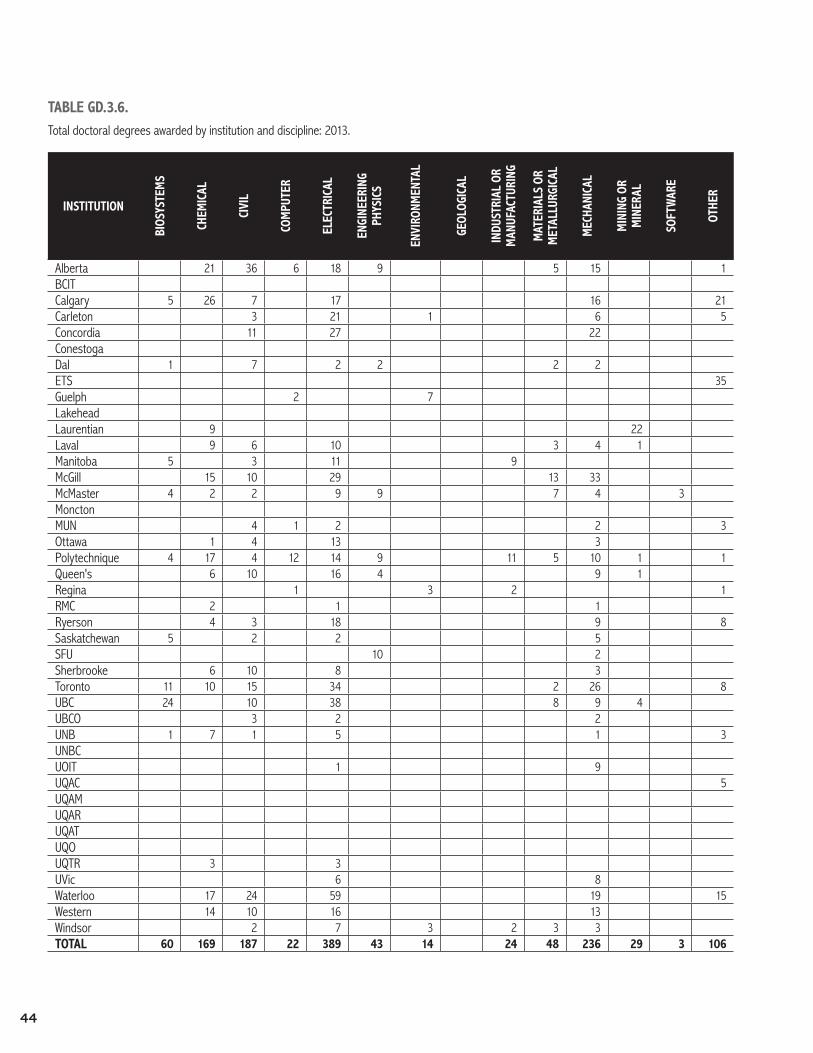
44
TABLE GD.3.6.Total doctoral degrees awarded by institution and discipline: 2013.
INSTITUTION
BIOS
YSTE
MS
CHEM
ICAL
CIVI
L
COM
PUTE
R
ELEC
TRIC
AL
ENGI
NEER
ING
PHYS
ICS
ENVI
RONM
ENTA
L
GEOL
OGIC
AL
INDU
STRI
AL O
R M
ANUF
ACTU
RING
MAT
ERIA
LS O
R M
ETAL
LURG
ICAL
MEC
HANI
CAL
MIN
ING
OR
MIN
ERAL
SOFT
WAR
E
OTHE
R
Alberta 21 36 6 18 9 5 15 1BCITCalgary 5 26 7 17 16 21Carleton 3 21 1 6 5Concordia 11 27 22ConestogaDal 1 7 2 2 2 2ETS 35Guelph 2 7LakeheadLaurentian 9 22Laval 9 6 10 3 4 1Manitoba 5 3 11 9McGill 15 10 29 13 33McMaster 4 2 2 9 9 7 4 3MonctonMUN 4 1 2 2 3Ottawa 1 4 13 3Polytechnique 4 17 4 12 14 9 11 5 10 1 1Queen's 6 10 16 4 9 1Regina 1 3 2 1RMC 2 1 1Ryerson 4 3 18 9 8Saskatchewan 5 2 2 5SFU 10 2Sherbrooke 6 10 8 3Toronto 11 10 15 34 2 26 8UBC 24 10 38 8 9 4UBCO 3 2 2UNB 1 7 1 5 1 3UNBCUOIT 1 9UQAC 5UQAMUQARUQATUQOUQTR 3 3UVic 6 8Waterloo 17 24 59 19 15Western 14 10 16 13Windsor 2 7 3 2 3 3TOTAL 60 169 187 22 389 43 14 24 48 236 29 3 106
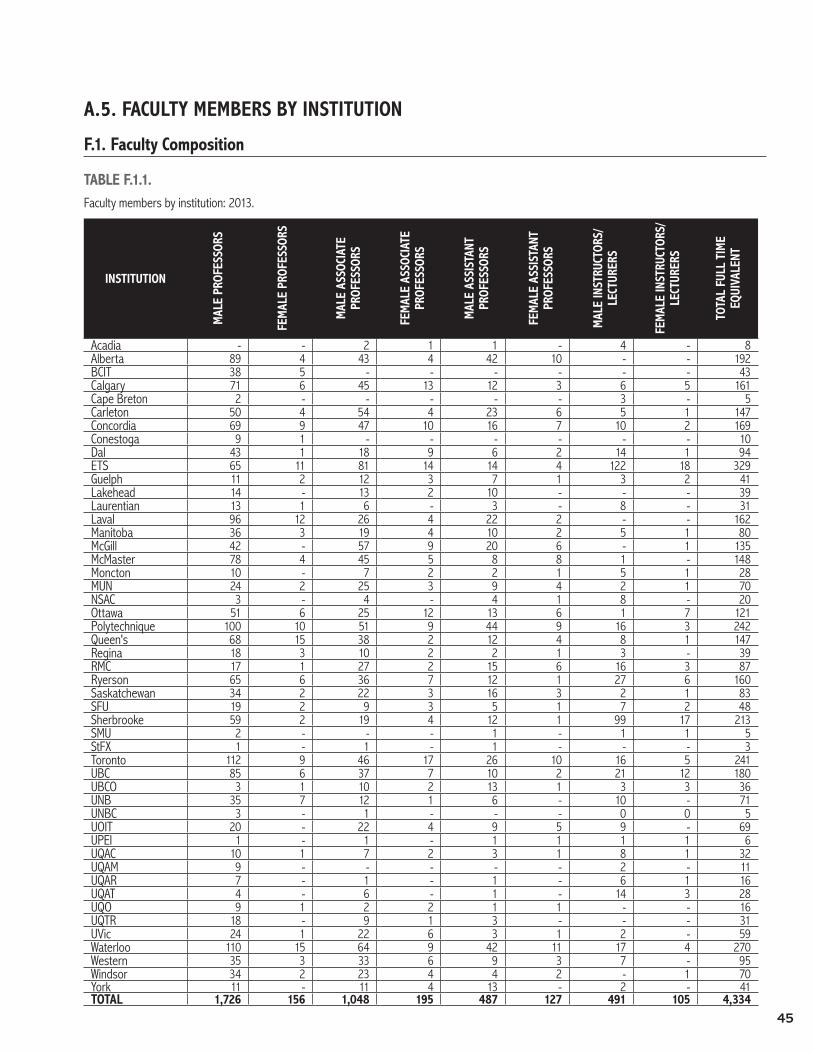
45
A.5. FACULTY MEMBERS BY INSTITUTION
F.1. Faculty Composition
TABLE F.1.1.Faculty members by institution: 2013.
INSTITUTION
MAL
E PR
OFES
SORS
FEM
ALE
PROF
ESSO
RS
MAL
E AS
SOCI
ATE
PROF
ESSO
RS
FEM
ALE
ASSO
CIAT
E PR
OFES
SORS
MAL
E AS
SIST
ANT
PROF
ESSO
RS
FEM
ALE
ASSI
STAN
T PR
OFES
SORS
MAL
E IN
STRU
CTOR
S/LE
CTUR
ERS
FEM
ALE
INST
RUCT
ORS/
LECT
URER
S
TOTA
L FU
LL T
IME
EQUI
VALE
NT
Acadia - - 2 1 1 - 4 - 8 Alberta 89 4 43 4 42 10 - - 192 BCIT 38 5 - - - - - - 43 Calgary 71 6 45 13 12 3 6 5 161 Cape Breton 2 - - - - - 3 - 5 Carleton 50 4 54 4 23 6 5 1 147 Concordia 69 9 47 10 16 7 10 2 169 Conestoga 9 1 - - - - - - 10 Dal 43 1 18 9 6 2 14 1 94 ETS 65 11 81 14 14 4 122 18 329 Guelph 11 2 12 3 7 1 3 2 41 Lakehead 14 - 13 2 10 - - - 39 Laurentian 13 1 6 - 3 - 8 - 31 Laval 96 12 26 4 22 2 - - 162 Manitoba 36 3 19 4 10 2 5 1 80 McGill 42 - 57 9 20 6 - 1 135 McMaster 78 4 45 5 8 8 1 - 148 Moncton 10 - 7 2 2 1 5 1 28 MUN 24 2 25 3 9 4 2 1 70 NSAC 3 - 4 - 4 1 8 - 20 Ottawa 51 6 25 12 13 6 1 7 121 Polytechnique 100 10 51 9 44 9 16 3 242 Queen's 68 15 38 2 12 4 8 1 147 Regina 18 3 10 2 2 1 3 - 39 RMC 17 1 27 2 15 6 16 3 87 Ryerson 65 6 36 7 12 1 27 6 160 Saskatchewan 34 2 22 3 16 3 2 1 83 SFU 19 2 9 3 5 1 7 2 48 Sherbrooke 59 2 19 4 12 1 99 17 213 SMU 2 - - - 1 - 1 1 5 StFX 1 - 1 - 1 - - - 3 Toronto 112 9 46 17 26 10 16 5 241 UBC 85 6 37 7 10 2 21 12 180 UBCO 3 1 10 2 13 1 3 3 36 UNB 35 7 12 1 6 - 10 - 71 UNBC 3 - 1 - - - 0 0 5 UOIT 20 - 22 4 9 5 9 - 69 UPEI 1 - 1 - 1 1 1 1 6 UQAC 10 1 7 2 3 1 8 1 32 UQAM 9 - - - - - 2 - 11 UQAR 7 - 1 - 1 - 6 1 16 UQAT 4 - 6 - 1 - 14 3 28 UQO 9 1 2 2 1 1 - - 16 UQTR 18 - 9 1 3 - - - 31 UVic 24 1 22 6 3 1 2 - 59 Waterloo 110 15 64 9 42 11 17 4 270 Western 35 3 33 6 9 3 7 - 95 Windsor 34 2 23 4 4 2 - 1 70 York 11 - 11 4 13 - 2 - 41TOTAL 1,726 156 1,048 195 487 127 491 105 4,334
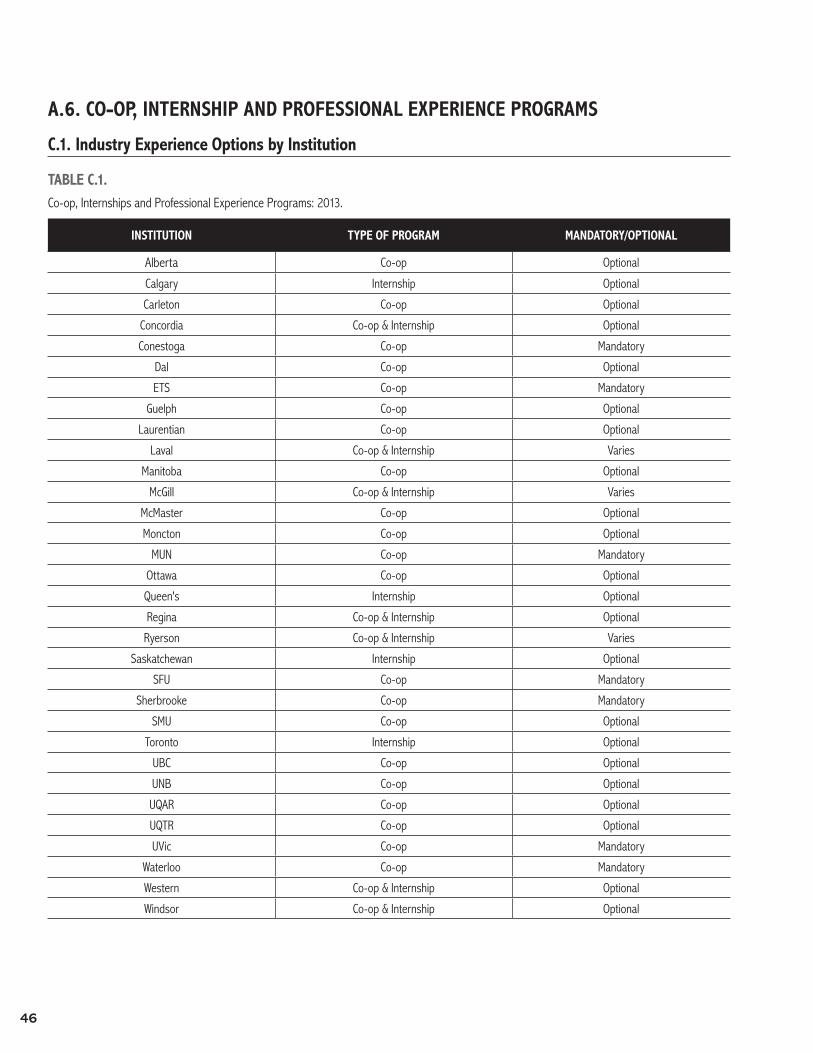
46
A.6. CO-OP, INTERNSHIP AND PROFESSIONAL EXPERIENCE PROGRAMS
C.1. Industry Experience Options by Institution
TABLE C.1.Co-op, Internships and Professional Experience Programs: 2013.
INSTITUTION TYPE OF PROGRAM MANDATORY/OPTIONAL
Alberta Co-op Optional
Calgary Internship Optional
Carleton Co-op Optional
Concordia Co-op & Internship Optional
Conestoga Co-op Mandatory
Dal Co-op Optional
ETS Co-op Mandatory
Guelph Co-op Optional
Laurentian Co-op Optional
Laval Co-op & Internship Varies
Manitoba Co-op Optional
McGill Co-op & Internship Varies
McMaster Co-op Optional
Moncton Co-op Optional
MUN Co-op Mandatory
Ottawa Co-op Optional
Queen's Internship Optional
Regina Co-op & Internship Optional
Ryerson Co-op & Internship Varies
Saskatchewan Internship Optional
SFU Co-op Mandatory
Sherbrooke Co-op Mandatory
SMU Co-op Optional
Toronto Internship Optional
UBC Co-op Optional
UNB Co-op Optional
UQAR Co-op Optional
UQTR Co-op Optional
UVic Co-op Mandatory
Waterloo Co-op Mandatory
Western Co-op & Internship Optional
Windsor Co-op & Internship Optional
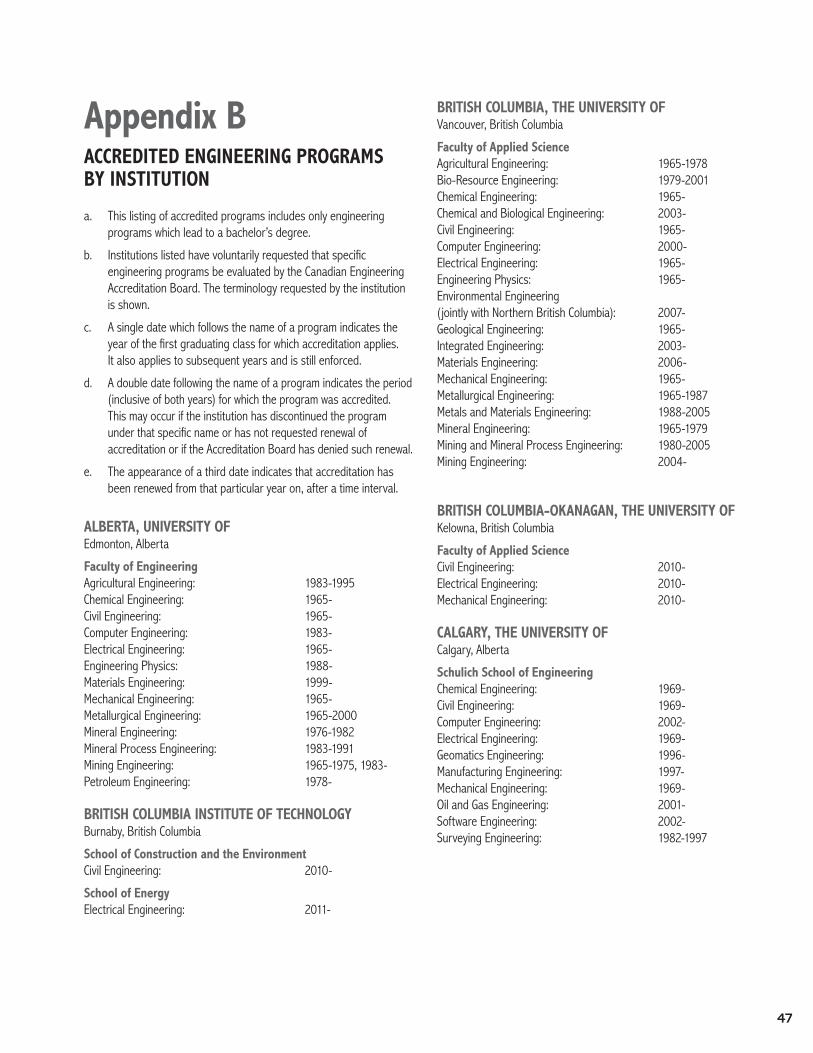
47
Appendix BACCREDITED ENGINEERING PROGRAMS BY INSTITUTION
a. This listing of accredited programs includes only engineering programs which lead to a bachelor’s degree.
b. Institutions listed have voluntarily requested that specific engineering programs be evaluated by the Canadian Engineering Accreditation Board. The terminology requested by the institution is shown.
c. A single date which follows the name of a program indicates the year of the first graduating class for which accreditation applies. It also applies to subsequent years and is still enforced.
d. A double date following the name of a program indicates the period (inclusive of both years) for which the program was accredited. This may occur if the institution has discontinued the program under that specific name or has not requested renewal of accreditation or if the Accreditation Board has denied such renewal.
e. The appearance of a third date indicates that accreditation has been renewed from that particular year on, after a time interval.
ALBERTA, UNIVERSITY OFEdmonton, Alberta
Faculty of EngineeringAgricultural Engineering: 1983-1995Chemical Engineering: 1965-Civil Engineering: 1965-Computer Engineering: 1983-Electrical Engineering: 1965-Engineering Physics: 1988-Materials Engineering: 1999-Mechanical Engineering: 1965-Metallurgical Engineering: 1965-2000Mineral Engineering: 1976-1982Mineral Process Engineering: 1983-1991Mining Engineering: 1965-1975, 1983-Petroleum Engineering: 1978-
BRITISH COLUMBIA INSTITUTE OF TECHNOLOGYBurnaby, British Columbia
School of Construction and the EnvironmentCivil Engineering: 2010-
School of EnergyElectrical Engineering: 2011-
BRITISH COLUMBIA, THE UNIVERSITY OFVancouver, British Columbia
Faculty of Applied ScienceAgricultural Engineering: 1965-1978Bio-Resource Engineering: 1979-2001Chemical Engineering: 1965-Chemical and Biological Engineering: 2003-Civil Engineering: 1965-Computer Engineering: 2000-Electrical Engineering: 1965-Engineering Physics: 1965-Environmental Engineering (jointly with Northern British Columbia): 2007-Geological Engineering: 1965-Integrated Engineering: 2003-Materials Engineering: 2006-Mechanical Engineering: 1965-Metallurgical Engineering: 1965-1987Metals and Materials Engineering: 1988-2005Mineral Engineering: 1965-1979Mining and Mineral Process Engineering: 1980-2005Mining Engineering: 2004-
BRITISH COLUMBIA-OKANAGAN, THE UNIVERSITY OFKelowna, British Columbia
Faculty of Applied ScienceCivil Engineering: 2010-Electrical Engineering: 2010-Mechanical Engineering: 2010-
CALGARY, THE UNIVERSITY OFCalgary, Alberta
Schulich School of EngineeringChemical Engineering: 1969-Civil Engineering: 1969-Computer Engineering: 2002-Electrical Engineering: 1969-Geomatics Engineering: 1996-Manufacturing Engineering: 1997-Mechanical Engineering: 1969-Oil and Gas Engineering: 2001-Software Engineering: 2002-Surveying Engineering: 1982-1997
48
CARLETON UNIVERSITYOttawa, Ontario
Faculty of Engineering and DesignAerospace Engineering: 1992-Biomedical and Electrical Engineering: 2010-Biomedical and Mechanical Engineering: 2012-Civil Engineering: 1965-Communications Engineering: 2002-Computer Systems Engineering: 1984-Electrical Engineering: 1965-Engineering Physics: 2003-Environmental Engineering: 1996-Mechanical Engineering: 1965-Software Engineering: 2003-Sustainable and Renewable Energy Engineering: 2012-
CONCORDIA UNIVERSITYMontréal, Québec (formerly Sir George Williams University, 1959-1974)
Faculty of Engineering and Computer ScienceBuilding Engineering: 1982-Civil Engineering: 1969-Computer Engineering: 1983-Electrical Engineering: 1969-Industrial Engineering: 1995-Mechanical Engineering: 1969-Software Engineering: 2002-
CONESTOGA COLLEGEKitchener, Ontario
School of Engineering and Information TechnologyMechanical Systems Engineering: 2010-
DALHOUSIE UNIVERSITYHalifax, Nova Scotia(formerly Dal Tech, 1997-2000 and Technical University of Nova Scotia, 1981-1997 and Nova Scotia Technical College, 1907-1980)
Faculty of EngineeringAgricultural Engineering: 1974-2000Biological Engineering: 1997-Chemical Engineering: 1965-Civil Engineering: 1965-Computer Engineering: 2006-Electrical Engineering: 1965-Engineering Physics: 1987-1991Environmental Engineering: 2006-Industrial Engineering: 1969-Materials Engineering: 2005-Mechanical Engineering: 1965-Metallurgical Engineering: 1965-1977, 1981-2005Mineral Resources Engineering: 2007-Mining Engineering: 1965-2006
ÉCOLE DE TECHNOLOGIE SUPÉRIEUREMontréal, Québec(affiliated with l’Université du Québec)
Génie de la construction: 1993-Génie des opérations et de la logistique: 2008-Génie des technologies de l’information: 2006-Génie et gestion de la construction: 1990-1996Génie électrique: 1990-Génie logiciel: 2004-Génie mécanique: 1990-Génie de la production automatisée: 1990-
GUELPH, UNIVERSITY OFGuelph, Ontario
School of EngineeringAgricultural Engineering: 1973-1995Biological Engineering: 1973-Engineering Systems and Computing: 1994-Environmental Engineering: 1993-Food Engineering: 1993-2000Mechanical Engineering: 2013-Water Resources Engineering: 1973-
LAKEHEAD UNIVERSITYThunder Bay, Ontario
Faculty of EngineeringChemical Engineering: 1974-Civil Engineering: 1974-Electrical Engineering: 1974-Mechanical Engineering: 1974-Software Engineering: 2002-
LAURENTIAN UNIVERSITYSudbury, Ontario
School of EngineeringChemical Engineering: 2006-Extractive Metallurgical Engineering: 1987-2006Extractive Metallurgy: 1985-1986Mechanical Engineering: 2011- Mining Engineering: 1987
LAVAL, UNIVERSITÉQuébec, Québec
Faculté de foresterie, de géographie et de géomatiqueGénie du bois: 2002-Génie géomatique: 2007-
Faculté des sciences de l’agriculture et de l’alimentationGénie agroenvironnemental: 2002-Génie alimentaire: 1997-
49
Faculté des sciences et de génieGénie chimique: 1965-Génie civil: 1965-Génie des eaux: 2009- Génie électrique: 1965-Génie géologique: 1965-Génie informatique: 1993-Génie logiciel: 2006-Génie des matériaux et de la métallurgie: 1990-Génie mécanique: 1965-Génie métallurgique: 1965-1990Génie des mines et de la minéralurgie: 1990-Génie minier: 1965-1990Génie physique: 1965-Génie rural: 1973-2002
MANITOBA, THE UNIVERSITY OFWinnipeg, Manitoba
Faculty of EngineeringAgricultural Engineering: 1971-1998Biosystems Engineering: 1996-Civil Engineering: 1965-Computer Engineering: 1987-Electrical Engineering: 1965-Geological Engineering: 1965-2001Industrial Engineering: 1987-2005Manufacturing Engineering: 2003-2013Mechanical Engineering: 1965-
MCGILL UNIVERSITYMontréal, Québec
Faculty of Agricultural and Environmental SciencesBioresource Engineering: 2005-
Faculty of EngineeringAgricultural Engineering (Macdonald College): 1971-2006Chemical Engineering: 1965-Civil Engineering: 1965-Computer Engineering: 1993-Electrical Engineering: 1965-Materials Engineering: 2005-Mechanical Engineering: 1965-Metallurgical Engineering: 1965-2007Mining Engineering: 1965-Software Engineering: 2007-
MCMASTER UNIVERSITY*Hamilton, Ontario
Faculty of EngineeringCeramic Engineering: 1974-1998Chemical Engineering: 1965-Chemical Engineering & Bioengineering: 2006-Civil Engineering: 1989-Civil Engineering & Computer Systems: 1992-1995Civil Engineering & Engineering Mechanics: 1965-1988Computer Engineering: 1981-Electrical & Biomedical Engineering: 2006-Electrical Engineering: 1965-Engineering Physics: 1974-Manufacturing Engineering: 1982-2005Materials Engineering: 1990-Mechanical Engineering: 1965-Mechatronics Engineering: 2009-Metallurgical Engineering: 1965-1997Software Engineering: 2001-
*Graduates of programs at this institution may have completed additional non-technical studies, such as a management or society option, that will be listed on their transcripts. These transcripts contain wording such as “(Discipline) Engineering and Society” or “(Discipline) Engineering and Management”. Only the engineering component of these programs is accredited by the Canadian Engineering Accreditation Board; thus, even though these options meet the accreditation requirements, only the base engineering programs are listed here.
MEMORIAL UNIVERSITY OF NEWFOUNDLANDSt. John’s, Newfoundland
Faculty of Engineering and Applied ScienceCivil Engineering: 1975-Computer Engineering: 2002-Electrical Engineering: 1975-Mechanical Engineering: 1975-Naval Architectural Engineering: 1986-1996Ocean and Naval Architectural Engineering: 1997-Process Engineering: 2013-Shipbuilding Engineering: 1982-1985
MONCTON, UNIVERSITÉ DEMoncton, Nouveau-Brunswick
Faculté d’ingénierieGénie civil: 1972-Génie électrique: 1998-Génie industriel: 1975-2009Génie mécanique: 1990-
50
NEW BRUNSWICK, UNIVERSITY OFFredericton, New Brunswick
Faculty of Computer Science and Faculty of EngineeringSoftware Engineering: 2006-
Faculty of EngineeringChemical Engineering: 1965-Civil Engineering: 1965-Computer Engineering: 2001-Electrical Engineering: 1965-Forest Engineering: 1972-Geological Engineering: 1984-Geomatics Engineering: 1999-Mechanical Engineering: 1965-Surveying Engineering: 1972-1999
NORTHERN BRITISH COLUMBIA, UNIVERSITY OFPrince George, British Columbia
College of Science and ManagementEnvironmental Engineering (jointly with British Columbia): 2007-
NOVA SCOTIA TECHNICAL COLLEGE(see Dalhousie University)
NSTC offered accredited engineering programs from 1965 to 1980.NSTC a offert des programmes de génie agréés de 1965 à 1980.
NOVA SCOTIA, TECHNICAL UNIVERSITY OF(see Dalhousie University)
TUNS offered accredited engineering programs from 1981 to 1996. However, students who enrolled prior to April 1, 1997, and graduated after that date can request that their degree be in the name of TUNS.
ONTARIO INSTITUTE OF TECHNOLOGY, UNIVERSITY OF*Oshawa, Ontario
Faculty of Engineering and Applied ScienceAutomotive Engineering: 2009- Electrical Engineering: 2009- Manufacturing Engineering: 2007- Mechanical Engineering: 2008- Software Engineering: 2009-
Faculty of Energy Systems and Nuclear ScienceNuclear Engineering: 2007-
* Graduates of programs at this institution may have completed additional non-technical studies, such as a management option, that will be listed on their degrees and transcripts. These degrees and transcripts contain wording such as “(Discipline) Engineering and Management”. Only the engineering component of these programs is accredited by the Canadian Engineering Accreditation Board; thus, even though these options meet the accreditation requirements, only the base engineering programs are listed here.
OTTAWA, UNIVERSITY OFOttawa, Ontario
Faculty of EngineeringBiomedical Mechanical Engineering: 2009-Chemical Engineering: 1965-Civil Engineering: 1971-Computer Engineering: 1990-Electrical Engineering: 1965-Mechanical Engineering: 1971-Software Engineering: 2001-
POLYTECHNIQUE, ÉCOLEMontréal, Québec(affiliated with l’Université de Montréal)
Génie aérospatial: 2012-Génie biomédical: 2012-Génie chimique: 1965-Génie civil: 1965-Génie électrique: 1965-Génie géologique: 1965-Génie industriel: 1973-Génie informatique: 1989-Génie logiciel: 2005-Génie des matériaux: 1990-2012Génie mécanique: 1965-Génie métallurgique: 1965-1989Génie des mines: 1991-Génie minier: 1965-1991Génie physique: 1965-
QUÉBEC EN ABITIBI-TÉMISCAMINGUE, UNIVERSITÉ DURouyn-Noranda, Québec
Unité d’enseignement et de recherche en sciences appliquéesGénie électromécanique: 2000-Génie mécanique: 2010-
QUÉBEC À CHICOUTIMI, UNIVERSITÉ DUChicoutimi, Québec
Département des sciences appliquéeGénie civil: 2012-Génie électrique: 2004-Génie géologique: 1983-Génie informatique: 1992-Génie mécanique: 2004-Génie unifié: 1981-2009Ingénierie de l’aluminium: 2008-2012
QUÉBEC À MONTRÉAL, UNIVERSITÉ DUMontréal, Québec
Faculté des sciencesGénie microélectronique: 2007-
51
QUÉBEC EN OUTAOUAIS, UNIVERSITÉ DUGatineau, Québec(formerly Québec à Hull, Université du)
Module de l’ingénierieGénie informatique: 2002-
QUÉBEC À RIMOUSKI, UNIVERSITÉ DURimouski, Québec
Module de génieGénie des systèmes électromécaniques: 1998-Génie électrique : 2009- Génie mécanique : 2009-
QUÉBEC À TROIS-RIVIÈRES, UNIVERSITÉ DUTrois-Rivières, Québec
École d’ingénierieGénie chimique: 1990-Génie électrique: 1978-Génie industriel: 1980-Génie mécanique manufacturier: 1987-1999Génie mécanique: 2000-
QUEEN’S UNIVERSITYKingston, Ontario
Faculty of Applied ScienceChemical Engineering: 1965-Civil Engineering: 1965-Computer Engineering: 2002-Electrical Engineering: 1965-Engineering Chemistry: 1979-Engineering Physics: 1965-Geological Engineering: 1975-Materials and Metallurgical Engineering: 1992-2002Mathematics and Engineering: 1974-Mechanical Engineering: 1965-Metallurgical Engineering: 1965-1991Mining Engineering: 1965-
REGINA, UNIVERSITY OFRegina, Saskatchewan
Faculty of Engineering and Applied ScienceElectronic Information Systems Engineering: 1986-1994Electronic Systems Engineering: 1995-Environmental Systems Engineering: 1997-Industrial Systems Engineering: 1984-Petroleum Systems Engineering: 2003-Regional Environmental Systems Engineering: 1990-1997Regional Systems Engineering: 1984-1989Software Systems Engineering: 2007-Systems Engineering: 1981-1983
ROYAL MILITARY COLLEGE OF CANADAKingston, Ontario
Faculty of EngineeringAeronautical Engineering: 2009- Chemical Engineering: 1965-1981, 2001-Chemical and Materials Engineering: 1992-2001Civil Engineering: 1965-Computer Engineering: 1983-Electrical Engineering: 1965-Engineering and Management: 1972-1995Engineering Physics: 1975-1995Fuels and Materials Engineering: 1982-1991Mechanical Engineering: 1965-
RYERSON POLYTECHNICAL INSTITUTE(see Ryerson University)
RPI offered accredited engineering programs in 1992.
RYERSON POLYTECHNIC UNIVERSITY (RPU)(see Ryerson University)
RPU offered accredited engineering programs from 1992 to 2002.
RYERSON UNIVERSITYToronto, Ontario(formerly Ryerson Polytechnical Institute, 1964-1992, and Ryerson Polytechnic University, 1992-2002)
Faculty of Engineering, Architecture and Science Aerospace Engineering: 1992-Biomedical Engineering: 2012-Chemical Engineering: 1992-Civil Engineering: 1992-Computer Engineering: 2006-Electrical Engineering: 1992-Industrial Engineering: 1992-Mechanical Engineering: 1992-
SASKATCHEWAN, UNIVERSITY OFSaskatoon, Saskatchewan
College of EngineeringAgricultural Engineering: 1965-1992Agricultural and Bioresource Engineering: 1992-Chemical Engineering: 1965-Civil Engineering: 1965-Computer Engineering: 2009-Electrical Engineering: 1965-Engineering Physics: 1965-Environmental Engineering: 2011- Geological Engineering: 1965-Geological Engineering (Geophysics): 1975-1999Mechanical Engineering: 1965-Mining Engineering: 1974-1976

52
SHERBROOKE, UNIVERSITÉ DESherbrooke, Québec
Faculté de génieGénie biotechnologique: 2008-Génie chimique: 1973-Génie civil: 1965-Génie électrique: 1965-Génie informatique: 1997-Génie mécanique: 1965-
SIMON FRASER UNIVERSITYBurnaby, British Columbia
School of Engineering ScienceEngineering Science: 1986-Mechatronic Systems Engineering: 2011-
SIR GEORGE WILLIAMS UNIVERSITY (SGW)(see Concordia University)
SGW offered accredited engineering programs from 1969 to 1974.
TORONTO, UNIVERSITY OFToronto, Ontario
Faculty of Applied Science and EngineeringChemical Engineering: 1965-Civil Engineering: 1965-Computer Engineering: 1994-Electrical Engineering: 1965-Engineering Science: 1965-Geo-Engineering: 1983-1990Geological Engineering: 1965-1974Geological Engineering & Applied Earth Science: 1975-1982Geological and Mineral Engineering: 1991-1998Industrial Engineering: 1965-Materials Engineering: 1996-Mechanical Engineering: 1965-Metallurgical Engineering & Materials Science: 1986-1995Metallurgy & Materials Science: 1965-1985Mineral Engineering: 1999-
VICTORIA, UNIVERSITY OFVictoria, British Columbia
Faculty of EngineeringComputer Engineering: 1988-Electrical Engineering: 1988-Mechanical Engineering: 1992-Software Engineering: 2007-
WATERLOO, UNIVERSITY OFWaterloo, Ontario
Faculty of EngineeringChemical Engineering: 1965-Civil Engineering: 1965-Computer Engineering: 1989-Electrical Engineering: 1965-Environmental Engineering: 1999-Geological Engineering: 1986-Management Engineering: 2012-Mechanical Engineering: 1965-Mechatronics Engineering: 2008-Nanotechnology Engineering: 2010-Software Engineering: 2006-Systems Design Engineering: 1974-
WESTERN ONTARIO, THE UNIVERSITY OFLondon, Ontario
Faculty of EngineeringChemical Engineering: 1965-1971, 2007-Chemical and Biochemical Engineering: 1972-2006Civil Engineering: 1965-Computer Engineering: 2001-Electrical Engineering: 1965-Green Process Engineering: 2012-Integrated Engineering: 2001-Materials Engineering: 1968-1999Mechanical Engineering: 1965-Software Engineering: 2001-
WINDSOR, UNIVERSITY OFWindsor, Ontario
Faculty of EngineeringChemical Engineering: 1965-1990Civil Engineering: 1965-Electrical Engineering: 1965-Engineering Materials: 1974-1991Environmental Engineering: 1991-Geological Engineering: 1972-1989Industrial Engineering: 1974-Mechanical Engineering: 1965-
YORK UNIVERSITYToronto, Ontario
Faculty of Science and EngineeringComputer Engineering: 2007-Geomatics Engineering: 2007-Space Engineering: 2007-
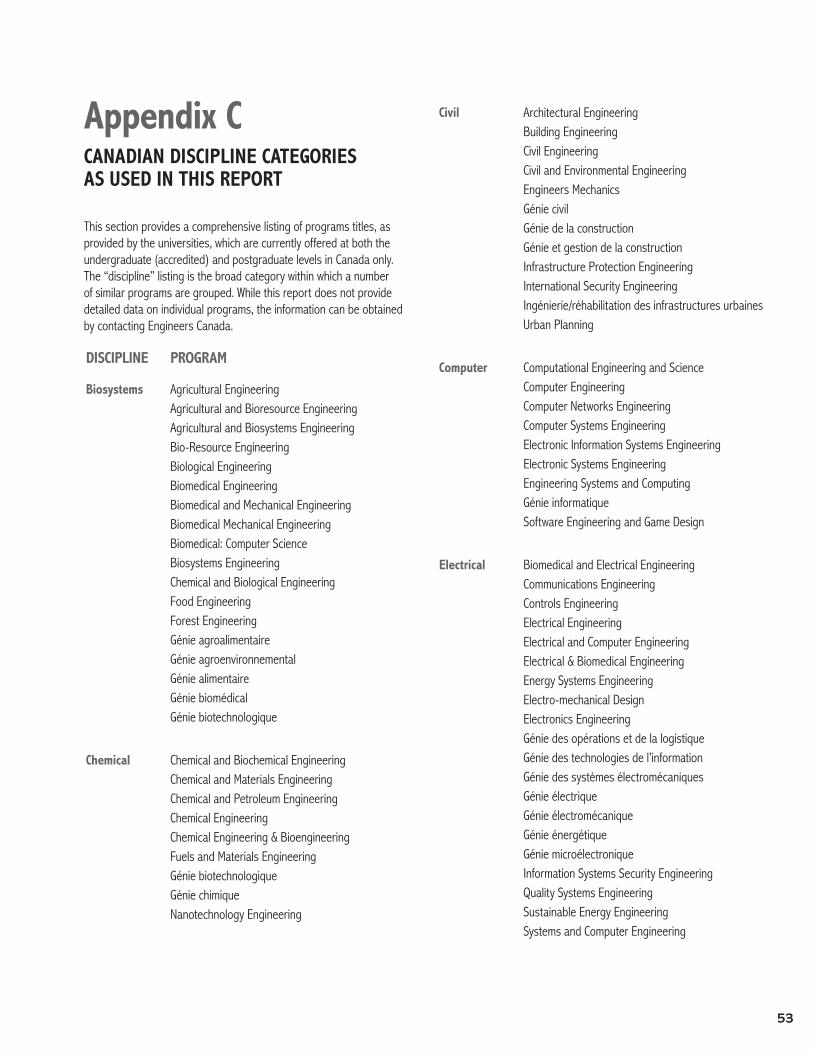
53
Appendix CCANADIAN DISCIPLINE CATEGORIES AS USED IN THIS REPORT
This section provides a comprehensive listing of programs titles, as provided by the universities, which are currently offered at both the undergraduate (accredited) and postgraduate levels in Canada only. The “discipline” listing is the broad category within which a number of similar programs are grouped. While this report does not provide detailed data on individual programs, the information can be obtained by contacting Engineers Canada.
DISCIPLINE PROGRAM
Biosystems Agricultural EngineeringAgricultural and Bioresource EngineeringAgricultural and Biosystems EngineeringBio-Resource EngineeringBiological EngineeringBiomedical EngineeringBiomedical and Mechanical EngineeringBiomedical Mechanical EngineeringBiomedical: Computer ScienceBiosystems EngineeringChemical and Biological EngineeringFood EngineeringForest EngineeringGénie agroalimentaireGénie agroenvironnementalGénie alimentaireGénie biomédicalGénie biotechnologique
Chemical Chemical and Biochemical EngineeringChemical and Materials EngineeringChemical and Petroleum EngineeringChemical EngineeringChemical Engineering & BioengineeringFuels and Materials EngineeringGénie biotechnologiqueGénie chimiqueNanotechnology Engineering
Civil Architectural EngineeringBuilding EngineeringCivil EngineeringCivil and Environmental EngineeringEngineers Mechanics Génie civilGénie de la constructionGénie et gestion de la constructionInfrastructure Protection EngineeringInternational Security EngineeringIngénierie/réhabilitation des infrastructures urbainesUrban Planning
Computer Computational Engineering and ScienceComputer EngineeringComputer Networks EngineeringComputer Systems EngineeringElectronic Information Systems EngineeringElectronic Systems EngineeringEngineering Systems and ComputingGénie informatiqueSoftware Engineering and Game Design
Electrical Biomedical and Electrical EngineeringCommunications EngineeringControls EngineeringElectrical EngineeringElectrical and Computer EngineeringElectrical & Biomedical EngineeringEnergy Systems EngineeringElectro-mechanical DesignElectronics EngineeringGénie des opérations et de la logistiqueGénie des technologies de l’informationGénie des systèmes électromécaniquesGénie électriqueGénie électromécaniqueGénie énergétiqueGénie microélectroniqueInformation Systems Security EngineeringQuality Systems EngineeringSustainable Energy EngineeringSystems and Computer Engineering
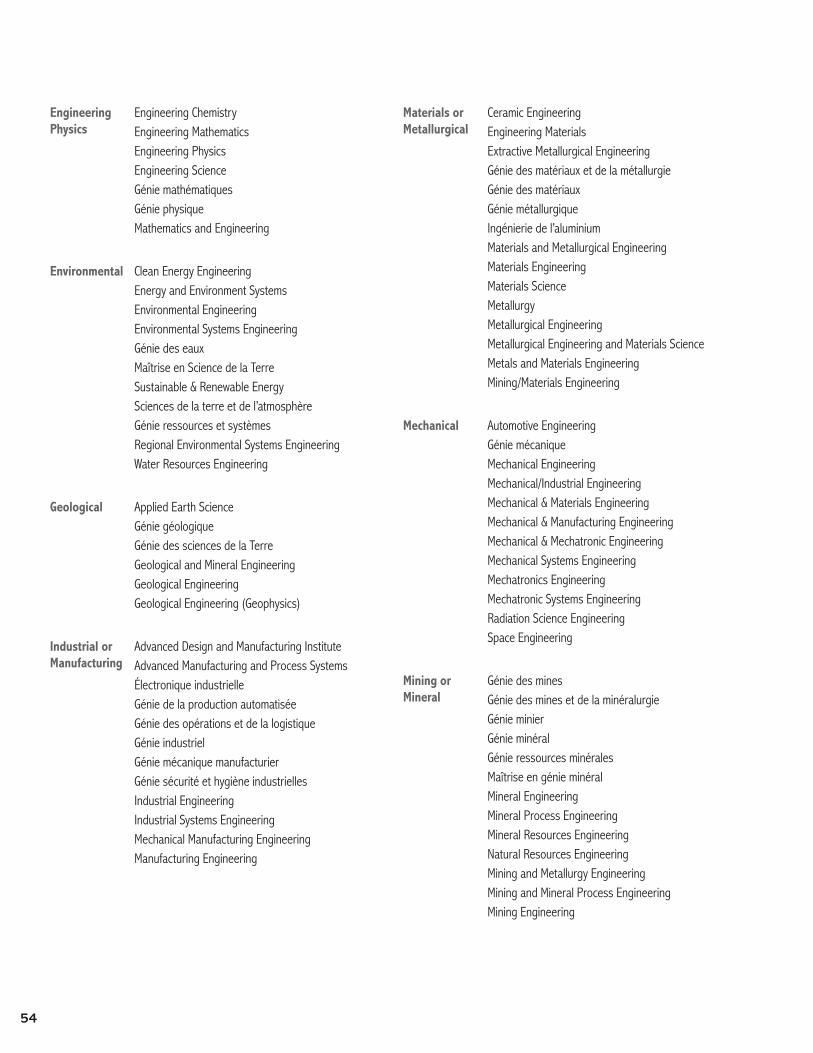
54
Engineering Physics
Engineering ChemistryEngineering MathematicsEngineering PhysicsEngineering ScienceGénie mathématiquesGénie physiqueMathematics and Engineering
Environmental Clean Energy EngineeringEnergy and Environment SystemsEnvironmental EngineeringEnvironmental Systems EngineeringGénie des eauxMaîtrise en Science de la TerreSustainable & Renewable EnergySciences de la terre et de l’atmosphèreGénie ressources et systèmesRegional Environmental Systems EngineeringWater Resources Engineering
Geological Applied Earth ScienceGénie géologiqueGénie des sciences de la TerreGeological and Mineral EngineeringGeological EngineeringGeological Engineering (Geophysics)
Industrial or Manufacturing
Advanced Design and Manufacturing InstituteAdvanced Manufacturing and Process SystemsÉlectronique industrielleGénie de la production automatiséeGénie des opérations et de la logistiqueGénie industrielGénie mécanique manufacturierGénie sécurité et hygiène industriellesIndustrial EngineeringIndustrial Systems EngineeringMechanical Manufacturing EngineeringManufacturing Engineering
Materials or Metallurgical
Ceramic Engineering Engineering MaterialsExtractive Metallurgical EngineeringGénie des matériaux et de la métallurgieGénie des matériauxGénie métallurgiqueIngénierie de l’aluminiumMaterials and Metallurgical EngineeringMaterials EngineeringMaterials ScienceMetallurgyMetallurgical EngineeringMetallurgical Engineering and Materials ScienceMetals and Materials EngineeringMining/Materials Engineering
Mechanical Automotive EngineeringGénie mécaniqueMechanical EngineeringMechanical/Industrial EngineeringMechanical & Materials EngineeringMechanical & Manufacturing EngineeringMechanical & Mechatronic EngineeringMechanical Systems Engineering Mechatronics EngineeringMechatronic Systems EngineeringRadiation Science EngineeringSpace Engineering
Mining or Mineral
Génie des minesGénie des mines et de la minéralurgieGénie minierGénie minéralGénie ressources minéralesMaîtrise en génie minéralMineral EngineeringMineral Process EngineeringMineral Resources EngineeringNatural Resources EngineeringMining and Metallurgy EngineeringMining and Mineral Process EngineeringMining Engineering
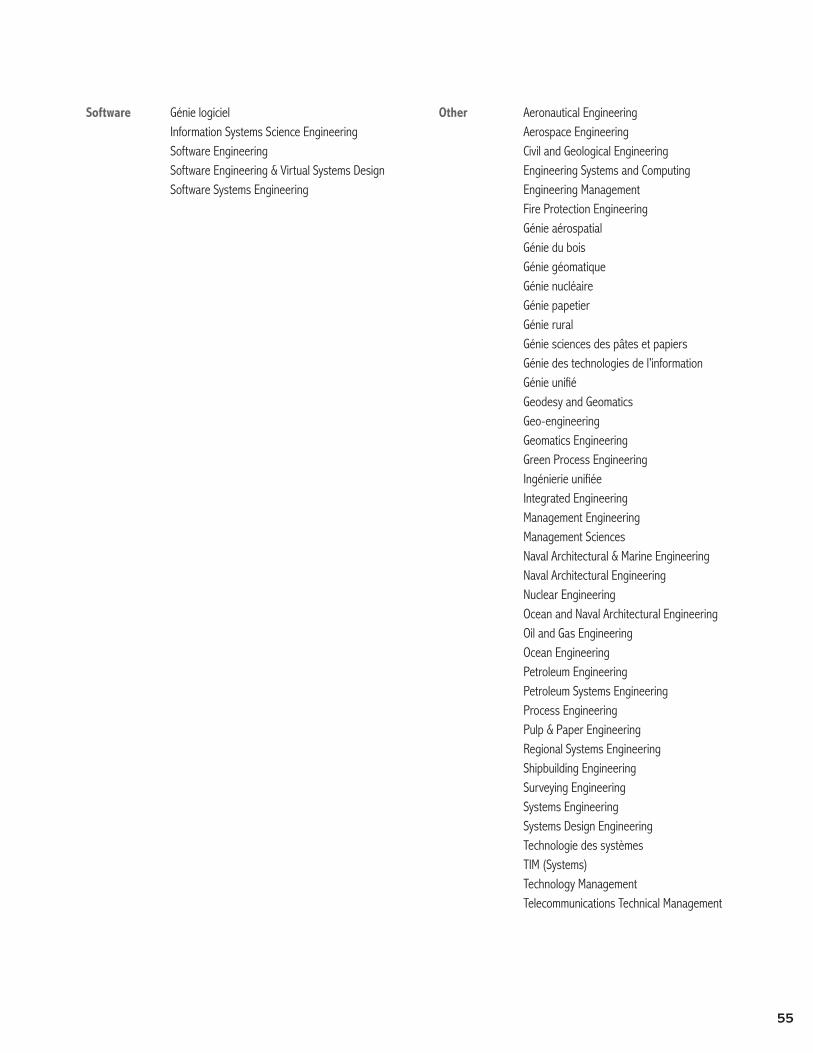
55
Software Génie logicielInformation Systems Science EngineeringSoftware EngineeringSoftware Engineering & Virtual Systems Design Software Systems Engineering
Other Aeronautical EngineeringAerospace EngineeringCivil and Geological EngineeringEngineering Systems and ComputingEngineering ManagementFire Protection EngineeringGénie aérospatialGénie du boisGénie géomatiqueGénie nucléaireGénie papetierGénie ruralGénie sciences des pâtes et papiersGénie des technologies de l’informationGénie unifiéGeodesy and GeomaticsGeo-engineeringGeomatics EngineeringGreen Process EngineeringIngénierie unifiéeIntegrated EngineeringManagement EngineeringManagement SciencesNaval Architectural & Marine EngineeringNaval Architectural EngineeringNuclear EngineeringOcean and Naval Architectural EngineeringOil and Gas EngineeringOcean EngineeringPetroleum EngineeringPetroleum Systems EngineeringProcess EngineeringPulp & Paper EngineeringRegional Systems EngineeringShipbuilding EngineeringSurveying EngineeringSystems EngineeringSystems Design EngineeringTechnologie des systèmesTIM (Systems)Technology Management Telecommunications Technical Management
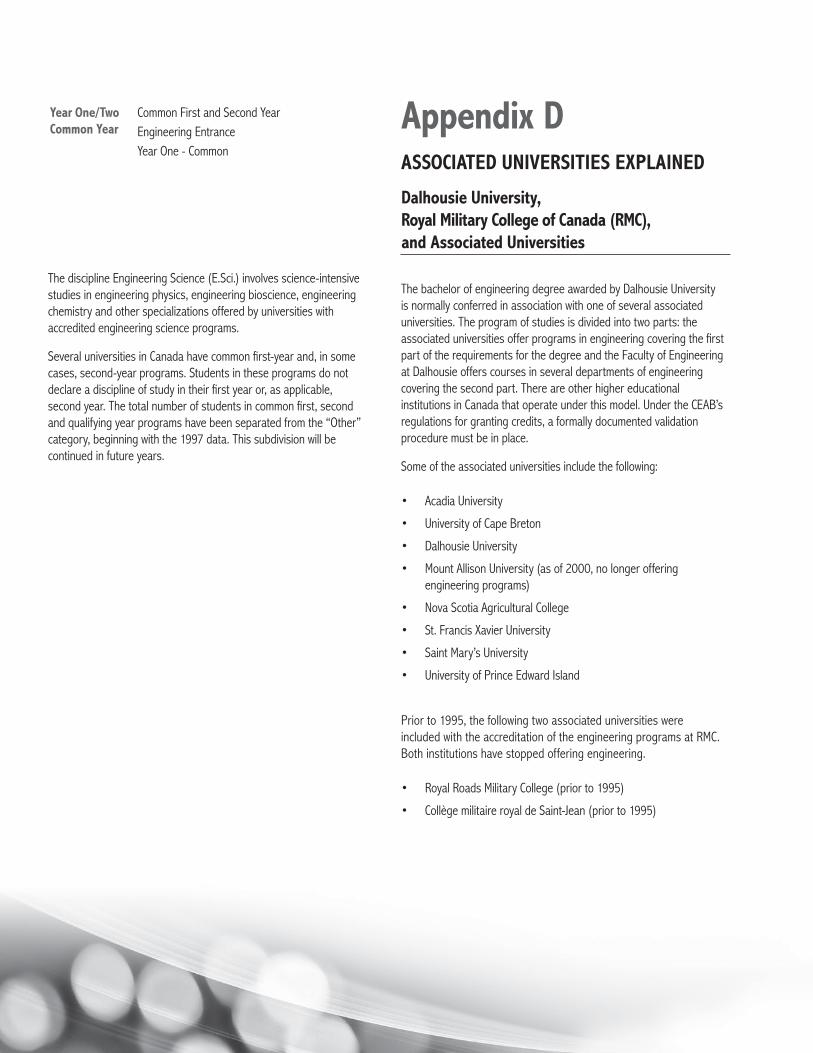
56
Year One/Two Common Year
Common First and Second Year Engineering Entrance Year One - Common
The discipline Engineering Science (E.Sci.) involves science-intensive studies in engineering physics, engineering bioscience, engineering chemistry and other specializations offered by universities with accredited engineering science programs.
Several universities in Canada have common first-year and, in some cases, second-year programs. Students in these programs do not declare a discipline of study in their first year or, as applicable, second year. The total number of students in common first, second and qualifying year programs have been separated from the “Other” category, beginning with the 1997 data. This subdivision will be continued in future years.
Appendix DASSOCIATED UNIVERSITIES EXPLAINED
Dalhousie University, Royal Military College of Canada (RMC), and Associated Universities
The bachelor of engineering degree awarded by Dalhousie University is normally conferred in association with one of several associated universities. The program of studies is divided into two parts: the associated universities offer programs in engineering covering the first part of the requirements for the degree and the Faculty of Engineering at Dalhousie offers courses in several departments of engineering covering the second part. There are other higher educational institutions in Canada that operate under this model. Under the CEAB’s regulations for granting credits, a formally documented validation procedure must be in place.
Some of the associated universities include the following:
• Acadia University
• University of Cape Breton
• Dalhousie University
• Mount Allison University (as of 2000, no longer offering engineering programs)
• Nova Scotia Agricultural College
• St. Francis Xavier University
• Saint Mary’s University
• University of Prince Edward Island
Prior to 1995, the following two associated universities were included with the accreditation of the engineering programs at RMC. Both institutions have stopped offering engineering.
• Royal Roads Military College (prior to 1995)
• Collège militaire royal de Saint-Jean (prior to 1995)
57
Appendix ESURVEY PROCEDURES AND DATA COMPILATION METHODOLOGY
Survey Procedures
Each year, Engineers Canada sends Canadian university faculties of engineering and applied science a questionnaire requesting statistics on full-time and part-time enrolment in their undergraduate and post-graduate programs. The institutions are also asked to provide data on the number of undergraduate and post-graduate degrees that have been awarded for the same calendar year being surveyed. Other information requested includes a gender breakdown for enrolment, as well as the number of foreign (visa) students enrolled in the programs.
Engineers Canada aims to produce a summary of the data by the spring, in order to support such activities as recruitment and planning for the upcoming academic year. The full report on engineering enrolment and degrees awarded is published and distributed several months later.
Compilation and Interpretation of Data
The enrolment and degrees awarded data is compiled into the Engineers Canada database. Prior to the publication of this report, summarized tables of the data are returned to the engineering faculties for verification.
The tabulations, which are found in Section A, list the enrolment and degrees awarded for undergraduate engineering programs that have been accredited by the Canadian Engineering Accreditation Board of Engineers Canada. Master’s and doctoral programs that are offered by the universities with accredited undergraduate engineering programs are also included. Further information is provided on faculty composition as well as cooperative, internship and professional experience programs.
The data tabulations are further subdivided to provide national, provincial, and institutional level information on enrolment as well as degrees awarded by engineering discipline, gender, and visa students.
Each year, data is collected on undergraduate enrolment in engineering programs that will be seeking accreditation. These are newer programs that have not produced any graduates as of the year of reporting. The Accreditation Board undertakes accreditation of these programs in the year in which the first students will graduate.
Data Limitations
Because of the variable nature of the titles applied to university engineering programs, the discipline headings are general in nature. Some of the data reporting may represent the “best fit” of a particular program, as defined in Appendix C of this report.
Data Utilization
Information presented in this report can be used for a variety of purposes:
• Enabling engineering students to make informed academic and career choices;
• Allowing employers and governments to determine the availability of qualified professional engineers in traditional and emerging areas of practice;
• Keeping the engineering profession abreast of current and future trends in engineering supply, the development and impact of technology, and the needs of employers to allow the development of appropriate standards for academic programs, entry into the engineering profession, and the maintenance of high practice standards in the interests of public safety and well-being; and,
• Assisting universities in preparing academic curricula and planning engineering programs that reflect advanced academic standards and emerging fields of study.
Further breakdown of the data can be requested by contacting Engineers Canada.
Engineers Canada 1100-180 Elgin Street, Ottawa, Ontario K2P 2K3 Tel.: 613.232.2474 Fax: 613.230.5759 email: [email protected]