Embed Size (px)
Citation preview
Bank of Canada Banque du Canada
Working Paper 2006-49 / Document de travail 2006-49
Canadian City Housing Prices andUrban Market Segmentation
by
Jason Allen, Robert Amano, David P. Byrne,and Allan W. Gregory

ISSN 1192-5434
Printed in Canada on recycled paper
Bank of Canada Working Paper 2006-49
December 2006
Canadian City Housing Prices andUrban Market Segmentation
by
Jason Allen,1 Robert Amano,2 David P. Byrne,3 andAllan W. Gregory3
1Monetary and Financial Analysis Department2Research Department
Bank of CanadaOttawa, Ontario, Canada K1A 0G9
3Queen’s UniversityKingston, Ontario, Canada K7L 3N6
Correspondence to Allan Gregory: [email protected]
The views expressed in this paper are those of the authors.No responsibility for them should be attributed to the Bank of Canada.
iii
Contents
Acknowledgements. . . . . . . . . . . . . . . . . . . . . . . . . . . . . . . . . . . . . . . . . . . . . . . . . . . . . . . . . . . . ivAbstract/Résumé. . . . . . . . . . . . . . . . . . . . . . . . . . . . . . . . . . . . . . . . . . . . . . . . . . . . . . . . . . . . . . . v
1 Introduction . . . . . . . . . . . . . . . . . . . . . . . . . . . . . . . . . . . . . . . . . . . . . . . . . . . . . . . . . . . . . . 1
2 A Single Canadian Housing Market? . . . . . . . . . . . . . . . . . . . . . . . . . . . . . . . . . . . . . . . . . . 3
3 City-Level Housing-Price Determinants . . . . . . . . . . . . . . . . . . . . . . . . . . . . . . . . . . . . . . . . 7
4 Conclusion . . . . . . . . . . . . . . . . . . . . . . . . . . . . . . . . . . . . . . . . . . . . . . . . . . . . . . . . . . . . . . 12
References. . . . . . . . . . . . . . . . . . . . . . . . . . . . . . . . . . . . . . . . . . . . . . . . . . . . . . . . . . . . . . . . . . . 14
Figures. . . . . . . . . . . . . . . . . . . . . . . . . . . . . . . . . . . . . . . . . . . . . . . . . . . . . . . . . . . . . . . . . . . . . . 17
Appendix: Data Descriptions . . . . . . . . . . . . . . . . . . . . . . . . . . . . . . . . . . . . . . . . . . . . . . . . . . . . 20

iv
Acknowledgements
Contract sponsor: Bank of Canada. David Byrne and Allan Gregory thank the Social Sciences and
Humanities Research Council for funding. We thank Jean-François Houde, Michel Laurence,
James Rossiter, Greg Tkacz, and Virginie Traclet as well as participants at a Bank of Canada
workshop and the Canadian Economics Association meetings in Montréal (2006). We thank
Wendy Chan for excellent research assistance. We also thank the Multiple Listing Service for
providing the housing data.
v
Abstract
The authors provide a detailed empirical analysis of Canadian city housing prices. They examine
the long-run relationship between city house prices in Canada from 1981 to 2005 as well as
idiosyncratic relations between city prices and city-specific variables. The results suggest that city
house prices are only weakly correlated in the long run, and that there is a disconnect between
house prices and interest rates. City-specific variables such as union wage levels, new-housing
prices, and the issuance of building permits tend to be positively related to city existing-house
prices. Surprisingly, there is mixed evidence with respect to standard measures of economic
activity, such as labour force and per capita GDP.
JEL classification: C22, C32, R2Bank classification: Regional economic developments
Résumé
Les auteurs présentent une analyse empirique détaillée de l’évolution des prix des maisons en
milieu urbain au Canada. Ils examinent la relation à long terme entre ces prix pour la période de
1981 à 2005 ainsi que les relations idiosyncrasiques entre ces mêmes prix et les variables propres
à chaque ville. Leurs résultats donnent à penser que la corrélation entre les prix des maisons en
milieu urbain est faible en longue période et que ceux-ci sont parfois déconnectés des taux
d’intérêt. Les variables propres aux villes, dont le niveau de salaire des travailleurs syndiqués, les
prix des maisons neuves et le nombre de permis de construire émis, sont liées positivement aux
prix de revente des maisons. Fait étonnant, les résultats ne sont pas concluants en ce qui concerne
les mesures courantes de l’activité économique telles que la population active et le produit
intérieur brut par habitant.
Classification JEL : C22, C32, R2Classification de la Banque : Évolution économique régionale
1 Introduction
Canadian house prices have increased at rapid and sustained rates throughout the past
two decades. In this time there has been an increase in home-ownership rates, a larger frac-
tion of household wealth held in the home, and an increase in household debt. Although the
rise in Canadian house prices has been modest by international standards, economists have,
nonetheless, discussed the possibility of a house-price bubble in the Canadian real estate mar-
ket, and the possible effects of rising mortgage rates and potential house-price collapse. Since
many more Canadians participate in the housing market than the stock market, the notion of
a house-price collapse understandably raises concern about its impact on the macroeconomy.
Tkacz and Wilkins (2006), for example, find a link between house-price movements and out-
put growth in Canada. Selody and Wilkins (2004) suggest that a central bank may occasionally
want to lean against large changes in house prices. Moreover, these concerns are shared by
many other developed countries. Nickell (2002), for instance, states that a key monetary policy
concern in the United Kingdom is the increase in house prices and the buildup of household
debt. The OECD, acknowledging the important role of housing wealth, has also recently stud-
ied the role of fundamentals in determining house-price movements in its member countries
(OECD (2005)). Ahearne et al. (2005), citing recent debates in industrialized countries on
how central banks should react to house prices, conduct a cross-country comparison and draw
lessons for monetary policy.
Notwithstanding the attention to housing paid by economists, there has been surprisingly
little recent work on Canadian house prices using modern time-series methods. The excep-
tions are Maclean (1994), who examines movements in new house prices using an error-
correction model, and Sutton (2002), who examines changes in Canadian house prices using
a vector-autoregression (VAR) approach. Lampert and Pomeroy (1998) present an overview
of Canada’s housing system and its economic components, and provide an excellent reference
for Canadian real-estate-related data sources. The principal regressand for these studies and
many other studies has been the aggregate price for existing houses. In addition to the authors
mentioned above, England and Ioannides (1997) study aggregate house-price movements in
OECD countries and conclude that lagged prices and GDP growth are important explanatory
variables. Tsatsaronis and Zhu (2002) examine potential long- and short-term determinants of
house prices in developed countries, including Canada, and conclude that inflation and interest
rates are key determinants in explaining changes in aggregate house prices, although there are
some differences across countries. Furthermore, the aggregate house-price index is often used
1
by monetary authorities as well as government agencies (for example, the Canadian Mort-
gage and Housing Corporation) to measure the effect of interest rate changes on consumers’
portfolio decisions.
In our view, the usefulness of the aggregate housing-price index for understanding house-
price fluctuations is not straightforward. To state the obvious, house prices are unlikely to
experience the arbitrage of tradable divisible commodities, and so it is unlikely that the law
of one price holds. Even casual inspection of various municipal markets suggests that fac-
tors operating on a municipal level are perhaps more relevant to understanding house-price
movements. Abraham and Hendershott (1994), using U.S. data, find that local variables such
as construction costs, employment growth, and income growth are significant in predicting
house prices across metropolitan housing markets. Consideration of local market segmen-
tation can also improve our understanding of the transmission of aggregate shocks, such as
an unanticipated change in the interest rate. Fratantoni and Schuh (2003), for instance, con-
struct a VAR model that takes into account regional differences in housing markets, and they
find that regional heterogeneity is important when tracing out the effects of a monetary policy
shock.
Another potential concern in aggregating to a single index is that important individual city
components may be lost or hopelessly confounded. Using a VAR approach, Sutton (2002) pre-
dicts that aggregate house prices in Canada should have increased substantially over the period
1995 to 2002 owing principally to strong growth and relatively low mortgage rates. This was
not the case and thus this is a puzzle. The rather flat aggregate Canadian house-price pro-
file masks substantial variation at the provincial and municipal levels. Although households
across the country might face the same borrowing costs through common mortgage rates, and
are linked somewhat by a common level of economic activity, there seem to be enough idio-
syncratic conditions operating to suggest that movements in housing prices may be largely
determined locally within a municipal environment.
In this paper, we examine city housing prices following what are now standard methods
for handling non-stationary time-series data. The aim of this paper is to use these methods to
examine relationships in housing prices. The analysis is empirical, with no specific theoretical
model of housing prices advanced. At this stage, we believe it is of sufficient importance to
provide a factual background from which theoretical models can be developed and tested. As
2
such, we document results for a variety of empirical models, interacting house prices with
mortgage rates, macroeconomic variables, and municipal variables.1
The paper is organized as follows. In sections 2 we present a systems approach to cointe-
gration following the methodology of Johansen (1988). This leads to a detailed examination
of the individual municipalities in section 3. In section 4 we offer some concluding remarks
and discuss extensions. Data descriptions are provided in the appendix.
2 A Single Canadian Housing Market?
In this section, we use quarterly house-price data provided by the Multiple Listing Service
(MLS) over the 1981Q1 to 2005Q1 sample period to examine whether city house prices are
linked in the long run. MLS collects data related to the average price of existing houses
sold in major municipalities in Canada.2 The MLS aggregate price index is defined as the
average price of existing houses sold in the 25 largest municipalities. We use the existing-
house price instead of the new-house price, since the former represents a larger proportion
of the housing market in Canada. In Figures 1 and 2 (see the appendix for data sources) we
graph house prices for eight Canadian cities: St. John’s, Halifax, Montreal, Ottawa, Toronto,
Calgary, Edmonton, and Vancouver. These include the largest urban centers in Canada while
geographically spanning the whole of the country. Table 1 presents nominal house prices for
these eight cities. From these preliminary statistics, it is apparent that house prices in major
Canadian cities have increased substantially over the past twenty years, with some very large
increases in Toronto and Vancouver over the past decade, and that there is a great deal of
intercity variability in house prices.
We test for time-series properties of each series by conducting augmented Dickey and
Fuller (1979) (hereafter, ADF) and Phillips and Perron (1988) (hereafter, PP) tests. In all in-
stances, we cannot reject the null hypothesis of a unit root. This result motivates the use of
cointegration methods for our analysis.3 More specifically, we apply the system cointegra-
tion approach developed in Johansen (1988), and refined in Johansen and Juselius (1990) and
1Indeed, we conduct extensive testing of our models. For the sake of brevity, we do not report these results inthe paper; instead, they are available at Allan Gregory’s website (www.econ.queensu.ca/pub/faculty/gregory).
2An alternative housing price measure is the Royal LePage series. We use MLS data because of its publicavailability over a substantially longer time period, and it is highly correlated with the Royal LePage series.
3The results are available on the paper’s website at www.econ.queensu.ca/pub/faculty/gregory.
3
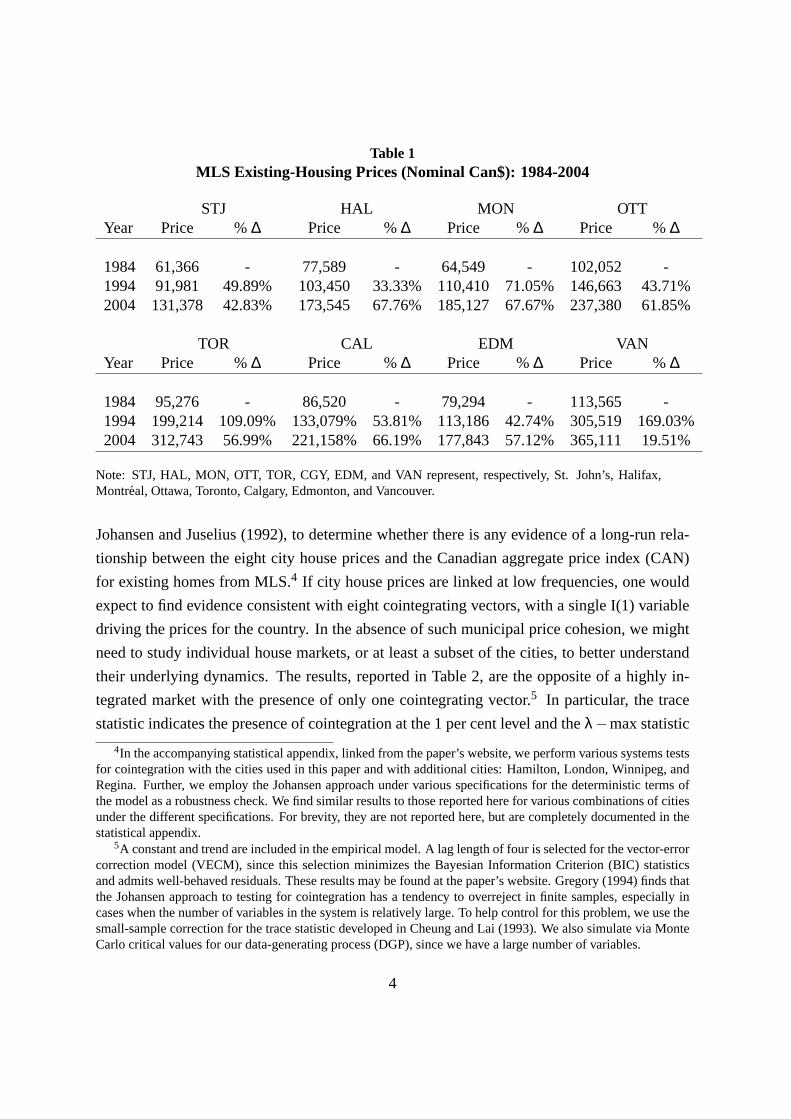
Table 1MLS Existing-Housing Prices (Nominal Can$): 1984-2004
STJ HAL MON OTTYear Price %∆ Price %∆ Price %∆ Price %∆
1984 61,366 - 77,589 - 64,549 - 102,052 -1994 91,981 49.89% 103,450 33.33% 110,410 71.05% 146,663 43.71%2004 131,378 42.83% 173,545 67.76% 185,127 67.67% 237,380 61.85%
TOR CAL EDM VANYear Price %∆ Price %∆ Price %∆ Price %∆
1984 95,276 - 86,520 - 79,294 - 113,565 -1994 199,214 109.09% 133,079% 53.81% 113,186 42.74% 305,519 169.03%2004 312,743 56.99% 221,158% 66.19% 177,843 57.12% 365,111 19.51%
Note: STJ, HAL, MON, OTT, TOR, CGY, EDM, and VAN represent, respectively, St. John’s, Halifax,Montreal, Ottawa, Toronto, Calgary, Edmonton, and Vancouver.
Johansen and Juselius (1992), to determine whether there is any evidence of a long-run rela-
tionship between the eight city house prices and the Canadian aggregate price index (CAN)
for existing homes from MLS.4 If city house prices are linked at low frequencies, one would
expect to find evidence consistent with eight cointegrating vectors, with a single I(1) variable
driving the prices for the country. In the absence of such municipal price cohesion, we might
need to study individual house markets, or at least a subset of the cities, to better understand
their underlying dynamics. The results, reported in Table 2, are the opposite of a highly in-
tegrated market with the presence of only one cointegrating vector.5 In particular, the trace
statistic indicates the presence of cointegration at the 1 per cent level and theλ−maxstatistic
4In the accompanying statistical appendix, linked from the paper’s website, we perform various systems testsfor cointegration with the cities used in this paper and with additional cities: Hamilton, London, Winnipeg, andRegina. Further, we employ the Johansen approach under various specifications for the deterministic terms ofthe model as a robustness check. We find similar results to those reported here for various combinations of citiesunder the different specifications. For brevity, they are not reported here, but are completely documented in thestatistical appendix.
5A constant and trend are included in the empirical model. A lag length of four is selected for the vector-errorcorrection model (VECM), since this selection minimizes the Bayesian Information Criterion (BIC) statisticsand admits well-behaved residuals. These results may be found at the paper’s website. Gregory (1994) finds thatthe Johansen approach to testing for cointegration has a tendency to overreject in finite samples, especially incases when the number of variables in the system is relatively large. To help control for this problem, we use thesmall-sample correction for the trace statistic developed in Cheung and Lai (1993). We also simulate via MonteCarlo critical values for our data-generating process (DGP), since we have a large number of variables.
4
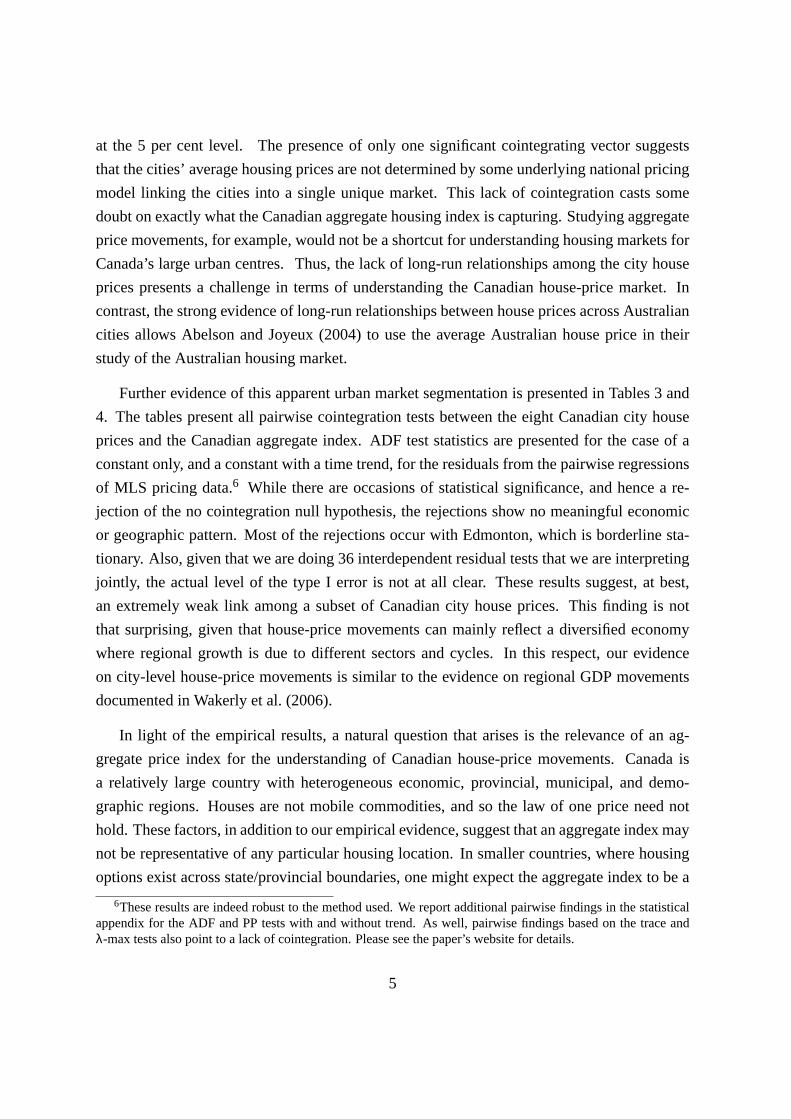
at the 5 per cent level. The presence of only one significant cointegrating vector suggests
that the cities’ average housing prices are not determined by some underlying national pricing
model linking the cities into a single unique market. This lack of cointegration casts some
doubt on exactly what the Canadian aggregate housing index is capturing. Studying aggregate
price movements, for example, would not be a shortcut for understanding housing markets for
Canada’s large urban centres. Thus, the lack of long-run relationships among the city house
prices presents a challenge in terms of understanding the Canadian house-price market. In
contrast, the strong evidence of long-run relationships between house prices across Australian
cities allows Abelson and Joyeux (2004) to use the average Australian house price in their
study of the Australian housing market.
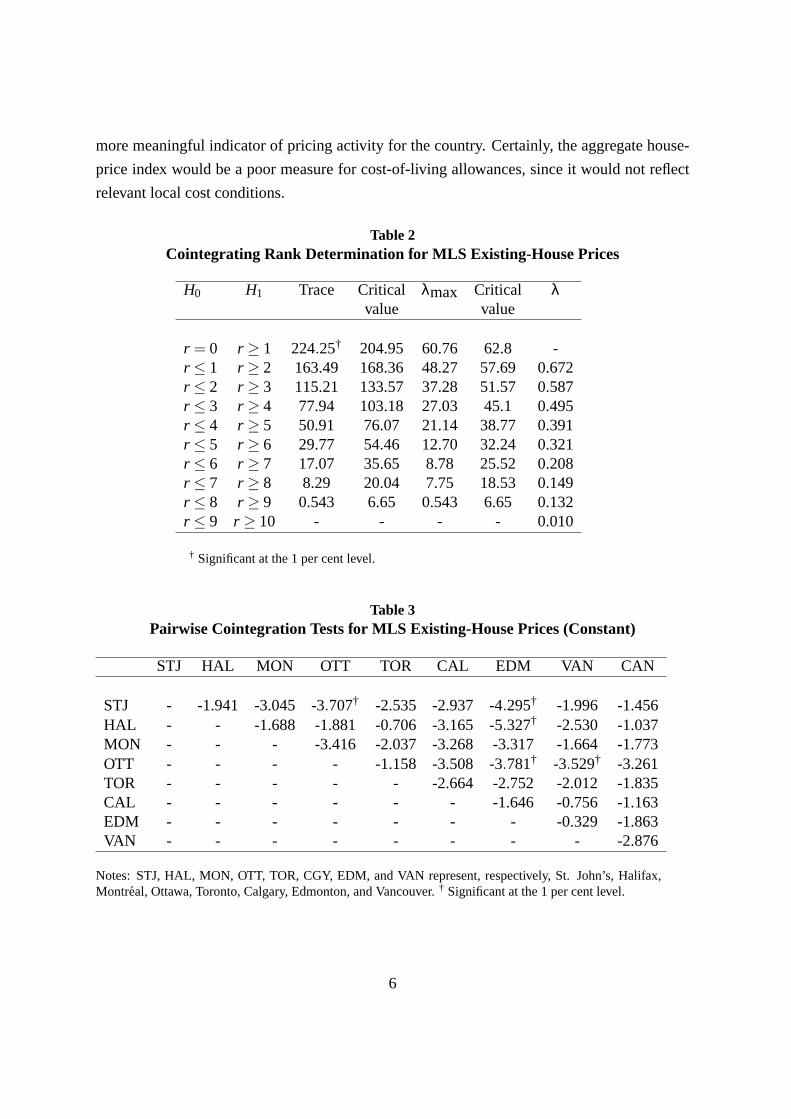
Further evidence of this apparent urban market segmentation is presented in Tables 3 and
4. The tables present all pairwise cointegration tests between the eight Canadian city house
prices and the Canadian aggregate index. ADF test statistics are presented for the case of a
constant only, and a constant with a time trend, for the residuals from the pairwise regressions
of MLS pricing data.6 While there are occasions of statistical significance, and hence a re-
jection of the no cointegration null hypothesis, the rejections show no meaningful economic
or geographic pattern. Most of the rejections occur with Edmonton, which is borderline sta-
tionary. Also, given that we are doing 36 interdependent residual tests that we are interpreting
jointly, the actual level of the type I error is not at all clear. These results suggest, at best,
an extremely weak link among a subset of Canadian city house prices. This finding is not
that surprising, given that house-price movements can mainly reflect a diversified economy
where regional growth is due to different sectors and cycles. In this respect, our evidence
on city-level house-price movements is similar to the evidence on regional GDP movements
documented in Wakerly et al. (2006).
In light of the empirical results, a natural question that arises is the relevance of an ag-
gregate price index for the understanding of Canadian house-price movements. Canada is
a relatively large country with heterogeneous economic, provincial, municipal, and demo-
graphic regions. Houses are not mobile commodities, and so the law of one price need not
hold. These factors, in addition to our empirical evidence, suggest that an aggregate index may
not be representative of any particular housing location. In smaller countries, where housing
options exist across state/provincial boundaries, one might expect the aggregate index to be a
6These results are indeed robust to the method used. We report additional pairwise findings in the statisticalappendix for the ADF and PP tests with and without trend. As well, pairwise findings based on the trace andλ-max tests also point to a lack of cointegration. Please see the paper’s website for details.
5
more meaningful indicator of pricing activity for the country. Certainly, the aggregate house-
price index would be a poor measure for cost-of-living allowances, since it would not reflect
relevant local cost conditions.
Table 2Cointegrating Rank Determination for MLS Existing-House Prices
H0 H1 Trace Critical λmax Critical λvalue value
r = 0 r ≥ 1 224.25† 204.95 60.76 62.8 -r ≤ 1 r ≥ 2 163.49 168.36 48.27 57.69 0.672r ≤ 2 r ≥ 3 115.21 133.57 37.28 51.57 0.587r ≤ 3 r ≥ 4 77.94 103.18 27.03 45.1 0.495r ≤ 4 r ≥ 5 50.91 76.07 21.14 38.77 0.391r ≤ 5 r ≥ 6 29.77 54.46 12.70 32.24 0.321r ≤ 6 r ≥ 7 17.07 35.65 8.78 25.52 0.208r ≤ 7 r ≥ 8 8.29 20.04 7.75 18.53 0.149r ≤ 8 r ≥ 9 0.543 6.65 0.543 6.65 0.132r ≤ 9 r ≥ 10 - - - - 0.010
† Significant at the 1 per cent level.
Table 3Pairwise Cointegration Tests for MLS Existing-House Prices (Constant)
STJ HAL MON OTT TOR CAL EDM VAN CAN
STJ - -1.941 -3.045 -3.707† -2.535 -2.937 -4.295† -1.996 -1.456HAL - - -1.688 -1.881 -0.706 -3.165 -5.327† -2.530 -1.037MON - - - -3.416 -2.037 -3.268 -3.317 -1.664 -1.773OTT - - - - -1.158 -3.508 -3.781† -3.529† -3.261TOR - - - - - -2.664 -2.752 -2.012 -1.835CAL - - - - - - -1.646 -0.756 -1.163EDM - - - - - - - -0.329 -1.863VAN - - - - - - - - -2.876
Notes: STJ, HAL, MON, OTT, TOR, CGY, EDM, and VAN represent, respectively, St. John’s, Halifax,Montreal, Ottawa, Toronto, Calgary, Edmonton, and Vancouver.† Significant at the 1 per cent level.
6
Table 4Pairwise Cointegration Tests for MLS Existing-House Prices (Trend and Constant)
STJ HAL MON OTT TOR CAL EDM VAN CAN
STJ - -1.960 -3.355 -4.335† -2.855 -2.802 -4.115† -1.962 -1.573HAL - - -1.703 -2.556 -0.968 -3.179 -5.420† -2.406 -1.165MON - - - -3.648 -2.100 -3.368 -3.231 -1.617 -1.745OTT - - - - -1.214 -3.195 -3.146 -3.358 -3.252TOR - - - - - -2.276 -2.528 -1.989 -2.071CAL - - - - - - -0.438 -3.202 -2.292EDM - - - - - - - -0.558 -2.623VAN - - - - - - - - -3.150
Notes: STJ, HAL, MON, OTT, TOR, CGY, EDM, and VAN represent, respectively, St. John’s, Halifax,Montreal, Ottawa, Toronto, Calgary, Edmonton, and Vancouver.† Significant at the 1 per cent level.
3 City-Level Housing-Price Determinants
The lack of long-run relationships for the cross-city house prices prompts us to seek city-
specific house-price determinants using single-equation methods in an effort to better under-
stand Canadian house-price fluctuations.7 Specifically, we first use the Engle and Granger
framework to test for the presence of cointegration between city house prices and a vector
of other potentially relevant variables. Once we find evidence consistent with cointegration,
we estimate elasticities via Phillips and Hansen’s (1990) fully modified ordinary least squares
(FM-OLS) for valid inference.
Like many other areas in economics, the literature on housing prices has yet to find a domi-
nant empirical model. A variety of models have been proposed, each based on variables which
the authors view as important in the market (Smith (1988)). Finding high-quality, comparable
Canadian data at the municipal level is problematic. Bearing this limitation in mind, we opt
to use a city-specific new-housing price index (NPI), union-wage index (UWI), the value of
building permits (BP), and the municipal labour force (LF) as possible explanatory variables.
These variables are readily available and consistently defined across the eight Canadian cities.
Also included are the cost of financing, proxied by the five-year mortgage rate (Rt), and a
measure of economic activity, per capita provincial gross domestic product, which we denote
7Since there is a natural normalization for the dependent variable (city housing prices), we use a single-equation approach for this part of our study.
7
GDP.8 The NPI is collected by Statistics Canada on a monthly basis and is an index of new-
house prices based on a survey of builders. The UWI is an index of wages set in 16 trades
engaged in construction in 20 metropolitan areas. The value of building permits issued, BP, is
collected monthly by Statistics Canada and is used as a leading indicator of building activity.
The building permit measure is the only one that displays strong seasonality, and thus we sea-
sonally adjust it using dummy variables in a simple application of the Frisch-Waugh-Lovell
theorem (Lovell (1963)). The idea of this set-up is to find out whether there is any role played
by the common mortgage rate, once we control for local conditions through these city-specific
variables.
We use the five-year mortgage rate as our proxy for the cost of home financing, since it is
highly correlated with other maturities and over 50 per cent of Canadian households use this
term. The one-, three-, and five-year interest rates are plotted in Figure 3. All three follow the
same downward path throughout the sample. All data, except the interest rate, are in log-form,
so that the estimates on each of the independent variables can be interpreted as elasticities. As
in section 2, we test the time-series properties of the data using the ADF and PP tests. We find
that each series may be described as non-stationary, except building permits in St. John’s and
Halifax, and the union wage in Halifax.9
Each of the variables in the regression analysis seems economically reasonable for explain-
ing existing-house price movements in the eight Canadian cities we examine. City-specific
new-house prices are included to determine the extent to which new and existing houses are
substitutes in the long run. We include the UWI to capture the labour costs of building a new
house or improving an existing one. An increase in union wages, which includes wages to
construction workers, should lead to a rise in the price of existing homes through either an
increase in the price of new houses built (via a substitution effect) or, more directly, via the
cost of home improvements of existing houses or both. We include building permits to capture
costs associated with construction. Poterba and Engelhardt (1991) also consider construction
costs when examining the determination of house prices in an efficient asset market. Argu-
ments in the popular press have at least informally suggested that labour entry/exit has an
impact on house prices. An increase in a city’s labour force puts added pressure on demand
for housing and therefore leads to house-price increases. The price increase may be some-
what mitigated by the fact that an increased labour force tends to bid down wages and thereby
8In preliminary work, we also considered ownership accommodation cost and rental accommodation cost inour regressions, but they did not improve our understanding of city-specific house-price fluctuations.
9The results are available on the paper’s website.
8
puts downward pressure on house prices. However, to the extent that the union wages are
sticky downward, this offsetting effect should be small. Case and Shiller (1989) and Case and
Shiller (1990) find that changes in local demographics can significantly explain house prices.
As mentioned, we include the five-year mortgage rate to capture the interest cost of owning a
home with a mortgage, and a per capita provincial GDP measure to proxy economic activity.
We would prefer a measure of per capita municipal GDP, but such a variable does not exist for
the span of data in this paper.
To determine whether the variables under consideration are cointegrated, we obtain the
residuals from the following linear regression (for each cityi):
MLSit = βi
0 ++βi1NPIit +βi
2UWIit +βi3BPi
t +βi4LF i
t +βi5Rt +βi
6GDPit +ui
t , (1)
and test whether the estimated residuals,ui , are I(1) or, in other words, whether there is coin-
tegration between the variables in equation (1). The cointegration test results are presented in
Table 5 and indicate the presence of cointegration for all individual city house prices. This
allows us to use the FM-OLS estimator to estimate the long-run correlation of each regressor
with each city house price.10 FM-OLS also permits us to conduct valid inference within a
cointegrating framework, even in the presence of endogeneity and non-spherical residuals.
The estimation results are presented in Table 6. The results are somewhat mixed, but
there are consistent correlations across the cities. There is a statistically significant positive
relationship between the average price of existing homes and new-housing prices in Canada.
Interestingly, in most cities the estimated coefficient on new-house prices is not significantly
different from one suggesting that new and old houses are perfect substitutes. However, for
Montreal and Vancouver, existing houses are valued approximately 25 per cent higher than
new houses, whereas in Edmonton existing houses trade at a 40 per cent discount. Of course,
there is no control for the quality of the houses. The UWI also has a statistically significant
positive effect on housing prices, with an elasticity ranging from 0.2 in Toronto to 1.01 in
Edmonton. The exceptions are Halifax, Montreal, and Ottawa, where the estimate parameters
are not statistically different from zero. With the exception of Vancouver, building permits
appear to be positively related to house prices. The parameter estimates range over a tight
interval of 0.03 to 0.09, suggesting, relative to NPI and UWI, only a small economic effect. In
10The Saikkonen (1991) and Stock and Watson (1993) dynamic OLS estimator gives similar qualitative results.These estimates can be obtained from the paper’s webpage.
9
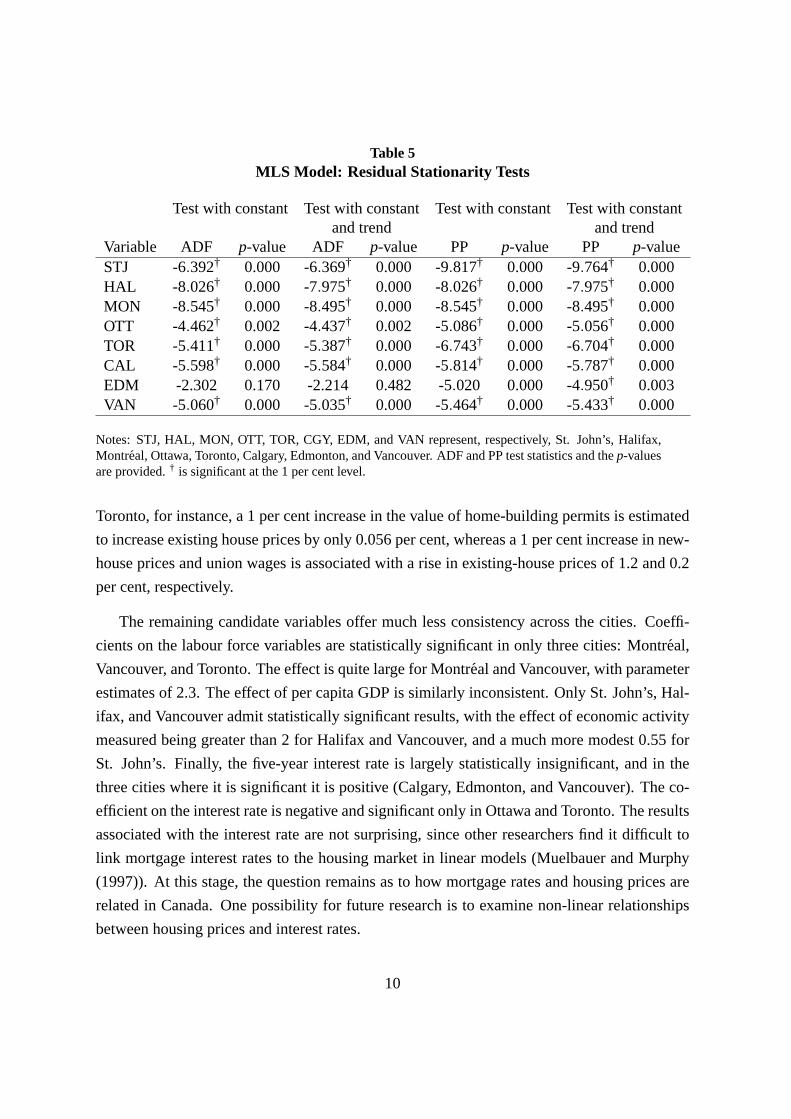
Table 5MLS Model: Residual Stationarity Tests
Test with constant Test with constant Test with constant Test with constantand trend and trend
Variable ADF p-value ADF p-value PP p-value PP p-valueSTJ -6.392† 0.000 -6.369† 0.000 -9.817† 0.000 -9.764† 0.000HAL -8.026† 0.000 -7.975† 0.000 -8.026† 0.000 -7.975† 0.000MON -8.545† 0.000 -8.495† 0.000 -8.545† 0.000 -8.495† 0.000OTT -4.462† 0.002 -4.437† 0.002 -5.086† 0.000 -5.056† 0.000TOR -5.411† 0.000 -5.387† 0.000 -6.743† 0.000 -6.704† 0.000CAL -5.598† 0.000 -5.584† 0.000 -5.814† 0.000 -5.787† 0.000EDM -2.302 0.170 -2.214 0.482 -5.020 0.000 -4.950† 0.003VAN -5.060† 0.000 -5.035† 0.000 -5.464† 0.000 -5.433† 0.000
Notes: STJ, HAL, MON, OTT, TOR, CGY, EDM, and VAN represent, respectively, St. John’s, Halifax,Montreal, Ottawa, Toronto, Calgary, Edmonton, and Vancouver. ADF and PP test statistics and thep-valuesare provided.† is significant at the 1 per cent level.
Toronto, for instance, a 1 per cent increase in the value of home-building permits is estimated
to increase existing house prices by only 0.056 per cent, whereas a 1 per cent increase in new-
house prices and union wages is associated with a rise in existing-house prices of 1.2 and 0.2
per cent, respectively.
The remaining candidate variables offer much less consistency across the cities. Coeffi-
cients on the labour force variables are statistically significant in only three cities: Montreal,
Vancouver, and Toronto. The effect is quite large for Montreal and Vancouver, with parameter
estimates of 2.3. The effect of per capita GDP is similarly inconsistent. Only St. John’s, Hal-
ifax, and Vancouver admit statistically significant results, with the effect of economic activity
measured being greater than 2 for Halifax and Vancouver, and a much more modest 0.55 for
St. John’s. Finally, the five-year interest rate is largely statistically insignificant, and in the
three cities where it is significant it is positive (Calgary, Edmonton, and Vancouver). The co-
efficient on the interest rate is negative and significant only in Ottawa and Toronto. The results
associated with the interest rate are not surprising, since other researchers find it difficult to
link mortgage interest rates to the housing market in linear models (Muelbauer and Murphy
(1997)). At this stage, the question remains as to how mortgage rates and housing prices are
related in Canada. One possibility for future research is to examine non-linear relationships
between housing prices and interest rates.
10
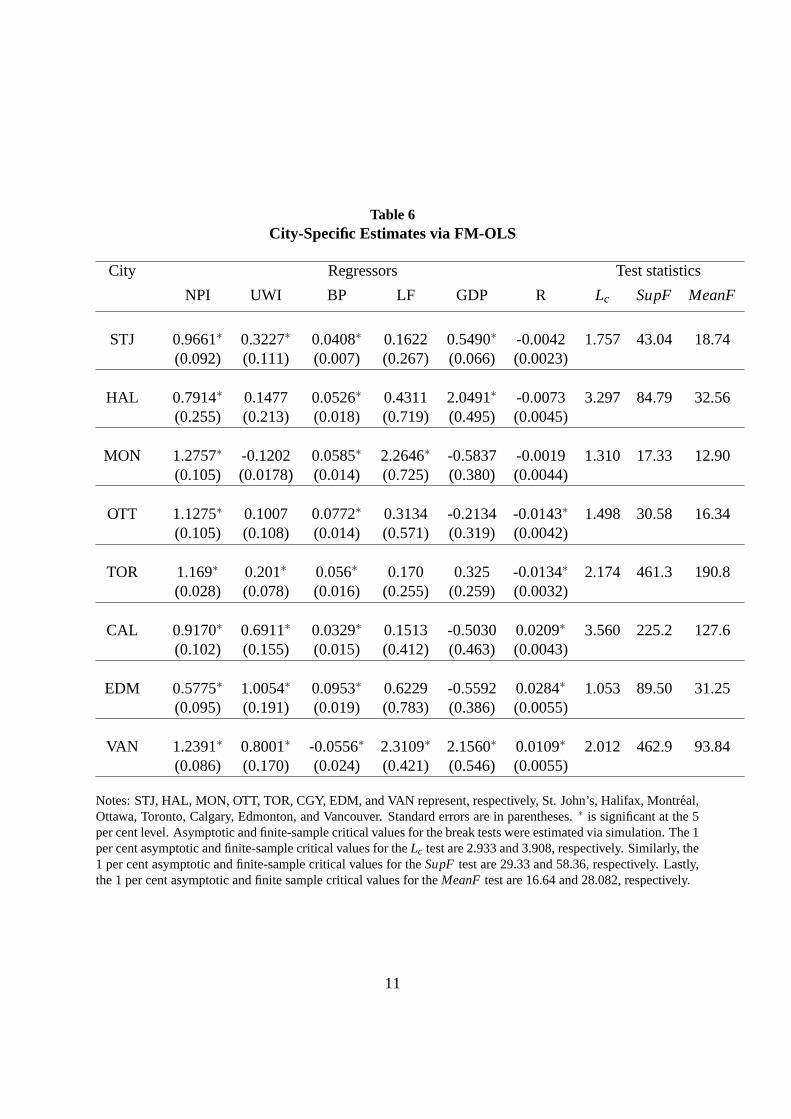
Table 6City-Specific Estimates via FM-OLS
City Regressors Test statistics
NPI UWI BP LF GDP R Lc SupF MeanF
STJ 0.9661∗ 0.3227∗ 0.0408∗ 0.1622 0.5490∗ -0.0042 1.757 43.04 18.74(0.092) (0.111) (0.007) (0.267) (0.066) (0.0023)
HAL 0.7914∗ 0.1477 0.0526∗ 0.4311 2.0491∗ -0.0073 3.297 84.79 32.56(0.255) (0.213) (0.018) (0.719) (0.495) (0.0045)
MON 1.2757∗ -0.1202 0.0585∗ 2.2646∗ -0.5837 -0.0019 1.310 17.33 12.90(0.105) (0.0178) (0.014) (0.725) (0.380) (0.0044)
OTT 1.1275∗ 0.1007 0.0772∗ 0.3134 -0.2134 -0.0143∗ 1.498 30.58 16.34(0.105) (0.108) (0.014) (0.571) (0.319) (0.0042)
TOR 1.169∗ 0.201∗ 0.056∗ 0.170 0.325 -0.0134∗ 2.174 461.3 190.8(0.028) (0.078) (0.016) (0.255) (0.259) (0.0032)
CAL 0.9170∗ 0.6911∗ 0.0329∗ 0.1513 -0.5030 0.0209∗ 3.560 225.2 127.6(0.102) (0.155) (0.015) (0.412) (0.463) (0.0043)
EDM 0.5775∗ 1.0054∗ 0.0953∗ 0.6229 -0.5592 0.0284∗ 1.053 89.50 31.25(0.095) (0.191) (0.019) (0.783) (0.386) (0.0055)
VAN 1.2391∗ 0.8001∗ -0.0556∗ 2.3109∗ 2.1560∗ 0.0109∗ 2.012 462.9 93.84(0.086) (0.170) (0.024) (0.421) (0.546) (0.0055)
Notes: STJ, HAL, MON, OTT, TOR, CGY, EDM, and VAN represent, respectively, St. John’s, Halifax, Montreal,Ottawa, Toronto, Calgary, Edmonton, and Vancouver. Standard errors are in parentheses.∗ is significant at the 5per cent level. Asymptotic and finite-sample critical values for the break tests were estimated via simulation. The 1per cent asymptotic and finite-sample critical values for theLc test are 2.933 and 3.908, respectively. Similarly, the1 per cent asymptotic and finite-sample critical values for theSupFtest are 29.33 and 58.36, respectively. Lastly,the 1 per cent asymptotic and finite sample critical values for theMeanF test are 16.64 and 28.082, respectively.
11
As a final experiment, we test the stability of our city-level cointegration relationships us-
ing a series of tests proposed by Hansen (1992): theLc, MeanF, andSupFtests. All three tests
are developed under the assumption of cointegration, and they have the same null hypothesis
of parameter stability but differ in their implicit alternative hypotheses. Specifically, theSupF
test is useful in testing whether there is a sharp shift in a regime, while theLc andMeanFtests
are useful for determining whether the specified model captures a stable relationship. The
results, reported on the right-hand side of Table 6, are again mixed. As pointed out by Hansen
(1992), the tests can be conflicting because they have power against different alternative hy-
potheses. The three tests suggest that the parameter estimates corresponding to St. John’s,
Montreal, and Ottawa are stable over the sample period, whereas theSupFandMeanF tests
find evidence of unstable relationships for Halifax, Toronto, Calgary, and Vancouver. Overall,
these results suggest that we should interpret our results with some caution, since they may be
unstable. Indeed, one might have been surprised if the long-run relationships had been con-
stant. We note that Hansen (1992) argues that theLc test results may be viewed as a test for
cointegration, against the alternative of no cointegration. Thus, ourLc test results corroborate
the previous conclusion of cointegration among the variables under study.
4 Conclusion
In this paper, we have presented a detailed empirical investigation of Canadian house
prices. We study long-run relationships between city house prices in Canada over the 1981
to 2005 sample period. We also examine idiosyncratic relations between city prices and city-
specific variables. The results indicate that city house prices are only weakly related in the
long run, and that there are only a few city-specific variables that are consistently related to
city house prices. These include new-house prices, union wages, and issuance of building
permits.
Our conclusions, resulting from the lack of cointegration among city house prices, are
similar, at least in spirit, to those reported in Wakerly et al. (2006). In particular, Wakerly et al.
(2006) find that Canadian regional output fluctuations are driven by an economically important
set of disaggregated propagation and growth mechanisms, and that studying regional output
movements may improve our understanding of Canadian business cycles. Studying aggregate
housing-price indexes alone will not lead to a deeper understanding of the Canadian housing
market. We think a better course for future research is to take into account local factors such
12

as land availability, expected future economic activity, and institutions. Such analysis is likely
to produce housing models based on city fundamentals that can be applied across a variety of
urban centers.
13
References
Abelson, P. and R. Joyeux. 2004. “House Prices in Australia: 1970 to 2003 Facts and Expla-
nations.” Manuscript.
Abraham, J. and P. Hendershott. 1994. “Bubbles in Metropolitan Housing Markets.” NBER
Working Paper No. 4774.
Ahearne, A., J. Ammer, B. Doyle, L. Kole, and R. Martin. 2005. “House Prices and Monetary
Policy: A Cross-Country Study.” International Finance Discussion Papers No. 841.
Case, K. and R. Shiller. 1989. “The Efficiency of the Market for Single Family Homes.”
American Economic Review79: 125–37.
———. 1990. “Forecasting Prices and Excess Returns in the Housing Market.”AREUEA
Journal18: 253–73.
Cheung, Y. and K. Lai. 1993. “Finite-Sample Sizes of Johansen’s Likelihood Ratio Tests for
Cointegration.”Oxford Bulletin of Economics and Statistics55: 313–29.
Dickey, D. and W. Fuller. 1979. “Distribution of the Estimators for Autoregressive Time Series
with a Unit Root.” Journal of the American Statistical Association74: 427–31.
England, P. and Y. Ioannides. 1997. “House Price Dynamics: An International Empirical
Perspective.”Journal of Housing Research6: 119–36.
Fratantoni, M. and S. Schuh. 2003. “Monetary Policy, Housing, and Heterogeneous Regional
Markets.” Journal of Money, Credit, and Banking35: 557–89.
Gregory, A. 1994. “Testing for Cointegration in Linear Quadratic Models.”Journal of Busi-
ness and Economic Statistics12: 347–60.
Hansen, B. 1992. “Testing for Parameter Instability in Linear Models.”Journal of Policy
Modeling14: 517–33.
Johansen, S. 1988. “Statistical Analysis of Cointegrating Vectors.”Journal of Econometric
Dynamics and Control12: 231–54.
Johansen, S. and K. Juselius. 1990. “Maximum Likelihood Estimation and Inference on Coin-
tegration – with Applications to the Demand for Money.”Oxford Bulletin of Economics and
Statistics52: 169–210.
14
———. 1992. “Testing Structural Hypotheses in a Multivariate Cointegration Analysis of the
PPP and the UIP for UK.”Journal of Econometrics53: 211–44.
Lampert, G. and S. Pomeroy. 1998. “Canada’s Housing System: The Public Policy Environ-
ment for Housing in Canada.” Manuscript.
Lovell, M. 1963. “Seasonal Adjustment of Economic Time Series.”Journal of the American
Statistical Association58: 993–1010.
Maclean, D. 1994.The Role of House Prices in Regional Inflation Disparities. Technical
Report No. 67, Ottawa: Bank of Canada.
Muelbauer, J. and A. Murphy. 1997. “Booms and Busts in the UK Housing Market.”Economic
Journal107: 1701–27.
Nickell, S. 2002. “House Prices, Household Debt and Monetary Policy.” Bank of England
Monetary Policy Committee. Speech to the Glasgow Agency, Glasgow, Scotland, 11 De-
cember.
OECD. 2005. “Recent House Price Developments: The Role of Fundamentals.”OECD
Economic Outlook.
Phillips, P. and P. Perron. 1988. “Testing for a Unit Root in Time Series Regression.”Bio-
metrika75: 335–46.
Poterba, J. and G. Engelhardt. 1991. “Demographics and House Prices: The Canadian Evi-
dence.”Regional Science and Urban Economics21: 539–46.
Saikkonen, P. 1991. “Asymptotically Efficient Estimation of Cointegration Regressions.”
Econometric Theory7: 1–21.
Selody, J. and C. Wilkins. 2004. “Asset Prices and Monetary Policy: A Canadian Perspective
on the Issues.”Bank of Canada Review(Autumn): 3-14.
Smith, L. 1988. “An Economic Assessment of Rent Controls: The Ontario Experience.”
Journal of Real Estate Finance and Economics1: 217–31.
Stock, J. and M. Watson. 1993. “A Simple Estimator of Cointegrating Vectors in Higher Order
Cointegrated Systems.”Econometrica61: 783–820.
15
Sutton, G. 2002. “Explaining Changes in House Prices.”BIS Quarterly Review(September):
45-55.
Tkacz, G. and C. Wilkins. 2006. “Linear and Threshold Forecasts of Output and Inflation with
Stock and Housing Prices.” Bank of Canada Working Paper No. 2006-25.
Tsatsaronis, K. and H. Zhu. 2002. “What Drives Housing Price Dynamics: Cross-Country
Evidence.”BIS Quarterly Review.
Wakerly, E., B. Scott, and J. Nason. 2006. “Common Trends and Common Cycles in Canada:
Who Knew So Much Has Been Going On?”Canadian Journal of Economics39: 320–47.
16
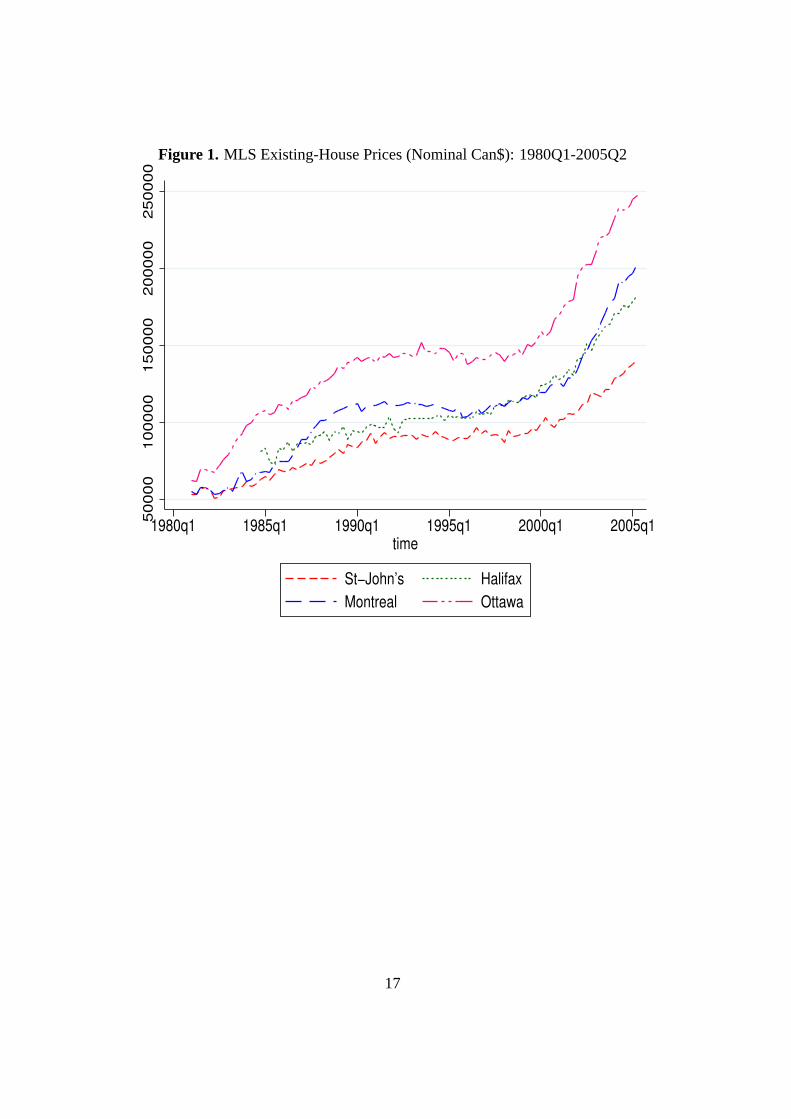
Figure 1. MLS Existing-House Prices (Nominal Can$): 1980Q1-2005Q25
00
00
10
00
00
15
00
00
20
00
00
25
00
00
1980q1 1985q1 1990q1 1995q1 2000q1 2005q1time
St−John’s Halifax
Montreal Ottawa
17
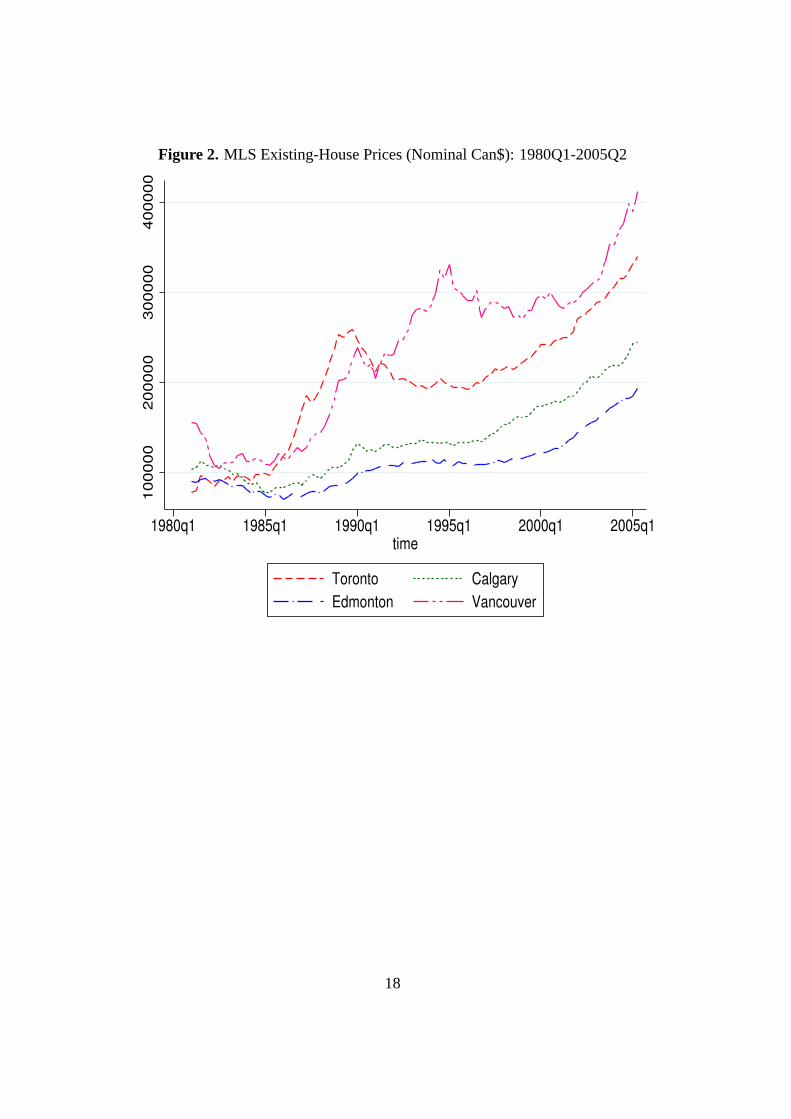
Figure 2. MLS Existing-House Prices (Nominal Can$): 1980Q1-2005Q21
00
00
02
00
00
03
00
00
04
00
00
0
1980q1 1985q1 1990q1 1995q1 2000q1 2005q1time
Toronto Calgary
Edmonton Vancouver
18
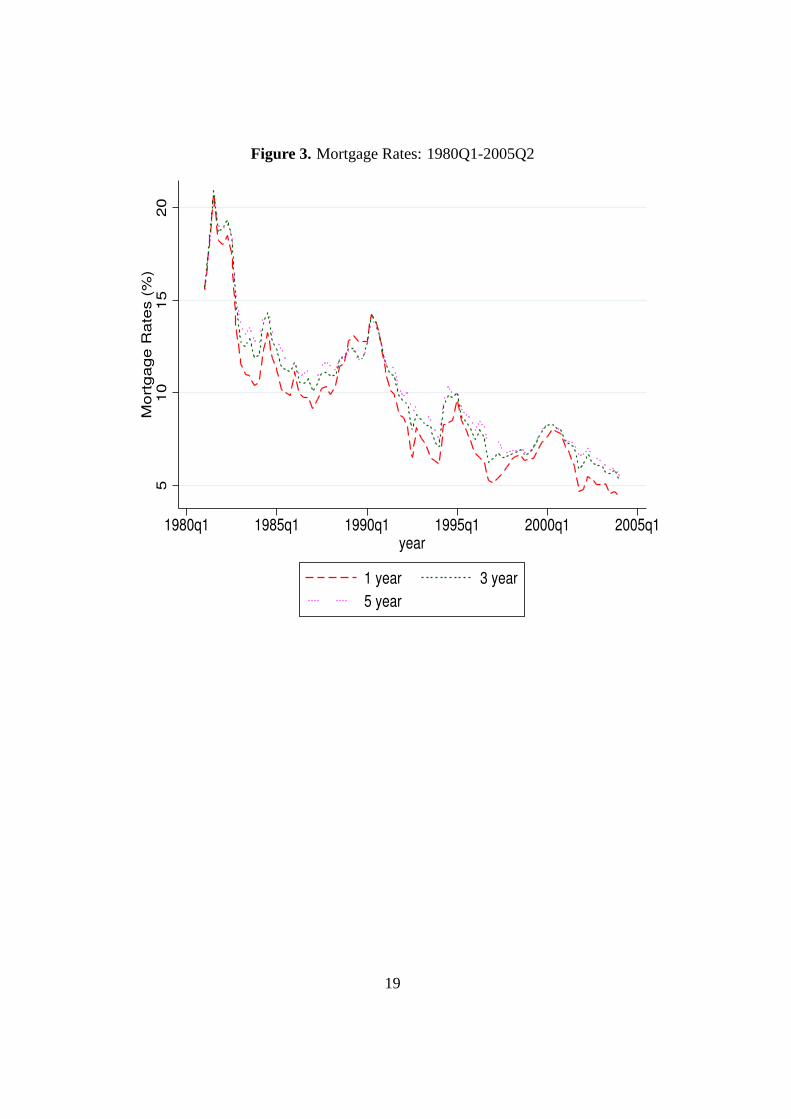
Figure 3. Mortgage Rates: 1980Q1-2005Q25
10
15
20
Mo
rtg
ag
e R
ate
s (
%)
1980q1 1985q1 1990q1 1995q1 2000q1 2005q1year
1 year 3 year
5 year
19

Appendix: Data Descriptions
MLS house-price data are provided by the Multiple Listing Service. In addition, Statistics
Canada has provided an extensive list of data. Statistics Canada also produces a publication
entitledUseful Information for Construction(2002), which provides catalogue numbers for
key statistics collected by the agency that provide a detailed overview of the construction
industry. Data are summarized below.
Existing-House Price Index (source: MLS)
• Multiple Listing Services
• Measured monthly
• Residential average sale price of existing homes
New-House Price Index (source: Statistics Canada)
• CANSIM Table 327-0005
• Measured monthly
• Tracks contractors’ selling price of new residential houses
• Price includes development costs paid by the contractor. They exclude GST and provin-
cial sales taxes.
• Canadian price is the aggregate of 21 urban centre groupings covering 24 metropolitan
areas.
Building Permits (source: Statistics Canada)
• CANSIM Tables 026-0001 to 026-0008, and 026-0010 to 026-0012
• Monthly observations
• Issuance of building permits by municipality
Union-Wage Index (source: Statistics Canada)
• CANSIM Table 327-0003
• Monthly observations
• Union wages (hourly compensation) for the construction industry
20
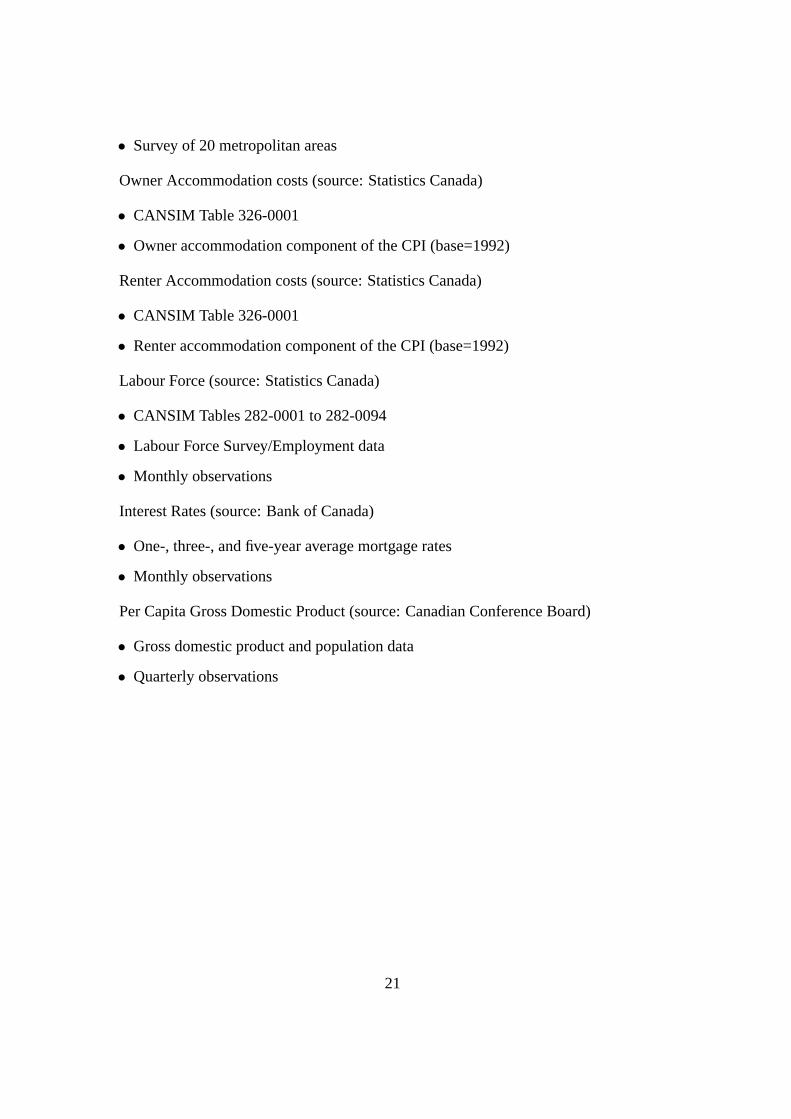
• Survey of 20 metropolitan areas
Owner Accommodation costs (source: Statistics Canada)
• CANSIM Table 326-0001
• Owner accommodation component of the CPI (base=1992)
Renter Accommodation costs (source: Statistics Canada)
• CANSIM Table 326-0001
• Renter accommodation component of the CPI (base=1992)
Labour Force (source: Statistics Canada)
• CANSIM Tables 282-0001 to 282-0094
• Labour Force Survey/Employment data
• Monthly observations
Interest Rates (source: Bank of Canada)
• One-, three-, and five-year average mortgage rates
• Monthly observations
Per Capita Gross Domestic Product (source: Canadian Conference Board)
• Gross domestic product and population data
• Quarterly observations
21
Bank of Canada Working PapersDocuments de travail de la Banque du Canada
Working papers are generally published in the language of the author, with an abstract in both officiallanguages, and are available on the Bank’s website (see bottom of page). Les documents de travail sontgénéralement publiés dans la langue utilisée par les auteurs; ils sont cependant précédés d’un résumé bilingue.On peut les consulter dans le site Web de la Banque du Canada, dont l’adresse est indiquée au bas de la page.
Copies and a complete list of working papers are available from:Pour obtenir des exemplaires et une liste complète des documents de travail, prière de s’adresser à :
Publications Distribution, Bank of Canada Diffusion des publications, Banque du Canada234 Wellington Street, Ottawa, Ontario K1A 0G9 234, rue Wellington, Ottawa (Ontario) K1A 0G9Telephone: 1 877 782-8248 Téléphone : 1 877 782-8248 (sans frais en (toll free in North America) Amérique du Nord)Email: [email protected] Adresse électronique : [email protected]: http://www.bankofcanada.ca Site Web : http://www.banqueducanada.ca
20062006-48 Modelling Term-Structure Dynamics for Risk Management:
A Practitioner’s Perspective D.J. Bolder
2006-47 Stress Testing the Corporate Loans Portfolio ofthe Canadian Banking Sector M. Misina, D. Tessier, and S. Dey
2006-46 Survey-Based Estimates of the Term Structure ofExpected U.S. Inflation S. Kozicki and P.A. Tinsley
2006-45 The Role of Debt and Equity Finance over the Business Cycle F. Covas and W.J. den Haan
2006-44 The Long-Term Effects of Cross-Listing, Investor Recognition,and Ownership Structure on Valuation M.R. King and D. Segal
2006-43 Efficient Hedging and Pricing of Equity-Linked Life InsuranceContracts on Several Risky Assets A. Melnikov and Y. Romanyuk
2006-42 Linking Real Activity and Financial Markets: The Bonds, Equity,and Money (BEAM) Model C. Gauthier and F. Li
2006-41 An Optimized Monetary Policy Rule for ToTEM J.-P. Cayen, A. Corbett, and P. Perrier
2006-40 Education and Self-Employment: Changes in Earnings and Wealth Inequality Y. Terajima
2006-39 Short-Run and Long-Run Causality between Monetary PolicyVariables and Stock Prices J.-M. Dufour and D. Tessier
2006-38 Conditioning Information and Variance Bounds on PricingKernels with Higher-Order Moments: Theory and Evidence F. Chabi-Yo
2006-37 Endogenous Borrowing Constraints and Consumption Volatilityin a Small Open Economy C. de Resende
2006-36 Credit in a Tiered Payments System A. Lai, N. Chande, and S. O’Connor
2006-35 Survey of Price-Setting Behaviour ofCanadian Companies D. Amirault, C. Kwan, and G. Wilkinson
2006-34 The Macroeconomic Effects of Non-Zero Trend Inflation R. Amano, S. Ambler, and N. Rebei
2006-33 Are Canadian Banks Efficient? A Canada–U.S. Comparison J. Allen, W. Engert, and Y. Liu