Embed Size (px)
Citation preview

November 2004
A national survey of Canadians’ use
of alcohol and other drugs
Prevalence of Use and Related Harms
HIGHLIGHTS
Canadian AddictionSurvey (CAS)

Errata: CAS Highlights August 2007 The CAS included a brief six-item screener to measure problematic drug use. The screener, the ASSIST, was developed by the World Health Organization. An error was recently found in one symptom (represented by two items: CNAS5 and ASSIS5) of the ASSIST scale. Properly stated, the question is “Have you ever tried [AND FAILED] to control, cut down or stop using cannabis, marijuana or hashish {or other drugs}. The phrase “and failed” was not asked of respondents. This error, in turn, affects the following derived variables: ASISTCAN, ASISTCN3, ASISTCN2, ASISTIL and ASISTIL3. NOTE: A small study to assess the impact of the missing “and failed” phrase suggested that estimates with the missing phrase underestimate the standard ASSIST item, but total scores and their cutoffs do not differ significantly between the two versions. This error should not affect estimates of subgroup differences (i.e., sex, age and regional differences). Caution and warning should be used in making direct comparisons with other studies using the ASSIST. Page For Should read P.6, column 2, line 22 “The most common concern is failing to control use (4.8%)
followed by …” “The most common concern is attempts to cut down (4.8%) followed by …”
P.8, Figure 4 “Failed control” “Attempts to cut down ”
This document was published by the Canadian Centre on Substance Abuse (CCSA). For additional copies, contact CCSA, 75 Albert St., Suite 300 Ottawa ON K1P 5E7 tel.: 613 235-4048 e-mail: [email protected] This document can also be downloaded as a PDF at www.ccsa.ca Ce document est également disponible en français sous le titre Enquête sur les toxicomanies au Canada (ETC) : Une enquête nationale sur la consommation d’alcool et d’autres drogues par les Canadiens : La prévalence de l’usage et les méfaits : Points saillants ISBN 1-896323-35-9
C A N A D I A N A D D I C T I O N S U R V E Y
Preface
1 P R E V A L E N C E O F U S E A N D R E L AT E D H A R M S H I G H L I G H T S
The Canadian Addiction Survey (CAS) is a collaborative initiative sponsored by
Health Canada, the Canadian Executive Council on Addictions (CECA)—which
includes the Canadian Centre on Substance Abuse (CCSA), the Alberta Alcohol and
Drug Abuse Commission (AADAC), the Addictions Foundation of Manitoba
(AFM), the Centre for Addiction and Mental Health (CAMH), the Prince Edward
Island Provincial Health Services Authority, and the Kaiser Foundation—the Centre
for Addictions Research of BC (CAR-BC), and the provinces of Nova Scotia, New
Brunswick and British Columbia.
The contributions of the following people and organizations are gratefully acknowledged.
Canadian Addiction Survey Research Advisory Team(west to east):
Ed Sawka, Alberta Alcohol and Drug Abuse Commission(AADAC); David Patton, Addictions Foundation ofManitoba (AFM); Ed Adlaf, Centre for Addiction andMental Health (CAMH); Juergen Rehm, CAMH; AncaIalomiteanu, CAMH; Patricia Begin, Canadian Centreon Substance Abuse (CCSA); Eric Single, CCSA;Stéphane Racine, Health Canada; Robert Hanson,Health Canada; Florence Kellner, Carleton University;Andrée Demers, University of Montreal; ChristianePoulin, Dalhousie University.
Canadian Addiction Survey Editorial Team (alphabetical order):
Ed Adlaf, CAMH; Patricia Begin, CCSA; Anne-ElyseDeguire, CCSA; Richard Garlick, CCSA; StéphaneRacine, Health Canada; Ed Sawka, AADAC; EricSingle, CCSA.
Financial and in-kind contributions (alphabetical order):
AADAC, AFM, CAMH, CCSA, Health Canada andthe provinces of British Columbia, New Brunswick andNova Scotia.

C A N A D I A N A D D I C T I O N S U R V E Y
Introduction
2H I G H L I G H T S P R E V A L E N C E O F U S E A N D R E L AT E D H A R M S
Timely and relevant data are prerequisites for effectivehealth policy and programming, and for the monitoringof established health objectives. Until the launch of theCanadian Addiction Survey (CAS) in December 2003,only two national general population surveys had beenspecifically dedicated to alcohol and other drug use inCanada: the National Alcohol and Other Drugs Survey(NADS) in 1989 (Eliany, Giesbrecht, and Nelson,1990) and the Canada’s Alcohol and Other DrugsSurvey (CADS) in 1994 (MacNeil and Webster, 1997),although alcohol and other drugs use items are occasion-ally captured in other health surveys.
Current information about prevalence rates, trends, andchanges from the CAS will fill a critical gap in popula-tion surveillance of alcohol and other drug use and willassist decision-makers in federal and provincial addic-tions agencies to allocate financial and human resourceswhere they are most needed (Office of the AuditorGeneral of Canada, 2001; Perron, 2002). HealthCanada’s participation in the CAS is an important initiative within the renewed Canada’s Drug Strategy,announced in May 2003. Current plans are to repeat theCAS in the future.
The CAS is one of the most detailed and extensiveaddiction surveys ever conducted in Canada, with over400 unique questionnaire items; the key objectives ofthe survey are as follows:
1. To determine the prevalence, incidence and frequencyof alcohol and other drug use in the Canadian popu-lation aged 15 and older;
2. To measure the extent of harms that are associated withthose individuals who use alcohol and other drugs;
3. To assess the context of use and identify the risk andprotective factors related to the use and consequencesof alcohol and other drug use;
4. To measure the public’s opinions, views and knowl-edge regarding existing and potential addiction poli-cies, and to identify emerging policy issues;
5. To provide baseline data for future evaluations of theeffectiveness of Canada’s Drug Strategy and otherefforts to reduce the harm associated with alcohol andother drug use.
Survey design and methodology The CAS sample included 13,909 Canadians aged 15and older who were interviewed by telephone betweenDecember 16, 2003, and April 19, 2004. The survey,based on a two-stage (telephone household, respondent)random sample, used random-digit-dialing methods. Alltelephone interviews were conducted by the researchfirm, Jolicoeur et associés. In each province, a minimumof 1,000 people were interviewed. In order to assesstrends in substance use, questionnaire items were typi-cally drawn from existing national surveys.
The survey’s scope precludes presenting analyses of all ofthe items in a single report. In this report, national dataon alcohol and other drug use and related harms, find-ings across provinces, and changes over time in alcoholand other drug use are set out. These data are presentedby demographic characteristics, including age, province,marital status, education, income adequacy and house-hold location. Further results from the CanadianAddiction Survey (CAS) will be presented through aforthcoming series of reports and research papers.

C A N A D I A N A D D I C T I O N S U R V E Y
3 P R E V A L E N C E O F U S E A N D R E L AT E D H A R M S H I G H L I G H T S
TABLE 1: Overview of major CAS indicators
CAN NL PE NS NB QC ON MB SK AB BC ***N= 13909 1001 1000 1002 1000 1003 1000 1502 1000 2401 3000
AlcoholCurrent drinkers—past year 79.3 73.9 70.2 76.0 73.8 82.3 78.7 76.5 78.2 79.5 79.3 **Drinking Type
Abstainer—never in life 7.3 9.5 8.6 7.1 10.1 6.2 8.3 7.1 4.7 6.5 6.9 **Former drinker—not in past year 13.7 17.1 21.5 17.2 16.5 11.7 13.3 17.0 17.5 14.3 14.1 **Light infrequent—past year 38.7 34.4 36.9 40.1 39.8 39.0 37.8 40.0 43.6 40.5 37.9 **Light frequent—past year 27.7 16.5 15.2 18.3 16.0 33.8 28.3 21.1 19.5 23.4 27.8 **Heavy infrequent—past year 5.6 11.5 9.6 9.2 9.1 3.7 5.0 7.2 7.8 7.5 6.0 **Heavy frequent—past year 7.1 11.1 8.2 8.1 8.5 5.7 7.3 7.7 6.9 7.9 7.3 *
Monthly heavy drinking 20.2 26.1 18.3 20.8 20.6 20.7 19.6 20.9 18.9 21.0 19.3 **Exceeded drinking guidelines 17.8 20.1 15.2 17.6 17.5 18.6 17.6 16.2 16.7 17.8 17.6 NS
Exceeded drinking guidelines1 22.6 27.3 21.7 23.3 23.7 22.7 22.6 21.4 21.5 22.5 22.4 NS
AUDIT hazardous drinking 13.6 16.9 14.8 15.8 14.1 11.9 13.7 15.1 13.8 15.3 13.4 NS
Other drug useCannabis—lifetime 44.5 38.5 36.5 43.4 42.1 46.4 40.4 44.6 41.0 48.7 52.1 **Cannabis—past year 14.1 11.6 10.7 14.4 11.1 15.8 12.4 13.4 11.4 15.4 16.8 **
Any drug (incl. cannabis)—life 45.1 38.5 36.9 43.7 42.5 47.3 40.9 44.8 41.3 49.3 52.7 **Any drug (incl. cannabis)—past year 14.5 11.7 10.7 14.5 11.1 16.4 12.6 13.7 11.8 15.9 17.5 **Any drug (excl. cannabis)—life 16.5 8.3 11.9 13.4 10.8 18.1 14.0 14.8 14.2 18.7 23.0 **Any drug (excl. cannabis)—past year 3.0 1.4Q 2.2Q 2.3Q 1.5Q 4.0 2.3Q 2.6 2.8Q 3.3 4.0 **Cocaine/crack—life 10.6 3.7 5.5 7.1 4.2 12.2 8.7 8.9 8.0 12.3 16.3 **Cocaine/crack—past year 1.9 0.9Q 1.1Q 1.1Q S 2.5Q 1.3Q 2.0Q 1.7Q 2.4Q 2.6 **Speed—life 6.4 1.2Q 3.3Q 3.2Q 4.5 8.9 5.5 4.5 4.0 6.1 7.3 **Ecstasy—life 4.1 1.5Q 2.6Q 3.4Q 1.9Q 3.7 3.7 2.6Q 3.1Q 5.1 6.5 **Hallucinogens—life 11.4 6.2 9.1 10.6 7.3 11.0 10.5 10.6 9.3 12.3 16.5 **Inhalants—life 1.3 0.7Q 1.4Q 1.1Q 1.0Q 2.1Q S 1.6Q 1.6Q 1.6Q 1.7Q NS
Alcohol and drug-related harmsAny alcohol harm (to self)2—
past year 8.8 7.2 9.3 8.7 7.3 8.4 9.1 7.6 8.9 9.5 9.1 NS
Any alcohol harm (from others)3—past year 32.7 29.7 33.6 32.1 31.4 30.2 31.8 36.2 35.7 38.0 35.4 **
Any drug harm (to self)4—past year 17.5 20.3 15.9 19.9 14.7 21.6 12.9 19.2 24.4 18.4 17.6 NS
1 among past-year drinkers (N= 10696); 2 among past-year drinkers (N= 10696); 3 among respondents 18 years and older (N= 13328); 4 among past-year illicit drug users (cannabis included; N=1909)
NS not significant; * p<.05; ** p<.01Q Qualified release due to high sampling variability
S estimate supressed
C A N A D I A N A D D I C T I O N S U R V E Y
Alcohol use and problems
4H I G H L I G H T S P R E V A L E N C E O F U S E A N D R E L AT E D H A R M S
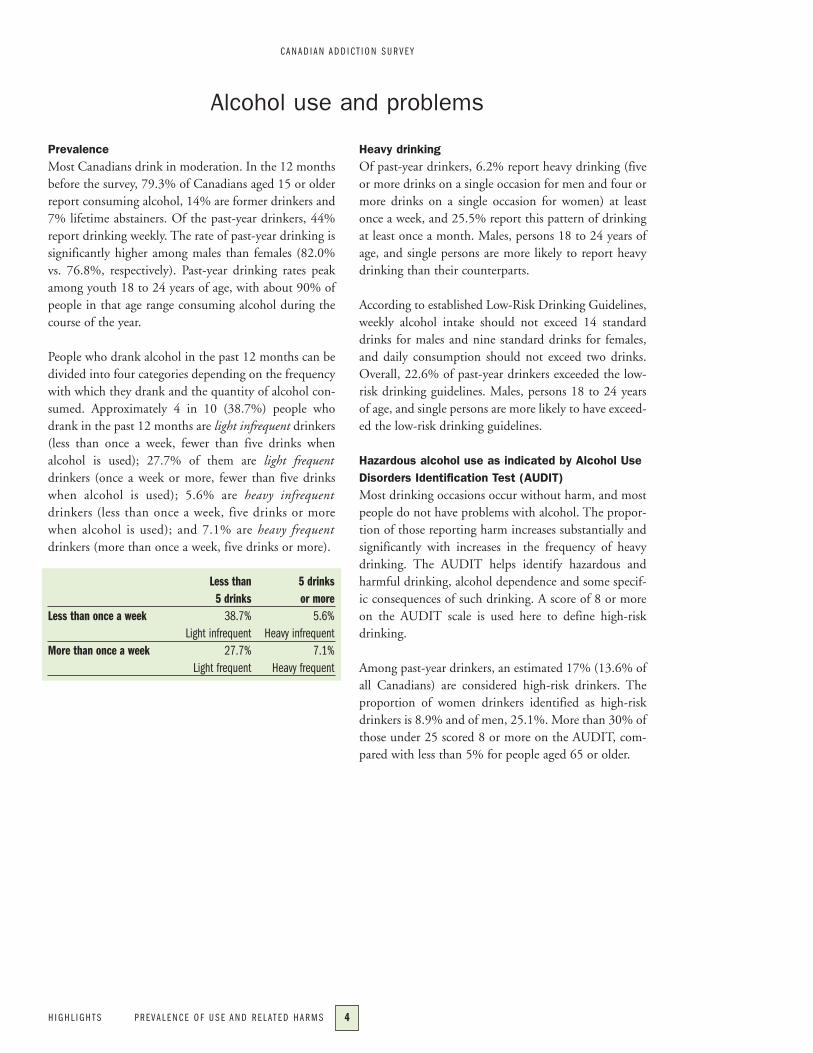
PrevalenceMost Canadians drink in moderation. In the 12 monthsbefore the survey, 79.3% of Canadians aged 15 or olderreport consuming alcohol, 14% are former drinkers and7% lifetime abstainers. Of the past-year drinkers, 44%report drinking weekly. The rate of past-year drinking issignificantly higher among males than females (82.0%vs. 76.8%, respectively). Past-year drinking rates peakamong youth 18 to 24 years of age, with about 90% ofpeople in that age range consuming alcohol during thecourse of the year.
People who drank alcohol in the past 12 months can bedivided into four categories depending on the frequencywith which they drank and the quantity of alcohol con-sumed. Approximately 4 in 10 (38.7%) people whodrank in the past 12 months are light infrequent drinkers(less than once a week, fewer than five drinks whenalcohol is used); 27.7% of them are light frequentdrinkers (once a week or more, fewer than five drinkswhen alcohol is used); 5.6% are heavy infrequentdrinkers (less than once a week, five drinks or morewhen alcohol is used); and 7.1% are heavy frequentdrinkers (more than once a week, five drinks or more).
Less than 5 drinks 5 drinks or more
Less than once a week 38.7% 5.6%Light infrequent Heavy infrequent
More than once a week 27.7% 7.1%Light frequent Heavy frequent
Heavy drinkingOf past-year drinkers, 6.2% report heavy drinking (fiveor more drinks on a single occasion for men and four ormore drinks on a single occasion for women) at leastonce a week, and 25.5% report this pattern of drinkingat least once a month. Males, persons 18 to 24 years ofage, and single persons are more likely to report heavydrinking than their counterparts.
According to established Low-Risk Drinking Guidelines,weekly alcohol intake should not exceed 14 standarddrinks for males and nine standard drinks for females,and daily consumption should not exceed two drinks.Overall, 22.6% of past-year drinkers exceeded the low-risk drinking guidelines. Males, persons 18 to 24 yearsof age, and single persons are more likely to have exceed-ed the low-risk drinking guidelines.
Hazardous alcohol use as indicated by Alcohol UseDisorders Identification Test (AUDIT)Most drinking occasions occur without harm, and mostpeople do not have problems with alcohol. The propor-tion of those reporting harm increases substantially andsignificantly with increases in the frequency of heavydrinking. The AUDIT helps identify hazardous andharmful drinking, alcohol dependence and some specif-ic consequences of such drinking. A score of 8 or moreon the AUDIT scale is used here to define high-riskdrinking.
Among past-year drinkers, an estimated 17% (13.6% ofall Canadians) are considered high-risk drinkers. Theproportion of women drinkers identified as high-riskdrinkers is 8.9% and of men, 25.1%. More than 30% ofthose under 25 scored 8 or more on the AUDIT, com-pared with less than 5% for people aged 65 or older.

0
1
2
3
4
5
6
Physic
al heal
th
Friend
ships
and so
cial lif
e
Financ
ial po
sition
Home li
fe or m
arriag
e
Work, st
udies
or
emplo
yment
oppo
rtunit
ies
Legal p
roblem
s
Difficult
y learn
ing
Housing
prob
lems
5.4
FIGURE 1
3.02.7
1.7
0.7 0.5
0
5
10
15
20
25
15.8 15.5
10.8 10.5
3.2
22.1
FIGURE 2
1.8
Insult
ed or
humilia
ted
Verba
l abuse
Seriou
s argu
ments o
r quar
rels
Pushed
or sh
oved
Family
or marr
iage p
roblem
s
Hit or p
hysica
lly ass
aulted
C A N A D I A N A D D I C T I O N S U R V E Y
5 P R E V A L E N C E O F U S E A N D R E L AT E D H A R M S H I G H L I G H T S
Harm from one’s own use of alcohol Nearly a quarter of former and current drinkers reportthat their drinking has caused harm to themselves and toothers sometime in their lives.
Almost 1 in 10 current drinkers report that they experi-enced harm from their drinking during the past year.Among these drinkers, 3% report adverse effects ofdrinking on friendships and social life, and 5.4% reportthat their drinking had harmed their physical health.
FIGURE 1: Percentage reporting harm experienced in
the past 12 months resulting from one’s own drinking,
past-year drinkers, age 15+, Canada 2004
Harm because of others’ use of alcoholAlmost a third of respondents (32.7%) report havingbeen harmed at least once in the past year because ofsomeone’s drinking. One in 10 respondents, 18 years andolder, reports that someone’s drinking was responsiblefor family and marriage problems. About one-fifth (22.1%) of respondents indicate that they were insulted andhumiliated and 15.5% report they had serious argu-ments or quarrels because of someone’s drinking, and15.8% report verbal abuse. Physical altercations wereless frequent, but rates were substantial: 10.8% werepushed or shoved, and 3.2% were physically assaulted.
Rates of all three measures of alcohol problems for marriedpeople are lower than for single people and for those for-merly married (widowed or divorced). When people aremarried, they are less likely to drink heavily and/or todrink heavily often. When married people do drink heavily,they are as likely to experience harm as unmarried people.
FIGURE 2: Percentage reporting harm experienced in
the past 12 months resulting from others’ drinking,
total population age 18+*, Canada 2004
0
1
2
3
4
5
6
Physic
al heal
th
Friend
ships
and so
cial lif
e
Financ
ial po
sition
Home li
fe or m
arriag
e
Work, st
udies
or
emplo
yment
oppo
rtunit
ies
Legal p
roblem
s
Difficult
y learn
ing
Housing
prob
lems
5.4
FIGURE 1
3.02.7
1.7
0.7 0.5
0
2
4
6
8
10
12
10.1
FIGURE 3
6.56.0
5.15.1
3.5
40
30
illicit dother t
canna33.1
34.132.0
23.8
FIGURE 4
15
20
25
15.8 15.5
22.1
FIGURE 2
1.8
Physic
al heal
th
Financ
ial po
sition
Friend
ships
and so
cial lif
e
Home li
fe or m
arriag
e
Work, st
udies
or
emplo
yment
oppo
rtunit
ies
Difficult
y learn
ing
Legal p
rob
Hous
* Due to the sensitivity of some items, harms from others’ drinking was asked only of those 18+

C A N A D I A N A D D I C T I O N S U R V E Y
Cannabis use and problems
6H I G H L I G H T S P R E V A L E N C E O F U S E A N D R E L AT E D H A R M S
PrevalenceOverall, 44.5% of Canadians report using cannabis atleast once in their lifetime, and 14.1% report use duringthe 12 months before the survey. Males are more likelythan females to have used cannabis in their lifetime(50.1% vs 39.2%) and during the past year (18.2% vs.10.2%). Younger people are more likely to have everused cannabis in their lifetime, with almost 70% ofthose between 18 and 24 having used it at least once.Younger people are also more likely to be past-year users.Almost 30% of 15-17 year olds and just over 47% of 18and 19 year olds have used cannabis in the past year.Beyond age 45, less than 10% of the population hasused cannabis in the past year.
Those who were never married are more likely to haveused cannabis. More than half (57.5%) of the never-married had used cannabis in their lifetime, comparedwith 35.2% of those who had been previously married,and 40.9% of those who are currently married or livingwith a partner. However, after adjusting for age differ-ences between marital status groups, both lifetime andpast-year cannabis use was significantly lower amongmarried respondents compared with never-married andpreviously married respondents.
Lifetime cannabis use increases with education, risingfrom 34.9% among those without high school comple-tion to a peak of 52.4% among those with some post-secondary education and 44.2% among those with auniversity degree.
Lifetime experiences with cannabis use increases withincome adequacy (income relative to the number of peo-ple in a household), from 42.9% of those with a lowincome adequacy to 44.6% of those with a moderateincome and 54.8% of those with a high income adequa-cy. The association between income adequacy and past-year use is not significant.
The frequency of cannabis use among past-year usersshows wide variation: about 21% of users do not reportuse during the past three months, while 24.9% reportuse just once or twice, 16% report use monthly, 20.3%weekly, and 18.1% daily
Hazardous or harmful cannabis use as measured bythe Alcohol, Smoking and Substance InvolvementScreening Test (ASSIST) About 1 in 20 Canadians report a cannabis-related con-cern. The most common concern is failing to control use(4.8%), followed by a strong desire to use (4.5%), andfriends’ concerns about the respondent’s cannabis use(2.2%). Problems such as unfulfilled obligations andexperiencing health, social and legal problems arereported by 1% or lower. Among past-year cannabisusers, about one-third report failing to control their use(34.1%) and a strong desire to use (32%). In addition,about 16% report that friends or relatives expressed con-cern about the respondent’s cannabis use, 6.9% reportfailed expectations, and 4.9% report experiencinghealth, social or legal problems due to their use.

C A N A D I A N A D D I C T I O N S U R V E Y
Other illicit drug use and problems
7 P R E V A L E N C E O F U S E A N D R E L AT E D H A R M S H I G H L I G H T S
PrevalenceThe use of illicit drugs is generally limited to cannabisonly. About 28.7% of Canadians (63.4% of lifetimeusers) report using only cannabis during their lifetime,and 11.5% (79.1% of past-year users) used onlycannabis during the past year.
Excluding cannabis, the illicit drug most commonly usedduring one’s lifetime is reported to be hallucinogens,used by 11.4% of respondents, followed closely bycocaine (10.6%), speed (6.4%) and ecstasy (4.1%). Thelifetime use of drugs such as inhalants, heroin, steroidsand drugs taken intravenously is about 1% or less of thepopulation. The percentage reporting the use of any fivedrugs other than cannabis (cocaine or crack; hallucinogens,PCP or LSD; speed or amphetamines; heroin; ecstasy[MDMA]), is 16.5%, and the percentage reporting theuse of any of the eight drugs, including cannabis, is 45.2%.
Although about one in six Canadians has used an illicitdrug other than cannabis in their lifetime, few have usedthese drugs during the past year. Rates of drug use in thepast 12 months are generally 1% or less, with the excep-tion of cocaine use (1.9%). About 3% of Canadians(4.3% of males and 1.8% of females) report using atleast one of the five drugs other than cannabis, and 14.5%(18.7% of males and 10.6% of females) report using anyof the eight drugs, including steroids and inhalants.
The rate of lifetime and past-year illicit drug use otherthan cannabis (16.5% and 3%) is highest among men(21.1% and 4.3%, respectively), 18 to 19 year olds (30.6%and 17.8%) and 20 to 24 year olds (28.1% and 11.5%),residents of Quebec (18.1% and 4%), and BritishColumbia (23% and 4%) and Alberta (18.7% lifetimeuse only), and single (24% and 8.9%) and previouslymarried respondents (13.5% lifetime only).
Harms related to illicit drug useThe most commonly reported drug-related harm involvesphysical health, reported by 30.3% of lifetime and 23.9%of past-year users of drugs other than cannabis, and15.1% of lifetime and 10.1% of past-year users of anydrug. Following physical health, a cluster of harms, rep-resented somewhat equally, includes harms to one’sfriendship and social life (22.3% and 16.4% of usersexcluding cannabis, 10.7% and 6% of any drug users),home and marriage (18.9% and 14.1% excludingcannabis, 8.7% and 5.1% of any drug users), work(18.9% and 14.2% excluding cannabis, 9.2% and 5.1%of any drug users), and financial (19.6% and 18.9%excluding cannabis, 8.4% and 6.5% of any drug users).

C A N A D I A N A D D I C T I O N S U R V E Y
8H I G H L I G H T S P R E V A L E N C E O F U S E A N D R E L AT E D H A R M S
0
2
4
6
8
10
12
10.1
FIGURE 3
6.56.0
5.15.1
3.5
1.3
40
30
20
10
illicit drugsother than cannabis
cannabis33.1
34.1
21.5
32.0
23.8
15.7
12.112.5
6.9
FIGURE 4
Physic
al heal
th
Financ
ial po
sition
Friend
ships
and so
cial lif
e
Home li
fe or m
arriag
e
Work, st
udies
or
emplo
yment
oppo
rtunit
ies
Difficult
y learn
ing
Legal p
roblem
s
Housing
prob
lems
About 17.5% of past-year users of illicit drugs, includingcannabis, and 36.7% of past-year users, excluding cannabis,report experiencing one or more of the eight harms.
FIGURE 3: Percentage reporting harms from one’s
own drug use (including cannabis), past-year drug users,
age 15+, Canada 2004
Hazardous or harmful illicit drug use as measured bythe Alcohol, Smoking and Substance InvolvementScreening Test (ASSIST) Among past-year users of illicit drugs other thancannabis, 42.1% report symptoms indicative of the needfor intervention, as determined by the ASSIST scale.
FIGURE 4: Percentage reporting drug use risk indicators
(ASSIST) among past-year cannabis and other drug
users, age 15+, Canada 2004
ancial
positi
on
Home li
fe or m
arriag
e
Work, st
udies
or
emplo
yment
oppo
rtunit
ies
Legal p
roblem
s
Difficult
y learn
ing
Housing
prob
lems
1.7
0.7 0.5
0
2
4
5.15.1
3.5
1.3
0
40
30
20
10
illicit drugsother than cannabis
cannabis33.1
34.1
21.5
32.0
23.8
15.7
12.1
4.9
12.5
6.9
FIGURE 4
15.8 15.5
10.8 10.5
3.2
1.8
Physic
al heal
th
Financ
ial po
sition
Friend
ships
and so
cial lif
e
Home li
fe or m
arriag
e
Work, st
udies
or
emplo
yment
oppo
rtunit
ies
Difficult
y learn
ing
Legal p
roblem
s
Housing
prob
lems
abuse
argum
ents o
r quar
rels
Pushed
or sh
oved
Family
or marr
iage p
roblem
s
Hit or p
hysica
lly ass
aulted
Failed
contr
ol
Strong
desire
to us
e
Friend
s conc
ern
Failed
expec
tation
s
Health,
social,
legal p
roblem
s

C A N A D I A N A D D I C T I O N S U R V E Y
Provincial comparisons
9 P R E V A L E N C E O F U S E A N D R E L AT E D H A R M S H I G H L I G H T S
Alcohol useAcross provinces, past-year alcohol use is fairly close tothe national average of 79.3%, although notably lowerrates are recorded for the Atlantic provinces of PrinceEdward Island (70.2%), New Brunswick (73.8%) andNewfoundland and Labrador (73.9%) and a higher ratefor Quebec (82.3%).
About two-thirds of the population across the countrymay be classified as light drinkers. There is also a minor-ity who are either heavy infrequent drinkers, rangingfrom 6% in British Columbia to 11.5% inNewfoundland and Labrador, or, are heavy frequentdrinkers, ranging from 5.7% in Quebec to 11.1% inNewfoundland and Labrador. About 1 in 10 Canadianshas these styles of heavier drinking, with significantlyhigher percentages in the four Atlantic Provinces and inAlberta.
Harms related to alcohol useThe most striking overall finding is the general patternamong current and former drinkers of consistently high-er lifetime rates of alcohol-related harms for fiveprovinces: Prince Edward Island, Manitoba,Saskatchewan, Alberta, and British Columbia. Harmrelated to friendships ranges from 9.6% in Quebec to17.7% in British Columbia, and harm to physical healthranges from 10.5% in Newfoundland and Labrador to18% in British Columbia.
Significantly higher rates of past-year harms experiencedbecause of others’ drinking tend to be reported in thefour western provinces.
Cannabis useCompared with the national average of 44.5%, lifetimeuse of cannabis is significantly higher in BritishColumbia (52.1%) and Alberta (48.7%), and lowerthan average in Ontario (40.4%), Newfoundland andLabrador (38.5%) and Prince Edward Island (36.5%).Also, compared with the national average of 14.1%,past-year use is significantly higher in British Columbia(16.8%) and Quebec (15.8%), and lower inSaskatchewan (11.4%) and Prince Edward Island(10.7%).
Other illicit drug useOther than cannabis, all other illicit drug use acrossprovinces remains relatively low with past-year use levelsat 3% or less. There are significantly lower usage rates ofmost illicit drugs in Prince Edward Island, NewBrunswick and Newfoundland and Labrador, and ratesabove the national average in Quebec, Alberta, and,most notably, in British Columbia.
Harms related to illicit drug useUse of illicit drugs can have negative impacts for thedrug user. The general finding, in terms of provincialdifferences, is that living in Newfoundland and Labradorand New Brunswick is significantly associated withlower rates of lifetime harms, while living in Alberta andBritish Columbia is associated with higher rates.
The major effect of drug use is on physical health whilethe smallest effect across provinces is on legal matters.There are differences among provinces in the lifetimeeffects on physical health with a lower rate inNewfoundland and Labrador (8.7%) and higher rates inQuebec (17.4%), Alberta (16%) and British Columbia(17.5%).

C A N A D I A N A D D I C T I O N S U R V E Y
Changes in alcohol and other drug use
10H I G H L I G H T S P R E V A L E N C E O F U S E A N D R E L AT E D H A R M S
Changes in alcohol and other drug use were examinedby comparing results from the CAS with those of the1989 National Alcohol and Other Drugs Survey(NADS) and the 1994 Canada’s Alcohol and OtherDrugs Survey (CADS).
TABLE 2: Changes in alcohol and other drug use for
comparable major indicators
NADS CADS CAS1989 1994 2004
AlcoholDrinkers—past year 77.7 72.3* 79.3Drinking Typea
Abstainer 6.6 12.8* 7.2Former drinker 15.7* 13.5 13.5Light infrequent 35.5 33.6* 38.1Light frequent 31.3* 29.2 27.3Heavy infrequent 3.6* 3.3* 5.5Heavy frequent 6.7 5.4* 7.0
Other drug useCannabis—lifetime 23.2* 28.2* 44.5Cannabis—past year 6.5* 7.4* 14.1
Any drugb (incl. cannabis)—life N.A. 28.5* 45.0Any drug (incl. cannabis)—past year N.A. 7.6* 14.4Cocaine/crack—life 3.5* 3.8* 10.6Cocaine/crack—past year 1.4 0.7* 1.9LSD/speed/heroin—life 4.1* 5.9* 13.2LSD/speed/heroin—past year 0.4 Q 1.1 1.3Inhalants—life N.A. 0.8 1.3Steroids—life N.A. 0.3 Q 0.6
a “Not stated” was used in the calculation of rates in Table 2 andnot used in Table 1 (Overview); this accounts for differencesin the prevalence rates from the CAS between the two Tables.
b “Any illicit” category excludes ecstasy; this accounts for differencesin the prevalence rates between Table 1 (Overview) and Table 2.
Q Qualified release due to high sampling variabilityN.A. Not available* Significantly different from CAS
Alcohol use and problemsAccording to this examination, the overall percentage ofdrinkers in Canada declined from 77.7% in 1989 to72.3% in 1994 and has now risen again to 79.3% in2004. Variations in drinking patterns across studies areconsistent with the corresponding variations in rates ofalcohol use. Furthermore, changes in rates of self-report-ed alcohol use are consistent with alcohol sales data.
More drinkers in 2004 report harms due to their drinkingduring their lifetime than did drinkers in earlier years.However, when we examine harms experienced in the 12months before the survey in 2004, drinkers are usuallyless likely to report harm from their own drinking, butare more likely, for most categories of harms, to reportharm from others’ drinking.
TABLE 3: Changes in harms associated with alcohol use
NADS CADS CAS1989 1994 2004
Alcohol % % %
Harms due to one’s own alcohol useFriendships or social life
Lifetimea 10.5 * 10.1* 14.2Past yearb 4.7 * 3.4 3.0
Physical HealthLifetime 11.6* 12.2* 14.8Past year 7.1 * 6.2 5.4
Home life or marriageLifetime 5.5 * N.A. 8.1Past year 3.0 * N.A. 1.8
Work, studies oremployment opportunities
Lifetime 3.5 * 4.9* 6.8Past year 2.0 1.7 1.7
Financial positionLifetime 5.4 * 6.9 6.9Past year 3.8 4.0* 2.7
Harms from others’ drinkingPast yearc
Insulted or humiliated 21.3 19.2* 22.1Arguments/Quarrels 16.6 14.0 15.5Family problems or marriagedifficulties 7.7 * 5.4* 10.5Passenger with drunk driver 10.4 * 7.5* 17.8Pushed or shoved N.A. 10.8 10.8Hit/Assaulted 7.2 * 4.4* 3.2
* Significantly different from CASa Lifetime harms among lifetime users, age 15+
(NADS only includes past-year drinkers) b Past-year harms among past-year users, age 15+c Past-year harms among total population, age 18+N.A. Not available

C A N A D I A N A D D I C T I O N S U R V E Y
11 P R E V A L E N C E O F U S E A N D R E L AT E D H A R M S H I G H L I G H T S
Other drug useSelf-reported rates of illicit drug use are increasing inCanada. The proportion of Canadians reporting anyillicit drug use in their lifetime rose from 28.5% in 1994to 45.0% in 2004, and in the past 12 months from7.6% to 14.4%.
The lifetime use of cannabis increased from 23.2% in1989, to 28.2% in 1994, and to 44.5% in 2004. Forcocaine, use rose from 3.5% in 1989, to 3.8% in 1994,and to 10.6% in 2004. For LSD/speed/heroin, the raterose from 4.1% in 1989 to 5.9% in 1994, and to 13.2%in 2004.
The past-year use of cannabis rose from 6.5% in 1989 to7.4% in 1994, and to 14.1% in 2004. For cocaine andcrack, rates declined from 1.4% in 1989 to 0.7% in 1994,and rose again to 1.9% in 2004. While past-year rates forthe combined category of LSD/speed/heroin rose slightlyfrom 0.4% in 1989, to 1.1% in 1994, and to 1.3% in2004, these findings are not statistically significant.
Use of steroids and inhalants remain very low.Indications are that lifetime use of steroids is increasingamong males.
Ecstasy is a relatively new substance of abuse and was notsurveyed for the NADS (1989) or the CADS (1994).For this reason, rates of ecstasy use were compared withthe Canadian Community Health Survey (CCHS) cycle1.2: Focus on Mental Health, conducted in 2002 byStatistics Canada. Rates of use for ecstasy were 2.9%(lifetime) and 0.8% (past 12 months) in the 2002 CCHS1.2 (Tjepkema, 2004) in contrast to rates of use of 4.1%(lifetime) and 1.1% (past 12 months) in the 2004 CAS.
Harms related to other drug useThis overall trend of increasing rates of illicit drug usedoes not translate into changes in reported harms amongmost of the variables that can be compared across surveys.
TABLE 4: Changes in harms from one’s own drug use
CADS CAS1994 2004
Illicit drug use % %
Friendships or social lifeLifetimea 10.6 11.9Past yearb 6.6 6.0
Physical HealthLifetime 17.6 16.5Past year 12.5 10.1
Work, studies or employment opportunitiesLifetime 12.8 10.3Past year 7.5 5.1
Financial positionLifetime 12.6 9.5Past year 10.3* 6.5
* Significantly different from CASa Lifetime harms among lifetime users of at least one of the
following: cannabis (excluding “one-time only” use), cocaine/crack, LSD or hallucinogens, speed, heroin, steroids or solvents.
b Past-year harms among past-year users, age 15+
The data indicate that the number of Canadians whoreport having used an injectable drug at some point intheir life increased from 1.7 million in 1994 to a littleover 4.1 million in 2004. Of those, 7.7% (132,000)reported having used a drug by injection in 1994 com-pared with 6.5% (269,000) in 2004.

C A N A D I A N A D D I C T I O N S U R V E Y
Conclusion
12H I G H L I G H T S P R E V A L E N C E O F U S E A N D R E L AT E D H A R M S
ReferencesEliany, M., Giesbrecht, N., & Nelson, M. (Eds.). (1990).National Alcohol and Other Drugs Survey: HighlightsReport. Ottawa: Health and Welfare Canada.
MacNeil, P., & Webster, I. (Eds.). (1997). Canada’sAlcohol and Other Drugs Survey 1994: A Discussion of theFindings (Vol. Cat: H39-338/1-1994E). Ottawa: Ministerof Public Works and Government and Services Canada.
Office of the Auditor General of Canada. (2001). Reportof the Auditor General, Chapter 11: Illicit Drugs: TheFederal Goverment’s Role. Ottawa.
For a country of Canada’s size and diversity, there is considerable convergence in
findings across provinces regarding the prevalence of alcohol and illicit drug use and
related harms. There are also important differences in terms of levels and patterns of
use, and risk of harms that are of significance not only to researchers, but to decision-
makers and ultimately to all Canadians.
This report represents a first step toward an overview of the alcohol and other drugs
situation in Canada using key variables. Additional analysis would provide further
insights into the picture of alcohol and illicit drug use on a regional, provincial or
local basis. Such efforts would yield useful results for policy and program decision-
makers and would contribute to the addictions knowledge base in Canada.
Perron, M. (2002). What do we need in a national drugstrategy? Paper presented at the Presentation on behalf ofthe Canadian Executive Council on Addictions to theParliamentary Committee on the Non-Medical Use ofDrugs, August 29, Ottawa.
Tjepkema, M. (2004). Use of Cannabis and Other IllicitDrugs. Health Reports, Vol. 15 (No. 4), 43-47.