Embed Size (px)
Citation preview

Please refer to page 19 for important disclosures and analyst certification, or on our website
www.macquarie.com/research/disclosures .
CANADA/UNITED STATES
BEP-U CN/BEP US Outperform
Price (at 04:38, 01 Feb 2017 GMT)C$39.20/US$30.22
Valuation C$ 43.00/US$33.00 - EV/2018E EBITDA and Dividend Yield 12-month target C$ 43.00/US$33.00
12-month TSR % +16.8
Volatility Index Low
GICS sector Utilities
Market cap C$m 11,619
Market cap US$m 8,912
30-day avg turnover C$m 5.1
Number shares on issue m 296.4
Investment fundamentals Year end 31 Dec 2015A 2016E 2017E 2018E
EBITDA m 1,088.0 1,585.4 1,529.8 1,560.7 Total DPS US$ 1.66 1.78 1.90 2.04 Total div y ield % 5.5 5.9 6.3 6.8 EV/EBITDA x 12.6 9.1 9.5 9.4
BEP-U CN vs TSX, & rec history
Note: Recommendation timeline - if not a continuous line, then there was no Macquarie coverage at the time or there was an embargo period.
Source: FactSet, Macquarie Capital (USA), February 2017
(all f igures in USD unless noted, TP in CAD)
Analyst(s) Dav id Noseworthy, P.Eng +1 212 231 6681 [email protected]
1 February 2017 Macquarie Capital (USA) Inc.
Brookfield Renewable Potential TERP & GLBL Acquisition Event
In our opinion, the potential acquisition of TerraForm Power Inc. and Terraform
Global Inc. by Brookfield Asset Management (Brookfield) is increasingly likely and
proximate. On Jan. 23/17 Brookfield, manager and sponsor of Brookfield
Renewable (BEP), brought this acquisition closer to reality by entering an
agreement to negotiate exclusively with these two parties. Herein we provide a
detailed analysis, summary of key events, and our perspective on frequently
asked questions regarding the potential acquisition.
Impact
In our view, TERP’s and GLBL’s lack of management and operational capability,
large size, and geographically diverse asset base make them difficult to acquire.
We view the fact that TERP and GLBL entered into exclusive agreements to work
with Brookfield as evidence that there were no superior bids to that of Brookfield’s.
We believe, BEP is well situated to acquire TERP and GLBL due to its large
overlapping operating footprint, relatively low cost of capital, and ready access to
large pools of capital from its sponsor and private equity partners.
We estimate, absent any cost synergies, acquiring 100% of TERP and GLBL on
the terms proposed would be $0.07 accretive to our 2017E DCPS on a full year
basis. However, we believe the elimination of public issuer costs, capital
efficiencies, and operating efficiencies would likely result in $20M of cost savings
net to BEP’s ownership interest. Including these savings we estimate $0.13 DCPS
accretion. For a more fulsome accretion analysis see Fig 10-18.
Depending on which of BEP’s four proposals is ultimately successful, we estimate
BEP will require between $320M - $850M to finance the equity portion of such a
transaction. Also, we expect BEP retain a 40% stake in whatever the Brookfield
consortium ultimately acquires, consistent with other recent transactions.
BEP reports Q4/16 result on Feb. 2/17. We expect AFFOPS of $0.41, above
consensus of $0.35, and Adj. EBITDA of $407M above consensus of $397M.
Earnings and target price revision
Our revised estimates reflect the transition to a new model.
Price catalyst
12-month price target: C$43.00 based on a combination of 13.75x EV/2018E
EBITDA and a 5.75% target yield on our 2018E dividend of $2.04/sh.
methodology.
Catalyst: Acquisition of TERP, GLBL, or other portfolios of renewable assets.
Action and recommendation
We maintain our Outperform rating. As one of the world’s largest publicly -traded,
pure play renewable power businesses, we believe BEP is a core holding in the
global independent power producer space.

Macquarie Research Brookfield Renewable
1 February 2017 2
Source: Company data, Macquarie Capital (USA), February 2017

Macquarie Research Brookfield Renewable
1 February 2017 3
What happened most recently?
On Jan. 23/17 Brookfield Asset Management (Brookfield), manager and sponsor of Brookfield
Renewable, entered into two separate agreements to negotiate a takeover on an exclusive basis with
both TerraForm Power (TERP US, US$11.87, Outperform, TP: US$14.00, Angie Storozynski) and
TerraForm Global (GLBL US, US$4.40, Outperform, TP: US$4.00, Angie Storozynski). This is the
most recent event in a series of efforts made by Brookfield to acquire TERP (see Fig. 1 for a summary
of key events). Brookfield has provided four alternative proposals to acquire TERP and GLBL. These
offers include acquiring: (1) 100% of TERP for $11.50/class A share; (2) 100% of TERP and GLBL for
$12.50 and $4.35 per share, respectively; (3) 50.1% of TERP and replace SunEdison, Inc. (SUNE) as
sponsor for $11.50/share; and (4) 50.1% of TERP and GLBL and replace SUNE as sponsor for $12.50
and $4.25, respectively. We have conducted a detailed analysis of Brookfield’s offers based on our
examination of Brookfield’s, TERP’s, and GLBL’s filings.
Fig 1 TERP Class A Share Price and Volume with Select Key Events Rela ted to Brookfield’s Acquisition Efforts
Source: company reports, Bloomberg, Macquarie Capital (USA)
Why are TERP & GLBL potentially available?
TERP and GLBL are potentially available for acquisition because its manger and sponsor,
SUNE, has filed for bankruptcy, creating doubt in the minds of investors as to the long term
sustainability of the yieldco model for these companies. Recall, on April 21, 2016 SUNE, manager and
sponsor of both TERP and GLBL, filed for protection under Chapter 11 of the U.S. Bankruptcy Code.
TERP and GLBL were not part of this filing and have no plans to file for bankruptcy. However, absent
SUNE, they would lack an operator, asset manager, and sponsor. Consequently, on September 19,
2016 TERP announced that its Board of Directors has initiated a process to explore and evaluate
potential strategic alternatives to maximize shareholder value, including a merger or sale of its entire
business.
Source: Company Releases, Bloomberg
(1) Dec 02/15 Appaloosa LP (ALP) disclosed its 8.7M Class A share position in TerraForm Power, Inc.
(2) Jun 20/16 Brookfield announces its 11.1M Class A share stake in TERP and total return swap for 11.6M notional Class A TERP shares
(3) Jul 22/16 Brookfield and ALP disclose that they have formed a group under the Exchange Act with a combined 22.5% economic interest TERP Class A shares.
(4) Nov 09/16 Brookfield offers $12/Class A share for TERP
(5) Nov 17/16 Brookfield offers a $13/Class A share for TERP and says it is prepared to make an offer for GLBL as well
(6) Dec 01/16 Brookfield extends the expiration date of its total return swaps agreement for 9M notional Class A TERP shares from April 17/17 to April 17/18
(7) Dec 03/16 Brookfield enters confidentiality agreement with TERP to participate in TERP's strategic review process
(8) Jan 09/17 Brookfield offers $11.50 - $12.50 per Class A TERP share, and $4.25 - $4.35 per Class A GLBL share
(9) Jan 23/17 Brookfield enters agreement to negotiate acquisition of TERP and GLBL on a exclusive basis
0
5
10
15
20
25
30
35
40
45
50
$0
$5
$10
$15
$20
$25
$30
$35
Jul 10
/15
Nov 1
2/1
5
Ma
r 16/1
6
Jul 19
/16
Nov 2
1/1
6
Avg
Da
ily V
olu
me
(M
illi
on
s)
Sh
are
Pri
ce
($/s
ha
re)
Major Events Price Volume (RHS)
2
4
83 5 9
6, 7
1
July 22/16 - Brookfield and ALP form a legal "group " with a combined 19.8M
Class A TERP shares
Jan 9/17 -Brookfield
offers
$11.50 -$12.50 for
TERP
Dec 3/16 - Appaloosa LP discloses 8.7M Class A share position in TERP
June 2/16 - Brookfield discloses 11.1M Class A
share position in TERP
and 11.5M Notional Class A Total Return swap
Nov 17/16 -Brookfield
offers
$13/share for TERP
Dec 3/16 -Brookfield gains access to TERP's
data room
Nov 9/16 - Brookfield offers $12/share for
TERP
Jan 23/17 - Brookfield enters agreement to negotiate the acquisition of TERP and GLBL on an exclusive basis -
Brookfield offers $4.25 - $4.35 for GLBL

Macquarie Research Brookfield Renewable
1 February 2017 4
Why is BEP a strong candidate to acquire TERP & GLBL?
We believe BEP is uniquely capable of acquiring TERP and GLBL because BEP has: (1) a strong
global operating footprint overlapping in many of the areas that TERP’s and GLBL’s assets reside; (2)
a relatively low cost of capital compared to the US yieldcos; and (3) access to significant pools of
capital through its affiliation with Brookfield Asset Management (Brookfield). The lack of other potential
suitors with these characteristics has in our view, severely diminished the pool of potential bidders for
these otherwise top-tier renewable assets. We discuss each factor in further detail below.
BEP has a strong global operating footprint overlapping in many of the areas that TERP and
GLBL have assets. We believe an acquirer of TERP and GLBL will need operating, maintenance,
and back office capability to replace those functions currently being provided by SUNE. As sponsored
yieldcos, TERP and GLBL, are financial constructs that lack internal operations, maintenance, and
asset management capability. The TerraForm Companies currently receive these services under a
management agreement with SunEdison, which has filed for protection under Chapter 11. In our view,
most financial buyers, like pension funds and private equity funds, have likely been eliminated from
the process due to the uncertainty regarding operating personnel and the difficulty to mitigate such a
risk. In contrast, BEP as one of the largest renewable power operators in the world could likely
assume operating control from SUNE in relatively short order.
BEP a significant cost of capital advantage over other strategic acquirers. BEP trades at a 2.3x
EV/2017E premium to the US yieldco average of 9.5 x (see Fig 2). Furthermore, BEP trades at a 0.7x
premium to its Canadian Independent Power Producers (IPP) average of 11.1x. In our view, the
relative weak valuations for US yieldcos and Canadian IPP make a competitive bid from strategics
less likely.
Fig 2 US and Canadian Comparables
Source: Factset, Macquarie Capital (USA), February 2017

Macquarie Research Brookfield Renewable
1 February 2017 5
BEP has access to significant pools of capital. BEP has demonstrated an ability to access public
equity and preferred equity markets on a regular basis over the last several years. For example in
2016, BEP raised C$860M of common equity, C$500M of medium term notes, and C$200M of
preferred equity. Beyond the public capital markets, BEP has access, through its partners and
sponsor, to private capital markets as well. Recall, in July 2016 Brookfield raised $14B for its
Brookfield Infrastructure Fund III. BEP has been regularly investing alongside the Brookfield private
equity funds over the last couple of years, typically taking a 40% interest. We would expect this to
continue with the potential acquisition of TERP and GLBL.
Despite indications of interest from other bidders, TERP decided to enter an exclusivity
agreement with BEP, which we believe is indicative that BEP made the best offer. Since
December 6th, 2016 when TERP let BEP’s expedited buy-out offer fall through, there have been a
couple of other bidders whom have shown interest.
D.E. Shaw: On Dec. 15th D.E. Shaw, entered into a confidentiality pact with TERP according to the
13D/A filing. The company owns a 6.7% stake in TERP. Prior to this announcement, Reuters
published an article on August 28th stating that D.E Shaw had expressed interest in TERP and on
October 25, 2016 D.E. Shaw made an offer for SunEdison’s stake in TERP.
AES Corp: in December AES Corp emerged as a potential bidder as well. According to
SparkSpread AES had intentions to make a formal bid for 100% of TERP.
Why is BEP interested in TERP?
In our view, TERP owns a premiere portfolio of North American renewable generation assets
(see Fig 3). The 3.0 GW portfolio has an average asset life of three years. The portfolio is diversified,
with no single project representing more than 10% of the overall capacity, and no one jurisdiction
representing more than 25% of capacity (see Fig 4). In addition, the portfolio has an average
remaining power purchase agreement (PPA) life of 15 years and 90% of the contracted capacity is for
six years or longer (see Fig 5). Finally, 86% of the PPAs are with investment-grade counterparties
(see Fig. 5). We note that on January 6, 2017 TERP sold a 365MW portfolio of UK solar assets to the
private equity arm of EFG Hermes for $580M, including $370M of assumed debt. TERP estimates that
these assets generate about $35M of annual EBITDA.
BEP, as one of the world’s largest operators of renewable assets, may be able to achieve operations
and maintenance cost saving relative to the costs incurred by TERP under its management agreement
with SUNE. Furthermore, we believe there may also be refinancing opportunities that would ultimately
reduce interest expense. We estimate $10M cost savings (assuming Brookfield acquires a 100%
interest) increases cash flow accretion by $0.04/share.

Macquarie Research Brookfield Renewable
1 February 2017 6
Fig 3 TERP Asset Map As At October 31, 2016
Note (1) : On January 6, 2017 TERP announced the sales of 365MW of solar in the UK for $580M. The transaction is expected to close in H1/17.
Source: Company data, January 2017
Fig 4 TERP’s Asset Portfolio Breakdown by Project / by Power Market
Source: Company data, January 2017

Macquarie Research Brookfield Renewable
1 February 2017 7
Why is BEP interested in GLBL?
We believe Brookfield’s interest in GLBL is motivate by a few considerations. First, at
Brookfield’s offer price, it is materially-accretive. Second, to the extent the sale of both TERP and
GLBL is desirable for stakeholders like SUNE and the TERP and GLBL Board of Directors, this could
differentiate Brookfield’s bid from other potential bids. Finally, GLBL’s assets are located primarily in
markets Brookfield is targeting. We discuss each consideration in further detail below.
We estimate the acquisition of 100% of GLBL for $4.35/share is $0.09 accretive to BEP’s 2017
cash flow, assuming a full year contribution. This is materially more accretive than TERP. We
believe Brookfield requires the higher cash-on-cash returns that the higher accretion signifies to bear
the higher risk profile of the countries in which GLBL operates (see Fig 6 – GLBL’s Assets by
Geography and Risk) and the credit-risk of their PPA counter parties.
Fig 5 TERP’s Asset Portfolio Breakdown by PPA Duration/ by Counterparty Credit Quality
Source: Company data, January 2017
Fig 6 GLBL’s Assets by Geography and by Risk
Source: Company data, Bureau of Diplomatic Security, CIA, January 2017

Macquarie Research Brookfield Renewable
1 February 2017 8
On January 27, 2017, Knighthead Capital, owner of a 7.2% stake in GLBL, indicated that based on a
recent acquisition in Brazil that GLBL would be worth $7.21/share. We estimate at this acquisition
price GLBL would still be $0.02 accretive to BEP’s 2017E AFFOPS. We believe the lack of an
alternative bid makes a higher bid from Brookfield challenging to justify.
BEP may be interested in GLBL as a way to differentiate its bid for TERP. Acquiring GLBL at the
same time as TERP may be attractive to: (1) SUNE, as it allows them to monetize their equity position
in both companies perhaps more quickly than would be the case if GLBL were to seek an acquirer
separately. Also, as structured, Brookfield is offering a premium for both TERP and GLBL together.
Any premium is likely desirable for SUNE; (2) there are six overlapping directors on the board of GLBL
and TERP (see Fig 7 – TERP & GLBL Board of Directors). To the extent that Brookfield’s offer allows
these directors to responsibly discharge their fiduciary duty to shareholders of both companies, we
believe a combined offer for TERP and GLBL may be more appealing than an offer for TERP alone,
especially if an acquisition of TERP by itself leaves GLBL orphaned.
Fig 7 TERP and GLBL Board of Directors
Source: Company data, Macquarie Capital (USA), February 2017
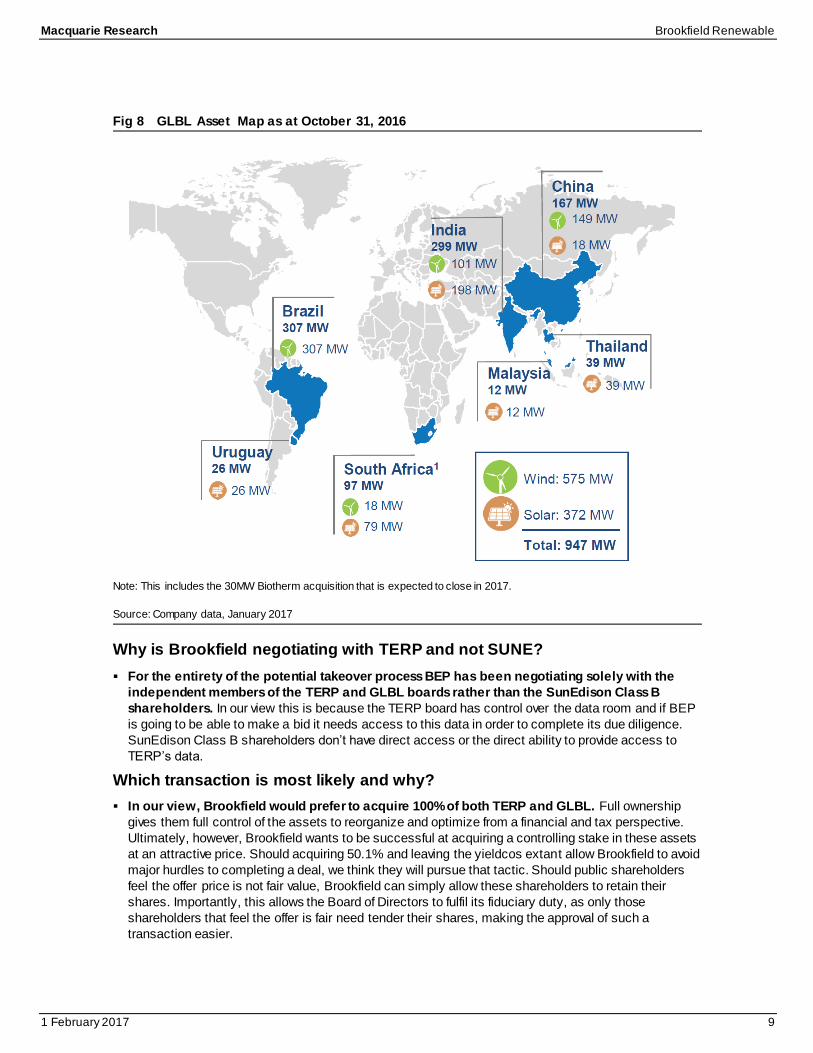
Two-thirds of GLBL’s assets are in markets that BEP either currently operates or intends to
operate (see Fig 8 – GLBL Asset Map). About 1/3 of GLBL’s assets are in Brazil, a historically
important market for BEP. Another 1/3 of GLBL’s assets are in India. BEP has recently identified India
as a potential market for expansion. However, the positive exposure to these markets may be
somewhat offset by exposure to potentially unattractive markets like South Africa, Malaysia, and
Uruguay.
Macquarie Research Brookfield Renewable
1 February 2017 9
Fig 8 GLBL Asset Map as at October 31, 2016
Note: This includes the 30MW Biotherm acquisition that is expected to close in 2017.
Source: Company data, January 2017
Why is Brookfield negotiating with TERP and not SUNE?
For the entirety of the potential takeover process BEP has been negotiating solely with the
independent members of the TERP and GLBL boards rather than the SunEdison Class B
shareholders. In our view this is because the TERP board has control over the data room and if BEP
is going to be able to make a bid it needs access to this data in order to complete its due diligence.
SunEdison Class B shareholders don’t have direct access or the direct ability to provide access to
TERP’s data.
Which transaction is most likely and why?
In our view, Brookfield would prefer to acquire 100% of both TERP and GLBL. Full ownership
gives them full control of the assets to reorganize and optimize from a financial and tax perspective.
Ultimately, however, Brookfield wants to be successful at acquiring a controlling stake in these assets
at an attractive price. Should acquiring 50.1% and leaving the yieldcos extant allow Brookfield to avoid
major hurdles to completing a deal, we think they will pursue that tactic. Should public shareholders
feel the offer price is not fair value, Brookfield can simply allow these shareholders to retain their
shares. Importantly, this allows the Board of Directors to fulfil its fiduciary duty, as only those
shareholders that feel the offer is fair need tender their shares, making the approval of such a
transaction easier.
Macquarie Research Brookfield Renewable
1 February 2017 10
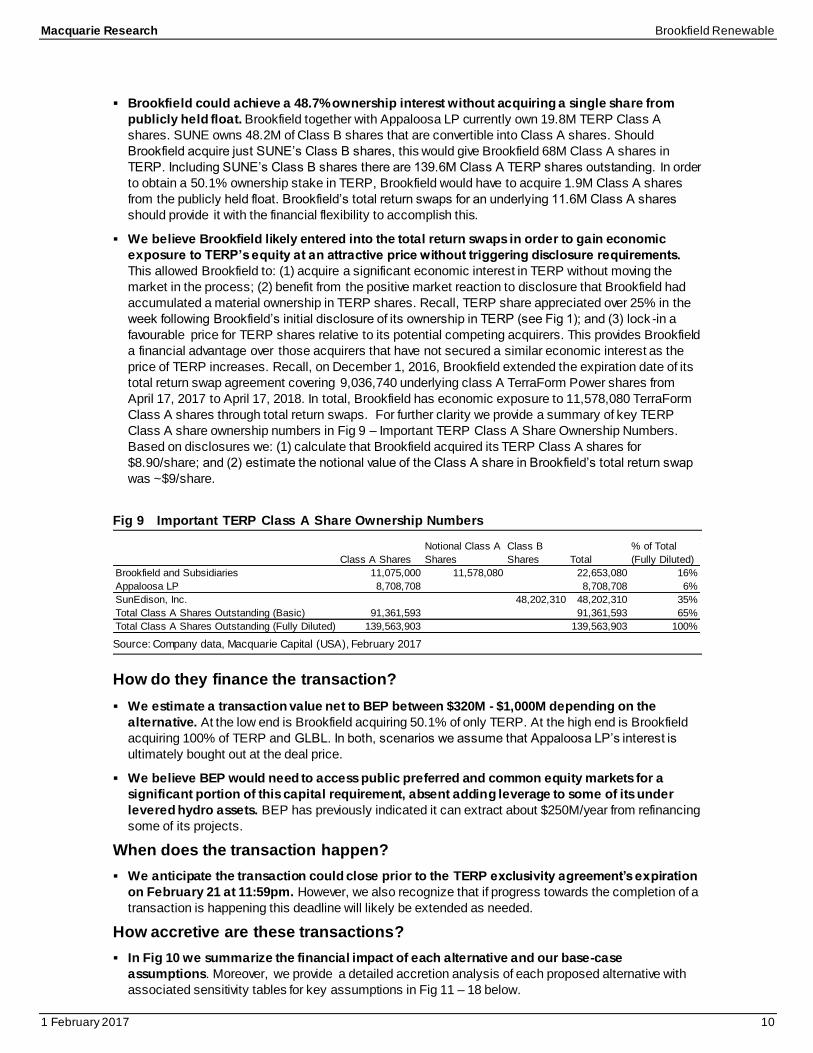
Brookfield could achieve a 48.7% ownership interest without acquiring a single share from
publicly held float. Brookfield together with Appaloosa LP currently own 19.8M TERP Class A
shares. SUNE owns 48.2M of Class B shares that are convertible into Class A shares. Should
Brookfield acquire just SUNE’s Class B shares, this would give Brookfield 68M Class A shares in
TERP. Including SUNE’s Class B shares there are 139.6M Class A TERP shares outstanding. In order
to obtain a 50.1% ownership stake in TERP, Brookfield would have to acquire 1.9M Class A shares
from the publicly held float. Brookfield’s total return swaps for an underlying 11.6M Class A shares
should provide it with the financial flexibility to accomplish this.
We believe Brookfield likely entered into the total return swaps in order to gain economic
exposure to TERP’s equity at an attractive price without triggering disclosure requirements.
This allowed Brookfield to: (1) acquire a significant economic interest in TERP without moving the
market in the process; (2) benefit from the positive market reaction to disclosure that Brookfield had
accumulated a material ownership in TERP shares. Recall, TERP share appreciated over 25% in the
week following Brookfield’s initial disclosure of its ownership in TERP (see Fig 1); and (3) lock -in a
favourable price for TERP shares relative to its potential competing acquirers. This provides Brookfield
a financial advantage over those acquirers that have not secured a similar economic interest as the
price of TERP increases. Recall, on December 1, 2016, Brookfield extended the expiration date of its
total return swap agreement covering 9,036,740 underlying class A TerraForm Power shares from
April 17, 2017 to April 17, 2018. In total, Brookfield has economic exposure to 11,578,080 TerraForm
Class A shares through total return swaps. For further clarity we provide a summary of key TERP
Class A share ownership numbers in Fig 9 – Important TERP Class A Share Ownership Numbers.
Based on disclosures we: (1) calculate that Brookfield acquired its TERP Class A shares for
$8.90/share; and (2) estimate the notional value of the Class A share in Brookfield’s total return swap
was ~$9/share.
Fig 9 Important TERP Class A Share Ownership Numbers
Source: Company data, Macquarie Capital (USA), February 2017
How do they finance the transaction?
We estimate a transaction value net to BEP between $320M - $1,000M depending on the
alternative. At the low end is Brookfield acquiring 50.1% of only TERP. At the high end is Brookfield
acquiring 100% of TERP and GLBL. In both, scenarios we assume that Appaloosa LP’s interest is
ultimately bought out at the deal price.
We believe BEP would need to access public preferred and common equity markets for a
significant portion of this capital requirement, absent adding leverage to some of its under
levered hydro assets. BEP has previously indicated it can extract about $250M/year from refinancing
some of its projects.
When does the transaction happen?
We anticipate the transaction could close prior to the TERP exclusivity agreement’s expiration
on February 21 at 11:59pm. However, we also recognize that if progress towards the completion of a
transaction is happening this deadline will likely be extended as needed.
How accretive are these transactions?
In Fig 10 we summarize the financial impact of each alternative and our base-case
assumptions. Moreover, we provide a detailed accretion analysis of each proposed alternative with
associated sensitivity tables for key assumptions in Fig 11 – 18 below.
Class A Shares
Notional Class A
Shares
Class B
Shares Total
% of Total
(Fully Diluted)
Brookfield and Subsidiaries 11,075,000 11,578,080 22,653,080 16%
Appaloosa LP 8,708,708 8,708,708 6%
SunEdison, Inc. 48,202,310 48,202,310 35%
Total Class A Shares Outstanding (Basic) 91,361,593 91,361,593 65%
Total Class A Shares Outstanding (Fully Diluted) 139,563,903 139,563,903 100%

Macquarie Research Brookfield Renewable
1 February 2017 11
Fig 10 Summary of Proposed Acquisition Alternatives by Brookfield Under Base Case Assumptions
Source: Company Reports, Macquarie Capital (USA), February 2017
Summary of Proposal
Alternatives (using base case
assumptions) (2) - (6)
Transaction Cost
(mlns USD)
Equity Funding
(mlns USD)
DCPS Accretion
($)
DCPS Accretion
(%)
EBITDA/share
Accretion ($)
EBITDA/share
Accretion (%)
BEP 2017E
EBITDA (mlns
USD) (1)
100% of TERP - $11.50/share $2,690 $642 $0.04 2.0% $0.21 3.7% $1,937
100% of TERP and GLBL for
$12.50 and $4.35 per share
respectively $3,409 $852 $0.13 5.7% $0.32 5.5% $2,013
50.1% of TERP and replace
SunEdison, Inc. (SUNE) as
sponsor for $11.50/share $1,347 $322 $0.01 0.6% $0.10 1.8% $1,838
50.1% of TERP and GLBL and
replace SUNE as sponsor for
$12.50 and $4.25
respectively. $1,704 $426 $0.05 2.2% $0.15 2.6% $1,873
(1) This combines BEP's EBITDA with that of the acquired assets and assumes the potenital transaction is effective as at January 1, 2017
(2) maximum 25% equity financing after assumption of debt(3) All cash on hand is used to reduce debt before close of the transaction
(4) For 100% acquired entities the removal of public issuer costs results in $15M/company
(5) For all transactions operating, finance, and tax efficiencies will result in $10M/company of savings
(6) Per share transaction price will equal price disclosed in each alternative (ie. No adjustment made post due diligence)
(7) We have adjusted estimates to reflect the announced agreement to sell TERP's 365MW portfolio of UK solar assets for $580M

Macquarie Research Brookfield Renewable
1 February 2017 12
Fig 11 BEP-TERP 100% Takeover Analysis (USD$ mlns., except where otherwise indicated)
Source: Company reports, Bloomberg, Macquarie Capital (USA), February 2017
Fig 12 Sensitivity Analysis (shaded areas represent scenarios that are not accretive)
Source: Company reports, Bloomberg, Macquarie Capital (USA), February 2017
Transaction Assumptions
Year 2017 Assumed equity component 25%
Interest rate - debt 4.0%
Tax rate 38%
BEP Ownership Percentage 40%
Percentage Of Target Acquired 100%
Transaction BEP TERP Comment Adjust Proforma
Stock Price (USD$/share) 30.22 11.50 30.22
Shares O/S (#M) 299 56
Current market cap 9,036 642
Takeout premium 0% Cash on hand 0
Purchase price 642 New Equity 642 9,678
Preferred shares 578 - 578
NCI 5,194 690 5,884
Net Debt 9,564 1,357 New net debt - 10,921
EV 24,372 2,690 27,061
Acretion Analysis
2017E Distributable Cash 686 52 Cost synergies 10 748
2017E Shares outstanding 304 56 (higher)/lower debt costs - 325
2017E DCPS 2.25 0.94 New shares issued (# M) 21.24 2.30
2017E EBITDA 1,746 181 1,937
2017E EBITDA per share 5.74 3.24 5.95
(1) The stock price for TERP is BEP's offer price. BEP's stock price is as of the close January 31st, 2017.
DCPS Accretion Cash on Hand EBITDAPS Accretion Cash on Hand
0.04 $0 $100 $200 $300 0.21 $0 $100 $200 $300
$0 $0.013 $0.021 $0.028 $0.036 $0 $0.182 $0.182 $0.182 $0.182
$5 $0.029 $0.036 $0.044 $0.051 $5 $0.197 $0.197 $0.197 $0.197
$10 $0.044 $0.052 $0.059 $0.067 $10 $0.212 $0.212 $0.212 $0.212
$15 $0.059 $0.067 $0.075 $0.082 $15 $0.228 $0.228 $0.228 $0.228
$20 $0.075 $0.082 $0.090 $0.098 $20 $0.243 $0.243 $0.243 $0.243
DCPS Accretion Takeout Premium EBITDAPS Accretion Takeout Premium
0.04 0% 5% 10% 20.0% 0.21 0% 5% 10% 20.0%
15% $0.082 $0.079 $0.076 $0.069 15% $0.360 $0.357 $0.354 $0.348
20% $0.061 $0.057 $0.054 $0.047 20% $0.276 $0.272 $0.268 $0.260
25% $0.044 $0.036 $0.032 $0.024 25% $0.212 $0.193 $0.184 $0.175
30% $0.044 $0.036 $0.029 $0.014 30% $0.212 $0.193 $0.174 $0.136
35% $0.044 $0.036 $0.029 $0.014 35% $0.212 $0.193 $0.174 $0.136
Co
st
Syn
erg
ies
Co
st
Syn
erg
ies
Eq
uit
y
Fin
an
cin
g
Eq
uit
y
Fin
an
cin
g

Macquarie Research Brookfield Renewable
1 February 2017 13
Fig 13 BEP-TERP-GLBL 100% Takeover Analysis (USD$ mlns., except where otherwise indicated)
Source: Company reports, Bloomberg, Macquarie Capital (USA), February 2017
Fig 14 Sensitivity Analysis (shaded areas represent scenarios that are not accretive)
Source: Company reports, Bloomberg, Macquarie Capital (USA), February 2017
Transaction Assumptions
Year 2017 Assumed equity component 25%
Interest rate - debt 4.0%
Tax rate 38%
BEP Ownership Percentage 40%
Percentage Of Target Acquired 100%
Transaction BEP TERP GLBL TERP & GLBL Comment Adjust Proforma
Stock Price (USD$/share) (1) 30.22 12.50 4.35 30.22
Shares O/S (#M) 299 56 70
Current market cap 9,036 698 304
Takeout premium 0% 0% Cash on hand 0
Purchase price 698 304 1,001 New Equity 852 9,888
Preferred shares 578 - - - 578
NCI 5,194 690 189 880 6,074
Net Debt 9,564 1,357 170 1,527 New net debt 149 11,240
EV 24,372 2,745 663 3,409 27,780
Acretion Analysis
2017E Distributable Cash 686 52 38 90 Cost synergies 20 792
2017E Shares outstanding 304 56 70 (higher)/lower debt costs (4) 332
2017E DCPS 2.25 0.94 0.54 New shares issued (# M) 28.20 2.38
2017E EBITDA 1,746 181 66 247 2,013
2017E EBITDA per share 5.74 3.24 0.95 6.054
(1) The stock price for TERP and GLBL is BEP's offer price. BEP's stock price is as of the close January 31st, 2017.
DCPS Accretion Cash on Hand EBITDAPS Accretion Cash on Hand
0.13 $0 $100 $200 $300 0.32 $0 $100 $200 $300
$0 $0.069 $0.076 $0.084 $0.091 $0 $0.256 $0.256 $0.256 $0.256
$5 $0.084 $0.091 $0.099 $0.106 $5 $0.271 $0.271 $0.271 $0.271
$10 $0.099 $0.107 $0.114 $0.121 $10 $0.286 $0.286 $0.286 $0.286
$15 $0.114 $0.122 $0.129 $0.136 $15 $0.301 $0.301 $0.301 $0.301
$20 $0.129 $0.137 $0.144 $0.152 $20 $0.317 $0.317 $0.317 $0.317
DCPS Accretion Takeout Premium EBITDAPS Accretion Takeout Premium
0.13 0% 5% 10% 20% 0.32 0% 5% 10% 20%
15% $0.187 $0.181 $0.176 $0.166 15% $0.529 $0.524 $0.519 $0.510
20% $0.157 $0.152 $0.146 $0.135 20% $0.421 $0.415 $0.409 $0.396
25% $0.129 $0.123 $0.118 $0.106 25% $0.317 $0.309 $0.301 $0.286
30% $0.105 $0.096 $0.090 $0.078 30% $0.228 $0.207 $0.198 $0.181
35% $0.105 $0.094 $0.082 $0.060 35% $0.228 $0.199 $0.170 $0.113
Co
st
Syn
erg
ies
Co
st
Syn
erg
ies
Eq
uit
y
Fin
an
cin
g
Eq
uit
y
Fin
an
cin
g

Macquarie Research Brookfield Renewable
1 February 2017 14
Fig 15 BEP-TERP 50.1% Takeover Analysis (USD$ mlns., except where otherwise indicated)
Source: Company reports, Bloomberg, Macquarie Capital (USA), February 2017
Fig 16 Sensitivity Analysis (shaded areas represent scenarios that are not accretive)
Source: Company reports, Bloomberg, Macquarie Capital (USA), February 2017
Transaction Assumptions
Year 2017 Assumed equity component 25%
Interest rate - debt 4.0%
Tax rate 38%
BEP Ownership Percentage 40%
Percentage Of Target Acquired 50.1%
Transaction BEP TERP Comment Adjust Proforma
Stock Price (USD$/share) 30.22 11.50 30.22
Shares O/S (#M) 299 28
Current market cap 9,036 322
Takeout premium 0% Cash on hand 0
Purchase price 322 New Equity 321.61 9,358
Preferred shares 578 - 578
NCI 5,194 345.9 5,540
Net Debt 9,564 680 New net debt - 10,244
EV 24,372 1,347 25,719
Acretion Analysis
2017E Distributable Cash 686 26 Cost synergies 2 714.07
2017E Shares outstanding 304 28 (higher)/lower debt costs - 315
2017E DCPS 2.25 0.94 New shares issued (# M) 10.64 2.27
2017E EBITDA 1,746 91 1,838
2017E EBITDA per share 5.74 3.24 5.84
(1) The stock price for TERP is BEP's offer price. BEP's stock price is as of the close January 31st, 2017.
DCPS Accretion Cash on Hand EBITDAPS Accretion Cash on Hand
0.01 $0 $50 $100 $150 0.10 $0 $50 $100 $150
$0 $0.007 $0.011 $0.015 $0.019 $0 $0.094 $0.094 $0.094 $0.094
$2 $0.013 $0.017 $0.021 $0.025 $2 $0.100 $0.100 $0.100 $0.100
$4 $0.020 $0.023 $0.027 $0.031 $4 $0.107 $0.107 $0.107 $0.107
$6 $0.026 $0.030 $0.034 $0.038 $6 $0.113 $0.113 $0.113 $0.113
$10 $0.039 $0.043 $0.046 $0.050 $10 $0.126 $0.126 $0.126 $0.126
DCPS Accretion Takeout Premium EBITDAPS Accretion Takeout Premium
0.01 0% 5% 10% 20% 0.10 0% 5% 10% 20%
15% $0.033 $0.031 $0.029 $0.026 15% $0.175 $0.173 $0.172 $0.169
20% $0.022 $0.020 $0.018 $0.014 20% $0.133 $0.131 $0.129 $0.125
25% $0.013 $0.009 $0.007 $0.003 25% $0.100 $0.091 $0.086 $0.081
30% $0.013 $0.009 $0.006 -$0.002 30% $0.100 $0.091 $0.081 $0.061
35% $0.013 $0.009 $0.006 -$0.002 35% $0.100 $0.091 $0.081 $0.061
Co
st
Syn
erg
ies
Co
st
Syn
erg
ies
Eq
uit
y
Fin
an
cin
g
Eq
uit
y
Fin
an
cin
g

Macquarie Research Brookfield Renewable
1 February 2017 15
Fig 17 BEP-TERP-GLBL 50.1% Takeover Analysis (USD$ mlns., except where otherwise indicated)
Source: Company reports, Bloomberg, Macquarie Capital (USA), February 2017
Fig 18 Sensitivity Analysis (shaded areas represent scenarios that are not accretive)
Source: Company reports, Bloomberg, Macquarie Capital (USA), February 2017
Transaction Assumptions
Year 2017 Assumed equity component 25%
Interest rate - debt 4.0%
Tax rate 38%
BEP Ownership Percentage 40%
Percentage Of Target Acquired 50.1%
Transaction BEP TERP GLBL TERP & GLBL Comment Adjust Proforma
Stock Price (USD$/share) 30.22 12.50 4.25 30.22
Shares O/S (#M) 299 28 35
Current market cap 9,036 350 149
Takeout premium 0% 0% Cash on hand 0
Purchase price 350 149 498 New Equity 426 9,462
Preferred shares 578 - - - 578
NCI 5,194 346 95 441 5,635
Net Debt 9,564 680 85 765 New net debt 72 10,401
EV 24,372 1,375 329 1,704 26,076
Acretion Analysis
2017E Distributable Cash 686 26 19 45 Cost synergies 4 733.32
2017E Shares outstanding 304 28 35 (higher)/lower debt costs (2) 318
2017E DCPS 2.25 0.94 0.54 New shares issued (# M) 14.10 2.30
2017E EBITDA 1,746 91 33 124 1,873
2017E EBITDA per share 5.74 3.24 0.95 5.88
DCPS Accretion Cash on Hand EBITDAPS Accretion Cash on Hand
0.05 $0 $50 $100 $150 0.15 $0 $50 $100 $150
$0 $0.036 $0.040 $0.044 $0.048 $0 $0.135 $0.135 $0.135 $0.135
$2 $0.043 $0.047 $0.051 $0.054 $2 $0.141 $0.141 $0.141 $0.141
$4 $0.049 $0.053 $0.057 $0.061 $4 $0.147 $0.147 $0.147 $0.147
$6 $0.055 $0.059 $0.063 $0.067 $6 $0.153 $0.153 $0.153 $0.153
$10 $0.068 $0.072 $0.076 $0.080 $10 $0.166 $0.166 $0.166 $0.166
DCPS Accretion Takeout Premium EBITDAPS Accretion Takeout Premium
0.05 0% 5% 10% 20% 0.15 0% 5% 10% 20%
15% $0.077 $0.076 $0.076 $0.074 15% $0.253 $0.253 $0.252 $0.251
20% $0.063 $0.062 $0.061 $0.060 20% $0.200 $0.199 $0.198 $0.196
25% $0.049 $0.048 $0.047 $0.046 25% $0.147 $0.146 $0.145 $0.143
30% $0.038 $0.036 $0.034 $0.032 30% $0.103 $0.099 $0.094 $0.090
35% $0.038 $0.036 $0.034 $0.030 35% $0.103 $0.099 $0.094 $0.086
Co
st
Syn
erg
ies
Co
st
Syn
erg
ies
Eq
uit
y
Fin
an
cin
g
Eq
uit
y
Fin
an
cin
g

Macquarie Research Brookfield Renewable
1 February 2017 16
Q4 Preview
Q4/16 Outlook: We forecast Q4/16 fund AFFOPU of $0.41, above consensus of $0.35 and Q4/15
AFFOPU of $0.27. Higher distributable cash Y/Y is largely due to cash flow contributions from the
1) stronger merchant power prices in the US and Ireland; 2) the full quarter contribution of Isagen; and
3) the increased contribution of the 151MW of wind assets in Ireland due to recent acquisitions; and
4) increased overall generation; partially offset by 1) weaker merchant power prices in Brazil and 2) a
stronger US dollar relative to other currencies where BEP operates.
See Fig 19 for a full summary of our Q4/16 estimates.
What to Expect in Q4
Acquisition and Development Pipeline: We expect management to provide colour on the progress
of these developments: (1) 127 MW of hydro and biomass development in Brazil (72 hydro, 55
biomass); (2) the full quarter contribution of Isagen; (3) the 43MW Ireland wind project development,
including the 19MW added in Q3/16; and (4) 100MW of hydro development projects in Brazil in early
stage development.
Recent Developments:
TERP and GLBL: The potential for BEP to acquire TERP and GLBL has been BEP’s most material
update this quarter. As we have outlined, this acquisition would be accretive if it were to go through.
See above for more detail.

Macquarie Research Brookfield Renewable
1 February 2017 17
Fig 19 Q4/2016 Expectations
Source: Company reports, and Macquarie

Macquarie Research Brookfield Renewable
1 February 2017 18
Macquarie Quant View
The quant model currently holds a marginally positive view on Brookfield
Renewable. The strongest style exposure is Valuations, indicating this stock
is under-priced in the market relative to its peers. The weakest style
exposure is Price Momentum, indicating this stock has had weak medium to
long term returns which often persist into the future.
Displays where the
company’s ranked based on
the fundamental consensus
Price Target and
Macquarie’s Quantitative
Alpha model.
Two rankings: Local market
(Canada) and Global sector
(Util ities)
194/433 Global rank in
Utilities % of BUY recommendations 60% (6/10)
Number of Price Target downgrades 0
Number of Price Target upgrades 5
Macquarie Alpha Model ranking Factors driving the Alpha Model
A list of comparable companies and their Macquarie Alpha model score
(higher is better).
For the comparable firms this chart shows the key underlying styles and their contribution
to the current overall Alpha score.
Macquarie Earnings Sentiment Indicator Drivers of Stock Return
The Macquarie Sentiment Indicator is an enhanced earnings revisions
signal that favours analysts who have more timely and higher conviction
revisions. Current score shown below.
Breakdown of 1 year total return (local currency) into returns from dividends, changes in
forward earnings estimates and the resulting change in earnings multiple.
What drove this Company in the last 5 years How it looks on the Alpha model
Which factor score has had the greatest correlation with the company’s
returns over the last 5 years.
A more granular view of the underlying style scores that drive the alpha (higher is better)
and the percentile rank relative to the sector and market.
Source (all charts): FactSet, Thomson Reuters, and Macquarie Research. For more details on the Macquarie Alpha model or for m ore customised analysis and screens, please contact the Macquarie Global Quantitative/Custom Products Group ([email protected])
Fu
nd
am
en
tals
Quant
Local market rank Global sector rank
Attractive
0.3
0.4
0.5
0.5
0.6
0.7
0.7
-3.0 -2.0 -1.0 0.0 1.0 2.0 3.0
Brookfield Renewable
SCANA Corporation
Aqua America
AES
American Water Works
Alliant Energy
CMS Energy
-100% -80% -60% -40% -20% 0% 20% 40% 60% 80% 100%
Brookfield Renewable
SCANA Corporation
Aqua America
AES
American Water Works
Alliant Energy
CMS Energy
Valuations Growth Profitability Earnings
Momentum
Price
Momentum
Quality
-0.7
0.5
0.5
-0.9
0.6
-1.2
0.3
-3.0 -2.0 -1.0 0.0 1.0 2.0 3.0
Brookfield Renewable
SCANA Corporation
Aqua America
AES
American Water Works
Alliant Energy
CMS Energy
-90% -40% 10% 60%
Brookfield Renewable
SCANA Corporation
Aqua America
AES
American Water Works
Alliant Energy
CMS Energy
Dividend Return Multiple Return Earnings Outlook 1Yr Total Return
-25%
-25%
-23%
-16%
19%
22%
23%
30%
-40% -20% 0% 20% 40%
⇐ Negatives Positives ⇒
Earnings Stability
3m Recom. Revisions
Return on Assets NTM
BPS Growth FY1
IRR Dividend Disc. Model
Piotroski Score
Price to Book NTM
Price to Book FY1
0 1
Technicals & TradingRisk
LiquidityCapital & Funding
QualityPrice Momentum
Earnings MomentumProfitability
Growth
ValuationAlpha Model Score
-0.56-0.28
-1.03 0.28
-0.22-0.26
0.00-0.15 0.07
0.18 0.29
0 1
Normalized
Score
0 50 100
Percentile relative
to sector(/433)
0 50 100
Percentile relative
to market(/430)

Macquarie Research Brookfield Renewable
1 February 2017 19
Important disclosures:
Recommendation definitions
Macquarie - Australia/New Zealand Outperf orm – return >3% in excess of benchmark return
Neutral – return within 3% of benchmark return Underperf orm – return >3% below benchmark return
Benchmark return is determined by long term nominal GDP growth plus 12 month f orward market div idend y ield
Macquarie – Asia/Europe Outperf orm – expected return >+10%
Neutral – expected return f rom -10% to +10% Underperf orm – expected return <-10%
Macquarie – South Africa Outperf orm – expected return >+10%
Neutral – expected return f rom -10% to +10% Underperf orm – expected return <-10%
Macquarie - Canada Outperf orm – return >5% in excess of benchmark return
Neutral – return within 5% of benchmark return Underperf orm – return >5% below benchmark return
Macquarie - USA Outperf orm (Buy ) – return >5% in excess of Russell 3000 index return
Neutral (Hold) – return within 5% of Russell 3000 index
return
Underperf orm (Sell)– return >5% below Russell 3000 index return
Volatility index definition*
This is calculated f rom the v olatility of historical price
mov ements.
Very high–highest risk – Stock should be expected
to mov e up or down 60–100% in a y ear – inv estors
should be aware this stock is highly speculativ e.
High – stock should be expected to mov e up or
down at least 40–60% in a y ear – inv estors should
be aware this stock could be speculativ e.
Medium – stock should be expected to mov e up or
down at least 30–40% in a y ear.
Low–medium – stock should be expected to mov e
up or down at least 25–30% in a y ear.
Low – stock should be expected to mov e up or down at least 15–25% in a y ear.
* Applicable to Asia/Australian/NZ/Canada stocks
only
Recommendations – 12 months
Note: Quant recommendations may dif f er from
Fundamental Analy st recommendations
Financial definitions
All "Adjusted" data items hav e had the f ollowing
adjustments made:
Added back: goodwill amortisation, prov ision f or catastrophe reserv es, IFRS deriv ativ es & hedging, IFRS
impairments & IFRS interest expense
Excluded: non recurring items, asset rev als, property rev als, appraisal v alue uplif t, pref erence div idends &
minority interests
EPS = adjusted net prof it / ef powa* ROA = adjusted ebit / av erage total assets
ROA Banks/Insurance = adjusted net prof it /av erage
total assets
ROE = adjusted net prof it / av erage shareholders f unds Gross cashflow = adjusted net prof it + depreciation
*equiv alent f ully paid ordinary weighted av erage number
of shares
All Reported numbers f or Australian/NZ listed stocks are
modelled under IFRS (International Financial Reporting
Standards).
Recommendation proportions – For quarter ending 31 December 2016
AU/NZ Asia RSA USA CA EUR Outperf orm 57.53% 50.72% 45.57% 42.28% 60.58% 52.79% (for global coverage by Macquarie, 8.71% of stocks followed are investment banking clients)
Neutral 33.90% 33.97% 43.04% 50.11% 37.23% 35.62% (for global coverage by Macquarie, 8.05% of stocks followed are investment banking clients) Underperf orm 8.56% 15.30% 11.39% 7.61% 2.19% 11.59% (for global coverage by Macquarie, 4.63% of stocks followed are investment banking clients)
BEP-U CN vs TSX, & rec history
(all f igures in CAD currency unless noted)
BEP US vs S&P 500, & rec history
(all f igures in USD currency unless noted)
TERP US vs S&P 500, & rec history
(all f igures in USD currency unless noted)
GLBL US vs S&P 500, & rec history
(all f igures in USD currency unless noted)
Note: Recommendation timeline – if not a continuous line, then there was no Macquarie coverage at the time or there was an embargo period.
Source: FactSet, Macquarie Capital (USA), February 2017
12-month target price methodology
BEP-U CN: C$43.00 based on a combination of 13.75x EV/2018E EBITDA and a 5.75% target yield on our 2018E dividend of $2.04/sh. methodology
BEP US: US$33.00 based on a DDM methodology
TERP US: US$14.00 based on a NAV methodology
GLBL US: US$4.00 based on a NAV methodology
Company-specific disclosures: TERP US: Macquarie Capital (USA) Inc. or one of its aff iliates, expects to receive or intends to seek compensation for investment banking services from Terraform Pow er Inc in the next three months. MACQUARIE CAPITAL (USA) INC or one of its aff iliates managed or co-managed a public offering of securities of TerraForm Pow er Inc in the past 24 months, for w hich it received compensation.

Macquarie Research Brookfield Renewable
1 February 2017 20
SUNE US: Macquarie Capital (USA) Inc. or one of its aff iliates, expects to receive or intends to seek compensation for investment banking services from Sunedison Inc in the next three months. MACQUARIE CAPITAL (USA) INC or one of its aff iliates managed or co-managed a public offering of securities of Sunedison Inc in the past 24 months, for w hich it received compensation. MACQUARIE CAPITAL (USA) INC or one of its aff iliates managed or co-managed a public offering of securities of SunEdison Inc in the past 24 months, for w hich it received compensation. TERP US: Macquarie Capital (USA) Inc. or one of its aff iliates, expects to receive or intends to seek compensation for investment banking services f rom Terraform Pow er Inc in the next three months. MACQUARIE CAPITAL (USA) INC or one of its aff iliates managed or co-managed a public offering of securities of TerraForm Pow er Inc in the past 24 months, for w hich it received compensation. Important disclosure information regarding the subject companies covered in this report is available at w ww.macquarie.com/research/disclosures.
Date Stock Code (BBG code) Recommendation Target Price 08-Aug-2016 BEP-U CN Outperform C$43.00 25-Jan-2016 BEP-U CN Outperform C$40.00
23-Feb-2015 BEP-U CN Outperform C$42.00 18-Sep-2014 BEP-U CN Outperform C$39.00
Target price risk disclosures: BEP-U CN: Risks to the dow nside include higher market interest rates, diff iculties in achieving increased eff iciencies, inflation of the value of potential M&A targets. Risks to the upside include low er market interest rates, increased pace of acquisitions driving faster growth in div idends. BEP US: Our US$33 TP is based on our DDM model w hich assumes a 6% discount rate and a 2% terminal grow th rate. Risks to the dow nside include higher market interest rates, diff iculties in achieving increased eff iciencies, inflation of the value of potential M&A targets. Risks to the upside include low er market interest rates, increased pace of acquisitions driving faster growth in dividends. TERP US: Our US$14.00 TP is based on run-rate CAFD of US$180m and a w ind-based multiple of 11x. Risks to the dow nside include inability to get a new sponsor and delever the balance sheet. GLBL US: GLBL's ongoing operations are vulnerable to w eaker than expected solar/wind/hydro resources in its operating geographies, as w ell as political/regulatory risk w ith regards to its contracts, and foreign exchange/inflation risk. GLBL's grow th is very capital intensive and is entirely dependent on the cost of and access to debt and equity f inancing.
Analyst certification: We hereby certify that all of the view s expressed in this report accurately reflect our personal views about the subject company or companies and its or their securities. We also certify that no part of our compensation w as, is or w ill be, directly or indirectly, related to the spec if ic recommendations or views
expressed in this report. The Analysts responsible for preparing this report receive compensation from Macquarie that is based upon various factors including Macquarie Group Ltd total revenues, a portion of w hich are generated by Macquarie Group’s Investment Banking activities. General disclaimers: Macquarie Securities (Australia) Ltd; Macquarie Capital (Europe) Ltd; Macquarie Capital Markets Canada Ltd; Macquarie Capital Markets North America Ltd;
Macquarie Capital (USA) Inc; Macquarie Capital Limited and Macquarie Capital Limited, Taiw an Securities Branch; Macquarie Capital Securities (Singapore) Pte Ltd; Macquarie Securities (NZ) Ltd; Macquarie Equities South Africa (Pty) Ltd; Macquarie Capital Securities (India) Pvt Ltd; Macquarie Capital Securities (Malaysia) Sdn Bhd; Macquarie Securities Korea Limited and Macquarie Securities (Thailand) Ltd are not authorized deposit-taking institutions for the purposes of the Banking Act 1959 (Commonw ealth of Australia), and their obligations do not represent deposits or other liabilities of Macquarie Bank Limited
ABN 46 008 583 542 (MBL) or MGL. MBL does not guarantee or otherw ise provide assurance in respect of the obligations of any of the above mentioned entities. MGL provides a guarantee to the Monetary Authority of Singapore in respect of the obligations and liabilities of Macquarie Capital Securities (Singapore) Pte Ltd for up to SGD 35 million. This research has been prepared for the general use of the w holesale clients of the Macquarie Group and must not be copied, either in w hole or in part, or distributed to any other person. If you are not the intended recipient you must not use or disclose the
information in this research in any w ay. If you received it in error, please tell us immediately by return e-mail and delete the document. We do not guarantee the integrity of any e-mails or attached files and are not responsible for any changes made to them by any other person. MGL has established and implemented a conflicts policy at group level (w hich may be revised and updated from time to time) (the "Conflicts Policy") pursuant to regulatory
requirements (including the FCA Rules) w hich sets out how we must seek to identify and manage all material conflicts of interest. Nothing in this research shall be construed as a solicitation to buy or sell any security or product, or to engage in or refrain from engaging in any transaction. In preparing this research, we did not take into account your investment objectives, f inancial situation or particular needs. Macquarie salespeople, traders and other professionals may provide oral or w ritten market commentary or trading strategies to our clients that reflect opinions w hich are contrary to the opinions
expressed in this research. Macquarie Research produces a variety of research products including, but not limited to, fundamental analysis, macro-economic analysis, quantitative analysis, and trade ideas. Recommendations contained in one type of research product may differ from r ecommendations contained in other types of research, whether as a result of differing time horizons, methodologies, or otherw ise. Before making an investment decision on the basis of this research, you need to consider, w ith or without the assistance of an adviser, whether the advice is appropriate in light of your particular investment
needs, objectives and f inancial circumstances. There are risks involved in securities trading. The price of securities can and does f luctuate, and an individual security may even become valueless. International investors are reminded of the additional risks inherent in international investments, such as currency f luctuations and international stock market or economic conditions, w hich may adversely affect the value of the investment. This research is based on information obtained from sources believed to be reliable but w e do not make any representation or w arranty that it is accurate, complete or up to date. We
accept no obligation to correct or update the information or opinions in it. Opinions expressed are subject to change w ithout notice. No member of the Macquarie Group accepts any liability w hatsoever for any direct, indirect, consequential or other loss arising from any use of this research and/or further communication in relation to this research. Clients should contact analysts at, and execute transactions through, a Macquarie Group entity in their home jurisdiction unless governing law permits otherw ise. The date and timestamp for above share price and market cap is the closed price of the price date.
#CLOSE is the f inal price at w hich the security is traded in the relevant exchange on the date indicated. Country-specific disclaimers: Australia: In Australia, research is issued and distributed by Macquarie Securities (Australia) Ltd (AFSL No. 238947), a participating organisation of the
Australian Securities Exchange. New Zealand: In New Zealand, research is issued and distributed by Macquarie Securities (NZ) Ltd, a NZX Firm. Canada: In Canada, research is prepared, approved and distributed by Macquarie Capital Markets Canada Ltd, a participating organisation of the Toronto Stock Exchange, TSX Venture Exchange & Montréal Exchange. Macquarie Capital Markets North America Ltd., w hich is a registered broker-dealer and member of FINRA, accepts responsibility for the contents of reports issued by Macquarie Capital Markets Canada Ltd in the United States and sent to US persons. Any
US person w ishing to effect transactions in the securities described in the reports issued by Macquarie Capital Markets Canada Ltd should do so w ith Macquarie Capital Markets North America Ltd. The Research Distribution Policy of Macquarie Capital Markets Canada Ltd is to allow all clients that are entitled to have equal access to our research. United Kingdom: In the United Kingdom, research is issued and distributed by Macquarie Capital (Europe) Ltd, w hich is authorised and regulated by the Financial Conduct Authority (No. 193905). Germany: In Germany, this research is issued and/or distributed by
Macquarie Capital (Europe) Limited, Niederlassung Deutschland, w hich is authorised and regulated by the UK Financial Conduct Authority (No. 193905). and in Germany by BaFin. France : In France, research is issued and distributed by Macquarie Capital (Europe) Ltd, w hich is authorised and regulated in the United Kingdom by the Financial Conduct Authority (No. 193905). Hong Kong & Mainland China: In Hong Kong, research is issued and distributed by Macquarie Capital Limited, w hich is licensed and regulated by the Securities and Futures Commission. In Mainland China, Macquarie Securities (Australia)
Limited Shanghai Representative Office only engages in non-business operational activities excluding issuing and distributing research. Only non-A share research is distributed into Mainland China by Macquarie Capital Limited. Japan: In Japan, research is Issued and distributed by Macquarie Capital Securities (Japan) Limited, a member of the Tokyo Stock Exchange, Inc. and Osaka Exchange, Inc. (Financial Instruments Firm, Kanto Financial Bureau
(kin-sho) No. 231, a member of Japan Securities Dealers Association). India: In India, research is issued and distributed by Macquarie Capital Securities (India) Pvt. Ltd. (CIN: U65920MH1995PTC090696), 92, Level 9, 2 North Avenue, Maker Maxity, Bandra Kurla Complex, Bandra (East), Mumbai – 400 051, India, w hich is a SEBI registered Research Analyst having registration no. INH000000545. Malaysia: In Malaysia, research is issued and distributed by Macquarie Capital Securities (Malaysia) Sdn. Bhd. (Company registration number: 463469-W) w hich is a Participating Organisation of Bursa Malaysia

Macquarie Research Brookfield Renewable
1 February 2017 21
Berhad and a holder of Capital Markets Services License issued by the Securities Commission. Taiwan: In Taiw an, research is issued and distributed by
Macquarie Capital Limited, Taiw an Securities Branch, w hich is licensed and regulated by the Financial Supervisory Commission. No portion of the report may be reproduced or quoted by the press or any other person w ithout authorisation from Macquarie. Nothing in this research shall be construed as a solicitation to buy or sell any security or product. The recipient of this report shall not engage in any activities w hich may give rise to potential conflicts of interest to the report. Research Associate(s) in this report w ho are registered as Clerks only assist in the preparation of research and are not engaged in
w riting the research. Thailand: In Thailand, research is produced, issued and distributed by Macquarie Securities (Thailand) Ltd. Macquarie Securities (Thailand) Ltd. is a licensed securities company that is authorized by the Ministry of Finance, regulated by the Securities and Exchange Commission of Thailand and is an exchange member of the Stock Exchange of Thailand. The Thai Institute of Directors Association has disclosed the Corporate
Governance Report of Thai Listed Companies made pursuant to the policy of the Securities and Exchange Commission of Thailand. Macquarie Securities (Thailand) Ltd does not endorse the result of the Corporate Governance Report of Thai Listed Companies but this Report can be accessed at: http://www.thai-iod.com/en/publications.asp?type=4. South Korea: In South Korea, unless otherw ise stated, research is prepared, issued and distributed by Macquarie Securities Korea Limited, w hich is regulated by the Financial Supervisory Services. Information on analysts in MSKL is disclosed at
http://dis.kofia.or.kr/websquare/index.jsp?w2xPath=/wq/fundMgr/DISFundMgrAnalystStut.xml&divisionId=MDIS03002001000000&serviceId=SDIS03002001000. South Africa: In South Africa, research is issued and distributed by Macquarie Equities South Africa (Pty) Ltd, a member of the JSE Limited. Singapore: In Singapore, research is issued and distributed by Macquarie Capital Securities (Singapore) Pte Ltd (Company Registration Number: 198702912C), a Capital Markets Services license holder under the Securities and Futures Act to deal in securities and provide custodial services in
Singapore. Pursuant to the Financial Advisers (Amendment) Regulations 2005, Macquarie Capital Securities (Singapore) Pte Ltd is exempt from complying w ith sections 25, 27 and 36 of the Financial Advisers Act. All Singapore-based recipients of research produced by Macquarie Capital (Europe) Limited, Macquarie Capital Markets Canada Ltd, Macquarie Equities South Africa (Pty) Ltd and Macquarie Capital (USA) Inc. represent and w arrant that they are institutional investors as defined in the Securities and Futures Act. United States: In the United States, research is issued and distributed by Macquarie
Capital (USA) Inc., w hich is a registered broker-dealer and member of FINRA. Macquarie Capital (USA) Inc, accepts responsibility for the content of each research report prepared by one of its non-US aff iliates when the research report is distributed in the United States by Macquarie Capital (USA) Inc. Macquarie Capital (USA) Inc.’s aff iliate’s analysts are not registered as research analysts with FINRA, may not be associated persons of Macquarie Capital
(USA) Inc., and therefore may not be subject to FINRA rule restrictions on communications w ith a subject company, public appearances, and trading securities held by a research analyst account. Information regarding futures is provided for reference purposes only and is not a solicitation for purchases or sales of futures. Any persons receiving this report directly from Macquarie Capital (USA) Inc. and w ishing to effect a transaction in any security described herein should do so w ith Macquarie Capital (USA) Inc. Important disclosure information regarding the subject companies covered in this report is available
at www.macquarie.com/research/disclosures, or contact your registered representative at 1-888-MAC-STOCK, or w rite to the Supervisory Analysts, Research Department, Macquarie Securities, 125 W.55th Street, New York, NY 10019. © Macquarie Group

Research Heads of Equity Research
Peter Redhead (Global - Head) (852) 3922 4836 Christine Farkas (US) (1 212) 231 6668 Greg MacDonald (Canada) (1 416) 628 3934
Consumer
Chad Beynon (Head of US Consumer) (1 212) 231 2634 Bob Summers (New York) (1 212) 231 1072 Laurent Vasilescu (New York) (1 212) 231 8046
Emerging Leaders – Consumer Discretionary
Matthew Brooks (New York) (1 212) 231 1585
Autos
Takuo Katayama (New York) (1 212) 231 1757
Energy
Oil & Gas
Vikas Dwivedi (Head of Oil & Gas, Global Energy Strategist) (1 713) 275 6352 Iain Reid (London) (44 20) 3037 2119
US Exploration & Production
Paul Grigel (Denver) (1 303) 952 2754
US Refining
Vikas Dwivedi (Head of Oil & Gas, Global Energy Strategist) (1 713) 275 6352
Oilfield Services
Walt Chancellor (Houston) (1 713) 275 6230
International/Canadian Oil & Gas Producers
Brian Bagnell (Calgary) (1 403) 539 8540 Brian Kristjansen (Calgary) (1 403) 539 8508 Tom Hems (Calgary) (1 403) 218 6666
Energy Infrastructure
David Noseworthy (New York) (1 212) 231 6681
Financials
Banks/Trust Banks
David Konrad (New York) (1 212) 231 0525 John Moran (Denver) (1 212) 231 0662 Jason Bilodeau (Toronto) (1 416) 848 3687
Regional Brokerage/Debt Collection
Hugh Miller (New York) (1 212) 231 2323
Financials
Property & Casualty Insurance
Amit Kumar (New York) (1 212) 231 8013
Industrials
Building Products
Adam Baumgarten (New York) (1 212) 231 0633
Business Services
Hamzah Mazari (New York) (1 212) 231 2442
Chemicals
Cooley May (Head of US Basics & Industrials) (1 212) 231 2586
Diversified Industrials
Jamie Clement (New York) (1 212) 231 0452 Michael Glen (Montreal) (1 514) 905 3636
Construction & Engineering/Machinery
Sameer Rathod (San Francisco) (1 415) 762 5034 John D’Angelo (Boca Raton) (1 415) 732 5038
Paper & Packaging
Danny Moran (New York) (1 212) 231 0698
Transports
Konark Gupta (Toronto) (1 416) 848 3539
Materials
Steel & Metals
Aldo Mazzaferro (New York) (1 212) 231 0693
Emerging Leaders – Basic Materials
Anthony Young (Boca Raton) (1 212) 231 2612
Global Metals & Mining
Michael Siperco (Toronto) (1 416) 848 3520 Matt Murphy (Toronto) (1 416) 848 3541 Michael Gray (Vancouver) (1 604) 639 6372
Technology
Gus Papageorgiou (Toronto) (1 416) 848 3512
TMET
Telecommunications
Amy Yong (New York) (1 212) 231 2624 Greg MacDonald (Toronto) (1 416) 628 3934
Cable, Satellite & Entertainment
Amy Yong (New York) (1 212) 231 2624 Andrew DeGasperi (New York) (1 212) 231 0649
Internet
Ben Schachter (New York) (1 212) 231 0644 Tom White (New York) (1 212) 231 0643
Media & Entertainment
Tim Nollen (New York) (1 212) 231 0635
Software
Sarah Hindlian (New York) (1 212) 231 1371
Utilities & Alternative Energy
Angie Storozynski (Head of US Utilities & Alternative Energy) (1 212) 231 2569 Andrew Weisel (New York) (1 212) 231 1159 James Ward (New York) (1 212) 231 0707 David Noseworthy (New York) (1 212) 231 6681
Commodities & Precious Metals
Colin Hamilton (Global) (44 20) 3037 4061 Jim Lennon (London) (44 20) 3037 4271
Economics and Strategy
David Doyle (Toronto) (1 416) 848 3663
Quantitative Analysis
Gurvinder Brar (Mumbai) (9197) 8055 5902 Steve Gao (London) (44 20) 3037 2765 Giuliano De Rossi (London) (44 20) 3037 1997
Find our research at
Macquarie: www.macquarieresearch.com/ideas/
Thomson: www.thomson.com/financial
Reuters: www.knowledge.reuters.com
Bloomberg: MAC GO
Factset: http://www.factset.com/home.aspx
CapitalIQ www.capitaliq.com
Contact [email protected] for access requests.
Email addresses
Equities Head of Global Cash Equities
Mark Duncan (852) 3922 5888
Head of US Equities
Robert Ansell (New York) (1 212) 231 0888
Head of Canadian Equities
David Washburn (Toronto) (1 416) 848 3631
Sales US Sales
Khristina McLaughlin (New York) (1 212) 231 8012 Jeff Evans (Boston) (1 617) 598 2508 Lisa Sowell (Atlanta) (1 212) 231 1787 Simon Barrington (London) (44 20) 3037 4927 Troy Pilalas (San Francisco) (1 415) 762 5025
Canada Sales
David Ricciardelli (Toronto) (1 416) 572 7150
Trading US Sales Trading
J.T. Cacciabaudo (New York) (1 212) 231 6381
Canada Trading
Perry Catellier (Co-head, Toronto) (1 416) 848 3619
Michael O'Rourke (Co-head, Toronto) (1 416) 848 3633
International Sales Trading
Mike Gray (New York) (1 212) 231 0928
This publication was disseminated on 01 February 2017 at 16:19 UTC.