Embed Size (px)
Citation preview

Canada’s international investment position: benefits and potential VulnerabilitiesGabriel Bruneau, Maxime Leboeuf and Guillaume Nolin
� In recent decades, international investment positions have increased faster than gross domestic product in Canada and internationally. This increase is the result of the significant growth of gross capital flows between countries.
� Greater global financial integration is beneficial and important for Canada, partly because access to global financial markets can help mitigate the impact of adverse economic shocks. Valuation effects were instrumental in softening the impact of the 2014–15 oil price shock on the Canadian economy.
� In certain circumstances, however, foreign capital inflows can also faci-litate the buildup of domestic vulnerabilities, such as high indebtedness. Shocks that heighten uncertainty or risk aversion have the potential to trigger a destabilizing reversal of these foreign inflows.
� Canada’s current international investment position is typical of advanced economies and will likely continue to act as an economic stabilizer. However, the strong growth of external portfolio debt liabilities since the 2008–09 global financial crisis warrants ongoing monitoring and analysis.
IntroductionInternational economic and financial linkages are important determinants of an economy’s level of activity and income, as well as its financial stability. These linkages are particularly important for the Canadian economy and other open economies that are dependent on international trade and access to international capital markets.
A country’s international financial linkages are reflected in its international investment position (IIP) statement. The IIP provides the value and compos-ition of the foreign assets owned by a country’s residents (external assets) as well as ownership of domestic assets by foreigners (external liabilities), which can be in the form of foreign direct investment (FDI), portfolio equity, portfolio debt securities and other types of assets, such as loans and deposits. Monitoring the IIP over time allows both gross and net financial flows to be tracked (Box 1).
CAnAdA’S inteRnAtionAl inVeStment poSition: beneFitS And potentiAl VulneRAbilitieS 43 BANK OF CANADA • FINANCIAL SySTEM REVIEw • JuNE 2017

In the face of most adverse domestic economic shocks, the IIP acts as a stabilizer as foreign financial flows and valuation effects help dampen the impact on consumption and investment. However, foreign financial inflows may also help facilitate a buildup of financial system vulnerabilities, for example, by fuelling an increase in leverage. Further, shocks that heighten uncertainty or risk aversion may lead to a reversal of these inflows, which could amplify the impact of the initial shocks. We analyze developments in Canada’s IIP since the 2008–09 global financial crisis and find that, while its stabilization role is still prominent, there are some potential emerging vulnerabilities.
International Investment Positions Have Grown SubstantiallyIIPs have grown rapidly in recent decades and are at historically high levels in many advanced economies, as measured by the ratio of external assets and liabilities to gross domestic product (GDP) (Chart 1). Increased trade openness, financial liberalization and a reduction in the cost of international investments have contributed to the growth in the IIPs of advanced econ-omies. This greater financial integration has brought important benefits to the global economy, notably a much greater ability to diversify risk.1
1 See Lane (2016) for a further discussion of trends, benefits and challenges of financial globalization.
Box 1
Key Defi nitionsThe net international investment position (𝑁𝐼𝐼𝑃)A country’s net international investment position (𝑁𝐼𝐼𝑃) is the diff erence between the value of a country’s external assets (𝐴) and external liabilities (𝐿):
𝑁𝐼𝐼𝑃 = 𝐴 − 𝐿
A country with a positive (negative) 𝑁𝐼𝐼𝑃 is a net creditor (debtor) to the rest of the world .
The current account balance (𝐶𝐴) consists of the trade balance (i .e ., net exports of goods and services), which is usually its biggest component, as well as net primary and net secondary investment income (𝑁𝐼𝐼𝑁𝐶), which includes interest payments, dividends, salaries and taxes:
𝐶𝐴 = Exports − Imports + 𝑁𝐼𝐼𝑁𝐶
The current account is fi nanced using the fi nancial account (𝐹𝐴), which is the net change in foreig n ownership of domestic assets and in domestic ownership of foreign assets .
𝐶𝐴 = −𝐹𝐴
The fi nancial account consists of foreign direct investment (𝐹𝐷𝐼), the acquisition of equity and debt, and changes in offi cial reserves . In other words, it is the measure of net
capital fl ows . The current account and the fi nancial account are the two largest components of the balance of payments .
Changes in the 𝑁𝐼𝐼𝑃 can be attributed to the country’s fi nancial account, to valuation eff ects (∆𝑉𝐴𝐿) and to some other negligible adjustments:
∆𝑁𝐼𝐼𝑃 = 𝐹𝐴 + ∆𝑉𝐴𝐿 + other
Valuation changes can be due to exchange rate movements, which aff ect the value of external assets and liabilities in domestic currency, or movements in asset prices (Box 2) .
Net and gross fl owsChanges in external assets and liabilities over time can be partly tied to gross and net fi nancial fl ows . Gross fi nancial fl ows are the purchases and sales of external assets and lia-bilities, while the net fi nancial fl ows represent the diff erence between the purchases and sales, i .e ., the fi nancial account balance . To make an analogy with trade, gross fl ows are to the net fl ows what total exports and imports are to the trade balance . For example, if Canadians purchase $1 of for-eign assets while foreigners acquire $1 of Canadian assets, external assets and liabilities increase by $1 each (gross fl ows) but the net fl ow is zero .
44 CAnAdA’S inteRnAtionAl inVeStment poSition: beneFitS And potentiAl VulneRAbilitieS BANK OF CANADA • FINANCIAL SySTEM REVIEw • JuNE 2017

The growth of IIPs has persisted since the end of the global financial crisis despite the fact that international trade and cross-border banking as shares of the global economy have been stable. This suggests that cross-border integration in financial markets is continuing, even if integration plateaued for the rest of the global economy and banking system after the crisis.
After a period of relative stagnation before the global financial crisis, Canada’s IIP has grown significantly relative to GDP; it is now close to that of the median of member countries of the Organisation for Economic Co-operation and Development (OECD). This growth partly reflects the rela-tive strength of the Canadian economy and financial system after the crisis, which facilitated investment abroad by Canadian firms and households and enhanced the attractiveness of Canadian assets to foreign investors.
The International Investment Position as a Stabilizing ForceA country’s net international investment position (NIIP)—the difference between external assets and external liabilities—plays an important role in adjustments to economic shocks. It represents the external portion of a country’s net wealth. Movements in the NIIP are driven by both the balance of payments and valuation effects (Box 1). These two factors are important stabilizers during negative domestic shocks.
For open economies with flexible exchange rates, the balance of payments helps dampen the impact of economic shocks. For example, the impact of a temporary adverse demand shock on aggregate spending can be smoothed by borrowing from abroad. In such a situation, domestic investment would exceed domestic saving, thereby creating a current account deficit.
While current account deficits (and the accompanying financial account surpluses) are often temporary, they can persist for extended periods of time for structural reasons. Cross-country differences in demographics,
File information (for internal use only): Chart 1 - Chart 1 - international investment - EN.indd
Last output: 01/06/16 - 02:21PM
Chart 1: International investment positions have grown rapidly in Canada and internationallySum of external assets and liabilities as a percentage of GDP at market prices, annual data
Canada Median Interquartile range
Note: The median is calculated from 35 Organisation for Economic Co-operation and Development member countries.
Sources: International Monetary Fund, Lane and Milesi-Ferretti (2007) an d Organisation for Economic Co-operation and Development Last observation: 2016
0
100
200
300
400
500
600
700
%
1970 1980 1990 2000 20101975 1985 1995 2005 2015
CAnAdA’S inteRnAtionAl inVeStment poSition: beneFitS And potentiAl VulneRAbilitieS 45 BANK OF CANADA • FINANCIAL SySTEM REVIEw • JuNE 2017

productivity growth and time preference (the level of patience of investors), for example, can explain cross-country differences in current account balances.
All else being equal, persistent current account deficits tend to be more sustainable if they coincide with productive investment. In other words, current account deficits can enhance the country’s capacity to generate future income. To illustrate, consider the period from Confederation until the First World War: during that time, Canada ran large and persistent current account deficits that helped finance rapid industrialization.
When the IIP is small, the cumulative sum of current account balances tracks the NIIP very closely. However, when external assets and liabil-ities are large, as is currently the case, valuation effects can also play an important role in the evolution of the NIIP. During the global financial crisis, sharp changes to the valuation of external assets and liabilities of different countries led to large and rapid wealth effects between countries.2 For this reason, the size and composition of gross financial flows have received increasing attention in recent years.3
Like the balance of payments, valuation effects can act as a stabilizing mechanism. Valuation effects can be divided into two categories: capital gains (losses) and exchange rate movements (see Box 2 for definitions).
First, external liabilities allow the sharing of capital losses after a shock, one of the benefits of international portfolio diversification. When a significant negative demand shock hits an economy, the value of domestic assets declines and their owners endure capital losses. As a result, residents of the country suffer from a negative wealth effect. However, foreign owners of domestic assets effectively share the capital losses on domestic assets with the country’s residents. This translates into a decline in the value of external liabilities. If the value of residents’ external assets is unaffected or less affected by the shock, the NIIP improves and the initial shock on wealth is dampened.
Second, valuation effects explained by exchange rate movements will gen-erally improve the NIIP of advanced economies after a shock that leads to a depreciation of their domestic currencies. This is because most advanced economies have a large portion of their external liabilities denominated in their domestic currency, while their external assets are denominated in foreign currencies. A depreciation of the domestic currency will therefore increase the value in domestic currency of external assets by more than that of liabilities, resulting in an increase in the NIIP and dampening the impact on the domestic economy.
The Canadian experience reveals the importance of valuation effects as a driver of the NIIP. For most of its recent history, except in the years preceding the global financial crisis, Canada’s current account was in per-sistent deficit (Chart 2). However, current account surpluses explain little of the dramatic improvement of the NIIP in the late 1990s and since 2013. Both improvements coincided with large shocks to the Canadian economy and
2 Gourinchas, Rey and Truempler (2012) estimate valuation effects on bilateral external positions in equity, direct investment and portfolio debt at the height of the crisis to determine which countries benefited from and which lost on their external exposure.
3 See, for example, Forbes, Hjortsoe and Nenova (2016) and Obstfeld (2012) for more information. In particular, Obstfeld (2012) argues that large current account imbalances, while welcome and very possibly warranted by fundamentals, can also signal elevated macroeconomic and financial stresses.
46 CAnAdA’S inteRnAtionAl inVeStment poSition: beneFitS And potentiAl VulneRAbilitieS BANK OF CANADA • FINANCIAL SySTEM REVIEw • JuNE 2017

Box 2
Valuation Eff ects During the Recent Oil Price Shock Valuation eff ects acted as a stabilizer following the oil price decline in 2014–15, helping dampen the impact of the adverse wealth eff ect of the shock on the Canadian economy and fi nancial system . To illustrate, we decompose c hanges in Canada’s external assets and liabilities into net capital fl ows and valuation eff ects . In turn, the latter can be decomposed into capital gains (or losses) and exchange rate movements:1
• Net capital fl ows capture changes in the international investment position (IIP) resulting from acquisitions or sales of external assets and liabilities . It is equal to the fi nancial account balance .
• Capital gains (or losses) refl ect changes in the value of fi nancial assets excluding the impact of exchange rate movements .
• Exchange rate movements refl ect changes in the value of Canada’s IIP that are strictly due to currency fl uctuations .
1 Changes are calculated from an accounting perspective . The contribution from exchange rate movements is approximated using the currency denomination of the main categories of foreign assets and liabilities obtained from Bénétrix, Lane and Shambaugh (2015) . Capital gains are calculated as the residual component after accounting for changes due to net capital fl ows and exchange rate move-ments . Dynamic eff ects (e .g ., the dynamic infl uence of the exchange rate on capital fl ows) are not considered .
Canada’s net international investment position (NIIP) has increased by more than 10 per cent of gross domestic product (GDP) since the second quarter of 2014, refl ecting the stabilizing impact of exchange rate movements and capital gains (Chart 2-A) . Following the oil price shock, the value of Canada’s external liabilities increased less than the value of its external assets, resulting in a net increase of the NIIP .
First, net capital infl ows were a drag on the NIIP, refl ecting in part a fall in oil exports and the associated worsening of Canada’s trade balance .
However, capital gains were responsible for a signifi cant share of the improvement in the NIIP . The value of external liabilities fell because the oil price shock had a sizable negative impact on Canadian assets . At the same time, the value of external assets rose slightly, highlighting the fact that investments abroad appeared to be largely unaff ected by the shock . This dynamic highlights the benefi ts of inter-national capital fl ows and fi nancial integration .
A weaker Canadian dollar also helped support the NIIP . All else being equal, the lower Canadian dollar increased the value of Canada’s external assets by more than its external liabilities . This is because most of Canada’s external assets were denominated in foreign currencies while the majority of external liabilities were denominated in Canadian dollars .
Chart 2-A: Capital gains and exchange rate movements boosted Canada’s NIIP during the oil price shockCumulative change from 2014Q2 to present as a percentage of GDP at market prices, quarterly data
a. Assets b. Liabilities c. Net
Capital fl ows Exchange rate Capital gains and other adjustments Total
Note: FDI stands for foreign direct investment and NIIP stands for net international investment position.Sources: Benetrix, Lane and Shambaugh (2015), International Monetary Fund, Statistics Canada and Bank of Canada calculations Last observation: 2016Q2
-10
0
10
20
30
40
50%
Total changein assets
FDI Portfolioequity
Portfoliodebt
-10
0
10
20
30
40
50%
Total changein liabilities
FDI Portfolioequity
Portfoliodebt
-10
0
10
20
30%
Total change inCanada’s NIIP
CAnAdA’S inteRnAtionAl inVeStment poSition: beneFitS And potentiAl VulneRAbilitieS 47 BANK OF CANADA • FINANCIAL SySTEM REVIEw • JuNE 2017

a depreciation of the Canadian dollar. This depreciation resulted in benefi-cial valuation effects. Box 2 analyzes in more detail how valuation effects helped dampen the impact of the 2014–15 oil price shock on the Canadian economy.
This discussion of valuation effects has so far focused on the behaviour of the IIP at the aggregate level in the event of a domestic shock. It is important to remember that the IIP is an aggregate of the external balance sheets of many different sectors and individual firms.4 The impact of valuation effects on the balance sheet of individual agents or sectors can vary greatly in both direction and magnitude, which can also have implications for financial stability.5 Unfortunately, a thorough sectoral analysis of the IIP is difficult because of significant data gaps, in Canada and internationally.
Vulnerabilities Related to the International Investment PositionWhile the current account and the valuation effects often act as shock absorbers, history reveals that, in certain circumstances, they can also act as shock amplifiers. The capital flows they measure can contribute to a buildup of financial system vulnerabilities. Moreover, shocks that heighten uncertainty or risk aversion can trigger a reversal of financial flows that could amplify those shocks.
Recent research finds that focusing on aggregate flows and levels can obscure important information.6 In what follows, we examine disaggregated data on the level and composition of capital flows, which are key to under-standing the associated financial system vulnerabilities.
4 The aggregation of countries, currency areas and decision-making units (firms and households) can be misleading, as discussed by Avdjiev, McCauley and Shin (2016).
5 See Forbes, Hjortsoe and Nenova (2016) for a comprehensive analysis of the role of valuation effects during global shocks.
6 See, for example, Olaberría (2012) and Jara and Olaberría (2013).
File information (for internal use only): Chart 1 - Chart 2 - changes in investment - EN.indd
Last output: 01/06/16 - 02:21PM
Chart 2: Changes in the Canadian net international investment position are not explained by the current account balanceAs a percentage of GDP at market prices
Current account (annualized quarterly data, left scale)
Net international investment position (quarterly data, right scale)
Note: Shaded areas represent recessions in Canada.
Source: Statistics Canada Last observation: 2016Q4
-60
-40
-20
0
20
40
-15
-10
-5
0
5
10%%
1961 1971 1981 1991 2001 20111966 1976 1986 1996 2006 2016
48 CAnAdA’S inteRnAtionAl inVeStment poSition: beneFitS And potentiAl VulneRAbilitieS BANK OF CANADA • FINANCIAL SySTEM REVIEw • JuNE 2017
Buildup of vulnerabilitiesThis historical experience from advanced economies shows there have been circumstances under which current account deficits have been associated with a buildup of financial system vulnerabilities. In particular, empirical evidence shows a link between capital inflows and booms in asset prices (e.g., real estate and stock prices).7 Indeed, large capital inflows, in conjunc-tion with financial market imperfections (i.e., asymmetric information, which can yield adverse selection or extrapolative expectation), can create a self-reinforcing increase in credit and asset prices. These inflows would there-fore result in a misallocation of resources and macroeconomic imbalances.
Conceptually, one way to understand the link between asset price booms and large capital inflows is to start with the idea that an economy’s bor-rowing capacity is a function of the value of its assets.8 Large capital inflows increase the demand for domestic assets; if the supply of these assets were fixed in the short term, inflows would raise their price. This, in turn, would augment the economy’s credit limit by increasing the value of collateral. Capital inflows would also lead to local currency appreciation, which is associated with greater credit growth.9 Relaxing the credit limits that con-strain domestic borrowing can then lead to an asset price boom through a self-reinforcing process: higher asset prices promote more borrowing and additional rounds of capital inflows, pushing prices even higher.
However, the strength of this link varies across countries. It depends on the depth of domestic financial markets, the degree of financial regulation and supervision, the quality of institutions and the type of exchange rate regime.10 These are potential explanations for why emerging-market econ-omies (EMEs) are more likely than advanced economies to experience a buildup of vulnerabilities associated with large capital inflows.
In addition to the size of capital inflows, their composition is important. Capital inflows can exacerbate liquidity and maturity mismatches in the financial system. The type of financial instrument also matters: for example, portfolio debt inflows are more likely to exacerbate movements in asset prices and to encourage risky lending.11 Large foreign inflows into debt may significantly increase the chance of an asset price boom compared with a situation where the inflows are concentrated in FDI.12 FDI is defined as a large equity stake; acquiring and divesting from large stakes, rather than small amounts of securities, are typically associated with significantly higher transaction costs. This higher cost increases investors’ incentives to accurately assess the value of their asset and thus reduces the potential for misallocation of resources.13
7 See, for example, Kim and Yang (2009) for Korea and Jara and Olaberría (2013) for Denmark.
8 This is related to the notion of financial accelerator (see Bernanke, Gertler and Gilchrist 1999 and Iacoviello 2005).
9 For a further discussion of the risk-taking channel of currency appreciation, see Bruno and Shin (2015).
10 Magud and Vesperoni (2014) find that countries with flexible exchange rates are less affected by the effects of a rapid reversal of flows than those with fixed exchange rates. However, they are not fully shielded: the fall in credit growth after a reversal is more modest but more persistent.
11 See Aoki, Benigno and Kiyotaki (2009).
12 See, among others, Krugman (2000a, 2000b), Reinhart and Reinhart (2009), Reinhart and Rogoff (2009), Olaberría (2012) and Avdjiev, Binder and Sousa (2017).
13 Korinek (2010) provides support for the idea that the composition matters by showing the different magnitudes of externalities created by different types of capital inflows. In particular, he suggests that FDI does not impose an externality since it often stays in the country when a financial crisis hits.
CAnAdA’S inteRnAtionAl inVeStment poSition: beneFitS And potentiAl VulneRAbilitieS 49 BANK OF CANADA • FINANCIAL SySTEM REVIEw • JuNE 2017

Finally, all else being equal, large foreign inflows into debt drive down domestic interest rates (Warnock and Warnock 2009; Ahmed and Zlate 2014).14 As a result of portfolio rebalancing, large inflows would likely affect other domestic interest rates. This mechanism can exacerbate movements in asset prices and encourage lending. In contrast, a rapid reversal of these flows would increase the cost of borrowing through higher risk premiums.15
Composition of the international investment position and reversalsForeign investors may suffer from an informational disadvantage relative to domestic investors and can therefore be more prone to rapidly withdraw from the market when uncertainty and risk aversion increase.16 For example, a country that receives large inflows based on its perceived financial sta-bility could be vulnerable to rapid outflows if the creditworthiness of its government, financial institutions or private firms subsequently comes into question. The vulnerability of the financial system to a large increase in uncertainty or risk aversion depends on a number of factors.
First, the larger the share of total liabilities held by foreigners in an economy, the more likely a rapid reversal of foreign inflows leads to an increase in risk premiums. This tightening of financial conditions would amplify the impact of the initial shock. A rapid reversal of foreign inflows is an extreme case for advanced economies, but slower reversals or a reduction in the pace of inflows can have similar but smaller effects.
Second, the greater the proportion of liabilities that take the form of port-folio debt, the more vulnerable the financial system will be, all else being equal. Portfolio debt liabilities have contractually predetermined payments, whereas equity and FDI are residual claims on profits and thus vary more in value. As a result, if there is a negative demand shock in the domestic economy, the value of external debt liabilities falls by less than that of equity or FDI. Furthermore, since the stock of debt is largely fixed in the short term, a rapid reversal of foreign flows would result in higher domestic risk premiums and tighter credit conditions, inducing a jump in the cost of refinancing debt.
Third, the vulnerabilities created by debt can be further magnified by the presence of maturity mismatches. Rollover risk, which is the risk of a sharp increase in the cost of refinancing existing debt when it matures, arises in the presence of maturity mismatches between assets and liabilities. Although this risk also exists at the level of individual balance sheets (e.g., private firms in the corporate sector), it becomes a risk to the financial system when it arises at the aggregate level. Long-term external or domestic assets financed by short-term foreign liabilities can generate funding stress in the event of large and rapid outflows because short-term debt matures more quickly and therefore generates greater rollover risk.
For example, in the years leading up to the global financial crisis, European banks accumulated large amounts of US assets through purchases of private-label mortgage-backed securities (i.e., external assets for European countries). These purchases by European banks were financed in part by
14 In particular, Ahmed and Zlate (2014) find that net inflows became more sensitive to interest rate differentials after the global financial crisis. For Canada, Feunou et al. (2015) find that foreign flows of $150 billion in federal debt lowered the Government of Canada 10-year bond yield by 100 basis points between 2009 and 2012.
15 Bank of Canada Financial System Review, December 2016.
16 See Broner et al. (2013) for a more extensive discussion.
50 CAnAdA’S inteRnAtionAl inVeStment poSition: beneFitS And potentiAl VulneRAbilitieS BANK OF CANADA • FINANCIAL SySTEM REVIEw • JuNE 2017

US banks in the form of short-term wholesale funding denominated in US dollars (an external liability for European countries).17 During the global financial crisis, exposure of these banks to the United States became one of the main channels of contagion to Europe. Note that these large exposures and liquidity mismatches were building up even though the current account between many European countries and the United States was roughly balanced.
Finally, the proportion of liabilities denominated in foreign currencies also matters, since currency depreciation increases the burden of servicing and repaying foreign currency debt. This is currently a concern for many EMEs, whose governments and firms often have a sizable outstanding debt in US dollars. Rolling over the debt could also prove difficult if funding substitutes in the domestic currency are costlier.
Changes in Canada’s International Investment PositionThe size of Canada’s IIP is broadly in line with that of other advanced econ-omies (Chart 1). However, between the end of 2008 and the end of 2016, its growth exceeded that of the median of OECD countries. In particular, external liabilities have increased by around 75 per cent of GDP, roughly triple the median growth in OECD countries during that period. The relative increase of external liabilities would have been large even if GDP growth had not moderated after the crisis. Among the components of external liabilities, portfolio debt securities rose by 33 per cent of GDP, FDI by 16 per cent, portfolio equity by 14 per cent and other debt (including currency and deposits of non-residents) by 13 per cent (Chart 3).18
Consequently, as a share of GDP, Canada’s portfolio debt liabilities have risen to their highest level since record-keeping began in 1990. This increase was broad-based, with long-term external debt liabilities increasing for
17 See Shin (2012).
18 Of note, currency and deposits held in Canada by non-residents have more than doubled in value since 2012. The financial stability implications of this increase are beyond the scope of this report.
File information (for internal use only): Chart 1 - Chart 3 - external liabilities - EN.indd
Last output: 01/06/16 - 02:21PM
Chart 3: External liabilities are increasingly composed of debt securitiesMarket value of external liabilities as a percentage of GDP at market prices, quarterly data
Foreign direct investment Debt securities
Portfolio equities Other debt
Note: “Other debt” includes loans, currency and deposits.
Source: Statistics Canada Last observation: 2016Q4
0
20
40
60
80%
1990 1995 2000 2005 2010 2015
CAnAdA’S inteRnAtionAl inVeStment poSition: beneFitS And potentiAl VulneRAbilitieS 51 BANK OF CANADA • FINANCIAL SySTEM REVIEw • JuNE 2017

governments, banks and non-bank corporations (Chart 4).19, 20 As a result, the share of the outstanding debt held by foreigners has risen for the federal government and corporate (financial and non-financial) sectors, surpassing previous highs observed in the 1990s (Chart 5).
19 We exclude short-term debt for two reasons: (i) short-term debt is a small component of total debt in government and non-financial corporate sectors, and (ii) short-term debt in the banking sector includes all currency and deposits held in Canada by non-residents.
20 The largest bonds issued by Canadian firms in US dollars during that period were from the financial, transportation, and mining and manufacturing industries. It is likely that the rise in external corporate debt liabilities was also concentrated in these sectors.
File information (for internal use only): Chart 1 - Chart 4 - long term gross - EN.indd
Last output: 01/06/16 - 02:21PM
Chart 4: Long-term gross external debt has increased across all sectorsMarket value, as a percentage of GDP at market prices
2008Q4 2016Q4
Note: Long-term investments are primarily composed of bonds and notes with a maturity of more than one year. Loans are a smaller portion and increased only marginally from 2009 to 2016. Non-bank corporations refer to Statistics Canada’s defi nition of “Other Sectors,” which includes all sectors except banks, monetary authorities, general government and direct investment liabilities. Banks include chartered banks and other deposit-taking institutions.
Source: Statistics Canada Last observation: 2016Q4
0
10
20
30
40%
Government Non-bank Banks
File information (for internal use only): Chart 1 - Chart 5 - foreign ownership - EN.indd
Last output: 01/06/16 - 02:21PM
Chart 5: The share of foreign ownership of federal and corporate debt has increasedShare of foreign ownership out of the total outstanding, market value, quarterly data
Federal Corporate Provincial
Note: “Corporate ” excludes government business enterprises.
Source: Statistics Canada Last observation: 2016Q4
0
10
20
30
40
50%
1990 1995 2000 2005 2010 2015
52 CAnAdA’S inteRnAtionAl inVeStment poSition: beneFitS And potentiAl VulneRAbilitieS BANK OF CANADA • FINANCIAL SySTEM REVIEw • JuNE 2017
This increase in external portfolio debt liabilities was mainly driven by three factors. First, accommodative monetary policy in a significant number of other advanced economies, including the use of unconventional monetary policies, created spillovers to Canadian assets, which generally offered higher yields. Second, Canada’s perceived financial stability increased the attractiveness of its debt after the crisis, notably for Canadian banks and Government of Canada debt. This happened in a context where the outstanding amount of sovereign and financial debt considered safe was declining globally because of credit downgrades. This attractiveness was notably apparent in the demand from official reserve managers, among others.21 Finally, the amount of debt outstanding in Canada grew robustly during that period because of high investment in the resources sector, strong residential mortgage demand and federal and provincial government fiscal deficits.
Since the crisis, large foreign inflows into debt may have contributed to drive down borrowing costs for Canadian households, financial institutions, firms and governments and may have facilitated a buildup of domestic imbalances. First, lower long-term mortgage rates encouraged household borrowing and increased housing demand. Moreover, housing demand was financed, in part, by foreign purchases of covered bonds issued by financial institutions,22 which are collateralized by uninsured mortgages, and Canada Mortgage Bonds, which are collateralized by insured mortgages.23 The increase in foreign deposits may have also facilitated the growth of mort-gage financing. Second, Canada’s external corporate debt liabilities have nearly doubled as a percentage of GDP since the crisis.24 As a result, lower corporate bond yields have helped stimulate demand for credit (Chart 6).
In the event of a shock large enough to undermine Canada’s perceived financial stability, foreign investors might significantly reduce their holdings of Canadian debt. This would translate into higher risk premiums, which would amplify the effect of the initial shock. The effect of these outflows on domestic interest rates might be substantial if they are large enough to reverse the effect of inflows observed since the crisis. These outflows could also affect market liquidity, especially if there are rapid sales of fixed-income securities.
In addition, changes in Canada’s IIP since the global financial crisis may have lessened its potential for stabilization. First, the larger relative size of external portfolio debt, as a share of both total domestic credit and total external liabilities, increases the potential impact of a reversal of these inflows. Even if the maturity of external debt has been extended in recent years, the amount of debt maturing every year is larger, thus increasing rollover risk. Further, given the increased share of portfolio debt, the value of total external debt liabilities is likely to decrease less during a shock to aggregate demand than before the crisis.
21 Pomorski, Rivadeneyra and Wolfe (2014).
22 Most covered bonds issued by Canadian banks are denominated in currencies other than the Canadian dollar. As at 28 February 2017, there were Can$140 billion worth of covered bonds outstanding, 50 per cent of which was denominated in euros and 32 per cent in US dollars. The National Housing Act became the legal framework for covered bond programs in Canada in 2012; it contains various pro-visions to limit their size and the risk. Notably, the Office of the Superintendent of Financial Institutions covered bond limit states that covered bonds must not, at the time of issuance, make up more than 4 per cent of total assets of the deposit-taking institution. See DBRS (2017).
23 In 2016, 35 per cent of Canada Mortgage Bonds were sold to foreign investors. See Canada Mortgage and Housing Corporation “Canada Mortgage Bond Fact Sheet,” 15 March 2017.
24 Note that external corporate debt liabilities include financial debt, which in turn includes bank whole-sale financing. This could have contributed indirectly to the growth in household credit. Bank of Canada analysis suggests that non-financial corporate leverage remains below its long-run average.
CAnAdA’S inteRnAtionAl inVeStment poSition: beneFitS And potentiAl VulneRAbilitieS 53 BANK OF CANADA • FINANCIAL SySTEM REVIEw • JuNE 2017
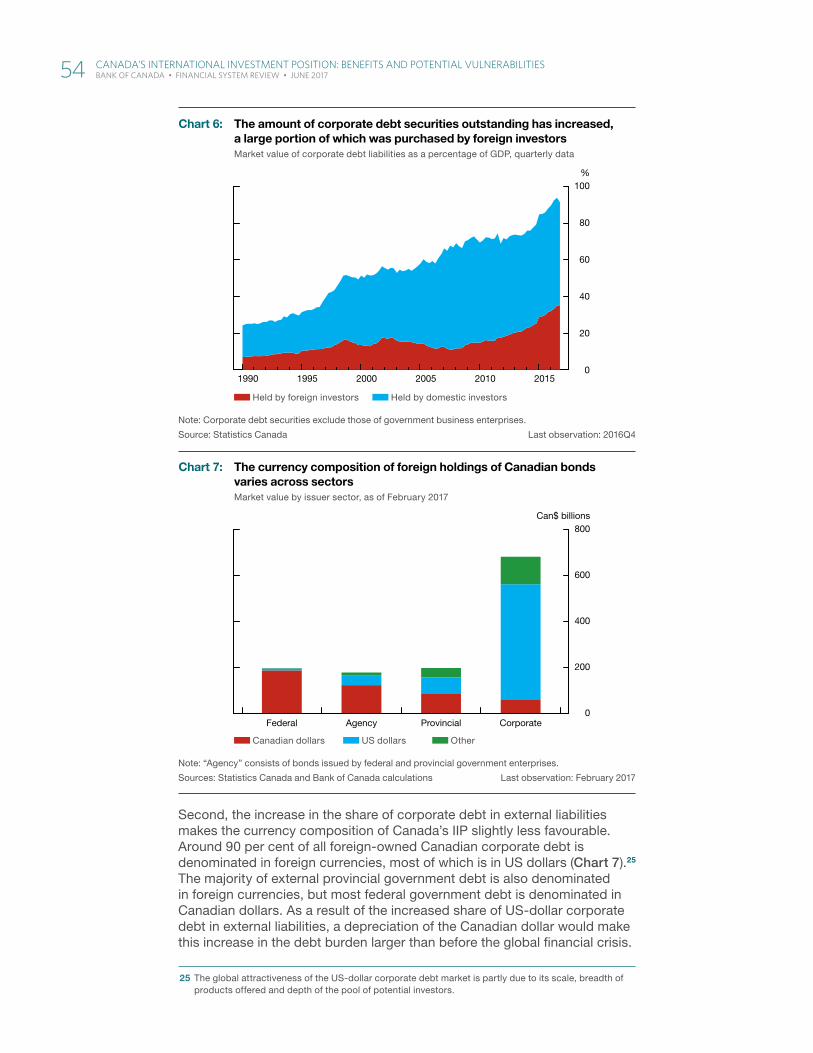
Second, the increase in the share of corporate debt in external liabilities makes the currency composition of Canada’s IIP slightly less favourable. Around 90 per cent of all foreign-owned Canadian corporate debt is denominated in foreign currencies, most of which is in US dollars (Chart 7).25 The majority of external provincial government debt is also denominated in foreign currencies, but most federal government debt is denominated in Canadian dollars. As a result of the increased share of US-dollar corporate debt in external liabilities, a depreciation of the Canadian dollar would make this increase in the debt burden larger than before the global financial crisis.
25 The global attractiveness of the US-dollar corporate debt market is partly due to its scale, breadth of products offered and depth of the pool of potential investors.
File information (for internal use only): Chart 1 - Chart 6 - foreign investors - EN.indd
Last output: 01/06/16 - 02:21PM
Chart 6: The amount of corporate debt securities outstanding has increased, a large portion of which was purchased by foreign investorsMarket value of corporate debt liabilities as a percentage of GDP, quarterly data
Held by foreign investors Held by domestic investors
Note: Corporate debt securities exclude those of government business enterprises.
Source: Statistics Canada Last observation: 2016Q4
0
20
40
60
80
100%
1990 1995 2000 2005 2010 2015
File information (for internal use only): Chart 1 - Chart 7 - currency composition - EN.indd
Last output: 01/06/16 - 02:21PM
Chart 7: The currency composition of foreign holdings of Canadian bonds varies across sectorsMarket value by issuer sector, as of February 2017
Canadian dollars US dollars Other
Note: “Agency” consists of bonds issued by federal and provincial government enterprises.
Sources: Statistics Canada and Bank of Canada calculations Last observation: February 2017
0
200
400
600
800
Federal Agency Provincial Corporate
Can$ billions
54 CAnAdA’S inteRnAtionAl inVeStment poSition: beneFitS And potentiAl VulneRAbilitieS BANK OF CANADA • FINANCIAL SySTEM REVIEw • JuNE 2017
However, this risk is mitigated when the increase in debt denominated in foreign currencies reflects increased foreign activity by Canadian firms, which would generate foreign currency revenues to service that debt, rather than Canadian activities being funded abroad.26 The value of assets of the foreign affiliates of Canadian firms has indeed grown significantly in recent years, although it is difficult to assess whether firms expanding their foreign presence are the same as those borrowing in foreign currencies.
ConclusionInternational capital flows are generally stabilizing since they allow for dif-ferences between savings and investment within countries and thus help smooth the impact of economic shocks. Several features of Canada’s IIP would play a stabilizing role. For example, roughly half of Canada’s external liabilities are in equities and FDI, suggesting that foreign investors will absorb some of the shocks to the Canadian economy. Further, the majority of Canada’s external liabilities are denominated in Canadian dollars, whereas its assets are mostly in foreign currencies. In addition to its benefits for the trade balance, this composition means that a depreciation of the Canadian dollar improves the NIIP.
The large foreign inflows into Canadian portfolio debt in recent years are, however, a potential cause for concern. These inflows may have facilitated the buildup of financial system vulnerabilities and may amplify economic shocks in a period of heightened uncertainty or risk aversion. While the levels of Canadian external debt are not particularly concerning, the pace at which it has been increasing recently warrants monitoring by policy-makers. This monitoring is necessary even if the NIIP is positive and the current account reverts to a surplus.
Our report analyzes financial flows at the aggregate country level. This is an important simplification. The saving and investment decisions that matter for financial stability are ultimately made by households, firms and different levels of government, not countries themselves. The attention to gross rather than net flows, the analysis of the currency composition of the IIP and the various sectoral decompositions contained in this report were meant to address the main pitfalls of this type of analysis. Fully analyzing the financial stability impli-cations of growth of Canada’s IIP will require a more granular investigation of external assets and liabilities.
26 Firms funding their domestic activities with foreign currencies could hedge using cross-currency swaps. However, a rapid reversal of capital flows could lead to a deterioration of the cost or availability of this hedging mechanism.
ReferencesAhmed, S. and A. Zlate. 2014. “Capital Flows to Emerging Market
Economies: A Brave New World?” Journal of International Money and Finance 48 (Part B): 221–248.
Aoki, K., G. Benigno and N. Kiyotaki. 2009. “Capital Flows and Asset Prices.” NBER International Seminar on Macroeconomics 2007: 175–216.
Avdjiev, S., S. Binder and R. Sousa. 2017. “External Debt Composition and Domestic Credit Cycles.” Bank for International Settlements Working Paper No 627.
CAnAdA’S inteRnAtionAl inVeStment poSition: beneFitS And potentiAl VulneRAbilitieS 55 BANK OF CANADA • FINANCIAL SySTEM REVIEw • JuNE 2017

Avdjiev, S., R. N. McCauley and H. S. Shin. 2016. “Breaking Free of the Triple Coincidence in International Finance.” Economic Policy 31 (87): 409–451.
Bénétrix, A. S., P. R. Lane and J. C. Shambaugh. 2015. “International Currency Exposures, Valuation Effects and the Global Financial Crisis.” Journal of International Economics 96 (Supplement 1): 98–109.
Bernanke, B. S., M. Gertler and S. Gilchrist. 1999. “The Financial Accelerator in a Quantitative Business Cycle Framework.” In Handbook of Macroeconomics, Edition 1, Volume 1, Chapter 21, edited by J. B. Taylor and M. Woodford, 1341–1393. North Holland.
Broner, F., T. Didier, A. Erce and S. L. Schmukler. 2013. “Gross Capital Flows: Dynamics and Crises.” Journal of Monetary Economics 60 (1): 113–133.
Bruno, V. and H. S. Shin. 2015. “Cross-Border Banking and Global Liquidity.” The Review of Economic Studies 82 (2): 535–564.
DBRS. 2017. Monthly Canadian Covered Bond Report (February).
Feunou, B., J.-S. Fontaine, J. Kyeong and J. Sierra. 2015. “Foreign Flows and Their Effect on Government of Canada Yields.” Bank of Canada Staff Analytical Note No. 2015-1.
Forbes, K., I. Hjortsoe and T. Nenova. 2016. “Current Account Deficits During Heightened Risk: Menacing or Mitigating?” Bank of England External MPC Unit Discussion Paper No. 46.
Gourinchas, P. O., H. Rey and K. Truempler. 2012. “The Financial Crisis and the Geography of Wealth Transfers.” Journal of International Economics 88 (2): 266–283.
Iacoviello, M. 2005. “House Prices, Borrowing Constraints, and Monetary Policy in the Business Cycle.” American Economic Review 95 (3): 739–764.
Jara, A. and E. Olaberría. 2013. “Are All Capital Inflows Associated with Booms in House Prices? An Empirical Evaluation.” Central Bank of Chile Working Paper No. 696.
Kim, S. and D. Y. Yang. 2009. “Do Capital Inflows Matter to Asset Prices? The Case of Korea.” Asian Economic Journal 23 (3): 323–348.
Korinek, A. 2010. “Regulating Capital Flows to Emerging Markets: An Externality View.” University of Maryland working paper.
Krugman, P. 2000a. “Fire-Sale FDI.” In Capital Flows and the Emerging Economies: Theory, Evidence and Controversies, edited by S. Edwards, 43–58. Chicago: University of Chicago Press.
—. 2000b. “Crises: The Price of Globalization?” In Global Economic Integration: Opportunities and Challenges, 75–106. Proceedings of the Economic Policy Symposium, 24–26 August. Jackson Hole, Wyoming: Federal Reserve Bank of Kansas City.
Lane, P. R. and G. M. Milesi-Ferretti. 2007. “The External Wealth of Nations Mark II: Revised and Extended Estimates of Foreign Assets and Liabilities, 1970–2004.” Journal of International Economics 73 (2): 223–250.
56 CAnAdA’S inteRnAtionAl inVeStment poSition: beneFitS And potentiAl VulneRAbilitieS BANK OF CANADA • FINANCIAL SySTEM REVIEw • JuNE 2017

Lane, T. 2016. “Follow the Money: A Canadian Perspective on Financial Globalization.” Remarks at the Centre for International Governance Innovation, 16 November 2016.
Magud, N. and E. R. Vesperoni. 2014. “Exchange Rate Flexibility and Credit During Capital Inflow Reversals: Purgatory…Not Paradise.” IMF Working Paper No. 14/61.
Obstfeld, M. 2012. “Does the Current Account Still Matter?” American Economic Review 102 (3): 1–23.
Olaberría, E. 2012. “Capital Inflows and Booms in Assets Prices: Evidence from a Panel of Countries.” Central Bank of Chile Working Paper No. 675.
Pomorski, L., F. Rivadeneyra and E. Wolfe. 2014. “The Canadian Dollar as a Reserve Currency.” Bank of Canada Review (Spring): 1–11.
Reinhart, C. M. and V. Reinhart. 2009. “Capital Flow Bonanzas: An Encompassing View of the Past and Present.” In NBER International Seminar on Macroeconomics 2008, 9–62. Chicago: University of Chicago Press.
Reinhart, C. M. and K. S. Rogoff. 2009. “The Aftermath of Financial Crises.” American Economic Review 99 (2): 466–472.
Shin, H. S. 2012. “Global Banking Glut and Loan Risk Premium.” IMF Economic Review 60 (2): 155–192.
Warnock, F. E. and V. C. Warnock. 2009. “International Capital Flows and U.S. Interest Rates.” Journal of International Money and Finance 28 (6): 903–919.
CAnAdA’S inteRnAtionAl inVeStment poSition: beneFitS And potentiAl VulneRAbilitieS 57 BANK OF CANADA • FINANCIAL SySTEM REVIEw • JuNE 2017