Embed Size (px)
Citation preview
The Title of the presentation
Second line if needed
Third line if needed
Today’s date
Location of presentation
June 16, 2017
Canada’s Housing Market
Dr. Sherry Cooper
Chief Economist
Dominion Lending Centres
4.0
4.5
5.0
5.5
6.0
6.5
7.0
7.5
8.0
81 83 85 87 89 91 93 95 97 99 01 03 05 07 09 11 13 15 17
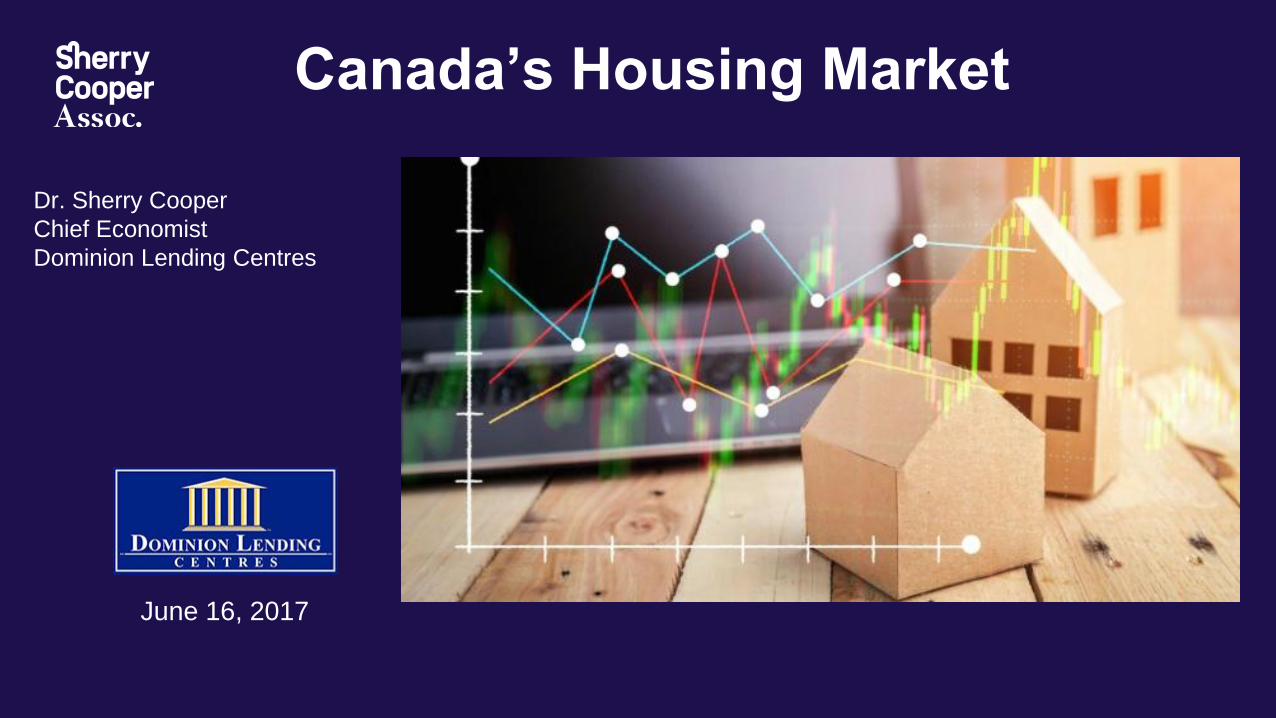
Housing Looms Large ... Canada (percent)
Source: Haver Analytics, Statistics Canada
Construction Jobs/Total
Housing/GDP
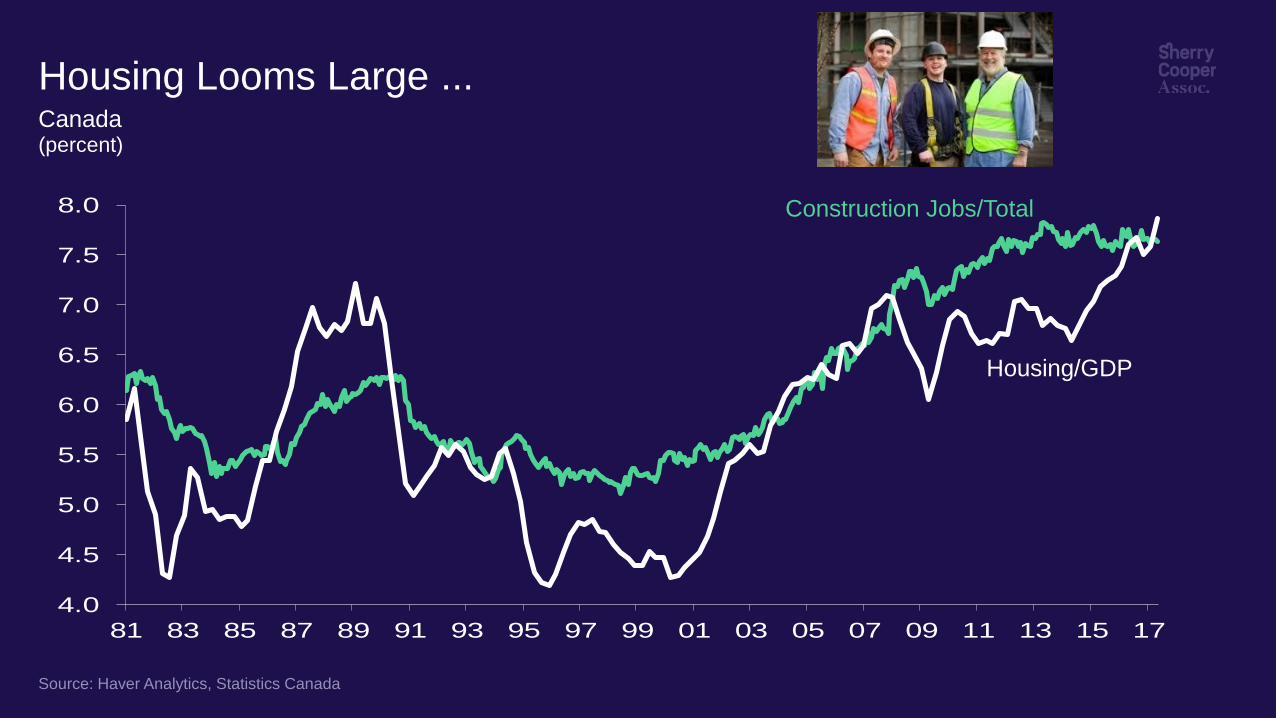
Homeowners as a % of all Canadian Households (percent)
60.3
61.8 62.162.4
62.6
63.6
65.8
68.4
69.0
1971 1976 1981 1986 1991 1996 2001 2006 2011
Canadian Homeownership At A Record High
Source: Statistics Canada, Censuses of Population, 1971 to 2006 and National Household Survey, 2011
70% of
Households Own
Their Own Homes
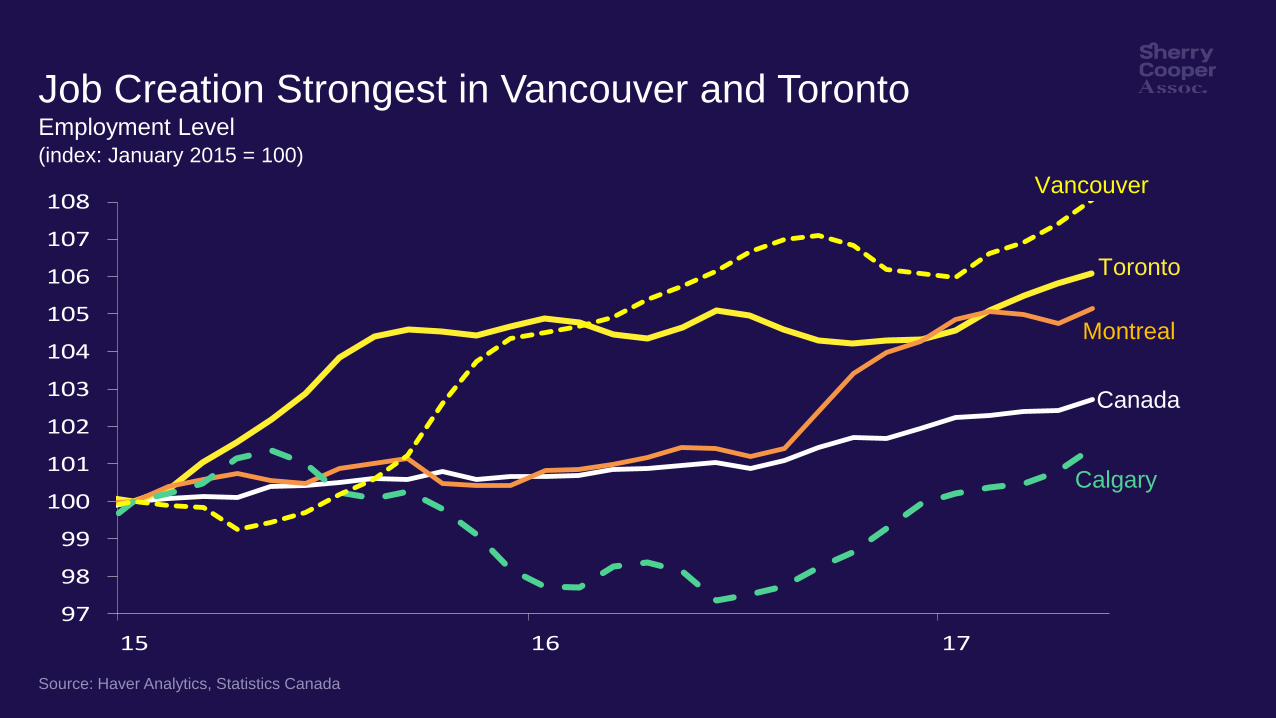
97
98
99
100
101
102
103
104
105
106
107
108
15 16 17
Job Creation Strongest in Vancouver and Toronto Employment Level (index: January 2015 = 100)
Canada
Calgary
Montreal
Source: Haver Analytics, Statistics Canada
Vancouver
Toronto
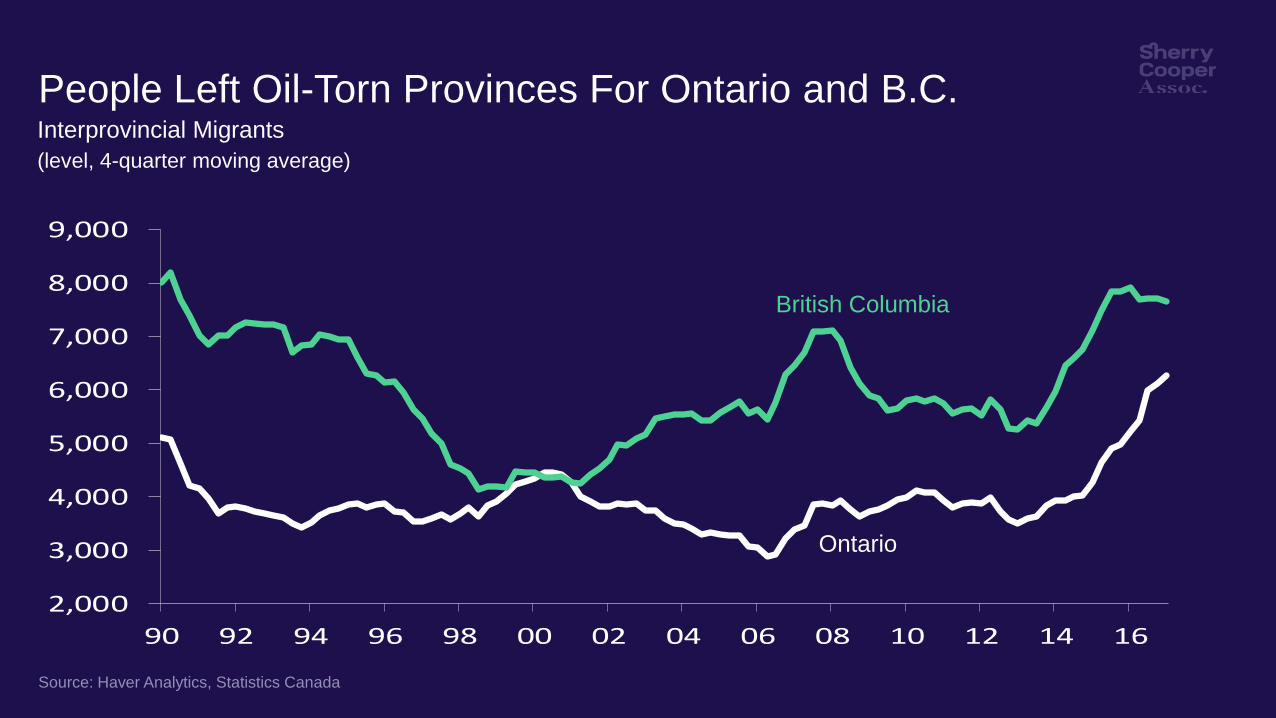
2,000
3,000
4,000
5,000
6,000
7,000
8,000
9,000
90 92 94 96 98 00 02 04 06 08 10 12 14 16
People Left Oil-Torn Provinces For Ontario and B.C.
Source: Haver Analytics, Statistics Canada
Interprovincial Migrants
(level, 4-quarter moving average)
British Columbia
Ontario
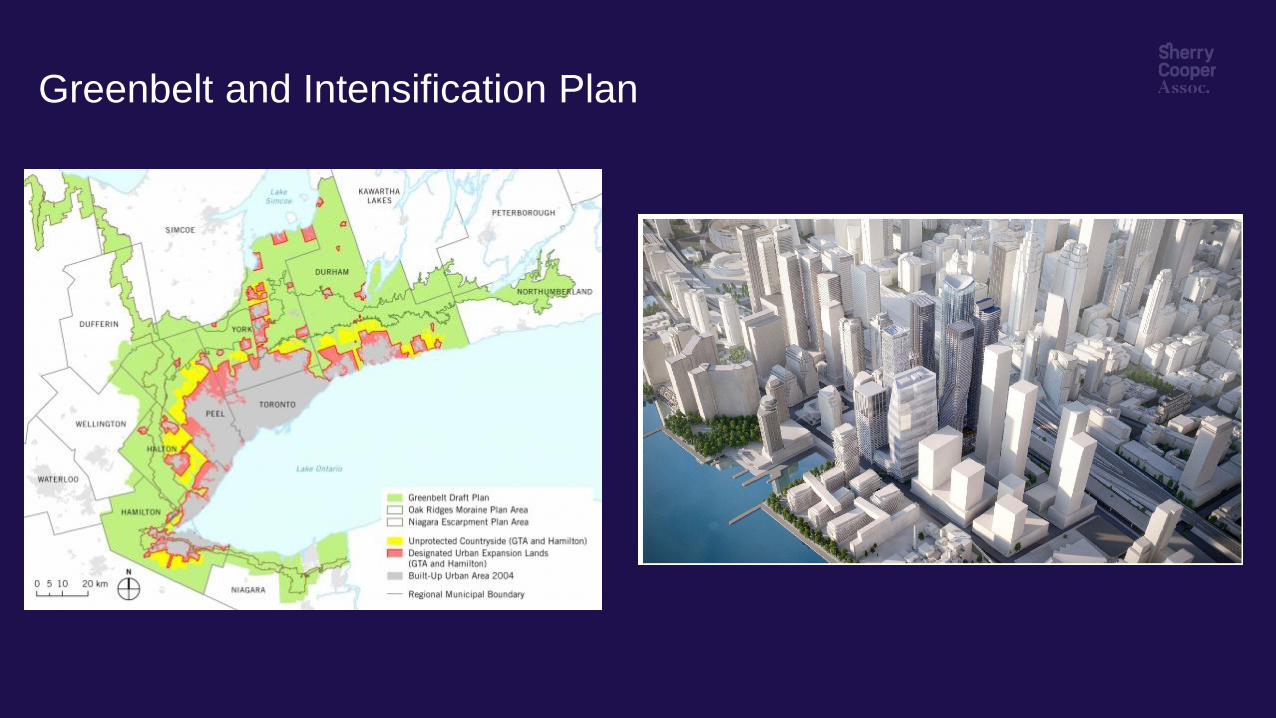
Greenbelt and Intensification Plan
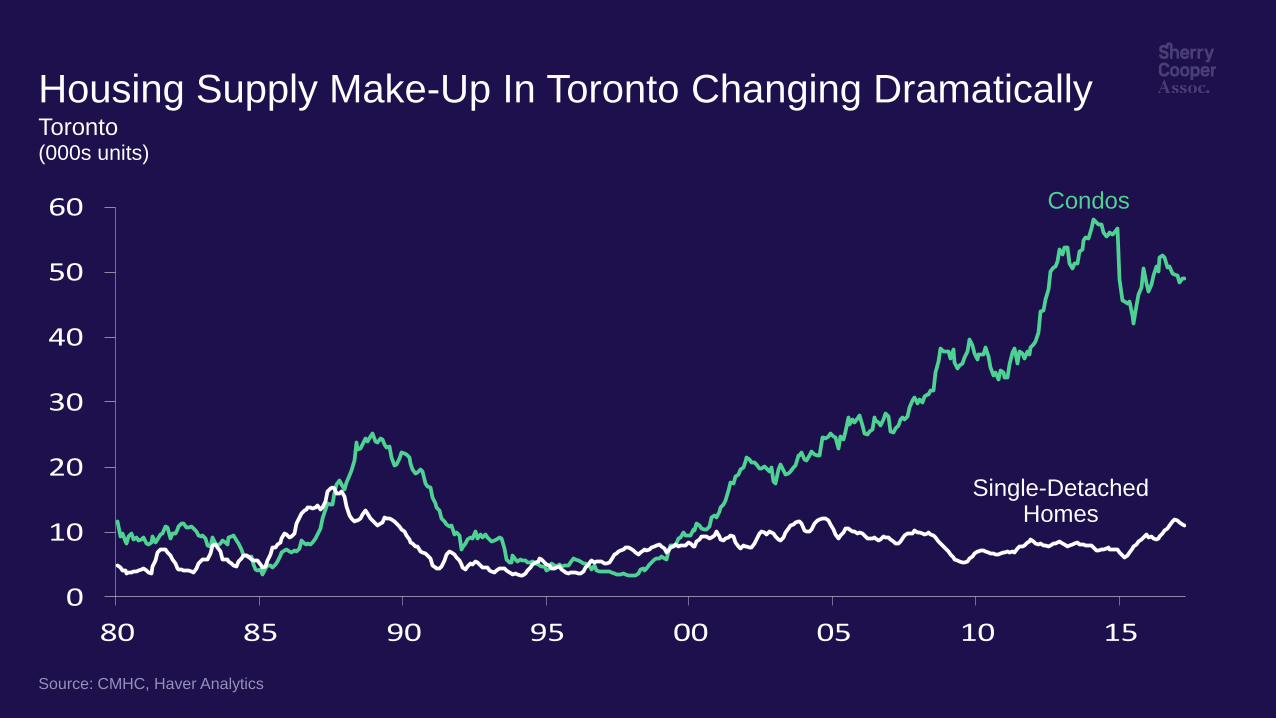
Housing Supply Make-Up In Toronto Changing Dramatically Toronto (000s units)
Source: CMHC, Haver Analytics
0
10
20
30
40
50
60
80 85 90 95 00 05 10 15
Condos
Single-Detached Homes
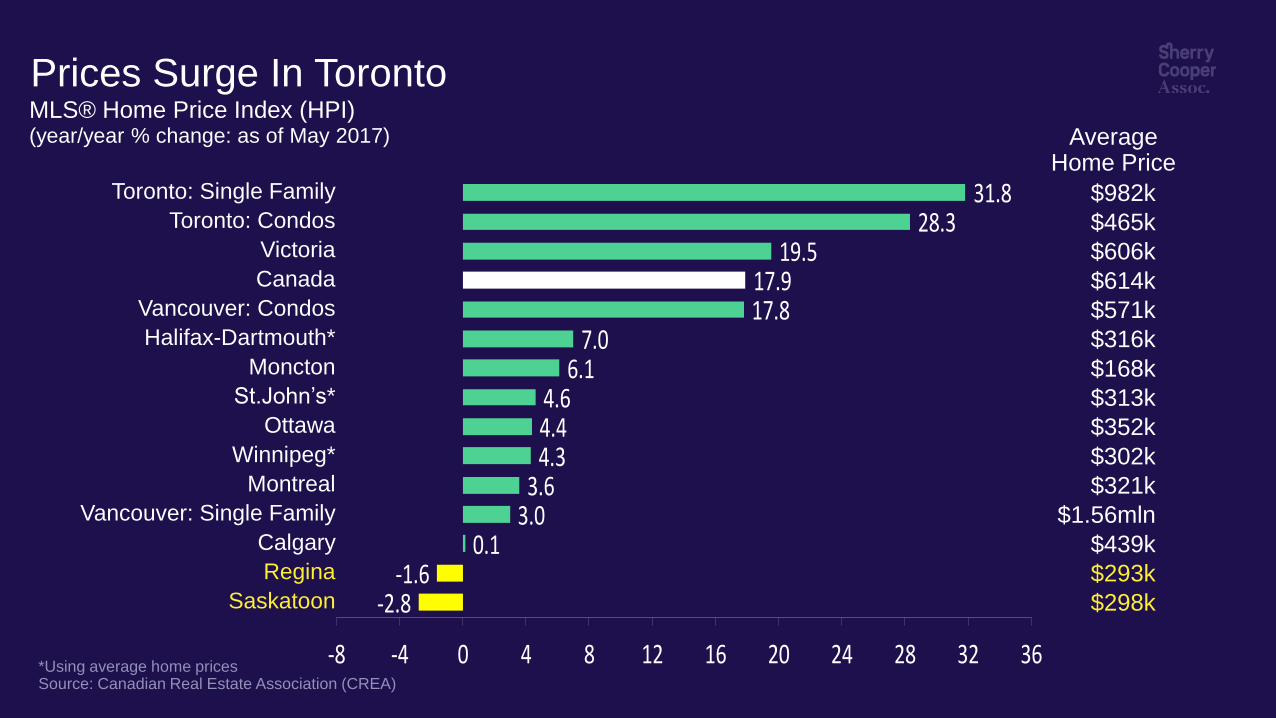
-2.8-1.6
0.13.03.6
4.34.44.6
6.17.0
17.817.9
19.528.3
31.8
-8 -4 0 4 8 12 16 20 24 28 32 36
Prices Surge In Toronto MLS® Home Price Index (HPI) (year/year % change: as of May 2017)
*Using average home prices Source: Canadian Real Estate Association (CREA)
Average Home Price
Toronto: Single Family
Toronto: Condos
Victoria
Canada
Vancouver: Condos
Halifax-Dartmouth*
Moncton
St.John’s*
Ottawa
Winnipeg*
Montreal
Vancouver: Single Family
Calgary
Regina
Saskatoon
$982k
$465k
$606k
$614k
$571k
$316k
$168k
$313k
$352k
$302k
$321k
$1.56mln
$439k
$293k
$298k
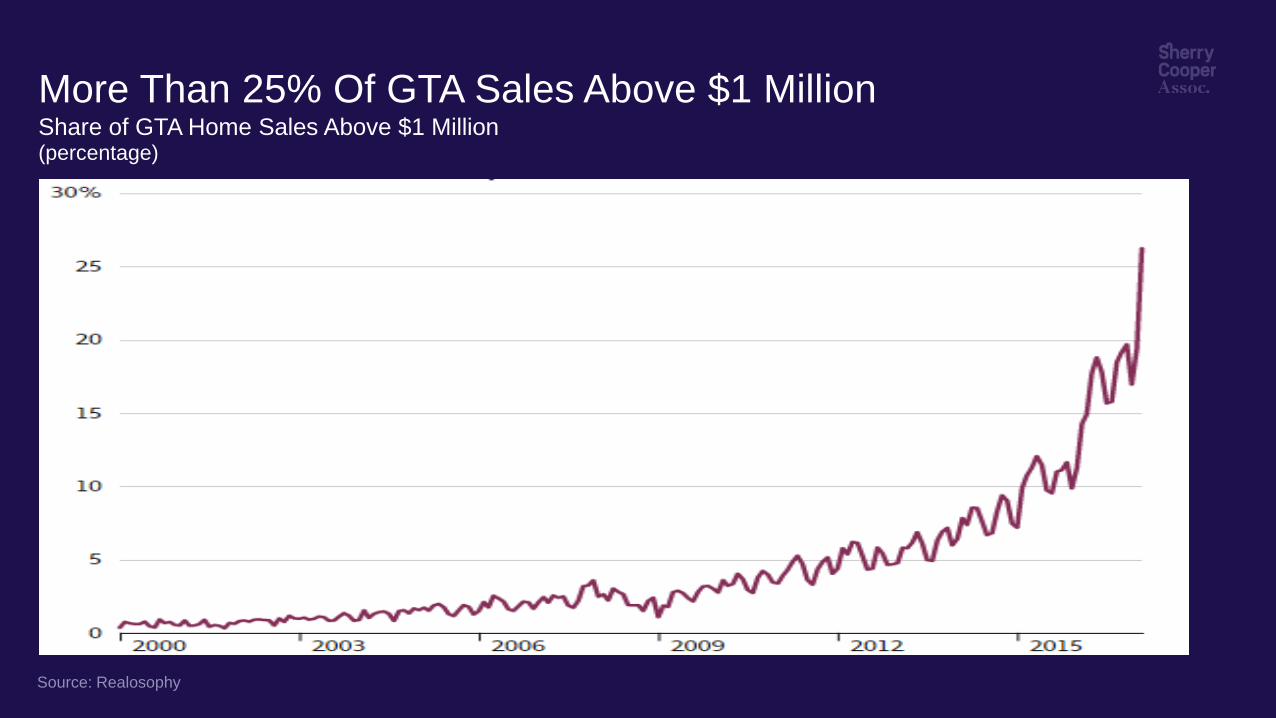
More Than 25% Of GTA Sales Above $1 Million
Share of GTA Home Sales Above $1 Million (percentage)
Source: Realosophy
-20
-10
0
10
20
30
40
50
60
1980 1985 1990 1995 2000 2005 2010 2015
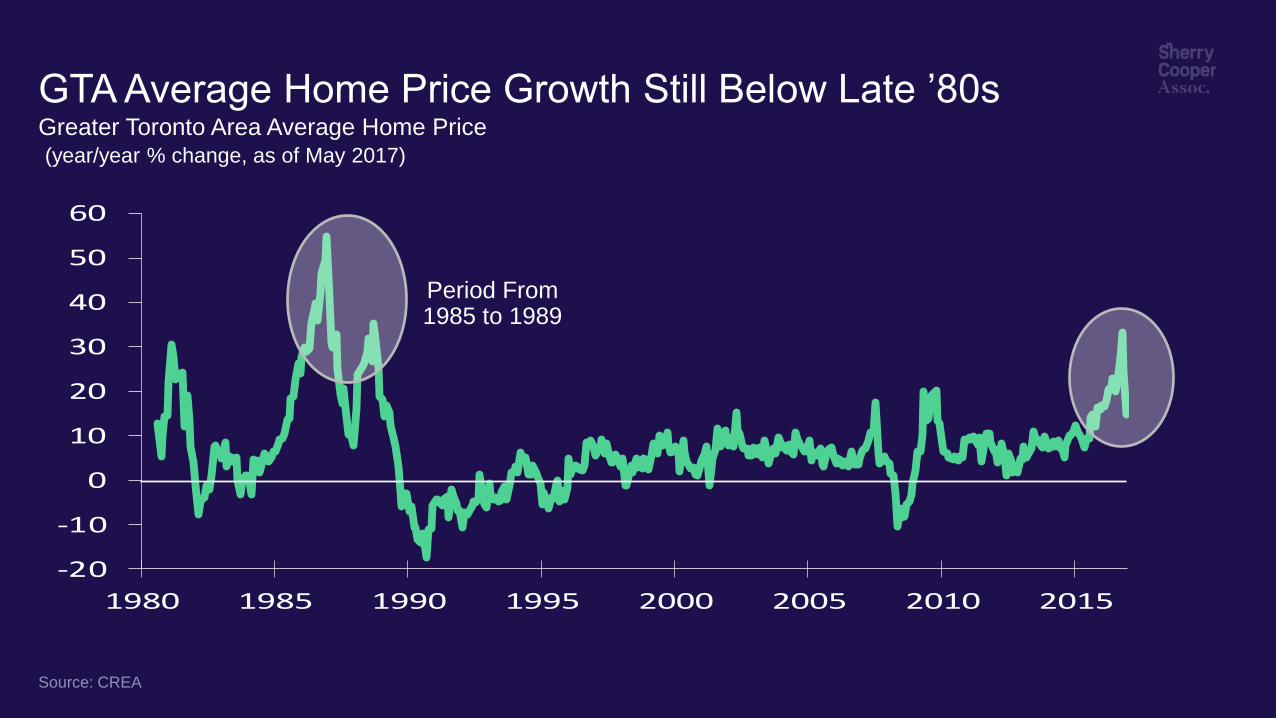
GTA Average Home Price Growth Still Below Late ’80s
Greater Toronto Area Average Home Price
Source: CREA
(year/year % change, as of May 2017)
Period From 1985 to 1989
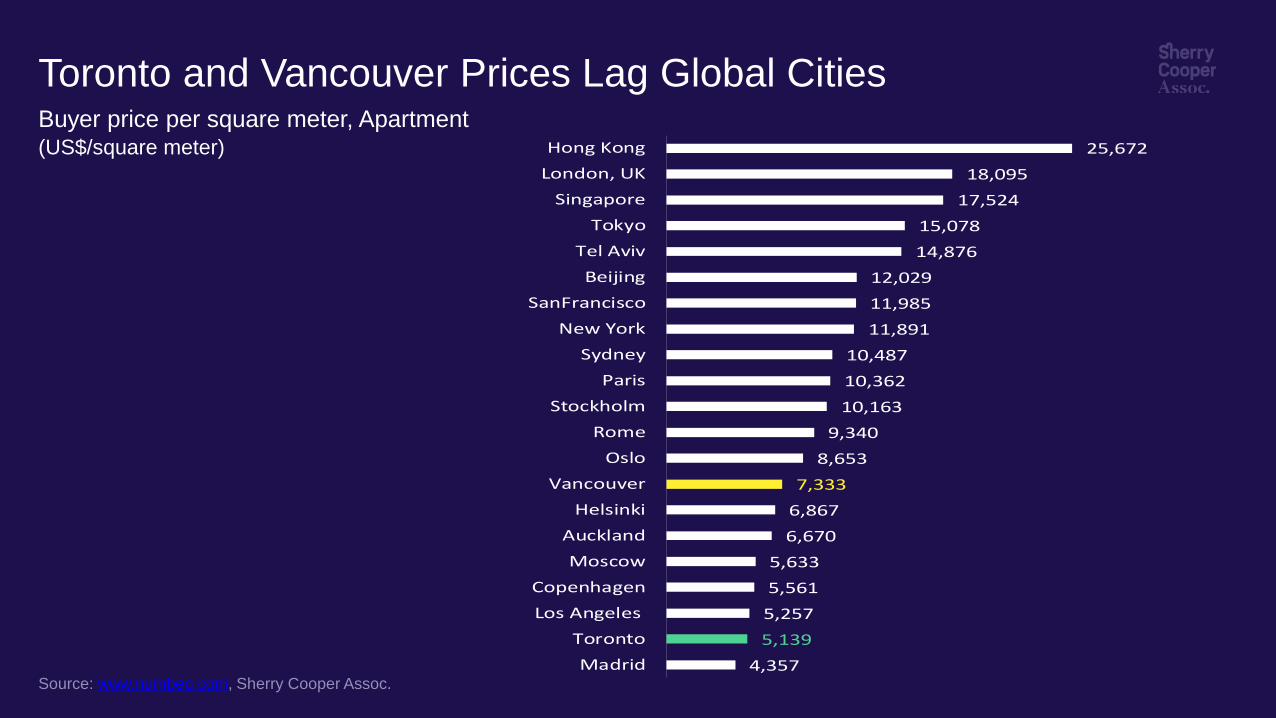
Toronto and Vancouver Prices Lag Global Cities Buyer price per square meter, Apartment (US$/square meter)
Source: www.numbeo.com, Sherry Cooper Assoc.
4,357
5,139
5,257
5,561
5,633
6,670
6,867
7,333
8,653
9,340
10,163
10,362
10,487
11,891
11,985
12,029
14,876
15,078
17,524
18,095
25,672
Madrid
Toronto
Los Angeles
Copenhagen
Moscow
Auckland
Helsinki
Vancouver
Oslo
Rome
Stockholm
Paris
Sydney
New York
SanFrancisco
Beijing
Tel Aviv
Tokyo
Singapore
London, UK
Hong Kong
50
100
150
200
250
300
350
88 90 92 94 96 98 00 02 04 06 08 10 12 14 16
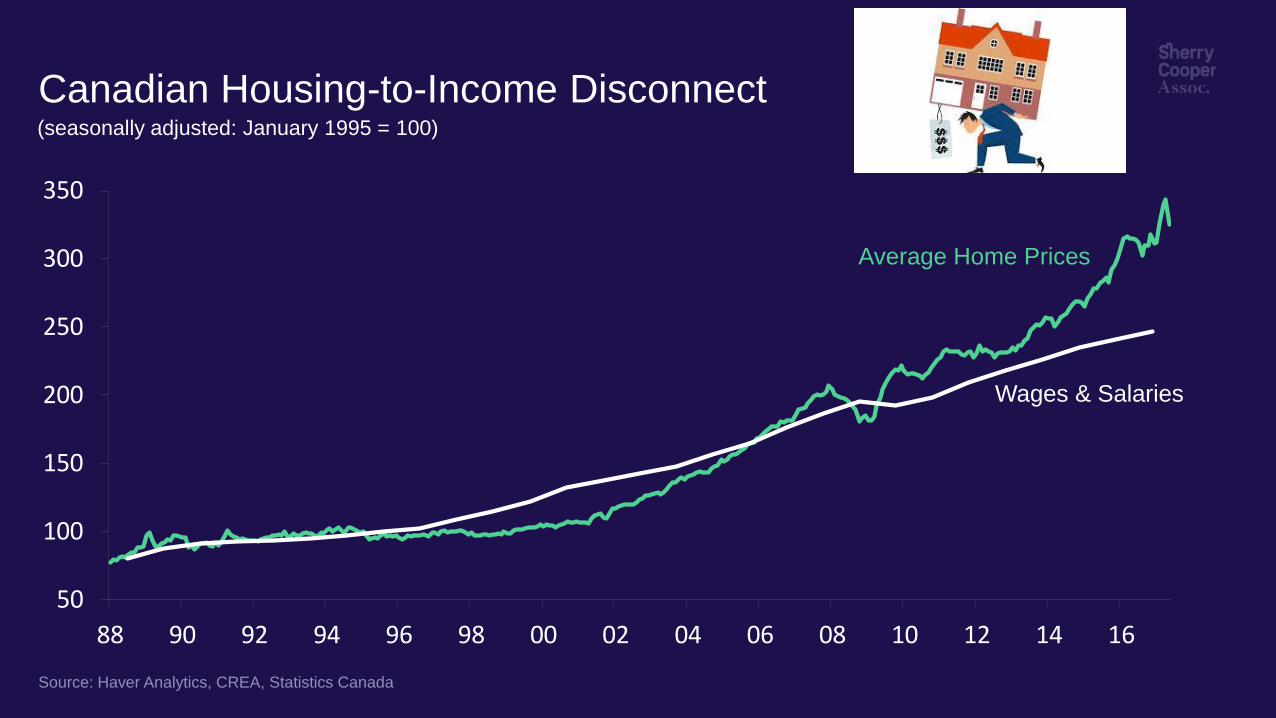
Canadian Housing-to-Income Disconnect
Source: Haver Analytics, CREA, Statistics Canada
(seasonally adjusted: January 1995 = 100)
Average Home Prices
Wages & Salaries
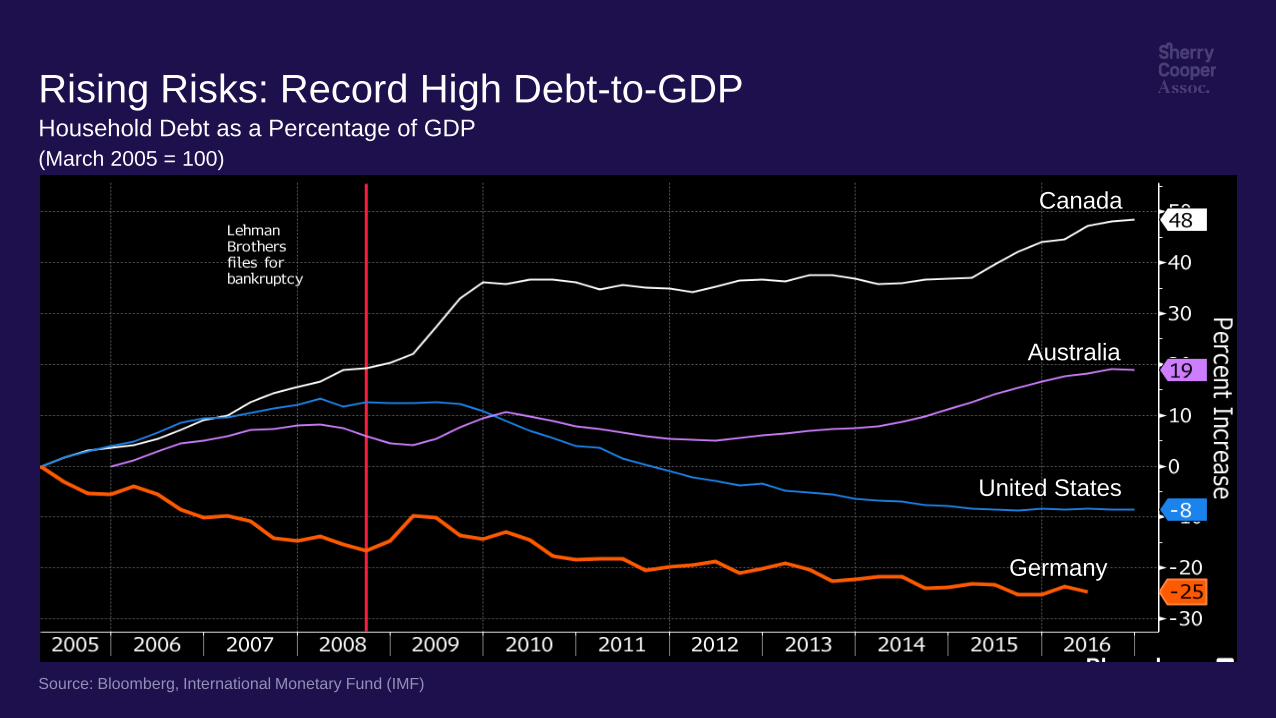
Rising Risks: Record High Debt-to-GDP
Household Debt as a Percentage of GDP
Source: Bloomberg, International Monetary Fund (IMF)
(March 2005 = 100)
Canada
Australia
United States
Germany
0
5
10
15
20
25
30
1999 2001 2003 2005 2007 2009 2011 2013 2015
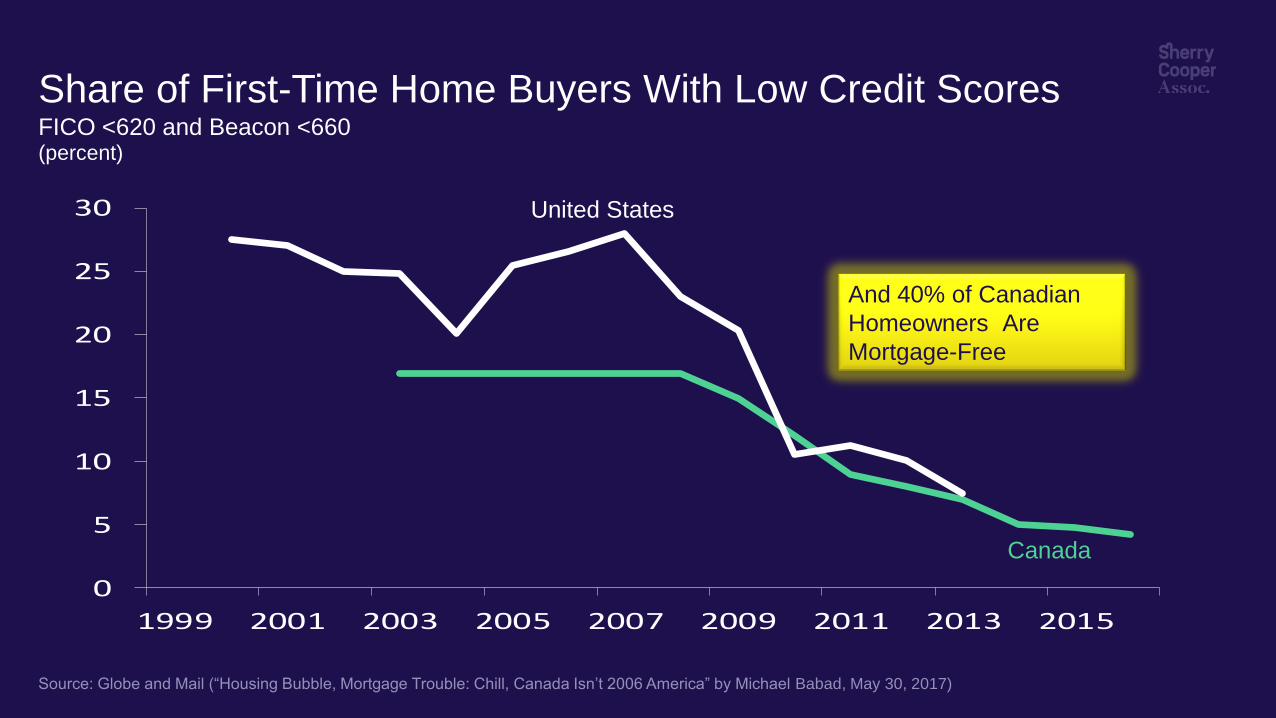
Share of First-Time Home Buyers With Low Credit Scores FICO <620 and Beacon <660 (percent)
Source: Globe and Mail (“Housing Bubble, Mortgage Trouble: Chill, Canada Isn’t 2006 America” by Michael Babad, May 30, 2017)
Canada
United States
And 40% of Canadian
Homeowners Are
Mortgage-Free
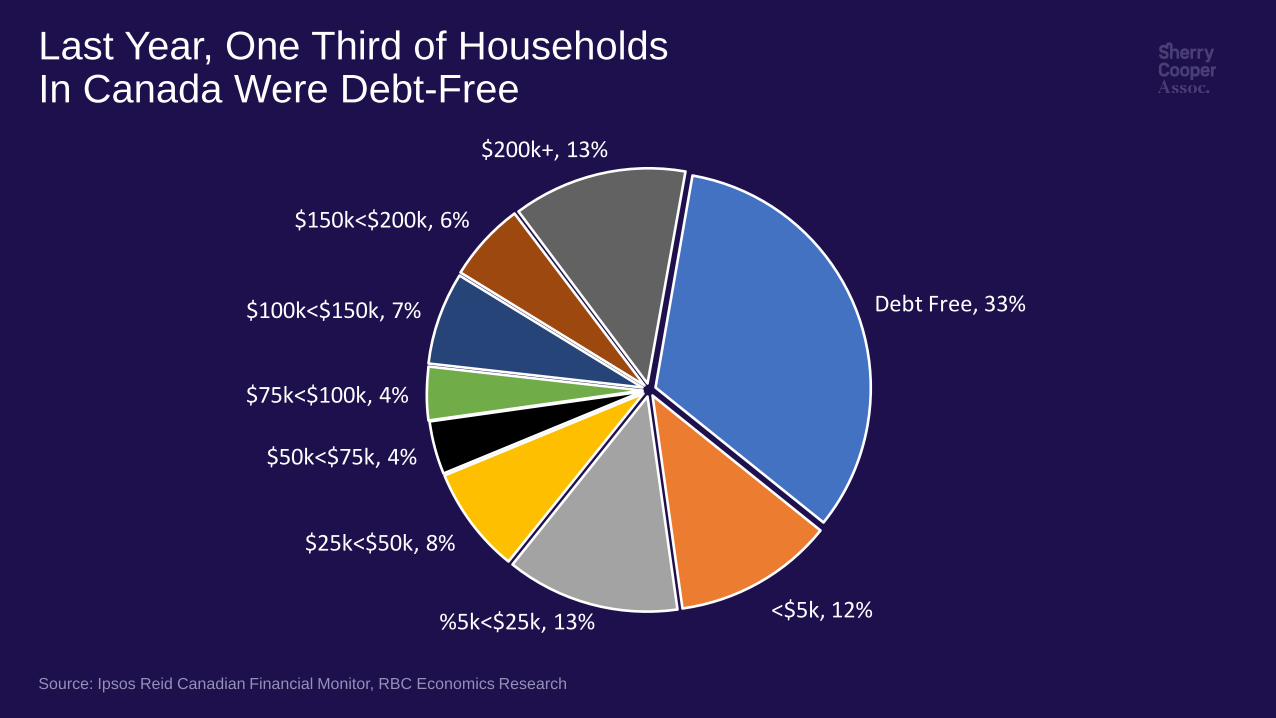
Debt Free, 33%
<$5k, 12%%5k<$25k, 13%
$25k<$50k, 8%
$50k<$75k, 4%
$75k<$100k, 4%
$100k<$150k, 7%
$150k<$200k, 6%
$200k+, 13%
Last Year, One Third of Households In Canada Were Debt-Free
Source: Ipsos Reid Canadian Financial Monitor, RBC Economics Research
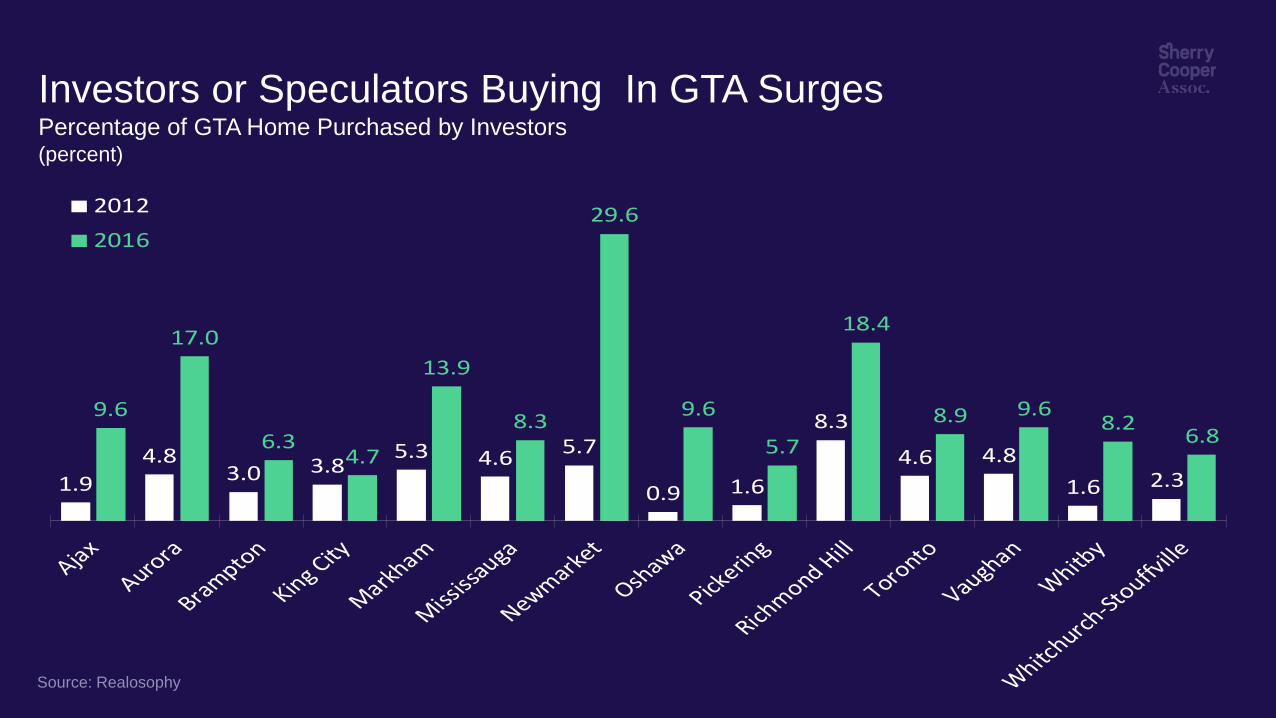
9.6
17.0
6.34.7
13.9
8.3
29.6
9.6
5.7
18.4
8.9 9.68.2
6.8
1.9
4.83.0 3.8
5.3 4.65.7
0.9 1.6
8.3
4.6 4.8
1.6 2.3
2012
2016
Investors or Speculators Buying In GTA Surges
Percentage of GTA Home Purchased by Investors
Source: Realosophy
(percent)
1 lrg title
1 lrg title + 1 subtitle
1 lrg title + 2 subtitles
1 sml + 3 lrg 2 sml + 1 lrg
2 lrg
1 sml +1 lrg; 3 sml
2 sml
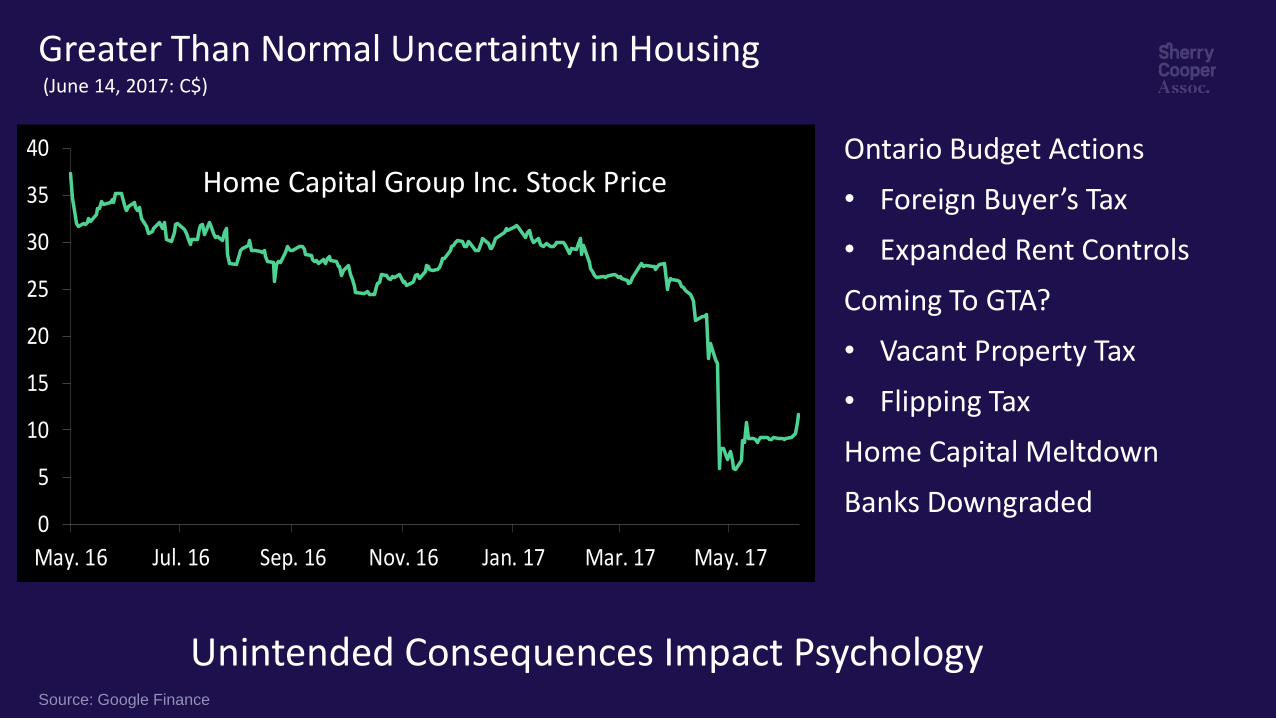
Greater Than Normal Uncertainty in Housing
Unintended Consequences Impact Psychology
Ontario Budget Actions
• Foreign Buyer’s Tax
• Expanded Rent Controls
Coming To GTA?
• Vacant Property Tax
• Flipping Tax
Home Capital Meltdown
Banks Downgraded 0
5
10
15
20
25
30
35
40
May. 16 Jul. 16 Sep. 16 Nov. 16 Jan. 17 Mar. 17 May. 17
(June 14, 2017: C$)
Home Capital Group Inc. Stock Price
Source: Google Finance
-20
-10
0
10
20
30
40
50
13 14 15 16 17
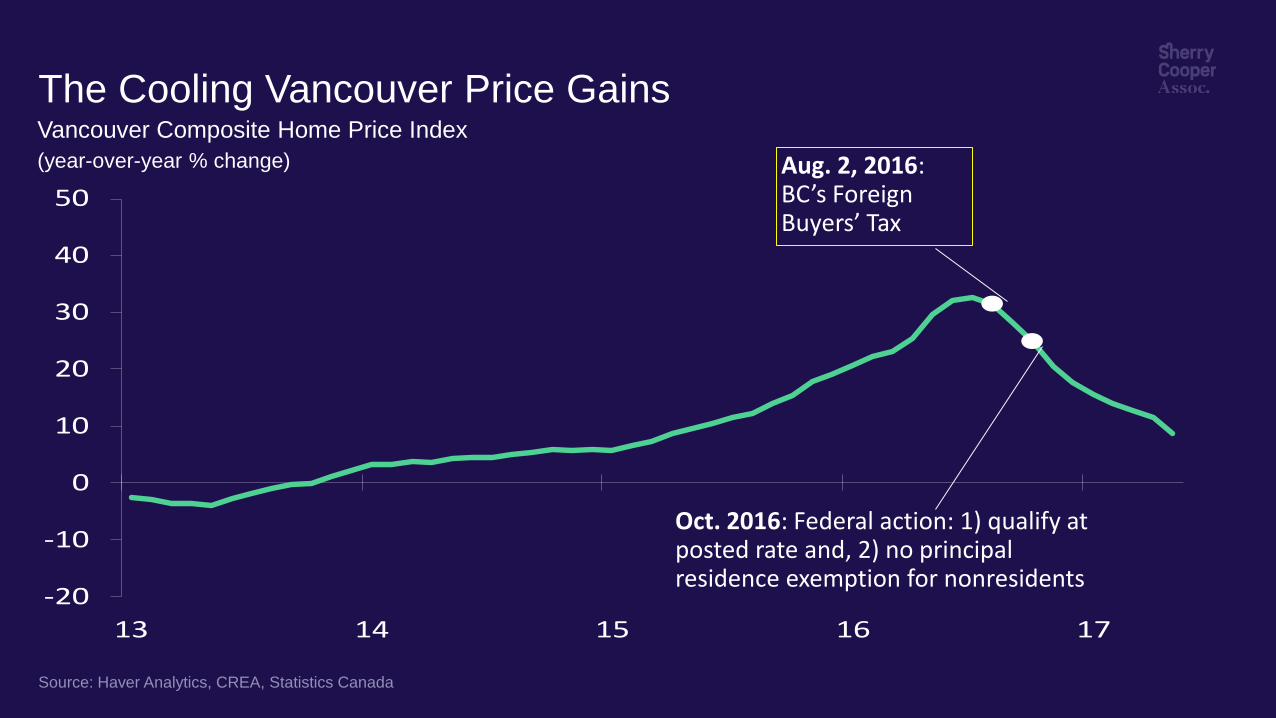
The Cooling Vancouver Price Gains
Source: Haver Analytics, CREA, Statistics Canada
Vancouver Composite Home Price Index
(year-over-year % change) Aug. 2, 2016: BC’s Foreign Buyers’ Tax
Oct. 2016: Federal action: 1) qualify at posted rate and, 2) no principal residence exemption for nonresidents
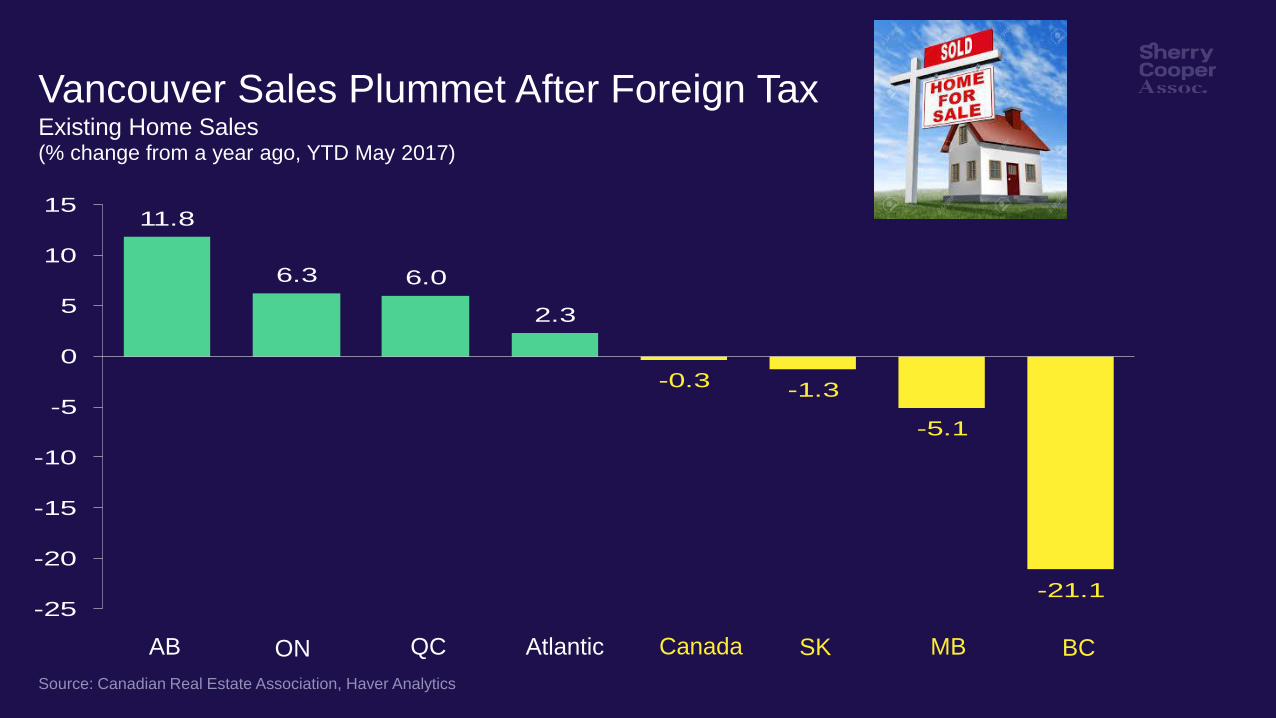
Vancouver Sales Plummet After Foreign Tax Existing Home Sales (% change from a year ago, YTD May 2017)
11.8
6.3 6.0
2.3
-0.3-1.3
-5.1
-21.1-25
-20
-15
-10
-5
0
5
10
15
Source: Canadian Real Estate Association, Haver Analytics
AB ON QC Canada MB Atlantic SK BC

0
5
10
15
20
25
30
90 92 94 96 98 00 02 04 06 08 10 12 14 16
Value of Existing Home Transactions
Source: Haver Analytics, CREA
Existing Home Sales
(C$ millions)
British Columbia
Ontario
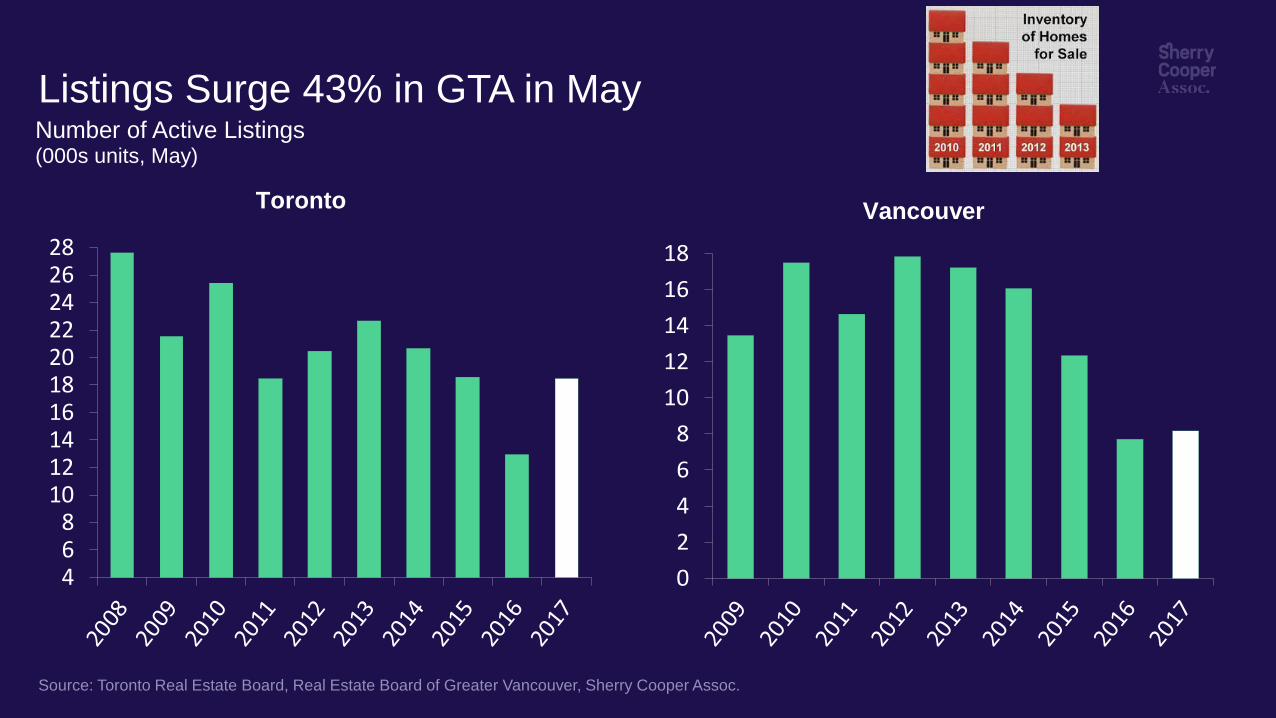
Listings Surge 43% in GTA in May Number of Active Listings (000s units, May)
Source: Toronto Real Estate Board, Real Estate Board of Greater Vancouver, Sherry Cooper Assoc.
Toronto Vancouver
468
10121416182022242628
0
2
4
6
8
10
12
14
16
18
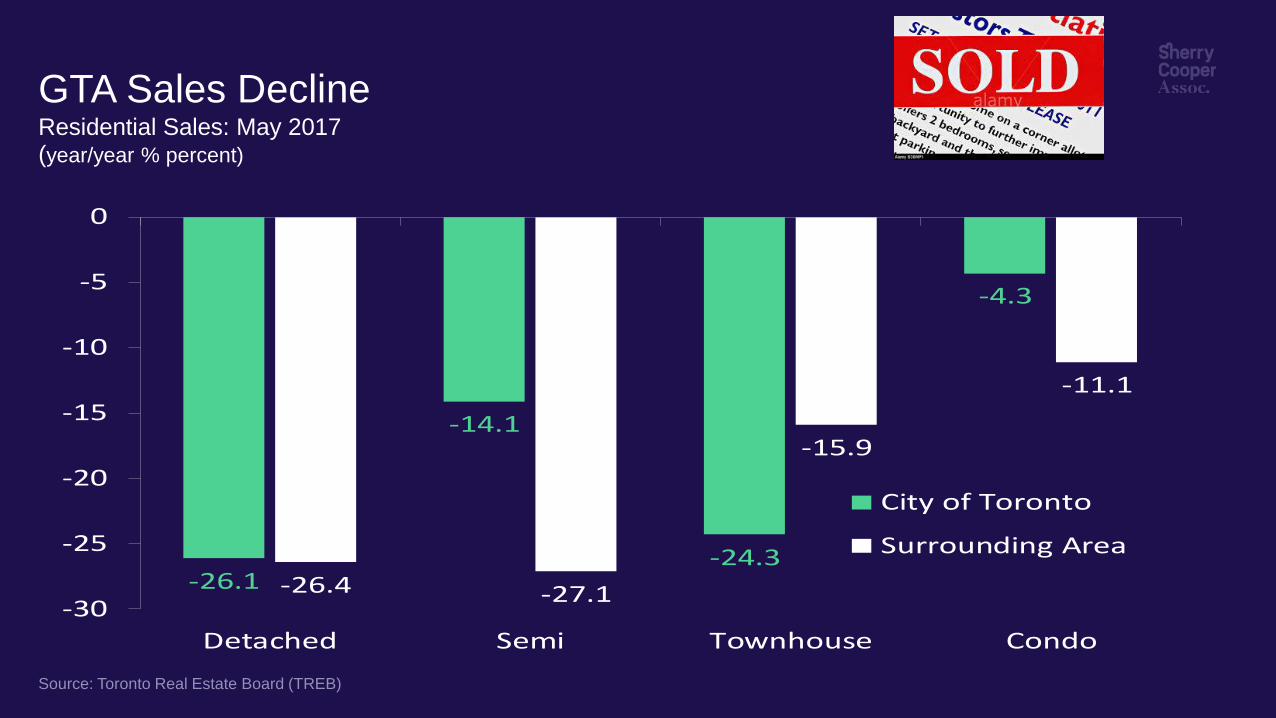
GTA Sales Decline Residential Sales: May 2017 (year/year % percent)
Source: Toronto Real Estate Board (TREB)
-26.1
-14.1
-24.3
-4.3
-26.4 -27.1
-15.9
-11.1
-30
-25
-20
-15
-10
-5
0
Detached Semi Townhouse Condo
City of Toronto
Surrounding Area
0.1
0.2
0.3
0.4
0.5
0.6
0.7
0.8
0.9
1.0
2000 2004 2008 2012 2016
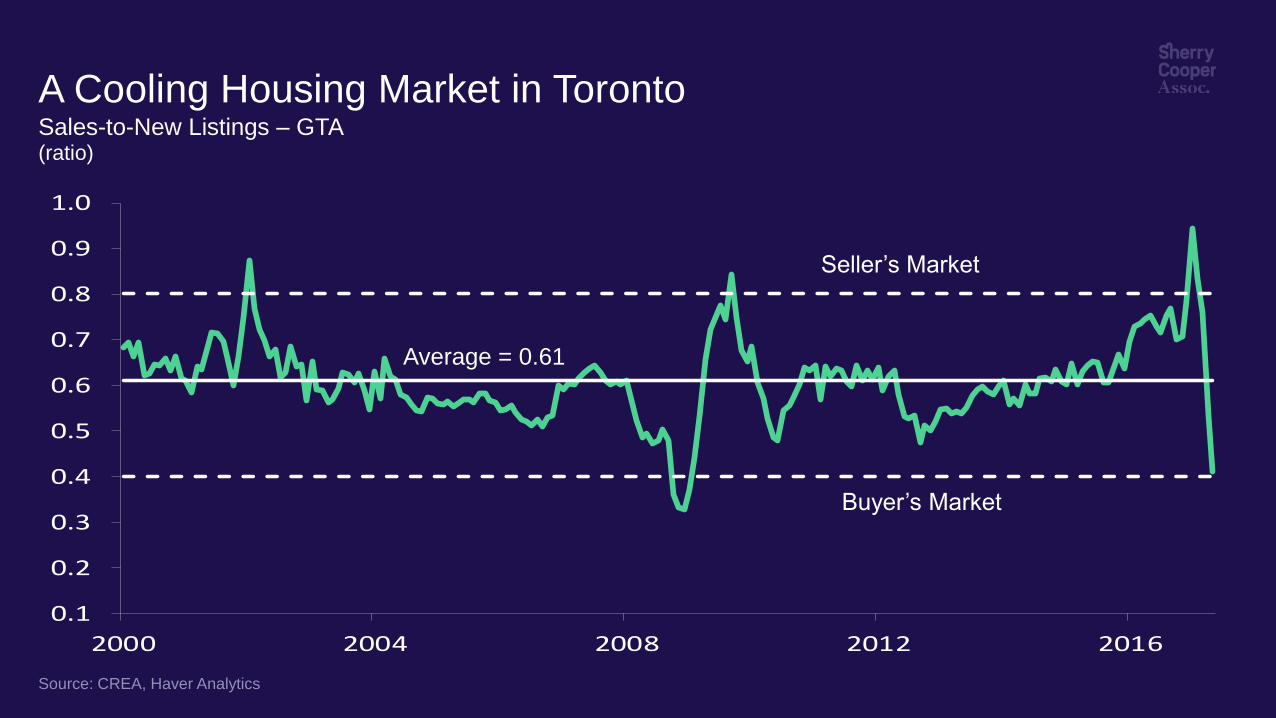
A Cooling Housing Market in Toronto Sales-to-New Listings – GTA (ratio)
Source: CREA, Haver Analytics
Average = 0.61
Seller’s Market
Buyer’s Market
0.0
0.1
0.2
0.3
0.4
0.5
0.6
0.7
0.8
0.9
1.0
2000 2004 2008 2012 2016
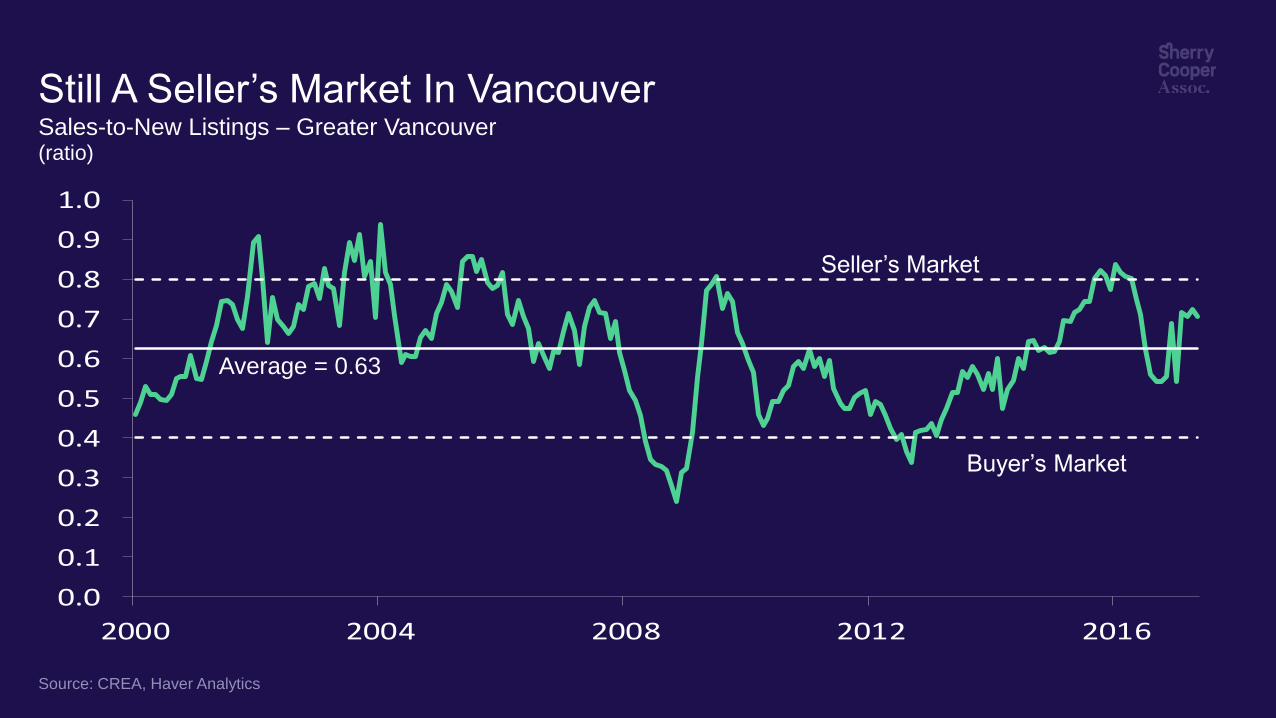
Still A Seller’s Market In Vancouver Sales-to-New Listings – Greater Vancouver (ratio)
Source: CREA, Haver Analytics
Average = 0.63
Seller’s Market
Buyer’s Market
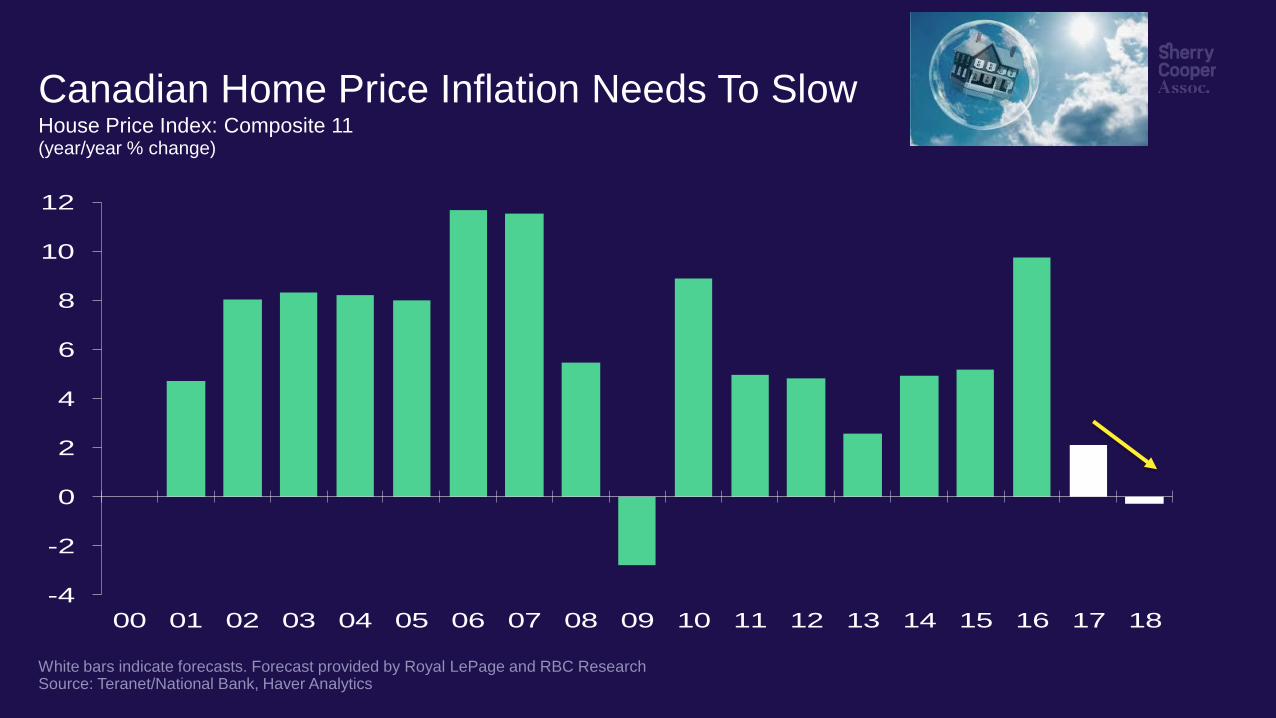
Canadian Home Price Inflation Needs To Slow House Price Index: Composite 11 (year/year % change)
White bars indicate forecasts. Forecast provided by Royal LePage and RBC Research Source: Teranet/National Bank, Haver Analytics
-4
-2
0
2
4
6
8
10
12
00 01 02 03 04 05 06 07 08 09 10 11 12 13 14 15 16 17 18

The Title of the presentation
Second line if needed
Third line if needed
Today’s date
Location of presentation
June 16, 2017
Follow Me On
www.SherryCooper.com
Twitter.com/@DrSherryCooper
Linkedin.com/in/DrSherryCooper
Facebook.com/DrSherryCooper