Embed Size (px)
Citation preview

Summary Report
Prepared for
Seed Synergy Collaboration Group
Prepared by
JRG Consulting Group a division of 1260977 Ontario Inc.
Guelph, Ontario (519) 836-1860
And
SJT Solutions Southey, Saskatchewan
(306) 726-4569
March 2018
JRG Consulting Group Collaborating for Success
in the Agri-Food Sector
Canada’s Seed System:
Economic Impact Assessment and Risk Analysis
Economic Impact Assessment and Risk Analysis – Summary Report March 2018
Prepared by JRG Consulting Group and SJT Solutions for Seed Synergy ii
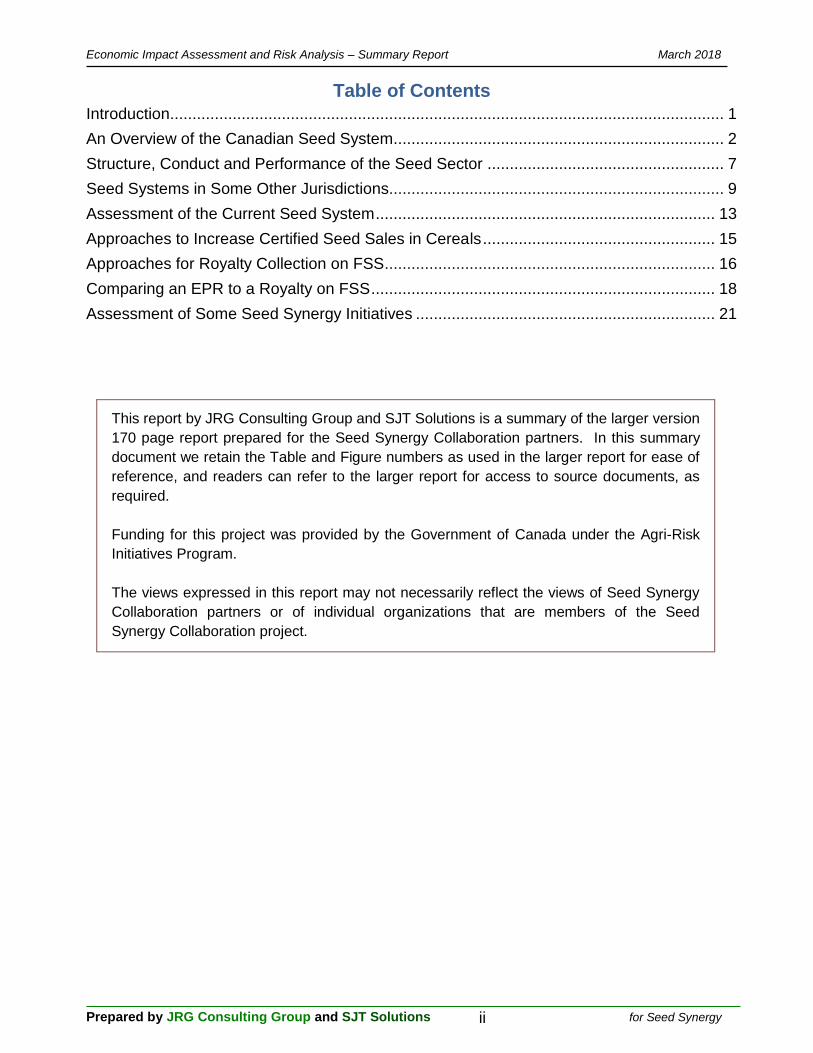
Table of Contents
Introduction ............................................................................................................................ 1
An Overview of the Canadian Seed System.......................................................................... 2
Structure, Conduct and Performance of the Seed Sector ..................................................... 7
Seed Systems in Some Other Jurisdictions........................................................................... 9
Assessment of the Current Seed System ............................................................................ 13
Approaches to Increase Certified Seed Sales in Cereals .................................................... 15
Approaches for Royalty Collection on FSS .......................................................................... 16
Comparing an EPR to a Royalty on FSS ............................................................................. 18
Assessment of Some Seed Synergy Initiatives ................................................................... 21
This report by JRG Consulting Group and SJT Solutions is a summary of the larger version
170 page report prepared for the Seed Synergy Collaboration partners. In this summary
document we retain the Table and Figure numbers as used in the larger report for ease of
reference, and readers can refer to the larger report for access to source documents, as
required.
Funding for this project was provided by the Government of Canada under the Agri-Risk
Initiatives Program.
The views expressed in this report may not necessarily reflect the views of Seed Synergy
Collaboration partners or of individual organizations that are members of the Seed
Synergy Collaboration project.

Economic Impact Assessment and Risk Analysis – Summary Report March 2018
Prepared by JRG Consulting Group and SJT Solutions 1 for Seed Synergy
Introduction The Seed Synergy Collaboration Project has six Canadian seed industry organizations that represent the Certified seed system value chain beginning with research & development, marketing, production & processing, through to sales & distribution. Seed Synergy members are the following trade associations (in alphabetic listing):
Canadian Plant Technology Agency (CPTA), Canadian Seed Growers’ Association (CSGA), Canadian Seed Institute (CSI), Canadian Seed Trade Association (CSTA), Commercial Seed Analysts Association of Canada (CSAAC), and Crop Life Canada.
Seed Synergy was formed to initiate change in the overall Canadian seed system. Seed Synergy initiatives are guided by the following vision: “A reformed, industry-led, government-enabled seed system that effectively attracts investment, fosters innovation, and delivers new and tailored seed traits to customers efficiently”. The Canadian seed industry is large, with $3.2 billion in seed sales to Canadian farmers and to overseas customers. In addition to providing advanced genetics for commercial farm operations, this value of sales supports over $6.0 billion in annual economic activity, and employment in many value added sectors of the economy. These seed sales are an integral input into the $33 billion in annual crop production sold by farmers into markets, as well as the crops used as home-grown feed and forages on livestock operations. The seed sector is key to continued productivity improvements in the Canadian agriculture and food sectors. Commercialization of new varieties that improve yields, offer disease resistance, provide attributes required by buyers of grains and oilseeds, and which improve per acre profit margins are required to enable continued competitiveness of the agriculture sector in domestic and export markets. The Advisory Council on Economic Growth (i.e., the Barton Report) is calling for an increase in agriculture and food exports, signalling out oilseed exports to increase by 20% and for pulses to capture 50% of global exports. The seed sector can continue to create such value which benefits the Canadian economy. However, changes are required to enable such value creation by product developers in the seed sector. Seed Synergy requested the consulting team of JRG Consulting Group and SJT Solutions to provide a third party assessment of proposed changes in the Canadian seed system. Within Canada, there are two rather different seed supply chains; one is the canola, corn, and soybean seed supply chain where the private sector supplies most of the new varieties, and the other is the cereal and pulse crop seed supply chain where the public sector supply most of the new seed products. These two seed supply chains are different due to the former being characterized by either hybrid crops and/or crops with patent protection and very effective intellectual property rights (IPR), and use of modern breeding technologies. In the cereals and pulse crops there is less effective IPR and the self-replicating nature of these crops have a significant effect on private sector investment, since farmers can save part of the harvest for planting next year’s crop. As a result, this report has a much larger focus on cereal and pulse crops.
Economic Impact Assessment and Risk Analysis – Summary Report March 2018
Prepared by JRG Consulting Group and SJT Solutions 2 for Seed Synergy
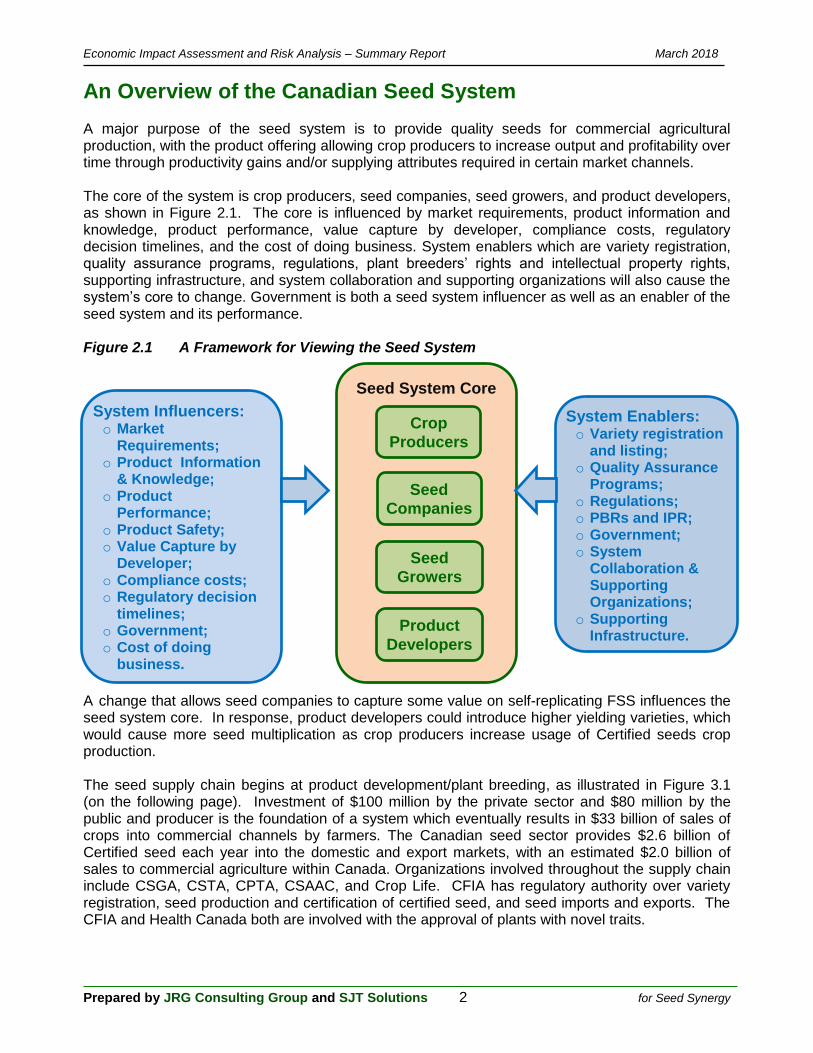
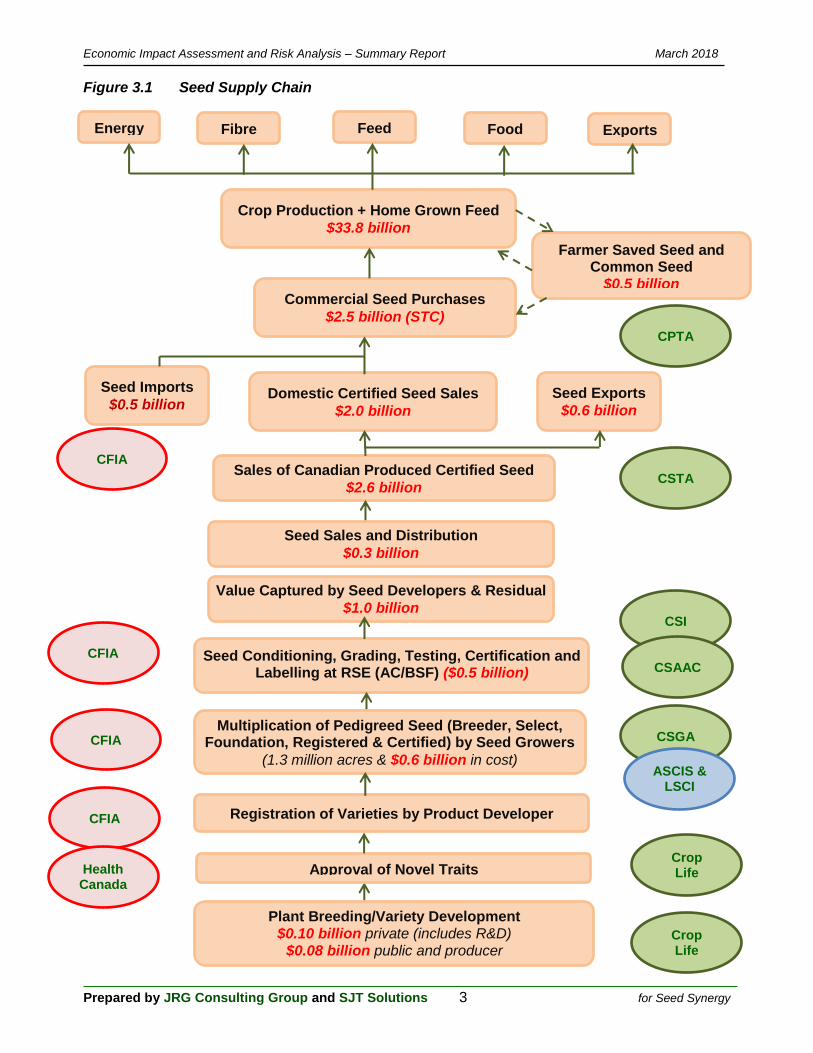
An Overview of the Canadian Seed System A major purpose of the seed system is to provide quality seeds for commercial agricultural production, with the product offering allowing crop producers to increase output and profitability over time through productivity gains and/or supplying attributes required in certain market channels. The core of the system is crop producers, seed companies, seed growers, and product developers, as shown in Figure 2.1. The core is influenced by market requirements, product information and knowledge, product performance, value capture by developer, compliance costs, regulatory decision timelines, and the cost of doing business. System enablers which are variety registration, quality assurance programs, regulations, plant breeders’ rights and intellectual property rights, supporting infrastructure, and system collaboration and supporting organizations will also cause the system’s core to change. Government is both a seed system influencer as well as an enabler of the seed system and its performance. Figure 2.1 A Framework for Viewing the Seed System A change that allows seed companies to capture some value on self-replicating FSS influences the seed system core. In response, product developers could introduce higher yielding varieties, which would cause more seed multiplication as crop producers increase usage of Certified seeds crop production. The seed supply chain begins at product development/plant breeding, as illustrated in Figure 3.1 (on the following page). Investment of $100 million by the private sector and $80 million by the public and producer is the foundation of a system which eventually results in $33 billion of sales of crops into commercial channels by farmers. The Canadian seed sector provides $2.6 billion of Certified seed each year into the domestic and export markets, with an estimated $2.0 billion of sales to commercial agriculture within Canada. Organizations involved throughout the supply chain include CSGA, CSTA, CPTA, CSAAC, and Crop Life. CFIA has regulatory authority over variety registration, seed production and certification of certified seed, and seed imports and exports. The CFIA and Health Canada both are involved with the approval of plants with novel traits.
Seed System Core
Crop
Producers
Seed
Companies
Seed
Growers
Product
Developers
System Influencers: o Market
Requirements; o Product Information
& Knowledge; o Product
Performance; o Product Safety; o Value Capture by
Developer; o Compliance costs; o Regulatory decision
timelines; o Government; o Cost of doing
business.
System Enablers: o Variety registration
and listing; o Quality Assurance
Programs; o Regulations; o PBRs and IPR; o Government; o System
Collaboration & Supporting Organizations;
o Supporting Infrastructure.
Economic Impact Assessment and Risk Analysis – Summary Report March 2018
Prepared by JRG Consulting Group and SJT Solutions 3 for Seed Synergy
Figure 3.1 Seed Supply Chain
Feed Energy Fibre Food Exports
Crop Production + Home Grown Feed
$33.8 billion
Commercial Seed Purchases
$2.5 billion (STC)
Seed Imports
$0.5 billion
Farmer Saved Seed and Common Seed
$0.5 billion
Seed Exports
$0.6 billion Domestic Certified Seed Sales
$2.0 billion
Sales of Canadian Produced Certified Seed
$2.6 billion
Seed Conditioning, Grading, Testing, Certification and Labelling at RSE (AC/BSF) ($0.5 billion)
billion)
Registration of Varieties by Product Developer
Crop Life
CSGA
CSTA
CPTA
CSI
CSAAC
Multiplication of Pedigreed Seed (Breeder, Select, Foundation, Registered & Certified) by Seed Growers
(1.3 million acres & $0.6 billion in cost) ASCIS &
LSCI
CFIA
CFIA
CFIA
Value Captured by Seed Developers & Residual
$1.0 billion
Plant Breeding/Variety Development $0.10 billion private (includes R&D)
$0.08 billion public and producer
CFIA
Crop Life Approval of Novel Traits Health
Canada
Seed Sales and Distribution
$0.3 billion
Economic Impact Assessment and Risk Analysis – Summary Report March 2018
Prepared by JRG Consulting Group and SJT Solutions 4 for Seed Synergy
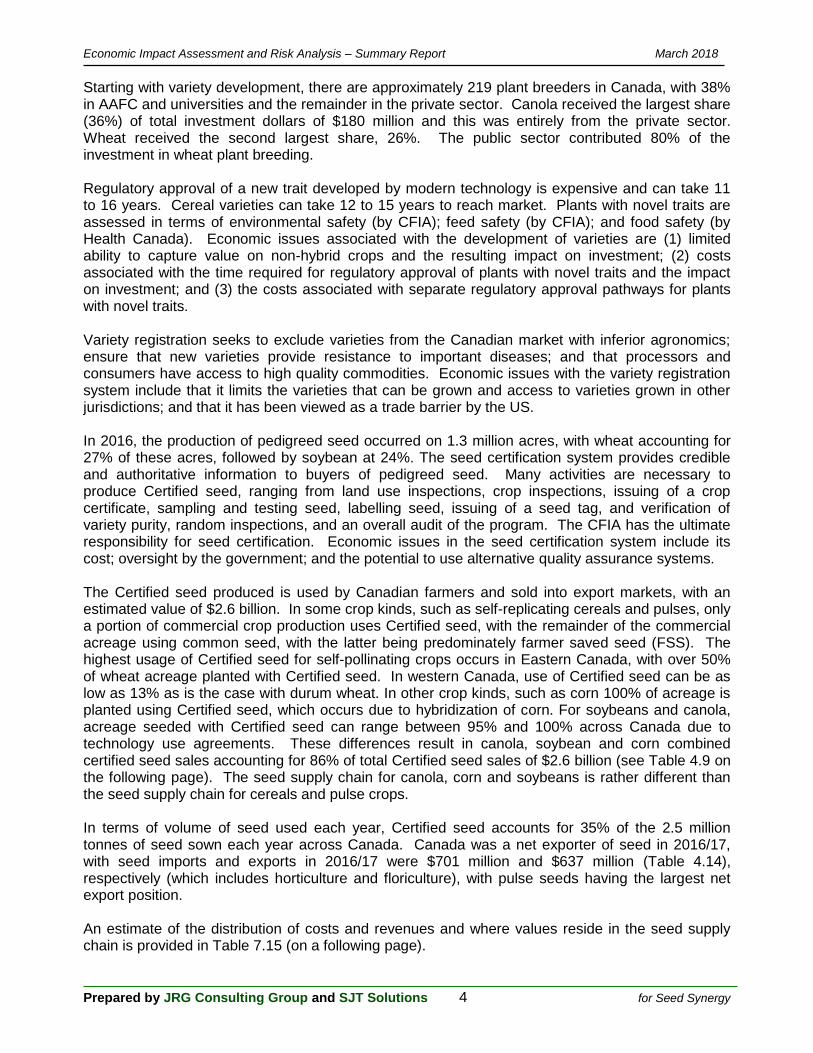
Starting with variety development, there are approximately 219 plant breeders in Canada, with 38% in AAFC and universities and the remainder in the private sector. Canola received the largest share (36%) of total investment dollars of $180 million and this was entirely from the private sector. Wheat received the second largest share, 26%. The public sector contributed 80% of the investment in wheat plant breeding. Regulatory approval of a new trait developed by modern technology is expensive and can take 11 to 16 years. Cereal varieties can take 12 to 15 years to reach market. Plants with novel traits are assessed in terms of environmental safety (by CFIA); feed safety (by CFIA); and food safety (by Health Canada). Economic issues associated with the development of varieties are (1) limited ability to capture value on non-hybrid crops and the resulting impact on investment; (2) costs associated with the time required for regulatory approval of plants with novel traits and the impact on investment; and (3) the costs associated with separate regulatory approval pathways for plants with novel traits. Variety registration seeks to exclude varieties from the Canadian market with inferior agronomics; ensure that new varieties provide resistance to important diseases; and that processors and consumers have access to high quality commodities. Economic issues with the variety registration system include that it limits the varieties that can be grown and access to varieties grown in other jurisdictions; and that it has been viewed as a trade barrier by the US. In 2016, the production of pedigreed seed occurred on 1.3 million acres, with wheat accounting for 27% of these acres, followed by soybean at 24%. The seed certification system provides credible and authoritative information to buyers of pedigreed seed. Many activities are necessary to produce Certified seed, ranging from land use inspections, crop inspections, issuing of a crop certificate, sampling and testing seed, labelling seed, issuing of a seed tag, and verification of variety purity, random inspections, and an overall audit of the program. The CFIA has the ultimate responsibility for seed certification. Economic issues in the seed certification system include its cost; oversight by the government; and the potential to use alternative quality assurance systems. The Certified seed produced is used by Canadian farmers and sold into export markets, with an estimated value of $2.6 billion. In some crop kinds, such as self-replicating cereals and pulses, only a portion of commercial crop production uses Certified seed, with the remainder of the commercial acreage using common seed, with the latter being predominately farmer saved seed (FSS). The highest usage of Certified seed for self-pollinating crops occurs in Eastern Canada, with over 50% of wheat acreage planted with Certified seed. In western Canada, use of Certified seed can be as low as 13% as is the case with durum wheat. In other crop kinds, such as corn 100% of acreage is planted using Certified seed, which occurs due to hybridization of corn. For soybeans and canola, acreage seeded with Certified seed can range between 95% and 100% across Canada due to technology use agreements. These differences result in canola, soybean and corn combined certified seed sales accounting for 86% of total Certified seed sales of $2.6 billion (see Table 4.9 on the following page). The seed supply chain for canola, corn and soybeans is rather different than the seed supply chain for cereals and pulse crops. In terms of volume of seed used each year, Certified seed accounts for 35% of the 2.5 million tonnes of seed sown each year across Canada. Canada was a net exporter of seed in 2016/17, with seed imports and exports in 2016/17 were $701 million and $637 million (Table 4.14), respectively (which includes horticulture and floriculture), with pulse seeds having the largest net export position. An estimate of the distribution of costs and revenues and where values reside in the seed supply chain is provided in Table 7.15 (on a following page).

Economic Impact Assessment and Risk Analysis – Summary Report March 2018
Prepared by JRG Consulting Group and SJT Solutions 5 for Seed Synergy
Table 4.9 Estimated Value of Certified Seed Use and Common Seed Use, by Crop Kind
Crop Kind Acreage (2015-2017 average)
Purchases of Certified
Seed
Distribution of Certified
Sales
Value of Common
Seed Used
Value of Seed Used by Crop
Farmers
million acres $ million % $ million $ million Barley 6.2 $37.8 1.4% $44.5 $82.3 Beans, all dry 0.3 $6.3 0.2% $16.6 $22.9 Canary seed 0.3 $0.8 0.0% $2.5 $3.3 Canola 21.3 $1,358.5 52% $23.5 $1,382.0 Chick peas 0.1 $0.8 0.0% $2.4 $3.2 Corn for grain 3.4 $424.6 16% $0.0 $424.6 Fababeans 0.1 $2.9 0.1% $0.8 $3.7 Flaxseed 1.2 $7.9 0.3% $7.8 $15.7 Lentils 4.8 $21.6 0.8% $66.8 $88.4 Mixed grains 0.3 $2.4 0.1% $2.8 $5.1 Mustard seed 0.4 $1.9 0.1% $9.6 $11.5 Oats 3.1 $30.5 1.2% $18.2 $48.6 Peas, dry 4.0 $21.1 0.8% $64.5 $85.6 Rye 0.4 $5.6 0.2% $4.1 $9.7 Soybeans 6.1 $463.2 18% $24.0 $487.2 Sunflower seed 0.1 $2.7 0.1% $0.3 $3.0 Wheat, durum 5.7 $25.0 1.0% $74.6 $99.6 Wheat, spring 16.1 $95.2 3.6% $154.1 $249.3 Wheat, winter 1.4 $42.2 1.6% $9.9 $52.0 Tame hay 16.6 $62.1 2.4% $0.0 $62.1
Total above 91.8 $2,613.0 100% $526.9 $3,139.9
Source: Calculation using certified seed sales by region estimates, acreage by region (Using CANSIM 001-0010), seeding rates based on OMAFRA crop budgets and Crop Planning Guide 2016 and 2017 (Government of Saskatchewan), certified seed prices based on Crop planning Guide and OMAFRA crop budgets
Table 4.14 Value of Seed Exports and Imports, 2015/16 and 2016/17
Crop Kind Exports Imports Net Exports 2015/16 2016/17 2015/16 2016/17 2015/16 2016/17
$ million $ million $ million $ million $ million $ million
Pulses $167.5 $176.8 $46.5 $38.9 $121.1 $137.9 Forages and grasses $179.9 $162.9 $85.7 $82.1 $94.2 $80.8 Corn $46.0 $103.8 $170.5 $212.2 ($124.5) ($108.4) Hemp $89.2 $101.5 $0.0 $0.0 $89.1 $101.5 Soybeans $20.6 $69.6 $9.2 $30.3 $11.3 $39.3 Rye $21.4 $20.5 $0.1 $0.2 $21.4 $20.3 Canola and rapeseed $19.8 $19.9 $72.9 $57.8 ($53.1) ($37.9) Linseed $19.5 $19.6 $13.2 $14.2 $6.3 $5.4 Oats $7.8 $8.1 $0.1 $0.1 $7.7 $7.9 Buckwheat $5.9 $6.4 $0.4 $0.0 $5.6 $6.4 Wheat and Durum $15.8 $3.5 $3.0 $3.1 $12.8 $0.4 Vegetable $2.2 $3.2 $150.5 $152.3 ($148.3) ($149.1) Barley $4.5 $2.7 $12.7 $0.2 ($8.3) $2.6 Sorghum and millet $1.1 $1.2 $0.8 $0.9 $0.3 $0.3 Sunflower $0.6 $0.8 $4.6 $6.1 ($4.0) ($5.3) Sugar beets $0.1 $0.0 $10.2 $10.5 ($10.2) ($10.4) Cotton $0.0 $0.0 $1.7 $1.4 ($1.7) ($1.4) Sweet corn $0.0 $0.0 $8.1 $8.0 ($8.1) ($8.0) Ground nuts $0.0 $0.0 $0.0 $0.0 ($0.0) ($0.0) Flower seed $0.0 $0.0 $18.3 $19.0 ($18.3) ($19.0)
Total $601.7 $700.5 $608.3 $637.3 ($6.6) $63.2
Source: Statistics Canada, CATSNET Analytics (July to June time frame)
Economic Impact Assessment and Risk Analysis – Summary Report March 2018
Prepared by JRG Consulting Group and SJT Solutions 6 for Seed Synergy
Table 7.15 Estimated Revenues and Costs in the Seed Supply Chain (2016-2017 averages)
Segment Activity cost/revenue drivers Quantity Units Per Unit
Value
Units Revenues Costs Cumulative
Revenues
Cumulative
Costs
Dist. of
costs
Dist. Of
revenu
esProduct Development
Public/university plant breeders number, $/breeder 84 breeders $1,000,000 $/breeder $84.0 $84.0
Producer funding and government funding number of projects funded $84.0 $84.0 $84.0
Private company breeders (scientists) number, $/scientist 135 scientists $1,000,000 $/scientist $135.0 $84.0 $219.0
Compliance costs with PNTs no. of traits, cost/trait, working capital 5 traits/year $2,500,000 $/trait $12.5 $84.0 $231.5
Crop Life members, fees/member 35 members $10,000 $/member $0.35 $84.0 $231.9 7%
Variety Registration
2 years of test plots no. of plots, cost/plot, varieties registered 250 varieties $4,000 $/variety $1.0 $84.0 $232.9
variety registration fee fee amount, varieties registered 250 varieties $875 $/variety $0.2 $84.0 $233.1
PBR application fee amount, varieties applied 200 varieties $2,000 $/variety $0.4 $84.0 $233.5
Filing for VRO and PBR application time required, no of filings 450 applications $1,000 $/application $0.5 $84.0 $233.9 7%
Seed Production
Cost of seed production (cereals and pulses) acres, cost/acre, crop kind 745,146 acres $380 $/acre $282.9 $84.0 $516.8
Cost of seed production (other crop kinds) acres, cost/acre, crop kind 575,207 acres $616 $/acre $354.2 $84.0 $871.0
Seed grower return acres, cost/acre, crop kind 1,320,352 acres $483 $/acre $637.1 $721.1 $871.0
Grower acreage fee acres, rate/acre 1,320,352 acres $1.35 $/acre $1.8 $721.1 $872.8
CSGA Grower membership fee members, rates 3,537 members $200 $/member $0.7 $721.1 $873.5
Plot fees plots, rate 2,699 plots $30 $/plot $0.1 $721.1 $873.6 27%
Field inspections
Fields pre-production inspections fields, rates 14,700 fields $25 $/field $0.4 $721.1 $873.9
Plots pre-production inspections plots, rates 2,699 plots $200 $/plot $0.5 $721.1 $874.4
Crop Inspections acres, cost/acre, inspection/acre 1,639,123 inspection $3.50 $/acre $5.7 $721.1 $880.2
Authorized Seed Crop Inspection Services (ASCIS).acres, rate/acre 858,863 acres $0.12 $/acre $0.1 $721.1 $880.3 27%
Seed Processing
Processing costs (cereals and pulses) volume, $/bag 955,190 tonnes $110 $/tonne $105.3 $721.1 $985.5
Shrink (cereals and pulses) % of volume, feed value 10% % $25.42 $721.1 $1,010.9
Processing costs (other crop kinds) volume, $/bag 681,368 tonnes $132 $/tonne $90.1 $721.1 $1,101.0
Shrink (other crop kinds) % of volume, feed value 15% % $39.19 $721.1 $1,140.2
Seed bag, seed tag, etc. volume, $/bag 1,438,834 tonnes $44 $/tonne $63.4 $721.1 $1,203.7
Seed treat volume, $/bag 1,438,834 tonnes $132 $/tonne $190.3 $721.1 $1,393.9
Lab fees lots, $/lot 25,000 lots $100 $/test $2.5 $721.1 $1,396.4
CSI fees no. of RSE, annual fee 968 no. $825 $/RSE $0.8 $721.1 $1,397.2
Audit costs no. of RSE, audit fee, frequency 968 no. $250 $/RSE $0.2 $721.1 $1,397.5 43%
Seed Sales and Distribution
Sales and distribution costs (on all domestic sales)volume of certified seed, $/bag 858,863 tonnes $290 $/tonne $249.1 $721.1 $1,646.5
CSTA membership fee members, fee rate 133 members $7,000 $/member $0.9 $721.1 $1,647.5
CPTA members, fees/member 25 members $6,360 $/member $0.16 $721.1 $1,647.6
Certified seed sales - cereals and pulse acreage, seeding rate, $/bag 10.4 million acres $29 $/acre $304.6 $304.6 $1,647.6 9%
Certified seed sales - corn, canola and soybean acreage, seeding rate, $/bag 30.1 million acres $75 $/acre $2,246.3 $2,550.8 $1,647.6 70%
Certified seed sales - forages and grasses acreage, seeding rate, $/bag 16.6 million acres $4 $/acre $62.1 $2,613.0 $1,647.6 2%
Value of seed export sales volume, $/tonne 750,000 tonnes $800 $/tonne $600.0 $3,213.0 $1,647.6 51% 19%
Revenue from the market $3,213.0
Seed company supply chain incurred costs $1,647.6 51%
Royalties on cereals and pulses Certified seed $/bag, certified seed sales 482,624 tonnes $1.75 $/50 lb bag $37.2 $37.2 1%
FSS royalties on cereals and pulses $/bag, common seed use 1,583,172 tonnes $0.00 $/50 lb bag $0.0 $0.0 0%
EPR on cereals and pulses $/tonne, tonnage sold 49.0 million tonnes $0.00 $/tonne $0.0 $0.0 0%
Royalties on corn and oilseeds and forages $/bag, certified seed sales 376,239 tonnes $55.00 $/50 lb bag $912.4 $949.6 30%
Government and producer funds for breeding $84.0 3%
Imports of seed (exclude horticulture) $450.0 14%
Residual/ profit margins in the seed supply chain $44.5 1%
Domestic sales check $2,613.0
Supporting organizations
CPTA members, fees/member 25 members $6,360 $/member $0.16 $0.16
CSGA members, fees/member 3,537 members $200 $/member $0.71 $0.87
CSTA members, fees/member 133 members $7,000 $/member $0.93 $1.80
CSI fees no. of RSE, annual fee 968 no. $1,500 $/RSE $1.45 $3.25
Crop Life members, fees/member 35 members $10,000 $/member $0.35 $3.60
Total $3.60
Economic Impact Assessment and Risk Analysis – Summary Report March 2018
Prepared by JRG Consulting Group and SJT Solutions 7 for Seed Synergy
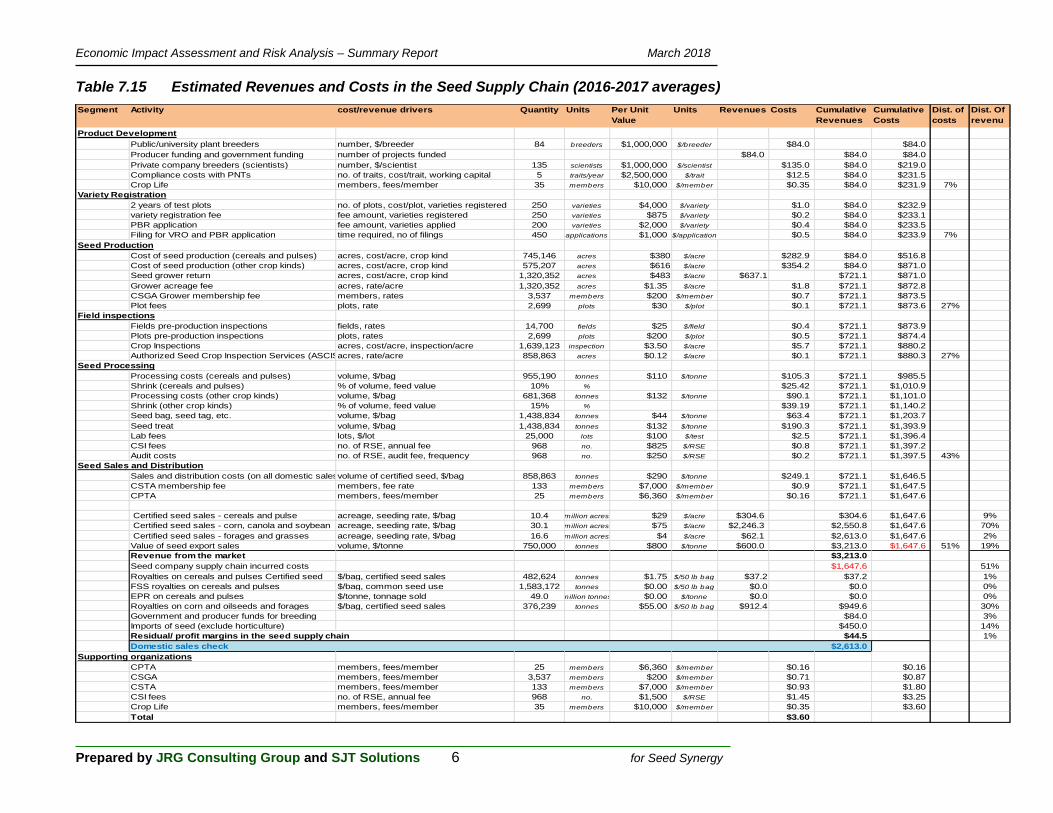
Structure, Conduct and Performance of the Seed Sector Basic conditions such as technology and regulation influence the structure of an industry, which is the number and size of firms, concentration, product differentiation, and barriers to entry. Structure, in turn, influences conduct which refers primarily to pricing. Conduct then influences performance which refers to various types of efficiency and to investment. An examination of the plant breeding and sales and distribution sectors for cereals, pulse, specialty crops and canola in Western Canada found high levels of concentration/dominance by a few large organizations. In terms of basic conditions, cereals, pulses and specialty crops are self-replicating, exhibit high use of farmer saved seed (FSS) and have relatively ineffective intellectual property rights (IPR). In the cereal and pulse sector, the public sector dominates with financial contributions by producers and taxpayers. These public sector product developers do not exercise any potential market power. This behavior and the basic conditions result in minimal value capture characterized by low investment and little private sector involvement. In the case of cereals and pulses, seed production and distribution is dominated by grower owned and directed organizations, which has not resulted in the exercise of market power. Due to these conditions, investment in plant breeding is rather low and unattractive to the private sector. Canola, on the other hand, is a hybrid crop and/or patent protected with very effective IPR and minimal use of FSS. In canola and in corn and soybeans, for example, the product developer segment has a few large firms and there are high barriers to entry (Table 7.17 provides a comparison between these two supply chains). Table 7.17 Summary Structure and Performance View of Two Major Seed Supply Chains
Item/Sector Cereals and Pulses Canola, Corn & Soybeans Basic conditions
o Self-replicating crops with farmers exemption – product substitution (FSS);
o Low incentive to use of modern breeding technologies;
o low share of market with PBR (UPOV 91); o Ineffective IPR
o Hybrid crops and/or patent protection; o High use of modern breeding
technologies; o Very effective IPR
Product developer
o Concentrated with public sector (gov't and universities) having major share;
o Most developers not integrated into downstream activities
o Concentrated with private sector having major share;
o Developers are vertically integrated with (downstream) seed distribution
Value capture by product developer
o Minimal value capture on products commercialized;
o Product substitution possible (via FSS); o $37 million associated with Certified seed
sales of $305 million (~12%)
o Basic conditions and oligopolistic behaviours enable value capture through pricing;
o $950 million on Certified seed sales of $2.2 billion (~40%)
Seed distributor o Monopolistic competition o Concentrated, however owned mostly by
seed growers; o Limited pricing power due to competition
with direct sales by seed growers
o Monopolistic competition o Concentrated; o Seed distributors are owned
by/affiliated by product developers
Seed grower o Perfect competition; o Price takers on seed production activities;
many growers are vertically integrated (upstream) into seed distribution
o Perfect competition; o Price takers on seed production
activities
Commercial farmer
o Perfect competition; o Price taker
o Perfect competition; o Price taker
End-use o Primarily commodity markets o Primarily commodity markets aside from food-grade soybeans and specialty oilseeds
Economic Impact Assessment and Risk Analysis – Summary Report March 2018
Prepared by JRG Consulting Group and SJT Solutions 8 for Seed Synergy
There are public breeders offering non-GM food grade soybean varieties. In contrast to cereals and pulse crops, canola product developers do exercise market power and because of this and the basic conditions noted, the ability to capture value results in high levels of investment in plant breeding. The seed production and distribution sectors in canola (and corn and soybeans) are characterized by companies selling differentiated products. A key difference between the canola (and corn and soybeans) is that canola seed production and distribution is controlled by the plant breeders/product developers through forward integration. This further enables the use of their market position to capture value through pricing of seed products. This different structure and basic conditions enables product developers to capture value through prices charged for Certified seed. There is much less value captured in the cereals and pulses supply chain (e.g., $37 million) by product developers compared to canola corn and soybeans (e.g., $950 million) as indicated above in Table 7.15. Basic conditions, such as use of PBR, can enable collection of royalties on FSS and increase overall value capture by product developers. Given the two rather distinct seed supply chains – of (1) cereal and pulse crops, and (2) canola, corn and soybeans as an example of the other seed supply chain – and the issues facing the cereal and pulse crop sector much of the analysis focuses on the seed supply chain for cereals and pulses.
Economic Impact Assessment and Risk Analysis – Summary Report March 2018
Prepared by JRG Consulting Group and SJT Solutions 9 for Seed Synergy
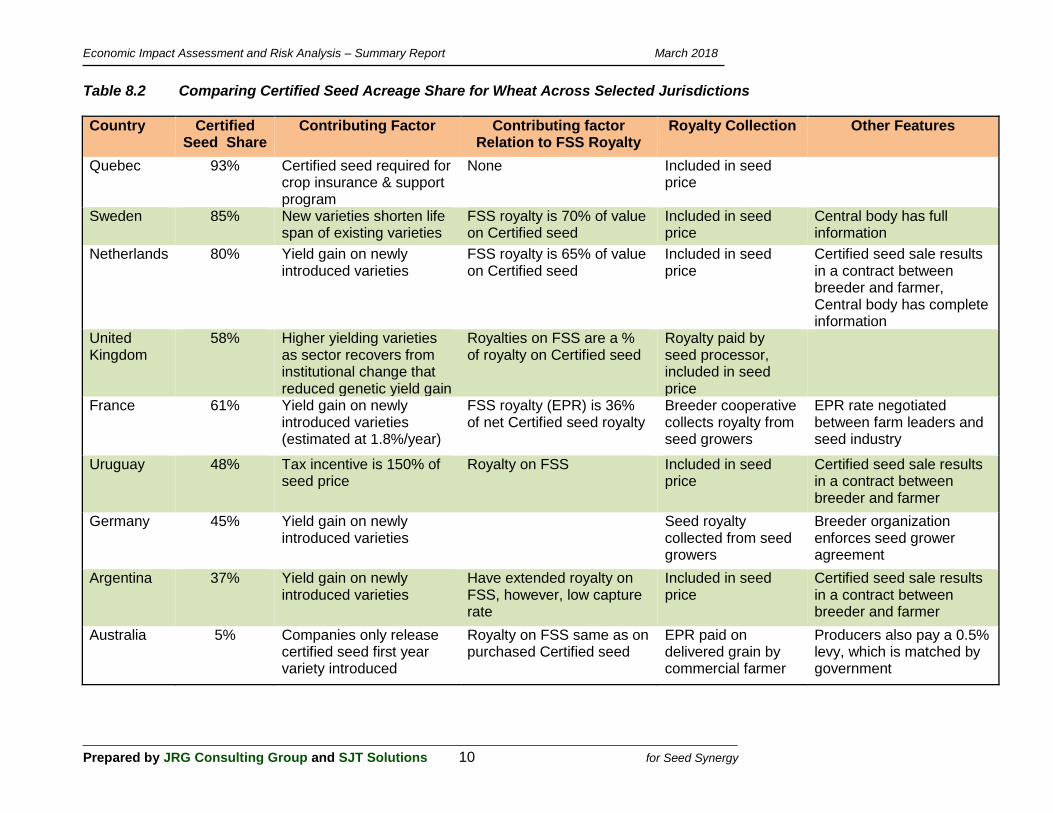
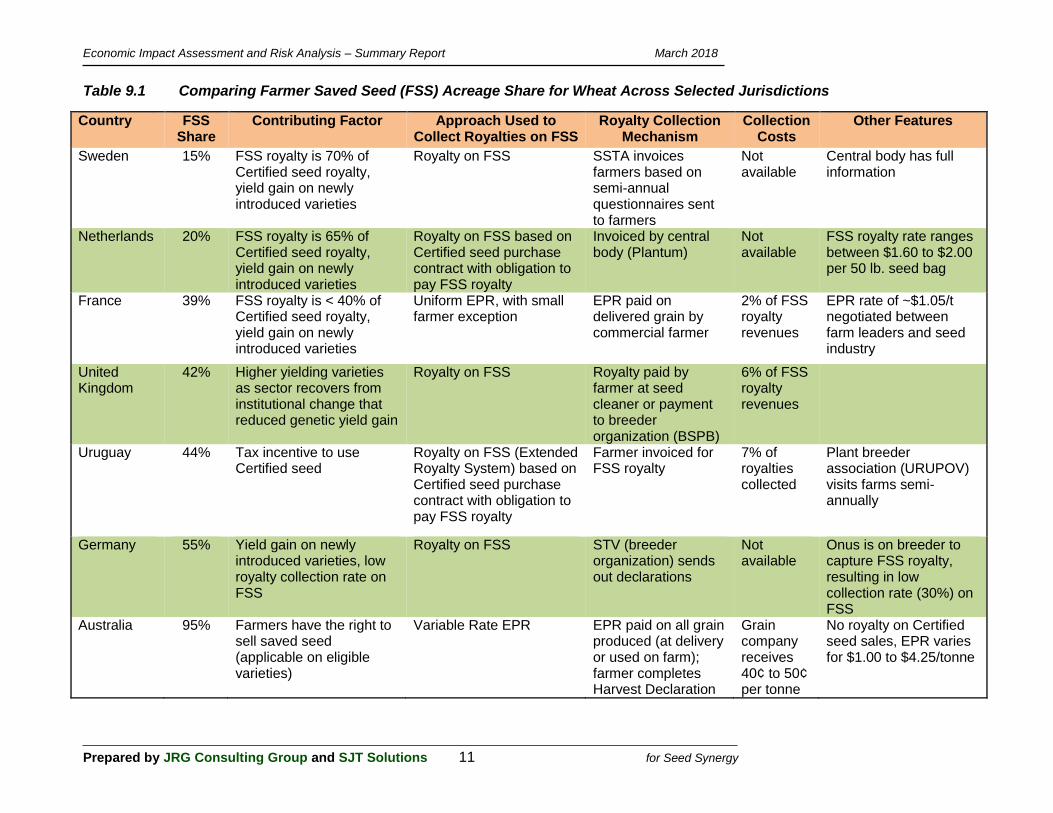
Seed Systems in Some Other Jurisdictions The use of Certified seed versus FSS varies significantly across the regions, with high usage of Certified seed for wheat in Quebec, Sweden, the Netherlands, the U.K., and France for example, with very low use of Certified seed in Australia (estimated at 5%). In western Canada in any year spring wheat acreage sown with Certified seed can range between 21% and 32% of planted acres. Quebec has a 93% Certified wheat seed acreage share, with this high level resulting from cross-compliance, where Certified seed must be used for crop insurance and income stabilization programs. Table 8.2 provides a summary of Certified seed share for wheat in selected countries and identifies potential factors contributing to the Certified seed market share. In the Netherlands and Sweden, Certified seed usage is over 80% for wheat, which can be attributed to (1) yield gain on newly released varieties, and (2) a royalty is collected on FSS, with the FSS royalty set at 70% of the Certified seed rate in Sweden and at 65% in the Netherlands. These conditions also apply in the UK, where the Certified seed share is over 50%. The higher the FSS royalty, in relation to the Certified seed royalty, the greater the farmer incentive to use Certified seed. In Uruguay, a tax incentive of 150% of the seed price is used to encourage use of Certified seed, which contributes to the 48% Certified seed share. The share of wheat acreage in France that uses Certified seed in any year is around 61%, which can be attributed to the introduction of higher yielding varieties and the use of an end-point-royalty (EPR) on all wheat sold (with a partial rebate on the Certified seed royalty). Royalty rates on Certified seed, the refund rate, and the EPR rate is negotiated between the seed industry and the farm leaders. Australia uses an EPR, with the royalty rate being variety specific, and no royalty embedded in the purchase price of Certified seed. For small grains, only 5% of the seed used is certified in Australia while 95% is FSS. For some varieties, farmers are allowed to sell seed to other growers (seed sharing), which tends to favour greater use of FSS. (See also Table 9.1). As in Canada, the US does not use an EPR system or collect royalties on FSS. In the US, 100% of royalties on certified seed are collected. The US uses Certified seed, quality assured seed, and common seed. In the Pacific North West, certified seed use is very high, 85% because of the use of contracts forbidding the use of FSS. In North Dakota, the share of certified seed in spring wheat is 40% because associated pre-treatment saves farmers’ time. Quality assured seed for wheat is found primarily in the Mid-West where it is sold by brand and not variety. There is no variety registration in the U.S. and some seed companies find that quality assured seed protects the confidentiality of seed more than the AOSCA’s certification process requiring information on origin and breeding process. There are some design elements in seed systems in Europe and in Australia that could be considered in Canada to support a royalty system on FSS. For example, in Australia the EPR is payable on all grain produced, not just what is delivered to an elevator. A contract between the PBR owner or the licensed commercialization agent and the grower lays out the terms and conditions of use of a new variety. The variety license agreement spells out whether the grower can sell to other growers (seed sharing). Each year farmers complete and submit an “EPR Harvest Declaration” which requires information on the following quantities: seed sown; harvest grain sold (and buyer’s identity); used on farm; in storage; and retained for planting. This information is submitted to a central body (Seedvise) which compiles necessary information, such as farmer-specific grain deliveries by variety. The EPR is collected using two systems: the automatic deduction of the EPR when the grain is delivered to a grain buyer and through invoices based on the Harvest Declaration. Seedvise is being used by some grain companies and royalty managers to simplify the administration and collection of EPRs. Grain elevators receive a fee to collect the EPR.
Economic Impact Assessment and Risk Analysis – Summary Report March 2018
Prepared by JRG Consulting Group and SJT Solutions 10 for Seed Synergy
Table 8.2 Comparing Certified Seed Acreage Share for Wheat Across Selected Jurisdictions
Country Certified Seed Share
Contributing Factor Contributing factor Relation to FSS Royalty
Royalty Collection Other Features
Quebec 93% Certified seed required for crop insurance & support program
None Included in seed price
Sweden 85% New varieties shorten life span of existing varieties
FSS royalty is 70% of value on Certified seed
Included in seed price
Central body has full information
Netherlands 80% Yield gain on newly introduced varieties
FSS royalty is 65% of value on Certified seed
Included in seed price
Certified seed sale results in a contract between breeder and farmer, Central body has complete information
United Kingdom
58% Higher yielding varieties as sector recovers from institutional change that reduced genetic yield gain
Royalties on FSS are a % of royalty on Certified seed
Royalty paid by seed processor, included in seed price
France 61% Yield gain on newly introduced varieties (estimated at 1.8%/year)
FSS royalty (EPR) is 36% of net Certified seed royalty
Breeder cooperative collects royalty from seed growers
EPR rate negotiated between farm leaders and seed industry
Uruguay 48% Tax incentive is 150% of seed price
Royalty on FSS Included in seed price
Certified seed sale results in a contract between breeder and farmer
Germany 45% Yield gain on newly introduced varieties
Seed royalty collected from seed growers
Breeder organization enforces seed grower agreement
Argentina 37% Yield gain on newly introduced varieties
Have extended royalty on FSS, however, low capture rate
Included in seed price
Certified seed sale results in a contract between breeder and farmer
Australia 5% Companies only release certified seed first year variety introduced
Royalty on FSS same as on purchased Certified seed
EPR paid on delivered grain by commercial farmer
Producers also pay a 0.5% levy, which is matched by government
Economic Impact Assessment and Risk Analysis – Summary Report March 2018
Prepared by JRG Consulting Group and SJT Solutions 11 for Seed Synergy
Table 9.1 Comparing Farmer Saved Seed (FSS) Acreage Share for Wheat Across Selected Jurisdictions
Country FSS Share
Contributing Factor Approach Used to Collect Royalties on FSS
Royalty Collection Mechanism
Collection Costs
Other Features
Sweden 15% FSS royalty is 70% of Certified seed royalty, yield gain on newly introduced varieties
Royalty on FSS SSTA invoices farmers based on semi-annual questionnaires sent to farmers
Not available
Central body has full information
Netherlands 20% FSS royalty is 65% of Certified seed royalty, yield gain on newly introduced varieties
Royalty on FSS based on Certified seed purchase contract with obligation to pay FSS royalty
Invoiced by central body (Plantum)
Not available
FSS royalty rate ranges between $1.60 to $2.00 per 50 lb. seed bag
France 39% FSS royalty is < 40% of Certified seed royalty, yield gain on newly introduced varieties
Uniform EPR, with small farmer exception
EPR paid on delivered grain by commercial farmer
2% of FSS royalty revenues
EPR rate of ~$1.05/t negotiated between farm leaders and seed industry
United Kingdom
42% Higher yielding varieties as sector recovers from institutional change that reduced genetic yield gain
Royalty on FSS Royalty paid by farmer at seed cleaner or payment to breeder organization (BSPB)
6% of FSS royalty revenues
Uruguay 44% Tax incentive to use Certified seed
Royalty on FSS (Extended Royalty System) based on Certified seed purchase contract with obligation to pay FSS royalty
Farmer invoiced for FSS royalty
7% of royalties collected
Plant breeder association (URUPOV) visits farms semi-annually
Germany 55% Yield gain on newly introduced varieties, low royalty collection rate on FSS
Royalty on FSS STV (breeder organization) sends out declarations
Not available
Onus is on breeder to capture FSS royalty, resulting in low collection rate (30%) on FSS
Australia 95% Farmers have the right to sell saved seed (applicable on eligible varieties)
Variable Rate EPR EPR paid on all grain produced (at delivery or used on farm); farmer completes Harvest Declaration
Grain company receives 40¢ to 50¢ per tonne
No royalty on Certified seed sales, EPR varies for $1.00 to $4.25/tonne
Economic Impact Assessment and Risk Analysis – Summary Report March 2018
Prepared by JRG Consulting Group and SJT Solutions 12 for Seed Synergy
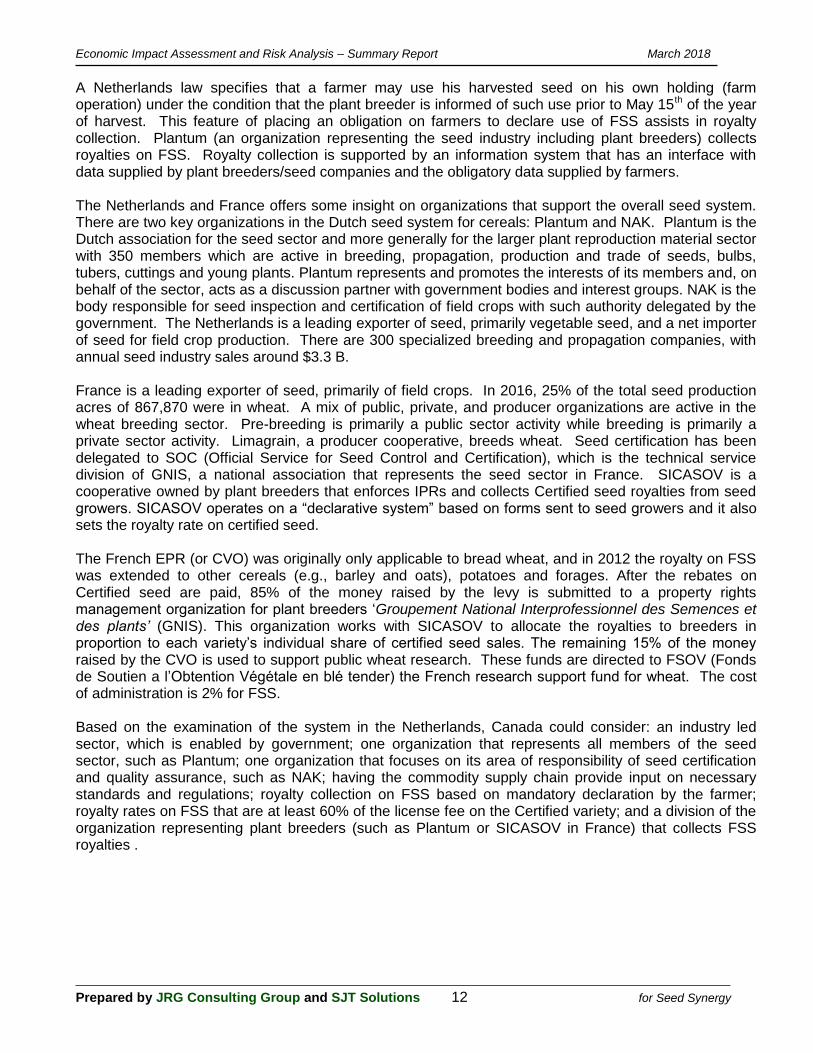
A Netherlands law specifies that a farmer may use his harvested seed on his own holding (farm operation) under the condition that the plant breeder is informed of such use prior to May 15th of the year of harvest. This feature of placing an obligation on farmers to declare use of FSS assists in royalty collection. Plantum (an organization representing the seed industry including plant breeders) collects royalties on FSS. Royalty collection is supported by an information system that has an interface with data supplied by plant breeders/seed companies and the obligatory data supplied by farmers. The Netherlands and France offers some insight on organizations that support the overall seed system. There are two key organizations in the Dutch seed system for cereals: Plantum and NAK. Plantum is the Dutch association for the seed sector and more generally for the larger plant reproduction material sector with 350 members which are active in breeding, propagation, production and trade of seeds, bulbs, tubers, cuttings and young plants. Plantum represents and promotes the interests of its members and, on behalf of the sector, acts as a discussion partner with government bodies and interest groups. NAK is the body responsible for seed inspection and certification of field crops with such authority delegated by the government. The Netherlands is a leading exporter of seed, primarily vegetable seed, and a net importer of seed for field crop production. There are 300 specialized breeding and propagation companies, with annual seed industry sales around $3.3 B. France is a leading exporter of seed, primarily of field crops. In 2016, 25% of the total seed production acres of 867,870 were in wheat. A mix of public, private, and producer organizations are active in the wheat breeding sector. Pre-breeding is primarily a public sector activity while breeding is primarily a private sector activity. Limagrain, a producer cooperative, breeds wheat. Seed certification has been delegated to SOC (Official Service for Seed Control and Certification), which is the technical service division of GNIS, a national association that represents the seed sector in France. SICASOV is a cooperative owned by plant breeders that enforces IPRs and collects Certified seed royalties from seed growers. SICASOV operates on a “declarative system” based on forms sent to seed growers and it also sets the royalty rate on certified seed. The French EPR (or CVO) was originally only applicable to bread wheat, and in 2012 the royalty on FSS was extended to other cereals (e.g., barley and oats), potatoes and forages. After the rebates on Certified seed are paid, 85% of the money raised by the levy is submitted to a property rights management organization for plant breeders ‘Groupement National Interprofessionnel des Semences et des plants’ (GNIS). This organization works with SICASOV to allocate the royalties to breeders in proportion to each variety’s individual share of certified seed sales. The remaining 15% of the money raised by the CVO is used to support public wheat research. These funds are directed to FSOV (Fonds de Soutien a l’Obtention Végétale en blé tender) the French research support fund for wheat. The cost of administration is 2% for FSS. Based on the examination of the system in the Netherlands, Canada could consider: an industry led sector, which is enabled by government; one organization that represents all members of the seed sector, such as Plantum; one organization that focuses on its area of responsibility of seed certification and quality assurance, such as NAK; having the commodity supply chain provide input on necessary standards and regulations; royalty collection on FSS based on mandatory declaration by the farmer; royalty rates on FSS that are at least 60% of the license fee on the Certified variety; and a division of the organization representing plant breeders (such as Plantum or SICASOV in France) that collects FSS royalties .
Economic Impact Assessment and Risk Analysis – Summary Report March 2018
Prepared by JRG Consulting Group and SJT Solutions 13 for Seed Synergy
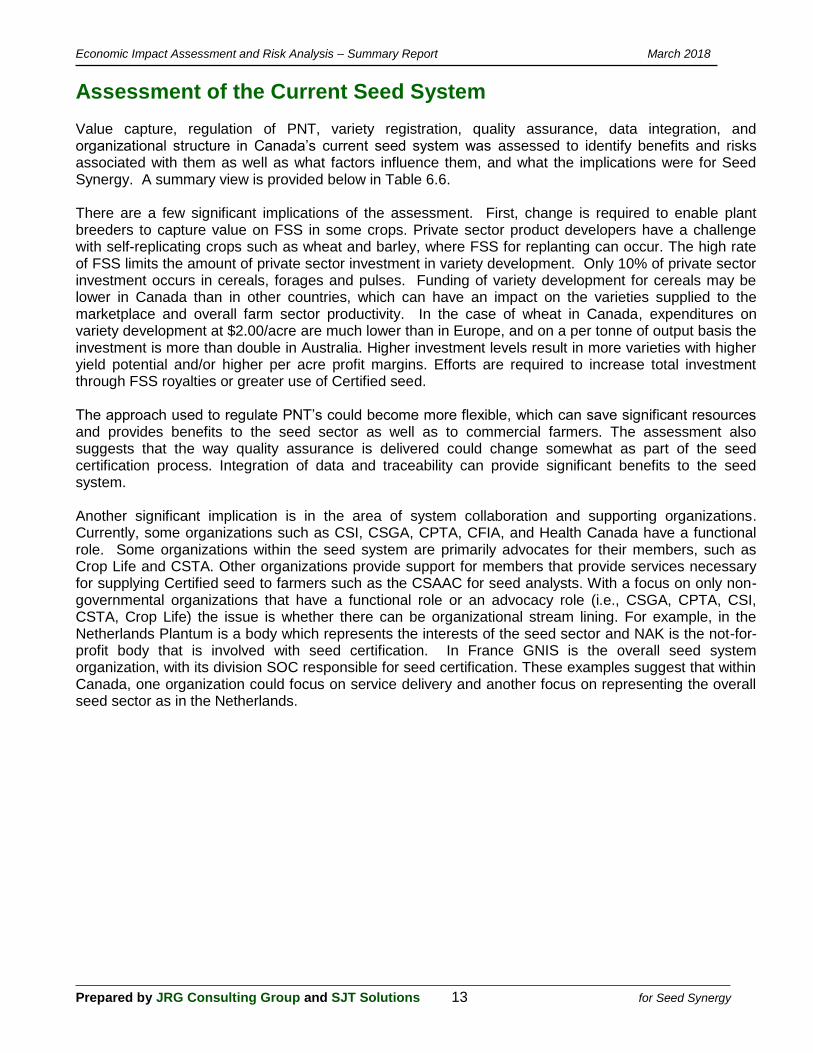
Assessment of the Current Seed System Value capture, regulation of PNT, variety registration, quality assurance, data integration, and organizational structure in Canada’s current seed system was assessed to identify benefits and risks associated with them as well as what factors influence them, and what the implications were for Seed Synergy. A summary view is provided below in Table 6.6. There are a few significant implications of the assessment. First, change is required to enable plant breeders to capture value on FSS in some crops. Private sector product developers have a challenge with self-replicating crops such as wheat and barley, where FSS for replanting can occur. The high rate of FSS limits the amount of private sector investment in variety development. Only 10% of private sector investment occurs in cereals, forages and pulses. Funding of variety development for cereals may be lower in Canada than in other countries, which can have an impact on the varieties supplied to the marketplace and overall farm sector productivity. In the case of wheat in Canada, expenditures on variety development at $2.00/acre are much lower than in Europe, and on a per tonne of output basis the investment is more than double in Australia. Higher investment levels result in more varieties with higher yield potential and/or higher per acre profit margins. Efforts are required to increase total investment through FSS royalties or greater use of Certified seed. The approach used to regulate PNT’s could become more flexible, which can save significant resources and provides benefits to the seed sector as well as to commercial farmers. The assessment also suggests that the way quality assurance is delivered could change somewhat as part of the seed certification process. Integration of data and traceability can provide significant benefits to the seed system. Another significant implication is in the area of system collaboration and supporting organizations. Currently, some organizations such as CSI, CSGA, CPTA, CFIA, and Health Canada have a functional role. Some organizations within the seed system are primarily advocates for their members, such as Crop Life and CSTA. Other organizations provide support for members that provide services necessary for supplying Certified seed to farmers such as the CSAAC for seed analysts. With a focus on only non-governmental organizations that have a functional role or an advocacy role (i.e., CSGA, CPTA, CSI, CSTA, Crop Life) the issue is whether there can be organizational stream lining. For example, in the Netherlands Plantum is a body which represents the interests of the seed sector and NAK is the not-for-profit body that is involved with seed certification. In France GNIS is the overall seed system organization, with its division SOC responsible for seed certification. These examples suggest that within Canada, one organization could focus on service delivery and another focus on representing the overall seed sector as in the Netherlands.
Economic Impact Assessment and Risk Analysis – Summary Report March 2018
Prepared by JRG Consulting Group and SJT Solutions 14 for Seed Synergy
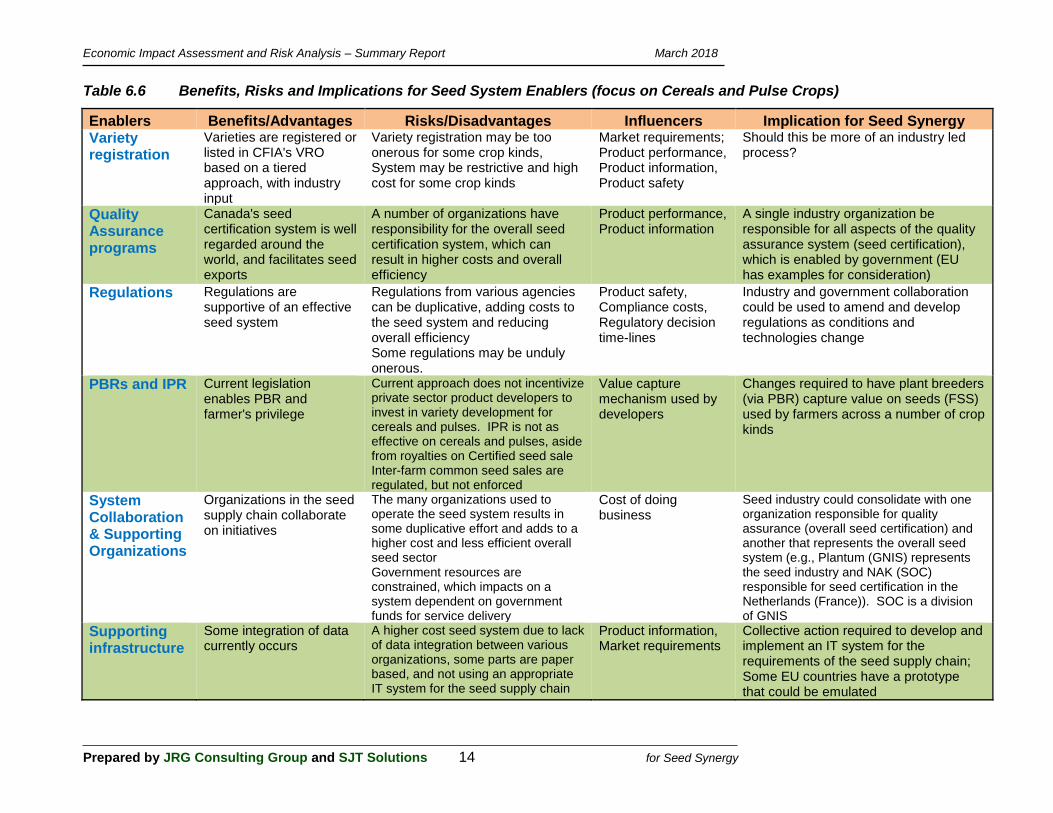
Table 6.6 Benefits, Risks and Implications for Seed System Enablers (focus on Cereals and Pulse Crops)
Enablers Benefits/Advantages Risks/Disadvantages Influencers Implication for Seed Synergy Variety registration
Varieties are registered or listed in CFIA's VRO based on a tiered approach, with industry input
Variety registration may be too onerous for some crop kinds, System may be restrictive and high cost for some crop kinds
Market requirements; Product performance, Product information, Product safety
Should this be more of an industry led process?
Quality Assurance programs
Canada's seed certification system is well regarded around the world, and facilitates seed exports
A number of organizations have responsibility for the overall seed certification system, which can result in higher costs and overall efficiency
Product performance, Product information
A single industry organization be responsible for all aspects of the quality assurance system (seed certification), which is enabled by government (EU has examples for consideration)
Regulations Regulations are supportive of an effective seed system
Regulations from various agencies can be duplicative, adding costs to the seed system and reducing overall efficiency Some regulations may be unduly onerous.
Product safety, Compliance costs, Regulatory decision time-lines
Industry and government collaboration could be used to amend and develop regulations as conditions and technologies change
PBRs and IPR Current legislation enables PBR and farmer's privilege
Current approach does not incentivize private sector product developers to invest in variety development for cereals and pulses. IPR is not as effective on cereals and pulses, aside from royalties on Certified seed sale Inter-farm common seed sales are regulated, but not enforced
Value capture mechanism used by developers
Changes required to have plant breeders (via PBR) capture value on seeds (FSS) used by farmers across a number of crop kinds
System Collaboration & Supporting Organizations
Organizations in the seed supply chain collaborate on initiatives
The many organizations used to operate the seed system results in some duplicative effort and adds to a higher cost and less efficient overall seed sector Government resources are constrained, which impacts on a system dependent on government funds for service delivery
Cost of doing business
Seed industry could consolidate with one organization responsible for quality assurance (overall seed certification) and another that represents the overall seed system (e.g., Plantum (GNIS) represents the seed industry and NAK (SOC) responsible for seed certification in the Netherlands (France)). SOC is a division of GNIS
Supporting infrastructure
Some integration of data currently occurs
A higher cost seed system due to lack of data integration between various organizations, some parts are paper based, and not using an appropriate IT system for the seed supply chain
Product information, Market requirements
Collective action required to develop and implement an IT system for the requirements of the seed supply chain; Some EU countries have a prototype that could be emulated

Prepared by JRG Consulting Group and SJT Solutions 15 for Seed Synergy
Economic Impact Assessment and Risk Analysis – Summary Report March 2018
Approaches to Increase Certified Seed Sales in Cereals The review of other jurisdictions identified that higher certified seed share use is the result of the following:
1. cross compliance: In Quebec, producers must use certified seed to participate in crop insurance and income stabilization programs;
2. high FSS royalties relative to certified seed royalties: A narrower differential between the certified seed royalty and the FSS royalty makes the use of certified seed more attractive to producers. Sweden's FSS royalty is 70% of the certified rate while the Netherlands is 65% of the certified rate;
3. rapid release of new varieties: Frequent releases of new and improved varieties, such as in Sweden, provide an incentive for farmers to use certified seed; and
4. yield gain on newly released varieties: New higher yielding varieties benefit producers' profitability and this provides an incentive to use certified seed.
Options to increase the use of certified seed were examined with the following results (see also Table 8.7 on the following page):
A requirement by downstream users to require the use of certified seed was found to have merit but was not expected to result in a large increase in certified seed use.
Promotion of new varieties by seed companies was also judged to have merit, but this option was not expected to increase sales by a large amount unless the new varieties are clearly superior.
With PBR, seed companies have the ability to employ use agreements associated with Certified seed sales, where the agreement has conditions of use. These conditions can include a prohibition of FSS (agreement to suspend farmers’ privilege) or the condition that with re-use by the farmer, a royalty payment is made to the seed company on the FSS. If use contracts were in place and 60% of cereal and pulse acreage in Canada was planted with certified seed, certified seed sales would increase by $467 million. If use contracts were in place and certified seed acreage for pulses and cereals rose by 60%, certified seed sales would increase by $181.1 million.
Crop insurance could require the use of Certified seed. In Western Canada, this would increase the number of acres (in cereals and pulses) with certified seed by 18.8 million acres and sales by $537.9 million.
Business risk management programs could incentivize the use of certified seed through lower premiums or higher coverage. While this could increase certified seed use, government would be unlikely to absorb the cost associated with the design changes, resulting in farmers paying the cost through adjustments to premiums.
The differential in price between Certified seed and FSS could be reduced by either increasing the cost of FSS or decreasing the price of Certified seed. With a FSS royalty rate of $2/bag on all cereals and pulse crops and a 60% Certified acreage share, certified seed sales would increase by $467 million (the same amount as a contract on FSS and 60% certified share option).
A tax credit on certified seed purchases would reduce the price differential between certified seed and FSS. However, tax credits have been proposed by the Canadian industry in the past with minimal support by the government.
The option of increasing Certified seed use via use agreements, which could limit the use of FSS or require payments on FSS, was judged to be the most effective in increasing Certified seed sales as well as the easiest to implement.
Prepared by JRG Consulting Group and SJT Solutions 16 for Seed Synergy
Economic Impact Assessment and Risk Analysis – Summary Report March 2018
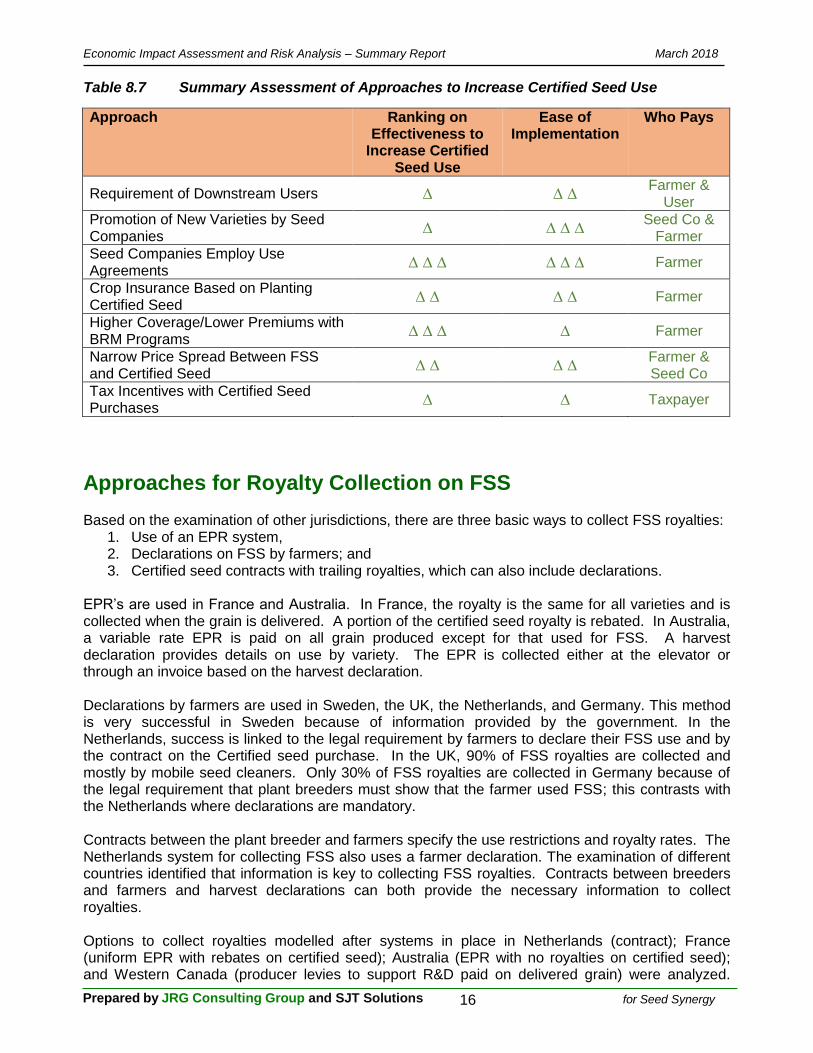
Table 8.7 Summary Assessment of Approaches to Increase Certified Seed Use
Approach Ranking on Effectiveness to
Increase Certified Seed Use
Ease of Implementation
Who Pays
Requirement of Downstream Users ∆ ∆ ∆ Farmer &
User Promotion of New Varieties by Seed Companies
∆ ∆ ∆ ∆ Seed Co &
Farmer
Seed Companies Employ Use Agreements
∆ ∆ ∆ ∆ ∆ ∆ Farmer
Crop Insurance Based on Planting Certified Seed
∆ ∆ ∆ ∆ Farmer
Higher Coverage/Lower Premiums with BRM Programs
∆ ∆ ∆ ∆ Farmer
Narrow Price Spread Between FSS and Certified Seed
∆ ∆ ∆ ∆ Farmer & Seed Co
Tax Incentives with Certified Seed Purchases
∆ ∆ Taxpayer
Approaches for Royalty Collection on FSS
Based on the examination of other jurisdictions, there are three basic ways to collect FSS royalties: 1. Use of an EPR system, 2. Declarations on FSS by farmers; and 3. Certified seed contracts with trailing royalties, which can also include declarations.
EPR’s are used in France and Australia. In France, the royalty is the same for all varieties and is collected when the grain is delivered. A portion of the certified seed royalty is rebated. In Australia, a variable rate EPR is paid on all grain produced except for that used for FSS. A harvest declaration provides details on use by variety. The EPR is collected either at the elevator or through an invoice based on the harvest declaration. Declarations by farmers are used in Sweden, the UK, the Netherlands, and Germany. This method is very successful in Sweden because of information provided by the government. In the Netherlands, success is linked to the legal requirement by farmers to declare their FSS use and by the contract on the Certified seed purchase. In the UK, 90% of FSS royalties are collected and mostly by mobile seed cleaners. Only 30% of FSS royalties are collected in Germany because of the legal requirement that plant breeders must show that the farmer used FSS; this contrasts with the Netherlands where declarations are mandatory. Contracts between the plant breeder and farmers specify the use restrictions and royalty rates. The Netherlands system for collecting FSS also uses a farmer declaration. The examination of different countries identified that information is key to collecting FSS royalties. Contracts between breeders and farmers and harvest declarations can both provide the necessary information to collect royalties. Options to collect royalties modelled after systems in place in Netherlands (contract); France (uniform EPR with rebates on certified seed); Australia (EPR with no royalties on certified seed); and Western Canada (producer levies to support R&D paid on delivered grain) were analyzed.
Prepared by JRG Consulting Group and SJT Solutions 17 for Seed Synergy
Economic Impact Assessment and Risk Analysis – Summary Report March 2018
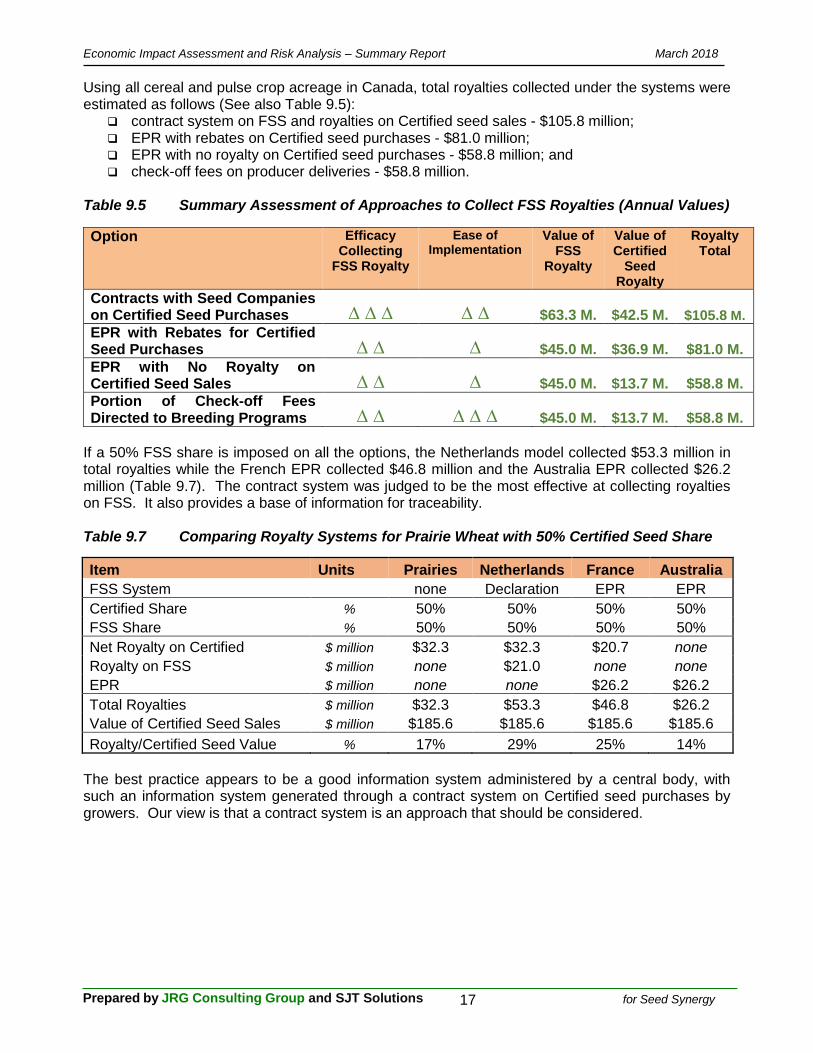
Using all cereal and pulse crop acreage in Canada, total royalties collected under the systems were estimated as follows (See also Table 9.5):
contract system on FSS and royalties on Certified seed sales - $105.8 million; EPR with rebates on Certified seed purchases - $81.0 million; EPR with no royalty on Certified seed purchases - $58.8 million; and check-off fees on producer deliveries - $58.8 million.
Table 9.5 Summary Assessment of Approaches to Collect FSS Royalties (Annual Values)
Option Efficacy Collecting
FSS Royalty
Ease of Implementation
Value of FSS
Royalty
Value of Certified
Seed Royalty
Royalty Total
Contracts with Seed Companies on Certified Seed Purchases ∆ ∆ ∆ ∆ ∆ $63.3 M. $42.5 M. $105.8 M.
EPR with Rebates for Certified Seed Purchases ∆ ∆ ∆ $45.0 M. $36.9 M. $81.0 M.
EPR with No Royalty on Certified Seed Sales ∆ ∆ ∆ $45.0 M. $13.7 M. $58.8 M.
Portion of Check-off Fees Directed to Breeding Programs ∆ ∆ ∆ ∆ ∆ $45.0 M. $13.7 M. $58.8 M.
If a 50% FSS share is imposed on all the options, the Netherlands model collected $53.3 million in total royalties while the French EPR collected $46.8 million and the Australia EPR collected $26.2 million (Table 9.7). The contract system was judged to be the most effective at collecting royalties on FSS. It also provides a base of information for traceability. Table 9.7 Comparing Royalty Systems for Prairie Wheat with 50% Certified Seed Share
Item Units Prairies Netherlands France Australia
FSS System
none Declaration EPR EPR
Certified Share % 50% 50% 50% 50%
FSS Share % 50% 50% 50% 50%
Net Royalty on Certified $ million $32.3 $32.3 $20.7 none
Royalty on FSS $ million none $21.0 none none
EPR $ million none none $26.2 $26.2
Total Royalties $ million $32.3 $53.3 $46.8 $26.2
Value of Certified Seed Sales $ million $185.6 $185.6 $185.6 $185.6
Royalty/Certified Seed Value % 17% 29% 25% 14%
The best practice appears to be a good information system administered by a central body, with such an information system generated through a contract system on Certified seed purchases by growers. Our view is that a contract system is an approach that should be considered.

Prepared by JRG Consulting Group and SJT Solutions 18 for Seed Synergy
Economic Impact Assessment and Risk Analysis – Summary Report March 2018
Comparing an EPR to a FSS Royalty Approach The farm sector, the seed sector, and government have all recognized the need for additional investment in varietal development in cereals and pulses. There are currently two approaches being considered for this sector to incentivize more investment. One approach is an EPR system where first receivers of grain collect an EPR royalty (such as $1.00/t) on delivered grain, which is then distributed back to the breeder/product developer. The second approach is a royalty paid on FSS where farmers with their purchase of Certified seed enter into a contractual agreement with the product developer/breeder with the obligation to pay a FSS royalty (e.g., 1¢/lb. or $0.50 per 50-lb. unit) on any FSS used in subsequent crop years. Contracts of this nature are already used with terms on FSS in Canada; however none with a FSS royalty. The use of contracts and EPR to collect royalties on FSS in cereals in Western Canada were compared using varieties covered by UPOV91. Our perspective on comparing FSS and EPR approaches is that a FSS royalty generates a larger amount of royalty dollars for investment into varietal development. Figure 11.1 illustrates the difference in royalty revenues; when UPOV varieties have a 50% market share, the FSS royalty approach generates $8.4 million in additional net royalties for investing in product development. Figure 11.1 FSS Royalties and EPR Over Time, Net Royalties
At the point in time when UPOV91 varieties represent 50% of total acreage, the contract system would result in a total of $24.2 million in royalties ($10.3 million from FSS royalties and $13.9 M in certified seed royalties) compared to net royalties of $15.8 million from an EPR. The FSS royalties of $10.3 million can generate future producer benefits of at least $70 million per year and an economy wide impact of $140 million per year. The combined $24.2 million in FSS and certified seed royalties from the contract system can generate future producer benefits of $170 million and economy wide impacts of $340 million each year. Besides providing more money for plant breeding through higher royalties the contract system (compared to an EPR system) was also judged to (See also Table 11.6 on the following page):
1. be more efficient in collecting the royalties; 2. be more saleable to producers and seed companies; 3. have a lower per acre cost to producers; and 4. provide a better linkage to traceability.
3.8
12.1
24.2
36.3
48.4
2.6
7.9
15.8
23.7
31.6
1.2 4.2
8.4 12.6
16.8
0
10
20
30
40
50
60
2017 25% 50% 75% 100%
M o
f $
FSS EPR Difference
Prepared by JRG Consulting Group and SJT Solutions 19 for Seed Synergy
Economic Impact Assessment and Risk Analysis – Summary Report March 2018
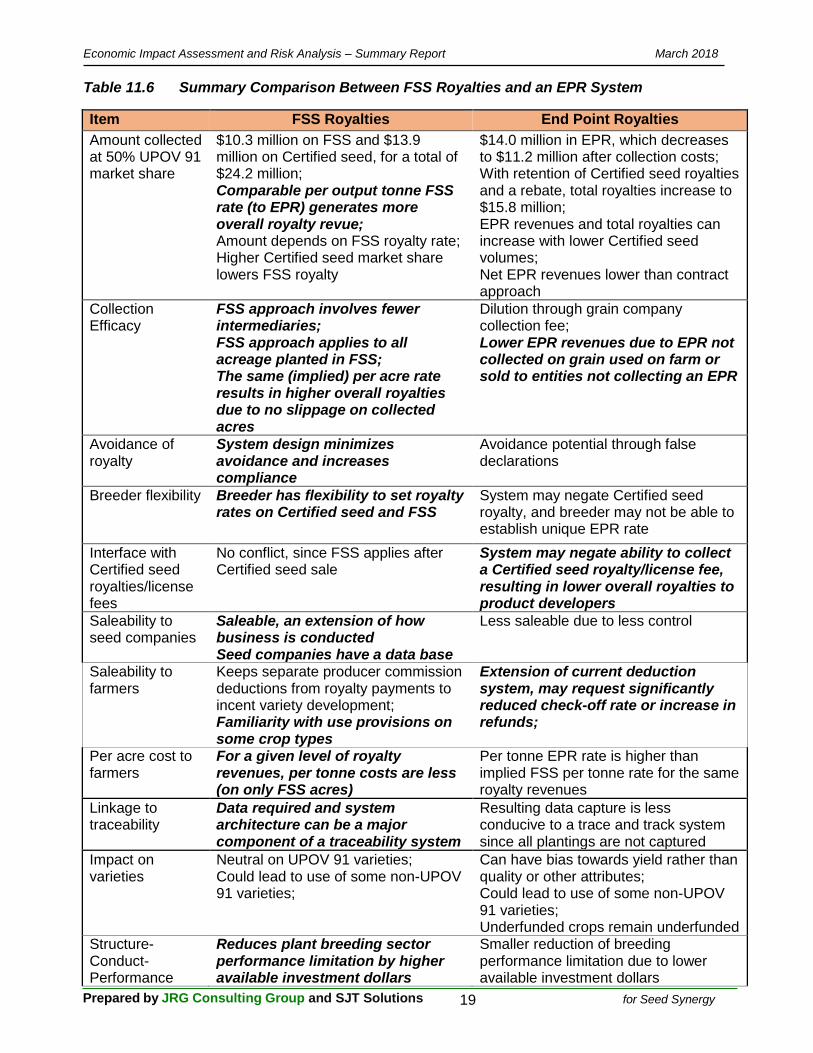
Table 11.6 Summary Comparison Between FSS Royalties and an EPR System
Item FSS Royalties End Point Royalties
Amount collected at 50% UPOV 91 market share
$10.3 million on FSS and $13.9 million on Certified seed, for a total of $24.2 million; Comparable per output tonne FSS rate (to EPR) generates more overall royalty revue; Amount depends on FSS royalty rate; Higher Certified seed market share lowers FSS royalty
$14.0 million in EPR, which decreases to $11.2 million after collection costs; With retention of Certified seed royalties and a rebate, total royalties increase to $15.8 million; EPR revenues and total royalties can increase with lower Certified seed volumes; Net EPR revenues lower than contract approach
Collection Efficacy
FSS approach involves fewer intermediaries; FSS approach applies to all acreage planted in FSS; The same (implied) per acre rate results in higher overall royalties due to no slippage on collected acres
Dilution through grain company collection fee; Lower EPR revenues due to EPR not collected on grain used on farm or sold to entities not collecting an EPR
Avoidance of royalty
System design minimizes avoidance and increases compliance
Avoidance potential through false declarations
Breeder flexibility Breeder has flexibility to set royalty rates on Certified seed and FSS
System may negate Certified seed royalty, and breeder may not be able to establish unique EPR rate
Interface with Certified seed royalties/license fees
No conflict, since FSS applies after Certified seed sale
System may negate ability to collect a Certified seed royalty/license fee, resulting in lower overall royalties to product developers
Saleability to seed companies
Saleable, an extension of how business is conducted Seed companies have a data base
Less saleable due to less control
Saleability to farmers
Keeps separate producer commission deductions from royalty payments to incent variety development; Familiarity with use provisions on some crop types
Extension of current deduction system, may request significantly reduced check-off rate or increase in refunds;
Per acre cost to farmers
For a given level of royalty revenues, per tonne costs are less (on only FSS acres)
Per tonne EPR rate is higher than implied FSS per tonne rate for the same royalty revenues
Linkage to traceability
Data required and system architecture can be a major component of a traceability system
Resulting data capture is less conducive to a trace and track system since all plantings are not captured
Impact on varieties
Neutral on UPOV 91 varieties; Could lead to use of some non-UPOV 91 varieties;
Can have bias towards yield rather than quality or other attributes; Could lead to use of some non-UPOV 91 varieties; Underfunded crops remain underfunded
Structure-Conduct-Performance
Reduces plant breeding sector performance limitation by higher available investment dollars
Smaller reduction of breeding performance limitation due to lower available investment dollars
Prepared by JRG Consulting Group and SJT Solutions 20 for Seed Synergy
Economic Impact Assessment and Risk Analysis – Summary Report March 2018
Our preference is for Seed Synergy to move forward with a FSS royalty approach. This preference is based on a number of factors, which are included in the following table (and in bold italics) Which of these two approaches that is adopted will have a considerable consequence on the seed industry and the investment level in varietal development. Consequently, this is an important issue for Seed Synergy and for the overall seed system in Canada. We strongly suggest that Seed Synergy endorse the FSS royalty approach. Our suggestion is based on the following considerations:
For a given level of royalty revenues, per tonne costs are less with a FSS royalty (and only on FSS acres);
For a comparable royalty rate (between FSS and EPR), the FSS generates more royalty revenues for investment by product developers/plant breeders;
Comparable per output tonne FSS rate (to EPR) generates more overall royalty revenues; FSS approach improves plant breeding sector performance (in relation to an EPR approach)
due to higher available investment dollars; FSS approach involves fewer intermediaries; The FSS royalty approach is based on contracts already in place between product
developers and farmers with restrictions on use of FSS; FSS approach applies to all acreage planted in FSS, with no avoidance, while an EPR does
not capture royalties in certain market channels; Data required and system architecture for FSS approach can become a major component of
a traceability system; Breeder has flexibility to set royalty rates on Certified seed and FSS; and Faster build-up of royalties can provide greater incentives for entry into breeding sector by
small and medium size breeding companies. A successful FSS royalty system requires that all purchases of Certified seed have the same general contract terms with respect to FSS, and that a minimum FSS royalty rate by crop kind is in place. The EPR has some weakness. One is that EPR revenues are not collected on grain used on farm or sold to entities not collecting an EPR. Another is that with an EPR being an extension of the current deduction system used by producer commissions, grain producers may request significantly reduced check-off rate or more refunds. Non-compliance could be an issue; to avoid the EPR, farmers may mis-declare varieties at delivery. Value capture from FSS using contracts produces a benefit to product developers that can approach $64.7 million per annum. A risk is that some seed companies decide not to have a FSS royalty rate or decide to have a low rate compared to others as a means to capture market share. To overcome this risk, the collective industry body would need to ensure that all seed companies had a FSS royalty rate that was a fixed percentage of the associated fee on Certified seed sales. Moving forward with a FSS contract approach on UPOV 91 varieties (varieties released after February 2015) allows for product developers to capture some of the value in their newly released varieties, which enables further investment in varietal development. With such value capture mechanisms, opportunity is created for breeding companies to invest in variety development, whether these are multi-nationals, or medium size or small Canadian companies.

Prepared by JRG Consulting Group and SJT Solutions 21 for Seed Synergy
Economic Impact Assessment and Risk Analysis – Summary Report March 2018
Assessment of Some Seed Synergy Initiatives A number of changes are being considered by Seed Synergy; key areas are shown in the middle portion of Figure 10.1, which are (1) value capture by product developers, (2) traceability and (3) value creation. Figure 10.1 Actions that Enhance Value in the Seed Sector Value creation (value of estimated increases in value and cost) can be well over $100 million per annum. The values in Table 10.12 are potential ranges, with the lower values being conservative estimates. This does not include the values associated with value capture with FSS royalties (or higher Certified seed market share). Table 10.12 Value Creation - Estimate of Potential Benefits and Cost Savings
Item Product Developer
Seed Company & Grower
Farmer Seed Sector
Total
$ million $ million $ million $ million $ million Traceability
$20 to $60+ $20 to $60+
Single Window $0.3 to $1.0
$0.3 to $1.0 Tiered Risk Assessment $5 to $16
$7 to $38
$12 to $55
Variety Registration $0.03 to $1.0
$0.03 to $1.0 Quality Assurance
$2 to $4 $2 to $4
$4 to $8
Product Profile $1 to $7 $10 to $20 -$5 to -$10 $0.5 to $2 $6 to $19 Sector Governance & Coordination $0.2 to $0.5 $0.2 to $0.5
$0.2 to $0.5 $0.6 to $1.5
Total $7 to $24 $12 to $25 $4 to $32 $20 to $62+ $43 to $142+
Value Capture by Product
Developers
Traceability
Value Creation
Product
Profile
Single
Window Variety
Registration
Tiered Risk
Assessment
Seed Sector
Governance
Supporting Seed Sector Activities The Seed Product
Quality
Assurance

Prepared by JRG Consulting Group and SJT Solutions 22 for Seed Synergy
Economic Impact Assessment and Risk Analysis – Summary Report March 2018
The Traceability Initiative We strongly recommend that Seed Synergy support an electronic traceability system, which begins with breeder seed, continues through seed production and the sale of Certified seed, and the subsequent use of the planted crop, whether used as FSS in the following year, or as a commercial sale to a buyer or intermediary. Digital technologies are available and in use in agriculture in parts of the world that have the necessary functionality, confidentiality, and security features for necessary on-line traceability; the block chain technology could become the underlying digital infrastructure. One of the advantages noted above for FSS royalties is that the FSS approach supports full traceability in the seed sector. The Certified seed contracts with the resulting obligation on reporting on FSS provides a critical link in tracking subsequent generations of Certified seed lots and as well tracing back to a seed lot based on a grain delivered to a first receiver of grain. These attributes are not realized with an EPR approach. The benefits are considerable and include;
Maintaining identify of a seed lot in the various segments of the seed supply chain; Locating a seed lot or variety within the seed supply chain; Tracing the flow of a seed lot through various stages in the seed supply chain; Facilitating identification of the cause of nonconformity of a seed lot; Allowing for withdrawal/recall of a seed lot, as required. Increased buyer confidence in the attributes of the seed lot purchased; Maintaining a description of seed lot attributes for access by each partner in the supply
chain; Improved business support functions such as necessary documentation and inventory
control; Improved communication between partners in the seed supply chain; Allowing for necessary coordination between partners in the seed supply chain; Improvement in the flow and reliability of information through the seed supply chain; Increase in accountability between supply chain partners; and Increase seed sector productivity;
Annual benefits to the overall seed sector can exceed $60 million per annum, which are costs avoided by product developers, seed companies, grain companies, and government. Necessary elements of a traceability system exist today; however, the system is not fully integrated and fully on-line. Traceability is a foundational piece and is inter-twined with a number of other Seed Synergy initiatives, such as (1) the single window, (2) product profile and (3) variety registration. These initiatives support the traceability initiative and, in turn, the traceability feature allows for the cost efficient development of an initiative (e.g., the product profile). This highlights the synergies associated with big data. There are also inter-twined risks. There are potential risks to the overall on-line traceability system if it is not properly designed and implemented. These risks can include (1) incomplete integration between various databases, (2) maintaining data security, (3) ensuring that proprietary data provisions are not breached, (4) necessary cooperation between industry partners does not occur, and (5) the cost of system design and on-going operation. These risks can be minimized through the appropriate design and architecture of the overall data management system. Risks associated with this option are (1) underperformance of large data bases; and (2) breach of proprietary data. Furthermore, with a seed sector traceability system, one organization in the seed sector needs to be responsible for its on-going operation, which also indicates a strong linkage between traceability and seed sector governance and coordination.
Prepared by JRG Consulting Group and SJT Solutions 23 for Seed Synergy
Economic Impact Assessment and Risk Analysis – Summary Report March 2018
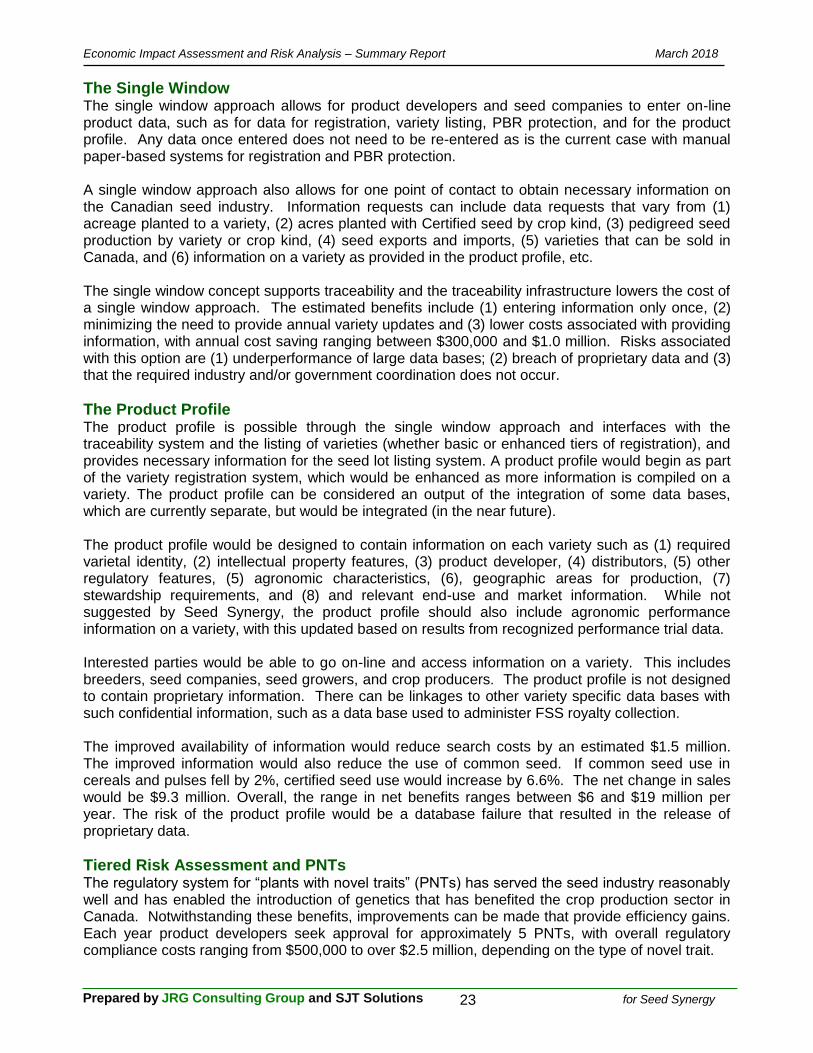
The Single Window The single window approach allows for product developers and seed companies to enter on-line product data, such as for data for registration, variety listing, PBR protection, and for the product profile. Any data once entered does not need to be re-entered as is the current case with manual paper-based systems for registration and PBR protection. A single window approach also allows for one point of contact to obtain necessary information on the Canadian seed industry. Information requests can include data requests that vary from (1) acreage planted to a variety, (2) acres planted with Certified seed by crop kind, (3) pedigreed seed production by variety or crop kind, (4) seed exports and imports, (5) varieties that can be sold in Canada, and (6) information on a variety as provided in the product profile, etc. The single window concept supports traceability and the traceability infrastructure lowers the cost of a single window approach. The estimated benefits include (1) entering information only once, (2) minimizing the need to provide annual variety updates and (3) lower costs associated with providing information, with annual cost saving ranging between $300,000 and $1.0 million. Risks associated with this option are (1) underperformance of large data bases; (2) breach of proprietary data and (3) that the required industry and/or government coordination does not occur.
The Product Profile The product profile is possible through the single window approach and interfaces with the traceability system and the listing of varieties (whether basic or enhanced tiers of registration), and provides necessary information for the seed lot listing system. A product profile would begin as part of the variety registration system, which would be enhanced as more information is compiled on a variety. The product profile can be considered an output of the integration of some data bases, which are currently separate, but would be integrated (in the near future). The product profile would be designed to contain information on each variety such as (1) required varietal identity, (2) intellectual property features, (3) product developer, (4) distributors, (5) other regulatory features, (5) agronomic characteristics, (6), geographic areas for production, (7) stewardship requirements, and (8) and relevant end-use and market information. While not suggested by Seed Synergy, the product profile should also include agronomic performance information on a variety, with this updated based on results from recognized performance trial data. Interested parties would be able to go on-line and access information on a variety. This includes breeders, seed companies, seed growers, and crop producers. The product profile is not designed to contain proprietary information. There can be linkages to other variety specific data bases with such confidential information, such as a data base used to administer FSS royalty collection. The improved availability of information would reduce search costs by an estimated $1.5 million. The improved information would also reduce the use of common seed. If common seed use in cereals and pulses fell by 2%, certified seed use would increase by 6.6%. The net change in sales would be $9.3 million. Overall, the range in net benefits ranges between $6 and $19 million per year. The risk of the product profile would be a database failure that resulted in the release of proprietary data.
Tiered Risk Assessment and PNTs The regulatory system for “plants with novel traits” (PNTs) has served the seed industry reasonably well and has enabled the introduction of genetics that has benefited the crop production sector in Canada. Notwithstanding these benefits, improvements can be made that provide efficiency gains. Each year product developers seek approval for approximately 5 PNTs, with overall regulatory compliance costs ranging from $500,000 to over $2.5 million, depending on the type of novel trait.
Prepared by JRG Consulting Group and SJT Solutions 24 for Seed Synergy
Economic Impact Assessment and Risk Analysis – Summary Report March 2018
The approval process has built in duplication and some redundancies, which if eliminated provide for considerable time savings. Efficiencies can be achieved by the three approval bodies jointly working on submissions, and the elimination of some duplicative reviews. Improvements could be made that reduce the time spent by CFIA and Health Canada seeking additional information and providing necessary approvals to product developers. Another efficiency gain occurs when the level of assessment is based on the risk of the event being approved and whether related trait assessments have already been conducted. A tiered risk assessment procedure would result in a full evaluation for higher risk events and a reduced evaluation protocol for lower risk events. Examples of low-risk events include those with traits very similar to previously-approved traits, or with traits that could have been introduced by natural spontaneous processes. The approach used in the U.S. accounts for risks and knowledge acquired, and should be considered as part of the Canadian system. A tiered risk assessment approach should result in efficiencies and costs savings for both the regulator and the product developer. A tiered risk assessment would decrease uncertainly; increase investment; reduce regulatory costs; and result in greater innovation. One saving is the reduced time required for the assessment and associated costs incurred by the regulator and the product developer. Another benefit is to the overall product development system, where more products can be approved in the same time frame. It would also increase predictability of regulatory requirements, which will promote investment in innovation. Such improvements in the regulatory system could benefit producers through faster access to new varieties and product developers through a reduction in the time to market. This would quicken the time for approval by an importing country. By reducing the time required for a regulatory decision by one year, the potential benefit to product developers of earlier commercialization can approach $16 million. Similarly, farmer benefits can approach $38 million over a 5 year period for each new PNT commercialized one year earlier. Annual benefits can be as high as $55 million, and in some cases as low as $12 million.
Registration of Varieties The variety registration system serves to maintain and improve grain quality standards; support seed certification and trade in seeds; and facilitate variety and grain identity and traceability. Changes are proposed to the system of variety registration which would streamline the process for some crop types. Crops subject to variety registration would go through either an Enhanced process (Part 1 in the current process) or a Basic process which would not require pre-registration and merit testing. There would be cost savings to the developer for having a crop enter and remain at the basic tier or be moved to the basic tier. With the agreement of the value chain, new crop kinds could enter at the basic tier and/or move to this tier. Cost savings would occur because of the reduction in testing and from lower administration costs. Estimated annual cost savings for candidates requiring high, medium, lower, and low-cost pre-registration testing for 1 to 25 candidates range from $26,000 to just under $1 million. Risks for this option include the possibility of an intended negative impact on export grain quality resulting in a loss of sales. These losses could outweigh the benefits.
Quality Assurance The current model of seed certification is for third party inspection of fields in pedigreed seed production and third party testing of seed for purity and germination, and third party oversight of seed grading and labeling. The cost of third party service providers is estimated to be in the range of $10 million per annum, with $6 million associated with inspection costs in the seed production stage and $4 million in the seed processing stage. It is possible to allow interested and qualified seed growers and companies to replace external third-party inspections with internal quality assurance and a third-party audit framework.
Prepared by JRG Consulting Group and SJT Solutions 25 for Seed Synergy
Economic Impact Assessment and Risk Analysis – Summary Report March 2018
This approach is used in other jurisdictions, such as the Netherlands for cereals. As with HACCP programs, self-inspection of seed can occur following a documented protocol, and overall system audits. This could be a more cost-effective model for those in high-cost remote areas. The current system would continue to operate for those for whom it is the right business choice. A conservative assumption can be that the quality assurance cost associated with seed production decreases by 50% (to $2.7 million) based on first-party inspection and fewer third party field inspections (many of them being random) and after considering the cost of auditing. The use of new seed cleaning and processing technologies could result in fewer rejected acres which would lower the cost of Certified seed going into a seed bag. Overall benefits are estimated to range between $2 and $4 million per year for the combination of seed growers and seed companies and farmers benefits are in the same magnitude
Seed Sector Governance and Coordination The above initiatives proposed by Seed Synergy requires visitation of how the seed sector is supported by organizations, necessary coordination and overall governance of the seed sector within Canada. There are some efficiency gains to be realized through a restructuring of the supporting organizations for the seed industry. Some organizations are focused on advocacy and representing the seed industry, such as CSTA and Crop Life, while others are focused on delivering necessary quality assurance and audit services, such as CSI, CSGA, and CSAAC. Some organizations are involved in both service delivery and advocacy. A streamlining of roles and responsibilities can result in efficiencies that should reduce overall costs incurred by the collective of these organizations and by seed sector companies that incur internal costs to ensure that the organizations are effective and efficient. A reconfiguration of organization structures such as (1) an overall seed industry organization that represents the industry and (2) another organization that ensures the requisite quality assurance required by the seed industry is a possibility. An organization that represents the overall seed industry could take ownership and be responsible for the on-line traceability system (from breeder seed through to the users of commercial crop production). The seed industry can look to the Netherlands and to France for models where there are fewer organizations that support the seed industry. In the Netherlands one organization (Plantum) represents and advocates for the seed industry (as well as collects FSS royalties on behalf of breeders), and one other organization (NAK) provides for quality assurance and oversees the quality assurance functions for the seed industry, which is a delegated authority. A similar situation exists in France with GNIS being the body that represents the seed sector, and a division of GNIS ensures that the necessary quality assurance occurs. Estimated annual cost reduction ranges between $0.6 to $1.5 million, with a large portion being cost saving incurred by seed growers, seed companies, and product developers (and plant breeders) providing overall guidance and direction to their supporting organizations. Non-quantitative benefits are that one voice provides a stronger message and that the seed system would be able to seize opportunities without obtaining government approval. A risk associated with this option is that the single voice may silence some parts of the supply chain. Another is that the advocacy body may interfere with the quality assurance body (which is only accountable to government) when the two organizations are not distinctly separate.
Prepared by JRG Consulting Group and SJT Solutions 26 for Seed Synergy
Economic Impact Assessment and Risk Analysis – Summary Report March 2018
In Summary The potential value creation initiatives produce an estimated annual benefit that can exceed $100 million. The largest source of value creation is in regulatory flexibility (tiered risk assessment in PNT) followed by traceability. This value does not include the value associated with the seed industry moving forward with our suggestion of adopting a Certified seed contract system with trailing royalties on FSS. The contract system for FSS royalties can also be a key element of the traceability system envisioned for the seed sector. A few of the other initiatives (e.g., the product profile) also support the traceability initiative. As well, one organization should have overall ownership of the traceability system. We encourage Seed Synergy to continue their efforts to initiate change in the seed sector. Change should begin with the change that provides additional investment dollars in product development and plant breeding. This starts with the implementation of a FSS royalty program. Other countries have such royalty collection in place and their best practices can be leveraged into Canada’s cereals and pulse crop sector.


![Time to Radicle Protrusion Does Not Correlate with Early ... · germination as well as its seed vigor [Association of Official Seed Analysts (AOSA), 1983]. Standard germination is](https://img.pdfslide.us/doc/110x75/5e2123bc4f26792d4164dec5/time-to-radicle-protrusion-does-not-correlate-with-early-germination-as-well.jpg)